global agriculture information network voluntary … ... consumption local wheat consumption is...
TRANSCRIPT
Foreign Agricultural Service
GAIN ReportGlobal Agriculture Information Network
Voluntary Report - public distribution Date: 12/26/2000
GAIN Report #PO0037
Portugal
Grain and Feed
Early Drought Transformed into Bumper Winter
Grain Harvest
2000
Approved by:Robert WicksU.S. Embassy, MadridPrepared by:Leonor Ramos
Report Highlights: Rainy Spring weather enabled wheat average yields to increase 10% over 1999,leading to a 2000 forecast of 454,000 mt (375,000 mt in 1999). With average yieldsup by 15% relative to 1999, 2000 barley output will reach 48,000 mt (45,000 mt in1999). Due to a reduction in Spring crop areas, 2000 corn output will total 900,000mt (1,014,000 mt in 1999). Winter grain 2000/01 imports will drop as a consequenceof the bumper crop. Nevertheless, the U.S. is expected to export 80,000 mt of highquality wheat to blend with the low quality 2000 wheat crop. 1 USD = 226 PTE.
Includes PSD changes: YesIncludes Trade Matrix: Yes
Unscheduled ReportMadrid [SP1], PO
GAIN Report #PO0027
TABLE OF CONTENTS
EXECUTIVE SUMMARY . . . . . . . . . . . . . . . . . . . . . . . . . . . . . . . . . . . . . . . . . . . . . . . 1
TOTAL WHEAT . . . . . . . . . . . . . . . . . . . . . . . . . . . . . . . . . . . . . . . . . . . . . . . . . . . . . . . . . . . . . . 2PS&D Table . . . . . . . . . . . . . . . . . . . . . . . . . . . . . . . . . . . . . . . . . . . . . . . . . . . . . . . . . . . 2PRODUCTION . . . . . . . . . . . . . . . . . . . . . . . . . . . . . . . . . . . . . . . . . . . . . . . . . . . . . . . . 2CONSUMPTION . . . . . . . . . . . . . . . . . . . . . . . . . . . . . . . . . . . . . . . . . . . . . . . . . . . . . . . 4TRADE . . . . . . . . . . . . . . . . . . . . . . . . . . . . . . . . . . . . . . . . . . . . . . . . . . . . . . . . . . . . . . . 4
Matrix, Total Wheat . . . . . . . . . . . . . . . . . . . . . . . . . . . . . . . . . . . . . . . . . . . . . . . . 5
DURUM WHEAT . . . . . . . . . . . . . . . . . . . . . . . . . . . . . . . . . . . . . . . . . . . . . . . . . . . . . . . . . . . . . 7PS&D Table . . . . . . . . . . . . . . . . . . . . . . . . . . . . . . . . . . . . . . . . . . . . . . . . . . . . . . . . . . . 7PRODUCTION . . . . . . . . . . . . . . . . . . . . . . . . . . . . . . . . . . . . . . . . . . . . . . . . . . . . . . . . 7CONSUMPTION . . . . . . . . . . . . . . . . . . . . . . . . . . . . . . . . . . . . . . . . . . . . . . . . . . . . . . . 8TRADE . . . . . . . . . . . . . . . . . . . . . . . . . . . . . . . . . . . . . . . . . . . . . . . . . . . . . . . . . . . . . . . 8
Trade Matrix . . . . . . . . . . . . . . . . . . . . . . . . . . . . . . . . . . . . . . . . . . . . . . . . . . . . . 8
BARLEY . . . . . . . . . . . . . . . . . . . . . . . . . . . . . . . . . . . . . . . . . . . . . . . . . . . . . . . . . . . . . . . . . . . 10PS&D Table . . . . . . . . . . . . . . . . . . . . . . . . . . . . . . . . . . . . . . . . . . . . . . . . . . . . . . . . . . 10PRODUCTION . . . . . . . . . . . . . . . . . . . . . . . . . . . . . . . . . . . . . . . . . . . . . . . . . . . . . . . 10CONSUMPTION . . . . . . . . . . . . . . . . . . . . . . . . . . . . . . . . . . . . . . . . . . . . . . . . . . . . . . 11TRADE . . . . . . . . . . . . . . . . . . . . . . . . . . . . . . . . . . . . . . . . . . . . . . . . . . . . . . . . . . . . . . 11
Trade Matrix . . . . . . . . . . . . . . . . . . . . . . . . . . . . . . . . . . . . . . . . . . . . . . . . . . . . 12
CORN . . . . . . . . . . . . . . . . . . . . . . . . . . . . . . . . . . . . . . . . . . . . . . . . . . . . . . . . . . . . . . . . . . . . . 13PS&D Table . . . . . . . . . . . . . . . . . . . . . . . . . . . . . . . . . . . . . . . . . . . . . . . . . . . . . . . . . . 13PRODUCTION . . . . . . . . . . . . . . . . . . . . . . . . . . . . . . . . . . . . . . . . . . . . . . . . . . . . . . . 13CONSUMPTION . . . . . . . . . . . . . . . . . . . . . . . . . . . . . . . . . . . . . . . . . . . . . . . . . . . . . . 14TRADE . . . . . . . . . . . . . . . . . . . . . . . . . . . . . . . . . . . . . . . . . . . . . . . . . . . . . . . . . . . . . . 14
Trade Matrix . . . . . . . . . . . . . . . . . . . . . . . . . . . . . . . . . . . . . . . . . . . . . . . . . . . . 15
RICE . . . . . . . . . . . . . . . . . . . . . . . . . . . . . . . . . . . . . . . . . . . . . . . . . . . . . . . . . . . . . . . . . . . . . . 16PS&D Table . . . . . . . . . . . . . . . . . . . . . . . . . . . . . . . . . . . . . . . . . . . . . . . . . . . . . . . . . . 16PRODUCTION . . . . . . . . . . . . . . . . . . . . . . . . . . . . . . . . . . . . . . . . . . . . . . . . . . . . . . . 16CONSUMPTION . . . . . . . . . . . . . . . . . . . . . . . . . . . . . . . . . . . . . . . . . . . . . . . . . . . . . . 18TRADE . . . . . . . . . . . . . . . . . . . . . . . . . . . . . . . . . . . . . . . . . . . . . . . . . . . . . . . . . . . . . . 18
Trade Matrix . . . . . . . . . . . . . . . . . . . . . . . . . . . . . . . . . . . . . . . . . . . . . . . . . . . . 19TRADE POLICY . . . . . . . . . . . . . . . . . . . . . . . . . . . . . . . . . . . . . . . . . . . . . . . . . . . . . . 21
GAIN Report #PO0027 Page 1 of 21
UNCLASSIFIED Foreign Agricultural Service/USDA
EXECUTIVE SUMMARY
An increase in winter grain area due to fair Winter weather conditions, and improved yields as a consequence ofintensive rainfall during April and May have led to a bumper 2000 winter grain harvest. AgOffice estimatestotal 2000 wheat production at 454,000 mt (375,00 mt in 1999), and total barley production at 48,000 mt(45,000 mt in 1999). The crop year was not as successful for irrigated Spring crops, which lacked water in earlySpring, and following heavy rains which affected normal seedings and vegetative development. With a totalarea of 174,000 ha (190,000 ha in 1999), 2000 corn production is forecast at 900,000 mt (1,014,000 mt in 1999),and with an area of 22,000 ha (25,000 ha in 1999), 2000 milled rice production is forecast at 90,000 mt(114,000 mt in 1999).
Subject to the Common Agricultural Policy (CAP), the Portuguese grain sector continues to benefit from aspecial local EU co-financed subsidy regime, due to terminate in 2002/03. Due to the importance of the grainsector in social terms, the GOP managed to secure in the July EU Council Meeting the approval for the speciallocal EU co-financed grains subsidies to remain unchanged in 2001/02. This achievement, to be likely extendedfor 2002/03, and maybe even transformed into a new subsidy program beyond 2003, represents an importantfinancial cushion for national grain producers, and if extended, an important factor for the sector’s medium-term restructuring. As for the rice sector, the EU Commission-proposed Rice Reform is viewed as a step towardsdisaster, leading to producer-estimated 22,000 Pte/ha net farmer income losses. The end of the interventionregime and the inclusion of rice in the arable crops regime is considered unacceptable by Portuguese riceproducers and local authorities.
The increased Winter grain production will lead to a decline in total 2000/01 winter grain imports. AgOfficeforecasts 2000/01 total wheat imports of 1.26 million mt, and barley imports at 183,000 mt. Due to the reduced2000 crops, corn and rice imports are forecast to increase to roughly 1.21 million mt and 114,000 mtrespectively (935,000 and 103,000 mt in 1999). Due to U.S. and EU policy differences on biotechnology, U.S.exporters will still not be able to ship corn into Portugal during 2000/01 under the 500,000 Mt Blair House cornquota regime. However, the lack of quality of the current wheat crop is stimulating importation of high qualitywheat from the United States under the EU’s reduced-duty high quality wheat import quota. During 2000/01,80,000 mt of high quality wheat is forecast to come from the United States into Portugal (48,000 mt in1999/00), consisting primarily of Northern Spring and Dark Northern Spring wheat number 2.
1 USD = 226 PTE
GAIN Report #PO0027 Page 2 of 21
UNCLASSIFIED Foreign Agricultural Service/USDA
TOTAL WHEAT
PS&D Table
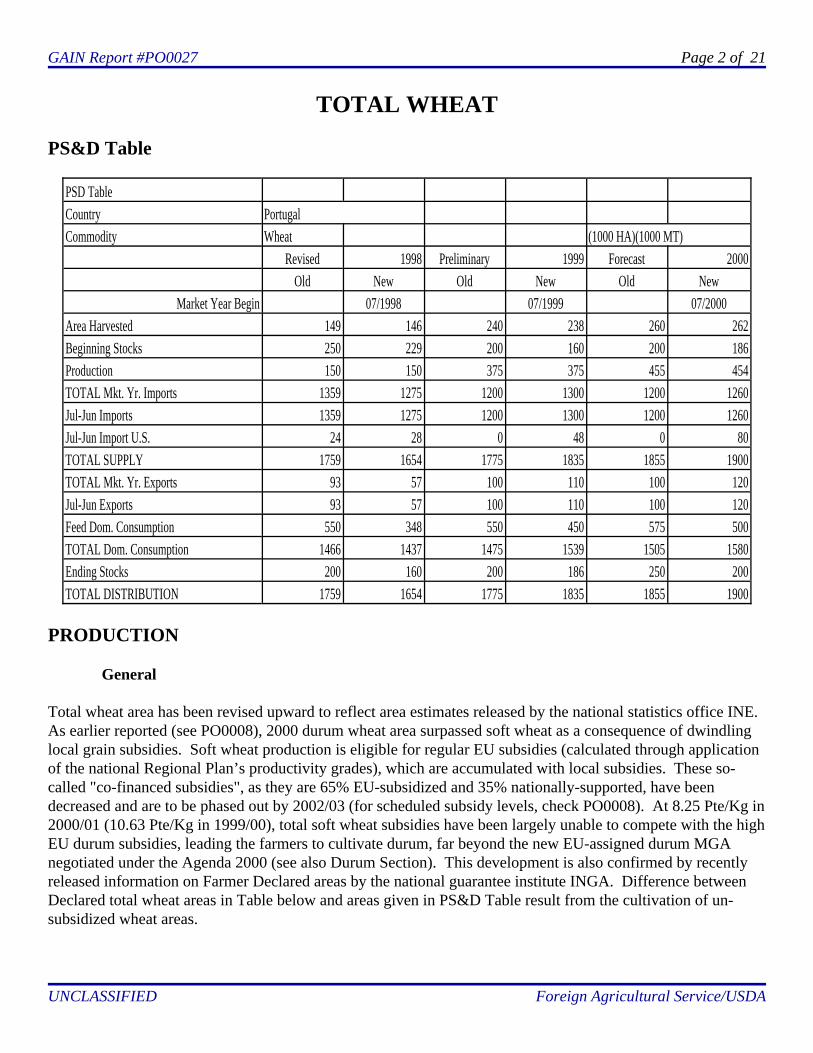
PSD TableCountry PortugalCommodity Wheat (1000 HA)(1000 MT)
Revised 1998 Preliminary 1999 Forecast 2000Old New Old New Old New
Market Year Begin 07/1998 07/1999 07/2000Area Harvested 149 146 240 238 260 262Beginning Stocks 250 229 200 160 200 186Production 150 150 375 375 455 454TOTAL Mkt. Yr. Imports 1359 1275 1200 1300 1200 1260Jul-Jun Imports 1359 1275 1200 1300 1200 1260Jul-Jun Import U.S. 24 28 0 48 0 80TOTAL SUPPLY 1759 1654 1775 1835 1855 1900TOTAL Mkt. Yr. Exports 93 57 100 110 100 120Jul-Jun Exports 93 57 100 110 100 120Feed Dom. Consumption 550 348 550 450 575 500TOTAL Dom. Consumption 1466 1437 1475 1539 1505 1580Ending Stocks 200 160 200 186 250 200TOTAL DISTRIBUTION 1759 1654 1775 1835 1855 1900
PRODUCTION
General
Total wheat area has been revised upward to reflect area estimates released by the national statistics office INE. As earlier reported (see PO0008), 2000 durum wheat area surpassed soft wheat as a consequence of dwindlinglocal grain subsidies. Soft wheat production is eligible for regular EU subsidies (calculated through applicationof the national Regional Plan’s productivity grades), which are accumulated with local subsidies. These so-called "co-financed subsidies", as they are 65% EU-subsidized and 35% nationally-supported, have beendecreased and are to be phased out by 2002/03 (for scheduled subsidy levels, check PO0008). At 8.25 Pte/Kg in2000/01 (10.63 Pte/Kg in 1999/00), total soft wheat subsidies have been largely unable to compete with the highEU durum subsidies, leading the farmers to cultivate durum, far beyond the new EU-assigned durum MGAnegotiated under the Agenda 2000 (see also Durum Section). This development is also confirmed by recentlyreleased information on Farmer Declared areas by the national guarantee institute INGA. Difference betweenDeclared total wheat areas in Table below and areas given in PS&D Table result from the cultivation of un-subsidized wheat areas.
GAIN Report #PO0027 Page 3 of 21
UNCLASSIFIED Foreign Agricultural Service/USDA
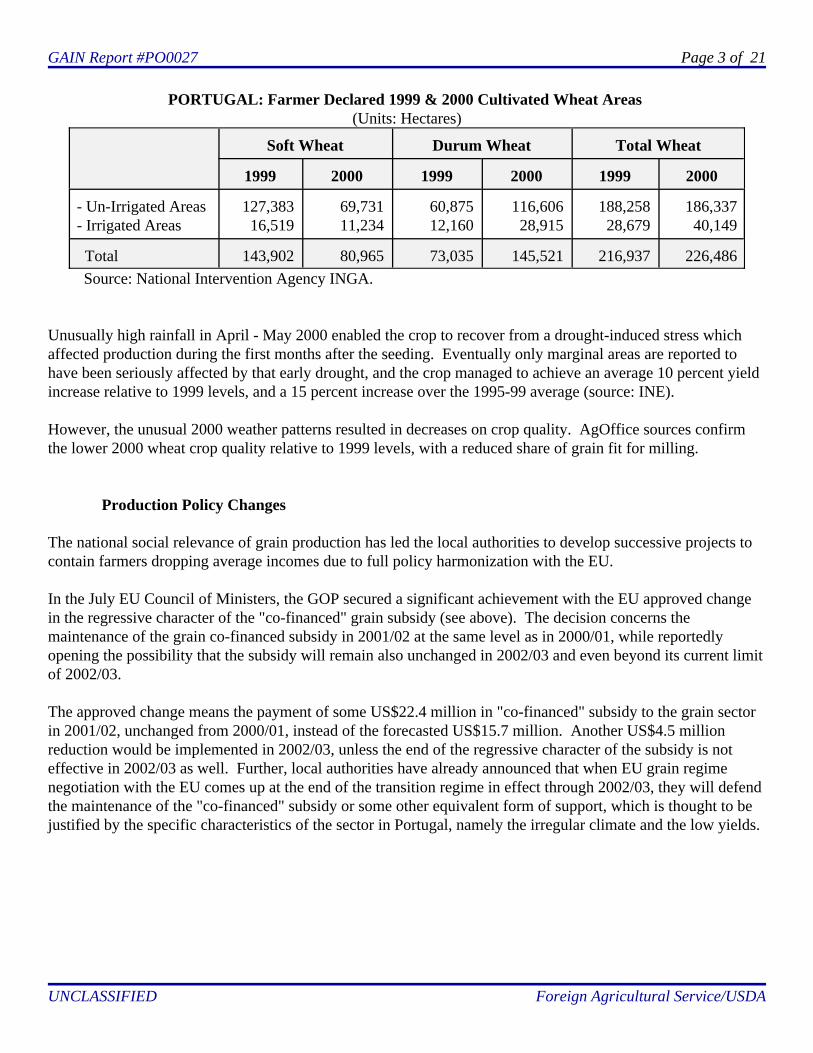
PORTUGAL: Farmer Declared 1999 & 2000 Cultivated Wheat Areas (Units: Hectares)
Soft Wheat Durum Wheat Total Wheat
1999 2000 1999 2000 1999 2000
- Un-Irrigated Areas- Irrigated Areas
127,38316,519
69,73111,234
60,87512,160
116,60628,915
188,25828,679
186,33740,149
Total 143,902 80,965 73,035 145,521 216,937 226,486 Source: National Intervention Agency INGA.
Unusually high rainfall in April - May 2000 enabled the crop to recover from a drought-induced stress whichaffected production during the first months after the seeding. Eventually only marginal areas are reported tohave been seriously affected by that early drought, and the crop managed to achieve an average 10 percent yieldincrease relative to 1999 levels, and a 15 percent increase over the 1995-99 average (source: INE).
However, the unusual 2000 weather patterns resulted in decreases on crop quality. AgOffice sources confirmthe lower 2000 wheat crop quality relative to 1999 levels, with a reduced share of grain fit for milling.
Production Policy Changes
The national social relevance of grain production has led the local authorities to develop successive projects tocontain farmers dropping average incomes due to full policy harmonization with the EU.
In the July EU Council of Ministers, the GOP secured a significant achievement with the EU approved changein the regressive character of the "co-financed" grain subsidy (see above). The decision concerns themaintenance of the grain co-financed subsidy in 2001/02 at the same level as in 2000/01, while reportedlyopening the possibility that the subsidy will remain also unchanged in 2002/03 and even beyond its current limitof 2002/03.
The approved change means the payment of some US$22.4 million in "co-financed" subsidy to the grain sectorin 2001/02, unchanged from 2000/01, instead of the forecasted US$15.7 million. Another US$4.5 millionreduction would be implemented in 2002/03, unless the end of the regressive character of the subsidy is noteffective in 2002/03 as well. Further, local authorities have already announced that when EU grain regimenegotiation with the EU comes up at the end of the transition regime in effect through 2002/03, they will defendthe maintenance of the "co-financed" subsidy or some other equivalent form of support, which is thought to bejustified by the specific characteristics of the sector in Portugal, namely the irregular climate and the low yields.
GAIN Report #PO0027 Page 4 of 21
UNCLASSIFIED Foreign Agricultural Service/USDA
CONSUMPTION
Local wheat consumption is forecast to increase in 2000/01 due to the increased production and decreased wheatprices. The large 2000 EU wheat harvest and more restrictive WTO-mandated export quotas will depress2000/01 wheat prices in the EU as a whole, while some market un-stability caused by the liquidation of formergrain monopoly EPAC is reported to have caused Portuguese wheat prices to drop at the beginning of theharvest. However, this problem has reportedly been to a large extent resolved by a GOP announcement that thefarmers could participate in the management of EPAC’s inland silos, and by the assurance that EPAC willprovide affordable services during the 2000 harvest.
Wheat consumption for milling is expected to remain stable during 2000/01, while rising importation of flour,bread and pasta could cause soft as well as durum wheat total use to drop moderately. The feed-use segmentwill expand considerably as a direct reaction to very low prices, which AgOffice sources report to be close tointervention prices. Soft and durum wheat will likely also be used as feed in addition to feed wheat as aconsequence of the poor crop quality. The national feed mixers association, representing some 70-75 percent oftotal national feed mixing activity, reports that its members consumed 110,929 mt of soft wheat and 234,173 mtof feed wheat in CY1999 (56,480 mt and 221,889 mt respectively in 1998), which include un-specified durumquantities.
TRADE
General
National 2000/01 total wheat imports are forecast to suffer a moderate reduction relative to 1999/00 levels. Reduction will be due to feed wheat, whose needs will be largely satisfied by the local crop. Importation ofmilling wheat is likely to expand moderately on account of the 2000 poor quality wheat crop.
Larger quantities of U.S. wheat will be imported in 2000/01 to meet millers’ needs for improving wheat, underthe EU reduced-tariff high quality wheat import quota. Due to the poor quality of the 2000 crop, while severaltrade sources perceive a generally trending down of EU wheat quality as a consequence of CAP productionincentives, interest in U.S. wheat for blending with lower-quality milling wheat has been increasing. U.S.wheat imports, consisting presently in Northern Spring and in Dark Northern Spring wheat number 2, is beingbrought in by a multinational trader in association with a local importer. In according to these sources, some80,000 Mt of U.S. high quality wheat will be imported during the 2000/01 marketing year.
Factors Affecting the U.S.
Under the EU import regime, only high quality soft wheat can be competitively brought in under the EUreduced-tariff high quality wheat quota.
Climactic factors in the United States restrict the shipping season from the Great Lakes region to the mid-Juneto mid-December period. Importation of large quantities of cereal during this period can lead to complicatedstorage problems in Portugal due to limited conveniently-located storage facilities. Logistics problems becomeextreme when U.S. and Canadian wheat arrivals coincide with imports of corn imported under the 500,000 mt
GAIN Report #PO0027 Page 5 of 21
UNCLASSIFIED Foreign Agricultural Service/USDA
Blair House quota during the first semester of each calendar year. The current 180-day limit set by EUauthorities for Customs clearance, in order for the grain to benefit from the reduced-duty regime of the highquality wheat quota is viewed by the trade as restrictive to higher levels of cereal importation from thirdcountries. The on-going process of privatization of the Lisbon port silos belonging to SILOPOR is another steptowards making the situation more complicated for cereals importers and users due to its possible implicationsfor storage space availability and costs. U.S. high quality wheat currently competes with Canadian, French andGerman high quality wheats.
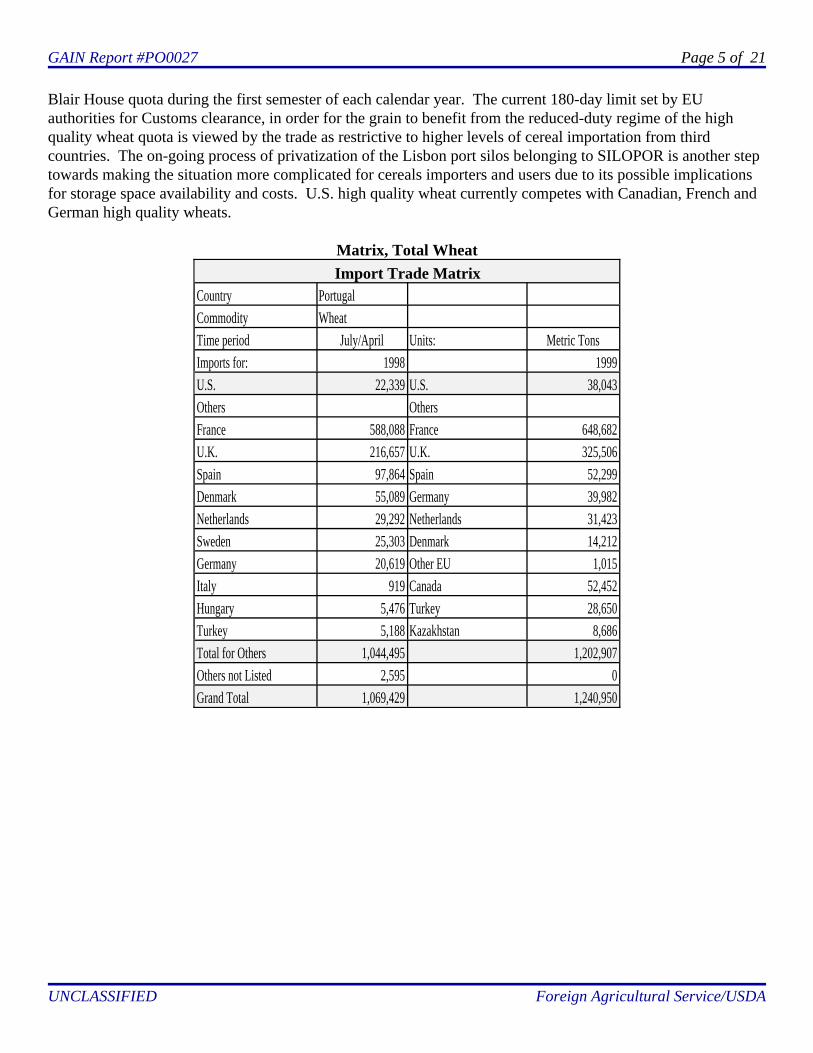
Matrix, Total WheatImport Trade Matrix
Country PortugalCommodity WheatTime period July/April Units: Metric TonsImports for: 1998 1999U.S. 22,339 U.S. 38,043Others OthersFrance 588,088 France 648,682U.K. 216,657 U.K. 325,506Spain 97,864 Spain 52,299Denmark 55,089 Germany 39,982Netherlands 29,292 Netherlands 31,423Sweden 25,303 Denmark 14,212Germany 20,619 Other EU 1,015Italy 919 Canada 52,452Hungary 5,476 Turkey 28,650Turkey 5,188 Kazakhstan 8,686Total for Others 1,044,495 1,202,907Others not Listed 2,595 0Grand Total 1,069,429 1,240,950
GAIN Report #PO0027 Page 6 of 21
UNCLASSIFIED Foreign Agricultural Service/USDA
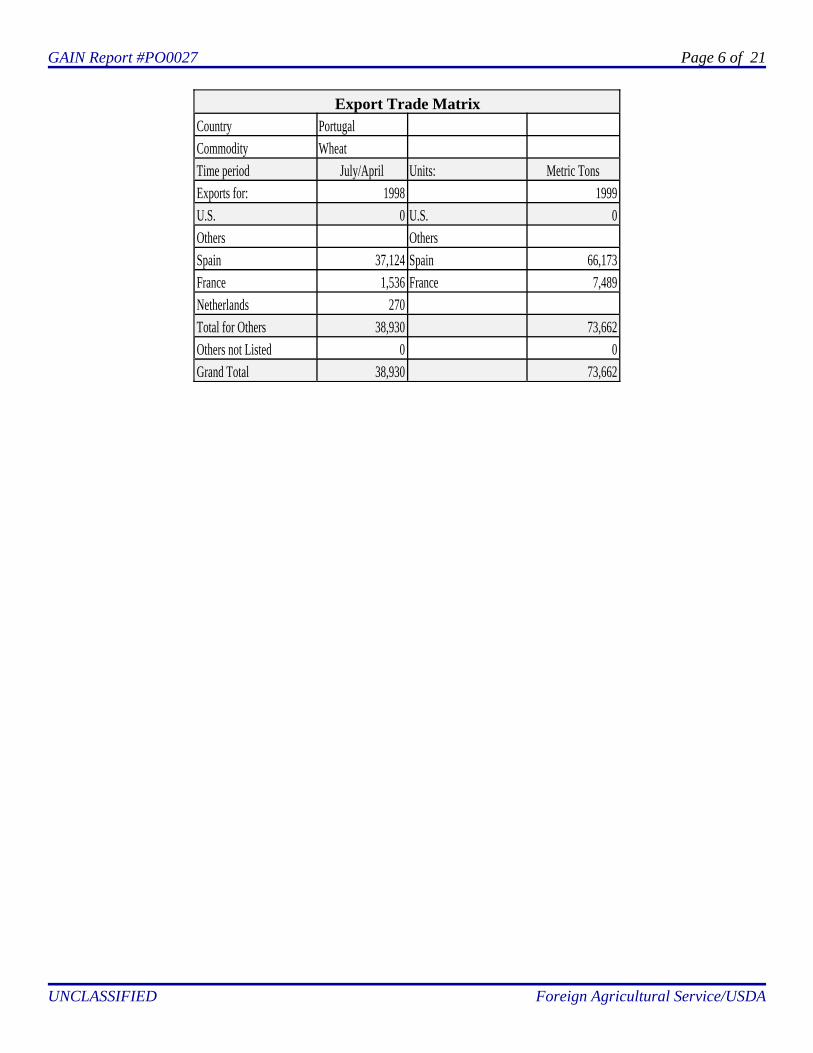
Export Trade MatrixCountry PortugalCommodity WheatTime period July/April Units: Metric TonsExports for: 1998 1999U.S. 0 U.S. 0Others OthersSpain 37,124 Spain 66,173France 1,536 France 7,489Netherlands 270Total for Others 38,930 73,662Others not Listed 0 0Grand Total 38,930 73,662
GAIN Report #PO0027 Page 7 of 21
UNCLASSIFIED Foreign Agricultural Service/USDA
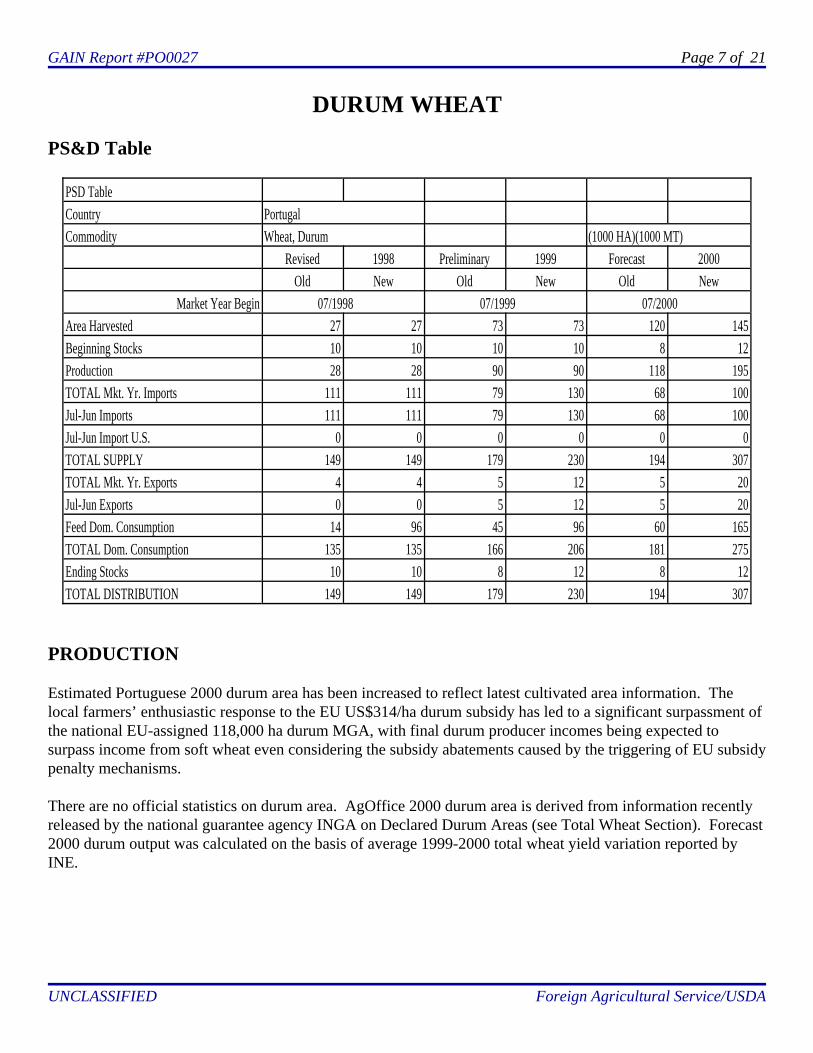
DURUM WHEAT
PS&D Table
PSD TableCountry PortugalCommodity Wheat, Durum (1000 HA)(1000 MT)
Revised 1998 Preliminary 1999 Forecast 2000Old New Old New Old New
Market Year Begin 07/1998 07/1999 07/2000Area Harvested 27 27 73 73 120 145Beginning Stocks 10 10 10 10 8 12Production 28 28 90 90 118 195TOTAL Mkt. Yr. Imports 111 111 79 130 68 100Jul-Jun Imports 111 111 79 130 68 100Jul-Jun Import U.S. 0 0 0 0 0 0TOTAL SUPPLY 149 149 179 230 194 307TOTAL Mkt. Yr. Exports 4 4 5 12 5 20Jul-Jun Exports 0 0 5 12 5 20Feed Dom. Consumption 14 96 45 96 60 165TOTAL Dom. Consumption 135 135 166 206 181 275Ending Stocks 10 10 8 12 8 12TOTAL DISTRIBUTION 149 149 179 230 194 307
PRODUCTION
Estimated Portuguese 2000 durum area has been increased to reflect latest cultivated area information. Thelocal farmers’ enthusiastic response to the EU US$314/ha durum subsidy has led to a significant surpassment ofthe national EU-assigned 118,000 ha durum MGA, with final durum producer incomes being expected tosurpass income from soft wheat even considering the subsidy abatements caused by the triggering of EU subsidypenalty mechanisms.
There are no official statistics on durum area. AgOffice 2000 durum area is derived from information recentlyreleased by the national guarantee agency INGA on Declared Durum Areas (see Total Wheat Section). Forecast2000 durum output was calculated on the basis of average 1999-2000 total wheat yield variation reported byINE.
GAIN Report #PO0027 Page 8 of 21
UNCLASSIFIED Foreign Agricultural Service/USDA
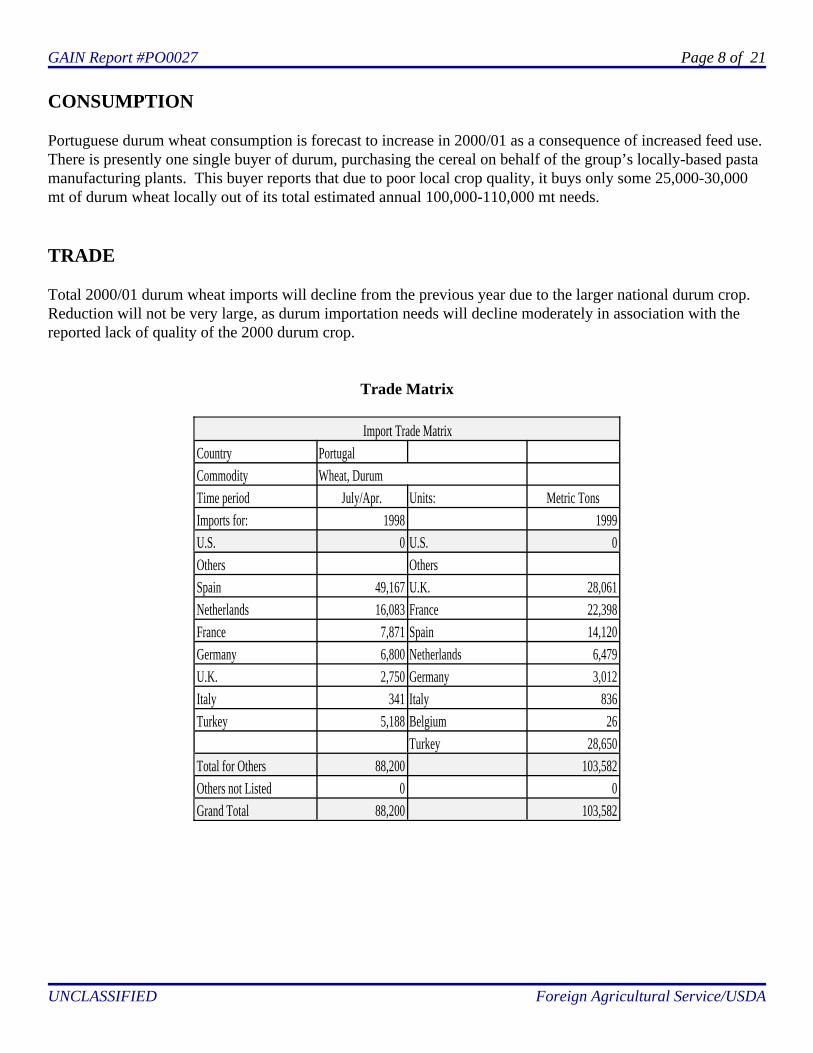
CONSUMPTION
Portuguese durum wheat consumption is forecast to increase in 2000/01 as a consequence of increased feed use. There is presently one single buyer of durum, purchasing the cereal on behalf of the group’s locally-based pastamanufacturing plants. This buyer reports that due to poor local crop quality, it buys only some 25,000-30,000mt of durum wheat locally out of its total estimated annual 100,000-110,000 mt needs.
TRADE
Total 2000/01 durum wheat imports will decline from the previous year due to the larger national durum crop. Reduction will not be very large, as durum importation needs will decline moderately in association with thereported lack of quality of the 2000 durum crop.
Trade Matrix
Import Trade MatrixCountry PortugalCommodity Wheat, DurumTime period July/Apr. Units: Metric TonsImports for: 1998 1999U.S. 0 U.S. 0Others OthersSpain 49,167 U.K. 28,061Netherlands 16,083 France 22,398France 7,871 Spain 14,120Germany 6,800 Netherlands 6,479U.K. 2,750 Germany 3,012Italy 341 Italy 836Turkey 5,188 Belgium 26
Turkey 28,650Total for Others 88,200 103,582Others not Listed 0 0Grand Total 88,200 103,582
GAIN Report #PO0027 Page 9 of 21
UNCLASSIFIED Foreign Agricultural Service/USDA
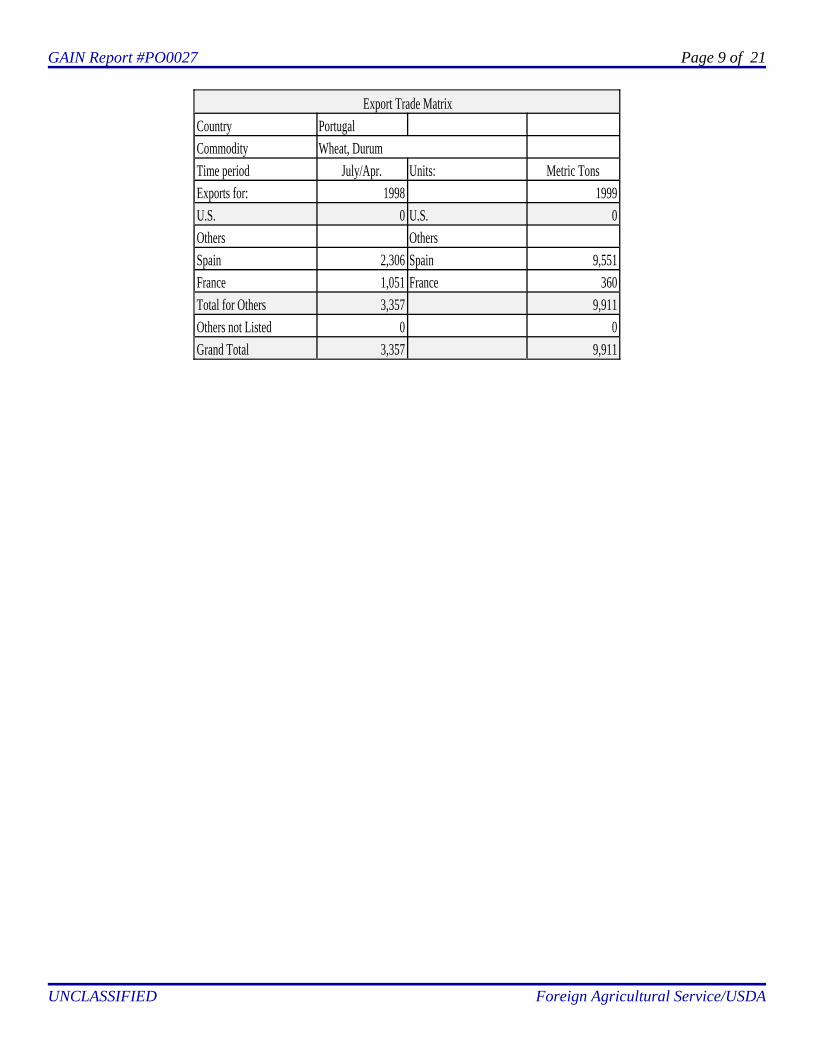
Export Trade MatrixCountry PortugalCommodity Wheat, DurumTime period July/Apr. Units: Metric TonsExports for: 1998 1999U.S. 0 U.S. 0Others OthersSpain 2,306 Spain 9,551France 1,051 France 360Total for Others 3,357 9,911Others not Listed 0 0Grand Total 3,357 9,911
GAIN Report #PO0027 Page 10 of 21
UNCLASSIFIED Foreign Agricultural Service/USDA
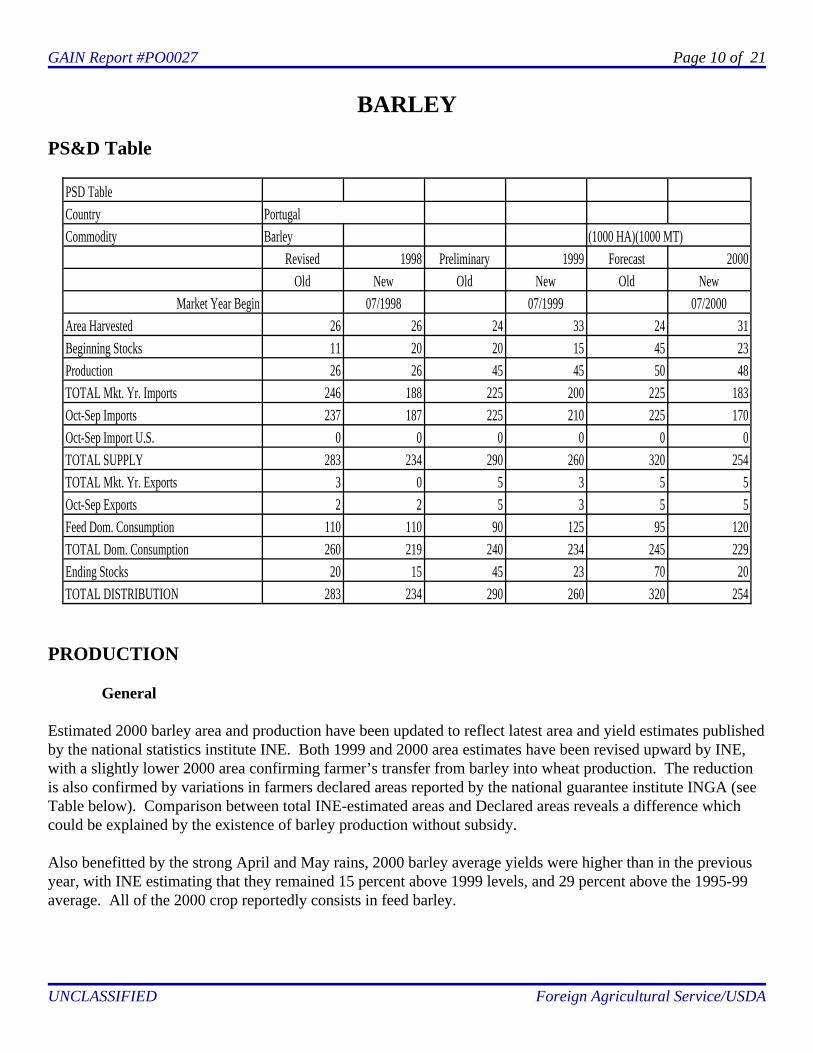
BARLEY
PS&D Table
PSD TableCountry PortugalCommodity Barley (1000 HA)(1000 MT)
Revised 1998 Preliminary 1999 Forecast 2000Old New Old New Old New
Market Year Begin 07/1998 07/1999 07/2000Area Harvested 26 26 24 33 24 31Beginning Stocks 11 20 20 15 45 23Production 26 26 45 45 50 48TOTAL Mkt. Yr. Imports 246 188 225 200 225 183Oct-Sep Imports 237 187 225 210 225 170Oct-Sep Import U.S. 0 0 0 0 0 0TOTAL SUPPLY 283 234 290 260 320 254TOTAL Mkt. Yr. Exports 3 0 5 3 5 5Oct-Sep Exports 2 2 5 3 5 5Feed Dom. Consumption 110 110 90 125 95 120TOTAL Dom. Consumption 260 219 240 234 245 229Ending Stocks 20 15 45 23 70 20TOTAL DISTRIBUTION 283 234 290 260 320 254
PRODUCTION
General
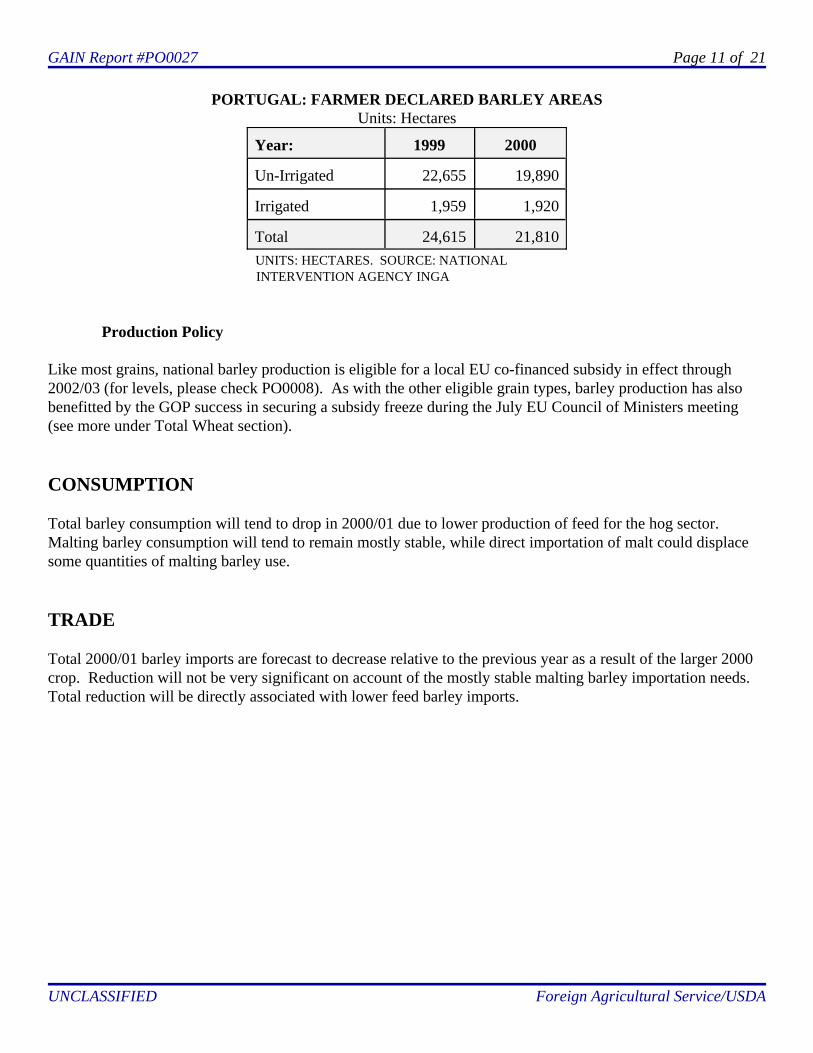
Estimated 2000 barley area and production have been updated to reflect latest area and yield estimates publishedby the national statistics institute INE. Both 1999 and 2000 area estimates have been revised upward by INE,with a slightly lower 2000 area confirming farmer’s transfer from barley into wheat production. The reductionis also confirmed by variations in farmers declared areas reported by the national guarantee institute INGA (seeTable below). Comparison between total INE-estimated areas and Declared areas reveals a difference whichcould be explained by the existence of barley production without subsidy.
Also benefitted by the strong April and May rains, 2000 barley average yields were higher than in the previousyear, with INE estimating that they remained 15 percent above 1999 levels, and 29 percent above the 1995-99average. All of the 2000 crop reportedly consists in feed barley.
GAIN Report #PO0027 Page 11 of 21
UNCLASSIFIED Foreign Agricultural Service/USDA
PORTUGAL: FARMER DECLARED BARLEY AREASUnits: Hectares
Year: 1999 2000
Un-Irrigated 22,655 19,890
Irrigated 1,959 1,920
Total 24,615 21,810 UNITS: HECTARES. SOURCE: NATIONAL INTERVENTION AGENCY INGA
Production Policy
Like most grains, national barley production is eligible for a local EU co-financed subsidy in effect through2002/03 (for levels, please check PO0008). As with the other eligible grain types, barley production has alsobenefitted by the GOP success in securing a subsidy freeze during the July EU Council of Ministers meeting(see more under Total Wheat section).
CONSUMPTION
Total barley consumption will tend to drop in 2000/01 due to lower production of feed for the hog sector. Malting barley consumption will tend to remain mostly stable, while direct importation of malt could displacesome quantities of malting barley use.
TRADE
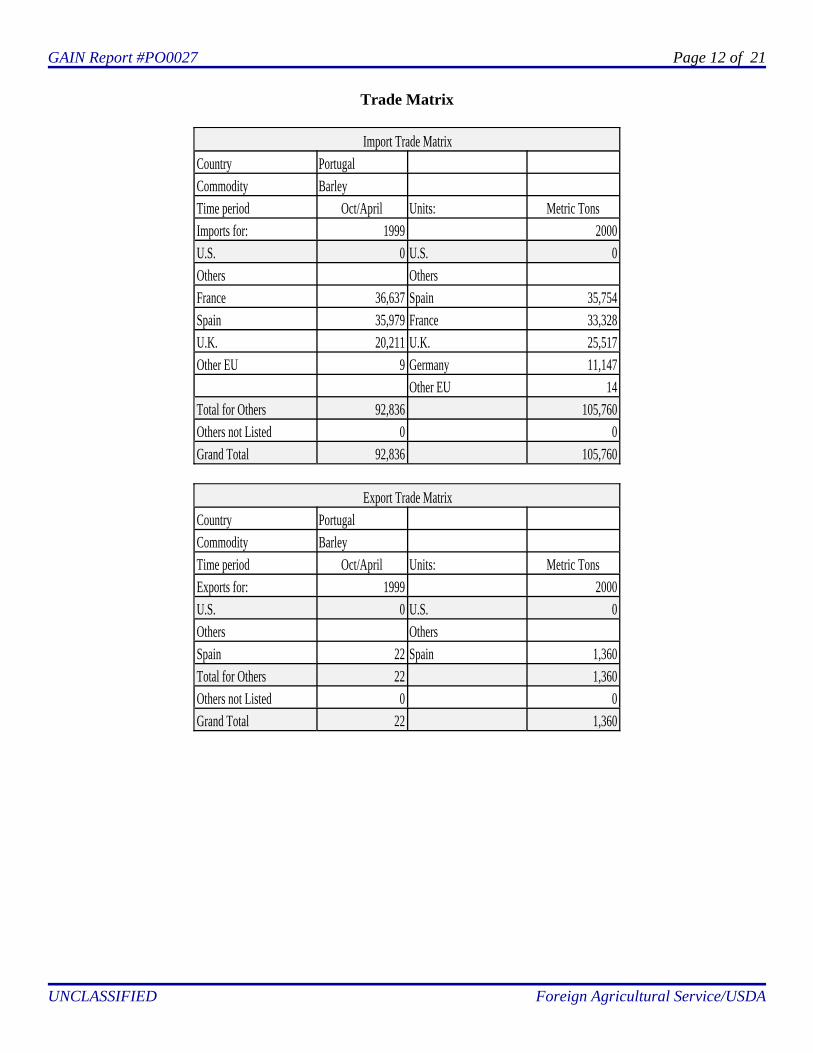
Total 2000/01 barley imports are forecast to decrease relative to the previous year as a result of the larger 2000crop. Reduction will not be very significant on account of the mostly stable malting barley importation needs. Total reduction will be directly associated with lower feed barley imports.
GAIN Report #PO0027 Page 12 of 21
UNCLASSIFIED Foreign Agricultural Service/USDA
Trade Matrix
Import Trade MatrixCountry PortugalCommodity BarleyTime period Oct/April Units: Metric TonsImports for: 1999 2000U.S. 0 U.S. 0Others OthersFrance 36,637 Spain 35,754Spain 35,979 France 33,328U.K. 20,211 U.K. 25,517Other EU 9 Germany 11,147
Other EU 14Total for Others 92,836 105,760Others not Listed 0 0Grand Total 92,836 105,760
Export Trade MatrixCountry PortugalCommodity BarleyTime period Oct/April Units: Metric TonsExports for: 1999 2000U.S. 0 U.S. 0Others OthersSpain 22 Spain 1,360Total for Others 22 1,360Others not Listed 0 0Grand Total 22 1,360
GAIN Report #PO0027 Page 13 of 21
UNCLASSIFIED Foreign Agricultural Service/USDA
CORN
PS&D Table
PSD TableCountry PortugalCommodity Corn (1000 HA)(1000 MT)
Revised 1998 Preliminary 1999 Forecast 2000Old New Old New Old New
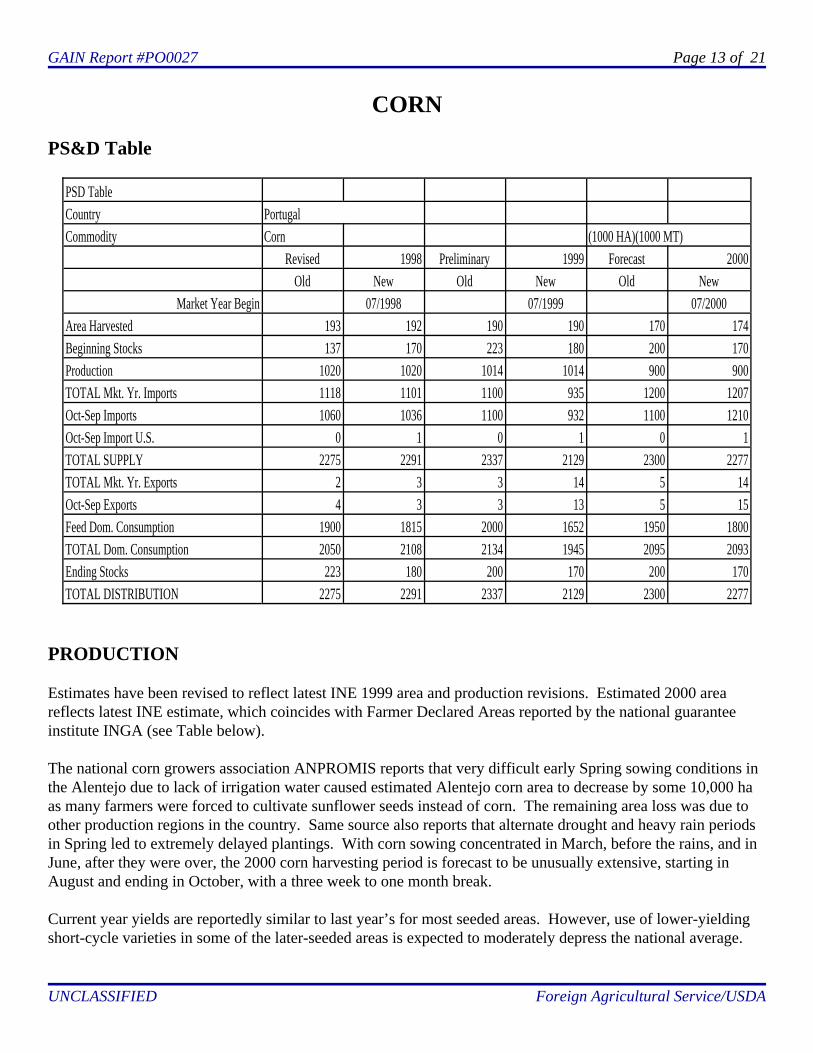
Market Year Begin 07/1998 07/1999 07/2000Area Harvested 193 192 190 190 170 174Beginning Stocks 137 170 223 180 200 170Production 1020 1020 1014 1014 900 900TOTAL Mkt. Yr. Imports 1118 1101 1100 935 1200 1207Oct-Sep Imports 1060 1036 1100 932 1100 1210Oct-Sep Import U.S. 0 1 0 1 0 1TOTAL SUPPLY 2275 2291 2337 2129 2300 2277TOTAL Mkt. Yr. Exports 2 3 3 14 5 14Oct-Sep Exports 4 3 3 13 5 15Feed Dom. Consumption 1900 1815 2000 1652 1950 1800TOTAL Dom. Consumption 2050 2108 2134 1945 2095 2093Ending Stocks 223 180 200 170 200 170TOTAL DISTRIBUTION 2275 2291 2337 2129 2300 2277
PRODUCTION
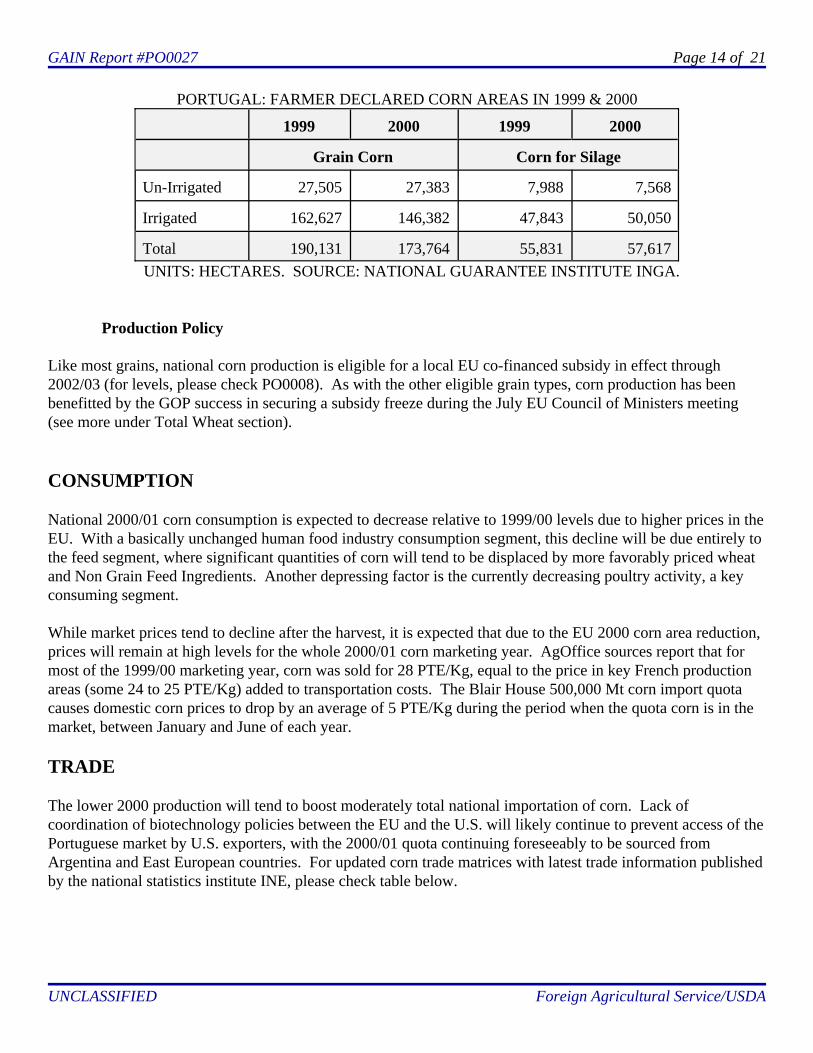
Estimates have been revised to reflect latest INE 1999 area and production revisions. Estimated 2000 areareflects latest INE estimate, which coincides with Farmer Declared Areas reported by the national guaranteeinstitute INGA (see Table below).
The national corn growers association ANPROMIS reports that very difficult early Spring sowing conditions inthe Alentejo due to lack of irrigation water caused estimated Alentejo corn area to decrease by some 10,000 haas many farmers were forced to cultivate sunflower seeds instead of corn. The remaining area loss was due toother production regions in the country. Same source also reports that alternate drought and heavy rain periodsin Spring led to extremely delayed plantings. With corn sowing concentrated in March, before the rains, and inJune, after they were over, the 2000 corn harvesting period is forecast to be unusually extensive, starting inAugust and ending in October, with a three week to one month break.
Current year yields are reportedly similar to last year’s for most seeded areas. However, use of lower-yieldingshort-cycle varieties in some of the later-seeded areas is expected to moderately depress the national average.
GAIN Report #PO0027 Page 14 of 21
UNCLASSIFIED Foreign Agricultural Service/USDA
PORTUGAL: FARMER DECLARED CORN AREAS IN 1999 & 2000
1999 2000 1999 2000
Grain Corn Corn for Silage
Un-Irrigated 27,505 27,383 7,988 7,568
Irrigated 162,627 146,382 47,843 50,050
Total 190,131 173,764 55,831 57,617UNITS: HECTARES. SOURCE: NATIONAL GUARANTEE INSTITUTE INGA.
Production Policy
Like most grains, national corn production is eligible for a local EU co-financed subsidy in effect through2002/03 (for levels, please check PO0008). As with the other eligible grain types, corn production has beenbenefitted by the GOP success in securing a subsidy freeze during the July EU Council of Ministers meeting(see more under Total Wheat section).
CONSUMPTION
National 2000/01 corn consumption is expected to decrease relative to 1999/00 levels due to higher prices in theEU. With a basically unchanged human food industry consumption segment, this decline will be due entirely tothe feed segment, where significant quantities of corn will tend to be displaced by more favorably priced wheatand Non Grain Feed Ingredients. Another depressing factor is the currently decreasing poultry activity, a keyconsuming segment.
While market prices tend to decline after the harvest, it is expected that due to the EU 2000 corn area reduction,prices will remain at high levels for the whole 2000/01 corn marketing year. AgOffice sources report that formost of the 1999/00 marketing year, corn was sold for 28 PTE/Kg, equal to the price in key French productionareas (some 24 to 25 PTE/Kg) added to transportation costs. The Blair House 500,000 Mt corn import quotacauses domestic corn prices to drop by an average of 5 PTE/Kg during the period when the quota corn is in themarket, between January and June of each year.
TRADE
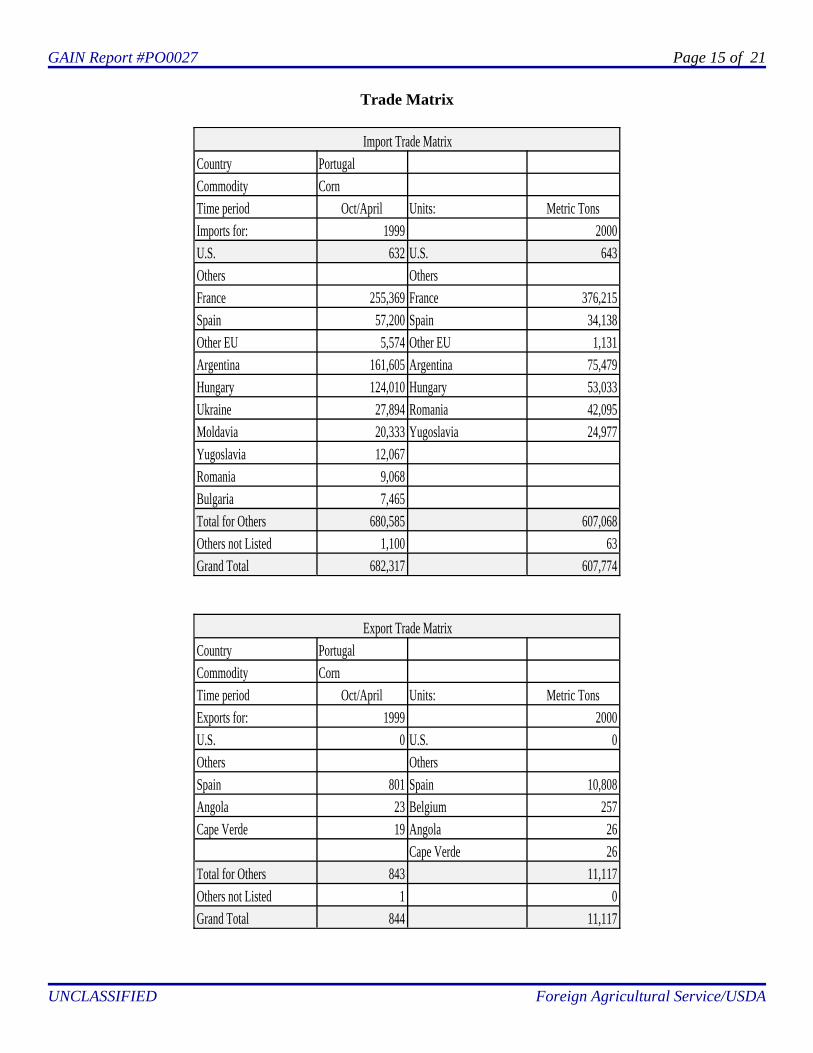
The lower 2000 production will tend to boost moderately total national importation of corn. Lack ofcoordination of biotechnology policies between the EU and the U.S. will likely continue to prevent access of thePortuguese market by U.S. exporters, with the 2000/01 quota continuing foreseeably to be sourced fromArgentina and East European countries. For updated corn trade matrices with latest trade information publishedby the national statistics institute INE, please check table below.
GAIN Report #PO0027 Page 15 of 21
UNCLASSIFIED Foreign Agricultural Service/USDA
Trade Matrix
Import Trade MatrixCountry PortugalCommodity CornTime period Oct/April Units: Metric TonsImports for: 1999 2000U.S. 632 U.S. 643Others OthersFrance 255,369 France 376,215Spain 57,200 Spain 34,138Other EU 5,574 Other EU 1,131Argentina 161,605 Argentina 75,479Hungary 124,010 Hungary 53,033Ukraine 27,894 Romania 42,095Moldavia 20,333 Yugoslavia 24,977Yugoslavia 12,067Romania 9,068Bulgaria 7,465Total for Others 680,585 607,068Others not Listed 1,100 63Grand Total 682,317 607,774
Export Trade MatrixCountry PortugalCommodity CornTime period Oct/April Units: Metric TonsExports for: 1999 2000U.S. 0 U.S. 0Others OthersSpain 801 Spain 10,808Angola 23 Belgium 257Cape Verde 19 Angola 26
Cape Verde 26Total for Others 843 11,117Others not Listed 1 0Grand Total 844 11,117
GAIN Report #PO0027 Page 16 of 21
UNCLASSIFIED Foreign Agricultural Service/USDA
RICE
PS&D Table
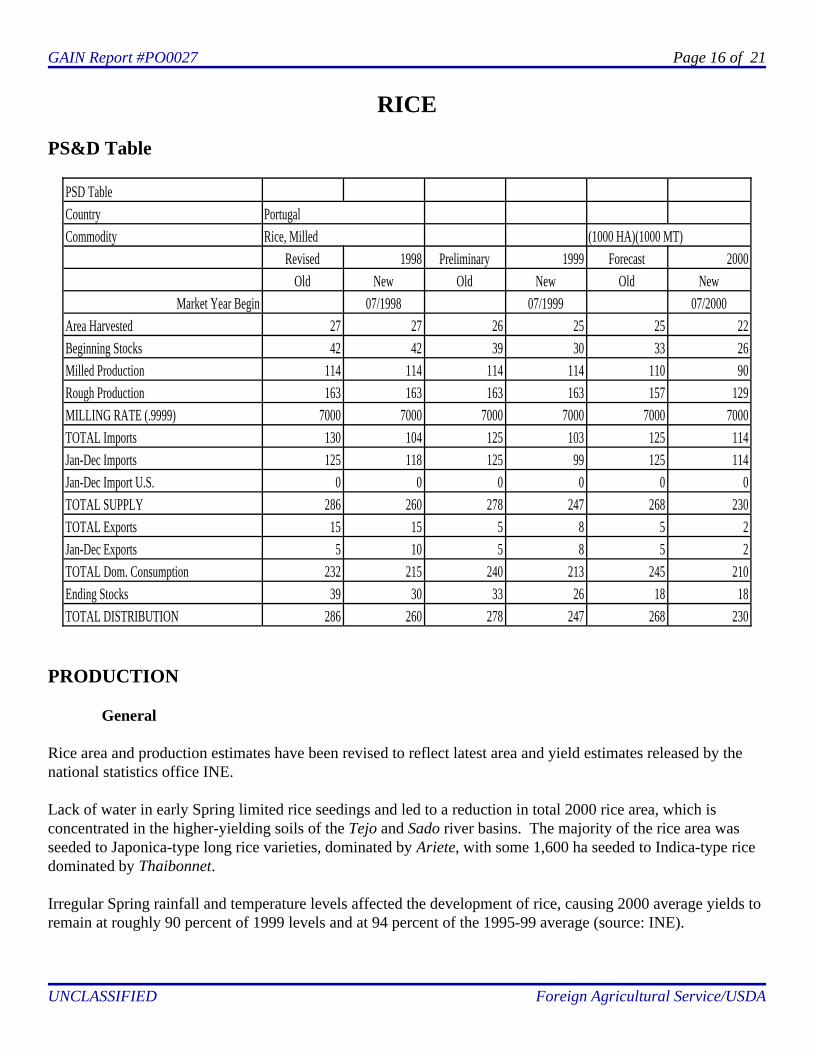
PSD TableCountry PortugalCommodity Rice, Milled (1000 HA)(1000 MT)
Revised 1998 Preliminary 1999 Forecast 2000Old New Old New Old New
Market Year Begin 07/1998 07/1999 07/2000Area Harvested 27 27 26 25 25 22Beginning Stocks 42 42 39 30 33 26Milled Production 114 114 114 114 110 90Rough Production 163 163 163 163 157 129MILLING RATE (.9999) 7000 7000 7000 7000 7000 7000TOTAL Imports 130 104 125 103 125 114Jan-Dec Imports 125 118 125 99 125 114Jan-Dec Import U.S. 0 0 0 0 0 0TOTAL SUPPLY 286 260 278 247 268 230TOTAL Exports 15 15 5 8 5 2Jan-Dec Exports 5 10 5 8 5 2TOTAL Dom. Consumption 232 215 240 213 245 210Ending Stocks 39 30 33 26 18 18TOTAL DISTRIBUTION 286 260 278 247 268 230
PRODUCTION
General
Rice area and production estimates have been revised to reflect latest area and yield estimates released by thenational statistics office INE.
Lack of water in early Spring limited rice seedings and led to a reduction in total 2000 rice area, which isconcentrated in the higher-yielding soils of the Tejo and Sado river basins. The majority of the rice area wasseeded to Japonica-type long rice varieties, dominated by Ariete, with some 1,600 ha seeded to Indica-type ricedominated by Thaibonnet.
Irregular Spring rainfall and temperature levels affected the development of rice, causing 2000 average yields toremain at roughly 90 percent of 1999 levels and at 94 percent of the 1995-99 average (source: INE).
GAIN Report #PO0027 Page 17 of 21
UNCLASSIFIED Foreign Agricultural Service/USDA
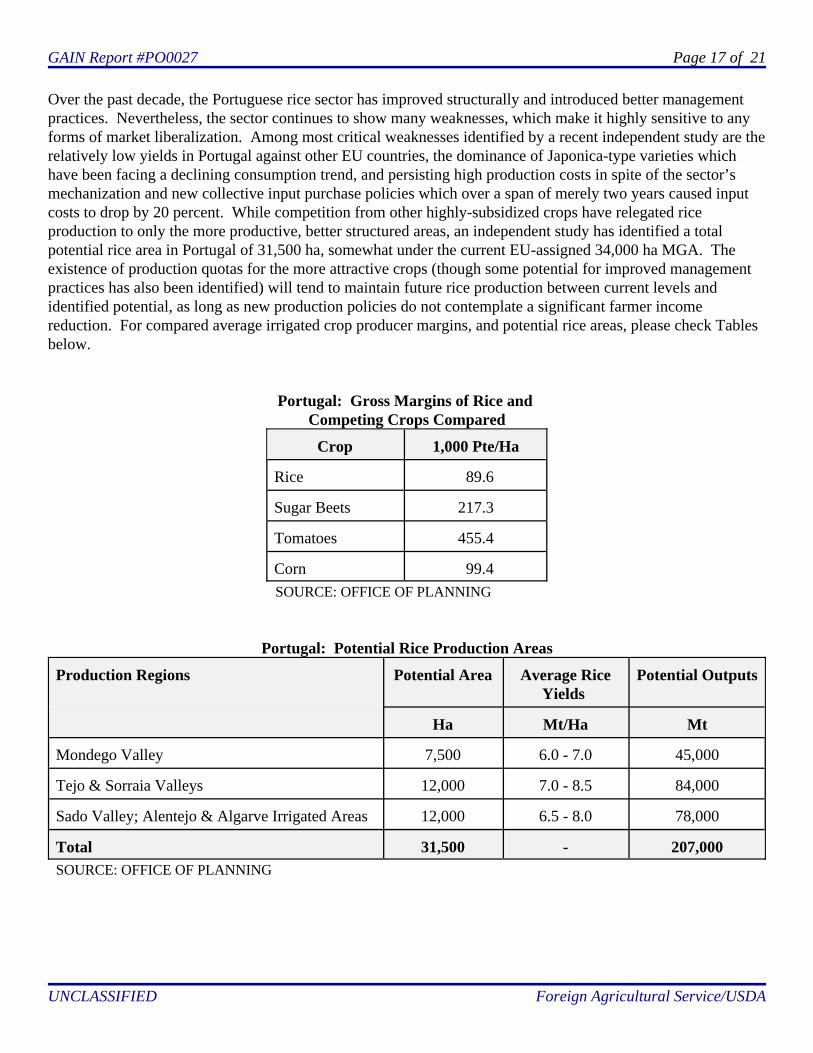
Over the past decade, the Portuguese rice sector has improved structurally and introduced better managementpractices. Nevertheless, the sector continues to show many weaknesses, which make it highly sensitive to anyforms of market liberalization. Among most critical weaknesses identified by a recent independent study are therelatively low yields in Portugal against other EU countries, the dominance of Japonica-type varieties whichhave been facing a declining consumption trend, and persisting high production costs in spite of the sector’smechanization and new collective input purchase policies which over a span of merely two years caused inputcosts to drop by 20 percent. While competition from other highly-subsidized crops have relegated riceproduction to only the more productive, better structured areas, an independent study has identified a totalpotential rice area in Portugal of 31,500 ha, somewhat under the current EU-assigned 34,000 ha MGA. Theexistence of production quotas for the more attractive crops (though some potential for improved managementpractices has also been identified) will tend to maintain future rice production between current levels andidentified potential, as long as new production policies do not contemplate a significant farmer incomereduction. For compared average irrigated crop producer margins, and potential rice areas, please check Tablesbelow.
Portugal: Gross Margins of Rice and Competing Crops Compared
Crop 1,000 Pte/Ha
Rice 89.6
Sugar Beets 217.3
Tomatoes 455.4
Corn 99.4 SOURCE: OFFICE OF PLANNING
Portugal: Potential Rice Production Areas
Production Regions Potential Area Average RiceYields
Potential Outputs
Ha Mt/Ha Mt
Mondego Valley 7,500 6.0 - 7.0 45,000
Tejo & Sorraia Valleys 12,000 7.0 - 8.5 84,000
Sado Valley; Alentejo & Algarve Irrigated Areas 12,000 6.5 - 8.0 78,000
Total 31,500 - 207,000 SOURCE: OFFICE OF PLANNING
GAIN Report #PO0027 Page 18 of 21
UNCLASSIFIED Foreign Agricultural Service/USDA
Production Policy
The WTO negotiations and the EU Rice Policy revision are key threats to the Portuguese rice sector, due to theexistence of a major price gap with international price levels.
The EU Common Rice Policy revision, presently under discussion, has generated unfavorable reactions on thepart of Portugal and other rice producing countries. The elimination of rice intervention mechanisms and theinclusion of rice in the EU Arable Crops regime is considered unacceptable by producers and local authorities. Producers believe that a sector reform based on the EU Commission proposal would cause farmer income lossesin the range of 360,000 Pte/ha which would not be off-set by higher subsidies.
CONSUMPTION
Rice 2000/01 consumption is forecast to decrease moderately due to competition from imported pastas andchanging consumption patterns. Nevertheless, per capita consumption levels remain at the EU’s highest at some14.5 Kg/hab/year.
Most significant recent market trends refer to the growth of the extra-long "needle", and more recently to theparboiled rice market niche. A recent independent study reveals that "needle" rice accounted in 1998/99 fornearly 40 percent of domestic rice consumption, already close to the EU 45 percent average. As for parboiledrice, on the rise over past years at an average yearly rate of more than 40 percent, it accounts for a market shareof less than three percent. Short and medium rice account for little more than two percent of total national riceconsumption. Remaining consumption is accounted for by Japonica-type, primarily locally-produced "carolino"rice.
TRADE
Portuguese 2000/01 rice imports are forecast to expand moderately due to the 2000 reduction in production. Extra-long Indica-type "needle" rice, on a sharp rise since the mid-90's, is presently the import market leader, isexpected to account for some 75 percent of total 2000/01 rice imports. Relegated to a secondary position, andon a decreasing trend since the mid-90's, Japonica-type medium-rice is expected to account for some 12 percent of total 2000/01 imports.
The bulk of the imports are in the paddy and brown rice forms, with white rice accounting for a minimal shareof the total. The bulk of imported Japonica-type rice consists of paddy rice, primarily from France, followed byItaly. The recent replacement of the Antilles with Guiana and Suriname for indica-type rices has beenaccompanied by a replacement of semi-processed rice with brown and paddy rice, which the industry has foundeasier to find in these origins.

GAIN Report #PO0027 Page 19 of 21
UNCLASSIFIED Foreign Agricultural Service/USDA
Trade Matrix
Import Trade MatrixCountry PortugalCommodity Rice, MilledTime period Jan/Decemb Units: Metric TonsImports for: 1998 1999U.S. 0 U.S. 0Others OthersSpain 31,909 France 26,153France 26,205 Spain 24,317Italy 4,884 Italy 5,763Greece 2,350 Netherlands 1,487Netherlands 1,443 Other EU 14Other EU 162 Guiana 38,367Guiana 40,620 Suriname 2,582Suriname 8,257 Dutch Antilles 375Dutch Antilles 1,909 Thailand 77Uruguay 382Total for Others 118,121 99,135Others not Listed 225 12Grand Total 118,346 99,147
Export Trade MatrixCountry PortugalCommodity Rice, MilledTime period Jan/Decemb Units: Metric TonsExports for: 1998 1999U.S. 0 U.S. 0Others OthersSpain 5,133 Netherlands 2,557Belgium 2,937 U.K. 2,510U.K. 1,120 Belgium 2,185Netherlands 634 Spain 1,115France 517 France 2Other EU 92 S. Tome & Prince 2Cape Verde 2,508 Angola 2Angola 1,013 Mozambique 1Total for Others 13,954 8,374Others not Listed 497Grand Total 14,451 8,374
GAIN Report #PO0027 Page 20 of 21
UNCLASSIFIED Foreign Agricultural Service/USDA
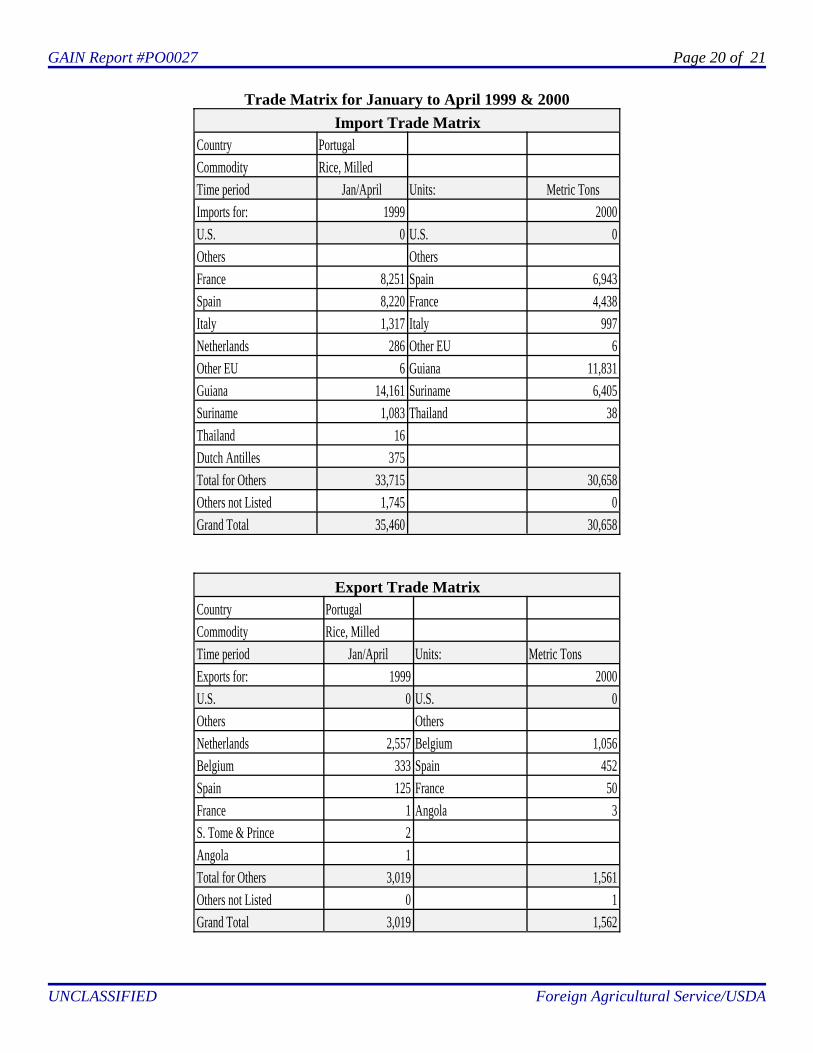
Trade Matrix for January to April 1999 & 2000Import Trade Matrix
Country PortugalCommodity Rice, MilledTime period Jan/April Units: Metric TonsImports for: 1999 2000U.S. 0 U.S. 0Others OthersFrance 8,251 Spain 6,943Spain 8,220 France 4,438Italy 1,317 Italy 997Netherlands 286 Other EU 6Other EU 6 Guiana 11,831Guiana 14,161 Suriname 6,405Suriname 1,083 Thailand 38Thailand 16Dutch Antilles 375Total for Others 33,715 30,658Others not Listed 1,745 0Grand Total 35,460 30,658
Export Trade MatrixCountry PortugalCommodity Rice, MilledTime period Jan/April Units: Metric TonsExports for: 1999 2000U.S. 0 U.S. 0Others OthersNetherlands 2,557 Belgium 1,056Belgium 333 Spain 452Spain 125 France 50France 1 Angola 3S. Tome & Prince 2Angola 1Total for Others 3,019 1,561Others not Listed 0 1Grand Total 3,019 1,562
GAIN Report #PO0027 Page 21 of 21
UNCLASSIFIED Foreign Agricultural Service/USDA
TRADE POLICY
The EU Rice Common Policy revision in progress will lead to a drastic change in the current rice importing regime, as the proposed elimination of the riceintervention price, the EU Commission contends, will automatically lead to the end of the Margins of Preference regime.