global analysis of gene expression in response to whole-chromosome ... · chromosome-wide gene...
TRANSCRIPT

Global Analysis of Gene Expression inResponse to Whole-Chromosome Aneuploidy inHexaploid Wheat1[OPEN]
Ai Zhang, Ning Li, Lei Gong, Xiaowan Gou, Bin Wang, Xin Deng, Changping Li, Qianli Dong,Huakun Zhang,2 and Bao Liu3
Key Laboratory of Molecular Epigenetics of the Ministry of Education, Northeast Normal University,Changchun 130024, People’s Republic of China
ORCID ID: 0000-0001-5481-1675 (B.L.).
Aneuploidy, a condition of unbalanced chromosome content, represents a large-effect mutation that bears significant relevanceto human health and microbe adaptation. As such, extensive studies of aneuploidy have been conducted in unicellular modelorganisms and cancer cells. Aneuploidy also frequently is associated with plant polyploidization, but its impact on geneexpression and its relevance to polyploid genome evolution/functional innovation remain largely unknown. Here, we used apanel of diverse types of whole-chromosome aneuploidy of hexaploid wheat (Triticum aestivum), all under the common geneticbackground of cv Chinese Spring, to systemically investigate the impact of aneuploidy on genome-, subgenome-, andchromosome-wide gene expression. Compared with prior findings in haploid or diploid aneuploid systems, we unraveladditional and novel features of alteration in global gene expression resulting from the two major impacts of aneuploidy, cis-and trans-regulation, as well as dosage compensation. We show that the expression-altered genes map evenly along eachchromosome, with no evidence for coregulating aggregated expression domains. However, chromosomes and subgenomes inhexaploid wheat are unequal in their responses to aneuploidy with respect to the number of genes being dysregulated.Strikingly, homeologous chromosomes do not differ from nonhomologous chromosomes in terms of aneuploidy-inducedtrans-acting effects, suggesting that the three constituent subgenomes of hexaploid wheat are largely uncoupled at thetranscriptional level of gene regulation. Together, our findings shed new insights into the functional interplay betweenhomeologous chromosomes and interactions between subgenomes in hexaploid wheat, which bear implications to furtherour understanding of allopolyploid genome evolution and efforts in breeding new allopolyploid crops.
Aneuploidy in a broad sense includes the gain and/or loss of whole chromosomes, chromosome arms, orvariable sizes of chromosomal segments (Tang andAmon, 2013). Nevertheless, the most frequent type ofaneuploidy is whole-chromosome aneuploidy, whichrefers to conditions with excess and/or deficiency ofsome but not all the chromosomes and, hence, rep-resents a severely imbalanced genome alteration.
Consequently, the normal dosages of thousands ofgenes located on the aneuploid chromosome(s) are al-tered simultaneously, which produces profound effectson virtually all aspects of cellular physiology and often,but not always, impairs fitness (Torres et al., 2008;Williams and Amon, 2009; Rutledge and Cimini, 2016).Aneuploidy bears significant relevance to humanhealth, as the condition is the leading cause of mentalretardation and spontaneous abortion and a hallmarkof cancer cells (Weaver and Cleveland, 2006). Aneu-ploidy also has been increasingly recognized as animportant source of heritable variations and a drivingforce for rapid adaption by pathogenic microbial or-ganisms under selective conditions (Pavelka et al.,2010), suggesting that an unbalanced karyotype, atleast in some organisms under certain circumstances,can be adaptive.
Conceivably, an immediate impact of aneuploidy ison gene expression and, hence, altered abundance ofgene products. Accumulated studies in model cellularsystems and disparate organisms have established thataneuploidy can exert two broad types of impact ongene expression: (1) primary or cis-effects, that is, ex-pression of the genes residing on the aneuploid chro-mosomes is altered due to dosage effects; and (2)secondary or trans-effects, that is, expression of a
1 This work was supported by the National Key Research andDevelopment Program of China (2016YFD0102003), the NationalNatural Science Foundation of China (31290210), and the Programfor Introducing Talents to Universities (B07017).
2 Current address: John Innes Centre, Colney, Norwich NR4 7UH,UK.
3 Address correspondence to [email protected] author responsible for distribution of materials integral to the
findings presented in this article in accordance with the policy de-scribed in the Instructions for Authors (www.plantphysiol.org) is:Bao Liu ([email protected]).
B.L. conceived and supervised the study; B.L. and L.G. supervisedthe experiments; A.Z., X.W.G., X.D., and H.K.Z. carried out the ex-periments; A.Z., N.L., Q.D., L.G., and B.L. analyzed the data andinterpreted the results; A.Z. and B.L. wrote the article with contribu-tions and approval from all authors.
[OPEN] Articles can be viewed without a subscription.www.plantphysiol.org/cgi/doi/10.1104/pp.17.00819
828 Plant Physiology�, October 2017, Vol. 175, pp. 828–847, www.plantphysiol.org � 2017 American Society of Plant Biologists. All Rights Reserved. www.plantphysiol.orgon May 1, 2019 - Published by Downloaded from
Copyright © 2017 American Society of Plant Biologists. All rights reserved.

sizable portion of genes located on all the unvariedchromosomes is altered due to aneuploidy-inducedactivation and/or suppression of cellular pathways, aphenomenon dubbed the aneuploidy transcriptionalresponse (Sheltzer et al., 2012; Birchler, 2014; Dürrbaumand Storchová, 2016). The molecular underpinnings ofboth the cis- and trans-effects on gene expression byaneuploidy remain to be fully understood (Birchler andVeitia, 2007; Dürrbaum and Storchová, 2016; Rutledgeand Cimini, 2016). Meanwhile, dosage compensationalsomay occur, whereby the expression of certain geneslocated on some aneuploid chromosome(s) remainsunchanged in spite of their copy number alterations(Guo and Birchler, 1994; Birchler et al., 2001; Hose et al.,2015; Gasch et al., 2016).Model cellular aneuploid systems often concern only
gain of chromosome(s), because the genetic back-ground is either haploid or diploid, neither of whichcan usually sustain the loss of a whole chromosome(Rutledge and Cimini, 2016). For still mysterious rea-sons, plants in general are more tolerant to aneuploidythan animals. For example, in Arabidopsis (Arabidopsisthaliana), selfed progeny of a triploid mother plantgenerates a swarm of diverse types of aneuploid plantsthat are viable and fertile (Henry et al., 2007; Huettelet al., 2008; Henry et al., 2010; Matsushita et al., 2012).Moreover, many plant species are polyploids, whichin theory have a much greater capacity to buffer thedosage imbalance of individual chromosome gain orloss and, therefore, are more permissive to the occur-rence of whole-chromosome aneuploidy than diploids,especially for chromosome loss.Notably, aneuploidy is frequently associated with
nascent polyploidization in plants (Xiong et al., 2011;Chester et al., 2012; Zhang et al., 2013b); however,whether these are ephemeral by-products of whole-genome duplication or represent an important con-tributing factor to polyploid genome evolution, especiallyat the onset stage of polyploid formation, remainsuninvestigated. However, the latter possibility is likely,given that, in contrast to nucleotide mutation, manytypes of aneuploidy can be readily reverted back toeuploidy following subsequent meiotic segregationyet might as well impart their impacts (heritable var-iation in gene expression) to the euploid progeny (Henryet al., 2010; Gao et al., 2016). Therefore, studyinganeuploidy in plants under a polyploid genomic envi-ronment not only allows assessing the effects of bothchromosome gain and loss to a greater dosage amplitudebut also may provide insights into the relevance of an-euploidy to polyploid genome evolution. There is anadded significance to this line of study, because whole-genome duplication is a pervasive driving force in theevolution of all higher plants (Doyle et al., 2008; Van dePeer et al., 2009; Jiao et al., 2011; Estep et al., 2014).Common wheat (Triticum aestivum; 2n = 6x = 42,
genome BBAADD) is a young allohexaploid species(approximately 8,500 years old) harboring three closelyrelated but distinct subgenomes with limited inter-subgenomic exchanges (Sears, 1944; Feldman et al.,
1995).Wheat stands as a textbook example of speciationvia allopolyploidization as well as one of the mostsuccessful staple food crops humans have ever do-mesticated (Feldman et al., 1995; Dubcovsky andDvorak, 2007). Probably due to its hexaploid natureand high level of functional redundancy (due tohomeology) among the three subgenomes, com-mon wheat can host a repertoire of diverse whole-chromosome aneuploidy. In fact, various types andoften a complete set (i.e. concerning all 21 chromo-somes) of aneuploid strains were developed success-fully in wheat decades ago (Sears, 1944). Being anestablished species and a remarkably productive crop,the three subgenomes (A, B, and D) of wheat are ap-parently coexisting and functioning in harmony, whichhas been suggested to be due, at least in part, to theextensive genomic changes that occurred immediatelyafter the allopolyploidization events (Feldman et al.,2012; Pont et al., 2013; El Baidouri et al., 2017), whichinclude the nearly ubiquitous occurrence of whole-chromosome aneuploidy (Zhang et al., 2013b). Tran-scriptome analysis indicated that the three subgenomesof wheat show a high degree of cell type- and stage-dependent subgenome expression dominance, sug-gesting specification, asymmetry, as well as interplayamong the three subgenomes at the transcriptionalgene regulation level (Pfeifer et al., 2014). In contrast,the fact that the BBAA component of wheat can beextracted out to form viable and fertile plants suggeststhe still genetic integrity and functional independenceof the subgenomes (Kerber, 1964; Zhang et al., 2014).However, the extent to which the three subgenomes ofwheat are concordantly or independently regulated atthe gene expression level within the common nucleus ofhexaploid wheat remains an unresolved issue.
In this study, a panel of diverse types of whole-chromosome aneuploidy, including variable doses ofwhole-chromosome gain, loss, or concomitant gain andloss of homeologous chromosomes, primarily of thehomeologous group 1 (i.e. chromosomes 1A, 1B, and1D) as representatives, was chosen to systemicallyinvestigate the dosage sensitivity, transcriptional re-sponses, and possible dosage compensation of whole-chromosome aneuploidy in hexaploidwheat. The choiceof the homeologous group 1 whole-chromosome an-euploidies as representative is primarily because theydo not possess known special properties with respect tothe impact of aneuploidization on genome-wide geneexpression in hexaploid wheat. All studied aneuploidstrains were in the common genetic background of thelaboratory standard genotype, cv Chinese Spring (CS),of wheat, originally developed by Sears (1944); hence,all are isogenic. In comparison with prior findings inhaploid or diploid aneuploid systems, we unravelnovel features of gene expression associated with thetwo major impacts of aneuploidy (i.e. cis- and trans-effects) as well as dosage compensation. Especially, wedocument the striking observation that homeologouschromosomes did not show differences from nonho-mologous chromosomes with respect to transcriptional
Plant Physiol. Vol. 175, 2017 829
Expression Dysregulation in Wheat Aneuploidy
www.plantphysiol.orgon May 1, 2019 - Published by Downloaded from Copyright © 2017 American Society of Plant Biologists. All rights reserved.

responses towhole-chromosome aneuploidy, irrespectiveof the aneuploid chromosome(s) being loss, gain, or si-multaneous loss/gain, or at different dosage gradients.This finding strongly suggests regulatory autonomy atthe transcriptional level of the three subgenomes inhexaploid wheat, which may shed new light on our un-derstanding of the gene regulatory orchestration of thethree constituent subgenomes of hexaploid wheat andwhich also may bear implications in allopolyploid cropamelioration via genetic editing or targeted (sub)genomicselection.
RESULTS
Karyotype Verification for All Aneuploid Strains and TheirCommon Isogenic Euploid Wild Type of HexaploidCommon Wheat
Aneuploid chromosomes, being numerically unbal-anced, are intrinsically unstable during meiotic trans-mission. Moreover, the aneuploid condition per se maypromote chromosome missegregation of the normalchromosomes in meiosis and/or mitosis, producinglagging chromosomes, and, hence, induce additionaland ongoing numerical and structural chromosomechanges, a process collectively termed chromosomeinstability (Sheltzer and Amon, 2011). Thus, to ensurethe accuracy of the analyzed plants, we first set out toverify the karyotypes of all the used aneuploid strainsof hexaploid common wheat CS and their isogenicwild-type euploid by a sequential genomic in situ hy-bridization (GISH)/fluorescence in situ hybridization(FISH) karyotyping method (Zhang et al., 2013b). Thismethod enables reliable identification of all 21 homolo-gous chromosome pairs in hexaploid wheat (Zhanget al., 2013b; Fig. 1; Supplemental Fig. S1). Therefore,this analysis not only ensures correct karyotypes of theaneuploid strains to be analyzed but also safeguardsthe exclusion of any additional karyotypic variationsdue to chromosome instability, which would confoundthe results. Karyotypes of all individual plants consti-tuting each of the 10 distinct whole-chromosome an-euploid strains in the common genetic background ofCSarevalidated (Fig. 1; Supplemental Fig. S1; SupplementalTable S1), which were found to contain no additional nu-merical and structural chromosome aberrations either atthe whole-plant or cell level (somatic mosaic aneu-ploidy). The bona fide euploid karyotype for each usedindividual of the euploid wild type (CS) also wasverified (Fig. 1).
All the Studied Diverse Types of Whole-ChromosomeAneuploidy in Hexaploid Wheat Induce DysregulatedGene Expression via cis- and trans-Effects
We assessed the impact of the diverse types of whole-chromosome aneuploidy, all under the same hexa-ploid common wheat (CS) genomic environment,on genome-wide gene expression with respect to both
genes residing on the numerically altered chromosomes(i.e. cis-effect) and those on the unvaried chromosomes(i.e. trans-effect) in a given aneuploid strain. We con-ducted deep mRNA sequencing (RNA-seq)-based tran-scriptome profiling for the second fully expanded leaftissue of third-leaf-stage seedlings (Simmons et al.,1985) of each of the 10 aneuploid strains (Fig. 1;Supplemental Table S1) along with their common iso-genic euploid strain (CS), with biological replicates (see“Materials and Methods”). We first conducted an as-sessment for possible differences in transcriptome sizebetween an aneuploid strain and CS or among the an-euploid strains by the method reported (Coate andDoyle, 2010; Matos et al., 2015). We found that there areno statistically significant differences in transcriptomesizes in all pairwise comparisons involving seven ana-lyzed aneuploid strains and CS (data not shown butavailable upon request). We calculated the FPKM(fragments per kilobase of gene per million mappedreads) values to quantify normalized chromosome- andgenome-scale gene expression changes (i.e. dysre-gulated expression) due to the various types ofwhole-chromosome aneuploidy. Through pairwisecomparisons of each aneuploid strain versus the com-mon isogenic euploid CS, we obtained the followingmajor observations.
First, the four types of aneuploidy involving the samechromosome 1A (i.e. nullisomic 1A [designated N1A,referring to missing a pair of chromosomes 1A], mon-osomic 1A [designated M1A, referring to loss of onechromosome 1A], trisomic 1A [designated Tri1A, re-ferring to gaining one extra chromosome 1A], and tet-rasomic 1A [designated T1A, referring to gaining a pairof chromosomes 1A]) all caused dysregulated expres-sion via both cis- and trans-effects relative to their iso-genic euploid (CS), but to substantially variablemagnitudes (Fig. 2A). Specifically, comparedwith CS, N1Aexhibited the largest trans-effect (cis-effect is not ap-plicable for this strain due to the complete absence ofchromosome 1A), with the expression of 4,603 genes(9.42% of all expressed genes) being altered signifi-cantly (x2 test, all q , 8.41E-177; Fig. 2A; SupplementalTable S2). M1A showed the second largest effect, withthe expression of 2,262 genes (4.5%) being affected, ofwhich 730 and 1,532 were due to cis- and trans-effects,respectively (Fig. 2A; Supplemental Table S2). T1Ashowed a similar effect to M1A, with the expression of2,221 genes (4.4%) being affected, of which 666 and1,555 were due to cis- and trans-effects, respectively (x2
test, q = 0.525; Fig. 2A; Supplemental Table S2). Tri1Ashowed the smallest effect, with the expression of only726 genes (1.47%) being affected, of which 225 and501 were due to cis- and trans-effects, respectively (x2
test, all q, 1.08E-161; Fig. 2A; Supplemental Table S2).Together, the most dramatic or unanticipated resultsfrom the above comparisons are as follows: (1) missingthe whole pair of chromosomes 1A (N1A) has thelargest effect, which makes all other studied aneu-ploidies pale in this respect; (2) gain of one extra chro-mosome 1A (Tri1A) has a much smaller effect (actually
830 Plant Physiol. Vol. 175, 2017
Zhang et al.
www.plantphysiol.orgon May 1, 2019 - Published by Downloaded from Copyright © 2017 American Society of Plant Biologists. All rights reserved.

the smallest effect; detailed in later sections) than gainof a pair of extra chromosomes 1A (T1A); and (3) lossexerts a much greater trans-effect than gain of the samedose for the same chromosome (1A). We should cau-tion, however, that these characteristics might bearchromosome specificity and, therefore, may not com-pletely hold true for all the wheat chromosomes.
Second, the same type of aneuploidy (i.e. monoso-mic) of the three chromosomes belonging to a givenhomeologous group (group 1) exhibited similar butalso dramatically different cis- and/or trans-effects ontranscript abundance (Fig. 2A). Specifically, M1A,M1B,and M1D exhibited similar cis-effects (x2 test, all q .0.098; Fig. 2A; Supplemental Table S3) but different
Figure 1. Diagrammatic illustration of all 10 karyotypes of whole-chromosome aneuploid strains in hexaploid wheat used in thisstudy. Based on sequential GISH and FISH, all 21 homologous chromosome pairs in hexaploid wheat can be reliably discrim-inated (Zhang et al., 2013b). The center image depicts the FISH and GISH profiles of the euploid wild-type hexaploid wheat (CS),illustrating the karyotyping method (bar = 10 mm). A to J are diagrams for the 10 aneuploid strains, which include monosomic 1A(A), monosomic 1B (B), monosomic 1D (C), trisomic 1A (D), tetrasomic 1A (E), monosomic 2A (F), trisomic 2A (G), nullisomic 1A(H), nullisomic 1A/trisomic 1B (I), and nullisomic 1A/tetrasomic 1B (J). The aneuploid chromosome(s) in each aneuploid strain isunderlined. In GISH, genomicDNAs of Triticumuratu (AA) andAegilops tauschii (DD) were used as probes, while genomicDNAof Aegilops speltoides (SS) was used as a blocker. In FISH, two repetitive DNA sequences, pSc119.2 (green) and pAS1 (red), wereused as probes. Original images of all 10 aneuploid karyotypes are shown in Supplemental Figure S1.
Plant Physiol. Vol. 175, 2017 831
Expression Dysregulation in Wheat Aneuploidy
www.plantphysiol.orgon May 1, 2019 - Published by Downloaded from Copyright © 2017 American Society of Plant Biologists. All rights reserved.

trans-effects, with the three chromosomes falling into theorderM1A.M1B.M1D in strengthwith respect to thenumbers of dysregulated genes located on the unvar-ied chromosomes they induce via trans-regulation(x2 test, all q , 0.008; Fig. 2A; Supplemental TableS3); this suggests that, although highly similar andsyntenic among the three homeologous group 1 chro-mosomes, they have markedly variable trans-regulatoryeffects.
Third, although the two aneuploid strains concerningchromosome 2A (i.e. monosomic 2A [designated M2A,referring to loss of one chromosome 2A] and trisomic2A [designated Tri2A, referring to gain of one extrachromosome 2A]) showed similar trends to M1A ver-sus Tri1A (described above) in the sense that loss ofa chromosome imposes a greater impact on geneexpression than gain of the same chromosome (x2 test,q = 0.016; Fig. 2A; Supplemental Table S4), themagnitude
Figure 2. Impact of whole-chromosome aneuploidy on global gene expression in hexaploid wheat. A, Numbers of dysregulatedgenes in each of the aneuploid strains relative to their common euploid wild type (CS). Based on chromosomal location, thedysregulated genes in each aneuploid strain can be classified into a cis-effect group (mapped to the aneuploid chromosomes) anda trans-effect group (mapped to the unvaried chromosomes), and these are represented by black and gray bars, respectively. B,Hierarchical analysis of dysregulated genes from the aneuploid strains and their common euploid CS, based on the expressionpattern of genes (12,565 in total) that showed dysregulated expression in at least one of the aneuploid strains. The height shows thecorrelation distance among the strains. Green and red numbers are significances determined via normal bootstrapping (bootstrapprobability [bp]) and multiscale bootstrapping resampling (approximated unbiased P value [au]), respectively. C, Heat mapvisualizing the hierarchical clustering of gene expression levels in each strain. The color key is indicated at the bottom.
832 Plant Physiol. Vol. 175, 2017
Zhang et al.
www.plantphysiol.orgon May 1, 2019 - Published by Downloaded from Copyright © 2017 American Society of Plant Biologists. All rights reserved.

of difference between M2A and Tri2A with respect to thenumbers of dysregulated genes (2,025 versus 1,738) wasmuch smaller than that between M1A and Tri1A (2,262versus 765; x2 test, P = 2.60E-165; Fig. 2A), suggestingchromosome-specific effects.Fourth, the two phenotypically compensated aneu-
ploid strains (i.e. nullisomic 1A/trisomic 1B [designatedN1ATri1B, referring to missing both chromosomes1A and gaining a single chromosome 1B] and nulliso-mic 1A/tetrasomic 1B [designated N1AT1B, referringto missing both chromosomes 1A and gaining a pair ofchromosomes 1B]) caused dysregulated expression of1,730 genes (3.64%) and 2,136 genes (4.46%) relative toCS, respectively (Fig. 2A). Of the dysregulated genes,both those due to cis- and trans-effects are significantlydifferent between the two strains (x2 test, all q, 4.23E-17;Fig. 2A; Supplemental Table S5). However, the differencein the numbers of dysregulated genes between thetwo strains due to the trans-effect (N1ATri1B versusN1AT1B = 1,325:1,039) is much smaller than that due tothe cis-effect (N1ATri1B versus N1AT1B = 405:1,097;x2 test, P = 4.68E-70; Fig. 2A). This suggests that theextra 1B chromosome(s) added to the otherwise 1Anullisomy produced dual effects on dysregulated geneexpression: on the one hand, it significantly attenuatedthe strong trans-effect caused by 1A nullisomy (Fig. 2A;Supplemental Fig. S2); on the other hand, it causeddysregulation of additional genes, primarily via a cis-effect, which scales with dosage (Fig. 2A). Taken to-gether, these results suggest that (1) the cis-effect islargely chromosome dosage dependent irrespective ofgenomic environments harboring variable contents ofhomeologous chromosomes; and (2) to an extent, theeffect of missing a pair of homologous chromosomes ondysregulated expression due to a trans-effect can beattenuated (manifested as a reduced number of dysre-gulated genes) by gaining one or a pair of its homeol-ogous chromosome(s), which, however, appeared to belargely dosage insensitive. Again, we should cautionthat these characteristics may show chromosome orhomeologous group specificity.The differential impacts of the various types of an-
euploidy on gene expression also were reflected by ahierarchical analysis of similarity in terms of overallexpression patterns as well as their expression diver-gence from the common euploid CS (Fig. 2, B and C).The results showed that N1A is most divergent inoverall expression patterns from the rest of the strains(Fig. 2, B and C). Most strikingly, the two compensatedaneuploid strains, N1ATri1B and N1AT1B, are sister toN1A, and together, they formed a subcluster that isdistantly related to the euploid CS and the other an-euploid strains (Fig. 2, B and C). This is unexpected,given that, based on phenotypic classification, thesetwo strains are largely reverted to that of CS (Sears,1944). However, this unexpected hierarchical pattern isconsistent with the dual effects of adding one or a pairof homeologous chromosomes (1B) to the otherwisenullisomic strain (N1A), described above. Another un-expected result is that different types of aneuploid
strains involving homeologous chromosomes (Tri1Aand M1D) or even nonhomologous chromosomes(M1D and Tri2A) can be clustered together (Fig. 2B).This suggests that the effects of aneuploidy on dysre-gulated gene expression can be due primarily to theimbalanced chromosome content per se rather than to agene-specific dosage effect. Similarfindingswere reportedrecently in a study in human pluripotent stem cells, whichshowed that chromosomally disparate aneuploidiesgenerated highly similar global expression profiles thatall contribute to a common phenotype, tumorigenicity(Ben-David et al., 2014).
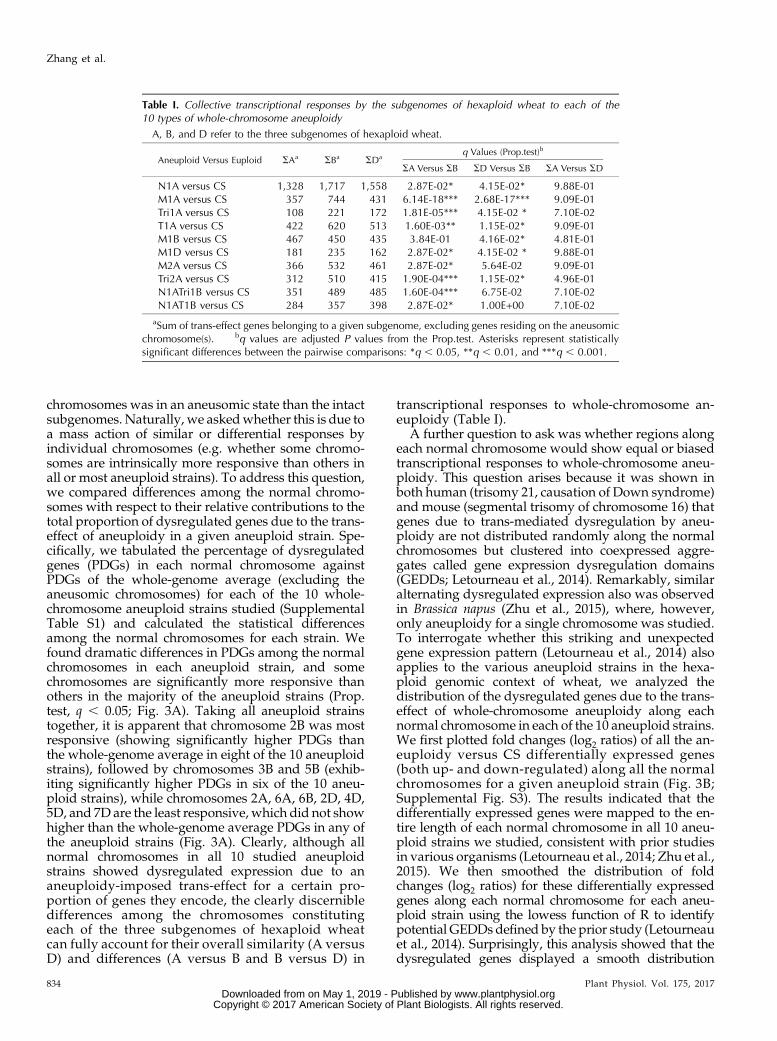
With respect to the trans-effect, we further interro-gated whether the expression of the three subgenomes,each as a whole, is similarly or differently impacted bythe various types of whole-chromosome aneuploidy,and in particular, whether a given subgenome is moreprone to transcriptional perturbation if one of its ownchromosomes is in an aneusomic state than the intactsubgenomes (harboring no aneuploid chromosome).We thus compared the pairwise differences betweeneach two subgenomes for the total numbers of genesthat showed dysregulated expression due to the trans-effect in a given aneuploid strain versus CS. The resultsshowed that (1) in nine of the 10 aneuploid strains(except for M1B), subgenome B showed significantlymore genes (Prop.test, all q , 0.029) manifesting trans-mediated dysregulation relative to CS than subgenomeA (Table I); (2) in seven of the 10 aneuploid strains(except M2A, N1ATri1B, and N1AT1B), subgenome Bshowed significantly more genes (Prop.test, all q ,0.012) manifesting trans-mediated dysregulation rela-tive to CS than subgenome D (Table I); and (3) in noneof the10 aneuploid strains, subgenomes A and Dshowed a significant difference (Prop.test, all q. 0.071)with regard to the number of genes manifesting trans-mediated dysregulation relative to CS (Table I). Col-lectively, these results suggest that, with respect to thetranscriptional response, of the three constituent sub-genomes of hexaploid wheat, subgenome B is moresensitive to most types of the whole-chromosome an-euploidy we studied here than subgenomes A and D,while subgenomes A and D have similar degrees ofresponse in all 10 aneuploid types studied. By exten-sion, these results indicate that a given subgenome as awhole is not more prone to transcriptional perturbationwhen one of its own chromosomeswas in an aneusomicstate under the hexaploid wheat genomic environment.
Transcriptional Responses of the Normal Chromosomes toAneuploidy Are Unequal, although There Is aChromosome-Wide Even Distribution ofDysregulated Genes
The aforementioned results suggest that the threesubgenomes of hexaploid wheat, when considered as awhole, are unequal in transcriptional responses towhole-chromosome aneuploidy, yet a given sub-genome is not more responsive when one of its own
Plant Physiol. Vol. 175, 2017 833
Expression Dysregulation in Wheat Aneuploidy
www.plantphysiol.orgon May 1, 2019 - Published by Downloaded from Copyright © 2017 American Society of Plant Biologists. All rights reserved.
chromosomes was in an aneusomic state than the intactsubgenomes. Naturally, we askedwhether this is due toa mass action of similar or differential responses byindividual chromosomes (e.g. whether some chromo-somes are intrinsically more responsive than others inall or most aneuploid strains). To address this question,we compared differences among the normal chromo-somes with respect to their relative contributions to thetotal proportion of dysregulated genes due to the trans-effect of aneuploidy in a given aneuploid strain. Spe-cifically, we tabulated the percentage of dysregulatedgenes (PDGs) in each normal chromosome againstPDGs of the whole-genome average (excluding theaneusomic chromosomes) for each of the 10 whole-chromosome aneuploid strains studied (SupplementalTable S1) and calculated the statistical differencesamong the normal chromosomes for each strain. Wefound dramatic differences in PDGs among the normalchromosomes in each aneuploid strain, and somechromosomes are significantly more responsive thanothers in the majority of the aneuploid strains (Prop.test, q , 0.05; Fig. 3A). Taking all aneuploid strainstogether, it is apparent that chromosome 2B was mostresponsive (showing significantly higher PDGs thanthe whole-genome average in eight of the 10 aneuploidstrains), followed by chromosomes 3B and 5B (exhib-iting significantly higher PDGs in six of the 10 aneu-ploid strains), while chromosomes 2A, 6A, 6B, 2D, 4D,5D, and 7D are the least responsive, which did not showhigher than the whole-genome average PDGs in any ofthe aneuploid strains (Fig. 3A). Clearly, although allnormal chromosomes in all 10 studied aneuploidstrains showed dysregulated expression due to ananeuploidy-imposed trans-effect for a certain pro-portion of genes they encode, the clearly discernibledifferences among the chromosomes constitutingeach of the three subgenomes of hexaploid wheatcan fully account for their overall similarity (A versusD) and differences (A versus B and B versus D) in
transcriptional responses to whole-chromosome an-euploidy (Table I).
A further question to ask was whether regions alongeach normal chromosome would show equal or biasedtranscriptional responses to whole-chromosome aneu-ploidy. This question arises because it was shown inboth human (trisomy 21, causation of Down syndrome)and mouse (segmental trisomy of chromosome 16) thatgenes due to trans-mediated dysregulation by aneu-ploidy are not distributed randomly along the normalchromosomes but clustered into coexpressed aggre-gates called gene expression dysregulation domains(GEDDs; Letourneau et al., 2014). Remarkably, similaralternating dysregulated expression also was observedin Brassica napus (Zhu et al., 2015), where, however,only aneuploidy for a single chromosome was studied.To interrogate whether this striking and unexpectedgene expression pattern (Letourneau et al., 2014) alsoapplies to the various aneuploid strains in the hexa-ploid genomic context of wheat, we analyzed thedistribution of the dysregulated genes due to the trans-effect of whole-chromosome aneuploidy along eachnormal chromosome in each of the 10 aneuploid strains.We first plotted fold changes (log2 ratios) of all the an-euploidy versus CS differentially expressed genes(both up- and down-regulated) along all the normalchromosomes for a given aneuploid strain (Fig. 3B;Supplemental Fig. S3). The results indicated that thedifferentially expressed genes were mapped to the en-tire length of each normal chromosome in all 10 aneu-ploid strains we studied, consistent with prior studiesin various organisms (Letourneau et al., 2014; Zhu et al.,2015). We then smoothed the distribution of foldchanges (log2 ratios) for these differentially expressedgenes along each normal chromosome for each aneu-ploid strain using the lowess function of R to identifypotential GEDDs defined by the prior study (Letourneauet al., 2014). Surprisingly, this analysis showed that thedysregulated genes displayed a smooth distribution
Table I. Collective transcriptional responses by the subgenomes of hexaploid wheat to each of the10 types of whole-chromosome aneuploidy
A, B, and D refer to the three subgenomes of hexaploid wheat.
Aneuploid Versus Euploid SAa SBa SDaq Values (Prop.test)b
SA Versus SB SD Versus SB SA Versus SD
N1A versus CS 1,328 1,717 1,558 2.87E-02* 4.15E-02* 9.88E-01M1A versus CS 357 744 431 6.14E-18*** 2.68E-17*** 9.09E-01Tri1A versus CS 108 221 172 1.81E-05*** 4.15E-02 * 7.10E-02T1A versus CS 422 620 513 1.60E-03** 1.15E-02* 9.09E-01M1B versus CS 467 450 435 3.84E-01 4.16E-02* 4.81E-01M1D versus CS 181 235 162 2.87E-02* 4.15E-02 * 9.88E-01M2A versus CS 366 532 461 2.87E-02* 5.64E-02 9.09E-01Tri2A versus CS 312 510 415 1.90E-04*** 1.15E-02* 4.96E-01N1ATri1B versus CS 351 489 485 1.60E-04*** 6.75E-02 7.10E-02N1AT1B versus CS 284 357 398 2.87E-02* 1.00E+00 7.10E-02
aSum of trans-effect genes belonging to a given subgenome, excluding genes residing on the aneusomicchromosome(s). bq values are adjusted P values from the Prop.test. Asterisks represent statisticallysignificant differences between the pairwise comparisons: *q , 0.05, **q , 0.01, and ***q , 0.001.
834 Plant Physiol. Vol. 175, 2017
Zhang et al.
www.plantphysiol.orgon May 1, 2019 - Published by Downloaded from Copyright © 2017 American Society of Plant Biologists. All rights reserved.

across the entire length of all the normal chromosomes ineach of the 10 studied aneuploid strains of hexaploidwheat (Fig. 3C; Supplemental Fig. S4), indicating theabsence of GEDDs in all the studied aneuploid strains ofhexaploid wheat. To further verify this unexpectedfinding, we compared the percentages of dysregulatedgenes versus total expressed genes within each 1-Mbslidingwindowalong each normal chromosome for eachof the 10 aneuploid strains and calculated the statisticaldifference for each window using binomial distribution.We found that only two chromosomal regions (i.e. aterminal region of the long arm of chromosome 2B and aproximal-terminal region of the long arm of chromo-some 7A; Supplemental Table S6) showed significantlyhigher proportions of dysregulated expression than thewhole-genome average (q, 0.05), suggesting a lack of aregional hotspot of dysregulated gene expression due tothe trans-effect of whole-chromosome aneuploidy inhexaploid wheat. Together, our results indicate that, incontrast to the findings in human, mouse (Letourneauet al., 2014), and probablyB. napus (Zhu et al., 2015), genesshowing transcriptional responses to whole-chromosome
aneuploidy in hexaploid wheat are not aggregated toGEDDs.
Widespread Dosage Compensation Likely Exists inHexaploid Wheat
Aneuploidy not only produces dosage effects (cis-effects) and its attendant downstream genome-widetranscriptional responses (trans-effects) but also canelicit dosage compensation for genes residing on theaneuploid chromosome(s), whereby the wild-type eu-ploid gene expression level is robustly maintainedirrespective of copy number changes. Although dosagecompensation is known to widely exist in animal sexchromosomes and autosomes of some species, such asDrosophila spp. (Sun et al., 2013a, 2013b), the occurrenceof dosage compensation in autosomes of other orga-nisms (e.g. yeast), as well as the extents of the phe-nomenon in different organisms, remain contentious(Torres et al., 2016). Previous studies in plants indicatedthat, whereas dosage compensation is prominent in
Figure 3. Transcriptional responses to whole-chromosome aneuploidy by the different aneuploids. A, Heat map showing theq values (adjusted by false discovery rate [FDR]) of Prop.test between dysregulated genes in each normal chromosome againstdysregulated genes of the whole-genome average (excluding the aneuploid chromosomes) for each aneuploid strain. The white,gray, and dark blue rectangles in each aneuploid strain denote the aneuploid chromosome(s), normal chromosomes on which thenumber of dysregulated genes did not transgress the whole-genome average, and normal chromosomes on which the number ofdysregulated genes transgressed the whole-genome average, respectively. B, Distribution of genes showing dysregulated ex-pression along each normal chromosome due to the transcriptional response in N1A. The red and blue dots represent up- anddown-regulated genes, respectively. Results for the rest of the aneuploid strains are given in Supplemental Figure S3. C, Log2(foldchange) of gene expression between N1A and CS along chromosomes 1B and 1D, depicted in gray. Red lines denote thesmoothed distribution for the differentially expressed genes along the 1B and 1D chromosomes, as representatives, in N1A usingthe lowess function of R. The y axis represents the log2(fold change) of FPKM between N1A and its isogenic euploid (CS). Thex axis represents the sorted positions of genes along the 1B and 1D chromosomes. Results of this analysis for all the normalchromosomes in each of the aneuploid strains are given in Supplemental Figure S4.
Plant Physiol. Vol. 175, 2017 835
Expression Dysregulation in Wheat Aneuploidy
www.plantphysiol.orgon May 1, 2019 - Published by Downloaded from Copyright © 2017 American Society of Plant Biologists. All rights reserved.

maize (Zea mays; Birchler, 1979; Guo et al., 1996), it oc-curred only moderately in Arabidopsis (Henry et al.,2007; Huettel et al., 2008). Our observation indicatedthat less than 30% of the expressed genes residing on agiven aneuploid chromosome in all 10 studied whole-chromosome aneuploid strains showed altered ex-pression due to a dosage effect (Supplemental TableS7). This striking robustness in gene expression tochromosome-wide dosage alteration strongly indicatesthe presence of dosage compensation in all chromo-somes of hexaploid wheat. To test this possibility, wetook advantage of two sets of aneuploid strains eachwith grading dosages of one particular chromosome inthe common euploid background of CS (SupplementalTable S1). We performed stringent statistical filtrationsfor genes that (1) were encoded exclusively by the nu-merically altered chromosome (the aneuploid chromo-some) and (2) showed highly constant expression levelsin all the relevant strains with a dosage gradient forthe pertinent chromosome. Specifically, the aneuploid
strains used for this analysis includedM1A (one copy of1A), euploid CS (two copies of 1A), Tri1A (three copiesof 1A), T1A (four copies of 1A), M2A (one copy of 2A),euploid CS (two copies of 2A), and Tri2A (three copiesof 2A). Based on the highly stringent filtering (detailedin “Materials and Methods”), we identified 254 and378 genes exhibiting clear dosage compensation inchromosomes 1A and 2A, respectively, which accoun-ted for 12% to 14% of all the expressed genes (aneuploidversus euploid CS) located on the respective aneuploidchromosomes (Fig. 4A; Supplemental Fig. S6A). Wefurther assessed the distribution of these genes on theaneuploid chromosomes against the theoretical distri-bution (Torres et al., 2016). We observed a left-skeweddistribution in both Tri1A and T1A (expected value .median.mean, skewness =20.45 and 20.25; Fig. 4C;Supplemental Fig. S5) and a right-skewed distributionin M1A (expected value,median,mean, skewness =0.31) in otherwise typical normal distributions (Fig. 4B).Similar situations were observed for chromosomes
Figure 4. Dosage compensation for genes located on numerically altered chromosome 1A. A, Box plot showing the distributionof FPKM values for genes along chromosome 1A, with scaled dosage of the chromosome from 1 to 4. The red dashed linerepresents the expected dosage effect of chromosome 1A if no dosage compensation occurs, while the green dashed line showsthe observed median of gene expression in the euploid (CS). B, Frequency distribution of log2(fold change) in M1A (relative to theeuploid CS). Log2(fold change) of 0.1 is the bin size in the histogram. The gray line represents the expected value if no dosagecompensation occurs, while the blue and red lines are the observed median and mean of distribution, respectively. C, Frequencydistribution of log2(fold change) in Tri1A (relative to the euploid CS). Denotations for the gray, blue, and red lines are as for B. Thevalues of mean, median, and skewness are shown.
836 Plant Physiol. Vol. 175, 2017
Zhang et al.
www.plantphysiol.orgon May 1, 2019 - Published by Downloaded from Copyright © 2017 American Society of Plant Biologists. All rights reserved.

M2A and Tri2A (Supplemental Fig. S6, B and C). Fur-thermore, we quantified the relative distribution fre-quencies of fold changes in expression in each of thesefive aneuploid strains concerning chromosome 1A or2A versus CS. We found that genes showing a dosageeffect and genes showing dosage compensation man-ifested distinct distributions with little overlapping(Supplemental Fig. S7). Altogether, our data clearlyshow the existence of widespread dosage compensa-tion in hexaploid wheat.
Genes Showing Dosage Effects, Dosage Compensation,and Transcriptional Responses Are Enriched for DistinctFunctional Categories
The foregoing results indicated that three broad typesof dysregulated expression are associated with whole-chromosome aneuploidy in hexaploid wheat: dosageeffects (dysregulated genes mapped to the aneuploidchromosomes due to a dosage-mediated cis-effect),dosage compensation (robust euploid-level expressionof genes mapped to the aneuploid chromosomes irre-spective of dosage alteration), and transcriptional re-sponses (dysregulated genes residing on the unvariedchromosomes of a given aneuploid strain due to atrans-acting effect). It is of apparent interest to inquirewhether these different gene groups under distinctregulatory mechanisms would bear different biologicalconsequences. To test this, we performed a Gene On-tology (GO) analysis for each of the gene groups iden-tified in the diverse whole-chromosome aneuploidstrains of hexaploid wheat. First, we analyzed thetwo distinct sets of genes mapped to the aneuploidchromosome(s) of the relevant aneuploid strains(Supplemental Table S1), which showed either a dosageeffect or dosage compensation in a given aneuploidstrain. We found that genes showing a dosage effectwere significantly enriched for annotated GO termsinvolved in signal transduction, response to stress, andthose associated with the nucleus, while genes showingdosage compensation were overrepresented by GOterms associated with cell wall macromolecule metab-olism, peptidoglycan biosynthesis, and ribosome (Fig.5A; all q , 0.014, based on hypergeometric distribu-tion). It is thus clear that genes showing dosage effectsor dosage compensation in the whole-chromosomeaneuploid strains of hexaploid wheat were enrichedfor distinct annotated GO terms, with the former in-volved mainly in signal transduction and response tostress while the latter were involved mainly in growthand cellular metabolism.Next, we conducted GO analysis for genes residing
on normal chromosomes in each of the 10 aneuploidstrains separately that showed transcriptional re-sponses. Depending on the directionality of responses(i.e. positive versus negative) to the varied aneuploidchromosome dosage, genes showing transcriptionalresponses can be divided further into direct trans-effectand inverse trans-effect, respectively (Birchler, 1981,
2012; Guo and Birchler, 1994). We found that (1) genesmanifesting a direct trans-effect in most of the 10aneuploid strains were overrepresented by GO termsinvolved in responses to oxidation and stimulus, car-bohydrate metabolism, and cell wall biogenesis [Fig.5B; log10(q) . 1.3]; (2) genes manifesting an inversetrans-effect in most aneuploid strains showed enrichedGO terms involved in photosynthesis, transcription,regulation of RNA metabolism, and protein metabo-lism [Fig. 5B; log10(q) . 1.3]; and (3) genes manifestingan inverse trans-effect in the two aneuploid strains withloss of one or both chromosomes 1A (M1A and N1A)were enriched for GO terms involved in ribosome bio-genesis [Fig. 5B; log10(q). 1.3]. In addition, an analysisof GO terms in the molecular function category alsoidentified distinctly enriched functional gene groups.For example, transporter activity and oxidoreductaseactivity were significantly overrepresented by genesmanifesting a direct trans-effect in most or all 10 aneu-ploid strains, while functional gene groups related totranscription regulator activity, transcription factor ac-tivity, and DNA binding were significantly enriched bygenes manifesting an inverse trans-effect in some an-euploid strains [Supplemental Fig. S8; log10(q) . 1.3].Taken together, these results indicated that genesshowing transcriptional responses are involved in di-verse functional gene groups and cellular pathways, asexpected given that all normal chromosomes of a givenaneuploid strain are affected (Fig. 2; Table I). Never-theless, genes with contrasting directionality of re-sponses (direct versus inverse) to dose alteration of anunrelated chromosome(s) are signified by distinctfunctional GO terms.
Homeologous Genes in Hexaploid WheatAre Rarely Coregulated in Response toWhole-Chromosome Aneuploidy
The foregoing analyses are all based on the totalexpressed genes. Given the allohexaploid nature ofcommon wheat, an interesting issue concerning thetranscriptional responses to aneuploidy is how the ex-pression of those genes that are encoded by the home-ologous chromosomes of a given chromosome group,which are homeologous and syntenic with the numer-ically altered chromosome, would respond. To addressthis issue, we first focused on a set of chromosomegroup 1 homeolog-specific genes in hexaploid wheatthat had exactly one copy in chromosomes 1A, 1B, and1D and that were defined as triplet genes (Pfeifer et al.,2014). This set of triplet genes can be reliably distin-guished by diagnostic single-nucleotide polymor-phisms based on the wheat (CS) reference genomesequence (Pfeifer et al., 2014). We compared the ex-pression levels (log2 ratio) for each member within agiven triplet gene between each of the three homeolo-gous group 1 monosomics (M1A, M1B, and M1D)versus their common isogenic euploid CS and identi-fied the differentially expressed triplets in each of the
Plant Physiol. Vol. 175, 2017 837
Expression Dysregulation in Wheat Aneuploidy
www.plantphysiol.orgon May 1, 2019 - Published by Downloaded from Copyright © 2017 American Society of Plant Biologists. All rights reserved.

comparisons. The results showed that, in M1A, theexpression levels of chromosome 1A homeologs for thisset of triplets exhibited a large reduction relative tothose of CS (Z statistic = 22.6288, P = 0.00428; detailedin “Materials and Methods”), while the 1B homeologs(Z statistic =20.1952, P = 0.4226) and 1D homeologs (Zstatistic =20.3267, P = 0.3719) did not show discerniblechanges in expression relative to their counterparts inCS (Fig. 6A). We also quantified contributions by thethree homeologs to each of the differentially expressedtriplets betweenM1A andCS by anUpSet plot (Fig. 6B),whereby their respective contributions to each of thesedifferentially expressed triplets can be classified intonine patterns. The most prominent pattern is directdown-regulation of chromosome 1A homeologs (due tothe cis-effect), which included 402 triplets (91.4% of thetotal 438), with the remaining 36 triplets showing trans-effect-mediated coordinated changes between twohomeologs or among all three homeologs (Fig. 6B). Weobserved the same trend in M1B andM1D (Fig. 6, C–F).
In the two phenotypically compensated aneuploidstrains (N1ATri1B and N1AT1B), we also observed lit-tle evidence of interactions between subgenomes B andD, with the major changes in both strains being con-fined to direct up-regulation of the 1B homeologs due tothe cis-effect that scales with the 1B chromosome dos-age (Supplemental Fig. S9). Next, we conducted an in-dependent hierarchical clustering analysis for this set ofhomeologous group 1 triplet genes in the three home-ologous group 1 monosomics (M1A, M1B, and M1D)and their common isogenic euploid CS. We found thatthe expression patterns of this set of triplet genes wereseparated by subgenomes rather than by genotypes(Supplemental Fig. S10). Taken together, it can beconcluded that, albeit highly similar and syntenic, thehomeologous chromosomes of hexaploidwheat did notshow a compensating effect by up-regulating the ex-pression of the homeologous genes when the homolo-gous chromosome pair of one subgenome was missing.In other words, homeologous chromosomes were not
Figure 5. Distinct GO enrichments forgenes mapped to aneuploid chromosomes,which showed dosage compensation ordosage effects, and for genes mapped to theunvaried chromosomes, which showedtranscriptional responses. A, Significantlyoverrepresented GO terms by genes map-ping to chromosome 1A or 2A, whichshowed either dosage effects or dosagecompensation in the relevant aneuploidstrains, with graded dosage alterations from1 to 4 and 1 to 3 for chromosomes 1A and2A, respectively. B, The q values of enrichedGO categories for genes showing direct orinverse trans-effects in all 10 aneuploidstrains. The x axis represents the log10(q).The dashed line represents the cutoff qvalue of 0.05 [log10(0.05) = 1.3].
838 Plant Physiol. Vol. 175, 2017
Zhang et al.
www.plantphysiol.orgon May 1, 2019 - Published by Downloaded from Copyright © 2017 American Society of Plant Biologists. All rights reserved.

more responsive than nonhomologous chromosomesregarding transcriptional responses towhole-chromosomeaneuploidy in hexaploid wheat.Given the unexpected nature of this observation,
we conducted an independent analysis of all 10 an-euploid strains using locus-specific cDNA pyrose-quencing for a subset of nine homeologous group1 triple genes that showed differential expression thatwas in line with chromosome dosage as well as metthe stringent criteria for designing the pyrosequenc-ing primers (Zhang et al., 2013a). We compared thedata with those from the corresponding RNA-seqreads and found that, in all nine studied tripletgenes, the two sets of data were fully concordant(Supplemental Fig. S11, A–I), thus validating the reli-ability of our RNA-seq data and analysis. Specifically,
the pyrosequencing data revealed that the expressionchange by a member of a given triplet is highly pro-portionate to the dosage of the chromosome(s) inquestion, with no evidence for coordinated expres-sion changes by its homeologs (Supplemental Fig.S11, A–I). In addition, we also included three home-ologous group 2 triplet genes for the pyrosequencinganalysis. We observed similar results to those of thegroup 1 triplet genes, in that the RNA-seq data canbe fully validated by this independent analysis(Supplemental Fig. S11, J–L). Once again, we shouldcaution that, although two homeologous chromo-some groups (1 and 2) were studied here, the possi-bility remains that the unvaried chromosome groupsmay not show exactly the same trend, which requiresfurther investigations.
Figure 6. Expression of homeologous members in a set of chromosome group 1-specific triplet genes in the same type of whole-chromosome aneuploidy (monosomics of 1A, 1B, and 1D) of hexaploid wheat. A, C, and E, Distributions of differentiallyexpressed triplets [log2(fold change)] relative to euploid CS inM1A (A), M1B (C), andM1D (E). The values of the Z statistic and thecorresponding P values are shown at the bottom of each graph. P values labeledwith asterisks refer to significant difference at P,0.01 (**) and P , 0.001 (***). B, D, and F, UpSet plots showing the detected expression patterns among the triplet members inM1A (B), M1B (D), andM1D (F). The black dots at the bottom of the vertical bars indicate the expressed triplet members, with thetotal triplet gene numbers of each pattern shown at the top of the vertical bars. Horizontal bars on the left denote the directions ofthe expression changes (up- or down-regulation, relative to euploid CS) by the triplet gene numbers in each situation.
Plant Physiol. Vol. 175, 2017 839
Expression Dysregulation in Wheat Aneuploidy
www.plantphysiol.orgon May 1, 2019 - Published by Downloaded from Copyright © 2017 American Society of Plant Biologists. All rights reserved.

Phenotypic Consequences of Whole-ChromosomeAneuploidy in Hexaploid Wheat
The genomically imbalanced nature of whole-chromosome aneuploidy often has severe phenotypicconsequences in all organisms studied (Williams andAmon, 2009; Henry et al., 2010; Birchler, 2014). Al-though many types of aneuploidy in plants are viableand fertile, they manifest pleiotropic developmentaldefects and generally impaired fitness. For example,in maize and Arabidopsis, the abnormal phenotypescaused by aneuploidy include developmental defects,partial sterility, alterations in plant architecture, and soforth (Birchler et al., 2001; Birchler and Veitia, 2007;Makarevitch et al., 2008; Henry et al., 2010). Qualita-tively, hexaploid common wheat is no exception to thisgeneral rule. Indeed, the seminal work by E.R. Searsmany decades ago has already established that whole-chromosome aneuploidy in the standard genotype (CS)of common wheat is associated with an array of ab-normal phenotypes (Sears, 1944). Here, we comparedseveral typical phenotypic traits between the aneuploidstrains and their isogenic euploid CS in order to getsome insights into the relationship between the degreesof dysregulated genes and severity in phenotypic ab-normality. The phenotypic traits assessed include freshweight of seedlings, plant height, tiller number, spikeletdensity, spike length, spikelet number, and seed set-ting. Prior studies in yeast have established that thereare two broad types of phenotypes associated withaneuploidy: one is gene-specific phenotypic variationsobservable only in specific aneuploid strains, and theother is general phenotypic abnormality manifested byall or most types of aneuploidy irrespective of theaneuploid chromosomes (Dodgson et al., 2016).We alsoobserved both types of abnormal phenotypes in thehexaploid wheat aneuploid strains. For example, plantheight and seed setting (a reflection of reproductivefitness) were reduced significantly in all aneuploidstrains, with N1A being mostly impaired (Fig. 7, A andC). Some phenotypic traits were affected significantly(Student’s t test, P, 0.05) in only some of the aneuploidstrains but not in others, such as seedling fresh weightand tiller number (Supplemental Fig. S12, A and B).Moreover, some traits were impacted in opposite di-rections in the different aneuploid strains, such asspikelet density and spike length (Fig. 7, B and D). Theseverity of some phenotypes clearly scales with thenumerically varied chromosome dosage. For example,a negative correlation between the dosage of chromo-some 1A and spikelet density was apparent in aneu-ploid strainsM1A, Tri1A, and T1A and euploid CS (Fig.7, B and E). Specifically, compared with CS, the dis-tances between spikelets were increased in M1A butdecreased in Tri1A and T1A (Fig. 7, B and D;Supplemental Fig. S12C). Interestingly, the phenotypesof M1B and M1D for this trait were similar to M1A,while M2A did not show this phenotypic change, sug-gesting that genes controlling the density of spikeletsare encoded by the homeologous group 1 chromosomes
(1A, 1B, and 1D) in hexaploid wheat. Notably, the sim-ilar and differential alterations to the multiple compo-nent traits related to the overall spike morphology haveaccumulated significant variations of this complex traitamong the aneuploid strains (Fig. 7E). The two com-pensating aneuploid strains (N1ATri1B and N1AT1B)showed clear, but only partial, attenuating effects of theadverse phenotypic impacts of N1A in all traits quanti-fied (Fig. 7; Supplemental Fig. S12), consistent with theoriginal report (Sears, 1944).
DISCUSSION
Aneuploidy, in which the copy number of one ormore chromosomes deviates from the balanced multi-ple of a haploid complement, represents a large-effectmutation that gravely affects cellular physiologyand has profound phenotypic consequences (Torreset al., 2008; Birchler and Veitia, 2012; Dodgson et al.,2016; Rutledge and Cimini, 2016). Apparently, all bio-logical consequences of aneuploidy are rooted indosage effects of genes encoded by the numericallyaltered chromosome(s); nevertheless, the mecha-nisms whereby a specific end phenotypic manifes-tation being brought about by aneuploidy can bedue to indirect effects of the numerically alteredchromosome(s) and, hence, can be extremely com-plex. Since the first unequivocal documentation oftrans-acting effects of aneuploidy on gene expres-sion in maize (Guo and Birchler, 1994), it has beengenerally recognized in diverse cellular and organ-ismal systems that the expression-altered genes dueto aneuploidy are not restricted to those located onthe aneusomic chromosome(s) but include a sizablefraction of genes residing on all the unvaried chromo-somes, a phenomenon collectively termed aneuploidy-induced transcriptional response (Sheltzer et al., 2012).Therefore, physiological and phenotypic consequencesof aneuploidy can be either attributable directly to thealtered expression of genes encoded by the aneusomicchromosome(s) due to a dosage effect (i.e. cis-effect) orindirectly to expression changes of many genes encodedby the unvaried chromosomes (i.e. trans-effect), whichgenerate additive or synergistic expressional and func-tional effects and which, in turn, may interact with thedosage-altered genes at the transcriptional and/orposttranscriptional levels (Pavelka et al., 2010). This isconsistent with the nonlinear nature of gene dosageeffects and their downstream biochemical processes(Veitia et al., 2013; Pires and Conant, 2016). Conse-quently, most if not all aneuploidy-induced biologicaleffects can be accounted for by the gene dosage balancehypothesis at genome-wide scales (Birchler and Veitia,2012; Veitia and Potier, 2015).
The seminal work by E.R. Sears in the early 1900s hasalready established that hexaploid wheat possesses agreater buffering capacity against the adverse effects ofmany types of whole-chromosome aneuploidy and,hence, fostered the generation and persistence of a
840 Plant Physiol. Vol. 175, 2017
Zhang et al.
www.plantphysiol.orgon May 1, 2019 - Published by Downloaded from Copyright © 2017 American Society of Plant Biologists. All rights reserved.

Figure 7. Variation in typical phenotypic traits in the whole-chromosome aneuploid strains relative to their isogenic euploidwildtype (CS) of hexaploid wheat. A to D show quantitatively tabulated values of plant height, spikelet density, seed setting, and spikelength, while E is an image showing the overall morphology of spikes. Asterisks denote statistical significance in the aneuploidversus euploid (CS) pairwise comparisons based on Student’s t test: *, P, 0.05; **, P, 0.01; and ***, P, 0.001. Bar in E = 1 cm.
Plant Physiol. Vol. 175, 2017 841
Expression Dysregulation in Wheat Aneuploidy
www.plantphysiol.orgon May 1, 2019 - Published by Downloaded from Copyright © 2017 American Society of Plant Biologists. All rights reserved.

diverse repertoire of various aneuploid strains that, inmost cases, include all 21 chromosomes (Sears, 1944).Nevertheless, the molecular basis for the hexaploidwheat’s remarkable ability to tolerate aneuploidy hasnot been explored. A straightforward molecular meta-phor conceivable for the phenomenon apparently liesin the nature of hexaploidy per se. However, this met-aphor would entail a default assumption that thehomeologous chromosomes can compensate for eachother at the gene expression level. Our results, byclearly showing that the homeologous chromosomesare not more responsive to missing a copy of the group1 homeologous chromosomes (i.e. monosomics for 1A,1B, and 1D) than nonhomologous chromosomes withrespect to trans-acting effects, strongly argue againstthis metaphor. Instead, we propose that the remarkableaneuploidy-tolerating capacity of hexaploid wheat ismore likely due to its intrinsically stronger phenotypicrobustness (hence, maintenance of fitness) to perturbedgene expression. Our observations that (1) all 10 diversetypes of whole-chromosome aneuploidy we studiedhave induced significantly dysregulated expression of asizable proportion of the expressed genes and (2) thetwo phenotypically compensated aneuploid strains (i.e.N1ATri1B and N1AT1B) showed no smaller propor-tions of dysregulated genes than most of the pheno-typically altered aneuploid strains have lent strongsupport to the possibility we proposed above.
A notable observation is the substantial differencesamong the normal chromosomes in their responses toa given whole-chromosome aneuploidy, which haveaccumulated to marked differential responses by thethree subgenomes, with subgenome B being signifi-cantlymore responsive than subgenomes A andD. Thisis consistent with the findings that the three sub-genomes of hexaploid wheat are asymmetric at bothstructural and expression levels (Feldman et al., 2012;Pont et al., 2013) and are functionally partitioned acrossdevelopment or under different environmental condi-tions (Pfeifer et al., 2014; Yang et al., 2014). Notably,subgenome expression asymmetry in polyploid wheatis already evident at the onset of allopolyploidization,which showed further augmentation in the course ofevolution and domestication at both the tetraploid andhexaploid levels (Wang et al., 2016). According to thepivotal-differential genome hypothesis for polyploidwheat evolution, subgenome A is considered the mostfundamental subgenome (pivotal) to polyploid wheatbecause it controls essential biological attributes, whilesubgenome B is more plastic and mainly confers ad-aptation to biotic and abiotic stresses (Feldman et al.,2012; El Baidouri et al., 2017; Mirzaghaderi and Mason,2017). This notion broadly accords with our resultsshowing that subgenome B is more responsive thansubgenome A to unbalanced karyotypes of whole-chromosome aneuploidy.
An interesting discovery reported recently in humanmonozygotic twins discordant for trisomy 21 (the ge-netic underpinning of Down syndrome) is that differ-ential expression between the twins is organized in
clustered aggregates along all chromosomes, a patterndubbed GEDDs (Letourneau et al., 2014). Importantly,similar expression patterns also were observed in in-duced pluripotent stem cells from the diseased twinharboring trisomy 21, in mouse with segmental trisomyof chromosome 16 (Letourneau et al., 2014), and, re-markably, in aneuploidy (monosomics) of a plant spe-cies, B. napus (Zhu et al., 2015). Thus, our exhaustiveanalysis documenting that the GEDD pattern does notexist in any of the 10 aneuploid strains (includingchromosome gain or loss) of hexaploid wheat came as asurprise. It was suggested that the occurrence of theGEDD pattern could be attributed to a reduced dy-namics of gene expression in the trisomics (Letourneauet al., 2014). Thus, the absence of GEDDs in aneuploidyof wheat may suggest a higher degree of robustness ofits allohexaploid genome in maintaining gene expres-sion dynamics and uncompromised fine-tuning of geneexpression even in cases of strong genetic perturbationby whole-chromosome aneuploidy. This is consistentwith the remarkable genomic plasticity characteristic ofhexaploid wheat, an attribute deemed critical to itsevolutionary success as a species and its broad adap-tation to diverse environments as an outstanding majorcrop (Dubcovsky and Dvorak, 2007). We anticipate thatfurther exploration into this issue may generate novelinsights into the unique features of allopolyploidy inresponse to severe genetic perturbations of unbalancedkaryotypes. That only negligible fitness loss was ob-servable in diverse types of aneuploidy associated withnascent allohexaploid wheats further corroborates thispossibility (Zhang et al., 2013b). Our argument that astrong robustness to genetic perturbation must be anessential property of hexaploid wheat also is based onanother path of reasoning: the repeated genetic ad-mixture and introgression from both of its tetraploid(tetraploid wheat [Triticum turgidum], genome BBAA)and diploid (goat grass [A. tauschii], genome DD) pro-genitors in the course of its domestication and globaldispersal (Dubcovsky and Dvorak, 2007; Matsuoka,2011; Wang et al., 2013). These repeated interploidyhybridization events have been suggested as essentialto account for the rich genetic diversity seen in thecurrent genetic pools of hexaploid wheat, which hasundergone a strong genetic bottleneck of speciation viaallopolyploidy only approximately 8,500 years ago(Dubcovsky and Dvorak, 2007; Matsuoka, 2011; Wanget al., 2013). The fact that hexaploid wheat, both as aspecies and a crop, has not only survived these trau-matic genomic imbalances (anisoploidy and aneu-ploidy) but also prospered from them lends furthersupport to its intrinsic robustness against geneticdisturbance.
Complex dosage compensation mechanisms areknown to have evolved in diverse organisms, includingboth plants and animals, which attenuate the adverseeffects of dosage imbalance (Birchler and Veitia, 2012;Sun et al., 2013a, 2013b; Veitia et al., 2013; Pires andConant, 2016). However, the scope and efficiency ofdosage compensation vary markedly across organisms
842 Plant Physiol. Vol. 175, 2017
Zhang et al.
www.plantphysiol.orgon May 1, 2019 - Published by Downloaded from Copyright © 2017 American Society of Plant Biologists. All rights reserved.

and even between different ecotypes of a given species(Hose et al., 2015). Here, we show that no more than30% of the expressed genes residing on the variousaneuploid chromosomes of hexaploid wheat showedaltered expression compared with their isogenic eu-ploid counterparts. Detailed analysis of the distributionof a set of expression-robust genes residing on the twoaneuploid chromosomes (1A and 2A), for which theaneusomic chromosome dosage varied in gradient,revealed a canonical pattern of dosage-compensatedgenes (Torres et al., 2016). Thus, possessing efficientdosage compensation mechanisms is likely anotherproperty of the hexaploid wheat genome, whichcounteracts the dosage effect for a large number ofdosage-altered genes and, hence, provides an efficientmechanism to attenuate the adverse effects of geneticdisturbance like whole-chromosome aneuploidy oncellular physiology and phenotype.Extensive studies in yeast have documented that
there are two broad categories of phenotypes associatedwith aneuploidy: chromosome-specific phenotypesunique to the pertinent chromosome being numericallyaltered and a set of general phenotypes shared bymanykinds of aneuploidy irrespective of the aneusomicchromosome (Torres et al., 2007; Sheltzer et al., 2011;Dodgson et al., 2016). While the chromosome-specificphenotypes are often caused by misexpression ofone or a few large-effect dosage-sensitive genes map-ped to the aneusomic chromosome, the general phe-notypes common to different types of aneuploidy aredue mainly to the mass effects of misexpression ofmany individual minor-effect genes residing on thenormal chromosomes (Bonney et al., 2015). The mostprominent general phenotypes of aneuploidy are de-fect in cellular proliferation and retardation in growthdue to misexpression of a large number of genes in-volved in cell division and the cell cycle as a result oftranscriptional responses induced by many types ofaneuploidy (Sheltzer et al., 2012). In Arabidopsis, an-euploidy is associated with a plethora of impaireddevelopmental phenotypes (Henry et al., 2010), asexpected for a higher plant in which developmentalpatterning is controlled by complex and intricate generegulatory networks that are especially sensitive toperturbed gene expression (Tang and Amon, 2013).Here, we show that both types of abnormal pheno-types also are associated with the aneuploid strains inhexaploid wheat and that the severity of both types ofphenotypes largely scale with the degree of aneu-ploidy or the severity of genomic imbalance. Thissuggests that the degree of dysregulated gene ex-pression due to both dosage effect (cis-effect) andtranscriptional response (trans-effect) is positively as-sociated with the degree of phenotypic abnormality inthe aneuploid strains. However, the exact molecularmechanism underlying a specific trait can be dispar-ate: some traits can be due to misexpression of a singlelarge-effect gene, while others can be the cumulatingeffect of many dysregulated genes, the individual ef-fects of which are cryptic (Tang and Amon, 2013). The
diverse enriched GO terms for the dysregulated genescorroborate the latter possibility. Notably, partial res-toration toward normal phenotypes is observable inthe two compensating aneuploid strains, N1ATri1Band N1AT1B, as originally discovered by E.R. Sears(Sears, 1944). However, as discussed above, this tin-kering toward phenotypic normalcy is not broughtabout by reduced numbers of genes that are dysre-gulated, since most of the phenotypically abnormalstrains (e.g. Tri1A and M1D) exhibited much lowernumbers of dysregulated genes. Thus, the molecularunderpinnings of phenotypic compensation in thesecompensated plants must act at the protein or moredownstream level, an issue that warrants furtherinvestigation.
To conclude, to our knowledge for the first time, wehave systemically investigated the impact of whole-chromosome aneuploidy on transcriptome-level geneexpression in hexaploid wheat. Compared with priorstudies mainly concerning diploid or haploid genomes,we have unraveled novel features of chromosome-,subgenome-, and genome-wide gene expression alter-ations associated with the diverse types of aneuploidyin an important allopolyploid genome that constitutesone of the most important agricultural crops thathumans have ever domesticated. Our findings haveadded new insights toward deeper understanding of anallopolyploid genome with respect to its gene regula-tory and functional interplay and its phenotypic man-ifestation, which bears significance in the context ofpolyploidy, a ubiquitous and cyclic event associatedwith the evolutionary history of all higher plants (Doyleet al., 2008; Van de Peer et al., 2009; Jiao et al., 2011). Ourresults also may have implications in the translationalaspect of functional genomics studies with respect to cre-ating novel crops via hybridization and polyploidization(Mason and Batley, 2015).
MATERIALS AND METHODS
Plant Materials
Atotal of 10whole-chromosomeaneuploid strains, all in the commongeneticbackground of the standard laboratory genotype CS of hexaploid wheat(Triticum aestivum; genome BBAADD, 2n= 6x= 42), were used in this study. Theaneuploid strains were as follows: (1) nullisomic 1A (missing a pair of chro-mosomes 1A, designated as N1A, 2n = 40); (2) monosomic 1A (missing onechromosome 1A, designated as M1A, 2n = 41); (3) monosomic 1B (missing onechromosome 1B, designated as M1B, 2n = 41); (4) monosomic 1D (missingone chromosome 1D, designated as M1D, 2n = 41); (5) monosomic 2A (missingone chromosome 2A, designated as M2A, 2n = 41); (6) trisomic 1A (gaining onechromosome 1A, designated as Tri1A, 2n = 43); (7) trisomic 2A (gaining onechromosome 2A, designated as Tri2A, 2n = 43); (8) tetrasomic 1A (adding a pairof chromosomes 1A, designated as T1A, 2n = 44); (9) nullisomic 1A/trisomic 1B(missing a pair of chromosomes 1A and gaining one chromosome 1B, desig-nated as N1ATri1B, 2n = 41); and (10) nullisomic 1A/tetrasomic 1B (missing apair of chromosomes 1A and gaining a pair of chromosomes 1B, designated asN1AT1B, 2n = 42; Supplemental Table S1). All plants were grown in a commongrowth chamber under controlled conditions (day/night, 22°C/16°C, 16/8 h).When the third leaf appeared and the second leaf fully expanded (Simmonset al., 1985), the second leaf of each of the 10 aneuploid strains and the euploidCS was collected for RNA isolation. At this developmental stage, all 10 aneu-ploid strains and the euploid CS are phenotypically identical (SupplementalFig. S13). All collected leaves were kept at 280°C until use.
Plant Physiol. Vol. 175, 2017 843
Expression Dysregulation in Wheat Aneuploidy
www.plantphysiol.orgon May 1, 2019 - Published by Downloaded from Copyright © 2017 American Society of Plant Biologists. All rights reserved.

Karyotyping
GISH and FISH were combined in sequence to identify the karyotypes ofevery individual plant for each aneuploid strain (Supplemental Table S1) andtheir CS euploid wild type before sampling the tissues. The protocols werelargely as described originally (Han et al., 2004; Kato et al., 2004), with minormodifications (Zhang et al., 2013b). Each of the FISH and GISH images wasacquired using an epifluorescence Olympus BX61 microscope and processedwith Adobe Photoshop CS 5.0 in its entirety (Supplemental Fig. S1).
Transcriptome Sequencing
Total RNAs were isolated from the frozen tissues using Trizol reagent(Invitrogen) according to themanufacturer’s instructions. The integrity, quality,and concentration of extracted RNAs were assessed with the Agilent2100 Bioanalyzer (Agilent Technologies). Transcriptome libraries were con-structed for each sample and sequenced using the IlluminaHiSeq 2000 platformwith standard protocols. Two biological replications were used for each of theaneuploid strains (Supplemental Table S1) as well as their common euploidwild type (CS) and sequenced as parallel experiments. Low-quality reads (20%of bases with PHRED scores less than 20) were filtered from the raw databy using the FASTX-Toolkit (-p 80 -q 20; http://hannonlab.cshl.edu/fastx_toolkit). In total, approximately 212-Gb high-quality paired-end reads (100 bp)were obtained from 22 libraries (Supplemental Fig. S14A).
Read Alignment and RNA-Seq Data Analysis
The hexaploid wheat (CS) genome sequence and its annotation informationwere downloaded from Ensembl Plants (http://plants.ensembl.org/Triticum_aestivum). Then, each set of cleaned data was aligned to the reference usingTopHat (version 2.0.11) with the following parameters: read-mismatches 2,segment mismatches 1, max-multihits 20, -r 0 (International Wheat GenomeSequencing Consortium, 2014). The raw data information and mapping effi-ciency are shown in Supplemental Figure S14 and Supplemental Table S9.The uniquely mapped reads to the reference sequence were computed. Theassessment of transcriptome size was conducted according to the methodreported (Coate and Doyle, 2010; Matos et al., 2015). The differentiallyexpressed genes were determined by using Cuffdiff (version 2.2.1) throughcomparing the FPKM values. Transcripts with an FDR-adjusted (Benjamini andHochberg, 1995) P , 0.05 were considered to exhibit statistically significantexpression differences between samples. Given the widespread transcriptionalresponses of aneuploidy (Sheltzer et al., 2012; Birchler, 2014; Dürrbaum andStorchová, 2016), we did not normalize the expression data using genes residingon the unvaried chromosomes, as cautioned (Birchler, 2010, 2014). GO enrich-ment analysis was performed by hypergeometric distribution in R, with anadjusted P, 0.05 as a cutoff to determine significantly enriched GO terms. Wedownloaded the wheat GO annotation file from the agriGO Web site (http://bioinfo.cau.edu.cn/agriGO/; Du et al., 2010).
Analysis of Dosage Compensation
We used data concerning two chromosomes to interrogate the occurrence ofdosage compensation in hexaploid wheat, which included chromosome 1A(with dosage gradient from 1 to 4; i.e. M1A, CS, Tri1A, and T1A) and chro-mosome 2A (with dosage gradient from 1 to 3; i.e. M2A, CS, and Tri2A).Candidate genes for which dosage compensation might have occurred wereselected by a strict three-step filtration. First, we excluded the dysregulatedgenes (differentially expressed genes) in the pairwise comparisons betweeneach aneuploid strain versus the euploid wild type. After this step, we identi-fied 995 nondifferentially expressed genes residing on chromosome 1A from theM1A versus CS, Tri1A versus CS, and T1A versus CS pairwise comparisons and1,285 nondifferentially expressed genes residing on chromosome 2A from theM2A versus CS and Tri2A versus CS pairwise comparisons. Second, a corre-lation test (Pearson correlation coefficient) between the expression level and thescaled-up dosage variation for each gene was performed according to themethod described (Shi et al., 2015). If the correlation coefficient was significantfor a given gene (FDR-adjusted P , 0.05), then it was removed from the can-didate gene list. Third, one-way ANOVAwas used to determine whether therewas any statistically significant difference in expression between two or moresamples within the 1A or 2A chromosome group. Then, Tukey’s honestly sig-nificant difference test was used to determine the specific genes that showed
significant expression differences in any of the pairwise comparisons within the1A or 2A chromosome group. In both of these tests, a false discovery valuebelow 0.05 was excluded. Finally, the still remaining genes were considered asdosage compensated in the aneuploid strains; that is, these genes showed arobust wild-type-level expression irrespective of dosage.
Selection of Homeologous Genes
Homeologous genes were defined as triplets that represent strictly unigenesshared among the A, B, and D subgenomes of hexaploid wheat (InternationalWheat Genome Sequencing Consortium, 2014). A total of 8,605 triplets weredownloaded from the wheat genome sequence repertoire (released by the In-ternational Wheat Genome Sequencing Consortium). Differentially expressedtriplets were defined if at least one of the three members exhibited significantdifferential expression in the aneuploid versus euploid comparisons. To assessthe transcriptional response by each subgenome to the whole-chromosomeaneuploidy, the triplets that showed altered expression in each of the aneu-ploid versus euploid comparisonswere presented as dot plots using the ggplot2package in R. The relative quantitative contribution by each subgenome to thetotal expression level of a given triplet was visualized by an UpSet plot (Lexet al., 2014). In addition, a hierarchical clustering of the expressed tripletsmapping to the homeologous group 1 chromosomes was conducted using thepvclust function implemented in R with correlation distance for log2(FPKM+1)transformed expression values and clustering by the average method.
Subgenome-Specific cDNA Pyrosequencing
The protocol essentially followed the original report (Mochida et al., 2003)withmodifications (Zhang et al., 2013a). A set of differentially expressed tripletsbased on the transcriptome profiling results was arbitrarily selected to designthe pyrosequencing primers for the purpose of assaying subgenome-specificexpression by the pyrosequencing system (PyroMarkID Q96; Qiagen).The SeqMan program (http://www.dnastar.com/) was used to identifysubgenome-specific single-nucleotide polymorphisms that enable reliable dis-tinction of the A, B, and D subgenomes for a given triplet gene. Consequently,both pyrosequencing primers and gene-specific PCR amplification primerswere designed successfully for a set of 12 triplet genes using the Soft AssayDesign software (Supplemental Table S8). Biotin-labeled PCR products wereimmobilized on streptavidin-coated paramagnetic beads. Capture of bio-tinylated single-strand PCR products, annealing of the sequencing primer, andsolid-phase pyrosequencing were performed following the manufacturer’srecommendations.
Data Processing and Statistical Analysis
The statistical significance of each comparison and graphical analyses wereexecuted in R (version 3.1.0). The correlations between two biological replicatesfor a given sample were estimated using the Pearson correlation coefficient onlog2(FPKM+1) in R. We detected the correlation coefficients ranging from 0.88to 0.99 between two biological replicates of a given aneuploid or euploid strain(Supplemental Fig. S14A).
To estimate the statistical significance of dysregulated expression betweeneach aneuploid strain versus the euploid CS, the x2 test was appliedwith a 0.05 qvalue as cutoff. The aneuploid strains together with their common euploid CSwere subjected to hierarchical clustering using a total of 12,565 genes thatshowed dysregulated expression in at least one aneuploid strain versus CScomparison. We performed hierarchical clustering by the pvclust package us-ing the correlation distance for transformed expression values [log2(FPKM+1)]and average linkage in R against 1,000 bootstrap permutations. Results of thepvclust analysis provide the approximated unbiased and the bootstrap prob-ability P values.
To determine whether the aneuploidy-induced trans-acting effects on geneexpression were statistically more prevalent for a given subgenome, the pro-portion of dysregulated genes in each of the A, B, and D subgenomes wasquantified. The Prop.test was applied separately for each aneuploid strain forthis analysis. Similarly, the percentages of dysregulated genes by each normalchromosome in a given aneuploid strain versus the euploid wild-type wereassessed based on the percentages of dysregulated genes out of the total numberof expressed genes (excluding genes residing on the aneuploid chromosome) todetermine whether the normal chromosomes in a given aneuploid strain wereequally or differentially responsive to aneuploidy at the gene expression level.The Prop.test was applied with an adjusted P value by FDR.
844 Plant Physiol. Vol. 175, 2017
Zhang et al.
www.plantphysiol.orgon May 1, 2019 - Published by Downloaded from Copyright © 2017 American Society of Plant Biologists. All rights reserved.

Toevaluatewhether thedysregulatedgenes in response toaneuploidywouldshow an even distribution or be clustered to coexpressed aggregates along agiven chromosome, we performed the lowess function in R to identify thepotential existence of codysregulated expression domains by the methodreported (Letourneau et al., 2014). Specifically, the smoothing of log2(foldchange) between an aneuploid and the euploid wild type was conducted. Thesmoother span (bin width) was the averaged proportion of dysregulated geneslocating on a given chromosome against the total number of dysregulated genesin each of the aneuploid versus euploid comparisons.
To analyze possible dosage compensation in the two studied aneuploidchromosomes (1A and 2A), we used the log2 ratio of aneuploid to euploid geneexpression to plot the frequency distributions by a bin value of 0.1. The mean,median, and skewness of the distributions are shown. Pearson mode skewnesswas calculated by 3 3 (mean 2 median)/SD. Genes exhibiting dosage effectsand dosage compensation are shown by density plots.
To test whether homeologous chromosomes show coordinated changes inexpression levels of the studied set of triplet genes in the threemonosomic strains(M1A, M1B, and M1D), we calculated the Z statistic of averaged log2(foldchange) of differentially expressed homeologs relative to the null hypothesis ofGaussian distribution with no expression reduction [mean = 0, s2 equals theobserved SE of log2(fold change) of differentially expressed homeologs] andobtained the corresponding P value.
Phenotyping
A set of phenotypic traits was quantitatively measured in at least 30 indi-viduals for each of the nine (except for Tri2A, some individuals of which wereaccidently damaged at the mature stage, thus impeding the measurement ofsome of the traits) aneuploid strains (Supplemental Table S1) along with theircommon euploidwild type (CS). The quantified traits included the fresh weightof 15-d-old seedlings and plant height, tiller number, spike length, spikeletnumber per spike, spikelet density, and seed setting all at the mature stage.Student’s t test was performed to test for statistical differences.
Accession Numbers
Data generated in this study are deposited in the National Center for Bio-technology Information Sequence Read Archive (accession no. SRP063352).
Supplemental Data
The following supplemental materials are available.
Supplemental Figure S1. Karyotypes of all aneuploid strains in the com-mon hexaploid wheat CS based on FISH and GISH.
Supplemental Figure S2. Proportional Venn diagram showing the over-laps of dysregulated genes among three comparisons, N1A versus CS,N1ATri1B versus CS, and N1AT1B versus CS.
Supplemental Figure S3. Distribution of genes showing dysregulated ex-pression along each normal chromosome due to the transcriptional re-sponse in each aneuploid strain (except for N1A, which is shown in Fig.3B) of hexaploid wheat.
Supplemental Figure S4. Log2(fold change) of gene expression betweeneach of the 10 aneuploid strains and euploid CS along each of the normalchromosomes of hexaploid wheat, depicted in gray.
Supplemental Figure S5. Frequency distribution of log2(fold change) inT1A (relative to the euploid CS).
Supplemental Figure S6. Dosage compensation for genes located onnumerically altered chromosome 2A.
Supplemental Figure S7. Frequency distribution of genes on the aneuploidchromosome showing dosage effects and dosage compensation in thefive aneuploid strains concerning 1A or 2A.
Supplemental Figure S8. Distinctly enriched GOs, in the molecular func-tion category, by genes showing transcriptional responses to whole-chromosome aneuploidy in each of the 10 aneuploid strains of hexaploidwheat due to direct trans-effect or inverse trans-effect.
Supplemental Figure S9. Expression of homeologous members in a set ofgroup 1 triplet genes in the two phenotypically compensated strains ofhexaploid wheat.
Supplemental Figure S10. Hierarchical clustering analysis of expressionsimilarity by homeologous members of a set of group 1 triplet genes inthe three monosomics (M1A, M1B, and M1D) and their common euploidwild type (CS).
Supplemental Figure S11. Validation of the RNA-seq data by locus-specific cDNA pyrosequencing.
Supplemental Figure S12. Variation in three additional phenotypic traitsin the whole-chromosome aneuploid strains relative to their isogeniceuploid wild type (CS) of hexaploid wheat.
Supplemental Figure S13. Seedlings of the 10 aneuploid strains and theircommon euploid CS at 15 d after germination.
Supplemental Figure S14. Details of clean data generated in this study.
Supplemental Table S1. Detailed information of the 10 aneuploid strainsand their common euploid CS of hexaploid wheat used in this study.
Supplemental Table S2. Statistical analysis among the four types of aneu-ploidy involving the same chromosome 1A.
Supplemental Table S3. Statistical analysis among the same type of aneu-ploidy of the three chromosomes belonging to homeologous group 1.
Supplemental Table S4. Statistical analysis between the aneuploid strainsconcerning chromosome 1A and 2A.
Supplemental Table S5. Statistical analysis between the two phenotypi-cally compensated aneuploid strains.
Supplemental Table S6. Chromosome locations of regional domains inM1A and M1B.
Supplemental Table S7. Percentages of the dosage effect mediated by cis-effects in different aneuploid strains.
Supplemental Table S8. Detailed information for 12 triplet gene primersused in this study.
Supplemental Table S9. Average sequencing depth of each sample.
ACKNOWLEDGMENTS
We thank Dr. Moshe Feldman of the Weizmann Institute of Science forproviding original seeds of all the aneuploid strains and CS; Dr. Jonathan F.Wendel for constructive suggestions in the course of this study; and the fouranonymous reviewers for their numerous valuable comments and constructivesuggestions to enable significant improvement of the article.
Received June 20, 2017; accepted August 14, 2017; published August 18, 2017.
LITERATURE CITED
Ben-David U, Arad G, Weissbein U, Mandefro B, Maimon A, Golan-LevT, Narwani K, Clark AT, Andrews PW, Benvenisty N, et al (2014)Aneuploidy induces profound changes in gene expression, proliferationand tumorigenicity of human pluripotent stem cells. Nat Commun 5:4825
Benjamini Y, Hochberg Y (1995) Controlling the false discovery rate: apractical and powerful approach to multiple testing. J R Stat Soc B 57:289–300
Birchler JA (1979) A study of enzyme activities in a dosage series of thelong arm of chromosome one in maize. Genetics 92: 1211–1229
Birchler JA (1981) The genetic basis of dosage compensation of alcoholdehydrogenase-1 in maize. Genetics 97: 625–637
Birchler JA (2010) Reflections on studies of gene expression in aneuploids.Biochem J 426: 119–123
Birchler JA (2012) Insights from paleogenomic and population studies intothe consequences of dosage sensitive gene expression in plants. CurrOpin Plant Biol 15: 544–548
Birchler JA (2014) Facts and artifacts in studies of gene expression in an-euploids and sex chromosomes. Chromosoma 123: 459–469
Birchler JA, Bhadra U, Bhadra MP, Auger DL (2001) Dosage-dependentgene regulation in multicellular eukaryotes: implications for dosagecompensation, aneuploid syndromes, and quantitative traits. Dev Biol234: 275–288
Plant Physiol. Vol. 175, 2017 845
Expression Dysregulation in Wheat Aneuploidy
www.plantphysiol.orgon May 1, 2019 - Published by Downloaded from Copyright © 2017 American Society of Plant Biologists. All rights reserved.

Birchler JA, Veitia RA (2007) The gene balance hypothesis: from classicalgenetics to modern genomics. Plant Cell 19: 395–402
Birchler JA, Veitia RA (2012) Gene balance hypothesis: connecting issuesof dosage sensitivity across biological disciplines. Proc Natl Acad SciUSA 109: 14746–14753
Bonney ME, Moriya H, Amon A (2015) Aneuploid proliferation defects inyeast are not driven by copy number changes of a few dosage-sensitivegenes. Genes Dev 29: 898–903
Chester M, Gallagher JP, Symonds VV, Cruz da Silva AV, Mavrodiev EV,Leitch AR, Soltis PS, Soltis DE (2012) Extensive chromosomal variationin a recently formed natural allopolyploid species, Tragopogon mis-cellus (Asteraceae). Proc Natl Acad Sci USA 109: 1176–1181
Coate JE, Doyle JJ (2010) Quantifying whole transcriptome size, aprerequisite for understanding transcriptome evolution across spe-cies: an example from a plant allopolyploid. Genome Biol Evol 2:534–546
Dodgson SE, Kim S, Costanzo M, Baryshnikova A, Morse DL, Kaiser CA,Boone C, Amon A (2016) Chromosome-specific and global effects ofaneuploidy in Saccharomyces cerevisiae. Genetics 202: 1395–1409
Doyle JJ, Flagel LE, Paterson AH, Rapp RA, Soltis DE, Soltis PS, WendelJF (2008) Evolutionary genetics of genome merger and doubling inplants. Annu Rev Genet 42: 443–461
Du Z, Zhou X, Ling Y, Zhang Z, Su Z (2010) agriGO: a GO analysis toolkitfor the agricultural community. Nucleic Acids Res 38: W64–W70
Dubcovsky J, Dvorak J (2007) Genome plasticity a key factor in the successof polyploid wheat under domestication. Science 316: 1862–1866
Dürrbaum M, Storchová Z (2016) Effects of aneuploidy on gene expression:implications for cancer. FEBS J 283: 791–802
El Baidouri M, Murat F, Veyssiere M, Molinier M, Flores R, Burlot L,Alaux M, Quesneville H, Pont C, Salse J (2017) Reconciling the evo-lutionary origin of bread wheat (Triticum aestivum). New Phytol 213:1477–1486
Estep MC, McKain MR, Vela Diaz D, Zhong J, Hodge JG, Hodkinson TR,Layton DJ, Malcomber ST, Pasquet R, Kellogg EA (2014) Allopoly-ploidy, diversification, and the Miocene grassland expansion. Proc NatlAcad Sci USA 111: 15149–15154
Feldman M, Levy AA, Fahima T, Korol A (2012) Genomic asymmetry inallopolyploid plants: wheat as a model. J Exp Bot 63: 5045–5059
Feldman M, Lupton FGH, Miller TE (1995) Wheats. In J Smartt, N Simmonds,eds, Evolution of Crop Plants, Ed 2. Longman Scientific & Technical, Harlow,UK, pp 84–192
Gao L, Diarso M, Zhang A, Zhang H, Dong Y, Liu L, Lv Z, Liu B (2016)Heritable alteration of DNA methylation induced by whole-chromosomeaneuploidy in wheat. New Phytol 209: 364–375
Gasch AP, Hose J, Newton MA, Sardi M, Yong M, Wang Z (2016)Further support for aneuploidy tolerance in wild yeast and effectsof dosage compensation on gene copy-number evolution. eLife 5:e14409
Guo M, Birchler JA (1994) Trans-acting dosage effects on the expression ofmodel gene systems in maize aneuploids. Science 266: 1999–2002
Guo M, Davis D, Birchler JA (1996) Dosage effects on gene expression in amaize ploidy series. Genetics 142: 1349–1355
Han F, Liu B, Fedak G, Liu Z (2004) Genomic constitution and variation infive partial amphiploids of wheat: Thinopyrum intermedium as re-vealed by GISH, multicolor GISH and seed storage protein analysis.Theor Appl Genet 109: 1070–1076
Henry IM, Dilkes BP, Comai L (2007) Genetic basis for dosage sensitivityin Arabidopsis thaliana. PLoS Genet 3: e70
Henry IM, Dilkes BP, Miller ES, Burkart-Waco D, Comai L (2010) Phe-notypic consequences of aneuploidy in Arabidopsis thaliana. Genetics 186:1231–1245
Hose J, Yong CM, Sardi M, Wang Z, Newton MA, Gasch AP (2015)Dosage compensation can buffer copy-number variation in wild yeast.eLife 4: 4
Huettel B, Kreil DP, Matzke M, Matzke AJ (2008) Effects of aneuploidy ongenome structure, expression, and interphase organization in Arabi-dopsis thaliana. PLoS Genet 4: e1000226
International Wheat Genome Sequencing Consortium (2014) A chromosome-based draft sequence of the hexaploid bread wheat (Triticum aestivum)genome. Science 345: 1251788
Jiao Y, Wickett NJ, Ayyampalayam S, Chanderbali AS, Landherr L, RalphPE, Tomsho LP, Hu Y, Liang H, Soltis PS, et al (2011) Ancestral poly-ploidy in seed plants and angiosperms. Nature 473: 97–100
Kato A, Lamb JC, Birchler JA (2004) Chromosome painting using repeti-tive DNA sequences as probes for somatic chromosome identification inmaize. Proc Natl Acad Sci USA 101: 13554–13559
Kerber ER (1964) Wheat: reconstitution of the tetraploid component(AABB) of hexaploids. Science 143: 253–255
Letourneau A, Santoni FA, Bonilla X, Sailani MR, Gonzalez D, Kind J,Chevalier C, Thurman R, Sandstrom RS, Hibaoui Y, et al (2014) Do-mains of genome-wide gene expression dysregulation in Down’s syn-drome. Nature 508: 345–350
Lex A, Gehlenborg N, Strobelt H, Vuillemot R, Pfister H (2014) UpSet:visualization of intersecting sets. IEEE Trans Vis Comput Graph 20:1983–1992
Makarevitch I, Phillips RL, Springer NM (2008) Profiling expressionchanges caused by a segmental aneuploid in maize. BMC Genomics 9: 7
Mason AS, Batley J (2015) Creating new interspecific hybrid and polyploidcrops. Trends Biotechnol 33: 436–441
Matos I, Machado MP, Schartl M, Coelho MM (2015) Gene expressiondosage regulation in an allopolyploid fish. PLoS ONE 10: e0116309
Matsuoka Y (2011) Evolution of polyploid Triticum wheats under cul-tivation: the role of domestication, natural hybridization and allo-polyploid speciation in their diversification. Plant Cell Physiol 52:750–764
Matsushita SC, Tyagi AP, Thornton GM, Pires JC, Madlung A (2012)Allopolyploidization lays the foundation for evolution of distinct pop-ulations: evidence from analysis of synthetic Arabidopsis allohexa-ploids. Genetics 191: 535–547
Mirzaghaderi G, Mason AS (2017) Revisiting pivotal-differential genomeevolution in wheat. Trends Plant Sci 22: 674–684
Mochida K, Yamazaki Y, Ogihara Y (2003) Discrimination of homoeolo-gous gene expression in hexaploid wheat by SNP analysis of contigsgrouped from a large number of expressed sequence tags. Mol GenetGenomics 270: 371–377
Pavelka N, Rancati G, Zhu J, Bradford WD, Saraf A, Florens L, SandersonBW, Hattem GL, Li R (2010) Aneuploidy confers quantitative proteomechanges and phenotypic variation in budding yeast. Nature 468: 321–325
Pfeifer M, Kugler KG, Sandve SR, Zhan B, Rudi H, Hvidsten TR, MayerKF, Olsen OA (2014) Genome interplay in the grain transcriptome ofhexaploid bread wheat. Science 345: 1250091
Pires JC, Conant GC (2016) Robust yet fragile: expression noise, proteinmisfolding, and gene dosage in the evolution of genomes. Annu RevGenet 50: 113–131
Pont C, Murat F, Guizard S, Flores R, Foucrier S, Bidet Y, Quraishi UM,Alaux M, Dole�zel J, Fahima T, et al (2013) Wheat syntenome unveilsnew evidences of contrasted evolutionary plasticity between paleo- andneoduplicated subgenomes. Plant J 76: 1030–1044
Rutledge SD, Cimini D (2016) Consequences of aneuploidy in sickness andin health. Curr Opin Cell Biol 40: 41–46
Sears ER (1944) Cytogenetic studies with polyploid species of wheat. II.Additional chromosomal aberrations in Triticum vulgare. Genetics 29:232–246
Sheltzer JM, Amon A (2011) The aneuploidy paradox: costs and benefits ofan incorrect karyotype. Trends Genet 27: 446–453
Sheltzer JM, Blank HM, Pfau SJ, Tange Y, George BM, Humpton TJ,Brito IL, Hiraoka Y, Niwa O, Amon A (2011) Aneuploidy drives ge-nomic instability in yeast. Science 333: 1026–1030
Sheltzer JM, Torres EM, Dunham MJ, Amon A (2012) Transcriptionalconsequences of aneuploidy. Proc Natl Acad Sci USA 109: 12644–12649
Shi X, Zhang C, Ko DK, Chen ZJ (2015) Genome-wide dosage-dependentand -independent regulation contributes to gene expression and evo-lutionary novelty in plant polyploids. Mol Biol Evol 32: 2351–2366
Simmons SR, Oelke EA, Anderson PM (1985) Growth and developmentguide for spring wheat. University of Minnesota Agricultural ExtensionService, St. Paul, article 37
Sun L, Johnson AF, Donohue RC, Li J, Cheng J, Birchler JA (2013a)Dosage compensation and inverse effects in triple X metafemales ofDrosophila. Proc Natl Acad Sci USA 110: 7383–7388
Sun L, Johnson AF, Li J, Lambdin AS, Cheng J, Birchler JA (2013b)Differential effect of aneuploidy on the X chromosome and genes withsex-biased expression in Drosophila. Proc Natl Acad Sci USA 110:16514–16519
Tang YC, Amon A (2013) Gene copy-number alterations: a cost-benefitanalysis. Cell 152: 394–405
846 Plant Physiol. Vol. 175, 2017
Zhang et al.
www.plantphysiol.orgon May 1, 2019 - Published by Downloaded from Copyright © 2017 American Society of Plant Biologists. All rights reserved.

Torres EM, Sokolsky T, Tucker CM, Chan LY, Boselli M, Dunham MJ,Amon A (2007) Effects of aneuploidy on cellular physiology and celldivision in haploid yeast. Science 317: 916–924
Torres EM, Springer M, Amon A (2016) No current evidence for wide-spread dosage compensation in S. cerevisiae. eLife 5: e10996
Torres EM, Williams BR, Amon A (2008) Aneuploidy: cells losing theirbalance. Genetics 179: 737–746
Van de Peer Y, Maere S, Meyer A (2009) The evolutionary significance ofancient genome duplications. Nat Rev Genet 10: 725–732
Veitia RA, Bottani S, Birchler JA (2013) Gene dosage effects: nonlinearities,genetic interactions, and dosage compensation. Trends Genet 29: 385–393
Veitia RA, Potier MC (2015) Gene dosage imbalances: action, reaction, andmodels. Trends Biochem Sci 40: 309–317
Wang J, Luo MC, Chen Z, You FM, Wei Y, Zheng Y, Dvorak J (2013)Aegilops tauschii single nucleotide polymorphisms shed light on theorigins of wheat D-genome genetic diversity and pinpoint the geo-graphic origin of hexaploid wheat. New Phytol 198: 925–937
Wang X, Zhang H, Li Y, Zhang Z, Li L, Liu B (2016) Transcriptomeasymmetry in synthetic and natural allotetraploid wheats, revealed byRNA-sequencing. New Phytol 209: 1264–1277
Weaver BA, Cleveland DW (2006) Does aneuploidy cause cancer? CurrOpin Cell Biol 18: 658–667
Williams BR, Amon A (2009) Aneuploidy: cancer’s fatal flaw? Cancer Res69: 5289–5291
Xiong Z, Gaeta RT, Pires JC (2011) Homoeologous shuffling and chro-mosome compensation maintain genome balance in resynthesized al-lopolyploid Brassica napus. Proc Natl Acad Sci USA 108: 7908–7913
Yang C, Zhao L, Zhang H, Yang Z, Wang H, Wen S, Zhang C, Rustgi S,von Wettstein D, Liu B (2014) Evolution of physiological responses tosalt stress in hexaploid wheat. Proc Natl Acad Sci USA 111: 11882–11887
Zhang H, Bian Y, Gou X, Dong Y, Rustgi S, Zhang B, Xu C, Li N, Qi B,Han F, et al (2013b) Intrinsic karyotype stability and gene copy numbervariations may have laid the foundation for tetraploid wheat formation.Proc Natl Acad Sci USA 110: 19466–19471
Zhang H, Bian Y, Gou X, Zhu B, Xu C, Qi B, Li N, Rustgi S, Zhou H, HanF, et al (2013a) Persistent whole-chromosome aneuploidy is generallyassociated with nascent allohexaploid wheat. Proc Natl Acad Sci USA110: 3447–3452
Zhang H, Zhu B, Qi B, Gou X, Dong Y, Xu C, Zhang B, Huang W, Liu C,Wang X, et al (2014) Evolution of the BBAA component of bread wheatduring its history at the allohexaploid level. Plant Cell 26: 2761–2776
Zhu B, Shao Y, Pan Q, Ge X, Li Z (2015) Genome-wide gene expressionperturbation induced by loss of C2 chromosome in allotetraploid Brassicanapus L. Front Plant Sci 6: 763
Plant Physiol. Vol. 175, 2017 847
Expression Dysregulation in Wheat Aneuploidy
www.plantphysiol.orgon May 1, 2019 - Published by Downloaded from Copyright © 2017 American Society of Plant Biologists. All rights reserved.