global apparel retail - wikispaces - ntutrumpapparel.pdf · asia-pacific comprises australia,...
TRANSCRIPT

www.datamonitor.com Datamonitor USA 245 Fifth Avenue 4th Floor New York, NY 10016 USA t: +1 212 686 7400 f: +1 212 686 2626 e: [email protected]
Datamonitor Europe 119 Farringdon Road London EC1R 3DA United Kingdom t: +44 20 7551 9000 f: +44 20 7675 7500 e: [email protected]
Datamonitor Middle East and North Africa Datamonitor PO Box 24893 Dubai, UAE t: +49 69 9754 4517 f: +49 69 9754 4900 e: datamonitormena@ datamonitor.com
Datamonitor Asia Pacific Level 46, 2 Park Street Sydney, NSW 2000 Australia t: +61 2 8705 6900 f: +61 2 8705 6901 e: [email protected]
Global - Apparel Retail 0199 - 2005 - 2009
© Datamonitor. This profile is a licensed product and is not to be photocopied Page 1
INDUSTRY PROFILE
Global Apparel Retail
Reference Code: 0199-2005
Publication Date: December 2010

EXECUTIVE SUMMARY
Global - Apparel Retail 0199 - 2005 - 2009
© Datamonitor. This profile is a licensed product and is not to be photocopied Page 2
EXECUTIVE SUMMARY
Market value
The global apparel retail industry grew by 2% in 2009 to reach a value of $1,031.5 billion.
Market value forecast
In 2014, the global apparel retail industry is forecast to have a value of $1,162.8 billion, an increase of 12.7% since 2009.
Market segmentation I
Womenswear is the largest segment of the global apparel retail industry, accounting for 51.8% of the industry's total value.
Market segmentation II
Americas accounts for 37.3% of the global apparel retail industry value.
Market rivalry
With an industry performance no more than moderate over the past five and virtually no switching costs for the customers together with huge product differentiation the apparel industry is characterized by moderate rivalry level.

CONTENTS
Global - Apparel Retail 0199 - 2005 - 2009
© Datamonitor. This profile is a licensed product and is not to be photocopied Page 3
TABLE OF CONTENTS
EXECUTIVE SUMMARY 2
MARKET OVERVIEW 7
Market definition 7 Research highlights 8 Market analysis 9
MARKET VALUE 10
MARKET SEGMENTATION I 11
MARKET SEGMENTATION II 12
FIVE FORCES ANALYSIS 13
Summary 13 Buyer power 15 Supplier power 16 New entrants 17 Substitutes 18 Rivalry 19
LEADING COMPANIES 20
Gap, Inc. 20 H & M Hennes & Mauritz AB 24 Levi Strauss & Co. 28 TJX Companies Inc 31
MARKET FORECASTS 35
Market value forecast 35 APPENDIX 36
Methodology 36 Industry associations 37 Related Datamonitor research 37 Disclaimer 38
CONTENTS
Global - Apparel Retail 0199 - 2005 - 2009
© Datamonitor. This profile is a licensed product and is not to be photocopied Page 4
ABOUT DATAMONITOR 39
Premium Reports 39 Summary Reports 39 Datamonitor consulting 39

CONTENTS
Global - Apparel Retail 0199 - 2005 - 2009
© Datamonitor. This profile is a licensed product and is not to be photocopied Page 5
LIST OF TABLES Table 1: Global apparel retail industry value: $ billion, 2005–09(e) 10
Table 2: Global apparel retail industry segmentation I:% share, by value, 2009(e) 11
Table 3: Global apparel retail industry segmentation II: % share, by value, 2009(e) 12
Table 4: Gap, Inc.: key facts 20
Table 5: Gap, Inc.: key financials ($) 21
Table 6: Gap, Inc.: key financial ratios 22
Table 7: H & M Hennes & Mauritz AB: key facts 24
Table 8: H & M Hennes & Mauritz AB: key financials ($) 25
Table 9: H & M Hennes & Mauritz AB: key financials (SEK) 25
Table 10: H & M Hennes & Mauritz AB: key financial ratios 26
Table 11: Levi Strauss & Co.: key facts 28
Table 12: Levi Strauss & Co.: key financials ($) 29
Table 13: Levi Strauss & Co.: key financial ratios 29
Table 14: TJX Companies Inc: key facts 31
Table 15: TJX Companies Inc: key financials ($) 33
Table 16: TJX Companies Inc: key financial ratios 33
Table 17: Global apparel retail industry value forecast: $ billion, 2009–14 35

CONTENTS
Global - Apparel Retail 0199 - 2005 - 2009
© Datamonitor. This profile is a licensed product and is not to be photocopied Page 6
LIST OF FIGURES Figure 1: Global apparel retail industry value: $ billion, 2005–09(e) 10
Figure 2: Global apparel retail industry segmentation I:% share, by value, 2009(e) 11
Figure 3: Global apparel retail industry segmentation II: % share, by value, 2009(e) 12
Figure 4: Forces driving competition in the global apparel retail industry, 2009 13
Figure 5: Drivers of buyer power in the global apparel retail industry, 2009 15
Figure 6: Drivers of supplier power in the global apparel retail industry, 2009 16
Figure 7: Factors influencing the likelihood of new entrants in the global apparel retail industry, 2009 17
Figure 8: Factors influencing the threat of substitutes in the global apparel retail industry, 2009 18
Figure 9: Drivers of degree of rivalry in the global apparel retail industry, 2009 19
Figure 10: Gap, Inc.: revenues & profitability 22
Figure 11: Gap, Inc.: assets & liabilities 23
Figure 12: H & M Hennes & Mauritz AB: revenues & profitability 26
Figure 13: H & M Hennes & Mauritz AB: assets & liabilities 27
Figure 14: Levi Strauss & Co.: revenues & profitability 30
Figure 15: Levi Strauss & Co.: assets & liabilities 30
Figure 16: TJX Companies Inc: revenues & profitability 34
Figure 17: TJX Companies Inc: assets & liabilities 34
Figure 18: Global apparel retail industry value forecast: $ billion, 2009–14 35

MARKET OVERVIEW
Global - Apparel Retail 0199 - 2005 - 2009
© Datamonitor. This profile is a licensed product and is not to be photocopied Page 7
MARKET OVERVIEW
Market definition
The apparel retail industry consists of the sale of all menswear, womenswear and childrenswear. The menswear market includes mens activewear, casual wear, essentials, formalwear, formalwear-occasion and outerwear. The womenswear market includes women's activewear, casual wear, essentials, formalwear, formalwear-occasion and outerwear. The childrenswear market includes baby clothing, boys activewear, boys casual wear, boys essentials, boys formalwear, boys formalwear-occasion, boys outerwear, girls activewear, girls casual wear, girls essentials, girls formalwear-occasion, girls outerwear and toddler clothing. The industry value is calculated at retail selling price (RSP), and includes all taxes and levies. All currency conversions used in this report have been calculated at constant 2009 annual average exchange rates.
For the purposes of this report, the global market consists of North America, South America, Western Europe, Eastern Europe, and Asia-Pacific.
North America consists of Canada, Mexico, and the United States.
South America comprises Argentina, Brazil, Chile, Colombia, and Venezuela.
Western Europe comprises Belgium, Denmark, France, Germany, Italy, the Netherlands, Norway, Spain, Sweden, and the United Kingdom.
Eastern Europe comprises the Czech Republic, Hungary, Poland, Romania, Russia, and Ukraine.
Asia-Pacific comprises Australia, China, India, Japan, Singapore, South Korea, and Taiwan.

MARKET OVERVIEW
Global - Apparel Retail 0199 - 2005 - 2009
© Datamonitor. This profile is a licensed product and is not to be photocopied Page 8
Research highlights
The global apparel retail industry had total revenue of $1,031.5 billion in 2009, representing a compound annual growth rate (CAGR) of 3.1% for the period spanning 2005-2009.
Sales of womenswear proved the most lucrative for the global apparel retail industry in 2009, with total revenues of $534.4 billion, equivalent to 51.8% of the market's overall value.
The performance of the industry is forecast to decelerate, with an anticipated CAGR of 2.4% for the five-year period 2009-2014, which is expected to drive the industry to a value of $1,162.8 billion by the end of 2014.
MARKET OVERVIEW
Global - Apparel Retail 0199 - 2005 - 2009
© Datamonitor. This profile is a licensed product and is not to be photocopied Page 9
Market analysis
The apparel retail industry consists of all menswear, womenswear and childrenswear. The global apparel retail industry has shown reasonably strong growth in recent years. The forecast growth rates will continue, albeit at a slightly slower rate. Performance does however, differ from country to country.
The global apparel retail industry had total revenue of $1,031.5 billion in 2009, representing a compound annual growth rate (CAGR) of 3.1% for the period spanning 2005-2009. In comparison, the European and Asia-Pacific industries grew with CAGRs of 1.7% and 4% respectively, over the same period, to reach respective values of $384.2 billion and $262.8 billion in 2009.
Sales of womenswear proved the most lucrative for the global apparel retail industry in 2009, with total revenues of $534.4 billion, equivalent to 51.8% of the market's overall value. In comparison, sales of menswear generated revenues of $335.6 billion in 2009, equating to 32.5% of the industry’s aggregate revenues.
The performance of the industry is forecast to decelerate, with an anticipated CAGR of 2.4% for the five-year period 2009-2014, which is expected to drive the industry to a value of $1,162.8 billion by the end of 2014. Comparatively, the European and Asia-Pacific industries will grow with CAGRs of 1.7% and 3.2% respectively, over the same period, to reach respective values of $417.5 billion and $307.2 billion in 2014.
MARKET VALUE
Global - Apparel Retail 0199 - 2005 - 2009
© Datamonitor. This profile is a licensed product and is not to be photocopied Page 10
MARKET VALUE
The global apparel retail industry grew by 2% in 2009 to reach a value of $1,031.5 billion.
The compound annual growth rate of the industry in the period 2005–09 was 3.1%.
Table 1: Global apparel retail industry value: $ billion, 2005–09(e) Year $ billion € billion % Growth2005 913.8 657.2 2006 963.9 693.2 5.52007 998.7 718.2 3.62008 1,011.7 727.6 1.32009(e) 1,031.5 741.8 2.0
CAGR: 2005–09 3.1%
Source: Datamonitor D A T A M O N I T O R
Figure 1: Global apparel retail industry value: $ billion, 2005–09(e)
Source: Datamonitor D A T A M O N I T O R

MARKET SEGMENTATION I
Global - Apparel Retail 0199 - 2005 - 2009
© Datamonitor. This profile is a licensed product and is not to be photocopied Page 11
MARKET SEGMENTATION I
Womenswear is the largest segment of the global apparel retail industry, accounting for 51.8% of the industry's total value.
The menswear segment accounts for a further 32.5% of the industry.
Table 2: Global apparel retail industry segmentation I:% share, by value, 2009(e) Category % ShareWomenswear 51.8%Menswear 32.5%Childrenswear 15.7%
Total 100%
Source: Datamonitor D A T A M O N I T O R
Figure 2: Global apparel retail industry segmentation I:% share, by value, 2009(e)
Source: Datamonitor D A T A M O N I T O R

MARKET SEGMENTATION II
Global - Apparel Retail 0199 - 2005 - 2009
© Datamonitor. This profile is a licensed product and is not to be photocopied Page 12
MARKET SEGMENTATION II
Americas accounts for 37.3% of the global apparel retail industry value.
Europe accounts for a further 37.3% of the global industry.
Table 3: Global apparel retail industry segmentation II: % share, by value, 2009(e) Category % ShareAmericas 37.3%Europe 37.3%Asia-Pacific 25.5%
Total 100%
Source: Datamonitor D A T A M O N I T O R
Figure 3: Global apparel retail industry segmentation II: % share, by value, 2009(e)
Source: Datamonitor D A T A M O N I T O R
FIVE FORCES ANALYSIS
Global - Apparel Retail 0199 - 2005 - 2009
© Datamonitor. This profile is a licensed product and is not to be photocopied Page 13
FIVE FORCES ANALYSIS
The apparel retail market will be analyzed taking retailers as players. The key buyers will be taken as individual consumers, and clothing manufacturers and wholesalers as the key suppliers.
Summary
Figure 4: Forces driving competition in the global apparel retail industry, 2009
Source: Datamonitor D A T A M O N I T O R
Despite the current global economic downturn, the apparel retail industry continues to grow at a healthy rate and this, coupled with the absence of switching costs for consumers and great product differentiation, means that rivalry within the industry is no more than moderate.
The apparel industry is of great importance to the economy in terms of trade, employment, investment and revenue all over the world. This particular industry has short product life cycles, vast product differentiation and is characterized by great pace of demand change coupled with rather long and inflexible supply processes. Clothing is essential to consumers who are individuals. Where brand loyalty exists, it is more likely to be to the designer than the retailer, although this is usually towards the top end of the industry. There is a growing demand for discount apparel retail with stores such providing low cost prolific-output fashion. Fashion, by its very nature, is unpredictable. The products are determined by designers, sub-cultures and creative industries and are subject to sharp and unpredictable changes. Key suppliers in this industry are clothing manufacturers and wholesalers, with retailers able to source from both.

FIVE FORCES ANALYSIS
Global - Apparel Retail 0199 - 2005 - 2009
© Datamonitor. This profile is a licensed product and is not to be photocopied Page 14
Although clothing manufacturing remains a significant part of total manufacturing in certain developed economies the ability of retailers in a given country to source from foreign manufacturers means that the effective supplier fragmentation is made greater. The apparel retail industry is still fragmented, in spit of the ongoing consolidation process and there is room for large numbers of smaller players.
FIVE FORCES ANALYSIS
Global - Apparel Retail 0199 - 2005 - 2009
© Datamonitor. This profile is a licensed product and is not to be photocopied Page 15
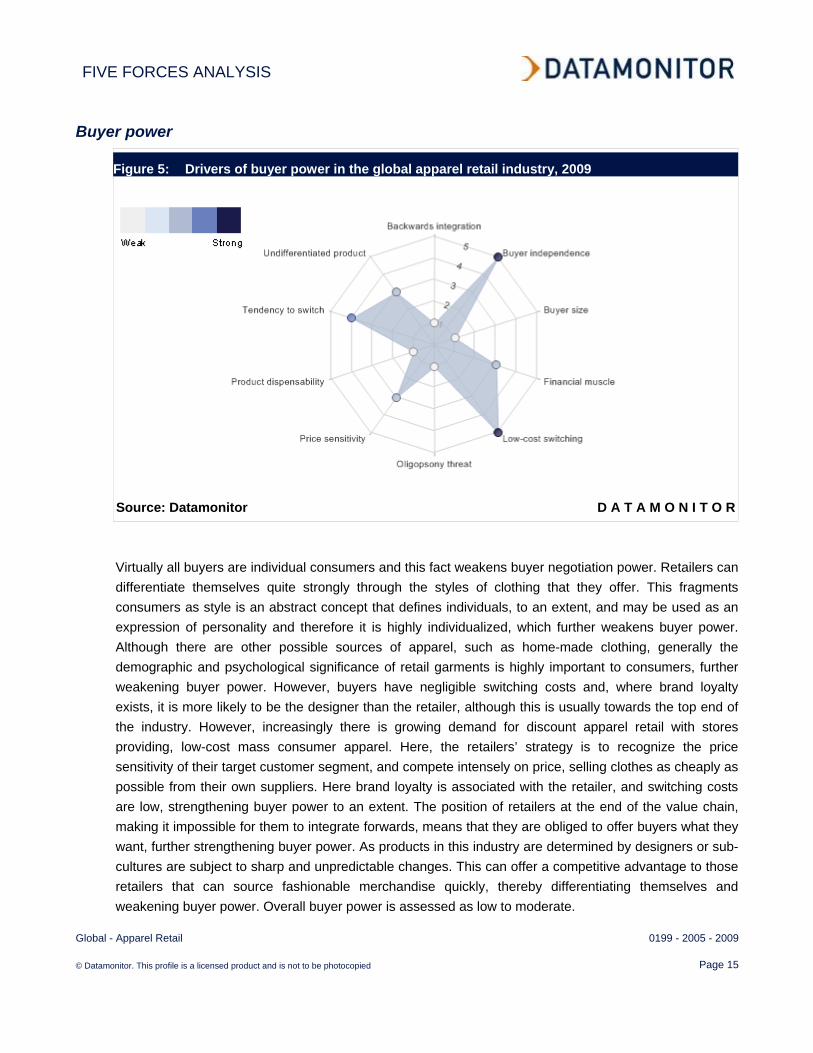
Buyer power
Figure 5: Drivers of buyer power in the global apparel retail industry, 2009
Source: Datamonitor D A T A M O N I T O R
Virtually all buyers are individual consumers and this fact weakens buyer negotiation power. Retailers can differentiate themselves quite strongly through the styles of clothing that they offer. This fragments consumers as style is an abstract concept that defines individuals, to an extent, and may be used as an expression of personality and therefore it is highly individualized, which further weakens buyer power. Although there are other possible sources of apparel, such as home-made clothing, generally the demographic and psychological significance of retail garments is highly important to consumers, further weakening buyer power. However, buyers have negligible switching costs and, where brand loyalty exists, it is more likely to be the designer than the retailer, although this is usually towards the top end of the industry. However, increasingly there is growing demand for discount apparel retail with stores providing, low-cost mass consumer apparel. Here, the retailers’ strategy is to recognize the price sensitivity of their target customer segment, and compete intensely on price, selling clothes as cheaply as possible from their own suppliers. Here brand loyalty is associated with the retailer, and switching costs are low, strengthening buyer power to an extent. The position of retailers at the end of the value chain, making it impossible for them to integrate forwards, means that they are obliged to offer buyers what they want, further strengthening buyer power. As products in this industry are determined by designers or sub-cultures are subject to sharp and unpredictable changes. This can offer a competitive advantage to those retailers that can source fashionable merchandise quickly, thereby differentiating themselves and weakening buyer power. Overall buyer power is assessed as low to moderate.

FIVE FORCES ANALYSIS
Global - Apparel Retail 0199 - 2005 - 2009
© Datamonitor. This profile is a licensed product and is not to be photocopied Page 16
Supplier power
Figure 6: Drivers of supplier power in the global apparel retail industry, 2009
Source: Datamonitor D A T A M O N I T O R
Key suppliers in this industry are clothing manufacturers and wholesalers, with retailers able to source from both. As the apparel manufacturing industry is in majority more labor intensive and does not necessary require excessive capital investment, its suppliers are focusing more towards the developing economies and even constituting large amount of their exports. As international trade liberalizes, supplier power in the global industry is decreased through competition from manufacturers in low-wage regions, most notably China. (Apparel manufacturing is almost always labor intensive, due to the difficulty of automating processes such as the sewing of garments.) Switching costs for retailers are not very high: they include the risk that choosing a low-cost supplier involves a more extended supply chain that may not be able to cope with sudden changes in demand in an industry susceptible to changes in fashion. Suppliers are further weakened by their lack of diversity, which makes the apparel retail industry highly important to their business. Retail is also labor-intensive, and the existence of a minimum wage in the many countries slightly increases the power of suppliers of labor. Overall, there is low to moderate supplier power in this industry.

FIVE FORCES ANALYSIS
Global - Apparel Retail 0199 - 2005 - 2009
© Datamonitor. This profile is a licensed product and is not to be photocopied Page 17
New entrants
Figure 7: Factors influencing the likelihood of new entrants in the global apparel retail industry,
2009
Source: Datamonitor D A T A M O N I T O R
The global apparel retail industry has grown only modestly in value in recent years, which limits its attractiveness to new entrants. Entry to the apparel retail industry does not require large capital outlay; setting up a single, independent apparel retail store is within the means of many individuals, even in countries like India and China, where median incomes are quite low. However, in some countries a few large corporations account for a major share of total industry revenues. Their scale economies include the ability to build brands in multiple retail outlets, and greater buying power when negotiating with suppliers. Negligible switching costs for consumers mean that they are free to transfer their custom to a new player. Industry entrants face several other barriers. Retaliation by existing players, such as the launch of a price war, is a possibility, especially where a new entrant moves into a more concentrated segment. The emerging brand strength of the major 'discount' chains is considerable, which may negate much of the effect of low switching costs. Overall there is a strong likelihood of significant new entrants to this industry.

FIVE FORCES ANALYSIS
Global - Apparel Retail 0199 - 2005 - 2009
© Datamonitor. This profile is a licensed product and is not to be photocopied Page 18
Substitutes
Figure 8: Factors influencing the threat of substitutes in the global apparel retail industry, 2009
Source: Datamonitor D A T A M O N I T O R
Clothing has more functions than just keeping the wearer warm: for example, it also acts as a signifier of socio-economic class and a way of displaying individual identity. Particularly in developed economies, most consumers obtain clothes from apparel retailers and they are typically offered a diverse range of products that allows them to fulfill these various needs. This makes some alternatives less beneficial from the buyers’ perspective. Substitutes for apparel retail include buying directly from manufacturers, which is facilitated by the growth of online sales. Home-made and custom-made (couture) clothing are also niche alternatives to retail of ready-made clothes. Counterfeit clothing can be a significant threat to revenues in some countries. Overall the threat of substitutes to the apparel retail industry is assessed as weak
FIVE FORCES ANALYSIS
Global - Apparel Retail 0199 - 2005 - 2009
© Datamonitor. This profile is a licensed product and is not to be photocopied Page 19
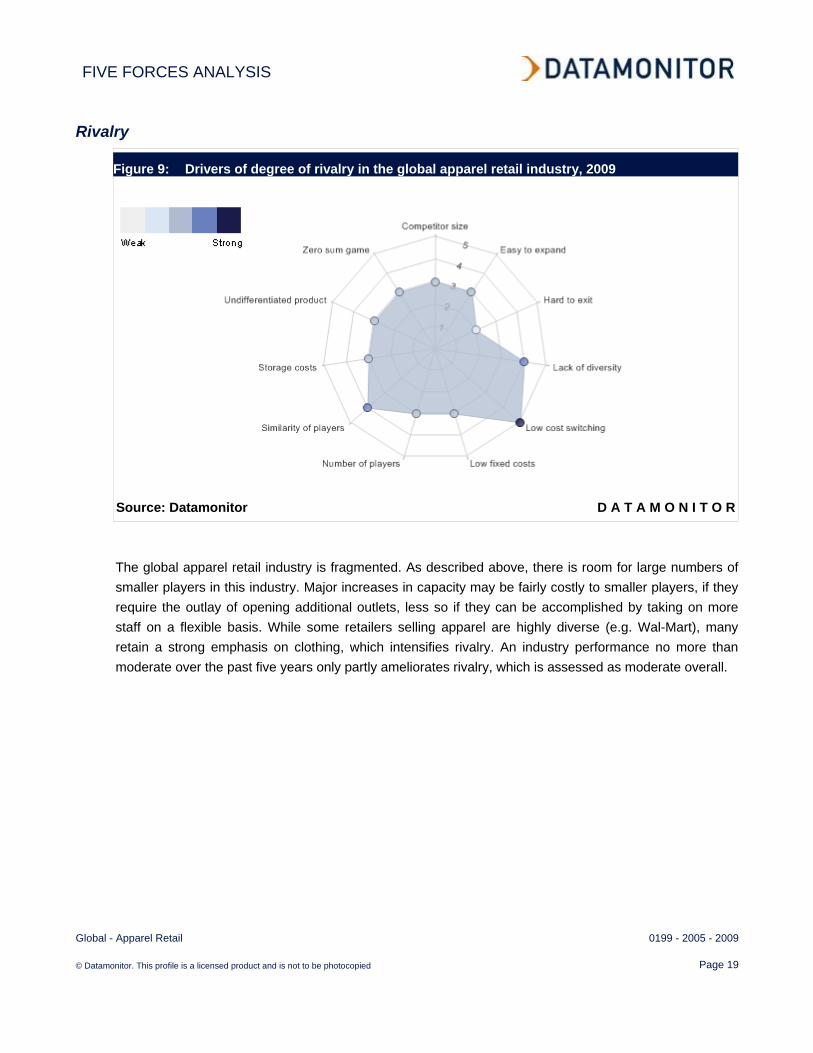
Rivalry
Figure 9: Drivers of degree of rivalry in the global apparel retail industry, 2009
Source: Datamonitor D A T A M O N I T O R
The global apparel retail industry is fragmented. As described above, there is room for large numbers of smaller players in this industry. Major increases in capacity may be fairly costly to smaller players, if they require the outlay of opening additional outlets, less so if they can be accomplished by taking on more staff on a flexible basis. While some retailers selling apparel are highly diverse (e.g. Wal-Mart), many retain a strong emphasis on clothing, which intensifies rivalry. An industry performance no more than moderate over the past five years only partly ameliorates rivalry, which is assessed as moderate overall.

LEADING COMPANIES
Global - Apparel Retail 0199 - 2005 - 2009
© Datamonitor. This profile is a licensed product and is not to be photocopied Page 20
LEADING COMPANIES
Gap, Inc.
Table 4: Gap, Inc.: key facts Head office: 2 Folsom street, San Francisco, California 94105 USA Telephone: 1 650 952 4400 Fax: 1 650 952 4407 Website: www.gapinc.com Financial year-end: February Ticker: GPS Stock exchange: New York Source: company website D A T A M O N I T O R
Gap is a specialty retailer that sells casual apparel, accessories and personal care products for men, women and children under the Gap, Old Navy, Banana Republic and Piperlime brands. The company operates 3,167 stores throughout the US, Canada, the UK, France, Ireland and Japan. Gap also has franchise agreements with unaffiliated franchisees to operate Gap and Banana Republic stores in Asia, Europe and Middle East. Gap also markets its products to US customers through four websites gap.com, bananarepublic.com, oldnavy.com and piperlime.com.
The company primarily conducts business through four business divisions: Gap, Old Navy, Banana Republic and other.
Gap store was founded in 1969. It offers an extensive selection of classically styled, high quality, casual apparel at moderate price points. Gap products range from wardrobe basics such as denim, khakis and T-shirts to fashion apparel, accessories and personal care for men, women and kids. The company entered the children's apparel market in 1986 with the introduction of GapKids and further introduced babyGap in 1989. The GapKids stores offer casual apparel and accessories for children aging from newborn to pre-teen. The company offers apparels for women through GapBody which was launched in 1998. The company also operates Gap Outlet stores which carry a similar line of products as GapBody. The company operates 1,249 Gap stores in North America, 173 in Europe and 110 in Asia.
Old Navy was launched in 1994 to address the market for value-priced family apparel. Old Navy offers a broad selection of apparel, shoes and accessories for adults, children and infants. It also offers other items such as personal care products. Additionally, Old Navy offers a line of maternity wear. The company operates 1,059 Old Navy stores in North America.

LEADING COMPANIES
Global - Apparel Retail 0199 - 2005 - 2009
© Datamonitor. This profile is a licensed product and is not to be photocopied Page 21
Banana Republic offers sophisticated, fashionable collection of dress-casual and tailored apparel, shoes and accessories for men and women at higher price points than Gap. Its products range from apparel, including intimate apparel, to personal care products. Further, it operates Banana Republic Factory Stores which carry a similar line of products. There are 555 Banana Republic stores in North America and 21 in Asia.
The others division includes Piperlime and direct; it also includes Gap's international sales programs. Piperlime, founded in 2006, is the company's newest online retail concept selling footwear online for men, women and kids.
Key Metrics
The company recorded revenues of $14,526 million in the fiscal year ending February 2009, a decrease of 7.8% compared to fiscal 2008. Its net income was $967 million in fiscal 2009, compared to a net income of $833 million in the preceding year.
Table 5: Gap, Inc.: key financials ($) $ million 2005 2006 2007 2008 2009Revenues 16,023.0 15,943.0 15,923.0 15,763.0 14,526.0Net income (loss) 1,113.0 778.0 778.0 833.0 967.0Total assets 10,048.0 8,821.0 8,544.0 7,838.0 7,564.0Total liabilities 5,112.0 3,396.0 3,370.0 3,564.0 3,177.0Employees 153,000 154,000 150,000 150,000 134,000 Source: company filings D A T A M O N I T O R

LEADING COMPANIES
Global - Apparel Retail 0199 - 2005 - 2009
© Datamonitor. This profile is a licensed product and is not to be photocopied Page 22
Table 6: Gap, Inc.: key financial ratios Ratio 2005 2006 2007 2008 2009Profit margin 6.9% 4.9% 4.9% 5.3% 6.7%Revenue growth (1.5%) (0.5%) (0.1%) (1.0%) (7.8%)Asset growth (6.2%) (12.2%) (3.1%) (8.3%) (3.5%)Liabilities growth (15.7%) (33.6%) (0.8%) 5.8% (10.9%)Debt/asset ratio 50.9% 38.5% 39.4% 45.5% 42.0%Return on assets 10.7% 8.2% 9.0% 10.2% 12.6%Revenue per employee $104,725 $103,526 $106,153 $105,087 $108,403Profit per employee $7,275 $5,052 $5,187 $5,553 $7,216 Source: company filings D A T A M O N I T O R
Figure 10: Gap, Inc.: revenues & profitability
Source: company filings D A T A M O N I T O R

LEADING COMPANIES
Global - Apparel Retail 0199 - 2005 - 2009
© Datamonitor. This profile is a licensed product and is not to be photocopied Page 23
Figure 11: Gap, Inc.: assets & liabilities
Source: company filings D A T A M O N I T O R

LEADING COMPANIES
Global - Apparel Retail 0199 - 2005 - 2009
© Datamonitor. This profile is a licensed product and is not to be photocopied Page 24
H & M Hennes & Mauritz AB
Table 7: H & M Hennes & Mauritz AB: key facts Head office: Master Samuelsgatan 46A, SE 106 38, Stockholm SWE Telephone: 46 8 796 55 00 Fax: 46 8 20 80 94 Website: www.hm.com Financial year-end: November Ticker: HMB Stock exchange: OMX Nordic Exchange Stockholm Source: company website D A T A M O N I T O R
H&M offers fashion and related products for women, men, teenagers and children. The company offers national brands and private label merchandise in various categories including apparel, cosmetics, accessories and footwear. H&M operated 1,738 stores in 33 countries as of November 2008. The company primarily operates from leased store premises and through direct channels such as Internet and catalogue in countries such as Sweden, Norway, Denmark, Finland, the Netherlands, Germany and Austria.
H&M operates its business through three geographical segments including the Nordic region, Eurozone excluding Finland, and rest of the world.
H&M adopted the concept of regional grouping, wherein it purchases and distributes the merchandise to a region of sale-countries. The products are then allocated to the sales countries in the region according to the demand in each market. To facilitate the regional grouping and to support expansion in the region, the company created a separate company, H & M Hennes & Mauritz GBC AB in 2007. The process involved transferring the central design, buying, logistics and stock-keeping functions to the new company. H&M also strengthened the production unit in Hong Kong by converting it into a central procurement department.
H&M procures its merchandise from 700 independent suppliers, primarily located in Asia and Europe where the company has about 20 local production offices that maintain contacts with suppliers. The production offices are responsible for ensuring that orders are placed with the correct supplier at the right price. In addition, the production offices are involved in quality testing, such as chemical and laundry tests, in association with external laboratories. The goods are subsequently transported to various distribution centers and redistributed to H&M stores or to the central regional replenishment centers.

LEADING COMPANIES
Global - Apparel Retail 0199 - 2005 - 2009
© Datamonitor. This profile is a licensed product and is not to be photocopied Page 25
Key Metrics
The company recorded revenues of $15,490 million in the fiscal year ending November 2009, an increase of 14.1% compared to fiscal 2008. Its net income was $2,138 million in fiscal 2009, compared to a net income of $1,996 million in the preceding year.
Table 8: H & M Hennes & Mauritz AB: key financials ($) $ million 2005 2006 2007 2008 2009Revenues 9,380.9 10,450.4 12,021.8 13,577.1 15,489.6Net income (loss) 1,206.7 1,409.0 1,773.2 1,995.8 2,138.1Total assets 4,330.3 4,639.8 5,446.2 6,687.1 7,094.2Total liabilities 947.3 1,014.7 1,258.1 1,865.2 1,794.3Employees 34,614 40,368 47,029 53,430 53,476 Source: company filings D A T A M O N I T O R
Table 9: H & M Hennes & Mauritz AB: key financials (SEK) SEK million 2005 2006 2007 2008 2009Revenues 71,886.0 80,081.0 92,123.0 104,041.0 118,697.0Net income (loss) 9,247.0 10,797.0 13,588.0 15,294.0 16,384.0Total assets 33,183.0 35,555.0 41,734.0 51,243.0 54,363.0Total liabilities 7,259.0 7,776.0 9,641.0 14,293.0 13,750.0 Source: company filings D A T A M O N I T O R

LEADING COMPANIES
Global - Apparel Retail 0199 - 2005 - 2009
© Datamonitor. This profile is a licensed product and is not to be photocopied Page 26
Table 10: H & M Hennes & Mauritz AB: key financial ratios Ratio 2005 2006 2007 2008 2009Profit margin 12.9% 13.5% 14.7% 14.7% 13.8%Revenue growth 14.1% 11.4% 15.0% 12.9% 14.1%Asset growth 18.0% 7.1% 17.4% 22.8% 6.1%Liabilities growth 22.7% 7.1% 24.0% 48.3% (3.8%)Debt/asset ratio 21.9% 21.9% 23.1% 27.9% 25.3%Return on assets 30.2% 31.4% 35.2% 32.9% 31.0%Revenue per employee $271,016 $258,877 $255,625 $254,110 $289,656Profit per employee $34,862 $34,903 $37,704 $37,354 $39,982 Source: company filings D A T A M O N I T O R
Figure 12: H & M Hennes & Mauritz AB: revenues & profitability
Source: company filings D A T A M O N I T O R

LEADING COMPANIES
Global - Apparel Retail 0199 - 2005 - 2009
© Datamonitor. This profile is a licensed product and is not to be photocopied Page 27
Figure 13: H & M Hennes & Mauritz AB: assets & liabilities
Source: company filings D A T A M O N I T O R
LEADING COMPANIES
Global - Apparel Retail 0199 - 2005 - 2009
© Datamonitor. This profile is a licensed product and is not to be photocopied Page 28
Levi Strauss & Co.
Table 11: Levi Strauss & Co.: key facts Head office: Levi Strauss & Co., 1155 Battery Street, San Francisco, California
94111 USA Telephone: 1 415 501 6000 Website: www.levistrauss.com Financial year-end: November Source: company website D A T A M O N I T O R
Levi Strauss (Levis) is a branded apparel company. Levis designs and markets jeans, casual pants, tops, jackets and related accessories; it also licenses its trademarks in many countries around the world for an array of products, including accessories, pants, tops, footwear and other products. With operations in the Americas, Europe and Asia Pacific, Levis's products are sold in approximately 60,000 retail locations in more than 110 countries.
Levis generates all of its revenues from the retail segment. The company designs its products under the brands Levi's, Dockers and Signature by Levi Strauss & Co. (Signature).
The Levi's brand has a range of products which cater to consumers of all ages and lifestyles. The company's product offering includes: Red Tab products and premium products such as Levi's Engineered Jeans, Levi's Blue, Levi's Redloop, Levi's Lady Style, Levi's Capital E products and Levi's Vintage Clothing line. The double arc of stitching, known as the Arcuate stitching design, and the Red Tab device, a fabric tab stitched into the back right pocket, are unique to Levi's jeans.
Dockers brand includes apparel for a wide range of occasions. The current Dockers product offerings in the US include Dockers for Men and Dockers for Women. Dockers for Men includes a range of stylish casual and dress products that cover the key wearing occasions for men: work, weekend, dress and golf, whereas Dockers for Women includes a range of pants, shorts, tops, skirts, sweaters and jackets in updated fits, fabrics and styles.
The Signature by Levi Strauss & Co brand offers value-seeking consumers products such as denim jeans, casual pants, tops and jackets in a variety of fits, fabrics and finishes.
Levis distributes its Levi's and Dockers products primarily through chain retailers and department stores in the US and primarily through department stores, specialty retailers and franchised stores outside of the US. Additionally, the company distributes its Levi's and Dockers products through online stores, and 260 company-operated stores located in 24 countries, including the US.

LEADING COMPANIES
Global - Apparel Retail 0199 - 2005 - 2009
© Datamonitor. This profile is a licensed product and is not to be photocopied Page 29
The company distributes products under the Signature brand primarily through mass channel retailers in the US and mass and other retailers and franchised stores outside of the US.
Key Metrics
The company recorded revenues of $4,023 million in the fiscal year ending November 2009, a decrease of 8.6% compared to fiscal 2008. Its net income was $152 million in fiscal 2009, compared to a net income of $229 million in the preceding year.
Table 12: Levi Strauss & Co.: key financials ($) $ million 2005 2006 2007 2008 2009Revenues 4,224.8 4,192.9 4,361.0 4,401.0 4,023.0Net income (loss) 155.9 239.0 460.0 229.0 151.8Total assets 2,804.1 2,804.1 2,850.7 2,941.4 2,989.0Total liabilities 4,026.2 3,796.2 1,960.0 1,850.0 3,321.0Employees 9,635 10,680 11,550 10,000 11,400 Source: company filings D A T A M O N I T O R
Table 13: Levi Strauss & Co.: key financial ratios Ratio 2005 2006 2007 2008 2009Profit margin 3.7% 5.7% 10.5% 5.2% 3.8%Revenue growth 3.7% (0.8%) 4.0% 0.9% (8.6%)Asset growth (2.8%) 0.0% 1.7% 3.2% 1.6%Liabilities growth (5.4%) (5.7%) (48.4%) (5.6%) 79.5%Debt/asset ratio 143.6% 135.4% 68.8% 62.9% 111.1%Return on assets 5.5% 8.5% 16.3% 7.9% 5.1%Revenue per employee $438,485 $392,594 $377,576 $440,100 $352,895Profit per employee $16,181 $22,378 $39,827 $22,900 $13,316 Source: company filings D A T A M O N I T O R

LEADING COMPANIES
Global - Apparel Retail 0199 - 2005 - 2009
© Datamonitor. This profile is a licensed product and is not to be photocopied Page 30
Figure 14: Levi Strauss & Co.: revenues & profitability
Source: company filings D A T A M O N I T O R
Figure 15: Levi Strauss & Co.: assets & liabilities
Source: company filings D A T A M O N I T O R

LEADING COMPANIES
Global - Apparel Retail 0199 - 2005 - 2009
© Datamonitor. This profile is a licensed product and is not to be photocopied Page 31
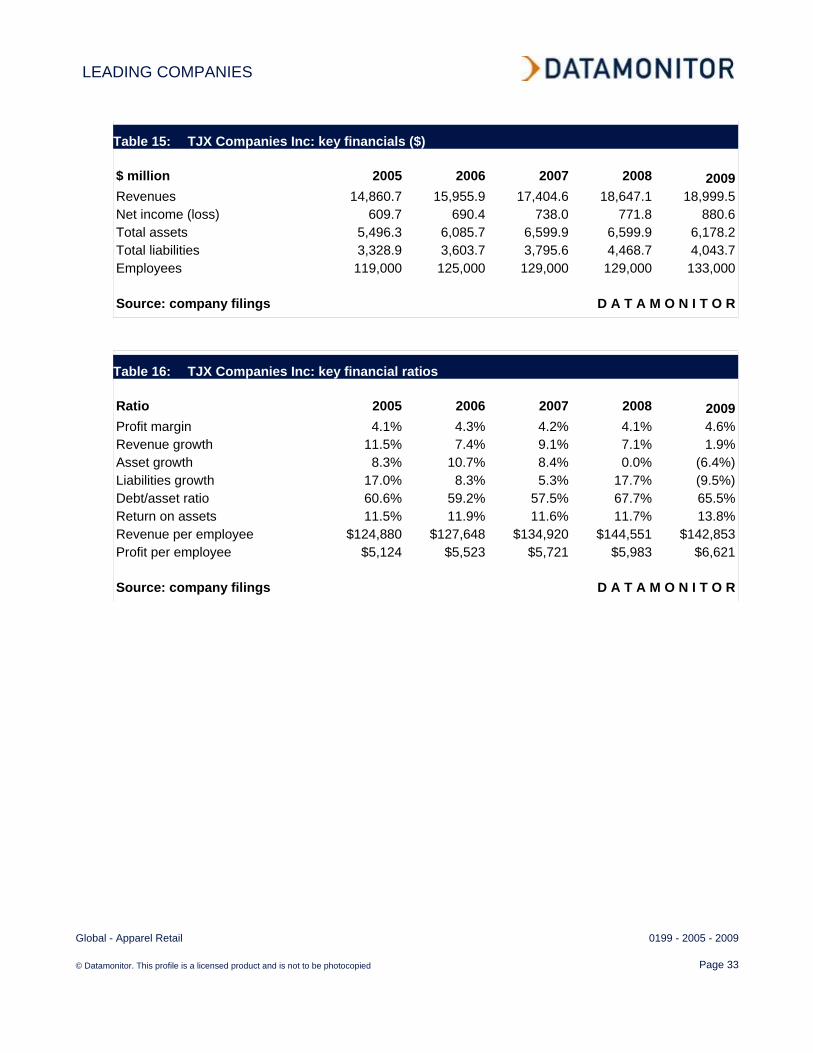
TJX Companies Inc
Table 14: TJX Companies Inc: key facts Head office: TJX Companies Inc., 770 Cochituate Road, Framingham,
Massachusetts 01701 USA Telephone: 1 508 390 1000 Fax: 1 508 390 2091 Website: www.tjx.com Financial year-end: January Ticker: TJX Stock exchange: New York Source: company website D A T A M O N I T O R
TJX Companies (TJX) is one of the leading off-price retailers of apparel and home fashions in the US and worldwide. The company offers branded and designer family apparel and home fashions every day at substantial savings as compared with comparable department and specialty stores' regular prices. As of January 2008, TJX operates over 2,500 stores in the US, Canada and Europe.
The company operates through six business divisions: Marmaxx, Winners and HomeSense, TK Maxx, HomeGoods, AJ Wright and Bob's Stores.
The company, under Marmaxx division, operates TJ Maxx and Marshalls stores. These stores sell brand name merchandise at prices 20%-60% below department and specialty store regular prices. Both stores offer family apparel, accessories, and giftware and home furnishings. In addition to these, TJ Maxx offers women's shoes and fine jewelry while Marshalls offers a full-line footwear department and a larger men's department. The company operates approximately 847 T.J. Maxx stores in 48 states and 762 Marshalls stores in 42 states, as well as 14 in Puerto Rico. T.J. Maxx and Marshalls stores are generally located in suburban community shopping centers. Both chains offer family apparel, accessories, giftware, and home fashions.
The Winners and HomeSense stores, which operate in Canada, are managed as one division and report as a single segment. The Winners stores are one of the leading off-price retailing stores in Canada offering off-price brand name women's apparel and shoes, lingerie, accessories, home fashions, giftware, fine jewelry, men's wear and children's clothing.
Winners operates HomeSense, the Canadian off price home-fashions chain. HomeSense offers a wide and rapidly changing assortment of off-price home fashions including giftware, accent furniture, lamps, rugs, accessories and seasonal merchandise.

LEADING COMPANIES
Global - Apparel Retail 0199 - 2005 - 2009
© Datamonitor. This profile is a licensed product and is not to be photocopied Page 32
The company operates HomeSense in a stand-alone format, as well as a superstore format where a HomeSense store and a Winners store are combined or operate side-by-side. At the end of FY2008, TJX operated a total of 191 Winners stores, which averaged approximately 29,000 square feet and 71 HomeSense stores, which averaged approximately 24,000 square feet.
TK Maxx, operating in the UK and Ireland, is the only major off-price retailer in Europe. TK Maxx utilizes the same off-price strategies employed by TJ Maxx, Marshalls and Winners. TK Maxx offers family apparel, accessories, giftware, and home fashions. By the end of FY2008, the company operated 221 TK Maxx stores which averaged approximately 30,000 square feet.
HomeGoods is the company's off-price retail chain that sells a range of home furnishings. HomeGoods offers exclusively home fashions, giftware, home basics, accent furniture, lamps, rugs, accessories, children's furniture, and seasonal merchandise for the home. HomeGoods stores operate in three formats: standalone, superstore and combo store formats.
The 289 HomeGoods stores operated at the end of FY2008 included 156 stand-alone stores, 105 superstores and 28 combo stores. However, the company also combines HomeGoods stores with a TJ Maxx or Marshall's store in a superstore format. Stand-alone HomeGoods stores average approximately 27,000 square feet. In superstores, which average approximately 53,000 square feet, an average of 22,000 square feet is dedicated to HomeGoods.
AJ Wright stores offer brand name family apparel, accessories, footwear, and gift ware, including toys and games, to moderate income customers. These stores average approximately 26,000 square feet at the end of FY2008. TJX operated 129 AJ Wright stores in the US.
Bob's Stores offer casual, family apparel, licensed team apparel, and footwear including work wear and activewear. These stores attract upper and middle income groups. Bob's Stores operated 34 stores at the end of fiscal 2008, with an average size of 46,000 square feet. Bob's Stores were sold in August 2008.
Key Metrics
The company recorded revenues of $19,000 million in the fiscal year ending January 2009, an increase of 1.9% compared to fiscal 2008. Its net income was $881 million in fiscal 2009, compared to a net income of $772 million in the preceding year.
LEADING COMPANIES
Global - Apparel Retail 0199 - 2005 - 2009
© Datamonitor. This profile is a licensed product and is not to be photocopied Page 33
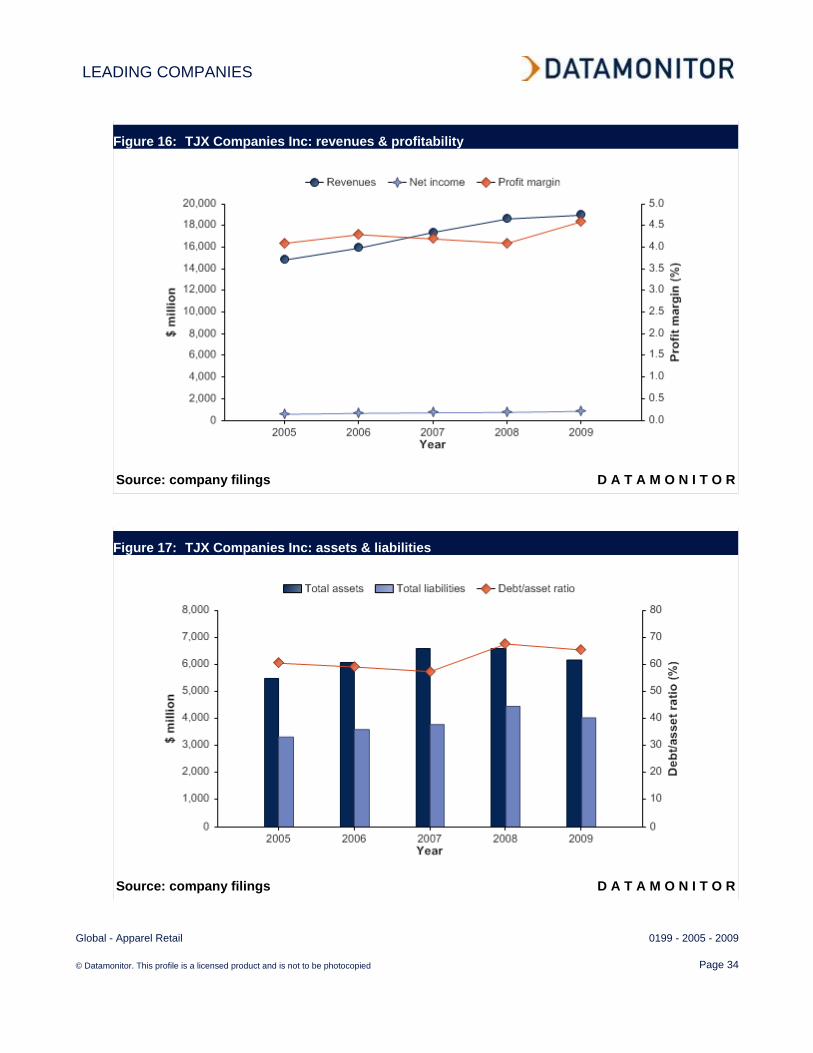
Table 15: TJX Companies Inc: key financials ($) $ million 2005 2006 2007 2008 2009Revenues 14,860.7 15,955.9 17,404.6 18,647.1 18,999.5Net income (loss) 609.7 690.4 738.0 771.8 880.6Total assets 5,496.3 6,085.7 6,599.9 6,599.9 6,178.2Total liabilities 3,328.9 3,603.7 3,795.6 4,468.7 4,043.7Employees 119,000 125,000 129,000 129,000 133,000 Source: company filings D A T A M O N I T O R
Table 16: TJX Companies Inc: key financial ratios Ratio 2005 2006 2007 2008 2009Profit margin 4.1% 4.3% 4.2% 4.1% 4.6%Revenue growth 11.5% 7.4% 9.1% 7.1% 1.9%Asset growth 8.3% 10.7% 8.4% 0.0% (6.4%)Liabilities growth 17.0% 8.3% 5.3% 17.7% (9.5%)Debt/asset ratio 60.6% 59.2% 57.5% 67.7% 65.5%Return on assets 11.5% 11.9% 11.6% 11.7% 13.8%Revenue per employee $124,880 $127,648 $134,920 $144,551 $142,853Profit per employee $5,124 $5,523 $5,721 $5,983 $6,621 Source: company filings D A T A M O N I T O R
LEADING COMPANIES
Global - Apparel Retail 0199 - 2005 - 2009
© Datamonitor. This profile is a licensed product and is not to be photocopied Page 34
Figure 16: TJX Companies Inc: revenues & profitability
Source: company filings D A T A M O N I T O R
Figure 17: TJX Companies Inc: assets & liabilities
Source: company filings D A T A M O N I T O R
MARKET FORECASTS
Global - Apparel Retail 0199 - 2005 - 2009
© Datamonitor. This profile is a licensed product and is not to be photocopied Page 35
MARKET FORECASTS
Market value forecast
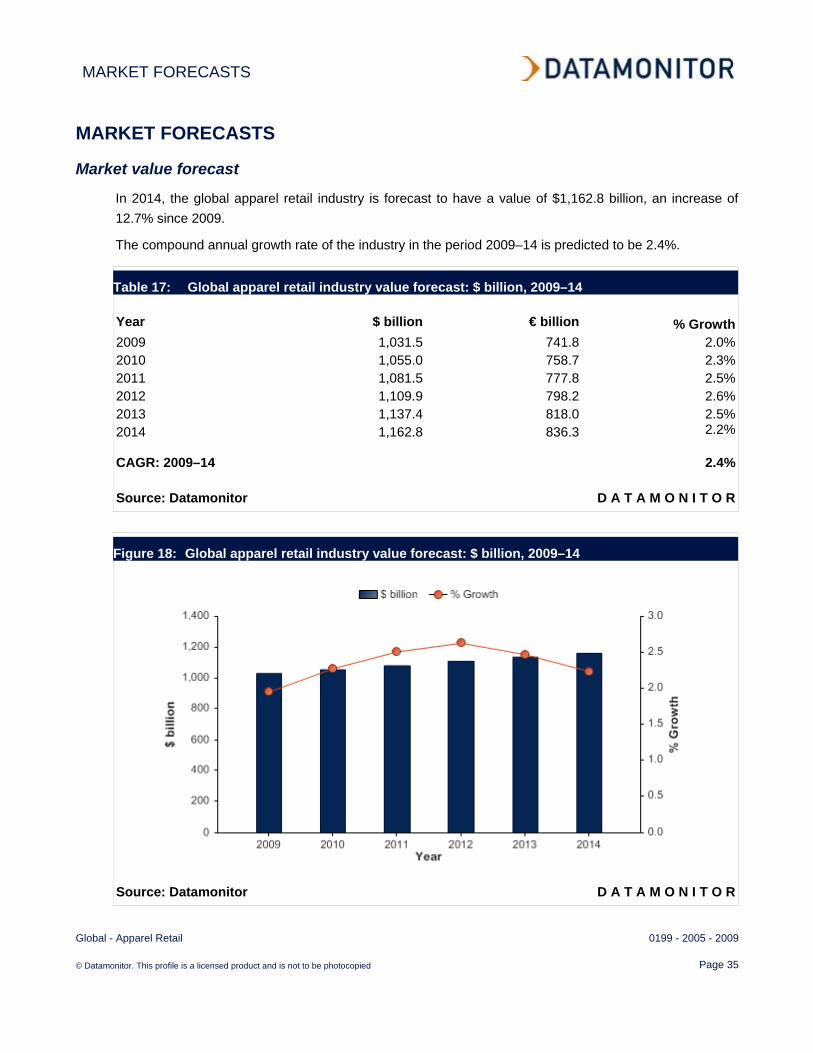
In 2014, the global apparel retail industry is forecast to have a value of $1,162.8 billion, an increase of 12.7% since 2009.
The compound annual growth rate of the industry in the period 2009–14 is predicted to be 2.4%.
Table 17: Global apparel retail industry value forecast: $ billion, 2009–14 Year $ billion € billion % Growth2009 1,031.5 741.8 2.0%2010 1,055.0 758.7 2.3%2011 1,081.5 777.8 2.5%2012 1,109.9 798.2 2.6%2013 1,137.4 818.0 2.5%2014 1,162.8 836.3 2.2%
CAGR: 2009–14 2.4%
Source: Datamonitor D A T A M O N I T O R
Figure 18: Global apparel retail industry value forecast: $ billion, 2009–14
Source: Datamonitor D A T A M O N I T O R

APPENDIX
Global - Apparel Retail 0199 - 2005 - 2009
© Datamonitor. This profile is a licensed product and is not to be photocopied Page 36
APPENDIX
Methodology
Datamonitor Industry Profiles draw on extensive primary and secondary research, all aggregated, analyzed, cross-checked and presented in a consistent and accessible style.
Review of in-house databases – Created using 250,000+ industry interviews and consumer surveys and supported by analysis from industry experts using highly complex modeling & forecasting tools, Datamonitor’s in-house databases provide the foundation for all related industry profiles
Preparatory research – We also maintain extensive in-house databases of news, analyst commentary, company profiles and macroeconomic & demographic information, which enable our researchers to build an accurate market overview
Definitions – Market definitions are standardized to allow comparison from country to country. The parameters of each definition are carefully reviewed at the start of the research process to ensure they match the requirements of both the market and our clients
Extensive secondary research activities ensure we are always fully up-to-date with the latest industry events and trends
Datamonitor aggregates and analyzes a number of secondary information sources, including: - National/Governmental statistics - International data (official international sources) - National and International trade associations - Broker and analyst reports - Company Annual Reports - Business information libraries and databases
Modeling & forecasting tools – Datamonitor has developed powerful tools that allow quantitative and qualitative data to be combined with related macroeconomic and demographic drivers to create market models and forecasts, which can then be refined according to specific competitive, regulatory and demand-related factors
Continuous quality control ensures that our processes and profiles remain focused, accurate and up-to-date

APPENDIX
Global - Apparel Retail 0199 - 2005 - 2009
© Datamonitor. This profile is a licensed product and is not to be photocopied Page 37
Industry associations
International Textile and Apparel Association PO Box 1360, Monument, CO 80132-1360, USA Fax: 001 719 488 3716 http://www.itaaonline.org/
Related Datamonitor research
Industry Profile
Apparel Retail in Europe
Apparel Retail in Asia-Pacific
Apparel Retail in the US
Apparel Retail in China
Apparel Retail in Japan

APPENDIX
Global - Apparel Retail 0199 - 2005 - 2009
© Datamonitor. This profile is a licensed product and is not to be photocopied Page 38
Disclaimer
All Rights Reserved.
No part of this publication may be reproduced, stored in a retrieval system or transmitted in any form by any means, electronic, mechanical, photocopying, recording or otherwise, without the prior permission of the publisher, Datamonitor plc.
The facts of this report are believed to be correct at the time of publication but cannot be guaranteed. Please note that the findings, conclusions and recommendations that Datamonitor delivers will be based on information gathered in good faith from both primary and secondary sources, whose accuracy we are not always in a position to guarantee. As such Datamonitor can accept no liability whatever for actions taken based on any information that may subsequently prove to be incorrect.
ABOUT DATAMONITOR
Global - Apparel Retail 0199 - 2005 - 2009
© Datamonitor. This profile is a licensed product and is not to be photocopied Page 39
ABOUT DATAMONITOR
The Datamonitor Group is a world-leading provider of premium global business information, delivering independent data, analysis and opinion across the Automotive, Consumer Markets, Energy & Utilities, Financial Services, Logistics & Express, Pharmaceutical & Healthcare, Retail, Technology and Telecoms industries.
Combining our industry knowledge and experience, we assist over 6,000 of the world’s leading companies in making better strategic and operational decisions.
Delivered online via our user-friendly web platforms, our market intelligence products and services ensure that you will achieve your desired commercial goals by giving you the insight you need to best respond to your competitive environment.
Premium Reports
Datamonitor's premium reports are based on primary research with industry panels and consumers. We gather information on market segmentation, market growth and pricing, competitors and products. Our experts then interpret this data to produce detailed forecasts and actionable recommendations, helping you create new business opportunities and ideas.
Summary Reports
Our series of company, industry and country profiles complements our premium products, providing top-level information on 30,000 companies, 3,000 industries and 100 countries. While they do not contain the highly detailed breakdowns found in premium reports, profiles give you the most important qualitative and quantitative summary information you need - including predictions and forecasts.
Datamonitor consulting
We hope that the data and analysis in this profile will help you make informed and imaginative business decisions. If you have further requirements, Datamonitor’s consulting team may be able to help you. For more information about Datamonitor’s consulting capabilities, please contact us directly at [email protected].