global automotive industry china consumer confidence survey · all types (millions of ... (most...
TRANSCRIPT
China Consumer Confidence Survey
www.riedelresearch.com
Global Automotive Industry Massive Disruption and Unprecedented Uncertainty - Winners and Losers
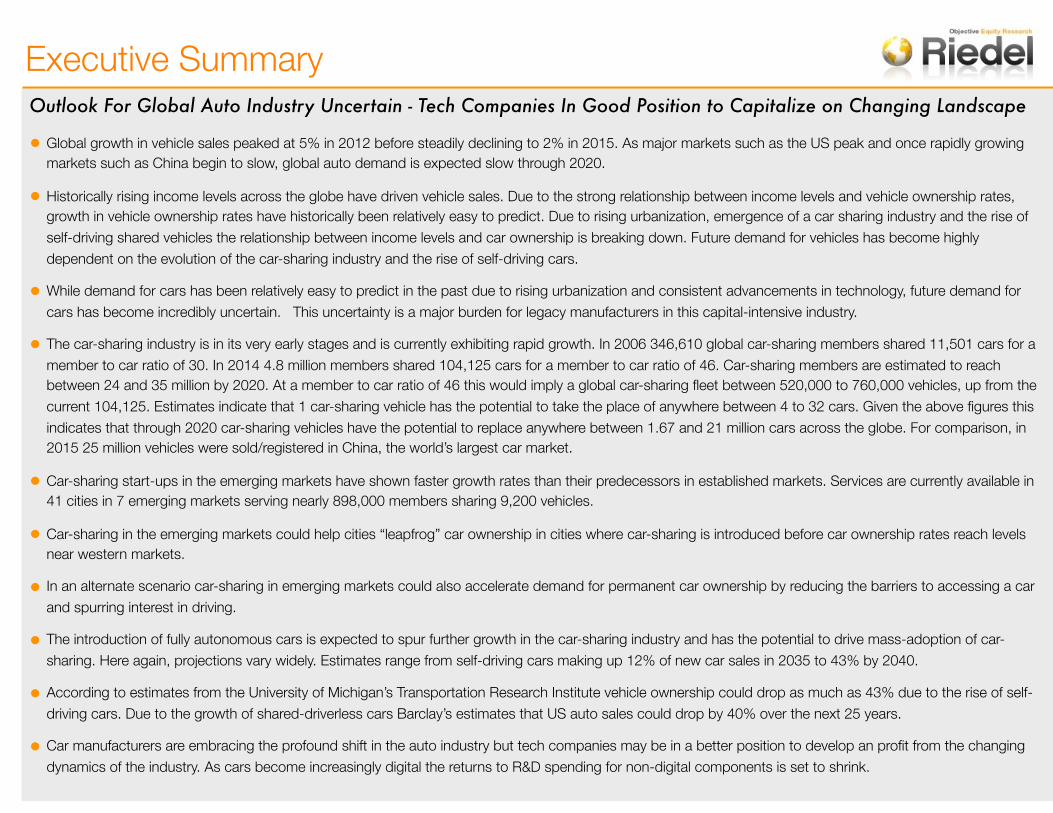
Executive SummaryOutlook For Global Auto Industry Uncertain - Tech Companies In Good Position to Capitalize on Changing Landscape
• Global growth in vehicle sales peaked at 5% in 2012 before steadily declining to 2% in 2015. As major markets such as the US peak and once rapidly growing markets such as China begin to slow, global auto demand is expected slow through 2020.
• Historically rising income levels across the globe have driven vehicle sales. Due to the strong relationship between income levels and vehicle ownership rates, growth in vehicle ownership rates have historically been relatively easy to predict. Due to rising urbanization, emergence of a car sharing industry and the rise of self-driving shared vehicles the relationship between income levels and car ownership is breaking down. Future demand for vehicles has become highly dependent on the evolution of the car-sharing industry and the rise of self-driving cars.
• While demand for cars has been relatively easy to predict in the past due to rising urbanization and consistent advancements in technology, future demand for cars has become incredibly uncertain. This uncertainty is a major burden for legacy manufacturers in this capital-intensive industry.
• The car-sharing industry is in its very early stages and is currently exhibiting rapid growth. In 2006 346,610 global car-sharing members shared 11,501 cars for a member to car ratio of 30. In 2014 4.8 million members shared 104,125 cars for a member to car ratio of 46. Car-sharing members are estimated to reach between 24 and 35 million by 2020. At a member to car ratio of 46 this would imply a global car-sharing fleet between 520,000 to 760,000 vehicles, up from the current 104,125. Estimates indicate that 1 car-sharing vehicle has the potential to take the place of anywhere between 4 to 32 cars. Given the above figures this indicates that through 2020 car-sharing vehicles have the potential to replace anywhere between 1.67 and 21 million cars across the globe. For comparison, in 2015 25 million vehicles were sold/registered in China, the world’s largest car market.
• Car-sharing start-ups in the emerging markets have shown faster growth rates than their predecessors in established markets. Services are currently available in 41 cities in 7 emerging markets serving nearly 898,000 members sharing 9,200 vehicles.
• Car-sharing in the emerging markets could help cities “leapfrog” car ownership in cities where car-sharing is introduced before car ownership rates reach levels near western markets.
• In an alternate scenario car-sharing in emerging markets could also accelerate demand for permanent car ownership by reducing the barriers to accessing a car and spurring interest in driving.
• The introduction of fully autonomous cars is expected to spur further growth in the car-sharing industry and has the potential to drive mass-adoption of car-sharing. Here again, projections vary widely. Estimates range from self-driving cars making up 12% of new car sales in 2035 to 43% by 2040.
• According to estimates from the University of Michigan’s Transportation Research Institute vehicle ownership could drop as much as 43% due to the rise of self-driving cars. Due to the growth of shared-driverless cars Barclay’s estimates that US auto sales could drop by 40% over the next 25 years.
• Car manufacturers are embracing the profound shift in the auto industry but tech companies may be in a better position to develop an profit from the changing dynamics of the industry. As cars become increasingly digital the returns to R&D spending for non-digital components is set to shrink.
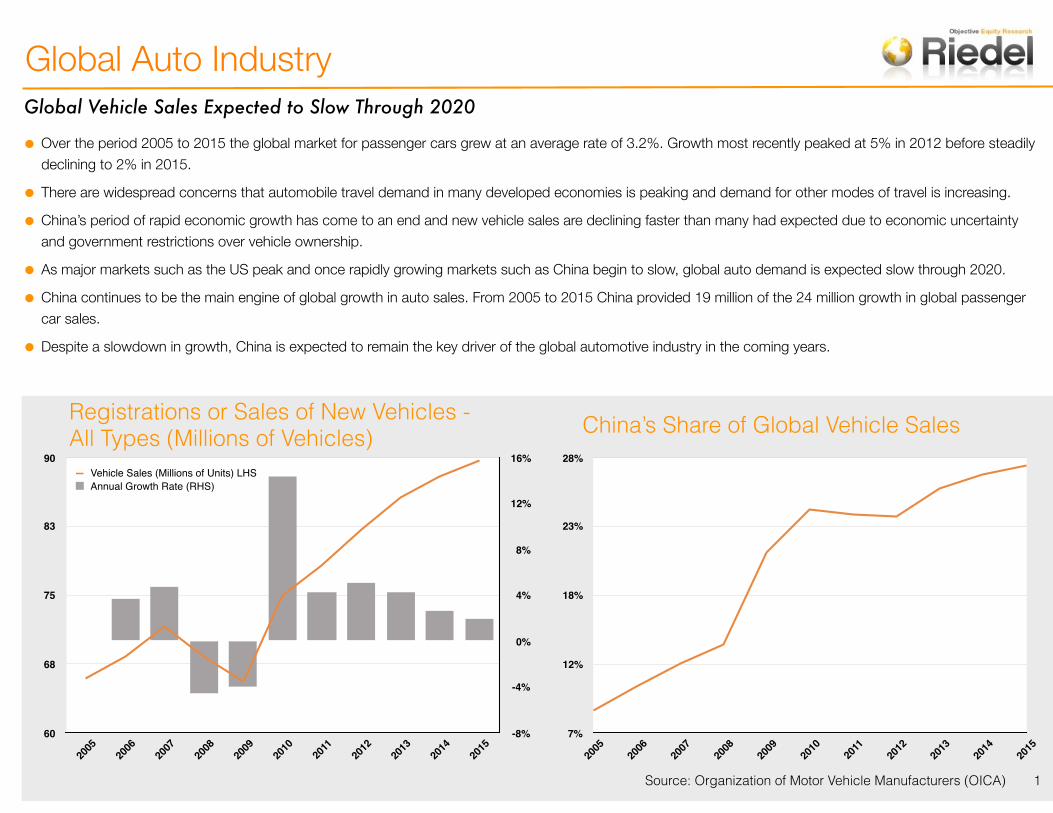
Global Auto IndustryGlobal Vehicle Sales Expected to Slow Through 2020
• Over the period 2005 to 2015 the global market for passenger cars grew at an average rate of 3.2%. Growth most recently peaked at 5% in 2012 before steadily declining to 2% in 2015.
• There are widespread concerns that automobile travel demand in many developed economies is peaking and demand for other modes of travel is increasing.
• China’s period of rapid economic growth has come to an end and new vehicle sales are declining faster than many had expected due to economic uncertainty and government restrictions over vehicle ownership.
• As major markets such as the US peak and once rapidly growing markets such as China begin to slow, global auto demand is expected slow through 2020.
• China continues to be the main engine of global growth in auto sales. From 2005 to 2015 China provided 19 million of the 24 million growth in global passenger car sales.
• Despite a slowdown in growth, China is expected to remain the key driver of the global automotive industry in the coming years.
Registrations or Sales of New Vehicles - All Types (Millions of Vehicles)
7%
12%
18%
23%
28%
2005
2006
2007
2008
2009
2010
2011
2012
2013
2014
2015
China’s Share of Global Vehicle Sales
Source: Organization of Motor Vehicle Manufacturers (OICA) 1
-8%
-4%
0%
4%
8%
12%
16%
60
68
75
83
90
2005
2006
2007
2008
2009
2010
2011
2012
2013
2014
2015
Vehicle Sales (Millions of Units) LHSAnnual Growth Rate (RHS)
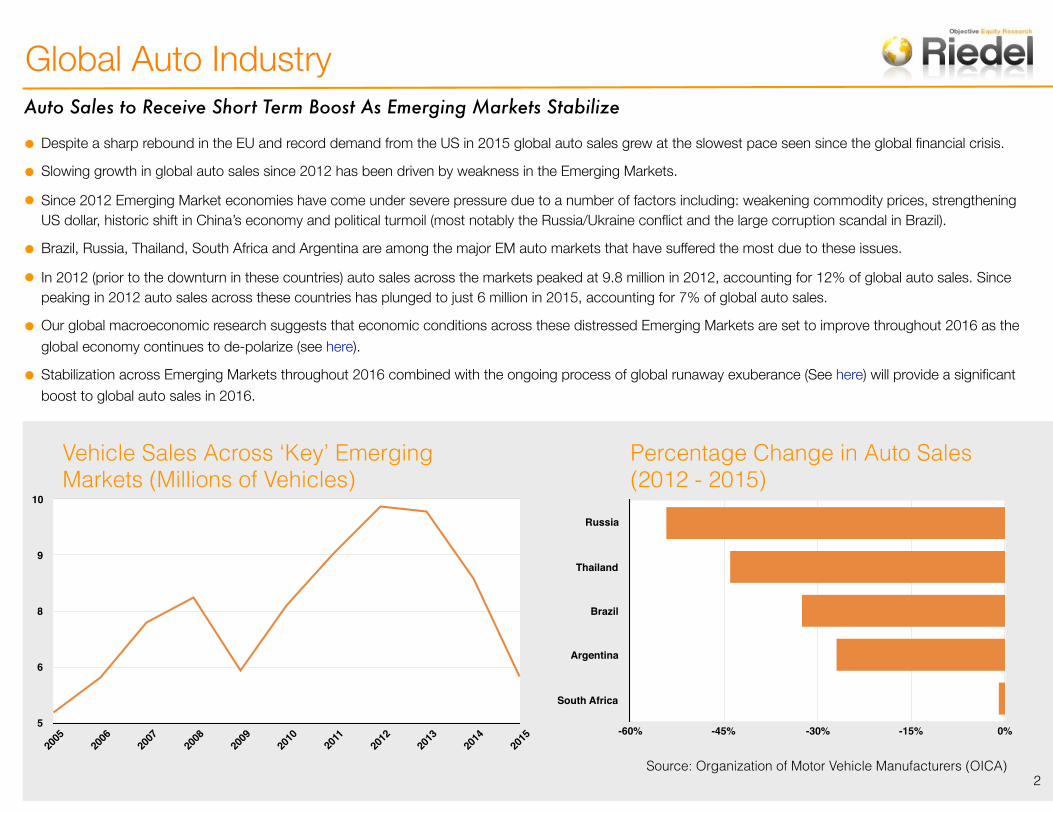
Auto Sales to Receive Short Term Boost As Emerging Markets Stabilize
• Despite a sharp rebound in the EU and record demand from the US in 2015 global auto sales grew at the slowest pace seen since the global financial crisis.
• Slowing growth in global auto sales since 2012 has been driven by weakness in the Emerging Markets.
• Since 2012 Emerging Market economies have come under severe pressure due to a number of factors including: weakening commodity prices, strengthening US dollar, historic shift in China’s economy and political turmoil (most notably the Russia/Ukraine conflict and the large corruption scandal in Brazil).
• Brazil, Russia, Thailand, South Africa and Argentina are among the major EM auto markets that have suffered the most due to these issues.
• In 2012 (prior to the downturn in these countries) auto sales across the markets peaked at 9.8 million in 2012, accounting for 12% of global auto sales. Since peaking in 2012 auto sales across these countries has plunged to just 6 million in 2015, accounting for 7% of global auto sales.
• Our global macroeconomic research suggests that economic conditions across these distressed Emerging Markets are set to improve throughout 2016 as the global economy continues to de-polarize (see here).
• Stabilization across Emerging Markets throughout 2016 combined with the ongoing process of global runaway exuberance (See here) will provide a significant boost to global auto sales in 2016.
Vehicle Sales Across ‘Key’ Emerging Markets (Millions of Vehicles)
Percentage Change in Auto Sales (2012 - 2015)
5
6
8
9
10
2005
2006
2007
2008
2009
2010
2011
2012
2013
2014
2015
Russia
Thailand
Brazil
Argentina
South Africa
-60% -45% -30% -15% 0%
Global Auto Industry
2Source: Organization of Motor Vehicle Manufacturers (OICA)
Rising Income Levels Have Historically Driven Vehicle Sales
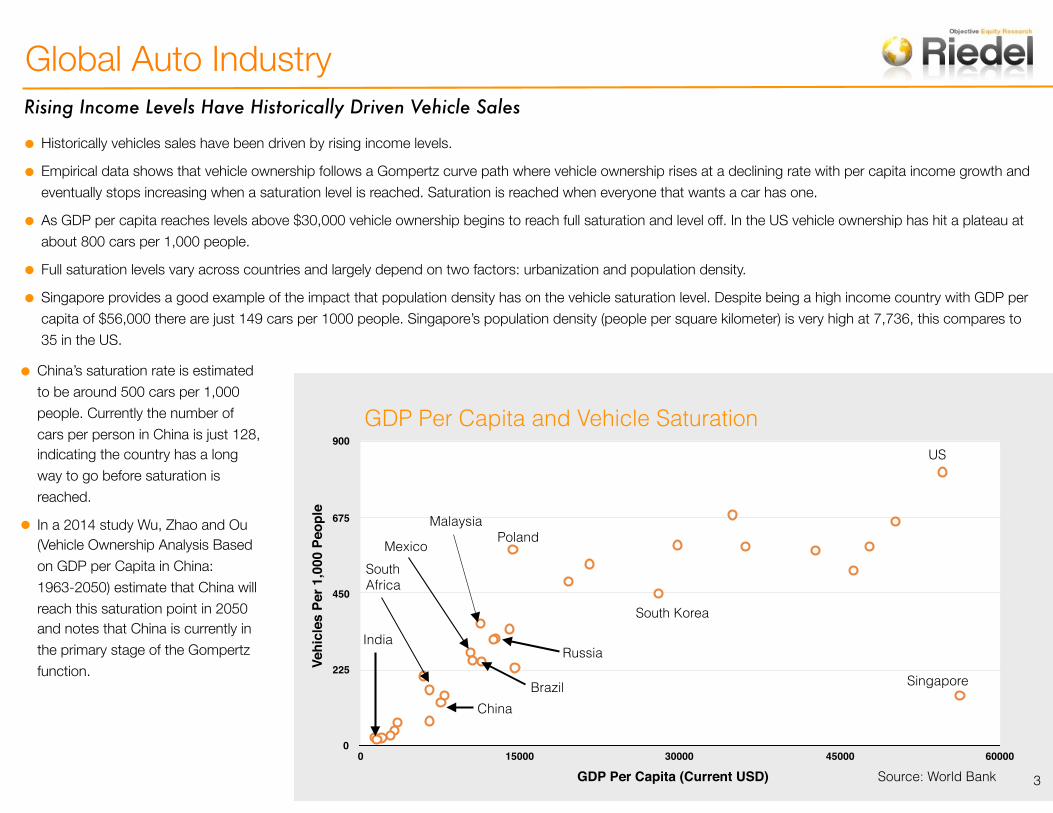
• Historically vehicles sales have been driven by rising income levels.
• Empirical data shows that vehicle ownership follows a Gompertz curve path where vehicle ownership rises at a declining rate with per capita income growth and eventually stops increasing when a saturation level is reached. Saturation is reached when everyone that wants a car has one.
• As GDP per capita reaches levels above $30,000 vehicle ownership begins to reach full saturation and level off. In the US vehicle ownership has hit a plateau at about 800 cars per 1,000 people.
• Full saturation levels vary across countries and largely depend on two factors: urbanization and population density.
• Singapore provides a good example of the impact that population density has on the vehicle saturation level. Despite being a high income country with GDP per capita of $56,000 there are just 149 cars per 1000 people. Singapore’s population density (people per square kilometer) is very high at 7,736, this compares to 35 in the US.
GDP Per Capita and Vehicle Saturation
0
225
450
675
900
0 15000 30000 45000 60000
• China’s saturation rate is estimated to be around 500 cars per 1,000 people. Currently the number of cars per person in China is just 128, indicating the country has a long way to go before saturation is reached.
• In a 2014 study Wu, Zhao and Ou (Vehicle Ownership Analysis Based on GDP per Capita in China: 1963-2050) estimate that China will reach this saturation point in 2050 and notes that China is currently in the primary stage of the Gompertz function. Singapore
US
China
India
South Africa
Brazil
Mexico
Russia
Malaysia
South Korea
Poland
GDP Per Capita (Current USD)
Vehi
cles
Per
1,0
00 P
eopl
e
Global Auto Industry
3Source: World Bank
Future Demand for Cars Uncertain As Relationship Between Income and Car Ownership Breaks Down
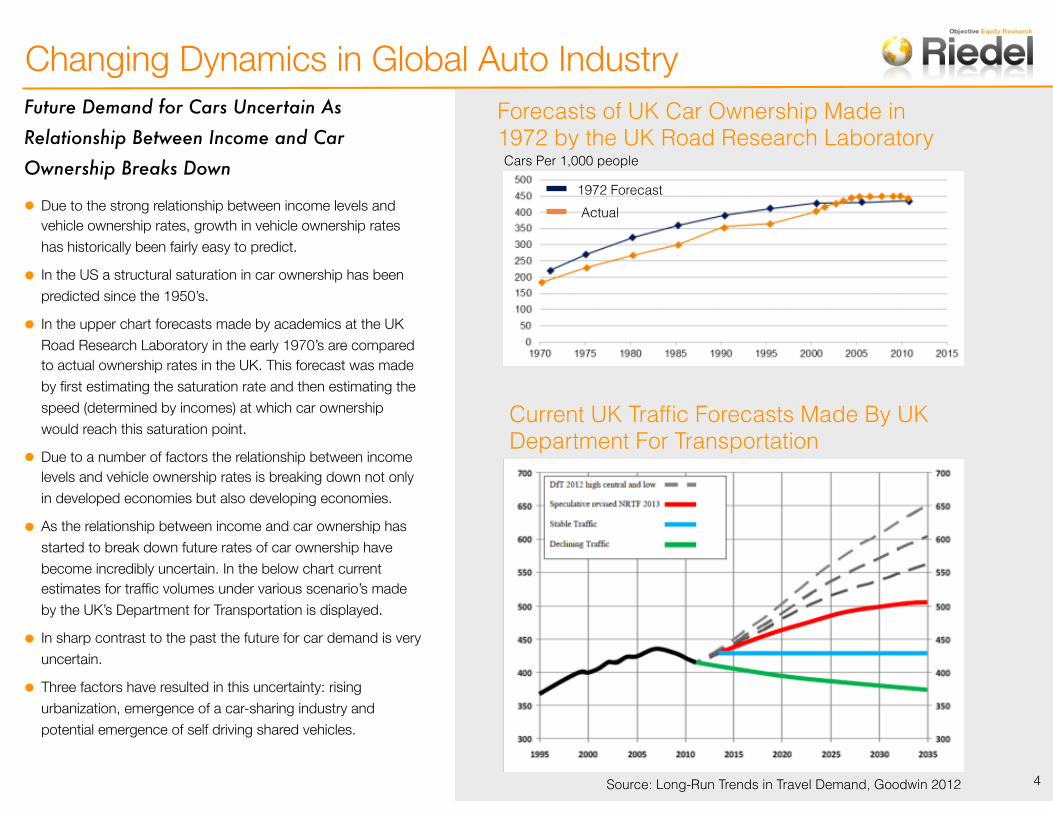
• Due to the strong relationship between income levels and vehicle ownership rates, growth in vehicle ownership rates has historically been fairly easy to predict.
• In the US a structural saturation in car ownership has been predicted since the 1950’s.
• In the upper chart forecasts made by academics at the UK Road Research Laboratory in the early 1970’s are compared to actual ownership rates in the UK. This forecast was made by first estimating the saturation rate and then estimating the speed (determined by incomes) at which car ownership would reach this saturation point.
• Due to a number of factors the relationship between income levels and vehicle ownership rates is breaking down not only in developed economies but also developing economies.
• As the relationship between income and car ownership has started to break down future rates of car ownership have become incredibly uncertain. In the below chart current estimates for traffic volumes under various scenario’s made by the UK’s Department for Transportation is displayed.
• In sharp contrast to the past the future for car demand is very uncertain.
• Three factors have resulted in this uncertainty: rising urbanization, emergence of a car-sharing industry and potential emergence of self driving shared vehicles.
Forecasts of UK Car Ownership Made in 1972 by the UK Road Research Laboratory
1972 ForecastActual
Cars Per 1,000 people
Current UK Traffic Forecasts Made By UK Department For Transportation
Source: Long-Run Trends in Travel Demand, Goodwin 2012
Changing Dynamics in Global Auto Industry
4
Rise in Urbanization Resulting in Declining Vehicle Ownership Rates
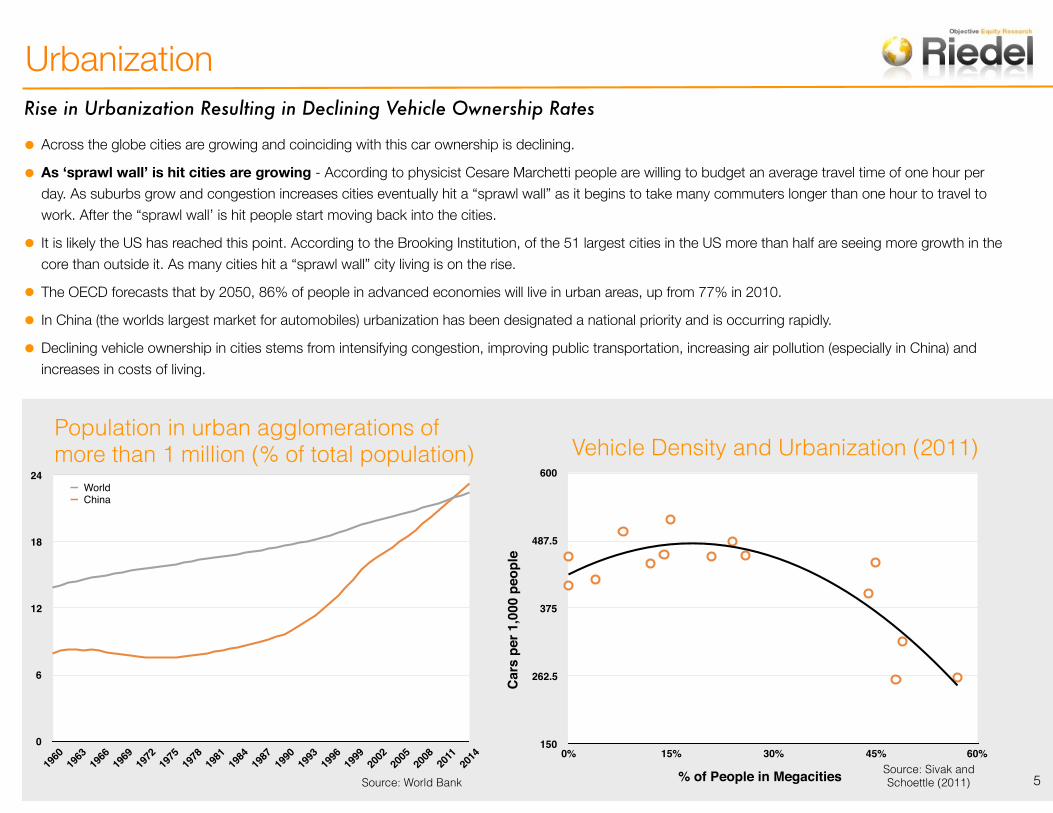
• Across the globe cities are growing and coinciding with this car ownership is declining.
• As ‘sprawl wall’ is hit cities are growing - According to physicist Cesare Marchetti people are willing to budget an average travel time of one hour per day. As suburbs grow and congestion increases cities eventually hit a “sprawl wall” as it begins to take many commuters longer than one hour to travel to work. After the “sprawl wall’ is hit people start moving back into the cities.
• It is likely the US has reached this point. According to the Brooking Institution, of the 51 largest cities in the US more than half are seeing more growth in the core than outside it. As many cities hit a “sprawl wall” city living is on the rise.
• The OECD forecasts that by 2050, 86% of people in advanced economies will live in urban areas, up from 77% in 2010.
• In China (the worlds largest market for automobiles) urbanization has been designated a national priority and is occurring rapidly.
• Declining vehicle ownership in cities stems from intensifying congestion, improving public transportation, increasing air pollution (especially in China) and increases in costs of living.
150
262.5
375
487.5
600
0% 15% 30% 45% 60%
% of People in Megacities
Car
s pe
r 1,0
00 p
eopl
e
Vehicle Density and Urbanization (2011)
0
6
12
18
24
1960
1963
1966
1969
1972
1975
1978
1981
1984
1987
1990
1993
1996
1999
2002
2005
2008
2011
2014
WorldChina
Population in urban agglomerations of more than 1 million (% of total population)
Source: World BankSource: Sivak and Schoettle (2011)
Urbanization
5

Car-Sharing Industry Emerging - Impact On Global Car Sales Incredibly Uncertain
• As urbanization is rapidly progressing, cities are becoming more congested. This development has coincided with the rapid rise of cellphones and car-pooling apps. As this has occurred the concept of car sharing has emerged.
• According to data from UC Berkeley’s Transportation Sustainability Research Center, members of car-sharing services across the globe have increased from 346,000 in 2006 to 4.8 million in 2014 while the number of car sharing vehicles worldwide has grown from 11,501 in 2006 to 104,125 in 2014.
• While the car-sharing industry remains in its early stages, growth of the industry has the potential to significantly reduce overall demand for cars. Estimates indicate that 1 rental car has the potential to take the place of anywhere between 4 to 32 cars.
• Studies in the US and survey’s indicate that between 11 to 26% of car-sharing participants sold a personal vehicle and between 12 to 68% postponed or entirely avoided a car purchase.
• Surveying households as opposed to individuals UC Berkeley’s Transportation and Research Center found that without car-sharing, households in the US owned .47 vehicles per household, after car-sharing households owned .24 vehicles per household. A large part of the drop was due to many households becoming car-less (80% of households owned no vehicle after joining a car-sharing service).
• The Boston Consulting Group estimates that Europe will have 14 million car-sharing members by 2021, 6 million in North America and 15 million in Asia-Pacific. Consulting group Frost & Sullivan forecast 26 million members worldwide of car-sharing services by 2020. Estimates by Roland Berger Strategy Consultants estimate annual growth at 30-35% through 2020, this would put the number of global members between 24 and 29 million.
• Shaheen, Cohen and Roberts (2005) estimate that car-sharing growth potential in major metropolitan regions in North America is 10% of people over the age of 21.The minimum age requirement for most car-sharing services in North America is 21, growth potential could exceed these projections if programs begin to serve those below the age of 21.
• Currently the car-sharing industry is just emerging. The potential impact of the car-sharing industry on demand for personal cars is very uncertain given the wide range of estimates regarding the number of cars 1 rental car might replace.
• McKinsey estimates that annual car sales will pull back to 2% annual growth by 2030, down from 3.6% due to growth in the car-sharing industry.
0
1
3
4
5
2006 2008 2010 2012 2014
4.8
1.81.2
0.70.3
Global Growth in Car-Sharing Members (Millions)
0
27500
55000
82500
110000
2006 2008 2010 2012 2014
104125
4355431967
1940311501
Global Growth in Car-Sharing Vehicles
Estimated to reach between
24 and 35 million by 2020
Emergence of Car-Sharing
6Source: UC Berkeley Transportation
Sustainability Research Center

Car-Sharing Gaining Traction in Emerging Markets - Impact on Demand For Cars in EM Even More Uncertain
• Car-sharing is not specific to developed markets and is already exhibiting rapid growth in developing countries in Asia and Africa including China, Kenya, South Africa, and Zambia.
• Car-sharing services require a dense population in order to be economically viable. The Boston Consulting Group estimates that in cities in Europe and North America populations of at least 500,000 are required to support car-sharing. In Aisa-Pacific this estimate is 5 million due to lower per capita incomes and less developed transportation infrastructure.
• Car-sharing across the emerging markets has grown from 6 operators in 2012 to 22 as of mid-2015. Currently car-sharing services are available in 41 cities in 7 emerging markets serving nearly 898,000 members sharing 9,200 vehicles in countries including Brazil, China, India, Malaysia, Mexico, South Africa and Turkey. Growth has been driven by China and India.
• In a focus group conducted by the World Resource Institute in 2012 about 48% of participants in Hangzhou China said they would consider delaying or forgoing car purchase plans if car-sharing were conveniently available. In Bangalore India this was 30%.
• Car-sharing operations may evolve differently in the emerging markets due to lower labor costs. For example, lower labor costs may facilitate vehicle deliveries to customers and one-way trips.
• Car-sharing start-ups have shown faster growth rates than their predecessors in established markets.
2500
5000
7500
10000
2011 2012 2013 2014 2015
9,200
3,519
1,259260144
Number of Car-Sharing Vehicles in the Emerging Markets
Source: World Resource Institute
• In China car-sharing would be especially attractive as it would work well with China’s initiative to boost new-energy vehicles and could also help ease traffic congestion and pollution. In Europe, car-sharing has been estimated to reduce the average users carbon dioxide emissions by 40-50%.
Potential Scenarios
• Car-sharing in the emerging markets could help cities “leapfrog” car ownership in cities where car-sharing is introduced before car ownership rates reach levels near western markets.
• In an alternate scenario car-sharing in emerging markets could also accelerate demand for permanent car ownership by reducing the barriers to accessing a car and spurring interest in driving.
Car-Sharing in the Emerging Markets
7
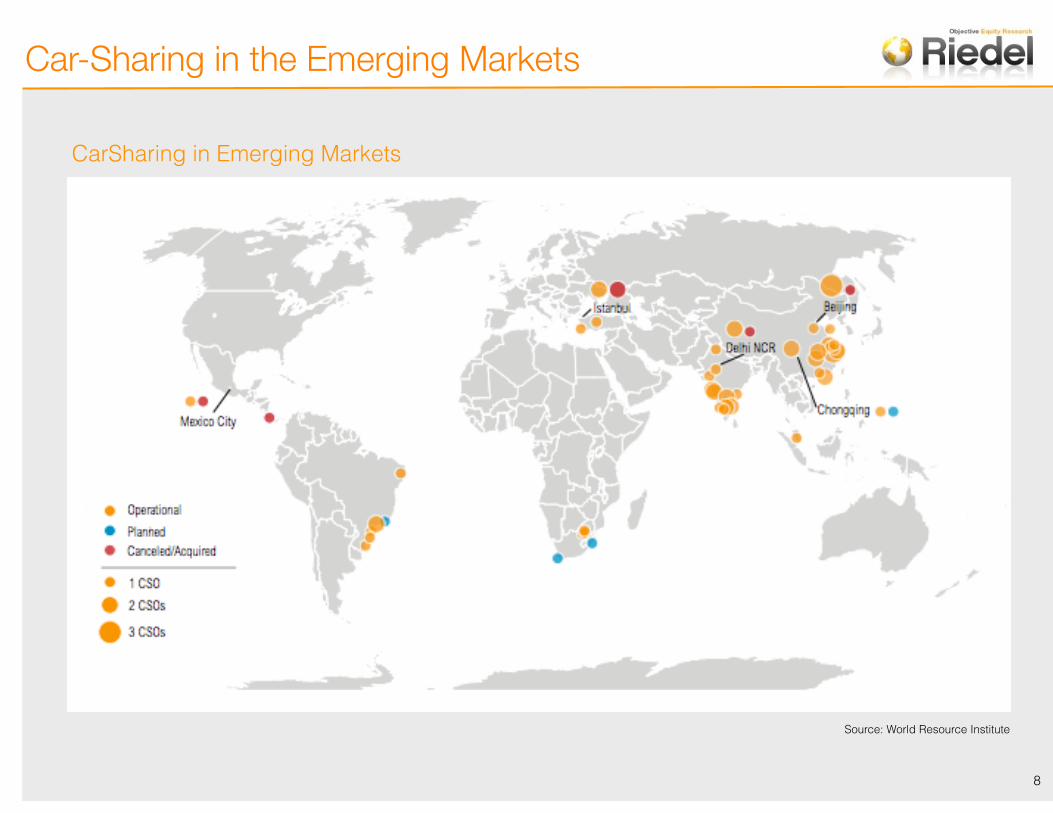
CarSharing in Emerging Markets
Source: World Resource Institute
Car-Sharing in the Emerging Markets
8

Rise of Self Driving Cars Has Potential to Drive Mass Adoption of Car-sharing - Potentially Decimating Car Demand
• Projections for the development and rise of automated, self driving cars vary widely. McKinsey estimates 15 percent of the new cars in 2030 could be fully autonomous, self-driven models. Merril Lynch estimates that by 2040 vehicles like robo-taxis could make up as much as 43% of all sales. The Boston Consulting Group estimates that by 2035 12% of global new car sales may come from robo-taxis and by 2040 this figure is expected to be 23%.
• Cities are already making plans to implement autonomous driving technology.
➡ Japan plans to launch an autonomous taxi system by 2016 with the ultimate goal of commercializing them for the 2020 Tokyo Olympics.
➡ In Europe Citymobil2 (a pilot program for automated transportation systems funded by the EU) is developing automated transportation systems and providing them in cities like Greece, Finland and Switzerland.
➡Cities in Spain, Singapore and California are expected to get driverless shuttles in 2016.
Self-Driving Cars
• The introduction of fully autonomous cars is expected to spur further growth in the car-sharing industry and has the potential to drive mass-adoption of car-sharing. Industry experts expect that once automated vehicles become common, shared automated vehicles will become a major transportation mode.
• The Boston Consulting Group estimates that the cost of conveying one passenger one mile by robo-taxi would be 35% less than doing so by conventional taxi at the average taxi occupancy rate of 1.2 passengers. Robo-taxis would become competitive with mass transit at an occupancy rate of 2 passengers.
• Due to the growth of shared-driverless cars Barclay’s estimates that US auto sales could drop by 40% over the next 25 years.
• Estimates from the University of Michigan Transportation Research Institute are similar, TRI estimates that vehicle ownership could drop as much as 43% due to the rise of self-driving cars. Researches conclude that US households could cut car ownership from the current average of 2.1 to 1.2 with self-driving cars.
Autonomous Vehicle Sales, (% of new car sales and total travel)
The above projections (made by the Victoria Travel Institute) assume that autonomous vehicle implementation will follow the patterns of other vehicle technologies. Based on this assumption the VTI projects that it will take one to three decades to dominate vehicle sales, plus one or two more decades to dominate vehicle travel.
Source: Victoria Travel Institute
9

Who Will Benefit?Car Companies Embracing Shifting Industry - Are Tech Companies Future Car Companies?
• Car manufacturers core business has shifted from selling cars in the 70’s to leasing and financing cars in the late 70’s. Due to the rise of the autonomous car and car-sharing there are now speculations the industry is set to shift to a pay per use model.
• The emergence of driverless cars and car-sharing implies that the automotive fleet will become increasingly owned by businesses who rent cars out to individuals. Businesses make buying decisions much differently than individuals do as they seek to maximize profits. As the car-sharing industry emerges the importance of car branding may decline.
• Car makers will increasingly become service providers as the focus increasingly shifts from physical products to digital services. As cars become increasingly digital the returns to R&D spending for non-digital components will shrink. This will require a shift to new operating models and capabilities and provide opportunities for new players.
• The automobile industry is already moving to embrace the changing dynamics. Ford has recently announced a deal with Zipcar to make their cars more accessible to college students. GM recently announced a $500 million investment in Lyft (a ride-sharing service). Daimler, BMW, and VW have launched their own car-sharing services, and Toyota is partnering with a real-estate developer to offer electric vehicle car-sharing in condominiums in Tokyo.
• Despite the enthusiasm traditional automakers have shown towards the shifting dynamics of the auto industry technology firms may be in a stronger position than carmakers to develop and profit from software required by autonomous vehicles.
• Apple Senior vice president Jeff Williams was quoted stating, “the car is the ultimate mobile device”. Apple’s electric car “Titan” is rumored to have a target ship date for 2019. Google will not build its own car but will partner with suppliers.
• In the table to the right is a comprehensive list of companies exposed to potential growth in the shared driverless car industry.
Name Maket Cap (USD
Billions)
PE EV/EBITDA
Dividend Yield
APPLE 588 11 7 2.0
ALPHABET 255 32 19 0.0
CISCO SYSTEMS 140 14 5 3.7
TEXAS INSTRUMENTS 57 20 10 2.7
BAIDU 51 13 7 0.0
CATERPILLAR 43 21 10 4.2
NOKIA 34 8 9 4.9
TESLA MOTORS 29 NA NA 0.0
NXP SEMICONDUCTORS 28 14 15 0.0
DELPHI AUTOMOTIVE 20 14 13 1.6
INFINEON TECHNOLOGIES 16 21 11 1.6
SKYWORKS SOLUTIONS 15 16 10 1.4
AUTOLIV 10 22 11 2.0
BOSCH 10 51 28 0.3
MOBILEYE 7 149 143 0.0
HARMAN INTL.INDS. 6 18 10 1.7
STMICROELECTRONICS 5 46 9 6.3
AVIS BUDGET GROUP 3 9 5 0.0
TOM TOM 2 107 24 0.0
AKKA TECHNOLOGIES 1 23 12 1.7
Average 21 12 2
Companies Best Positioned To Benefit From Shift to Driverless Shared Vehicles
10