global aviation data management (gadm) management workshop...global aviation data management (gadm)...
TRANSCRIPT

Global Aviation Data Management (GADM)
Jehad FaqirHead of Safety & Flight Operations
IATA- MENA
Safety Management WorkshopKuwait , 25-27 May , 2015
2
“The way forward is to collect data from as many information sources as possible, complemented with the well developed
analytical tools to unlock critical information” Tony Tyler
Global Aviation Data Management
Kuwait,25-27 May 2015Safety Management Workshop
3
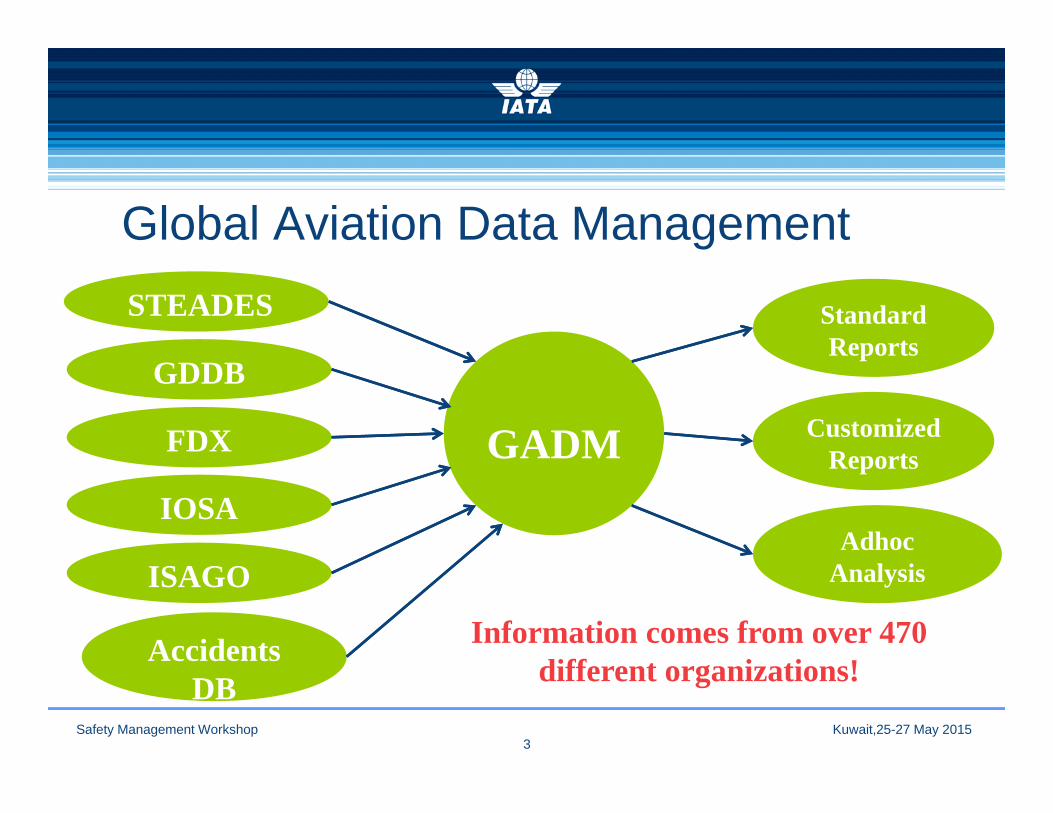
GADM
STEADES
GDDB
FDX
Accidents DB
IOSA
ISAGO
Standard Reports
Customized Reports
Adhoc Analysis
Information comes from over 470 different organizations!
Global Aviation Data Management
Kuwait,25-27 May 2015Safety Management Workshop

4
Safety Trends Evaluation, Analysis & Data Exchange System.
Data is cleaned and collated
STEADES Report: analysis and prevention
strategies
Airline safety office gets pilot
and cabin reports (ASRs, CSRs)
Quarterly, airline submits De-identified
reports
Airline Safety Dept enter & classify reports
Extract available to airlines on web
Query ToolInteractive
Benchmarking
STEADESWorld’s largest safety database!
Kuwait,25-27 May 2015Safety Management Workshop

5
Airport Analysis using STEADES
The analysis was conducted on Air Safety Reports(ASR) held in Evaluation and Data ExchangeSystem (STEADES) database.
The STEADES database is comprised of de-identified safety incident reports from over 175participating airlines,
Annual reporting rate now exceeding 190,000reports per year.
Kuwait,25-27 May 2015Safety Management Workshop

6
Report Distribution (2009 Q1 – 2013 Q4)
OccurrenceGLOBAL
Occurrence RegionMENA
Occurrence Country
OccurrenceAirport
Total Reports 667,871 27,928 ??? ????
Total World Flights
172,619,536 NA
Total STEADES Flights
39,578,359 NA
% of World’s Flights 23% NA
Kuwait,25-27 May 2015Safety Management Workshop

7
Airport Analysis Criteria An Average minimum of 100 reports /year per airport
should be available spanning at least 3 years. Rule of three is respected :Data from at least 3 separate
operators # of Airports in GADM /STEADES: 1,468 # of airports with Average of 100 reports/year: 142 # of airports with Average of 75 reports/year : 165 # of airports with Average of 50 reports/year : 229 Topics of interest based on the scope for IATA airport
operational visits
Kuwait,25-27 May 2015Safety Management Workshop
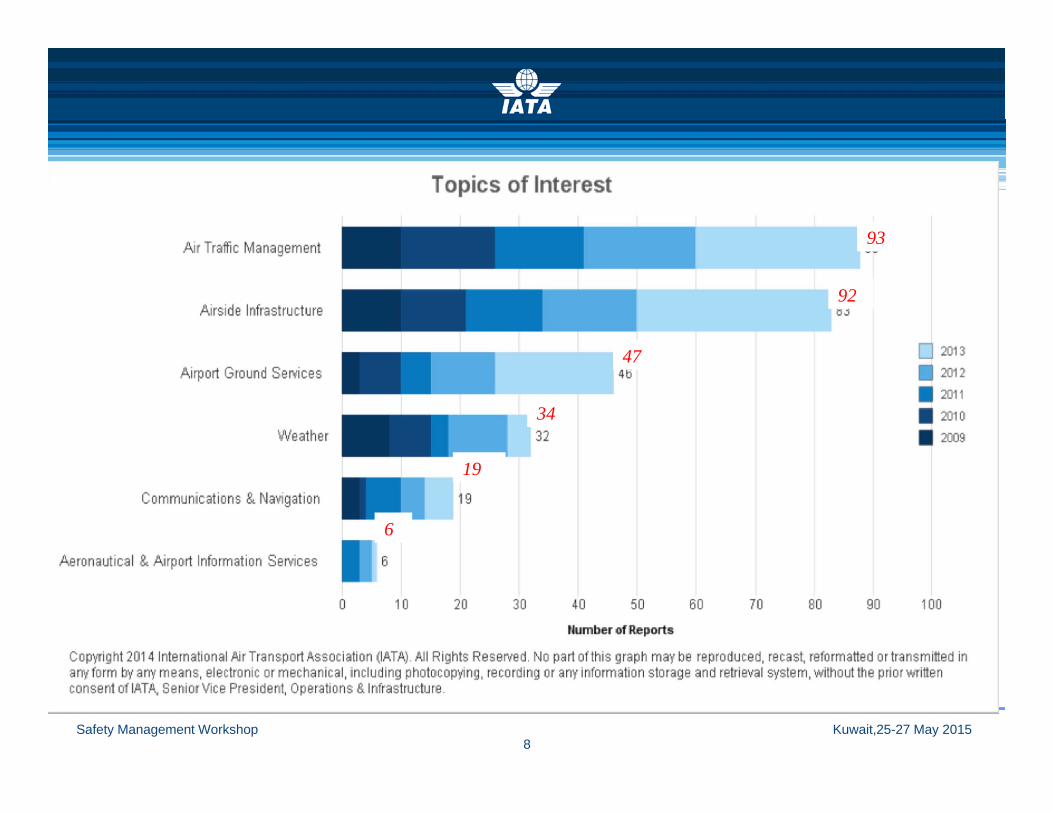
8
93
92
47
34
19
6
Kuwait,25-27 May 2015Safety Management Workshop

9Kuwait,25-27 May 2015Safety Management Workshop

10Kuwait,25-27 May 2015Safety Management Workshop


12
Quarterly data submission by airlines, ground service providers and airports providing ground services Data is de-identified Benefits: Quarterly report & analysis on
ground damage accidents Interactive tool for querying ground
damage accidents
Ground Damage Database (GDDB)
Kuwait,25-27 May 2015Safety Management Workshop

13
some 90,000 take-offs and landingshappen every day in the world
chances are you are facing the same problems as everyone else
Kuwait,25-27 May 2015Safety Management Workshop

14
and if you could…
have a team working on issues you didn’t even know existed
anticipate safety concerns at new airports or new routes
compare your operations against the entire industry
compare global and regional statistics
…would you?Kuwait,25-27 May 2015Safety Management Workshop

15
FL
I G
H
T DA
T A
Kuwait,25-27 May 2015Safety Management Workshop

Raw data from the aircraft is downloaded routinely for
FOQA/FDM/FDA
Data is sent to IATA where it gets processed using a common set of event covering:
Unstable approachesGPWSTailwind on landingTCASHard landingRejected TakeoffGo Around
Data is processed by the airline or its service provider (internal FOQA – IATA doesn’t get any of that information)
Kuwait,25‐27 May 2015Safety Management Workshop 16

De‐Identification Protocol
airline IATAData files are stored and processed usinga pre‐determined random tail number,so that actual aircraft tail number is lostand not stored in the database
During the processing of the data file in theFDM software, the flight number and tailnumber fields are removed and the flightdate parameter is set to the first day of themonth in the RAW binary file level
A new binary file is generated
The original data file that camefrom the airline is permanentlydeleted from IATA’s servers
The de‐identified file is keptfor the purposes of eventvalidation
No other person other than the IATA FDX analysis team can have accessto the database or the de‐identified data file.
The web portal does not contain any information on sectors or airlines.
In addition, the web portal only displays airports with at least 3 airlinesflying into/from them
Globa
l FDX safety data can be
accessed
by th
e airline
through the web
portal
Kuwait,25‐27 May 2015Safety Management Workshop 17
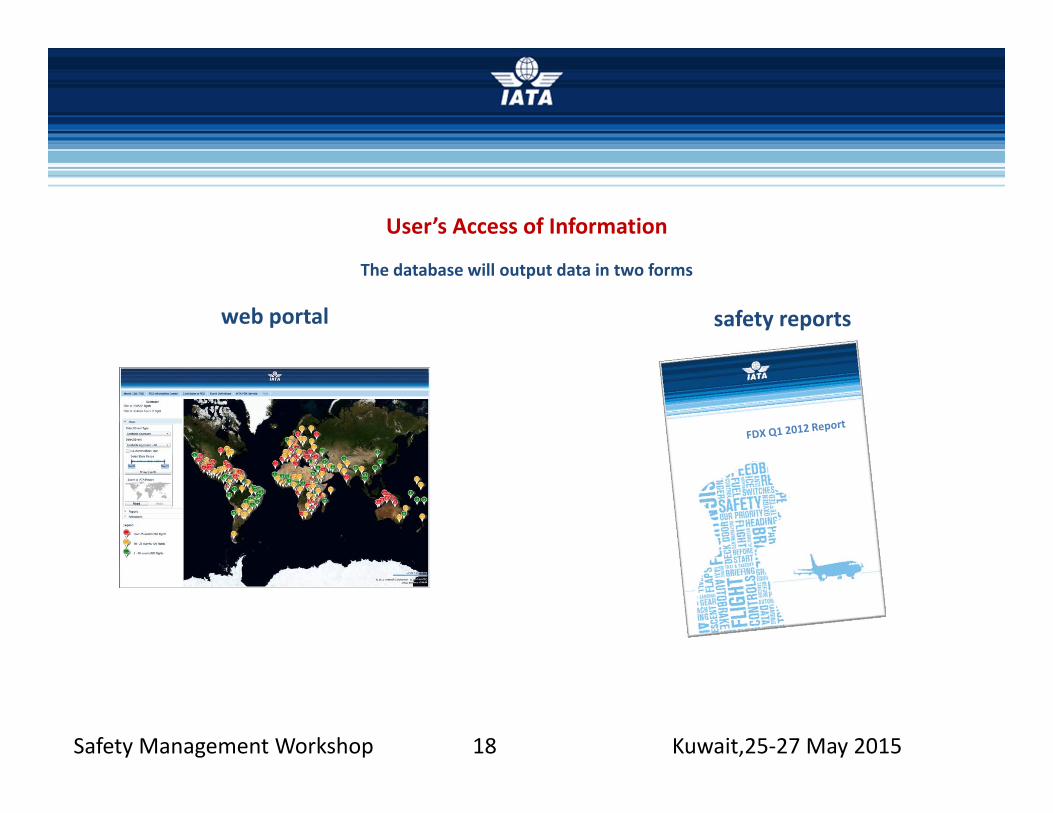
User’s Access of Information
web portal safety reports
The database will output data in two forms
Kuwait,25‐27 May 2015Safety Management Workshop 18
web portal
19 Kuwait,25‐27 May 2015Safety Management Workshop

The web portal shows data against a world map
background which in this example is showing airports with unstable approaches.
The user can only see airports with at least 3 airlines flying
into them.
Kuwait,25‐27 May 2015Safety Management Workshop 20

the numbers & colors indicate the event rate in each airport
Kuwait,25‐27 May 2015Safety Management Workshop 21
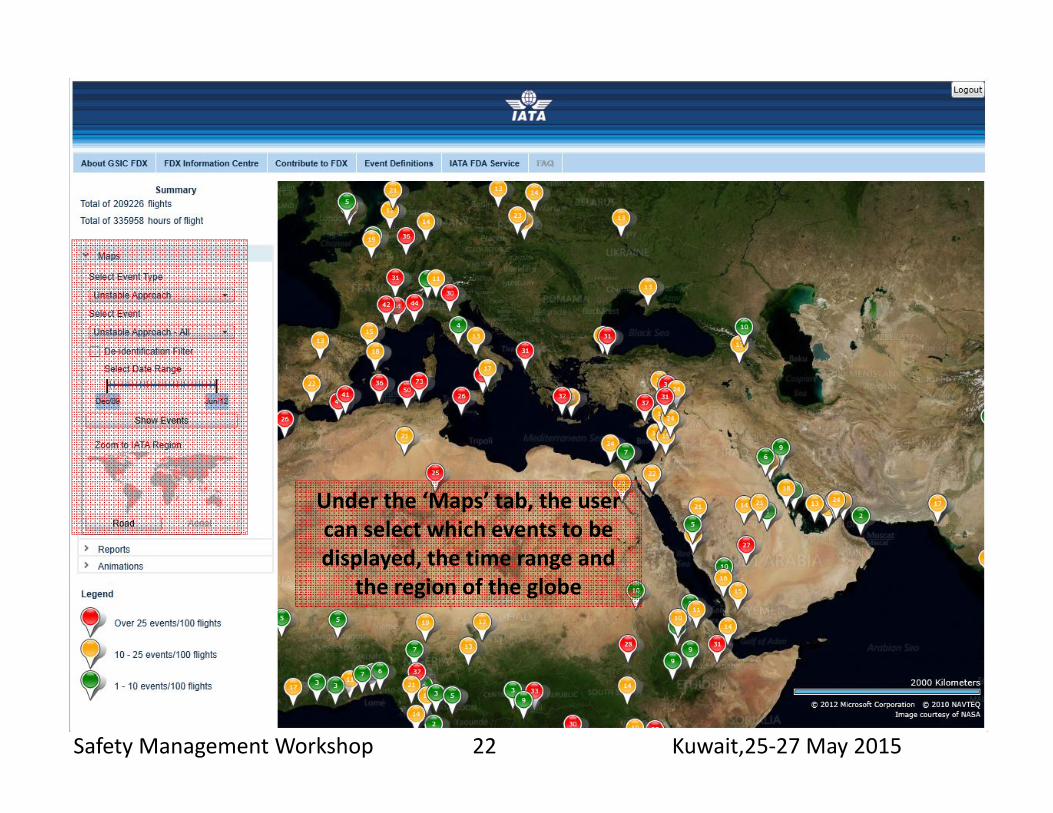
Under the ‘Maps’ tab, the user can select which events to be displayed, the time range and
the region of the globe
Kuwait,25‐27 May 2015Safety Management Workshop 22

EVENT NAME TRIGGERExcessive Glideslope Deviation ‐ Above (1000 – 500 ft) > 1 dot between 1,000 and 500ft AGL
Excessive Glideslope Deviation ‐ Above (Below 500 ft) > 1 dot between 500 and 200ft AGL
Excessive Glideslope Deviation ‐ Below (1000 – 500 ft) < ‐1 dot between 1,000 and 500ft AGL
Excessive Glideslope Deviation ‐ Below (Below 500 ft) < ‐1 dot between 500 and 200ft AGL
Excessive Localizer Deviation (1000 – 500 ft) > 1 dot between 1,000 and 500ft AGL
Excessive Localizer Deviation (Below 500 ft) > 1 dot between 500 and 200ft AGL
High Rate of Descent (1000 – 500 ft) RoD > 1200 ft/min between 1,000 and 500ft AGL
High Rate of Descent Below 500 ft RoD > 1200 ft/min between 1,000 and 0ft AGL
Late Flap Configuration (1000 – 500 ft) Landing flap selected between 1,000 and 500ft AGL
Late Flap Configuration (Below 500 ft) Landing flap selected between 500 and 0ft AGL
Late Gear Configuration (1000 – 500 ft) Landing gear selected between 1,000 and 500ft AGL
Late Gear Configuration (Below 500 ft) Landing gear selected between 500 and 0ft AGL
Low Power on Approach (1000 ‐ 500) Low power between 1,000 and 500ft AGL
Low Power On Approach Below 500 ft Low power between 500 and 0ft AGL
High Speed on Approach (1000 ‐ 500) Vref Deviation > 20kt between 1,000 and 500ft AGL
High Speed on Approach Below 500 ft Vref Deviation > 20kt between 500 and 0ft AGL
Low Speed on Approach (1000 ‐ 500) Vref Deviation < ‐5kt between 1,000 and 500ft AGL
Low Speed on Approach Below 500 ft Vref Deviation < ‐5kt between 500 and 0ft AGL
Excessive Tailwind on Landing Tail Wind > 10kt
Go Around Go Around executed below 3,000ft / 1,000 and 500ft
Hard Landing Vertical Acceleration > 1.8g
Rejected Takeoff RTO executed > 60kt
TCAS RA TCAS RA when available in data frame
TCAS TA TCAS TA when available in data frame
GPWS All GPWS modes when available in data frame
Kuwait,25‐27 May 2015Safety Management Workshop 23
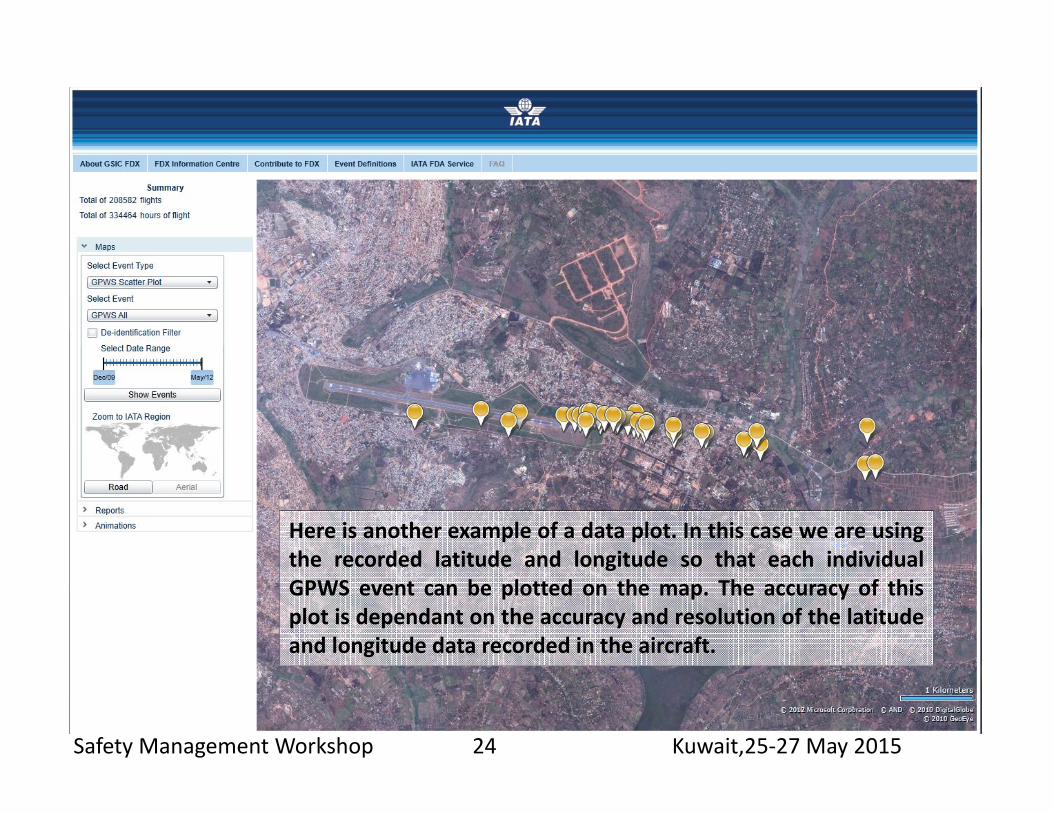
Here is another example of a data plot. In this case we are usingthe recorded latitude and longitude so that each individualGPWS event can be plotted on the map. The accuracy of thisplot is dependant on the accuracy and resolution of the latitudeand longitude data recorded in the aircraft.
Kuwait,25‐27 May 2015Safety Management Workshop 24
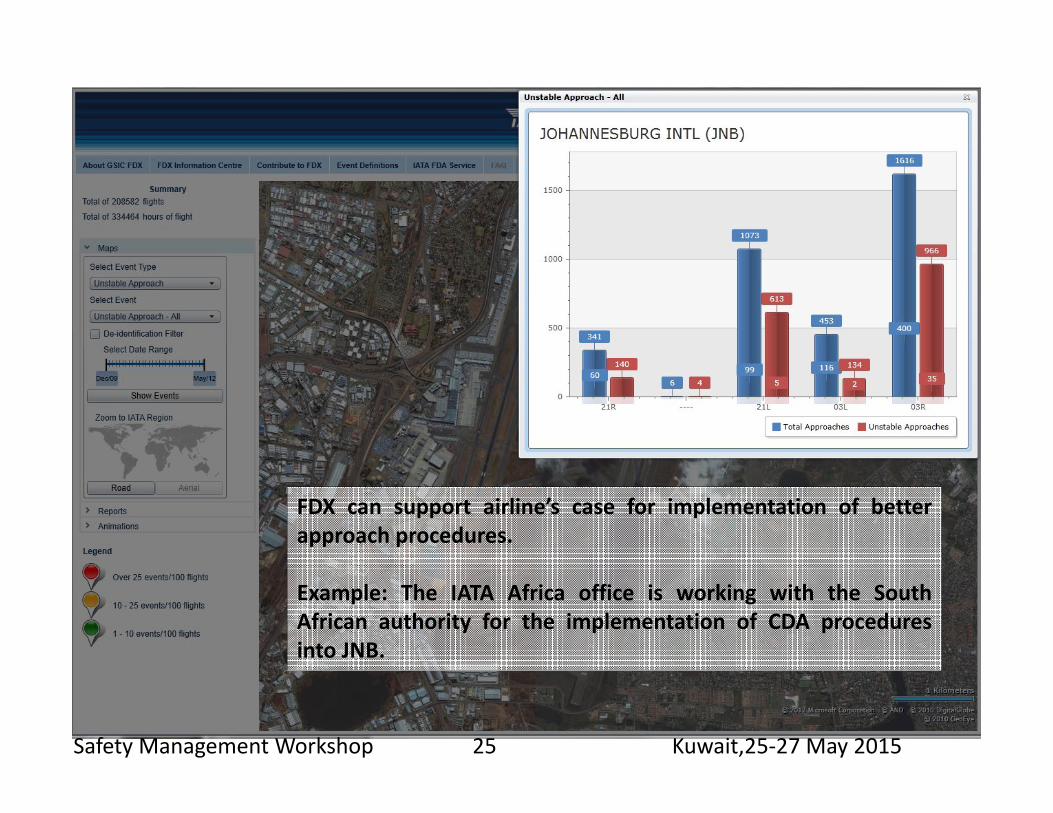
FDX can support airline’s case for implementation of betterapproach procedures.
Example: The IATA Africa office is working with the SouthAfrican authority for the implementation of CDA proceduresinto JNB.
Kuwait,25‐27 May 2015Safety Management Workshop 25

Included in FDX is a Global Animation Archive,where animations will be created during thecourse of the program. Contributing airlinescan share and use these animations fortraining and safety awareness.
Data is always de‐identified.
26 Kuwait,25‐27 May 2015Safety Management Workshop
safety reports
27
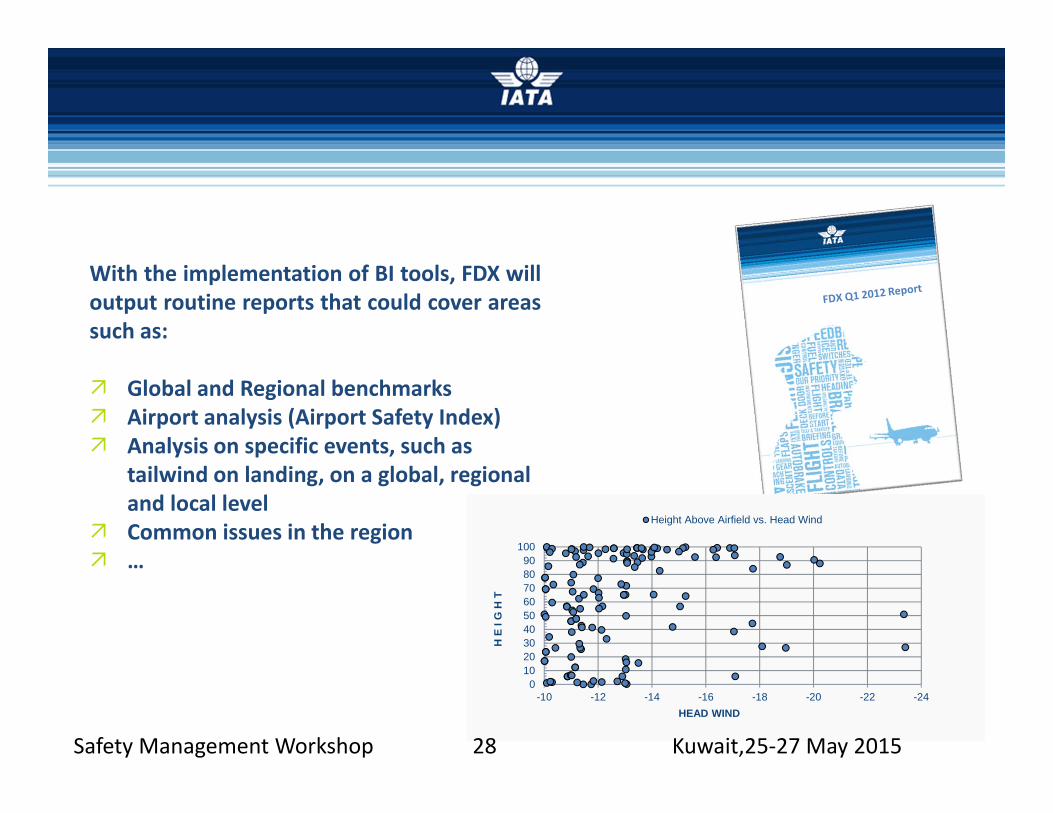
With the implementation of BI tools, FDX willoutput routine reports that could cover areassuch as:
Global and Regional benchmarks Airport analysis (Airport Safety Index) Analysis on specific events, such as
tailwind on landing, on a global, regional and local level
Common issues in the region …
0102030405060708090
100
-24-22-20-18-16-14-12-10
H E
I G
H T
HEAD WIND
Height Above Airfield vs. Head Wind
Kuwait,25‐27 May 2015Safety Management Workshop 28

What’s Next?
Increase Statistical Relevance by having more airlines contributing and committed
Integrated BI Tools for automated generation of trend and risk analysis reports
New events to be monitored (member’s feedback)
Airport/RWY Risk Index (method need to be defined)
Expand Global Animation Archive
Integration with STEADES and other safety programs
Kuwait,25‐27 May 2015Safety Management Workshop 29