global banking and firm financing: a double adverse
TRANSCRIPT

Board of Governors of the Federal Reserve System
International Finance Discussion Papers
Number 1325
August 2021
Global Banking and Firm Financing: A Double Adverse Selection Channel ofInternational Transmission
Leslie Sheng Shen
Please cite this paper as:Shen, Leslie Sheng (2021). “Global Banking and Firm Financing: A Double Ad-verse Selection Channel of International Transmission,” International Finance Discus-sion Papers 1325. Washington: Board of Governors of the Federal Reserve System,https://doi.org/10.17016/IFDP.2021.1325.
NOTE: International Finance Discussion Papers (IFDPs) are preliminary materials circulated to stimu-late discussion and critical comment. The analysis and conclusions set forth are those of the authors anddo not indicate concurrence by other members of the research staff or the Board of Governors. Referencesin publications to the International Finance Discussion Papers Series (other than acknowledgement) shouldbe cleared with the author(s) to protect the tentative character of these papers. Recent IFDPs are availableon the Web at www.federalreserve.gov/pubs/ifdp/. This paper can be downloaded without charge from theSocial Science Research Network electronic library at www.ssrn.com.

Global Banking and Firm Financing: A Double AdverseSelection Channel of International Transmission∗
Leslie Sheng Shen†Federal Reserve Board of Governors
April 2021
Abstract
This paper proposes a “double adverse selection channel” of international transmission.It shows, theoretically and empirically, that financial systems with both global and localbanks exhibit double adverse selection in credit allocation across firms. Global (local)banks have a comparative advantage in extracting information on global (local) risk, andthis double information asymmetry creates a segmented credit market where each banklends to the worst firms in terms of the unobserved risk factor. Given a bank funding (e.g.,monetary policy) shock, double adverse selection affects firm financing at the extensiveand price margins, generating spillover and amplification effects across countries.
∗An earlier draft of the paper was circulated under the title “Global vs. Local Banking: A Double Adverse SelectionProblem.” I am grateful to Pierre-Olivier Gourinchas, Ulrike Malmendier, Yuriy Gorodnichenko and Annette Vissing-Jorgensen for invaluable advice and guidance. I also would like to thank Carlos Avenancio-Leon, Thorsten Beck, SatoshiFukuda, Linda Goldberg, Galina Hale, Rebecca Hellerstein, Sebnem Kalemli-Özcan, Amir Kermani, Ross Levine, RobertMarquez, Ben Moll, Damian Puy, Jonathan Ragan-Kelley, Nick Sander, Neeltje van Horen, Ganesh Viswanath-Natraj,Michael Weber, James Wilcox, and seminar participants at the Federal Reserve Bank of New York, Federal ReserveBoard, George Washington University, London School of Economics, University of Maryland, Santa Clara University,UC Berkeley Economics and Haas, University of British Columbia, University of Pittsburg, the ECB Forum on CentralBanking, CEBRA International Finance and Macroeconomics Meeting, Norges Bank Workshop on Frontier Research inBanking, Emerging Scholars in Banking and Finance Conference, and the annual meeting of the American EconomicsAssociation for helpful comments. Michael Nguyen-mason, Yingjie Wu, Lisa Zhang, and Qin Zhang provided excellentresearch assistance. This work is supported by research funding from the Clausen Center. The views in this paper aresolely the responsibility of the author and should not be interpreted as reflecting the views of the Board of Governorsof the Federal Reserve System or any other person associated with the Federal Reserve System.†Shen: Federal Reserve Board, 20th and C Streets NW, Washington, D.C. 20551 (email: [email protected]).

1 Introduction
How economic and financial shocks transmit across countries is a fundamental question ininternational finance. A growing body of literature has pointed out that global banks—banksthat lend to foreign entities through cross-border loans—play a key role in transmitting shocksabroad.1 Indeed, the past two decades have seen an explosion in cross-border lending by globalbanks: global banking loans have more than tripled since the mid-1990s, reaching almost $15trillion and accounting for around 20% of total domestic private credit for an average developedor major emerging market economy (Appendix Figure B.1). Existing literature mostly studiesthe role of global banks in transmitting shocks by tracing changes in the credit they supplyin response to monetary policy and liquidity shocks.2 In contrast, this paper delves into theeconomic mechanism that explains how global banking credit is allocated across firms in thefirst place, and shows that the underlying mechanism generates a new channel of internationaltransmission.
I propose an information view of credit allocation in financial systems with both globaland local banks. I show, theoretically and empirically, that bank specialization in globalversus local information constitutes a key mechanism driving credit allocation across firmsin such globalized financial systems. Global banks specialize in information on global riskfactors, and local banks specialize in information on local risk factors. This micro-foundationreveals a problem of double adverse selection in credit allocation: each bank type lends to theworst firms in terms of the risk characteristic it does not specialize in. This double adverseselection gives rise to a new channel of international transmission: when one bank is hit witha funding shock (e.g., monetary policy shock), firm financing is affected at both the extensiveand intensive (interest rate) margin, generating spillover and amplification effects throughadverse interest rates—a “double adverse selection channel” of international transmission.
The information view of credit allocation builds on a long-standing literature in bankinghighlighting that the special role of banks derives from their ability to collect and processinformation, which is key in determining bank-firm relationships (Campbell and Kracaw 1980,Diamond 1984, Ramakrishnan et al. 1984, and Boyd and Prescott 1986). I show, however, thatthe traditional theory is not sufficient to explain bank-firm sorting in a globalized financial
1 See, among others, Cetorelli and Goldberg (2012a), Schnabl (2012), De Haas and Lelyveld (2014), Rey(2016), Bräuning and Ivashina (2020), Ongena et al. (2017), Miranda-Agrippino and Rey (2018), Morais et al.(2018),Takáts and Temesvary (2020), and Baskaya et al. (2021).
2 Existing literature shows that, following monetary policy shocks, global banks adjust cross-border flows toother countries through both external capital markets and internal capital markets, increasing the internationalpropagation of domestic liquidity shocks. Morais et al. (2018) find that US and European global banks increasesthe supply of credit to Mexican firms following a softening of monetary policy at home. Cetorelli and Goldberg(2012a) show that global banks actively use internal capital markets to reallocate funds between the head officeand their foreign offices in response to monetary policy shocks.
2

system with both global and local banks. The traditional theory posits that banks and firmssort based on hard and soft information: large banks are more likely to lend to firms withmore readily available hard information, which tend to be large and established firms, whilesmall banks are more likely to establish relationships with firms with more soft information,which tend to be small and young firms. Mapping this theory to the context of bank-firmsorting in globalized financial systems,3 one would conjecture that global banks are more likelyto lend to firms with more hard information, since global banks tend to be larger than localbanks. However, using a detailed bank-firm loan-level dataset spanning across 24 countries,I find that both global and local banks lend to firms across the entire asset size and agedistribution. This finding points to a puzzle in the mechanism driving the allocation of globalbanking credit across firms: why do firms of similar size and age borrow from different typesof banks?4
In light of this puzzle, I raise a new perspective. I conjecture that global and local banksdiffer in their specialization in global and local information: global banks have a comparativeadvantage in extracting information on global risk factors, and local banks have a comparativeadvantage in extracting information on local risk factors. Each bank type’s comparativeinformational advantage plays a key role in determining bank-firm sorting in financial systemswith both bank types. This idea is motivated by the observation that global banks are uniquelypositioned to extract information on global factors through global market making activitiesand research efforts within the banking organizations.5 At the same time, local banks aremore conveniently positioned to extract information on local factors through local lendingrelationships (Petersen and Rajan 1994, Berger et al. 2005).
To analyze and test the conjecture, I first develop a model to formalize the new perspectiveand derive empirical predictions. I specifically focus on the prediction for bank-firm sortingin globalized financial systems and the implication for international transmission of bankfunding shocks. I then test the model predictions using detailed cross-country loan-level dataand empirical strategies that tightly maps to the model set-up.
The model features an economy comprised of global and local banks, and firms that havereturns dependent on global and local risk factors. The key ingredient of the model is eachbank type’s comparative informational advantage: global banks have the technology to extract
3 Globalized financial systems here refer to markets comprised of global and local banks as well as firmswith access to both banks, which tend to be firms above a certain size threshold.
4 Another mechanism we may conjecture driving the sorting may be bank specialization in loans of par-ticular currency denominations. I provide evidence in Section 2 showing that, in fact, global and local bankslend in both local and non-local currencies.
5 For instance, global banks heavily recruit PhD economists to work in their macro research departments.See past and current job listings from global banks such as Citi, JP Morgan, and Goldman Sachs on theAmerican Economic Association’s Job Openings for Economists site: https://www.aeaweb.org/joe/listings.
3

information on global factors but not local factors, and vice versa for local banks. This doubleinformation asymmetry is common knowledge and thereby incorporated in both the banks’loan contract pricing and the firms’ selection of lenders. Each bank prices loans based on thecomponent of firm return it observes, as well as its expectation of the component of returnit does not observe for the subset of firms that selects the respective bank. Each bank typeholds Nash-type conjectures about the other bank type’s loan pricing and plays best responsestrategies. The equilibrium features a fixed-point solution where each bank offers the bestrate to the firms that select into that bank.
The model generates a sharp prediction about credit allocation across firms: firms withhigher expected return based on global factors relative to local factors are more likely toborrow from global banks, and vice versa for firms with returns more dependent on localfactors. This allocation reveals a problem of double adverse selection: both global and localbanks are adversely selected against by the firms, as firms select into borrowing from thebank which observes the more favorable component of their returns. In other words, eachbank lends to the worst firms in terms of the unobserved characteristic.
I further demonstrate that the double adverse selection problem generates a double ad-verse selection channel of international transmission through which bank funding shocks aretransmitted to foreign (and domestic) firm financing. When one of the banks is hit with afunding (e.g., monetary policy) shock, the double adverse selection affects credit allocationat both the extensive and intensive margins, generating spillover and amplification effectsthrough adverse interest rates.
Specifically, suppose global banks face a decrease in funding cost due to expansionarymonetary policy in the home country of the global banks. At the extensive margin, the modelpredicts that firms with relatively balanced global and local risk exposure components are morelikely to switch into contracting with global banks. The result is driven by double adverseselection: since the firms with relatively balanced global and local risk exposure receive themost adverse interest rates relative to the first-best outcome, they are more likely to switchlenders given any changes in the credit market. These marginal firms that switch away fromlocal banks into global banks are less risky than the infra-marginal firms that continue toborrow from either the local banks or the global banks.
At the intensive margin, the model predicts that i) the interest rates of the infra-marginalfirms that remain with the local banks are expected to increase (i.e., a spillover effect), and ii)the interest rates of the infra-marginal firms that remain with the global banks are expected todecrease by more than the direct effect caused by the funding cost change (i.e., an amplificationeffect). The spillover effect on the infra-marginal firms that continue to borrow from localbanks is solely driven by an exacerbation of the adverse selection problem. Since the marginal
4

firms that switch away from local banks are less risky than the infra-marginal firms, local banksare left with a riskier pool of firms, which induces the banks to increase interest rates, despiteno changes to their funding cost. On the other hand, the impact of the funding cost shock ispositively amplified for infra-marginal firms that continue to borrow from global banks becausethe marginal firms that switch into global banks are less risky than these infra-marginal firms,which alleviates the adverse selection problem for the global banks.
Next, I formally test the two model predictions on bank-firm sorting and internationaltransmission of bank funding shock, using data on global syndicated corporate loans fromDealscan hand-matched with international firm-level databases including Amadeus, Orbis,Compustat, and Compustat Global. I categorize the lead bank on each loan into global banksand local banks. The resulting sample includes 115,166 loans, borrowed by 12,979 firms across24 countries, over the period 2004-2017. This cross-country bank-firm loan-level dataset isuniquely appropriate for this study because it captures a significant portion of cross-borderlending that other loan datasets such as credit registry data would not capture.
To test the model prediction on bank-firm sorting, I construct measures for each firm’sglobal and local risk exposure that tightly maps to the model set-up. The empirical analysisreveals a stark pattern of bank-firm sorting: as predicted by the model, global banks lendmore to firms with higher exposure to global risk relative to local risk, and vice versa forlocal banks. To make this result more concrete, consider two firms: Oil States International,an American multinational corporation that provides services to oil and gas companies, andZale Corporation, an American jewelry retailer that has a large presence in malls aroundthe US. While both firms are public firms, headquartered in Texas, and of similar size (withtotal assets around $1.3 billion in 2017), Oil States International’s return is more dependenton global risk factors, since, as a multinational firm in the petroleum industry, it is highlyexposed to global demand and supply shocks. On the other hand, Zale Corporation’s return ismore exposed on local risk factors, since its main sources of sales revenue are local customers.The model predicts that on average, Oil States International is more likely to borrow fromglobal banks, while Zale Corporation is more likely to borrow from local banks. The dataconfirms this prediction: banks that lend to Oil States International are mostly global banks,including Bank of Nova Scotia, Credit Suisse, and Royal Bank of Canada, while mostly localbanks such as Bank of Boston, First Republic Bank Dallas, and Rhode Island Hospital TrustNational Bank lend to Zale Corporation.
To test the model predictions of how funding shocks to banks affect credit allocation, I takethe Euro area as an empirical laboratory and analyze how US and Euro area monetary policyshocks affect credit allocation across firms in the Euro area, through US and Euro area banks.To identify exogenous shocks to US and Euro area monetary policy, I use high-frequency
5

data on Federal Funds futures and Euribor futures. I find that an expansionary shock to USmonetary policy induces firms in the Euro area with relatively balanced global and local riskcomponents to switch their borrowing from Euro area banks to US banks, conditional on Euroarea monetary policy. The analogue applies to an expansionary shock to Euro area monetarypolicy.
Furthermore, I find that, conditional on Euro area (US) monetary policy and given ex-pansionary US (Euro area) monetary policy, the interest rates of the infra-marginal firmsthat continue to borrow from Euro area (US) banks increase, reflecting a spillover effect. Atthe same time, the interest rate spreads of the infra-marginal firms that continue to borrowfrom US (Euro area) banks decrease, reflecting an amplification effect. The results are con-sistent with the model prediction on the effects of bank funding shocks on credit allocationat both the extensive and intensive margins, revealing a double adverse selection channel ofinternational transmission.
This channel not only sheds new light on how global banks propagate the transmission ofshocks but also clarifies an existing view on this issue, namely the “international risk-takingchannel” of monetary policy transmission.6 The new channel reveals that the empirical resultswhich the existing literature (e.g., Morais et al. 2018) points to as evidence for risk-takingbehavior by global banks could be confounded with a force generated by the adverse selectionproblem, namely, substitution between global banking credit and local banking credit.
Related Literature This paper contributes to three broad strands of literature. First, itcontributes to the literature on the role of financial intermediaries in the transmission andamplification of shocks in the international context. While a long strand of work has studiesthe credit channel of monetary policy transmission (see e.g., Bernanke and Blinder 1992,Bernanke and Gertler 1995, and Kashyap and Stein 2000), there have been less work on thecredit channel in the international dimension until the global financial crisis. Since then, globalbanks emerged as a key channel for international transmission of liquidity conditions andmonetary policy, sparking both theoretical and empirical research. On the theoretical front,several recent papers have introduced models with global banks for studying internationaltransmission, including Dedola et al. (2013), De Blas and Russ (2013), Niepmann (2015),Bruno and Shin (2015b), and Aoki et al. (2016). While these models solely focus on emergenceand implications of one type of bank,7 this paper points out that the competitive interaction
6 The international risk-taking channel of monetary policy transmission is based on the view that lowmonetary policy rates and QE in developed economies could induce banks to lend to riskier firms abroad(Bruno and Shin 2015a, Coimbra and Rey 2017, and Morais et al. 2018).
7 In the framework in Bruno and Shin (2015b), there are both global and local banks. But local bankssimply act as a conduit that intermediates funds from global banks to firms, which essentially make only onetype of bank active in the economy.
6

between global and local banks plays an important role for international transmission. Onthe empirical front, a growing literature uses bank-level and loan-level data to trace out thechannels through which global banking affects domestic bank lending, including Cetorelli andGoldberg (2012b), Popov and Udell (2012), Schnabl (2012), De Haas and Lelyveld (2014),Ivashina et al. (2015), and Baskaya et al. (2021). This paper contributes to this line of workby pointing out a new channel of international transmission through global banks—the doubleadverse selection channel of international transmission.
Moreover, this channel is new to the literature on international transmission of monetarypolicy. Recent papers by Rey (2016) and Miranda-Agrippino and Rey (2018) provide evidenceof large spillovers of US monetary policy on credit creation around the world, suggestingglobal banks as the main source for transmission. Existing work has pointed to currencymismatches on global banks’ balance sheets (Ongena et al. 2017, Bräuning and Ivashina 2018,Bräuning and Ivashina 2020) and internal capital markets within global banks (Cetorelli andGoldberg 2012a) as channels of international monetary policy transmission. In addition,low international monetary policy rates and expansive quantitative easing in large developedeconomies over the past decade have prompted debates on the extent of a bank risk-takingchannel of monetary policy transmission, as explained in Borio and Zhu (2012), Bruno andShin (2015a), and Coimbra and Rey (2017). Morais et al. (2018), using bank-firm loandata, show that low monetary policy rates and QE in developed economies led global banksto increase credit supply to firms in Mexico, especially firms with higher-than-average ex-ante loan rates. They consider this to be evidence of bank risk-taking. Contrary to theirexplanation, I show that the force driving increased credit supply to riskier firms could besubstitution between global banking credit and local banking credit, raising adverse selectionas a new channel of international transmission of monetary policy.
Second, this paper contributes to the literature in banking. The new perspective I proposebuilds on the traditional information view of banking from classic papers by Campbell andKracaw (1980), Diamond (1984), Ramakrishnan et al. (1984), and Boyd and Prescott (1986).Through this lens, a subsequent strand of literature argues that different banks specialize inhard versus soft information, and lend to different types of firms as a result (Petersen andRajan 1994, Stein 2002, Berger et al. 2005, and Liberti and Petersen 2018). I provide evidenceshowing that hard versus soft information is insufficient for explaining bank-firm sorting inglobalized banking systems, and propose an alternative dimension of bank specialization.8
In the context of cross-border banking specifically, this paper is related to the strand ofbanking literature that studies the effects of foreign bank entry on credit access. The frame-work developed in this paper builds on the work by Dell’Ariccia and Marquez (2004), Sengupta
8 Section 2 describes the traditional theory and the relevant empirical tests in detail.
7

(2007), Detragiache et al. (2008), and Gormley (2014), which emphasize the importance of(imperfect) information in shaping competition and credit allocation in economies with bothlocal banks and foreign banks. The focus of that line of studies is foreign bank entry intolow-income countries, where overall information asymmetries may be large. Local banks areconsidered to have an informational advantage over the foreign banks, which, as a result, areable to target only the largest or the least informationally opaque firms. In contrast, thefocus of this paper is cross-border lending by global banks in developed economies, where themajority of global banking activity occurs. What sets this paper apart is the new perspectiveon how banks’ comparative advantage in different types of information, or global and localinformation specifically, can affect credit allocation.9 While the existing models predict thatthe smaller, more informationally opaque firms are more likely to borrow from local banks10,the framework in this paper predicts that some large and informationally transparent firmsare still likely to borrow from local banks, as long as their returns are more dependent onlocal risk factors.11
Third, this paper adds to the work on the role of information frictions in internationalcapital and credit markets. Papers have pointed out information friction as an importantmechanism in driving international capital flows (Martin and Taddei 2013) and determiningexchange rates (Bacchetta and Van Wincoop 2006). Albuquerque et al. (2009) specificallyhighlight the role of global information in international equity markets, showing that it helpsexplain U.S. investors’ trading behavior and performance. To the best of my knowledge, thisis the first paper that studies the role of global information in international banking.
The rest of this paper is structured as follows. Section 2 reviews the traditional theory andpresents a new puzzle on bank-firm sorting in globalized credit markets. Section 3 presentsa model of global and local banking. Section 4 applies the framework to analyze bank-firmsorting and international transmission of bank funding shocks. Section 5 outlines the empiricalpredictions and describes the data used for empirical testing. Section 6 presents the empirical
9 The key ingredient incorporated in my model to formalize the idea of banks’ differing specializationin global versus local information, double asymmetric information, and the ensuing result of double adverseselection, is new to the line of research in contract theory on adverse selection in credit markets, starting withthe classic papers such as Stiglitz and Weiss (1981) and De Meza and Webb (1987).
10 Papers including Berger et al. (2001), Clarke et al. (2005), Mian (2006), and Gormley (2010) provideempirical evidence in support of this prediction, though the empirical settings studied in these papers are alllow-income economies.
11 Detragiache et al. (2008), Beck and Peria (2010) and Gormley (2014) also explore the impact of foreignbanking on overall credit access, relating it to debates on the benefits and costs of financial openness. Theyargue that foreign banking entry undermines overall access to credit since it worsens the credit pool left tolocal banks, gives rise to adverse selection, and thereby lowers overall financial development. While my modelalso points to the possibility of a decline in aggregate credit due to adverse selection, I show that access toglobal banking credit actually leads to a more efficient credit allocation in the financial system. This is in linewith papers which argue that the benefits of financial openness outweigh the costs, such as Levine (1996),Claessens et al. (2001), Edison et al. (2002), Claessens (2006), and Beck et al. (2007).
8

analysis on bank-firm sorting. Section 7 presents the empirical analysis on the effects ofmonetary policy shocks on credit allocation across foreign and domestic firms. Section 8concludes. Proofs are relegated to APPENDIX A.
2 Traditional Theory and New Perspective
In this section, I review the traditional theory on bank-firm sorting and test whether it predictsthe patterns of bank-firm sorting in globalized credit markets—markets comprised of globaland local banks as well as firms with access to both banks.
Classic banking theory argues that banks exist because of their unique ability to collect andprocess information. Based on this view, a long strand of literature in banking and corporatefinance has used the distinction between hard and soft information to explain how banksand firms establish relationships (see, e.g., Petersen and Rajan 1994, Stein 2002, Petersenand Rajan 2002, and Liberti and Petersen 2018). Hard information is information that isquantifiable, independent of its collection process, and easy to transmit in impersonal ways.Soft information is information that is not easily quantifiable, dependent on its collectionprocess, and requires context-specific knowledge to fully understand. Theories based on thisview conjecture that large banks are more likely to lend to firms with more readily availablehard information, while small banks are more likely to establish relationships with firms withmore soft information.
As a first step to understand patterns of bank-firm sorting in globalized credit markets,I test whether the sorting patterns between firms and global versus local banks bear out thepredictions of the traditional banking theory. Since global banks tend to be larger, I testwhether global banks are more likely to lend to firms with more hard information, and localbanks are more likely to lend to firms with more soft information, using a bank-firm loan-leveldataset that spans across 24 countries and covers the period 2004-2017.12 For measures ofhard and soft information, I follow the empirical literature (e.g., Berger et al. 2005 and Mian2006), which often uses firm asset size and firm age to proxy for hard information.
I sort firms into quartiles based on the distribution of firm asset size and firm age in eachyear in each country, and then calculate the proportion of loans given by global banks andlocal banks in each quartile. Figure 1 plots the distribution of lending from global and localbanks over the entire sample. The plot shows that both global banks and local banks lend tofirms of all sizes and ages, revealing that the traditional theory does not predict the patternof bank-firm sorting in financial systems with both global and local banks.
I further test whether the differences between global and local banks illustrated in Figure12 See Section 5.2 of the paper for a detailed discussion of the data and data-cleaning procedure.
9

Figure 1: Bank-Firm Sorting, by Firm Size and Age Quartile
0.2
.4.6
.81
1 2 3 4
Firm Asset Size
0.2
.4.6
.81
1 2 3 4
Firm Age
Global Bank Local Bank
Notes. The plot shows sorting patterns between firms and global versus local banks, with firms sorted intoquartiles by asset size and age. The data sample consists of syndicated loans between global and local banksand firms across 24 countries from 2004-2017. Source: Dealscan, Amadeus, Orbis, Compustat, CompustatGlobal, and author’s calculation.
1 are indeed insignificant in a statistical sense. For each given variable measuring hard infor-mation, I test whether the value-weighted mean of that variable for global banks is differentfrom that for local banks. Table 1 presents these means and their differences. The resultsconfirm the takeaways from the graphical analysis: the differences in value-weighted meansare statistically insignificant between global and local banks for firm asset size and firm age.
Another conjecture about the mechanism driving the sorting between firms and globalversus local banks may be bank specialization in loans of particular currency denominations.This is particularly motivated by recent papers by Maggiori et al. (2018) and Gopinath andStein (2018) that highlight the prevalence of Dollar loans, and to a lesser extent Euro loans,in international financial markets. Given these considerations, I test whether global banksspecialize in lending in non-local currencies, while local banks specialize in lending in localcurrency. As shown in Appendix Figure B.2, in fact, global and local banks make loans inboth local and non-local currencies. This empirical observation holds even when the US orboth the US and Euro area countries are excluded from the sample.
The empirical evidence shows that the traditional banking theory of bank specialization
10

Table 1: Bank-Firm Sorting, by Firm Size and Age Quartile: Statistical Test
(1) (2)Size Age
(1) Mean: Global Bank 3.196*** 2.759***(0.0299) (0.0208)
(2) Mean: Local Bank 3.099*** 2.726***(0.0674) (0.0367)
(3) Difference 0.0969 0.0330(0.0716) (0.0426)
Observations 115,166 114,323
Notes. The dependent variable in each regression (Y) is one of the hard information variables, firm size(column 1) or firm age (column 2), coded 1-4 based on the quartile number to which each respective firmbelongs. Note the firms are sorted every year by country. Row 1 and row 2 show the means for each variablefor global banks and local banks, respectively, by running a value-weighted regression of Y on a constant. Fordifferences in means of the two types of banks, the whole data is used in the regression and a dummy forglobal banks is added (row 3). Standard errors reported in parentheses are clustered at the bank level. Source:Dealscan, Amadeus, Orbis, Compustat, Compustat Global, and author’s calculation.
in hard or soft information, as well as the view of bank specialization in particular currencydenominations, are insufficient to explain observed sorting patterns between firms and globalversus local banks. This points to a puzzle in the mechanism driving bank-firm sorting inglobalized credit markets. In light of the puzzle, I propose a new perspective. I argue thatglobal and local banks’ differing specialization in global and local information constitutes akey mechanism for bank-firm sorting and credit allocation in financial systems with both typesof banks. Global banks have a comparative advantage in extracting information on globalrisk, and local banks have a comparative advantage in extracting information on local risk.
This new perspective builds on the classic information view of banking. Furthermore,it incorporates global banks’ unique position to acquire “global” information through globalmarket-making activities and research efforts they invest in for analyzing global economic andmarket trends. Next, I proceed to formalize the new perspective by developing a model withglobal and local banks in which each bank type’s comparative informational advantage servesas the key ingredient.
3 A Model of Global and Local Banking
In this section I develop a model to study bank-firm sorting and credit allocation in aneconomy with two types of banks—global banks and local banks—and firms heterogenous intheir exposure to global and local risks. Each type of bank can perfectly observe only one
11

component of firms’ risk exposure, giving rise to a double information asymmetry. I showthat bank-firm sorting and credit allocation in equilibrium reveal a problem of double adverseselection.
3.1 Set-up
Consider an economy with two periods (t = 0, 1), a single good, and two classes of agents:firms and banks. All agents are risk neutral and cannot end with a negative amount of cashdue to limited liability.
Firms. There is a continuum of heterogenous firms that have access to a fixed-size projectrequiring an investment of one. Each firm i’s production technology is characterized by thefollowing production function:
zi = zGi + zLi + ui (1)
where zGi denotes firm i’s component of return due to global risk, zLi denotes firm i’s compo-nent of return due to local risk, and ui denotes firm i’s idiosyncratic risk. Each component isindependently and uniformly distributed, with zGi ∼ U(0, 1), zLi ∼ U(0, 1), and ui ∼ U(0, 1).More specifically, zGi can be considered to encompass two components, zGi = βGi z
G, whereβGi denotes firm i’s exposure to global risk and zG denotes global risk. Similarly, zLi can beconsidered to encompass two components, zLi = βLi z
L, where βLi denotes firm i’s exposure tolocal risk and zL denotes local risk.13
Firms have full information on their returns due to global and local risk at the time ofinvestment (period 0), while idiosyncratic risks are not realized until after investment (period1). Firms have no private wealth; to implement the project, they need to raise one unit ofexternal funds from a bank j through a loan contract.
Banks. There are two types of banks, global banks (G) and local banks (L), denoted asj ∈ {G,L}. They can enter the financial market and compete on projects by offering standarddebt contracts. There is perfect competition within each bank type in the financial market.
The key feature that differentiates global banks from local banks is their informationacquisition technology on global and local information: global banks have the technology toevaluate firms’ return due to global risk (zGi ) but are not able to extract information on firms’return due to local risk (zLi ), while local banks are able to evaluate firms’ return due to localrisk but are not able to extract information on firms’ return due to global risk. This gives riseto an environment with double information asymmetry. The nature of the double information
13 These considerations become more applicable when mapping the model to empirics, which I describemore in detail in Section 6.
12

asymmetry problem and the distributions of the firms’ return due to global risk and local riskare common knowledge across banks and firms.
Given the information structure, the loan rate offered by the two types of banks can bemade contingent on the component of firm return observable to each respective bank type.Each type-contingent interest rate applies uniformly for all firms of the given observablecomponent regardless of their unobserved return component. More specifically, global bankscan offer type-contingent gross interest rate RG(zGi ) for firms with return component zGi , andthat rate applies for all firms with a given zGi regardless of zLi . Similarly, local banks canoffer type-contingent interest rate RL(zLi ) for firms with return component zLi , and that rateapplies for all firms with a given zLi regardless of zGi .
It follows that the interest rates offered by each type of bank can be generated by interestrate functions that map the observable return components to type-contingent interest ratesfrom the respective bank type: global banks offer contracts based on the interest rate functionRG : zGi 7→ RG(zGi ), and local banks offer contracts based on the interest rate functionRL : zLi 7→ RL(zLi ). For both types of banks, each bank’s objective is to maximize expectedprofit across firms of each observable type: global banks maximize expected profit across firmsof each given zGi , and local banks maximize expected profit across firms of each given zLi .
Global banks and local banks face gross funding rate rG and rL, respectively, for the fundsthey intermediate.14
Bank-Firm Sorting. This environment in which each type of bank can perfectly observeonly one component of the firms’ return, while firms have full information on both returncomponents, gives rise to a sorting process between banks and firms. The timing of the modelis presented in Figure 2.
Let Ei denote the expectation of firm i conditional on its information set. Between globalbanks and local banks, each firm i selects the contract offered by bank j ∈ {G,L} that yieldsthe higher expected utility Ei
[max(zi − Rj(zji ), 0)
].15 Firm selection results in a partition
of the set of all firms into two subsets, as each firm i with return component (zGi , zLi ) selects
to borrow from either a global bank or a local bank given the interest rate functions of thetwo bank types. One subset, denoted as SG, chooses to sign a lending contract with a globalbank, and the other subset, denoted as SL, chooses to sign a lending contract with a local
14 Since the funding market is not of central importance to this paper, it is not explicitly modeled foranalytical convenience. The funding rates rG and rL could reflect funding conditions in the interbank market,the deposit market, or other risk premiums. While funding is fully elastic here, the model predictions do notchange if rG and rL are considered to be decreasing in loan amounts.
15 Note that the expectation here is taken with respect to idiosyncratic shocks only.
13

Figure 2: Model Timeline
bank:
SG =
{(zGi , z
Li ) : Ei
[max(zi −RG(zGi ), 0)
]≥ Ei
[max(zi −RL(zLi ), 0)
]}; (2a)
SL =
{(zGi , z
Li ) : Ei
[max(zi −RL(zLi ), 0)
]> Ei
[max(zi −RG(zGi ), 0)
]}. (2b)
The following assumptions about firm selection hold throughout the paper.
Assumption 1. Suppose RG(zGi ) > zGi +zLi +1 or RL(zLi ) > zGi +zLi +1. Then (zGi , zLi ) ∈ SG
if RG(zGi ) ≤ RL(zLi ); and (zGi , zLi ) ∈ SL otherwise.
Assumption 1 states that in the region of the parameter space when the firm’s expected utilityis zero when it borrows from either a global bank or a local bank, it chooses the bank thatoffers the lower interest rate. This assumption ensures that there is no ambiguity in firmselection across all regions of the parameter space.
Remark 1. Based on Equations (2a) and (2b) and Assumption 1, each firm i selects intoborrowing from a global bank if and only if RG(zGi ) ≤ RL(zLi ), and each firm i selects intoborrowing from a local bank if and only if RG(zGi ) > RL(zLi ). In sum, each firm chooses thebank that offers the lowest rate.
The selection of firms directly affects global and local banks’ expected profits. Let EGdenote the expectation of a global bank conditional on its information set and EL denote
14

the expectation of a local bank conditional on its information set. The expected profits fora global bank (G) from lending to firms of a given zGi and a local bank (L) from lending tofirms of a given zLi are given by
G: EG[πG(zGi )] =
∫G1
min
(zGi + zLi + ui,RG(zGi )
)dFG1(zLi , ui)− rG,
where G1(zGi ) =
{(zLi , ui)
∣∣ zLi : (zGi , zLi ) ∈ SG, 0 ≤ ui ≤ 1
};
(3a)
L: EL[πL(zLi )] =
∫L1
min
(zGi + zLi + ui,RL(zLi )
)dFL1(zGi , ui)− rL,
where L1(zLi ) =
{(zGi , ui)
∣∣ zGi : (zGi , zLi ) ∈ SL, 0 ≤ ui ≤ 1
}.
(3b)
The first term on the right hand side of Equations (3a) and (3b) is the expected gross returnacross loan contracts to firms of a given zGi and zLi for a global bank and a local bank,respectively. In the global bank’s expected profit function, G1(zGi ) summarizes the set offirms which select global banks given zGi . This includes firms with idiosyncratic risk ui fromany part of the ui distribution, and zLi such that they are in the subset of firms that choosethe global bank’s contract. Similarly in the local bank’s expected profit function, L1(zLi )
summarizes the set of firms which select local banks given zLi . This includes firms withidiosyncratic risk ui from any part of the ui distribution, and zGi such that they are in thesubset of firms that choose the local bank’s contract. The integrand in both equations showsthe relationship between bank profit and firm profit in a standard debt contract: for eachfirm, when its realized return is less than the contractual interest rate, it defaults and givesup any realized project returns to the lending bank; otherwise, the firm is able to repay theloan at the contractual rate and keeps the difference between the project return and rate asprofit. FG1(.) and FL1(.) denote the cumulative distribution function of the relevant variableconditional on G1 and L1, respectively. The last terms in Equations (3a) and (3b) are thefunding costs for the global bank and local bank, respectively.
3.2 Strategies and Equilibrium Definition
As shown in Equations (3a) and (3b), each type of bank’s choice of the interest rate functionaffects the expected profit of the other type of bank since it influences the subset of firms thatselects loan contracts from one versus the other. I consider the competitive interplay betweena global bank and a local bank as a non-cooperative game.
In the game, the global bank’s strategy set UG consists of the set of possible interest rate
15

functions RG, and the local bank’s strategy set UL consists of the set of possible interestrate functions RL. The payoff function for the global bank is the expected profit functionEG[πG(RG,RL)] across all firms, and that for the local bank is the expected profit func-tion EL[πL(RG,RL)].16 A given strategy RG is a best response to the strategy RL ifEG[πG(RG,RL)] ≥ EG[πG(RG′ ,RL)] ∀ RG′ ∈ UG, and vice versa for RL.
In a competitive equilibrium in this credit market, both global and local banks play bestresponses to each other’s strategies. Each operating bank earns an expected profit of zerogiven perfect competition and free entry, and the selection of firms is consistent with thebanks’ equilibrium strategies.
Formally, the definition of the competitive equilibrium is as follows:
Definition 1. For a given set of parameters rG, rL, and the distributions of zGi , zLi , and ui,
a competitive equilibrium with free entry in the credit market is a strategy profile {RG,RL}and sets SG and SL such that:
1. (No Unilateral Deviation):EG[πG(RG,RL)] ≥ EG[πG(RG′ ,RL)] ∀ RG′ ∈ UG;EL[πL(RG,RL)] ≥ EL[πG(RG,RL′)] ∀ RL′ ∈ UL;
2. (Zero Profit Condition, Global Bank):∫G1
min
(zGi + zLi + ui,RG(zGi )
)dFG1(zLi , ui) = rG;
3. (Zero Profit Condition, Local Bank):∫L1
min
(zGi + zLi + ui,RL(zLi )
)dFL1(zGi , ui) = rL;
4. (Firm Selection):
Sj =
{(zGi , z
Li ) : Ei
{max[zi −Rj(zji ), 0]
}≥ Ei
{max[zi −Rk(zki ), 0], j 6= k ∈ {G,L}
}.
Part 1 of Definition 1 requires that no unilateral deviation in strategy by any bank isprofitable for that bank. Parts 2 and 3 impose zero profit among global banks and localbanks, respectively. Part 4 defines the set of firms that select the loan contract with either ofthe two types of banks in an incentive-compatible fashion. All banks that enter the markethold correct expectations about both banks’ pricing choices and the pool of firms that willaccept the contract. As a consequence, the allocations of credit across firms are consistentwith the banks’ equilibrium strategies.
Before turning to characterizing the equilibrium in the credit market of two bank typesunder double information asymmetry, I describe two useful benchmarks.
16 Banks also strictly prefer making a loan with zero expected profit to not making a loan.
16

First Best. In an environment where both types of banks observe full information on eachfirm’s return due to global and local risk, the only margin that differentiates the loan ratecharged by global banks versus local banks is the funding cost faced by each bank type. As aresult, only the bank type with lower funding cost (r) exists in the credit market in equilibrium,and its interest rate function is strictly decreasing in (zGi + zLi ). Panel (a) of Figure 3 showsan illustration of the first-best equilibrium in an economy with full information. The diagonalline zLFB + zGFB + 1/2 = r denotes a threshold.17 The firms in the region below this thresholdare not able to receive loans, as their expected profits are too low for the bank to break evenin expectation.
Closed Economy. In an environment where there exist only local banks that observeinformation on each firm’s return due to local risk, the interest rate function RL(zLi ) isstrictly decreasing in zLi and uniform across the entire distribution of zGi . Panel (b) of Figure3 shows an illustration of the equilibrium in this economy. Firms with zLi below zLCE = rL−1
(firms in Regions a and c) are not able to receive loans. Relative to the first-best allocationwithout information asymmetries, the equilibrium in a closed economy overfunds firms whosereturn due to local risk is high relative to return due to global risk (firms in Region b) andunderfunds firms whose return due to local risk is low relative to return due to global risk(firms in Region c).
Figure 3: Benchmark Equilibrium: First-Best and Closed Economy
zGi
zLi
1
1zG
i
zLi
1
1
(a) (b)First-Best Closed Economy
zLCE = rL − 1zG
FB = r − 1/2
zLFB = r − 1/2
No LoansNo Loans
b
ca
First-best
Notes. Panel (a) illustrates the first-best equilibrium in an economy with full information. Panel (b) illustratesthe equilibrium credit allocation in a closed economy in which there are only local banks.
17 Note E[ui] = 1/2.
17

3.3 Equilibrium Characterization
In the following I characterize the equilibrium in a credit market of two bank types underdouble information asymmetry. I start by establishing the properties of the bank interest ratefunctions in equilibrium.
Subject to the zero profit conditions from Parts 2 and 3 of Definition 1, Equation (3a)determines the global banks’ type-contingent interest rate function RG given firm selectionas specified in Equation (2a), and Equation (3b) determines the local banks’ type-contingentinterest rate functionRL given firm selection as specified in Equation (2b). Since firm selectiondepends on interest rates from both types of banks in equilibrium, Equations (3a) and (3b)given Equations (2a) and (2b) simultaneously determine the type-contingent interest ratefunctions RG and RL in equilibrium.
Let EG[zLi | (zGi , zLi ) ∈ SG, zGi ] denote the global banks’ expectation of the average zLi
for the set of firms with (zGi , zLi ) in SG conditional on zGi , and EL[zGi | (zGi , z
Li ) ∈ SL, zLi ]
denote the local banks’ expectation of the average zGi for the set of firms with (zGi , zLi ) in SL,
conditional on zLi . Proposition 1 characterizes RG and RL.
Proposition 1. (Type-Contingent Interest Rate Functions)
1. RG is strictly decreasing in zGi for zGi ∈ [zG, 1], where zG ≡ rG − EG[zLi | (zG, zLi ) ∈SG, zGi ]− 1/2.
2. RL is strictly decreasing in zLi for zLi ∈ [zL, 1]„ where zL ≡ rL − EL[zGi | (zGi , zL) ∈
SL, zLi ]− 1/2.
Part 1 of Proposition 1 establishes that the global banks’ interest rate function is strictlymonotone for zGi ∈ [zG, 1]. The lower bound zG pins down a cut-off point on zGi below whichthe expected profits of the pertinent firms are too low for the global banks to break evenin expectation. In other words, zG defines the lowest zGi firm to which the global bankslend. The lower bound zG is increasing in global bank’s funding cost (rG), decreasing in theaverage zLi of the set of firms that are expected to select the global bank, and decreasing in theexpected idiosyncratic shocks for firms. The explanation for local banks’ interest rate functionRL established in Part 2 of Proposition 1 is analogous. Panel (a) of Figure 4 illustrates theinterest rate functions in a graph with zLi on the x-axis. Since global banks cannot observezLi , RG is uniform across zLi . RL is strictly decreasing in zLi , as established in Proposition 1.
Using strict monotonicity, I next establish that the competitive interplay between globaland local banks generates a unique form of horizontal segmentation in equilibrium, in whichthere exists a set of marginal firms that are indifferent between taking loans from global banksand local banks. Formally,
18

Proposition 2. (Threshold Functions) Let RG = {RG(zGi ) | zGi ∈ [zG, 1]} and RL =
{RL(zLi ) | zLi ∈ [zL, 1]}. In the region RG ∩ RL, there exist threshold functions z̄L(zGi )
and z̄G(zLi ) such that:
1. RG(zGi ) = RL(z̄L(zGi )).
RL(zLi ) = RG(z̄G(zLi )).
2. SG = {(zGi , zLi ) : zLi ≤ z̄L(zGi )}, and SL = {(zGi , zLi ) : zLi > z̄L(zGi )}.
SL = {(zGi , zLi ) : zGi < z̄G(zLi )}, and SG = {(zGi , zLi ) : zGi ≥ z̄G(zLi )}.
Part 1 of Proposition 2 establishes that, for every firm with zGi (resp. zLi ), there exists athreshold on zLi (resp. zGi ), denoted as z̄L(zGi ) (resp. z̄G(zLi )), at which both the global bankand local bank offer the same interest rate. Panel (b) of Figure 4 illustrates the threshold:for a given zGi , there exists a threshold z̄L(zGi ) at which the interest rate functions of the twobanks intersect, RG(zGi ) = RL(z̄L(zGi )).
Part 2 of Proposition 2 follows from the monotonic property of the type-contingent interestrate. Given RG(zGi ) and RL(zLi ) are strictly decreasing in zGi and zLi , respectively, firms(zGi , z
Li ) with zLi < z̄L(zGi ) face a lower rate from global banks and therefore select global
banks (i.e, the firms are in SG). Firms with zLi > z̄L(zGi ) face a lower rate from local banksand thereby select local banks (i.e, they are in SL). This idea is shown in Panel (b) of Figure4. An analogous explanation applies to firms with zGi < z̄G(zLi ) and zGi > z̄G(zLi ).
Parts 1 and 2 of Proposition 2 establish the existence of thresholds that segment thecredit market into two parts, with global banks as the lender in one, and local banks as thelender in the other. In equilibrium, the threshold values z̄L(zGi ) and z̄G(zLi ) are determinedby the interaction between the interest rate schedules of the global and local banks, wherez̄L(zGi ) = (RL)−1(RG(zGi )) and z̄G(zLi ) = (RG)−1(RL(zLi )).
The following corollary characterizes the threshold functions, describing how they changegiven changes in zGi , z
Li , and the interest rate functions. Let z̃G be a cut-off that pins down
an upper bound on zGi , above which firms with zLi from any part of the zLi distribution areexpected to select the global bank (i.e., z̄L(zGi ) = 1 for all zGi ≥ z̃G), and the analogue appliesto z̃L.
Corollary 1. (Threshold Functions Characterization) Let z̃G = min{zGi : z̄L(zGi ) = 1} andz̃L = min{zLi : z̄G(zLi ) = 1}.
1. z̄L(zGi ) is increasing in zGi for zGi ∈ [zG,min(z̃G, 1)].
z̄G(zLi ) is increasing in zLi for zLi ∈ [zL,min(z̃L, 1)].
19

Figure 4: Illustration of Interest Rate Functions and Threshold Functions
10zL
i
Ri
RG(zGi )
RL(zLi )
(a)
10zL
i
Ri
z̄L(zGi )
(b)
SG SL
RG(zGi )
RL(zLi )
10zL
i
Ri
RG(zGi )
RL(zLi )
z̄L(zGi )
(d)
SG SL
z̄L′�(zGi )
RL′�(zLi )
10zL
i
Ri
z̄L(zGi )
(c)
SG SL
RG(zGi )
RL(zLi )
RG(zG′�i )
z̄L(zG′�i )
Notes. Panel (a) illustrates Proposition 1, showing the monotonically decreasing property of the interest ratefunctions, given information asymmetry. Panel (b) illustrates Part 1 and 2 of Proposition 2, showing, for agiven zGi , there exists a threshold z̄L(zGi ) at which RG(zGi ) = RL(z̄L(zGi ). Firms below the threshold borrowfrom global banks; firms above which borrow from local banks. Panel (c) illustrates Part 3 of Proposition 2,showing an increase in zGi lowers RG(zGi ) and increases z̄L(zGi ), holding all else constant. Panel (d) illustratesPart 4 of Proposition 2, showing an increase in RL(zLi ) increases z̄L(zGi ), holding all else constant.
20

2. z̄G(zLi ) is decreasing in RL(zLi ) and z̄L(z̄G(zLi )) is increasing in RL(zLi ), for zGi ∈ [zG,min(z̃G, 1)]
and zLi ∈ [zL,min(z̃L, 1)].
z̄L(zGi ) is decreasing in RG(zGi ) and z̄G(z̄L(zGi )) is increasing in RG(zGi ), for zGi ∈ [zG,min(z̃G, 1)]
and zLi ∈ [zL,min(z̃L, 1)].
The intuition for Part 1 of Corollary 1 is straightforward. Suppose there is an increase inzGi from zGi to zG′i , or in other words, the global component of firm i’s return strengthens.Global banks’ expected profit increases, and perfect competition drives down RG(zGi ). At themargin, this attracts firms with higher zLi to contract with global banks. Thus, the thresholdon zLi increases, z̄L(zG
′i ) > z̄L(zGi ). This relationship is illustrated in Panel (c) of Figure 4.
The intuition for Part 2 of Corollary 1 (shown in Panel (d) of Figure 4) is as follows.Suppose the local banks’ interest rate function changes such that RL(zLi ) increases for somezLi ∈ [zL,min(z̃L, 1)]. A higher interest rate induces a set of marginal firms to switch fromcontracting with local banks to global banks, holding constant zGi and RG(zGi ). In particular,the local component (zLi ) of the switching firms is greater than that of the firms in globalbanks’ original portfolio, which implies an increase of the threshold z̄L(zGi ). At the same time,the global component (zGi ) of the switching firms is higher than that of the firms that remainwith local banks, which implies a decrease of the threshold z̄G(z̄L(zGi )).
Based on the results from Proposition 1 and 2 and Corollary 1, I next characterize thecompetitive interaction between the two interest rate functions offered by the two types ofbanks.
Proposition 3. (Interaction of Rate Functions in Equilibrium) Given zGi , for any increase inRL(zLi ) such that z̄L(zGi ) increases, RG(zGi ) declines. Given zLi , for any increase in RG(zGi )
such that z̄G(zLi ) increases, RL(zLi ) declines.
Proposition 3 points out that each bank’s type contingent interest rate function is deter-mined by two inputs: the observed risk component of each firm’s return and the thresholdvalue of the unobserved risk component. For a given zGi , if there is a change in the local banks’interest rate function RL such that the threshold z̄L(zGi ) increases, a set of marginal firmswith zLi greater than all the zLi ’s in global banks’ original portfolio switches into borrowingfrom global banks. As a result, the global banks offer a lower RG(zGi ) for the firms with thegiven zGi . The interaction between the interest rates functions of global and local banks pointto a stable equilibrium in which the two banks interact as strategic substitutes.
Propositions 1–3 lead to a full characterization of the equilibrium solution on RG andRL. The solutions for the equilibrium interest rates RG(zGi ) and RL(zLi ), and thresholdsz̄Li = z̄L(zGi ) and z̄Gi = z̄G(zLi ), for zGi ∈ [zG, 1] and zLi ∈ [zL, 1] are described in detail inAPPENDIX A, I.A.
21

4 Model Analysis and Implications
In this section, I analyze the model by studying bank-firm sorting in equilibrium, and howcredit allocation across firms responds to changes in banks’ funding cost at the extensive (firmselection) and intensive (interest rate) margins. I show that the the model delivers two sharpempirical predictions on bank-firm sorting and international transmission of funding shockson credit allocation across firms.
4.1 Equilibrium Bank-Firm Sorting
To build intuition, I focus on bank-firm sorting in a symmetric equilibrium where global andlocal banks face the same funding cost, rG = rL = r. This can be motivated by the ideathat both types of banks have access to funds from a global interbank market that providesan elastic supply of funds at the risk-free interest rate r. This case allows me to focus solelyon the implications of the double information asymmetry on bank-firm sorting. AppendixI.B discusses the equilibrium bank-firm sorting in the general case when there is variationbetween the funding costs of global and local banks (rG 6= rL).
Given the assumption rG = rL = r, the expected profit functions of the global and localbanks become completely symmetric. With perfect competition and free entry, the equilibriumthresholds also become symmetric.
Lemma 1. (Thresholds: Symmetric Case) If rG = rL, then z̄L(zGi ) = zGi and z̄G(zLi ) = zLi .
Given Lemma 1, sorting between firms and global versus local banks immediately follows.
Corollary 2. (Bank-Firm Sorting: Symmetric Case) Let rG = rL. A firm selects a globalbank if and only if zGi ≥ zLi . A firm selects a local bank if and only if zLi > zGi .
Panel (a) of Figure 5 provides a simple illustration of bank-firm sorting for the symmetriccase. Global and local banks compete for loans borrowed by firms with zGi ∈ [zG, 1] andzLi ∈ [zL, 1]. In equilibrium, the thresholds form a 45 degree line that segments the creditmarket. Firms in Region L, which have zLi > zGi , select into local banks, and firms in RegionG, which have zGi ≥ zLi , select into global banks.
Corollary 2 reveals that the information asymmetry problem faced by global and localbanks creates a segmented credit market affected by double adverse selection. Both typesof banks are adversely selected against, as firms select into borrowing from the bank whichobserves the more favorable component of their risk exposure. Specifically, firms with a weakerlocal component (zLi ) relative to their global component (zGi ) select into a global bank — thebank that cannot observe the weaker component.
22

Furthermore, firms are borrowing at higher interest rates relative to the first-best out-comes. This is because banks, given the information asymmetry problem, can only assigninterest rates contingent on the component of firms’ risk exposure that they observe, but noton the unobserved component, for which their rates must be uniform, as shown by the iso-interest rate curves in Panel (b) of Figure 5. Knowing the firm selection process, they assigninterest rates based on the expected risk of the firms which will approach them. This givesrise to heterogeneity among firms in the degree to which they are charged higher interest ratesrelative to the first-best outcomes. The firms that are riskier in their unobserved exposurecomponent face more favorable interest rates, and firms with relatively balanced global andlocal risk exposure (i.e., closer to the thresholds) face more adverse interest rates. Specifically,consider firms a and b in Panel (a) of Figure 5. In this economy, both firms select into bor-rowing from a global bank in equilibrium, and are offered the same interest rate RG(zGi ) sincetheir zGi component is the same. However, the zLi component of firm a is much stronger thanthat of b, which means that firm a faces a worse outcome relative to the first-best outcome.
4.2 Bank Funding Cost Shock
Next, I proceed to study how the equilibrium credit allocation responds to changes in banks’funding cost (e.g., a change in monetary policy of the home country of one of the banks) atboth the extensive (firm selection) and intensive (interest rate) margins. In addition, I applythe model to clarify the forces underlying the international risk-taking channel of monetarypolicy. The following corollary summarizes the effects of a shock to banks’ funding cost onthe thresholds and the equilibrium interest rates.
Corollary 3. (Funding Shock) Holding all else constant,
1. z̄L(zGi ) is decreasing in rG and increasing in rL; z̄G(zLi ) is decreasing in rL and increas-ing in rG.
2. RG(zGi ) is increasing in rG and decreasing in rL; RL(zLi ) is increasing in rL and de-creasing in rG.
To expand on its intuition and implications, I describe the results from Corollary 3 in thecontext of a decrease in global banks’ funding cost, e.g., a decrease in funding rate due toexpansionary monetary policy in the home country of the global banks. The effects of a lowerfunding cost, rG, are also illustrated in Figure 6, which is based on simulation results withparameter values rG = 1.015, rG′ = 1.005, and rL = 1.040, where rG′ denotes the new grossfunding rate for global banks.
23

Figure 5: Bank-Firm Sorting and Interest Rates Under Symmetric Equilibrium
zGi
zLi
A
B
C
1
1
a
b
.
.
.c
.d
L
G
zG
zL
zGi
zLi
1
1zG
zL
(a) (b)
A
B
C
L
G
RG(zGi ) RL(zL
i )Increasing
Notes. Panel (a) shows the equilibrium bank-firm sorting when rG = rL. Panel (b) shows iso-interest ratecurves by global banks and local banks. For both plots, Region A depicts the region where no loans are given.Region B depicts the region where only local bank loans are given and no global banks would give loans.Region C depicts the region where only global bank loans are given and no local banks would give loans.Region L depicts the region where both global and local bank compete for loans, and loans are given by localbanks in equilibrium. Region G depicts the region where both global and local bank compete for loans, andloans are given by global banks in equilibrium.
24

Extensive Margin Effects. A decrease in global banks’ funding costs lowers the equilib-rium interest rates offered by global banks for all firms. Based on Part 4 of Proposition 2,z̄L(zGi ) increases, and z̄G(zLi ) decreases, which implies that a set of marginal firms switchfrom local banks to global banks. The changes in the thresholds are illustrated in Panel (a) ofFigure 6. It is interesting to point out that the marginal firms that switch into global banksare less risky than the infra-marginal firms that continue to borrow from either the local banksor the global banks. Moreover, the funding cost change affects zGi and zLi , the cut-offs on zGiand zLi below which global and local banks, respectively, would not make loans. A set of riskyfirms that initially were not able to get loans from either bank can now get loans from globalbanks (firms in Region G′2), while a set of firms that initially were getting loans from localbanks are no longer able to borrow from either class of bank (firms in Region G′3).
This result shows that a shock to bank funding cost affects credit allocation at the extensivemargin. Specifically, the model predicts that firms near the thresholds, which are firms withrelatively balanced global and local risk exposure components, are more likely to switch intocontracting with global banks. The result is driven by adverse selection: since the firms withrelatively balanced global and local risk exposure are more adversely selected against, theyare more likely to switch lenders given any changes in the credit market.
Intensive Margin Effects. Changes in bank funding cost also affect credit allocation atthe intensive margin. Given a decline in rG, for each value of zLi , the zGi components ofthe marginal firms that switch away from local banks are higher than those of all the infra-marginal firms that remain with the local banks. Since the local banks are left with a riskierpool of firms, they charge higher interest rates, despite no changes to their funding cost. Thispoints to a spillover effect, one that is solely driven by an exacerbation of the adverse selectionproblem. Simulation results show that, given a 100 basis point decrease in rG (specifically adecrease from rG = 1.015 to rG′ = 1.005), the interest rates that local banks offer to the infra-marginal firms that continue to borrow from them increase by 126 basis points on average, asshown in the red region in Panel (b) of Figure 6.
From the global banks’ perspective, the zLi components of the marginal firms that switchinto them are higher than those of all the infra-marginal firms that were getting loans fromthem in the initial equilibrium, conditional on zGi . Since the pool of firms that borrows fromglobal banks is less risky given the funding cost shock, they lower RG(zGi ). In other words,the interest rates of the infra-marginal firms that remain with the global banks are expectedto decrease by an amount more than that caused by the decrease in global banks’ fundingcost, reflecting an amplification effect. The impact of the funding shock is positively amplifiedfor those infra-marginal firms because firm switching alleviates the initial adverse selection
25

Figure 6: Effects of a Positive rG Shock (rG lowers)
(a) Equilibrium Characterization
zGi
zLi
1
1
0
pre
post
G′�1
L
G
G′�2
zG
zL′�
zG′�
zL
G′�3
z̄L(zGi )
z̄G(zLi )
(b) Rate Change: Infra-marginal Firms
(c) Rate Change: Marginal Firms (d) Rate Change: Marginal Firms (zoomed in)
Notes. Simulations based on parameter values rG = 1.015, rG′
= 1.005, and rL = 1.040. Panel (a) Illustratesthe equilibrium characterization before and after a decrease in rG. Panel (b) shows ∆Ri = Rpost
i − Rprei for
the infra-marginal firms. Panel (c) shows ∆Ri = (Rposti − Rpre
i )/(Rprei − 1) for the marginal firms. Panel (d)
shows a zoomed-in version of part (c) of this figure.
26

problem for the global banks. Simulation results show that a decrease of 100 basis points inrG translates to a decrease of 180 basis points for an average infra-marginal firm that borrowsfrom global banks, as shown in the blue region in Panel (b) of Figure 6.
Panels (c) and (d) of Figure 6 illustrate the change in interest rate for the marginal firmsthat switch banks given the funding cost shock (firms in Region G′1 in panel (a) of the Figure).The effects are heterogenous across the firms: while interest rates decrease for the switchingfirms that are closer to initial threshold; rates increase for firms closer to new threshold.Nevertheless, those firms would have been worse off if there were frictions to switching thatleft them with the local banks.
4.3 Discussion of Double Adverse Selection Channel of International Trans-mission
Altogether, the analysis of the effects of a funding cost shock on credit allocation revealsa double adverse selection channel of international transmission.18 It results from the keyingredient in the model: competitive interactions between banks with differing specializationin global versus local information.
One of factors that can affect banks’ funding cost is monetary policy rate changes. Whenthis happens, the model points to a novel adverse selection channel of international monetarypolicy transmission through bank lending, one that is distinct from the channels discussedin the existing literature, including currency mismatches on global banks’ balance sheets (?,Ongena et al. 2017, Bräuning and Ivashina 2018) and internal capital markets within globalbanks (Cetorelli and Goldberg 2012a).
One channel of international monetary policy transmission that has received much atten-tion in recent years is the risk-taking channel. Papers, including Bruno and Shin (2015a) andCoimbra and Rey (2017), argue that low international monetary policy rates and QE could in-duce global banks to reach for yield and take on excess risk. In particular, Morais et al. (2018),using loan-level data, show that low monetary policy rates and QE in developed economies ledglobal banks in Mexico to increase credit supply to firms charged higher-than-average ex-anteinterest rates (riskier firms). They consider this result as evidence for risk-taking behavior byglobal banks.
To better understand the forces underlying their result, I implement the empirical exercisein Morais et al. (2018) in my model using numerical simulation and examine whether bankrisk-taking is indeed the main driving force. Following their procedure, I first categorize
18 APPENDIX B provides additional discussion on how double adverse selection in globalized financialmarkets sheds new light on the effects of banks’ funding shocks on banks portfolio riskiness and the benefitsand costs of financial integration.
27

each firm in the model into a high-risk group and a low-risk group based on whether thefirm’s ex-ante rate is above or below the average interest rate in the credit market in theinitial equilibrium. I then examine, given a decline in global banks’ funding cost due toexpansionary monetary policy in their home country, whether it is the high-risk firms thatreceive more loans from the global banks.
The specific parameter values I use for the simulation are rG = 1.015, rG′ = 1.005, andrL = 1.040, where the change in rG reflects the decline in monetary policy rate in developedeconomies in the post-global financial crisis period and rL reflects the average monetary policyrate in Mexico over the period. Panel (c) of Figure 6 shows a line pinpointing the firm withthe average ex-ante interest rate in that parameter space. As shown, the set of marginalfirms that switch into global banks in response to the funding cost change are firms in thehigh-risk group. Therefore, this model recovers the result that Morais et al. (2018) find in thepaper, predicting that an expansionary monetary policy in the home country of the globalbanks leads to a higher supply of credit to high-risk firms in the local economy. However,in contrast to their explanation, in my model the driving force for the result is substitutionbetween global banking credit and local banking credit.
5 Empirical Predictions and Data
5.1 Mapping Theory to Empirics
The model delivers two sharp empirical predictions on bank-firm sorting and internationaltransmission of funding shocks on credit allocation across firms:
Prediction 1: Conditional on funding cost differences between global and local banks,global banks lend more to firms with higher return due to global risk relative to local risk,and local banks lend more to firms with higher return due to local risk relative to global risk.
Prediction 2a: A shock to the funding cost of one type of bank induces the segment offirms with relatively balanced global and local risk components (i.e., the marginal firms nearthe thresholds z̄L(zGi ) and z̄G(zLi )) to switch to borrowing from the other type of bank.
Prediction 2b: Given a decrease in global banks’ funding cost, the interest rates of theinfra-marginal firms that remain with the local banks are expected to increase (spillover effect).The interest rates of the infra-marginal firms that remain with the global banks are expectedto decrease by more than the direct effect due to the decrease in funding cost (amplificationeffect). The effects on interest rates of the marginal firms that switch banks are ambiguous.
I proceed to test these predictions in the subsequent sections.
28

5.2 Data and Summary Statistics.
The main data source for the empirical analysis is syndicated corporate loans from LoanPricing Corporation’s Dealscan database.19 Syndicated loans are extended by a group ofbanks to a borrower under a single loan contract. Within each group of lenders, the “leadarranger” is the bank that establishes a relationship with the borrowing firm, negotiates termsof the contract, and guarantees a loan amount for a price range. It then turns to “participant”lenders that fund part of the loan.20 Ivashina and Scharfstein (2010) report that syndicatedloan exposures represent about a quarter of total commercial and industrial loan exposureson US banks’ balance sheets, and about a third for large US and foreign banks. De Haasand Van Horen (2013) note that syndicated loans are a key source of cross-border funding forfirms from both advanced and emerging market countries.
For the purpose of this study, the ideal dataset is one that encompasses the universe ofloans to firms that genuinely have access to both global and local banking credit, which arelikely to be firms above a certain threshold in size. The global syndicated loans are viewedas a proxy of that universe of loans. Despite potential selection issues, syndicated loans areuniquely appropriate for this study because they capture a significant portion of cross-borderlending, which would not be captured by other loan datasets such as credit registry data.
In the Dealscan data, there is detailed information on each loan contract, including termsof the loans at origination (interest rate, whether or not the loan is secured, the maturityof the loan), the type of loan (e.g., line of credit versus term loan), the purpose of the loan,the size of the loan, and the contract activation and ending dates. The dataset also containsinformation on the name of the borrowers and lenders as well as the country of syndication.Using the names of the borrowers, I hand-match the Dealscan data with international firm-level databases including Orbis, Amedeus, Compustat, and Compustat Global to extract firmbalance sheet data.21 I further implement a series of data-cleaning procedures to correct forbasic reporting mistakes, including dropping firm-year observations that have missing infor-mation on total assets and operating revenues, dropping firms with negative total assets oremployment in any year, and dropping firm-year observations with missing information re-garding their industry of activity. Finally, I also exclude firms in financial industries, identified
19 All of the commercially licensed data used in this paper were obtained under the purview of the Universityof California at Berkeley licenses, while the author was a student of the university.
20 See Sufi (2007) and Ivashina (2009) for more background description of syndicated loans.21 The Amadeus and Orbis datasets are mainly used to extract information on European and other non-US
firms, including private firms. Compustat is used to extract information on US firms. A well-known problemin the Orbis and Amadeus dataset is that key variables, such as employment and materials, are missing oncethe data are downloaded. I follow the data collection process described in Kalemli-Ozcan et al. (2015) tomaximize the coverage of firms and variables for the sample. Specifically I merge data across historical disksinstead of downloading historical data all at once from the WRDS website.
29

by SIC codes 60 through 64 from the sample.For the purpose of this empirical analysis, one of the key variables needed is one that
identifies whether the lender of each loan is a global bank or a local bank. To this end, Icategorize the lead lender(s) of each loan as global or local. The focus is on the lead bank(s)of each loan contract because they are the entities that are responsible for due diligence priorto loan syndication, while the participant banks rely on the information collected by the leadbanks (Ivashina and Scharfstein 2010).22
The bank categorization is based on the following criteria:
1. Local banks: a lender is categorized as a local bank if the corresponding loan is not across-border loan, i.e., the borrower of the loan operates in the country where the lenderresides. This includes local subsidiaries of foreign banks.23
2. Global banks:
• Method 1: a lender is categorized as a global bank if it is considered a globallysystemically important bank (G-SIB), or if the corresponding loan is a cross-borderloan.
• Method 2: a lender is categorized as a global bank if the corresponding loan is across-border loan.
The resulting sample encompasses 115,166 loans, borrowed by 12,979 firms across 24countries, in the period 2004-2017. Table 2 presents the summary statistics on the loancounts and firm counts for each country in the sample, with the loan counts decomposedinto the share given by global banks and that given by local banks, based on Method 1 ofthe categorization criteria for global banks.24 The majority of the countries in the sampleare developed economies, where most global banking activities take place. For most of thecountries, the loans are split relatively evenly between global banking credit and local bankingcredit.
Table 3 presents the summary statistics on a set of firm balance sheet variables. All thevariables in the table are in billions of dollars, except for age and employment. Value added,
22 For loans that involve multiple lead banks of which some are global banks and some are local banks, Iconsider a loan is given by global bank if ≥ 50% of the lenders are global banks. These cases make up around20% of the loans. Based on the model predictions, I conjecture that firms with relatively balanced globaland local risk components are more likely to get loans that involve both global and local lead banks. I findempirical evidence that supports this conjecture.
23 E.g., for firms in Germany, JP Morgan Holding Deutschland is a local bank, while JP Morgan Chase USAis a global bank. Local subsidiaries are considered separate legal entities from their parent bank, incorporatedin host countries and supervised by the host regulator.
24 Table B.1 in APPENDIX C presents summary statistics on the same variables as Table 2 but with thebanks categorized based on Method 2 of the categorization criteria for global banks.
30

Table 2: Summary Statistics: Loan and Firm Count by Country (Method 1)
Country Loan GB LB Firm Country Loan GB LB FirmAustralia 4507 0.70 0.30 701 Japan 21341 0.45 0.55 2865Austria 387 0.53 0.47 61 Mexico 601 0.70 0.30 137Belgium 704 0.69 0.31 123 Netherlands 2028 0.54 0.46 406Canada 6760 0.64 0.36 903 New Zealand 1023 0.70 0.30 127Czech Republic 197 0.68 0.32 77 Norway 1017 0.66 0.34 253Denmark 327 0.56 0.44 84 Poland 318 0.54 0.46 87Finland 587 0.65 0.35 113 Portugal 254 0.65 0.35 64France 5876 0.67 0.33 996 Spain 4380 0.68 0.32 839Germany 5987 0.68 0.32 942 Sweden 875 0.66 0.34 190Greece 309 0.66 0.34 47 Switzerland 790 0.69 0.31 175Ireland 404 0.70 0.30 107 United Kingdom 6810 0.69 0.31 1528Italy 2378 0.67 0.33 688 United States 46732 0.70 0.30 1466
Notes. Sample constructed from Dealscan, Amadeus, Orbis, Compustat, Compustat Global, and author’scalculation. Sample period covers the year 2004-2017.
wage bill, total assets, and exporter revenue are deflated with gross output price indices witha base year of 2017. I first calculate the means and standard deviations of each variableacross firms in each given year and country without weighting across firms. Entries in thetable denote the means and standard deviations averaged across all years and countries. Thesummary statistics exhibit significant variation in each variable in the sample, which showsthat the sample contains firms from a wide distribution of asset size and age. For all variablesexcept exporter revenue, there does not seem to be a significant difference between the firmsthat borrow from global banks and the ones that borrow from local banks. On the otherhand, it seems that firms that borrow from global banks export significantly more than firmsthat borrow from local banks.
6 Empirical Analysis I: Double Adverse Selection in Credit Al-location
In this section, I test whether the bank-firm sorting patterns predicted by the model areconsistent with the observed patterns in the data (model Prediction 1). To that end, I followan empirical strategy that tightly maps to the model set-up.
Methodology. In order to test whether global banks lend more to firms with higher returndue to global risk (zGi ) relative to local risk (zLi ), and vice versa for local banks, I need to
31

Table 3: Summary Statistics: Firm Characteristics by Bank Type
Global Bank Local BankMean SD Mean SD
Value Added 512.55 1256.45 468.55 895.09Age 25.29 24.67 25.23 24.98Employees 1657.34 6073.34 1719.58 5326.32Wage Bill 209.73 1030.76 163.35 786.41Working Capital 110.58 1089.56 123.34 1173.32Fixed Asset 918.03 2465.80 732.76 2987.84Total Assets 1344.5 4658.56 1134.53 4034.32Exporter Revenue 587.00 1789.34 113.31 456.68
Notes. Value added is constructed as the difference between operating revenue and materials with negativevalues dropped. Age of the firm is calculated as the difference between the year of the balance sheet informationand the year of firm incorporation plus one. Except for age and employment, all entries in the table are inbillions of dollars. Value added, wage bill, total assets, and exporter revenue are deflated with gross outputprice indices with a base year of 2017. I first calculate the means and standard deviations without weightingacross firms for each year in each country. Entries in the table denote the means and standard deviationsaveraged across all years and countries. Data from Amadeus, Orbis, Compustat, and Compustat Global.Sample period covers the year 2004-2017.
construct measures for zGi and zLi for each firm in the sample. Recall from the model that theproduction function for each firm is zi = zGi + zLi + ui. I take that as a simplified version of atypical Cobb-Douglas production function Yi = ziK
γi L
1−γi , where there is one unit of Ki and
Li. The parameter zi, in turn, can be interpreted as a firm revenue productivity measure thatcaptures total exposure to both productivity and demand risk, and zGi (zLi ) can be interpretedas total exposure to global (local) productivity and demand risk.
I start by estimating a time-varying revenue productivity measure zit for each firm in eachyear based on the method of Solow growth accounting.25 Specifically, I compute the zit basedon the following equation:
log zit = log (Yit/Lit)− γtlog (Kit/Lit) (4)
where Yit denotes nominal value added divided by the 2-digit industry-level output pricedeflator for each country, where value added is constructed as the difference between operatingrevenue and material costs with negative values dropped, Lit denotes the wage bill divided
25 Gorodnichenko (2012) shows that this can be used as a robust non-parametric method to estimateproductivity. He also points out that a number of existing parametric methods for estimating productivity aremisspecified or poorly identified. In particular, inversion/control-function estimators (e.g., Olley and Pakes1996, Levinsohn and Petrin 2003) can lead to inconsistent estimates because they ignore variation in factorprices. GMM/IV estimators using lags of endogenous variables as instruments (e.g., Blundell and Bond 1998)can be poorly identified because of economic restrictions on the comovement of inputs and output.
32

by the same output price deflator, Kit denotes fixed assets divided by the aggregate price ofinvestment goods, and the factor share γt uses country-specific and industry-specific sharesextracted from the National Accounts of each country.
Appendix Figure B.3 plots the estimates of the productivity measure, log zit, averagedacross firms and time by country. As expected, average productivity is higher for the relativelymore developed economies such as the US and high-income European economies.
Next I decompose the firm-specific productivity measure, zi, which captures total exposureto productivity and demand risk, into two components: exposure to global risk (zGi ) andexposure to local risk (zLi ). Firms’ total exposure to global risk can be considered to encompasstwo components, zGi = βGi z
G, where βGi denotes firm i’s exposure to global risk and zG denotesglobal risk. The same applies to firms’ total exposure to local risk: zLi = βLi z
L, where βLidenotes firm i’s exposure to local risk and zL denotes local risk.
I implement a principal component analysis to extract estimates for zG and zL, followingStock and Watson (2002). Specifically, I estimate the following equation:
zict =βGiczGt + βLicz
Lct + uict (5)
where zict is the productivity measure for firm i in country c in year t, zGt is the global factor,zLct is the local factor in country c, and uict is a firm-specific component.
The factors can be estimated consistently with a two-step procedure. In the first step, thecommon global factor is obtained from the principal components of the zict series across the24 countries in the sample. The first principal component explains 58% of the total variance,which I take as the global factor, zGt . Appendix Figure B.4 plots the global factor.26 Asshown, it declines around 2007-2008, the period of the global financial crisis, and graduallyrecovers thereafter.
In the second step, I orthogonalize the global component by regressing the productivitymeasures zict on the global factor and taking the residuals. I then extract local (country)factors by computing the principal components based on the residualized zict series for eachcountry. The first principal component from output for each country is taken as the localfactor, zLct. Finally, I estimate the firm-specific global and local exposure measures usingOLS regressions. βGi and βLi are extracted from the loadings on the global and local factor,respectively.
Results. Using the estimated measures for zGi and zLi , I proceed to test the first modelprediction on bank-firm sorting. Similar to the procedure I used to test the traditional theory
26 To map closely to the model setup where zGi and zLi only take positive values, the factor values have beenadjusted upward by their minimum so that all the values are positive.
33

Figure 7: Bank-Firm Sorting, by zGi /zLi Quartile (Method 1)
0.2
.4.6
.81
1 2 3 4
ziG/zi
L
Global Bank Local Bank
Notes. The plot shows sorting patterns between firms and global versus local banks, with firms sorted intoquartiles by their exposure to global versus local risk (zGi /zLi ), uses variables that are constructed based onMethod 1 of the bank categorization criteria for global banks. Data sample consists of syndicated loans betweenfirms global and local banks and firms across 24 countries from 2004-2017. Source: Dealscan, Amadeus, Orbis,Compustat, Compustat Global, and author’s calculation.
on bank-firm sorting in Section 2 but now using the new measures, I sort firms into quartilesbased on the distribution of firm exposure to global versus local risk (zGi /z
Li ) in each year by
country, and calculate the proportion of loans given by global banks and local banks in eachquartile. Figure 7 plots the resulting distribution of lending from global and local banks overthe entire sample. The plot shows a stark pattern of bank-firm sorting: global banks lendmore to firms with higher return given global risk (zGi ) relative to local risk (zLi ), and localbanks lend more to firms with higher return due to local risk relative to global risk.27
As before, I further test whether the differences between global and local banks illustratedin Figure 7 and B.5 are statistically significant. For the measure on firm exposure to globalversus local risk (zGi /z
Li ), I test whether the value-weighted mean of that variable for global
banks is different from that for local banks. Table 4 presents these means and their differ-ences. The results confirm the graphical analysis: the differences in value-weighted means arestatistically significant between global and local banks for the measure of firm exposure toglobal versus local risk (zGi /z
Li ), supporting the model prediction on bank-firm sorting.
27 Figure B.5 is a parallel version of Figure 7, with the banks categorized based on Method 2 of the bankcategorization criteria for global banks.
34

Table 4: Bank-Firm Sorting, by zGi /zLi Quartile: Statistical Test
Method 1 Method 2ziG/ziL ziG/ziL
Mean: Global Bank 2.905*** 3.382***(0.046) (0.040)
Mean: Local Bank 2.107*** 2.507***(0.113) (0.097)
Difference 0.798*** 0.875***( 0.122) (0.105)
Observations 98,345 98,345
Notes. The dependent variable in each regression (Y) is the measure of firm exposure to global versus localrisk, (zGi /zLi ), coded 1-4 based on the quartile number to which each respective firm belong. Note the firms aresorted based on the exposure measure every year by country. Row 1 and row 2 show the means for each variablefor global banks and local banks, respectively, by running a value-weighted regression of Y on a constant. Fordifferences in means of the two types of banks, the whole data is used in the regression and a dummy for globalbanks is added (row 3). Standard errors reported in parentheses are clustered at the bank-level. Results incolumn 1 and column 2 are based on the banks categorized using Method 1 and Method 2, respectively, ofthe bank categorization criteria for global banks. Source: Dealscan, Amadeus, Orbis, Compustat, CompustatGlobal, and author’s calculation.
The results show that the new perspective I raise in this paper, bank specialization inglobal versus local information, plays an important role in determining bank-firm sorting infinancial systems with both global and local banks. But does the traditional theory of bankspecialization in hard versus soft information still play a role? I investigate this question bystudying how the measures that capture global information and the measures that capturehard information jointly predict the likelihood of getting loans from global banks. I run a setof regressions with the dependent variable being a dummy variable that takes the value 1 if theloan is given by a global bank and 0 otherwise. The independent variables in the regressionsare firm exposure to global risk relative to local risk (zGi /z
Li ), firm asset size, and/or firm
age, each coded by the quartile number to which each observation of the respective variablebelongs. The results are presented in Table 5. Results in column 1 show that between firms intwo consecutive quartiles based on the measure of exposure to global risk relative to local risk,the firms in the higher quartile group are 33% more likely to get loans from a global bank.Columns 2 and 3 present results from regressions that include firm asset size and firm age,respectively. The results show that, controlling for firm exposure to global risk relative to localrisk, firms that are larger and more established are significantly more likely to get loans fromglobal banks, which is consistent with the predictions from the traditional banking theory.The results in column 4 show that each of the three measures still have predictive poweron the likelihood of getting loans from global banks, even when the other two measures are
35

also included as regressors. Overall, these results suggest that the bank-firm sorting patternspredicted by the traditional banking theory can be recovered once bank specialization in globaland local information are taken into account.
Table 5: Bank-Firm Sorting, Traditional Theory and New Perspective
(1) (2) (3) (4)1(GB) 1(GB) 1(GB) 1(GB)
zGi /zLi 0.329*** 0.221*** 0.261*** 0.198**
(0.086) (0.074) (0.080) (0.081)Size 0.268*** 0.236***
(0.081) (0.073)Age 0.157** 0.138*
(0.075) (0.078)
Industry FE Yes Yes Yes YesCountry FE Yes Yes Yes YesObservations 98,345 98,345 98,345 98,345
Notes. Results from regressions with the dependent variables being a dummy variable that takes the value 1 ifthe loan is given by a global bank and 0 otherwise. The independent variables are firm exposure to global riskrelative to local risk (zGi /zLi ), firm asset size, and/or firm age, each coded by the quartile number to whicheach observation of the respective variable belongs. Each regression controls for industry and country fixedeffects. Standard errors reported in parentheses are clustered at the firm level. Source: Dealscan, Amadeus,Orbis, Compustat, Compustat Global, and author’s calculation.
Finally, I explore the characteristics of the firms that borrow from global banks, and thecharacteristics of the loans are given by global banks. For the former, I study if exportersare more likely to have a higher value of zGi /z
Li and thereby more likely to get loans from
global banks. I run a firm-level panel regression with zGi /zLi as the dependent variable, and a
dummy variable that takes the value 1 if the exporting revenue for the respective firm for agiven year is nonzero and 0 otherwise as the main regressor, controlling for time and countryfixed effects. The results, reported in column 1 of Table 6, show that exporting firms tend tohave significantly higher zGi /z
Li values, or higher exposure to global risk relative to local risk.
Combined with the results from the sorting exercises, this empirical evidence suggests thatexporters are more likely to get loans from global banks.
In light of these evidence, I further investigate into the loan-level data to see whetherloans of specific purposes such as trade finance are more likely to be funded by global banks.I run a loan-level regressions with the main regressors being dummies on specific loan purposes,including project finance, working capital, trade finance, and others28. The dependent variable
28 Others include IPO related finance, real estate, stock buyback, etc. They are grouped together in one
36

of the regression is a dummy variable that takes the value 1 if the loan is given by a globalbank and 0 otherwise. The results (column 2 of Table 6) show that it is not the case thatglobal banks mainly finance loans for the purpose of trade finance. A significant portion ofthe loans they finance are for general project finance and working capital.
Table 6: Determinants of zGi /zLi and Global Banking Credit
(1) (2)zGi /z
Li 1(GB)
Exporter 0.565***(0.103)
Project purposeProject finance 0.013***
(0.001)Working capital 0.020***
(0.001)Trade finance 0.004**
(0.002)Year FE Yes YesIndustry FE Yes YesCountry FE Yes YesObservations 129,309 98,345
Notes. Column 1 reports results from a firm-level panel regression with zGi /zLi as the dependent variable, anda dummy variable that takes the value 1 if the exporting revenue for the respective firm for a given year isnonzero and 0 otherwise as the main regressor. Column 2 reports results from a loan-level regression with adummy variable that takes the value 1 if the loan is given by a global bank and 0 otherwise as the dependentvariable, and dummy variables on loan purpose as the main regressors. Time, industry and country fixedeffects are included in both regressions. Standard errors reported in parentheses are clustered at the firmlevel. Source: Dealscan, Amadeus, Orbis, Computstat, Compustat Global, and author’s calculation.
7 Empirical Analysis II: A Double Adverse Selection Channelof International Transmission
In this section, I study how shocks to bank funding cost, specifically monetary policy shocks,affect credit allocation at the extensive and intensive margins, testing model Predictions 2. Itake the Euro area as the empirical laboratory of this study, and analyze how US and Euroarea monetary policy, through US and Euro area banks, respectively, affect credit allocationacross firms in the Euro area. From the perspective of Euro area firms, US banks are globalbanks, and Euro area banks are local banks. Given this context, I raise two conjectures based
variable.
37

on the model predictions and the results on bank-firm sorting from the last section:i) Conditional on Euro area monetary policy, an expansionary US monetary policy induces
firms in the Euro area with relatively balanced global and local risk components—firms in thesecond tercile of the zGi /z
Li distribution—to switch their borrowing from Euro area banks to
US banks.ii) Conditional on Euro area monetary policy and given expansionary US monetary policy,
the interest rates of the infra-marginal firms that continue to borrow from Euro area banks—firms in the first tercile of the zGi /z
Li distribution (firms with relatively low zGi relative to
zLi )—are expected to increase (spillover effect). The interest rates of the infra-marginal firmsthat continue to borrow from US banks—firms in the third tercile of the zGi /z
Li distribution
(firms with relatively high zGi relative to zLi )—are expected to decrease by more than thedirect effect due to expansionary US monetary policy (amplification effect). The effects oninterest rates of the marginal firms that switch banks—firms in the second tercile of the zGi /z
Li
distribution—are ambiguous.To test the conjectures, I perform regressions of the following form, using data on loans
borrowed by Euro area firms in the loan-level data and the firm-specific zGi /zLi measure:
∆Yit =
3∑q=1
βq(∆USRt x Tqit−1) +
3∑q=1
δq(∆EURt x Tqit−1) +
3∑q=2
γqT qit−1 + νi + σt + εit (6)
where i indexes firm, t indexes the date on which a specific loan is issued, ∆(.) denotes thedifference in the referred variable between the date on which the current loan is issued and thedate on which the last loan was issued, Y denotes the applicable dependent variable which Iexplain below, USR denotes US monetary policy shocks, EUR denotes Euro area monetarypolicy shocks, q indexes each of the three terciles of the zGi /z
Li distribution, T qit−1 are dummy
variables that take the value 1 when firm i’s zGi /zLi measure at the time of the last loan
issuance belongs to tercile q and 0 otherwise, νi are firm dummies, and σt are year dummies.The standard errors are clustered by time, to take into consideration potential correlationsacross firms in borrowing behavior or borrowing term changes since the monetary policyshocks are aggregate.
For measures of US and Euro area monetary policy shocks, I use intraday data on theFederal Funds 30-day futures contracts and the three-month Euribor futures contracts, re-spectively, from Gorodnichenko and Weber (2016) and CQG Data Factory.29 The Federal
29 The US monetary policy shock measure based on intraday data on the Federal Funds futures contractshas been used in a number of papers, including Kuttner (2001), Cochrane and Piazzesi (2002), Rigobon andSack (2004), Gertler and Karadi (2015), Gorodnichenko and Weber (2016), Nakamura and Steinsson (2018),
38

Funds futures data is based on trading on the Chicago Board of Trade (CBOT) Globex elec-tronic trading platform. It reflects the market expectation of the average effective FederalFunds rate during that month. The Euribor futures rates is based on trading on ICE Fu-tures Europe and reflects the market expectation of the Euribor rate for three-month Eurodeposits.30 Therefore, both series provide a market-based measure of the anticipated path ofthe monetary policy rates for the respective region.
In order to identify exogenous shocks to US and Euro area monetary policy, the monetarypolicy shocks are calculated as changes in the futures rates within a time window aroundthe Federal Open Market Committee (FOMC) or European Central Bank (ECB) monetarypolicy announcements.31 The identifying assumption is that changes in the interest ratefutures within the specified windows around the announcements only reflect market responsesto the monetary policy news, not changes in other domestic or foreign economic conditions.For measures of US monetary policy shocks, I consider a window of 60 minutes around theannouncements that starts 15 minutes (∆−) prior to the event, following Gorodnichenko andWeber (2016) and Nakamura and Steinsson (2018).
As for ECB monetary policy, its key target rate decision since 2001 has been announcedat 13:45 CET through a press release, followed by a press conference at 14:30 pm CET. At thepress conference, the ECB President and Vice-President discuss the future path of monetarypolicy and announce any additional non-conventional measures.32 To give a sense of howthe ECB policy rate announcement and the press conference affect the market expectation ofthe Euribor rate, I illustrate the three-month Euribor futures rate in high frequency on twospecific announcement dates in Figure B.6. The upper panel plots the Euribor futures ratefrom 08:00 to 18:00 CET for April 6, 2006. At 13:45 CET, the ECB announced through apress release that it is keeping the target rate unchanged. Since this decision was expectedby the market, the futures rate did not exhibit significant change around the press releasetime. But it decreased sharply during the press conference window. This is because, contraryto market expectation of an interest rate hike later in the year, Jean-Claude Trichet told the
and Wong (2018). The Euro area monetary policy measure based on the three-month Euribor futures hasbeen used in papers including Bernoth and Hagen (2004), Rosa and Verga (2008), and Ranaldo and Rossi(2010). They show that the three-month Euribor futures rate is an unbiased predictor of Euro area policyrate changes.
30 To be more specific, the three-month Euribor future is a commitment to engage in a three-month loan ordeposit of a face value of 1,000,000 Euros. Futures prices are quoted on a daily basis. There are four deliverydates during a year, namely the third Wednesday of March, June, September and December.
31 I obtain the dates of the FOMC meetings from the Federal Reserve Board website athttp://www.federalreserve.gov/monetarypolicy/fomccalendars.htm, and those of the ECB meetings from theECB website at https://www.ecb.europa.eu/press/govcdec/mopo. I also verify the exact times of the monetarypolicy announcements using the first news article about them on Bloomberg.
32 See Rosa and Verga (2008) for a description of the institutional features unique to ECB monetary policyannouncements.
39

press that “the current suggestions regarding the high probability of an increase of rates inour next meeting do not correspond to the present sentiment of the Governing Council.” Thedecline in Euribor futures rate during the press conference time window thus reflect market’srevision of its expectations. The bottom panel of Figure B.6 plots the Euribor futures ratefor November 3, 2011, when the ECB unexpectedly cut interest rates by 25bps for the firsttime in two years. The sharp decline in the Euribor futures rate around the time of thepress release reflect the change in market expectation. Given the unique institution featuresof ECB monetary policy announcements, I apply a window of 120 minutes that starts 10minutes (∆−) prior to the press release and ends 10 minutes (∆+) after the press conferenceto construct measures of ECB monetary policy shocks.
Furthermore, I consider two measures of monetary policy shocks for each region: a cur-rent period shock based on current month futures (mp1), and a long-term path shock basedon three-month-ahead futures (mp4). The long-term path shock is aimed at capturing anypersistent effects of current period shocks on long-term investment, which can occur when thecurrent period shocks change expectations about the future path of monetary policy rates.
The shock measures take the general form:
mpt = (fxt+∆+ − fxt−∆−) (7)
where t is the time when the FOMC or ECB issues an announcement, ft+∆+ is the FederalFunds futures or the Euribor futures ∆+ minutes after t, ft−∆− is the Federal Funds futures orthe Euribor futures ∆− minutes before t, and x denotes either 1 for current month futures or4 for three-month-ahead futures. For the US current monetary policy shock measure (mp1),Equation (7) is adjusted by the term D
D−t , where D is the number of days in the month. Thisis because the Federal Funds futures settle on the average effective overnight Federal Fundsrate.
I aggregate up the identified shocks to obtain monthly measures of monetary policy shocks,following Cochrane and Piazzesi (2002). I use the monetary policy measures from the monthprior to the loan dates (t) when estimating Equation (6), to ensure time consistency.
Extensive Margin To analyze how monetary policy shocks affect credit allocation acrossfirms in the Euro area at the extensive margin, I estimate Equation (6) with the the dependentvariable being the change in a dummy variable that takes the value 1 if the loan is given bya US bank and 0 if the loan is given by a Euro area bank between two consecutive loans foreach given firm i (denoted as ∆USBit). The main coefficients of interest are βq and δq. Iconjecture β2 to be negative, and δ2 to be positive, since, based on the model prediction,contractionary US monetary policy would induce firms in the second tercile of the zGi /z
Li
40

distribution to switch away from US banks, and contractionary ECB monetary policy wouldinduce firms in the second tercile of the zGi /z
Li distribution to switch into US banks. All the
specifications include firm fixed effects to account for potential demand-driven explanationsfor changes in the trends of firms’ borrowing behavior, as well as time fixed effects to controlfor common shocks.
Table 7 reports the regression results. Columns 1 and 3 show the average effects of the USand Euro area monetary policy shocks, based on measures of mp1 and mp4, respectively, onthe firms’ switching behavior. Results in Column 1 show that, on average, a 25-basis-pointshock to the current US monetary policy rates decreases the probability of firm switchingfrom a Euro area bank into a US bank by 3.4 percentage points, while a 25-basis-point shockto the Euro area monetary policy rates increases the probability of a firm switching from aEuro area bank into a US bank by 4.1 percentage points. The effects are larger and moresignificant when considering shocks to the path of monetary policy rates. Results in Column3 show that, on average, a 25-basis-point shock to the path of US monetary policy ratesdecreases the probability of firm switching into a US bank by 5.2 percentage points, whilesuch shock to the path of Euro area monetary policy rates increases the probability of a firmswitching into a US bank by 5.3 percentage points.The coefficients are statistically significantat the 5% level. The findings point to evidence of firm switching in the Euro area in responseto monetary policy shocks on average. In particular, firms respond slightly more to domesticmonetary policy shocks.
Turning to the coefficients of interest, columns 2 and 4 in Table 7 show the estimationsof how these effects vary for firms in different terciles of the zGi /z
Li distribution (Equation
(6)). Across both specifications, the effects of US and Euro area monetary policy shockson the probability of firm switching are around two times larger in the second tercile of thezGi /z
Li distribution than the other terciles, and highly significant. The point estimates of
β2 imply that a 25-basis-point shock to the current and long-term US monetary policy ratedecreases the probability of firm switching into a US bank by 6.0 and 7.6 percentage points,respectively, for firms in the second tercile of the zGi /z
Li distribution. For those firms, the point
estimates of δ2 imply that a 25-basis-point shock to the Euro area monetary policy increasesthe probability of firm switching into a US bank by 6.6-8.5 percentage points. The effects areagain larger when considering shocks to the path of monetary policy rates, suggesting thatfirm investments respond more to changing expectations about the future path of monetarypolicy rates. The results for the other two terciles are mostly statistically insignificant.
Overall, the results suggest that most of the firm switching effects are concentrated inthe second tercile of the zGi /z
Li distribution, where firms have relatively balanced exposure to
global risk relative to local risk. This evidence supports the model prediction on the effects
41

of bank funding shocks on credit allocation across firms at the extensive margin.
Intensive Margin Next, I turn to analyzing how monetary policy shocks affect creditallocation across firms in the Euro area at the intensive (interest rate) margin. I implementEquation (6) with the dependent variable being the change in the interest rate spread betweentwo consecutive loans for each given firm i (denoted as ∆Rit).33 The spread describes theamount the borrower pays in basis points over the LIBOR. The main coefficients of interestare again βq and δq. The model predicts that, conditional on Euro area (US) monetarypolicy and given contractionary US (Euro area) monetary policy, the interest rates of theinfra-marginal firms that continue to borrow from Euro area (US) banks decrease, reflecting a(positive) spillover effect. Thus, β1 (which summarizes the group of firms that are more likelyto be borrowing from Euro area banks) and δ3 (which summarizes the group of firms thatare more likely to be borrowing from US banks) are conjectured to be negative. The modelalso predicts that, under the above scenario, the interest rate spreads of the infra-marginalfirms that continue to borrow from US (Euro area) banks increase, reflecting a (negative)amplification effect. Thus, β3 and δ1 are conjectured to be positive.
Since these predictions are based on the assumption that there is stronger pass-throughfrom US monetary policy to the interest rates offered by US banks, and similarly Euro areamonetary policy to Euro area banks, I first perform a series of regressions to validate theseassumptions. Columns 1, 2, 4 and 5 in Table 8 report the results from regressions of changesin firm interest rate spreads (∆Rit) on changes in US and Euro area monetary policy shocks(∆USR and ∆EUR, respectively), a dummy variable that takes the value 1 for US or Euroarea banks and 0 otherwise (1(USB) or 1(EUB)), and interactions of these two variables:either an interaction between the US monetary policy shock and the US bank dummy variable(USR ∗ 1(USB)), or one between the Euro area monetary policy shock and the Euro areabank dummy variable (∆EUR ∗ 1(EUB)). The results confirm the assumption. Columns 1and 4 show that a 25-basis-point shock to the current and long-term US monetary policy ratedisproportionately increases the interest rate spread charged by US banks, by around 25 and33 basis points, respectively, on average relative to other banks. Results in columns 2 and5 show that a 25-basis-point shock to the current and long-term Euro area monetary policyrate disproportionately increases the interest rate spread charged by Euro area banks, by 34and 37 basis points, respectively, on average relative to other banks.
Turning to the coefficients of interest, columns 3 and 6 in Table 8 report the results of howthe effects of monetary policy shocks on interest rate spreads vary for firms in different terciles
33 To make the interest rate spreads as comparable as possible, the type of loan facilities (e.g., revolvingline, bank term loan, and institutional term loan) between two consecutive loans are matched.
42

of the zGi /zLi distribution (Equation (6)). As predicted, the coefficients β1 and δ3 are negative
across all specifications. Specifically, a 25-basis-point shock to the current US monetary policyrate decreases the interest rate spread for the infra-marginal firms that continue to borrowfrom Euro area banks by 22 basis points, while such a shock to the Euro area monetarypolicy rate decreases the interest rate spread for the infra-marginal firms that continue toborrow from US banks by 25 basis points. The effects are larger and more significant whenconsidering shocks to the path of monetary policy rates (column 6). A 25-basis-point shockto the long-term US (Euro area) monetary policy rate decreases the interest rate spread forthe infra-marginal firms that continue to borrow from Euro area (US) banks by 27 (32) basispoints. These results point to a (positive) spillover effect.
Furthermore, the coefficients β3 and δ1 are positive across all specifications, as predicted,and highly statistically significant. Specifically, a 25-basis-point shock to the current US mon-etary policy rate increases the interest rate spread for the infra-marginal firms that continueto borrow from US banks by 25 basis points. The effect increases to 32 basis points given a25-basis-point shock to the path of US monetary policy rate. Similarly, a 25-basis-point shockto the current and long-term Euro area monetary policy rate increases the interest rate spreadfor the infra-marginal firms that continue to borrow from Euro area banks by 34 and 40 basispoints, respectively. These results point to a (negative) amplification effect. Furthermore, theeffects on interest rates of the firms in the second tercile of the zGi /z
Li distribution, which,
based on the results from Table 7, is mostly comprised of marginal firms that may switchbanks, are ambiguous, as predicted.
Overall, the results in Table 8 support the model prediction on the effects of bank fundingshocks on credit allocation across firms at the intensive margin. Combined with the resultson the extensive margin effects, they point to evidence of a novel adverse selection channel ofmonetary policy transmission.
43

Table 7: Monetary Policy Shocks and Credit Allocation: Extensive Margin
(1) (2) (3) (4)mp1 mp1 mp4 mp4
∆USR -0.134* -0.209**(0.071) (0.083)
∆EUR 0.164** 0.211**(0.074) (0.089)
∆USR ∗ T 1 -0.049 -0.054(0.119) (0.128)
∆USR ∗ T 2 -0.241** -0.302**(0.120) (0.131)
∆USR ∗ T 3 -0.117 -0.163(0.118) (0.127)
∆EUR ∗ T 1 0.057 0.062(0.118) (0.137)
∆EUR ∗ T 2 0.264** 0.339***(0.118) (0.135)
∆EUR ∗ T 3 0.173 0.220*(0.116) (0.127)
Firm FE Yes Yes Yes YesTime FE Yes Yes Yes YesObservations 11,454 11,454 11,454 11,454R-squared 0.067 0.068 0.067 0.068
Notes. Regressions with the dependent variable being the change in a dummy variable that takes the value 1if the loan is given by a US bank and 0 if the loan is given by a Euro area bank between two consecutive loansfor each given firm i (denoted as ∆USB). USR denotes US monetary policy shocks, and EUR denotes Euroarea monetary policy shocks. T q is a dummy variable that takes the value 1 when the firm’s zGi /zLi measureat the time of the last loan issuance belongs to tercile q and 0 otherwise. For the specifications in columns 1and 2, the monetary policy measures used are current period shocks constructed from current month futures(mp1). For the specifications in columns 3 and 4, the monetary policy measures used are long-term pathshocks constructed from three-month-ahead futures (mp4). Year and firm fixed effects are included in allspecifications. Standard errors reported in parentheses are clustered by time. Source: Dealscan, Amadeus,Orbis, Computstat, Compustat Global, and author’s calculation. Significance at the 1 percent, 5 percent, and10 percent levels is indicated by ***, **, and *, respectively.
44

Table 8: Monetary Policy Shocks and Credit Allocation: Intensive Margin
(1) (2) (3) (4) (5) (6)mp1 mp1 mp1 mp4 mp4 mp4
∆USR ∗ 1(USB) 98.543** 132.458***(43.765) (47.986)
∆EUR ∗ 1(EUB) 136.633*** 147.375***(42.543) (49.864)
∆USR ∗ T 1 -89.354* -108.564*(48.542) (54.875)
∆USR ∗ T 2 62.796 78.342(52.769) (60.875)
∆USR ∗ T 3 98.427** 126.653**(46.293) (58.975)
∆EUR ∗ T 1 136.864** 158.539***(56.249) (57.986)
∆EUR ∗ T 2 76.563 83.457(52.087) (59.357)
∆EUR ∗ T 3 -101.876* -127.978**(54.681) (54.975)
Firm FE Yes Yes Yes Yes Yes YesTime FE Yes Yes Yes Yes Yes YesObservations 3,367 3,367 3,367 3,367 3,367 3,367R-squared 0.051 0.051 0.052 0.051 0.051 0.052
Notes. Regressions with the dependent variable being the change in the interest rate spread between two consecutive loans for each given firmi (denoted as ∆R). USR denotes US monetary policy shocks, and EUR denotes Euro area monetary policy shocks. 1(USB) and 1(EUB) aredummy variables that takes the value 1 for US and Euro area banks, respectively, and 0 otherwise. T q is a dummy variable that takes the value 1when the firm’s zGi /zLi measure at the time of the last loan issuance belongs to tercile q and 0 otherwise. For the specifications in columns 1-3, themonetary policy measures used are current period shocks constructed from current month futures (mp1). For the specifications in columns 4-6, themonetary policy measures used are long-term path shocks constructed from three-month-ahead futures (mp4). The specifications in column 1 and 4include USR, 1(USB), and EUR as regressors. The specifications in column 2 and 5 include USR, 1(EUB), and EUR as regressors. Year and firmfixed effects are included in all specifications. Standard errors reported in parentheses are clustered by time. Source: Dealscan, Amadeus, Orbis,Computstat, Compustat Global, and author’s calculation. Significance at the 1 percent, 5 percent, and 10 percent levels is indicated by ***, **, and*, respectively.
45

8 Conclusion
The rise of global banking has transformed financial systems and corporate financing acrossthe world over the past two decades. This paper provides a new theory on the mechanismdriving credit allocation in globalized financial systems, and tests it using cross-country loan-level data. I show that bank specialization in global versus local information—information onglobal versus local risk factors—plays a key role in determining bank-firm sorting and creditallocation in financial systems with both global and local banks.
I point out that that the traditional theory of bank specialization in hard or soft informa-tion is insufficient to explain observed sorting patterns between firms and banks in globalizedfinancial systems, revealing a puzzle in the mechanism driving global banking credit. In lightof the puzzle, I develop a model of banking in which there are global and local banks, andfirms that have return dependent on exposure to global and local risk. Each bank faces aproblem of asymmetric information: global banks have the technology to extract informationon global risk factors but not local risk factors, and vice versa for local banks. The modelshows that this double information asymmetry creates a segmented credit market affectedby double adverse selection: banks are adversely selected against by firm selection, as firmsselect into borrowing from the bank which observes the more favorable component of theirrisk exposure.
I further apply the model to analyze the macroeconomic implications of the adverse selec-tion problem, studying the impact on credit allocation of funding shocks to banks. The modeldemonstrates that, given a monetary policy shock, adverse selection affects credit allocationat both the extensive and intensive margins. It induces firms with relatively balanced globaland local risk components to switch banks, and generates spillover and amplification effectsthrough adverse interest rates. I test the model using a cross-country bank-firm loan-leveldataset matched with firm balance sheet data. I find bank-firm sorting patterns, and evi-dence of firm switching behavior and interest rate changes given US and Euro area monetarypolicy shocks, that support the model predictions. The results point to a new double adverseselection channel of international monetary policy transmission.
Overall, the evidence substantiates that bank specialization in global versus local infor-mation is a key mechanism driving credit allocation in globalized banking systems. Thismechanism has potentially important policy implications. Relative to the traditional viewthat firms and banks sort based on hard versus soft information, this new mechanism sug-gests that global banks’ balance sheet may be more loaded on global risk than previouslythought, since firms with returns more dependent on global risk are more likely to select intoborrowing from them. This, in turn, calls for considerations from policy-makers for bank
46

regulations on exposure limits and macroprudential policies.
References
Albuquerque, R., G. H. Bauer, and M. Schneider (2009). Global private information ininternational equity markets. Journal of Financial Economics 94 (1), 18–46.
Aoki, K., G. Benigno, and N. Kiyotaki (2016). Monetary and financial policies in emergingmarkets. Working Paper.
Bacchetta, P. and E. Van Wincoop (2006). Can information heterogeneity explain the ex-change rate determination puzzle? American Economic Review 96 (3), 552–576.
Baskaya, Y., J. Giovanni, S. Kalemli-Ozcan, and M. Ulu (2021). International spillovers andlocal credit cycles. Forthcoming.
Beck, T., A. Demirguc-Kunt, and M. S. M. Peria (2007). Reaching out: Access to and use ofbanking services across countries. Journal of Financial Economics 85, 234–266.
Beck, T. and M. S. M. Peria (2010). Foreign bank participation and outreach: Evidence fromMexico. Journal of Financial Intermediation 19 (1), 52–73.
Berger, A., N. Miller, M. Petersen, R. Rajan, and J. Stein (2005). Does function followorganizational form? Evidence from the lending practices of large and small banks. Journalof Financial economics 76 (2), 237–269.
Berger, A. N., L. F. Klapper, and G. F. Udell (2001). The ability of banks to lend toinformationally opaque small businesses. Journal of Banking and Finance 25, 2127–2167.
Bernanke, B. S. and A. Blinder (1992). The federal funds rate and the channels of monetarytransmission. The American Economic Review 82 (4), 901–921.
Bernanke, B. S. and M. Gertler (1995). Inside the black box: the credit channel of monetarypolicy transmission. Journal of Economic perspectives 9 (4), 27–48.
Bernoth, K. and J. v. Hagen (2004). The euribor futures market: Efficiency and the impactof ecb policy announcements. International finance 7 (1), 1–24.
Blundell, R. and S. Bond (1998). Initial conditions and moment restrictions in dynamic paneldata models. Journal of econometrics 87 (1), 115–143.
Borio, C. and H. Zhu (2012). Capital regulation, risk-taking and monetary policy: A missinglink in the transmission mechanism? Journal of Financial stability 8 (4), 236–251.
Boyd, J. H. and E. C. Prescott (1986). Financial intermediary-coalitions. Journal of Economictheory 38 (2), 211–232.
Bräuning, F. and V. Ivashina (2018). US monetary policy and emerging market credit cycles.Working Paper.
47

Bräuning, F. and V. Ivashina (2020). Monetary policy and global banking. The Journal ofFinance 75 (6), 3055–3095.
Bruno, V. and H. S. Shin (2015a). Capital flows and the risk-taking channel of monetarypolicy. Journal of Monetary Economics 71, 119–132.
Bruno, V. and H. S. Shin (2015b). Cross-border banking and global liquidity. Review ofEconomic Studies 82 (2), 535–564.
Campbell, T. S. and W. A. Kracaw (1980). Information production, market signalling andthe theory of financial intermediation. The Journal of Finance 35 (4), 863–882.
Cetorelli, N. and L. Goldberg (2012a). Banking globalization and monetary transmission.Journal of Finance 67 (5), 1811–1843.
Cetorelli, N. and L. S. Goldberg (2012b). Liquidity management of US global banks: Internalcapital markets in the great recession. Journal of International Economics 88 (2), 299–311.
Claessens, S. (2006). Competitive implications of cross-border banking. In G. Caprio, D. D.Evanoff, and G. G. Kaufman (Eds.), Cross-Border Banking: Regulatory Challenges, pp.151–182. Hackensack, NJ: World Scientific Publishing.
Claessens, S., A. Demirgüç-Kunt, and H. Huizinga (2001). How does foreign entry affectdomestic banking markets? Journal of Banking and Finance 25 (5), 891–911.
Clarke, G. R., R. J. Cull, M. S. M. Peria, and S. M. Sanchez (2005). Bank lending to smallbusinesses in Latin America: Does bank origin matter? Journal of Money, Credit andBanking 37 (1), 83–118.
Cochrane, J. H. and M. Piazzesi (2002). The fed and interest rates—a high-frequency identi-fication. American Economic Review 92 (2), 90–95.
Coimbra, N. and H. Rey (2017). Financial cycles with heterogeneous intermediaries. WorkingPaper.
De Blas, B. and K. N. Russ (2013). All banks great, small and global: Loan pricing andforeign competition. International Review of Economics & Finance 26, 4–24.
De Haas, R. and I. V. Lelyveld (2014). Multinational banks and the global financial crisis:Weathering the perfect storm? Journal of Money, Credit and Banking 46 (1), 333–364.
De Haas, R. and N. Van Horen (2013). Running for the exit? International bank lendingduring a financial crisis. The Review of Financial Studies 26 (1), 244–285.
De Meza, D. and D. C. Webb (1987). Too much investment: A problem of asymmetricinformation. Quarterly Journal of Economics 102 (2), 281–292.
Dedola, L., P. Karadi, and G. Lombardo (2013). Global implications of national unconven-tional policies. Journal of Monetary Economics 60, 66–85.
48

Dell’Ariccia, G. and R. Marquez (2004). Information and bank credit allocation. Journal ofFinancial Economics 72 (1), 185–214.
Detragiache, E., T. Tressel, and P. Gupta (2008). Foreign banks in poor countries: theoryand evidence. Journal of Finance 63 (5), 2123–2160.
Diamond, D. (1984). Financial intermediation and delegated monitoring. Review of EconomicStudies 51 (3), 393–414.
Edison, H. J., R. Levine, L. Ricci, and T. Sløk (2002). International financial integration andeconomic growth,. Journal of International Money and Finance 21, 749–776.
Gertler, M. and P. Karadi (2015). Monetary policy surprises, credit costs, and economicactivity. American Economic Journal: Macroeconomics 7 (1), 44–76.
Gopinath, G. and J. C. Stein (2018). Banking, trade and the making of a dominant currency.Working Paper.
Gormley, T. A. (2010). The impact of foreign bank entry in emerging markets: Evidence fromIndia. Journal of Financial Intermediation 19 (1), 26–51.
Gormley, T. A. (2014). Costly information, entry and credit access. Journal of EconomicTheory 154 (633-667).
Gorodnichenko, Y. (2012). Using firm optimization to evaluate and estimate productivity andreturns to scale. Working Paper.
Gorodnichenko, Y. and M. Weber (2016). Are sticky prices costly? Evidence from the stockmarket. American Economic Review 106 (1), 165–99.
Ivashina, V. (2009). Asymmetric information effects on loan spreads. Journal of financialEconomics 92 (2), 300–319.
Ivashina, V. and D. Scharfstein (2010). Bank lending during the financial crisis of 2008.Journal of Financial Economics 97 (3), 319–338.
Ivashina, V., D. S. Scharfstein, and J. C. Stein (2015). Dollar funding and the lending behaviorof global banks. Quarterly Journal of Economics 130 (3), 1241–1281.
Kalemli-Ozcan, S., B. Sorensen, C. Villegas-Sanchez, V. Volosovych, and S. Yesiltas (2015).How to construct nationally representative firm level data from the ORBIS global database.Working Paper.
Kashyap, A. K. and J. C. Stein (2000). What do a million observations on banks say aboutthe transmission of monetary policy? American Economic Review 90 (3), 407–428.
Kuttner, K. N. (2001). Monetary policy surprises and interest rates: Evidence from the fedfunds futures market. Journal of monetary economics 47 (3), 523–544.
49

Levine, R. (1996). Foreign banks, financial development and economic growth. In C. E.Barfield (Ed.), International Financial Markets: Harmonization versus Competition, pp.224–254. Washington, DC: AEI Press.
Levinsohn, J. and A. Petrin (2003). Estimating production functions using inputs to controlfor unobservables. Review of Economic Studies 70 (2), 317–342.
Liberti, J. M. and M. A. Petersen (2018). Information: Hard and soft. Working Paper.
Maggiori, M., B. Neiman, and J. Schreger (2018). International currencies and capital allo-cation. Working Paper.
Martin, A. and F. Taddei (2013). International capital flows and credit market imperfections:A tale of two frictions. Journal of International Economics 89 (2), 441–452.
Mian, A. (2006). Distance constraints: The limits of foreign lending in poor economies.Journal of Finance 61 (3), 1465–1505.
Miranda-Agrippino, S. and H. Rey (2018). US monetary policy and the global financial cycle.Working Paper.
Morais, B., J.-L. Peydró, J. Roldan, and C. Ruiz (2018). The international bank lendingchannel of monetary policy rates and quantitative easing: credit supply, reach-for-yield andreal effects. Journal of Finance, Forthcoming.
Nakamura, E. and J. Steinsson (2018). High frequency identification of monetary non-neutrality: The information effect. Quarterly Journal of Economics 133 (3), 1283–1330.
Niepmann, F. (2015). Banking across borders. Journal of International Economics 96 (2),244–265.
Olley, S. and A. Pakes (1996). Dynamics of productivity in the telecommunications equipment.Econometrica 64 (6), 1263–1297.
Ongena, S., I. Schindele, and D. Vonnák. (2017). In lands of foreign currency credit, banklending channels run through? Working Paper.
Petersen, M. and R. G. Rajan (1994). The benefits of lending relationships: Evidence fromsmall business data. Journal of Finance 49 (1), 3–37.
Petersen, M. A. and R. G. Rajan (2002). Does distance still matter? The informationrevolution in small business lending. The journal of Finance 57 (6), 2533–2570.
Popov, A. and G. F. Udell (2012). Cross-border banking, credit access and the financial crisis.Journal of international economics 87 (1), 147–161.
Ramakrishnan, R. TS, and A. V. Thakor (1984). Information reliability and a theory offinancial intermediation. Review of Economic Studies 51 (3), 415–432.
50

Ranaldo, A. and E. Rossi (2010). The reaction of asset markets to swiss national bankcommunication. Journal of International Money and Finance 29 (3), 486–503.
Rey, H. (2016). International channels of transmission of monetary policy and the MundellianTrilemma. IMF Economic Review 64 (1), 6–35.
Rigobon, R. and B. Sack (2004). The impact of monetary policy on asset prices. Journal ofMonetary Economics 51 (8), 1553–1575.
Rosa, C. and G. Verga (2008). The impact of central bank announcements on asset prices inreal time. International Journal of Central Banking 4 (2), 175–217.
Schnabl, P. (2012). The international transmission of bank liquidity shocks: Evidence froman emerging market. Journal of Finance 67 (3), 897–932.
Sengupta, R. (2007). Foreign entry and bank competition. Journal of Financial Eco-nomics 84 (2), 502–528.
Stein, J. (2002). Information production and capital allocation: Decentralized versus hierar-chical firms. Journal of Finance 57 (5), 1891–1921.
Stiglitz, J. E. and A. Weiss (1981). Credit rationing in markets with imperfect information.American Economics Review 71 (3), 393–410.
Stock, J. H. and M. W. Watson (2002). Macroeconomic forecasting using diffusion indexes.Journal of Business & Economic Statistics 20 (2), 147–162.
Sufi, A. (2007). Information asymmetry and financing arrangements: Evidence from syndi-cated loans. The Journal of Finance 62 (2), 629–668.
Takáts, E. and J. Temesvary (2020). The currency dimension of the bank lending channel ininternational monetary transmission. Journal of International Economics, 103309.
Wong, A. (2018). Transmission of monetary policy to consumption and population aging.Working Paper.
51

APPENDIX A MODEL SOLUTION AND PROOFS
I.A Equilibrium Solution
Propositions 1–3 lead to a full characterization of the equilibrium solution on RG and RL.Based on these characterizations, I solve for the equilibrium interest ratesRG(zGi ) andRL(zLi ),and thresholds z̄Li = z̄L(zGi ) and z̄Gi = z̄G(zLi ), for zGi ∈ [zG, 1] and zLi ∈ [zL, 1] as follows.
First, let RG(zGi , z̄Li ) and RL(zLi , z̄
Gi ) be the implicit functions which give the rate at which
each banks’ expected profit (Equation (3a) and (3b)) would be zero for a given observedcomponent combined with a given threshold on the unobserved component34:
RG(zGi , z̄Li ) = RG(zGi ) s.t. EG[πG(zGi , z̄
Li ,RG(zGi ))] = 0;
RL(zLi , z̄Gi ) = RL(zLi ) s.t. EL[πL(zLi , z̄
Gi ,RL(zLi ))] = 0.
Based on Proposition 2, for each given zGi , the corresponding threshold z̄Li is the zLi forthe firm (zGi , z
Li ) for which RL(zLi )=RG(zGi ). By symmetry, z̄G(z̄Li ) = zGi . Therefore, the
equilibrium rate RG(zGi ) and threshold z̄Li are the solutions to the system of equations:
RG(zGi , z̄Li ) = RL(z̄Li , z
Gi ).
RG(zGi ) = RG(zGi , z̄Li ).
(A.1)
Similarly, for each given zLi , the equilibrium rate RL(zLi ) and threshold z̄Gi are the solutionsto the system of equations:
RL(zLi , z̄Gi ) = RG(z̄Gi , z
Li ).
RL(zLi ) = RL(zLi , z̄Gi ).
(A.2)
Furthermore, I apply Proposition 2 to solve for zG and zL, the cut-offs below which theexpected profits of the firms are too low for the global bank and local bank to break even inexpectation, regardless of the rate charged. At these cut-off points, the maximum expectedprofits of the banks are zero, all firms default given the equilibrium interest rates. The nextlemma establishes that the cut-offs zG and zL are thresholds to each other.
Lemma 2. zG = z̄G(zL), and zL = z̄L(zG).
Given Lemma 2, zG and zG are the solutions to the system of equations:
zL∫0
1∫0
(zGi + zLi + ui) dFzL(ui, zLi ) = rG;
zG∫0
1∫0
(zGi + zLi + ui) dFzG(ui, zGi ) = rL.
where FzL(.) and FzG(.) denote the cumulative distribution function of the relevant variable
34 The implicit equations are fully written out in the appendix as Equations (A.5a) and (A.5b).
52

conditional on zLi ≤ zL and zGi ≤ zG, respectively. The solutions to this system is:
zG =1
3(4rG − 2rL − 1) and zL =
1
3(4rL − 2rG − 1). (A.3)
The bounds zG and zL define the cut-offs on zGi and zLi , respectively, below which globalbanks and local banks would not make loans. They are increasing in the banks’ own fundingcost and decreasing in the funding cost faced by the other bank type. In other words, facinghigher funding cost induces the respective banks to be more restrictive on the riskiest firmto which they lend, while higher funding cost faced by the other bank type induces them tolend to riskier firms. Interestingly, each banks’ own funding cost has a stronger effect on therespective lower bound than the other banks’ funding cost. Appendix Figure A.1 illustratesthe cut-offs zG and zL in a space that summarizes all the firms in the economy. Given thecut-offs, firms in Region A are not offered loans. Firms in Region B can only receive loansfrom local banks, and firms in Region C can only receive loans from global banks.
Figure A.1: Firm Space
zGi
zLi
A
B
C
1
1zG
zL
Notes. The plot summarizes all the firms in the economy. The bounds zG and zL define the cut-offs belowwhich global banks and local banks, respectively, would not make loans. Firms in Region A are not offeredloans. Firms in Region B can only receive loans from local banks. Firms in Region C can only receive loansfrom global banks.
I.B Model Equilibrium
Asymmetric Equilibrium. I solve the model numerically to study firm-bank sorting inthe general case when there is variation between the funding costs of global and local banks(rG 6= rL).
Panel (a) of Figure A.2 provides an illustration of the equilibrium when rG < rL, where
53

rG = 1.00 and rL = 1.01. Compared to the symmetric case, global banks are able to capture agreater share of the loan market given their funding advantage. In particular, they are able toattract all the firms with zGi > z̃G, and they provide loans to firms with lower zGi componentsthan before, since the cut-off zG is increasing in rG (Equation (A.3)).
Panel (b) of Figure A.2 illustrates the equilibrium when rG > rL, where rL = 1.00 andrG = 1.01. The results are analogous.
Figure A.2: Firm-Bank Sorting under Asymmetric Equilibrium
zGi
zLi
A
B
C
1
1
L
G
zG
zL
zGi
zLi
1
1zG
zL
(a) (b)
A
B
C
L
G
rG < rLrG = rL rG > rL
z̃G
z̃L
rG = rL
Notes. Panel (a) illustrates the firm-bank sorting when rG < rL, where rG = 1.00 and rL = 1.01. Panel (b)illustrates the firm-bank sorting when rG > rL, where rL = 1.00 and rG = 1.01. For both plots, Region Adepicts the region where no loans are given. Region B depicts the region where only local bank loans are givenand no global banks would give loans. Region C depicts the region where only global bank loans are givenand no local banks would give loans. Region L depicts the region where both global and local banks competefor loans, and loans are given by local banks in equilibrium. Region G depicts the region where both globaland local banks compete for loans, and loans are given by global banks in equilibrium.
54

I.C Proofs
Proof of Proposition 1. Based on Equations (2a) and (3a), RG(zGi ) is given implicitly bythe global bank’s expected profit function:
EG[πG(zGi )] =
[ ∫Gc
(∫Ga
(zGi + zLi + ui) dF (ui) +
∫Gb
RG(zGi ) dF (ui)
)dF (zLi )
]− rG = 0
where Ga =
{ui∣∣ 0 ≤ ui < min(max(0,RG(zGi )− zGi − zLi ), 1)
}Gb =
{ui∣∣ min(max(0,RG(zGi )− zGi − zLi ), 1) ≤ ui ≤ 1
}Gc =
{zLi∣∣ zLi : (zGi , z
Li ) ∈ SG
}(A.4)
Equation (A.4) can be decomposed into two regions over zGi :
1. No loans: zGi such that zGi + EG[zLi | (zGi , zLi ) ∈ SG] + 1/2 < rG.
2. Loans: zGi such that zGi + EG[zLi | (zGi , zLi ) ∈ SG] + 1/2 ≥ rG.
Equilibrium rates RG(zGi ) are defined in region 2.Analyzing ∂EG[πG(zGi )]
∂zGi: An increase in zGi lowers the probability of default and increases
the bank’s expected return. Thus ∂EG[πG(zGi )]
∂zGi> 0 ∀zGi .
Given that, I first prove that RG is weakly decreasing in zGi . Assume otherwise: thereexists zGj > zGi such that RG(zGj ) > RG(zGi ). Given perfect competition with free entry,
E[πG(zGi )] = 0 for RG(zGi ). Because ∂EG[πG(zGi )]
∂zGi> 0, another global bank could offer at most
the same RG(zGi ) for zGj and at least break even. Therefore, it could offer RG(zGj ) ≤ RG(zGi ),which is a contradiction. RL is similarly weakly decreasing in zLi .
Analyzing ∂EG[zLi |(zGi ,zLi )∈SG]
∂RG(zGi ): An increase in the rate RG(zGi ) may cause some marginal
values of zLi to switch from selecting the global to the local bank. Since both RG(zGi ) andRL(zLi ) are non-increasing, those that do will be those with the lowest RL(zLi ) and thereforethe highest zLi , lowering the expected value of zLi over firms which select the global bank.Therefore, ∂EG[zLi |(zGi ,zLi )∈SG]
∂RG(zGi )≤ 0.
Analyzing ∂EG[πG(zGi )]
∂RG(zGi ): An increase in RG(zGi ) drives the expected return to the global
bank through two effects:
1. It increases the return in all outcomes where previously there was no default.
2. It decreases the expected value of zLi for firms which will select the global bank, whichdecreases the expected return in case of default.
55

Absent other constraints, at any point, ∂EG[πG(zGi )]
∂RG(zGi )could be dominated by either term and
be positive, negative, or zero.Now I prove that RG is strictly decreasing in zGi (where loans are made, in region 2).
Assume otherwise: there exists zGj > zGi such that RG(zGj ) ≥ RG(zGi ). Consider againthe perfect competition and free entry among global banks. EG[πG(zGi )] = 0 for RG(zGi ).Because ∂EG[πG(zGi )]
∂zGi> 0, if RG(zGj ) = RG(zGi ) there would be excess profit: EG[πG(zGj )] > 0.
Regardless of the sign of ∂EG[πG(zGi )]
∂RG(zGi ), another bank could charge a lower rate RG(zGj ) without
losing money in expectation:
• If ∂EG[πG(zGi )]
∂RG(zGi )≤ 0, decreasing the rate would leave profit unchanged or increased and
clearly be possible.
• If ∂EG[πG(zGi )]
∂RG(zGi )> 0, a competing global bank could trade the excess profit to offer a lower
rate and capture the market while still at least breaking even.
Therefore RG(zGj ) < RG(zGi ), which is a contradiction.The proof that RL is strictly decreasing in zLi is entirely analogous.
Further analysis. Consider the two effects which drive ∂EG[πG(zGi )]
∂RG(zGi ). The first is trivially
continuous. The second is continuous because RL being strictly decreasing means that dif-ferential changes in RG(zGi ) cannot have discontinuous effects on selection SG.
Consider also the implicit function ofRG(zGi ) where the the bank profit is zero: EG[πG(zGi )] =
0. By the implicit function theorem, dRG(zGi )
dzGi= −∂EG[πG]
∂zGi/∂EG[πG(zGi )]
∂RG(zGi ). We know that
dRG(zGi )
dzGi< 0 (RG is strictly decreasing) and ∂EG[πG]
∂zGi> 0. Therefore, ∂EG[πG(zGi )]
∂RG(zGi )> 0, and the
positive profit effect of increasing RG(zGi ) dominates the negative selection effect.Finally, considering the regions over zGi , the boundary between the two regions occurs
when zGi +EG[zLi | (zGi , zLi ) ∈ SG]+1/2 = rG. Since ∂EG[zLi | (zGi ,zLi )∈SG]
∂RG(zGi )< 0 and dRG(zGi )
dzGi< 0,
EG[zLi | (zGi , zLi ) ∈ SG] is increasing in zGi . Therefore there is a unique zGi = rG − EG[zLi |
(zGi , zLi ) ∈ SG]− 1/2. Equilibrium rates RG(zGi ) are defined for all zGi ≤ zGi ≤ 1.
All analyses apply to the analogous terms for local banks.
Proof of Proposition 2.1) In an equilibrium market configuration that supports both types of banks, there must
exist a set of marginal firms that are indifferent between the contracts by global banks andlocal banks, which occur when RG(zGi ) = RL(zLi ). Let f(zGi , z
Li ) = RG(zGi ) − RL(zLi ) = 0.
By Proposition 1, ∂f(zGi ,zLi )
∂zLi= −∂RL(zLi )
∂zLi> 0 for zLi ∈ [zLi , 1]. By the implicit function
56

theorem, for each zGi ∈ [zGi , 1], there exists a threshold function z̄L: zGi 7→ z̄Li , such thatRG(zGi ) = RL(z̄Li ).
The proof on the existence of a threshold function z̄G: zLi 7→ z̄Gi such that RL(zLi ) =
RG(z̄Gi ) is analogous.2) Consider a marginal firm that faces RG(zGi ) = RL(zLi ). As zLi decreases, RL(zLi )
increases by Proposition 1, while RG(zGi ) remains constant. Since now RL(zLi ) > RG(zGi ),those firms would select a global bank. Therefore, firms with zLi < z̄Li ∈ SG. Conversely,as zLi increases, RL(zLi ) decreases by Proposition 1, while RG(zGi ) remains constant. SinceRL(zLi ) < RG(zGi ), those firms would select a local bank. Therefore, SG = {(zGi , zLi ) : zLi ≤z̄L(zGi )}, and SL = {(zGi , zLi ) : zLi > z̄L(zGi )}
The proof that SL = {(zGi , zLi ) : zGi < z̄G(zLi )} and SG = {(zGi , zLi ) : zGi ≥ z̄G(zLi )} isanalogous.
Proof of Proposition 3. The equilibrium interest rate functions are solution to the bankexpected profits equations subject to zero profits conditions and firm selection:
EG[πG(zGi )] =
[ ∫Gc
(∫Ga
(zGi + zLi + ui) dF (ui) +
∫Gb
RG(zGi ) dF (ui)
)dF (zLi )
]− rG = 0,
where Ga =
{ui∣∣ 0 ≤ ui < min(max(0, RG(zGi )− zGi − zLi ), 1)
},
Gb =
{ui∣∣ min(max(0, RG(zGi )− zGi − zLi ), 1) ≤ ui ≤ 1
},
Gc =
{zLi∣∣ 0 < zLi ≤ z̄L(zGi ))
};
(A.5a)
EL[πL(zLi )] =
[ ∫Lc
(∫La
(zGi + zLi + ui) dF (ui) +
∫Lb
RL(zLi ) dF (ui)
)dF (zGi )
]− rL = 0,
where La =
{ui∣∣ 0 ≤ ui < min(max(0, RL(zLi )− zGi − zLi ), 1)
},
Lb =
{ui∣∣ min(max(0, RL(zLi )− zGi − zLi ), 1) ≤ ui ≤ 1
},
Lc =
{zGi∣∣ 0 < zGi ≤ z̄G(zLi ))
}.
(A.5b)Analyzing ∂EG[πG(zGi )]
∂RL(z̄L(zGi )): An increase in RL(z̄L(zGi )) shifts marginal firms from the local to
global bank at (zGi , z̄L(zGi )). This increases the threshold value z̄L(zGi ) at zGi . As a result,
the expected profit of the global bank increases, all else held constant, so ∂EG[πG(zGi )]
∂RL(z̄L(zGi ))> 0.
57

The analysis that ∂EG[πG(zGi )]
∂RG(zGi )> 0 is outlined in the proof for Proposition 1.
By the implicit function theorem, dRG(zGi )
dRL(z̄L(zGi ))= − ∂EG[πG(zGi )]
∂RL(z̄L(zGi ))/∂EG[πG(zGi )]
∂RG(zGi )< 0.
Proof of Lemma 2. At zG, the equilibrium rate RG(zG) is such that all firms whichapproach global banks default: RG(zG) = zG + z̄L(zG) + 1. Similarly at zL, RL(zL) =
z̄G(zL) + zL + 1. It is clear that at least one entry zj must be the threshold for the other zk:z̄j(zk) = zj .
Without loss of generality, let j = G and k = L: z̄G(zL) = zG. Assume otherwise,z̄L(zG) > zL. Given z̄G(zL) = zG, RL(zL) = zG+zL+1. It follows RG(zG) = zG+ z̄L(zG)+
1 > zG + zL + 1 = RL(zL). This implies RL(z̄L(zG)) > RL(zL), which contradicts the strictmonotonicity of RL. At the same time, z̄L(zG) < zL is a contradiction, since local banksmake no loans to firms with zLi < zL by definition. Therefore, zL = z̄L(zG).
The proof that zG = z̄G(zL) is analogous.
Proof of Lemma 1. Let rG = rL. The expected profit equations for global banks and localbanks subject to the break even conditions and firm selection, given by Equations (A.5a) and(A.5b), respectively, are symmetric. The result that z̄L(zGi ) = zGi and z̄G(zLi ) = zLi follows.
Proof of Corollary 2. Let rG = rL. Assume firm i selects into borrowing from a globalbank. Based on firm selection criteria from Equations (2a) and 2b and Assumption 1,RG(zGi ) ≤ RL(zLi ), which implies zGi ≥ zLi by Proposition 1 and Lemma 1. Now assumezGi ≥ zLi . Based on Equations (A.5a) and (A.5b), RGi(zGi ) ≤ RLi(z
Li ), which implies firm i
selects into borrowing from a global bank.The proof that a firm selects a local bank if and only if zLi > zGi is analogous.
58

APPENDIX B Additional Discussion of Model Implications
This section supplements the model discussion in Section 4.3. I apply the theoretical frame-work to discuss how the double adverse selection in globalized financial markets sheds newlight on the effects of banks’ funding shocks on banks portfolio riskiness and the benefits andcosts of financial integration.
Overall Riskiness in Bank Portfolios. The prior exercise suggests that credit substi-tution driven by adverse selection is an important effect of monetary policy transmission.Furthermore, it could potentially confound with bank risk-taking behavior. I investigate thisissue further by analyzing how a funding shock affects the overall riskiness of banks’ portfolios,and decomposing the overall effect into the changes due to credit substitution and those dueto bank risk-taking.
Let the riskiness of the portfolio held by a bank j be expressed in terms of the firms’average output Rj =
∑ni=1(zGi + zLi )/n, where j denotes either a global bank or local bank,
and i denotes the firm in the respective bank portfolio. Higher average output Rj implieslower risk.
I compute Rj before and after a decline in rG using numerical simulation, and examine thechange in Rj of each bank’s portfolios given the change. Specifically, I run the simulation fortwo sets of parameter values for the initial equilibrium. In scenario 1, rG < rL in the initialequilibrium: rG = 1.015, rL = 1.050, and rG′ = 1.005 ex-post. In scenario 2, rG = rL = 1.015
in the initial equilibrium, and rG′ = 1.005. Table A.1 presents the results. The local bank’sportfolios become unambiguously riskier after the funding cost change due to negative spillovereffects. On the other hand, the overall riskiness of the global bank’s portfolio may increase ordecrease depending on the relationship between rG and rL in the initial equilibrium.
In scenario 1, the overall riskiness of the global bank’s portfolio increases given the declinein funding cost. This is due to the risk profiles of both the marginal firms that switch intothe global bank and the newly added firms that were too risky to receive loans before (RegionG′1 and Region G
′2 in Panel (a) of Figure A.3, respectively). The average risk of the firms
that newly enter the credit market and borrow from the global bank is unambiguously higherthan that of the infra-marginal firms that were getting loans from the global bank, drivingup the overall riskiness of the global bank’s portfolio. This change can be attributed to bankrisk-taking. The marginal firms that switch into borrowing from the global bank, despitehaving higher zLi components conditional on zGi , have lower z
Gi components on average—and,
as a result, higher combined average risk—than those of the infra-marginal firms. This furtherdrives up the overall riskiness of the global bank’s portfolio, and the driving force is creditsubstitution.
59

In scenario 2, the overall riskiness of the global bank’s portfolio lowers. While the riskinessof the firms that newly enter the credit market is still unambiguously higher than that of theinfra-marginal firms (Region G
′2 in Panel (b) of Figure A.3), the average riskiness of the
switching firms is lower. The average riskiness of both the zLi and zGi components of theswitching firms are lower than the infra-marginal firms that were initially getting loans fromglobal banks. The risk profile of the marginal firms dominate the risk adjustments in globalbank’s portfolio given the change in rG. In other words, the effects due to credit substitutiondominate the effects due to bank risk-taking in this scenario.
Figure A.3: Effects of a Decline in Funding Cost rG
(a) Scenario 1, rG < rL
zGi
zLi
1
1
0
pre
post
G′�1
L
G
G′�2
zG
zL′�
zG′�
zL
G′�3
(b) Scenario 2, rG = rL
zGi
zLi
1
1
0
pre
post
G′�2
L
G
G′�1
zG
zL′�
zG′�
zL
G′�3
Notes. Panel (a) Illustrates the equilibrium before and after a decline in rG based on simulations withparameter values rG = 1.015, rG
′= 1.005, and rL = 1.050. Panel (a) Illustrates the equilibrium before and
after a decline in rG based on simulations with parameter values rG = 1.015, rG′
= 1.005, and rL = 1.015.
Closed Economy vs. Financial Integration. An interesting counterfactual to consideris how this financially integrated economy compares with the benchmark closed economy, interms of bank-firm sorting, aggregate credit, and efficiency. In a closed economy where thereare only local banks, firms with zLi < rL − 1 are considered too risky to get loans (illustratedin Panel (b) of Figure 3). With financial integration, most of those firms, specifically firmswith zGi > zG, would be able to get loans from global banks (firms in Region n in Panel (a)of Figure A.4). Furthermore, a set of firms with stronger global components (zGi ) relative totheir local components (zLi ) would switch into borrowing from global banks (firms in RegionG in Panel (a) of Figure A.4), since they would receive lower interest rates from global banks,as shown in Panel (b) of the figure. Those firms would all benefit from financial integration.
However, the switching of firms leaves local banks with a riskier pool of firms, inducing
60
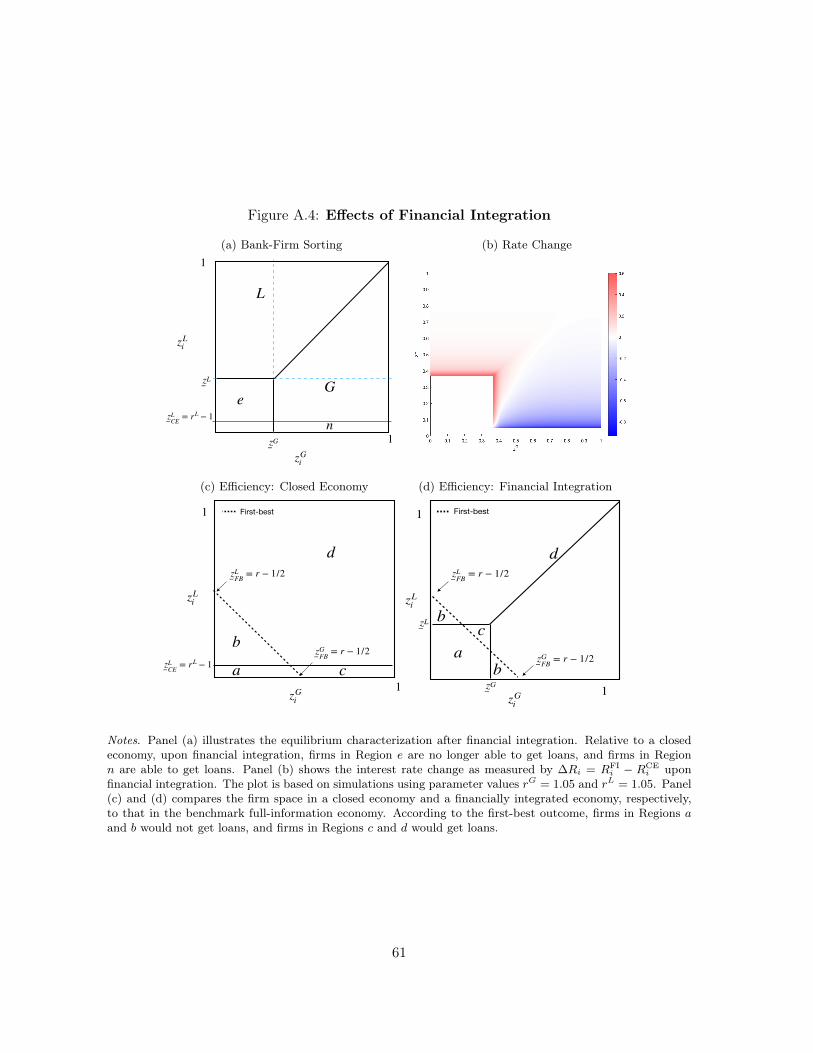
Figure A.4: Effects of Financial Integration
(a) Bank-Firm Sorting
zGi
zLi
1
1zG
zL
L
G
n
ezL
CE = rL − 1
(b) Rate Change
(c) Efficiency: Closed Economy
zGi
zLi
1
1
zLCE = rL − 1 c
bzG
FB = r − 1/2
zLFB = r − 1/2
a
d
First-best
(d) Efficiency: Financial Integration
zGi
zLi
1
1
zGFB = r − 1/2
zLFB = r − 1/2
zG
zL
ba
d
cb
First-best
Notes. Panel (a) illustrates the equilibrium characterization after financial integration. Relative to a closedeconomy, upon financial integration, firms in Region e are no longer able to get loans, and firms in Regionn are able to get loans. Panel (b) shows the interest rate change as measured by ∆Ri = RFI
i − RCEi upon
financial integration. The plot is based on simulations using parameter values rG = 1.05 and rL = 1.05. Panel(c) and (d) compares the firm space in a closed economy and a financially integrated economy, respectively,to that in the benchmark full-information economy. According to the first-best outcome, firms in Regions aand b would not get loans, and firms in Regions c and d would get loans.
61

Table A.1: Banks’ Overall Risk Before and After a Decline in rG
Pre Post Switching NewScenario 1 G 1.163 1.157 1.155 0.509
L 0.943 0.917 – –
Scenario 2 G 1.087 1.155 1.516 0.508L 1.155 1.085 – –
Notes. The table shows the riskiness of the portfolios held by a global bank (G) and a local bank (L) before(“pre”) and after (“post”) a decline in rG. The post effect is further decomposed by showing the riskiness of the“switching” firms and “new” firms that select into global banks after the change. Riskiness of bank portfoliosis measured as Rj =
∑ni=1(zGi + zLi )/n, where j denotes either a global bank or local bank, i denotes all the
firms in the respective bank portfolio. The higher the Rj measure, the lower the risk. In scenario 1, rG < rL
in the initial equilibrium: rG = 1.015, rL = 1.050, and rG′
= 1.005 ex-post. In scenario 2, rG = rL = 1.015in the initial equilibrium, and rG
′= 1.005.
an increase in interest rate for the infra-marginal firms that remain with local banks (firms inRegion L in Panel (a) of Figure A.4), as shown in Panel (b) of the Figure. This means thatfinancial integration can give rise to an adverse selection problem. Moreover, this adverseselection problem would force a set of firms to exit the credit market (firms in Region e inPanel (a) of Figure A.4). This result suggests that financial integration can induce a declinein aggregate credit due to adverse selection, which is in line with the arguments raised inDetragiache et al. (2008) and Gormley (2014).
Despite the potential decline in aggregate credit, it is important to point out that creditallocation in a fully integrated financial system is more efficient relative to a closed economy. Idefine efficiency in terms of how closely credit allocation corresponds to that in the benchmarkfull-information economy. As shown in Panels (c) and (d) in Figure A.4, in a full informationeconomy, firms in Regions a and b would not get loans, and firms in regions c and d wouldget loans. In both a closed economy and a financially integrated economy, firms in Regionb are overfunded, while firms in Region c are underfunded. Nevertheless, for all reasonableparameters values, Regions b and c in a financially integrated economy are smaller thanthe corresponding regions in a closed economy. Quantitatively, let efficiency be defined asthe share of total credit in the economy relative to the benchmark full-information economy(Efficiency = 1 − (b + c)/(a + b + c + d) based on the illustrations Panels (c) and (d) inFigure A.4). Given parameter values rG = 1.05 and rL = 1.05, the closed economy is 85%efficient, while a financially integrated economy is 95% efficient.
62

APPENDIX C ADDITIONAL FIGURES AND TABLES
Figure B.1: Global Banking Credit to Private Sector
(a) Total Global Banking Credit, All Countries
05
1015
$ Tr
illion
1995q1 2000q1 2005q1 2010q1 2015q1 2020q1
(b) Share in Total Private Credit, by Country
020
4060
Perc
ent
Argenti
na
Austra
lia
Austria
Belgium
Canad
aChile
Czech
Repub
lic
Denmark
Finland
France
German
y
Greece
Hunga
ry
Irelan
dIta
ly
Mexico
Netherl
ands
New Zea
land
Norway
Poland
Portug
alSpa
in
Sweden
Switzerla
ndTu
rkey
United
Kingdo
m
United
States
Notes. Panel (a) plots a time-series of total cross-border credit to the non-bank private sector across all BISreporting countries. Source: BIS Locational Banking Statistics. Panel (b) plots the share of cross-bordercredit in total private credit, averaged over 2005-2016, for a cross-section of developed and major emergingmarket economies. Source: BIS Locational Banking Statistics and IMF International Financial Statistics.
63

Figure B.2: Loan Currency Denominations by Global and Local Banks
0.2
.4.6
.81
GB LB
US Excluded
0.2
.4.6
.81
GB LB
US and Eurozone Excluded
Local Currency Non-Local Currency
Notes. The plot shows the share of loans in local currency versus non-local currency given by global and localbanks. The left panel is based on loans from all countries in the sample except the US. The right panel isbased on loans from all countries in the sample except the US and Euro area countries. Source: Dealscan,Amadeus, Orbis, Compustat, Compustat Global, and author’s calculation.
64

Figure B.3: Estimates of Average Productivity Measure log zit by Country
0 1 2 3log(zi)
United StatesUnited Kingdom
SwitzerlandSweden
SpainPortugal
PolandNorway
New ZealandNetherlands
MexicoJapan
ItalyIrelandGreece
GermanyFranceFinland
DenmarkCzech Republic
CanadaBelgiumAustria
Australia
Notes. Estimates of the productivity measure log zit averaged across firms and years by country, calculatedbased on Equation (4). Source: Dealscan, Amadeus, Orbis, Compustat, Compustat Global, and author’scalculation.
65

Figure B.4: Estimates of Global Factor zG
01
23
4zG
2004 2006 2008 2010 2012 2014 2016
Notes. A plot of the global factor zG, extracted from the first principal component of the zict series. The factorvalues have been adjusted upward by their minimum so that all the values are positive. Source: Dealscan,Amadeus, Orbis, Compustat, Compustat Global, and author’s calculation.
66

Figure B.5: Bank-Firm Sorting, by zGi /zLi Quartile (Method 2)
0.2
.4.6
.81
1 2 3 4
ziG/zi
L
Global Bank Local Bank
Notes. The plot shows sorting patterns between firms and global versus local banks, with firms sorted intoquartiles by their exposure to global versus local risk (zGi /zLi ), uses variables that are constructed based onMethod 2 of the bank categorization criteria for global banks. Data sample consists of syndicated loans betweenfirms global and local banks and firms across 24 countries from 2004-2017. Source: Dealscan, Amadeus, Orbis,Compustat, Compustat Global, and author’s calculation.
67

Figure B.6: Three-Month Euribor Rates around ECB Announcements
Target Announcement
PC Start
PC End
2.98
33.
023.
043.
063.
08Im
plie
d Yi
eld
8 9 10 11 12 13 14 15 16 17 18
April 6, 2006
Target Announcement
PC Start
PC End
1.1
1.15
1.2
1.25
1.3
Impl
ied
Yiel
d
8 9 10 11 12 13 14 15 16 17 18Time Stamp
Nov 3, 2011
Notes. The figure plots the three-month Euribor rates on April 6, 2006 (upper panel) and November 3, 2011(bottom panel) between 08:00 and 18:00. Vertical lines represent the target policy rate announcement (13:45),the start of the press conference (14:30), and the end of the press conference (15:30). All times are in CET.Source: CQG Data Factory.
68

Table B.1: Summary Statistics: Loan and Firm Count by Country (Method 2)
Country Loan GB LB Firm Country Loan GB LB FirmAustralia 4507 0.70 0.30 701 Japan 21341 0.45 0.55 2865Austria 387 0.53 0.47 61 Mexico 601 0.70 0.30 137Belgium 704 0.69 0.31 123 Netherlands 2028 0.54 0.46 406Canada 6760 0.64 0.36 903 New Zealand 1023 0.70 0.30 127Czech Republic 197 0.68 0.32 77 Norway 1017 0.66 0.34 253Denmark 327 0.56 0.44 84 Poland 318 0.54 0.46 87Finland 587 0.65 0.35 113 Portugal 254 0.65 0.35 64France 5876 0.67 0.33 996 Spain 4380 0.68 0.32 839Germany 5987 0.68 0.32 942 Sweden 875 0.66 0.34 190Greece 309 0.66 0.34 47 Switzerland 790 0.69 0.31 175Ireland 404 0.70 0.30 107 United Kingdom 6810 0.69 0.31 1528Italy 2378 0.67 0.33 688 United States 46732 0.70 0.30 1466
Notes. Sample constructed from Dealscan, Amadeus, Orbis, Compustat, Compustat Global, and author’scalculation. Sample period covers the year 2004-2017.
69