global change impacts on rice-wheat provision and the environmental consequences
DESCRIPTION
Global Change Impacts on Rice-Wheat Provision and the Environmental Consequences. Peter Grace SKM - Australia Cooperative Research Centre for Greenhouse Accounting. Rice-Wheat Production Systems. Trends in Rice Yields. Trends in Wheat Yields. Reasons for Productivity Decline. - PowerPoint PPT PresentationTRANSCRIPT

Global Change Impacts on Rice-Wheat Provision and the
Environmental Consequences
Peter Grace
SKM - Australia
Cooperative Research Centre for Greenhouse Accounting

Rice-Wheat Production Systems
Country Area(million ha)
India 10
Bangladesh 0.8
Pakistan 2.2
Nepal 0.5
China 9.7

Trends in Rice Yields
0
2
4
6
8
10
-0.7 -0.5 -0.3 -0.1 0.1 0.3
Average yield change (t/ha/yr)
Init
ial y
ield
(t/
ha
)

Trends in Wheat Yields
0
1
2
3
4
5
-0.2 -0.1 0 0.1 0.2
Average yield change (t/ha/yr)
Init
ial y
ield
(t/
ha
)

Reasons for Productivity Decline
• Intensification-inefficient N use• Soil organic matter decline• Inappropriate water management• Soil structural decline• Micro-nutrient deficiencies• Pest and disease build-up• Narrow genetic base

Reasons for Productivity Decline
• Intensification-inefficient N use• Soil organic matter decline• Inappropriate water management• Soil structural decline• Micro-nutrient deficiencies• Pest and disease build-up• Narrow genetic base

Reasons for Productivity Decline
Intensification-inefficient N use
Soil organic matter decline
Soil structural decline
Inappropriate water management

Nitrogen Distribution in Rice-Wheat
Fertilizer Manure Irrigation Rain Plant Leaching Gaseous Soil
Inputs Outputs

Environmental Impacts
• Intensification-inefficient N use
Leaching of nitrates to groundwater
Greenhouse gas production - N2O

Environmental Impacts
• Soil organic matter decline
Greenhouse gas production - CO2 + CH4

Environmental Impacts
• Inappropriate water management– Irrigation without adequate drainage
– Groundwater rises
Salinity (salt) and sodicity (Na)

Environmental Impacts
• Salinity (salt) and plants– Root water uptake reduced
– Tolerance varies
• Sodicity– Decreased microbial activity
– Soils less permeable• Waterlogging
• Run-off
• Erosion
• Lower plant available water contents

Environmental Impacts
• Inappropriate water management– Excessive irrigation
Groundwater depletion
Increased pumping - GHG production - CO2

Groundwater Depletion
District Fall in watertable
1974-1993(m/yr)
Water tabledepth1993(m)
Rice-wheat% total
crop area
Gurgaon -0.3 10.8 39Kurukshetra -0.5 18.2 82.3MohinderGarh -0.6 31.0 13.6Panipat -0.3 10.4 80.7Rewari -0.2 16.8 22.5

South Asia - Water Use
600
800
1000
1200
1400
1995 2000 2010 2025
Time (years)
Wat
er U
se (
km3/
yr)

Environmental Impacts
• Soil structural decline
Waterlogging - GHG production - N2O + CH4

CLIMATE CHANGE REDUCED
GHGs
NEW PRODUCTION
SYSTEMS
CURRENT PRODUCTION
SYSTEMS IMPROVED FOOD
PRODUCTION
ADAPT to climate variability
MITIGATE further climate
change
IMPACT of climate variability on current production systems
GHGs

Key Conclusions from IPCC TAR WG I
• An increase in extreme weather event• Higher maximum temperatures & hot days• Higher minimum temperatures• More intense precipitation events• Increased summer drying and risk of drought• Increased Asian summer monsoon
precipitation variability

Climate Extremes

South Asia Climate - GCM Outputs
2020 2050% change
2080
Winter Summer Winter Summer Winter Summer
Temp 1.6 1.1 3.3 2.2 4.5 3.2
Precip 2.7 2.5 -2.1 6.6 5.3 7.9
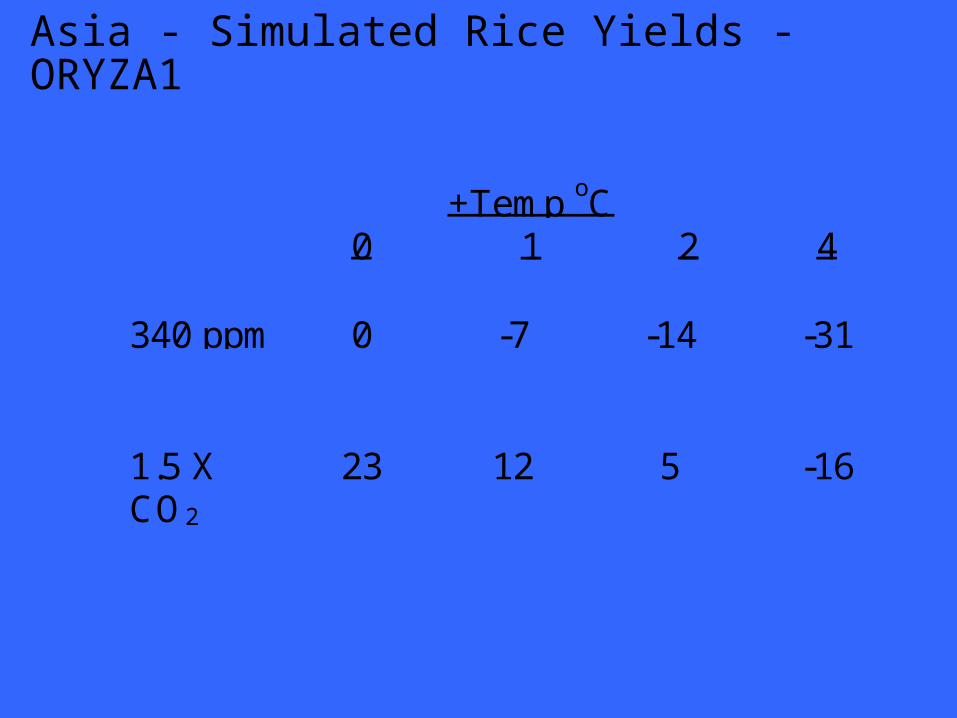
Asia - Simulated Rice Yields - ORYZA1
0+Temp oC
1 2 4
340 ppm 0 -7 -14 -31
1.5 XCO2
23 12 5 -16

Wheat
• Losses of 1-1.5% yield/day occur with late planting after end November
• Delay due to inability to sow– Late harvest of previous crop
– Seedbed preparation

Adaptation to Climate Change
• Depends on region specific climate changes• Promote flexibility - traditional ecological knowledge• Avoid stress at critical growth stages
– Adjustment of planting dates
– Change cultivar

Mitigation of Climate Change
• Amount of residue retained• No and reduced tillage• Reduction in fallow periods• Flood reduction

CLIMATE CHANGE REDUCED
GHGs
NEW PRODUCTION
SYSTEMS
CURRENT PRODUCTION
SYSTEMS IMPROVED FOOD
PRODUCTION
ADAPT to climate variability
MITIGATE further climate
change
IMPACT of climate variability on current production systems
GHGs

Global Warming Potential of Rice-Wheat Production Systems
• Standard nomenclature
• CH4 = 20 x CO2
• N2O = 310 x CO2
• CARBON EQUIVALENTS• CARBON to PRODUCTIVITY RATIO

Rice-Wheat system - long-term trials (20 yr)
SystemRice(t/ha)
Wheat(t/ha)
Fodder(t/ha)
N fert/crop(kg/ha)
Manure(t/ha)
SOC(%)
Control 3.74 1.71 1.86 0 0 0.49Trt 1 5.02 3.13 1.93 60 0 0.641
Trt 2 5.67 3.97 2.36 120 0 0.84Trt 3 5.92 4.38 2.32 180 0 1.061
Trt 8 6.41 4.6 2.47 120 15 1.481estimated for 0-15 cm based on published measurements in other treatments

Rice-Wheat system - long-term trials (20 yr) - remove and/or burn crop residues
Treatment: Control Trt 1 Trt 2 Trt 3 Trt 8GHG SourceCO2: Soil tillage 3539 3003 2288 1502 0CO2: Diesel1 260 260 260 260 260N2O: Burning residues 0.4 0.6 0.6 0.7 0.7N2O: Manure application2 0 0 0 0 3N2O: N fertilizer application2 0 2.4 4.7 7.1 4.7N2O: Cereal residues retained2 0 0 0 0 0N2O: N-fixing crops3 1.1 1.1 1.4 1.4 1.5CH4: Burning residues 17 25.3 29.9 31.1 34.1CH4: Rice cultivation4 100 100 100 100 200kg CE5/ha 3953 4774 5510 6086 8032CPR6 0.73 0.59 0.57 0.59 0.73

Rice-Wheat system - long-term trials (20 yr)
Treatments Control Trt 1 Trt 2 Trt 3 Trt 8SystemsCE (kg C emitted): Conventional/retain residues 3496 4103 4721 5232 7137 Conventional/burn residues 3953 4774 5510 6086 8032 No till/retain residues 2966 3646 4362 4981 6724CPR (kg C emitted/kg grain yield): Conventional/retain residues 0.64 0.50 0.49 0.51 0.64 Conventional/burn residues 0.73 0.59 0.57 0.59 0.73 No till/retain residues 0.54 0.45 0.45 0.48 0.61

Enhancing Rice-Wheat Provision-Conclusions
• Improved agronomic management• New germplasm• Biodiversity