global communications gaap summit 2014 - pwc communications gaap summit 2014 eurostars madrid tower,...
TRANSCRIPT

Global Communications GAAP Summit 2014
Eurostars Madrid Tower, Madrid 23-24 June

Paul Barkus Welcome and introduction

PwC
Welcome and introduction
Slide 3
June 2014 Global Communications GAAP Summit

PwC
Navigating change
Global Communications GAAP Summit June 2014
There is nothing wrong with change, if it is in the right direction. Sir Winston Churchill
Slide 4

PwC
Navigating change – what are we seeing?
Global Communications GAAP Summit
Slide 5
June 2014
Consolidation driving an increase in M&A
Convergence of technologies - fixed, mobile, broadcasters
Move from being technology led with customer preferences driving strategies
Innovative financing structures for consumers
New network funding models
Increased activity around accounting standards and regulation

PwC
What’s in the news? (Organic growth)
Slide 6
Global Communications GAAP Summit June 2014

PwC
What’s in the news? (Inorganic growth)
Slide 7
Global Communications GAAP Summit June 2014

PwC
This is your summit...
Slide 8
Global Communications GAAP Summit June 2014

PwC
Global Communications GAAP Summit June 2014
Agenda
Monday 23 June
Time Session
15:00 – 15:45 Registration
15:45 – 16:00 Introduction and welcome
16:00 – 18:00 Navigating change and putting it into practice - how do you tell your story?
18.30 Buses depart for dinner
Today
Slide 9

PwC
Global Communications GAAP Summit June 2014
Agenda
Tuesday 24 June
Time Session
08.00 – 08:15 Introduction
08.15 – 09:00 What’s new in accounting?
09:00 – 09:30 Telefónica market update
09:30 – 10:15 Coffee break
10.15 – 12:15 Workshop 1: Inorganic growth
12.15 – 13.30 Lunch
13.30 - 15.30 Workshop 2: Organic growth
15.30 - 16.00 Closing remarks
Tomorrow
Slide 10

PwC
Administration
Slide 11
Global Communications GAAP Summit June 2014

Global Communications Summit 2014
Navigating change - putting it into practice June 2014
www.pwc.com
PwC
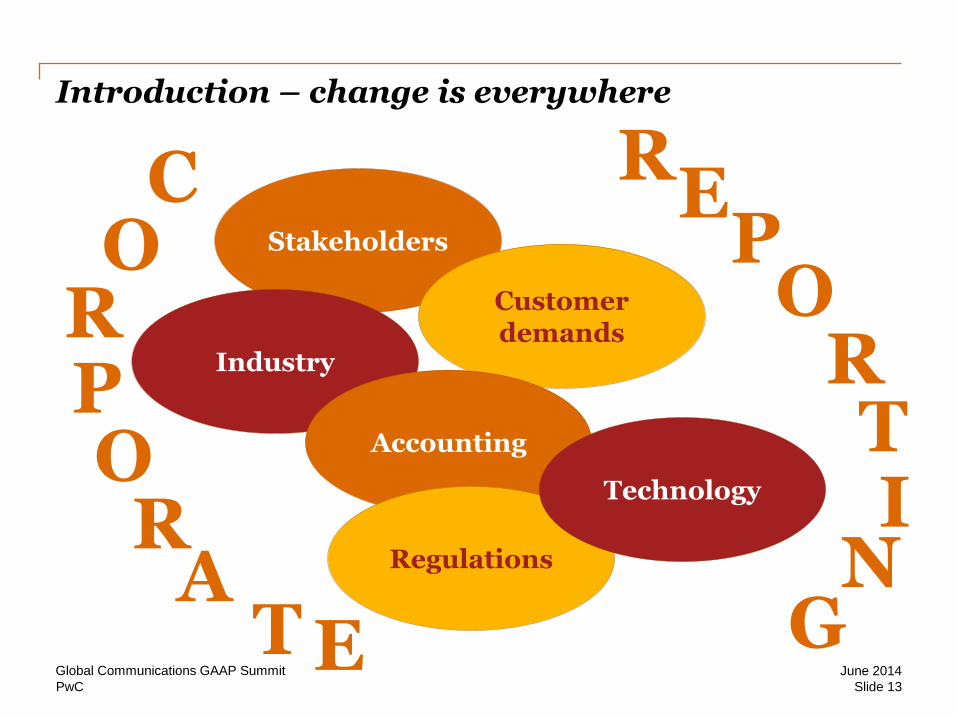
Introduction – change is everywhere
C O
R P O
R A
T E
R E
P O
R T I
N G
Stakeholders
Industry
Customer demands
Accounting
Regulations
Technology
Global Communications GAAP Summit
Slide 13
June 2014

Discussion Panel
The Telco Trends for 2014+
June, 2014 Jose F. Arias / Jose A. Tortosa
VicePresidents (CMT Practice)

Strategy&
Strategy& – Outlook for the Telecom section 2014
Excitement and challenges
• reduction in value growth • traffic boost enormous
Maturity in the market =
Europe North America Developing markets
• Regulatory
pressures
• Top line constrains
• Redesign of core
business
• Further
consolidation
• Softer regulatory
positions
• Investment
demands
• Operators relative size drives
growth and profitability
• Regulatory and competition
pressure
• Growth rates slowing
• Investment requirement
increasing

Strategy&
Four major industry drivers
Convergence
• 3P/4P becoming the usual offering,…
• …, and buying behavior • Multi-device access
demanded
Competition
• Increasing • Emergence of MVNOs
and arbitrage players • Consolidation of
vendors, device manufacturers
Adjacencies
• OTT • Blurring boundaries
between competitors and collaborators
Regulations
• Stronger quality controls and times
• Decrease of MTRs • Open access • Shift from telecom to
competition law
EU cable players requesting MVNO license to offer 3P/4P
EU incumbents launching 4P in 2012/2013
3P/4P household penetration in Spain in 18 months
10
+40%
+40%
Growth in smartphone adoption cause 4% loss of messaging services to just below $104 Bn
Billion messages a day sent over Whatsapp
Drop in SMS revenues, witnessed by KPN
42%
20%
20
Sector Growth 2005-2013
–# of telecom operators
– Industry revenues
MVNO competition (2013)
–# of MVNOs worldwide
–# of MVNOs in Germany
Million dollar antitrust fine on international telco for abusing dominant position on the Internet market
Countries impose unbundling of copper and fiber
Yearly Drop in MTRs Germany 2007-2013
60
200
+70%
1%
111
1207
-18%
Demand for
investment
(data boost)
Consolidation
of players Digitization
A B C

Strategy&
Convergence
Operator
Bundle
✓ ✓ ✓ ✓ ✓ ✓
✓ ✗ ✓ ✗ ✗ ✓
✓ ✓ ✓ ✗ ✗ ✓
✓ ✗ ✓ ✗ ✓ ✗
✗ ✗ ✓ ✗ ✗ (✓)
✗ ✗ ✓ ✓ ✓ ✓
✗ ✗ ✓ ✓ ✓ ✗
✗ ✗ ✗ (✓) ✓ ✓
Discount
Overview of Bundled Offers of European Incumbents

Strategy&
Competition
MVNOs & Secondary Brands Market Share, 2013 (%)
40% 40%
24%14% 13% 11% 10%5%
MVNOs MNOs
15-20%
Convergent market
Convergent market
Convergent market
45%
convergent
market
Convergent market
60%
convergent
market
10%
convergent
market
Convergent market
Source: Regulatory bodies; Analysis Mason; specialized webs and news
MVNOs in Europe are reaching 15%-20% market share

Strategy&
Regulation
Overview of Bundled Offers of European Incumbents Selected Examples for Antitrust Fines against global Telco operators
(2011-2014)
Telecom Italia, €104 Mn in May 2013
Abuse of dominant position in
network infrastructure
Telekomunikacja Polska S.A,
€127 Mn in June 2011
Abuse of dominant market position
Telefónica and Portugal Telecom,
€79 Mn in Jan 2013
Illegal non-compete contract clause
Telmex (America Movil),
$52 Mn in Feb 2013
Anticompetitive practices
Telecom NZ,
$9 Mn in Apr 2011
Anti-competitive wholesale pricing
KPN, €30 Mn in Jan 2014
Failing to inform competitors on
tariffs in a government tender
Source: Press, Strategy& analysis
2013 2014 2012 2011

Strategy&
Demand for investment A
The Data Traffic Challenge
Higher investments demand
• Fibre as the only solution to address broadband demand
• LTE as the only solution for mid-term data traffic requirement
Need to "re-imagine" the
business model
1
2
Time
Revenues
Traffic
De-coupling/Gap
Costs
~30% of Western
European BB lines >
30MBps in 2Q13;
Cable switching to 120
Mbps; 54% own a
smartphone
Massive Fibre,
Cable, LTE
deployment
ILLUSTRATIVE

Strategy&
Demand for investment A
Core business process re-imagination to respond to Data Traffic challenge
Infrastructure • Fiber and network sharing
• Tower sharing
Network • Pay-per-use models
• Full outsourcing
IT • Greenfield IT
• Full outsourcing
Joint Procurement
• Combining purchasing power
(Digital) Business Processes
• Simplification through adoption of efficiency philosophy
• Exp: “Kaizen” – car manufacturing

Strategy&
Consolidation of players M&A activity: Portfolio rationalization and expansion into adjacencies
B
$21.6 Bn in Jul 2013
$0.7 Bn in Nov 2013
$5.7 Bn in Nov 2013
$2.0 Bn in Jan 2014
$1.6 Bn in Feb 2014
A
B
C
Stake Increase
Cross-Border
In-Market
Acquisition Type
$16 Bn in June 2013
€0.8 Bn in Feb 2014
€7.2 Bn in Mar 2014
€7.7 Bn in Oct 2013€17 Bn in Apr 2014
$45 Bn in Feb 2014
$48.5 Bn in May 2014C
C
C
A
A
A
B
C
A
B
C
Source: Operator announcements, Press, Strategy& analysis
2012 2013 2014
Highlights in M&A´s (2012-2014)
C
Source: Bloomberg, Dealogic; Strategy&
Adjacent Telco´s M&A
Note: Deals > €1 Mn only
$3.1bn in Jan 2011
$80Mn in Apr 2011
$1.4bn in Aug 2011
$1.3bn in Oct 2013

Strategy&
Digitization C
Total
connected
devices
7.6 7.2 6.3
50.0
0.5
12.5
25.0
2020 2003 2010 2015
6.8
0.08 6.58 3.47 1.84
0
40
30
20
50
10
In bn
More Connected Devices than
People
Digital Commerce
eEducation Smart Grid Autonomous Car
Big Data Digital Wallets Mobile Health
3D Printing
From “connecting individuals” to “connecting devices
Source: Ovum, Strategy& analysis

Strategy&
Digitization C
Typical Archetypes of ‘Way to Play’ in Digital Services
Connectivity Play Digital Enabler Digital Life
Provider
Description
EBITDA
Margins
Revenue
Sources
~30-50% ~30-40% ~20-25%
“Become efficient provider
of secure connectivity
related bundled products
and services”
“Build adjacent platforms
that enable Digital services
by partnering with ICT and
OTT players”
“Become a comprehensive
Digital Life Provider with
best-in-class services that
are vertically integrated”
100%
Connectivity
Services
20%
Connectivity
80%
60% Services
Connectivity 40%
Innovation
Focus Defocus/ Partner Enabling platform focus (APIs) Leading-edge services,
global labs
Sample
Operators

Strategy&
Demand for
investment
(data boost)
Consolidation
of players Digitization
A B C
In summary, …
Convergence Competition Adjacencies Regulations

Telling your story
Integrated Reporting

PwC
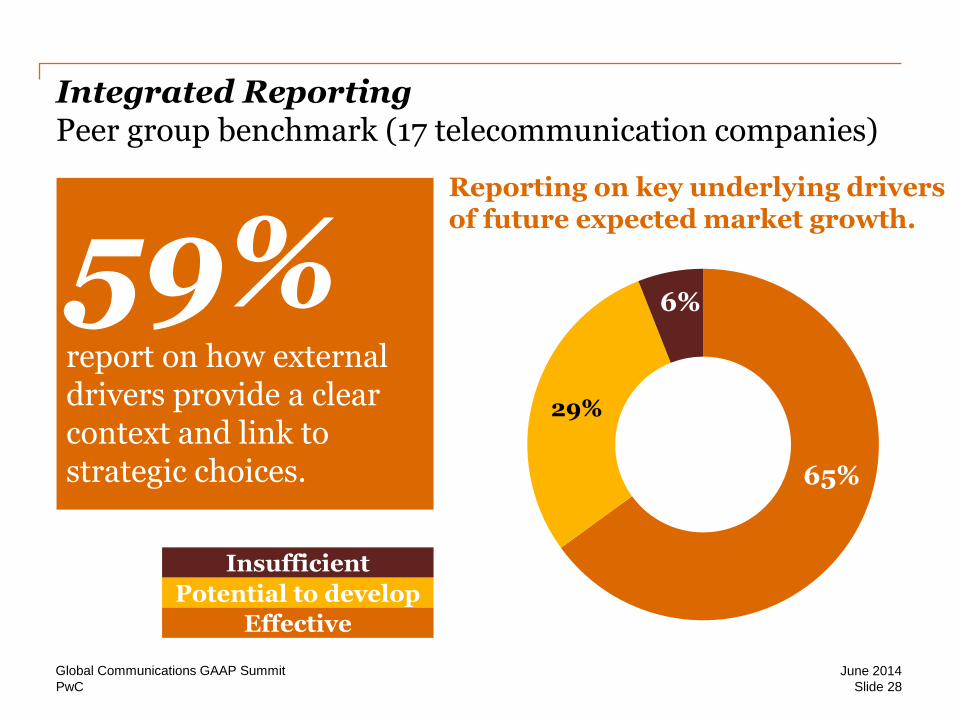
Integrated Reporting
• An integrated report is a concise communication about how an organization’s strategy, governance, performance and prospects lead to the creation of value over the short, medium and long term
• The International Integrated Reporting Council (IIRC) issued the framework in December 2013.
Global Communications GAAP Summit
Slide 27
June 2014
PwC
59% report on how external drivers provide a clear context and link to strategic choices.
Integrated Reporting Peer group benchmark (17 telecommunication companies)
Reporting on key underlying drivers of future expected market growth.
29%
6%
65%
Insufficient
Potential to develop
Effective
Global Communications GAAP Summit
Slide 28
June 2014

PwC
12%
Integrated Reporting Peer group benchmark (17 telecommunication companies)
Reporting on the company’s impact on external non-financial capitals.
12% discuss the future availability of material non-financial capitals it uses to create value. 47% 47%
6%
47%
Global Communications GAAP Summit
Insufficient
Potential to develop
Effective
Slide 29
June 2014

PwC
12%
Integrated Reporting Peer group benchmark (17 telecommunication companies)
Are performance measures clearly aligned with strategic priorities? 76%
report consistently on performance between the “front half” reporting and financial statements.
18%
47%
35%
Global Communications GAAP Summit
Insufficient
Potential to develop
Effective
Slide 30
June 2014

Telling your story
Investor views

PwC
Alternative Performance Measures (“APMs”) Investor views
Investor view - Non GAAP measures
Investors discuss how companies can improve Non-GAAP measures in their reporting
http://www.pwc.com/gx/en/audit-services/corporate-reporting/publications/investor-view/index.jhtml
Global Communications GAAP Summit
Slide 32
June 2014

Telefónica
Marta Soto Head of Accounting Policies & Digital Subsidiaries
June 2014

DISCOVER, DISRUPT, DELIVER 34
1. Profile & Strategy: recent developments

DISCOVER, DISRUPT, DELIVER
Telefónica is the result of more than 85 years of anticipation and
transformation especially during the last decade
35
2000 - 2005 2006 - 2008 2009 - 2011 2012 - 2014
• Veronica Operation:
Telefónica de Argentina;
Telefónica del Perú; Telesp
and Tele Sudeste in Brazil
(2000)
• Joint venture of Telefónica and
Portugal Telecom in Brazil:
Vivo (2003)
• Launches Imagenio (2003)
• Acquisition of BellSouth's
assets in Latin America (2004)
• Acquisition of Cesky Telecom
(2005)
• Takes a 5% stake in China
Netcom (2005)
• Acquisition of the O2 assets in
the UK, Germany and Ireland
(2006)
• Mobile license awarded in
Slovakia (2006)
• 51% stake taken in Colombia
Telecom (2006)
• Industrial alliance with
Telecom Italia (10.47% of the
voting rights) (2007)
• Acquisition of Telemig by Vivo
in Brazil (2008)
• Reaches a 5.38% participation
in China Unicom after the CU-
CNC merger (2008)
• Strengthening of the strategic
alliance with China Unicom
(2009)
• Acquisition of Hansenet in
Germany, Jajah in Israel and
Tuenti in Spain (2010)
• Control of Vivo obtained by
buying PT stake out of
Brasilcel (2010)
• Mobile license awarded in
Costa Rica (2011)
• T.Digital and TGR creation
(2011)
• Sale of 4.56% stake in China
Unicom (2012)
• IPO Telefónica Deutschland
(2012)
• Sale of Atento (2012)
• Sale of 40% of Telefónica’s
stake in Centroamérica (2013)
• Sale of Telefónica Ireland
(2013)*
• Acquisition of E-Plus in
Germany (2013)*
• Capital increase in Telco (from
46,18% to 66%) (2013)
• Sale of Telefónica Czech
Republic (2014)**
• New totally customer-centred
organization
* The operations are subject to obtaining the relevant regulatory approval.
** Telefónica holds a 4.9% stake in Telefónica Czech Republic.

DISCOVER, DISRUPT, DELIVER 36
Since the beginning of internationalization, the company has
experienced a significant growth
* Includes Ireland (in a process of divestment), Czech Republic and Slovakia (Telefónica holds a 4.9% stake in Telefónica Czech Republic).
** Data as of FY 2013.
1989 2000 Mar14 1989 – Mar14
Customers (Mn) 12 68 313 x26
Countries * 1 16 24 +23
Team (‘000) 71 149 122 x2
Revenues (Mn €) 4,273 28,482 57,061 ** x13
DISCOVER, DISRUPT, DELIVER 37
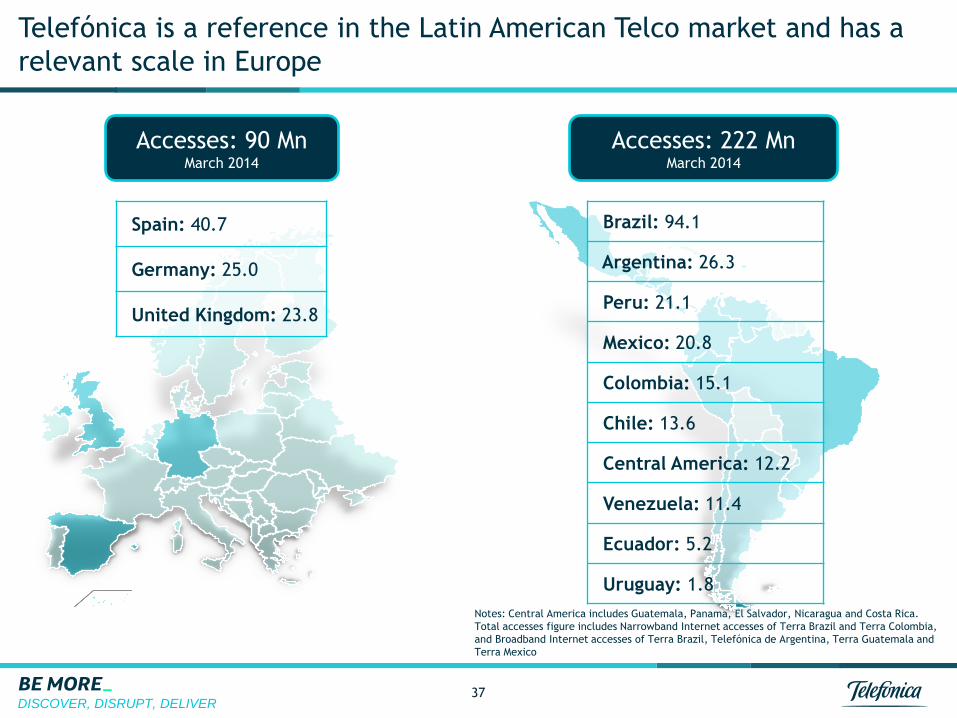
Telefónica is a reference in the Latin American Telco market and has a
relevant scale in Europe
Spain: 40.7
Germany: 25.0
United Kingdom: 23.8
Accesses: 90 Mn March 2014
Accesses: 222 Mn March 2014
Brazil: 94.1
Argentina: 26.3
Peru: 21.1
Mexico: 20.8
Colombia: 15.1
Chile: 13.6
Central America: 12.2
Venezuela: 11.4
Ecuador: 5.2
Uruguay: 1.8
Notes: Central America includes Guatemala, Panama, El Salvador, Nicaragua and Costa Rica.
Total accesses figure includes Narrowband Internet accesses of Terra Brazil and Terra Colombia,
and Broadband Internet accesses of Terra Brazil, Telefónica de Argentina, Terra Guatemala and
Terra Mexico

DISCOVER, DISRUPT, DELIVER
New digital solutions create growth opportunities for the industry...
Cloud Services M2M
Mobile Payment e-Government
Big Data e-Commerce
4%
6%
10%
ICT Total ICT Latam Mobile Data
Global Industry Revenues CAGR 13-17
Source: IDC - Worldwide Black Book (Mar14).
38

DISCOVER, DISRUPT, DELIVER
Telefónica sits on a privileged position to capture that growth potential
39
Traditional Telco Digital Telco From To
“Combines its Telco
with additional digital
assets
to help people to access
and enjoy the best that
technology can offer”
Leverage unique assets (networks/IT & BI/distribution)
• Copper, 2G/3G
• Traditional IT
• Fiber, LTE, Cloud-RAN, virtualisation…
• IT as a Digital enabler
• Physical stores and call centers
• Traditional Business Intelligence
• Digital customer experience
• Customer Insight
+ Capturing growth beyond connectivity
• Communication services • Digital solutions
DISCOVER, DISRUPT, DELIVER
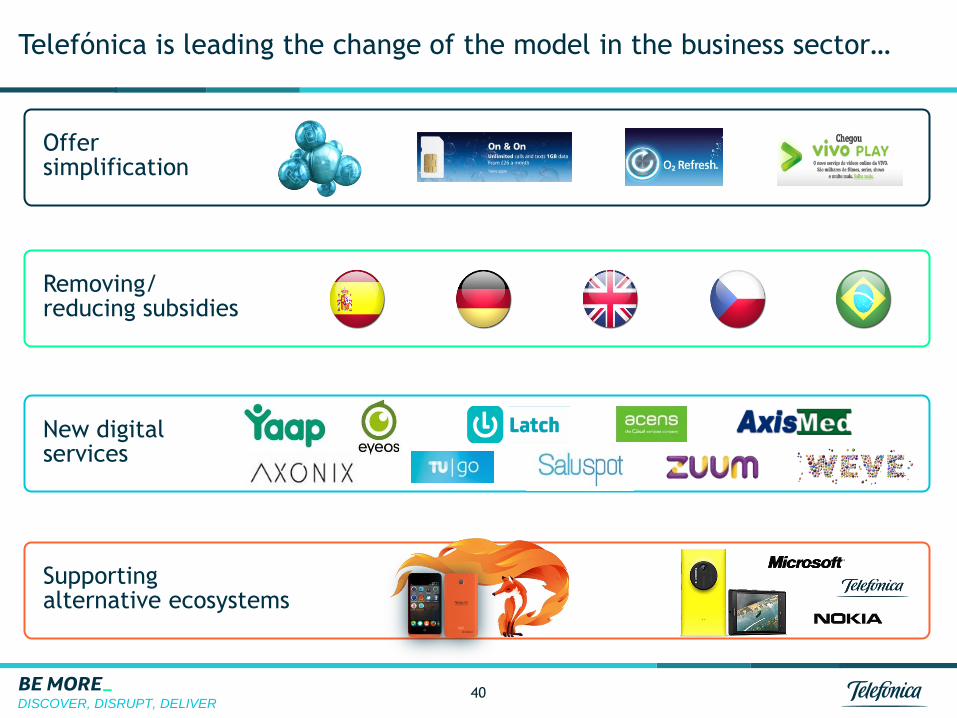
Telefónica is leading the change of the model in the business sector…
Removing/ reducing subsidies
Offer simplification
New digital services
Supporting alternative ecosystems
40

DISCOVER, DISRUPT, DELIVER
…with disruptive initiatives in the way we invest
41
Leading in-market Consolidation
Ireland Czech
The biggest DC in
the World with Tier IV
certificate
Network sharing
Apps and physical
servers reduction
Fibber and LTE
deployment
Server
virtualization
Network virtualization
IT
Network
DISCOVER, DISRUPT, DELIVER
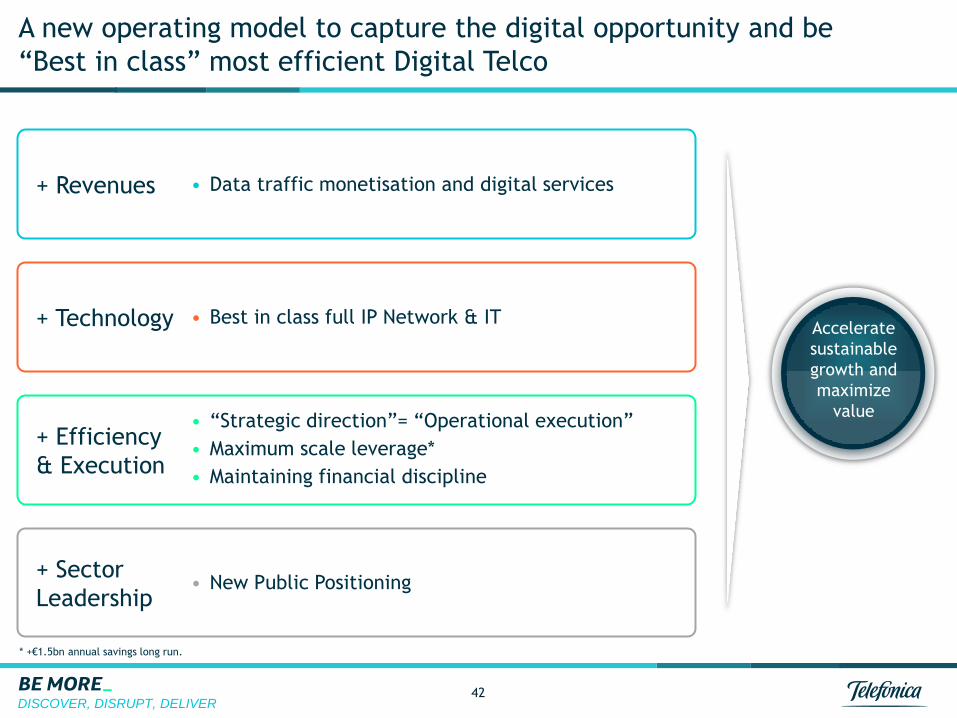
• Data traffic monetisation and digital services
• Best in class full IP Network & IT
• “Strategic direction”= “Operational execution”
• Maximum scale leverage*
• Maintaining financial discipline
• New Public Positioning
42
A new operating model to capture the digital opportunity and be
“Best in class” most efficient Digital Telco
* +€1.5bn annual savings long run.
+ Revenues
+ Technology
+ Efficiency
& Execution
+ Sector
Leadership
Accelerate
sustainable
growth and
maximize
value

DISCOVER, DISRUPT, DELIVER
Enhanced visibility and
report level
43
Closing distances between strategic and operational decisions & increased
visibility of key businesses
LatAm (ex-Bz) Spain Brazil Germany United Kingdom
CGRO (Chief Global
Resources Officer)
CCDO (Chief Commercial
Digital Officer)
Controller
& Planning
Group General
Counsel
Finance & Corp.
Development
Public Affairs and
Regulation
Strategy
Comm. & Media
Chief of Staff
The new organization
COO
Chairman & CEO One single
Corporate
Center

DISCOVER, DISRUPT, DELIVER
Our Vision revolves around our clients
44
Technology should be open
BE MORE_
to everyone so that we can all

DISCOVER, DISRUPT, DELIVER 45
2. Communication

DISCOVER, DISRUPT, DELIVER 46
Our Financial Information…
Our press release,
reflecting our digital
transformation
Our Financial
Statements: simplifying
contents

DISCOVER, DISRUPT, DELIVER 47
Our Integrated Report…
IIRC(*) Pilot
Programme
(*) International Integrated Reporting Council
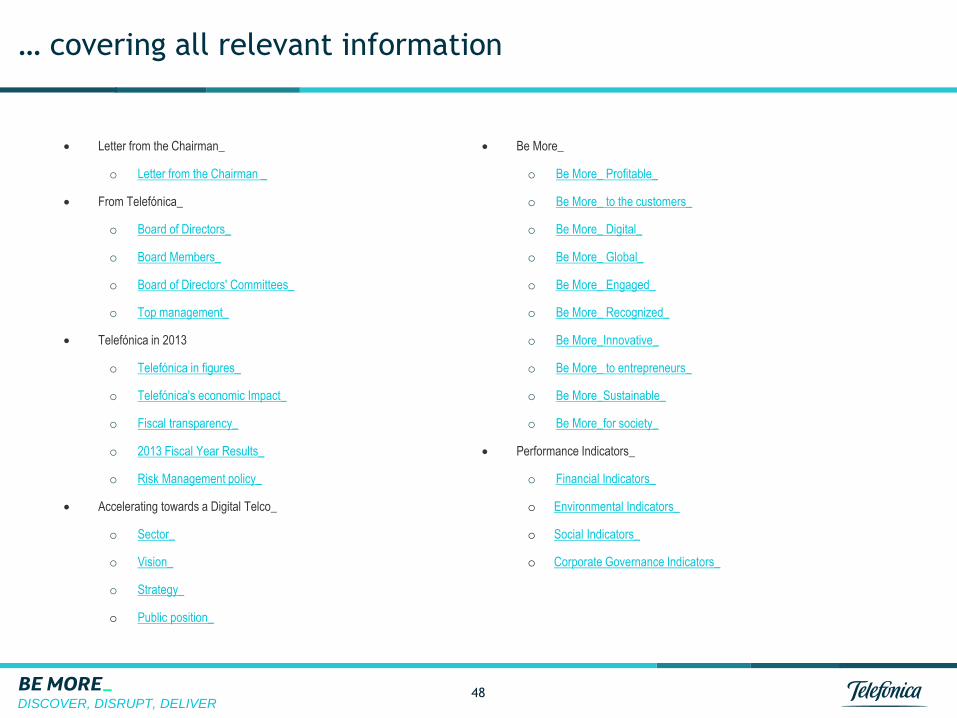
DISCOVER, DISRUPT, DELIVER 48
… covering all relevant information
Letter from the Chairman_
o Letter from the Chairman _
From Telefónica_
o Board of Directors_
o Board Members_
o Board of Directors' Committees_
o Top management_
Telefónica in 2013
o Telefónica in figures_
o Telefónica's economic Impact_
o Fiscal transparency_
o 2013 Fiscal Year Results_
o Risk Management policy_
Accelerating towards a Digital Telco_
o Sector_
o Vision_
o Strategy_
o Public position_
Be More_
o Be More_ Profitable_
o Be More_ to the customers_
o Be More_ Digital_
o Be More_ Global_
o Be More_ Engaged_
o Be More_ Recognized_
o Be More_Innovative_
o Be More_ to entrepreneurs_
o Be More_Sustainable_
o Be More_for society_
Performance Indicators_
o Financial Indicators_
o Environmental Indicators_
o Social Indicators_
o Corporate Governance Indicators_


PwC
Telecom Argentina S.A.
Marcelo F. Kozak
Chief Accountant and SOX Compliance Officer
June 2014
Global Communications GAAP Summit
Slide 50
June 2014

PwC
Listed Company (BCBA (*)/ NYSE)
Since 1994
Telecom Italia’s subsidiary
Since 2010
Financial Debt Restructuration
In 2005 (USD 3.2 billion)
Telecom Argentina and its Financial Reporting (“FR”) background
SOX Compliance Since 2002
(Section 404 since 2006)
FINANCIAL REPORTING
RSE Since 2007
(*) BCBA = Buenos Aires Stock Exchange
External & Internal reporting
under IFRS
Global Communications GAAP Summit
Slide 51
June 2014

PwC
Competitors and Market Share
~155% of population
~67% of households2
~45% of households2
MAIN COMPETITORS
ACCESSES
(million)
TELECOM GROUP
PENETRATION
MARKET
SHARE 1Q14 33% 27% 46%
1 Estimated Official GDP, 3Q 2013, Indec. 2 Source: Pyramid Research. Fixed line penetration residential only.
Mobile Broadband Fixed
51 55 57 61
2010 2011 2012 2013
3,9 4,4 4,8 5,1
2010 2011 2012 2013
8,78,8
8,99,0
2010 2011 2012 2013
Integrated operator
Global Communications GAAP Summit
Population 41 million
GDP1 ´13 (billion)
U$S 485.4
GDP1 per capita ´13
U$S 11,824
Slide 52
June 2014

PwC
Our business and our strategy (cont.)
Strategy
Creation of value
to stakeholders in a sustainable way
Global Communications GAAP Summit
Slide 53
June 2014

PwC
Past and current challenges and its impact in FR
Freezing tariffs since 2001 in regulated services (22% of revenues in 2007 to 8% in 1Q 2014)
Strong competition in non-regulated services (data, broadband, mobile )
Greater regulatory and political intervention
Unstable macroeconomic environment (Inflation, devaluation, foreign exchange restrictions, growth/recession periods, etc.)
Management = To manage Risk & Opportunities
Challenges
Evolution of Main Macroeconomic variables -last 2 decades-:
Convertibility
period (1)
Post -convertibility
period (1)
1992-2001 2002-2011 2012 2013 Min Máx
Gross Domestic Product growth ("GDP") 2.7% 5.7% 1.9% 4.9% -10.9% 9.2%
Devaluation ($/U$S) 0.0% 15.7% 14.3% 32.6% -13.1% 237.0%
Consumer Price Index (% variation) 2.6% 11.3% 10.8% 10.9% -1.8% 40.9%
Wholesale Domestic Price Index (% variation) 0.8% 17.6% 13.1% 14.8% -6.3% 118.0%
Unemployment index (% of the economically
active population at the end of year)
15.8% 10.3% 6.9% 6.4% 6.4% 20.9%
GDP per capita (thousand of U$S) 7.6 6.6 11.9 11.8 2.5 11.9
Source: INDEC - Last available variables
(1) Annual average(2) Est imated data
1992-2013 period
(2)
(2)
Global Communications GAAP Summit
Slide 54
June 2014

PwC
Past and current challenges and its impact in FR (cont.)
Impacts in FR:
• High Inflation Analysis / IAS 29 analysis.
• Impairment test / IAS 36.
• Focus on IFRS7 regarding financial risks disclosures.
• Multiples exchange rates / IAS 21.
• “De facto” restrictions to transfer funds abroad.
• Proper disclosure of risks (legal, regulatory, financial, etc.).
Significant Accounting policies (estimations)
Risk Factors (aligned with Risk Mapping)
Global Communications GAAP Summit
Slide 55
June 2014

PwC
How we manage the challenges?
Main grounds of our FR:
Financial
Reporting
High standards regarding Corporate
Governance
Transparency with the market
and comprehensive financial
information
Operational information
Global Communications GAAP Summit
Slide 56
June 2014

PwC
How we manage the challenges? (Cont.)
• Effective communication of our performance results: Through Financial
KPIs (Based on IFRS – Non GAAP measures are not used)
Enterprise Value (USDMM) NFP (USDMM) (market capitalization + net financial debt – fair value)
Global Communications GAAP Summit
Slide 57
June 2014

PwC
How we manage the challenges? (Cont.)
• Effective communication of our performance results: Through Financial
KPIs (Based on IFRS – Non GAAP measures are not used)
Financial performance (AR$MM) Labor Costs
2002 2007 2012 2013 1Q 2014
EBITDA margin 47% 34% 30% 28% 28%
EBIT Margin -5% 18% 18% 17% 18%
CAPEX as % Revenues 7% 16% 15% 18% 14%
ROE N/A 42% 33% 32% 30% Global Communications GAAP Summit
Slide 58
June 2014

PwC
How we manage the challenges? (Cont.)
Clients (Thousands) ARPU (AR$/month)
• Effective communication of our performance results: Through
Operational KPIs
Global Communications GAAP Summit
Slide 59
June 2014

PwC
How we manage the challenges? (Cont.)
Market Share Revenue Share Internet Mobile
These indicators have been published in a consistent manner during the last 10 years.
The Operational KPIs and Macroeconomic indicators are essential for an adequate understanding of FR in a context of high volatility (during growth or recession periods).
• Effective communication of our performance results: Through
Operational KPIs
28.7% 27.5% 26.9%
33.0% 29.3% 28.9%
19.1% 24.3% 25.0%
19.2% 18.9% 19.2%
2007 2012 2013
Telecom Telefónica Cable Other
30.9% 34.3% 34.7%
38.1% 33.6% 34.2%
31.0% 32.1% 31.1%
2007 2012 2013
Telecom Movistar América Movil
Global Communications GAAP Summit
Slide 60
June 2014

PwC
How we manage the challenges? (Cont.)
• Effective and comprehensive disclosure of FR:
Segregation of information
(revenues segregated by type
of service )
Increased bundling
(higher and more complex price estimations to apply relative fair value
allocation of revenues, potential discontinuation of the residual method
in mobile industry).
Non-Gaap measures
(SEC comment: EBITDA & ARPU, key performance measures used by
Telecom Argentina ´s Management )
2013 % 2012 % 2011 %
Voice 10,645 44 9,927 49 9,184 54
Internet 4,879 20 3,395 17 2,411 14
Data 8,488 36 6,767 34 5,316 32
Total services revenues 24,012 100 20,089 100 16,911 100
Annual Variation % 20% 19% 25%
Years ended December 31,
Global Communications GAAP Summit
Slide 61
June 2014

PwC
Next steps in Financial Reporting towards Integrated Reporting
There is an increasing need for an integrated view of the business and value creation for stakeholders. The keys to achieve this are:
Communication with stakeholders,
To use commonly defined KPIs and non-GAAP measures.
In the interim it is key to:
Include detailed disclosures about the policies and criteria used to calculate KPIs and non-GAAP measures.
To include key prospective information (Financial and Operational).
Global Communications GAAP Summit
Slide 62
June 2014

Jenny Harrison, Head of External Reporting, BT Group plc
June 2014
Reporting on our performance

© British Telecommunications plc
65

© British Telecommunications plc
66
Our journey
2001-2003
Rehabilitation
• Reducing debt
• Restructuring
the business
2003-2008
Move to data
• Defend
traditional
• Grow “new
wave”
2008-2013
A better business
• Cost
transformation
• Investing for the
future
2013
A better future
• Further cost
transformation
• Customer
service
improvements
• Delivering on
investments
Cash flow
growth
EBITDA
growth
Profitable
revenue
growth

© British Telecommunications plc
67
Our purpose, goal, strategy and culture
Broaden and deepen our customer relationships
Fibre TV and
content
Mobility
and
future
voice
UK
business
markets
Leading
global
companies
Our strategy
A growing BT: to deliver sustainable profitable revenue growth
Invest for
growth
Our goal
A healthy organisation
Deliver superior
customer service
Transform
our costs
Our purpose To use the power of communications to make a better world
Our culture

© British Telecommunications plc
68
BT Sport – an example of how we explain ourselves

© British Telecommunications plc
69
Q4 2013/14 Change FY 2013/14 Change
Revenue £1,068m 9% £4,019m 4%
EBITDA £269m 5% £833m (14)%
BT Consumer – how our strategy has increased revenue
Consumer YoY revenue growth Q4 revenue up 9%
– broadband and TV up 24%
– improved trend in calls and lines, up 1%
Q4 costs up 10%
– c.£130m BT Sport investment and higher
revenue-related costs
– partly offset by cost transformation activities
Q4 EBITDA up 5%
– reflects better revenue performance
-4%
-2%
0%
2%
4%
6%
8%
10%
Q1 Q2 Q3 Q4 Q1 Q2 Q3 Q4
2012/13 2013/14

© British Telecommunications plc
70
How have we communicated our strategy?
Internal communication – clarity on our strategy. Focus on health of our
organisation.
Externally - strategic reporting in the UK – we have to CONNECT the story
Linking strategy – business model – KPIs – remuneration - financials
The five growth areas in our strategy are used as case studies in this year’s
annual report
The BT Group KPIs
– Adjusted earnings per share
– Normalised free cash flow
– Customer service improvement (non-financial measure)
– And refreshed this year to include Revenue growth (reflects re-emphasis in strategy)

© British Telecommunications plc
71
Our Group KPI disclosure

© British Telecommunications plc
72
How do we measure non-financial value creation?
Our line of business KPIs (published quarterly)
– Order intake (contract businesses)
– Operational measures
– Share of broadband net adds
– Active lines, line loss, physical lines
– Consumer ARPU
Regular disclosure of operational statistics help analysts review the business
– These translate into £ growth
– Importance of trends over time
Organisational health measures (published in annual report)
– Employee engagement
– Volunteering
– Social impact of digital inclusion programmes

© British Telecommunications plc
73
BT Consumer KPIs – how we explain operational performance
Total consumer line loss Broadband net adds1
2012/13 2013/14
‘000s
TV net additions
2012/13 2013/14
‘000s
2012/13 2013/14
BT retail net adds BT share of net adds
‘000s
(250)
(200)
(150)
(100)
(50)
0
Q1 Q2 Q3 Q4 Q1 Q2 Q3 Q4
30%
40%
50%
60%
70%
80%
90%
100%
0
30
60
90
120
150
180
Q1 Q2 Q3 Q4 Q1 Q2 Q3 Q40
10
20
30
40
50
60
70
80
Q1 Q2 Q3 Q4 Q1 Q2 Q3 Q4
Q4 consumer line loss of
49,000, best for >5 years
170,000 retail broadband net
adds in Q4, a 79% market share
Q4 TV net adds of 46,000,
up 15%
1 includes business customers; DSL & fibre, excluding cable

Telling your story
Questions and Answers

PwC
Tonight: Royal Theatre
Meet on floor -1 at 18:30 for a prompt departure
Slide 75
Global Communications GAAP Summit June 2014

Thank you
This publication has been prepared for general guidance on matters of interest only, and does not constitute professional advice. You should not act upon the information contained in this publication without obtaining specific professional advice. No representation or warranty (express or implied) is given as to the accuracy or completeness of the information contained in this publication, and, to the extent permitted by law, PricewaterhouseCoopers LLP, its members, employees and agents do not accept or assume any liability, responsibility or duty of care for any consequences of you or anyone else acting, or refraining to act, in reliance on the information contained in this publication or for any decision based on it.
© 2014 PricewaterhouseCoopers LLP. All rights reserved. In this document, “PwC” refers to PricewaterhouseCoopers LLP (a limited liability partnership in the United Kingdom) which is a member firm of PricewaterhouseCoopers International Limited, each member firm of which is a separate legal entity.