global corporate finance
TRANSCRIPT

S IX TH ED I T ION
Suk Kim and Seung H. Kim
GLOBALCORPORATEF INANCE

Global Corporate Finance

World Value of the Dollar
The table below, based on foreign-exchange quotations from Reuters, gives the rates of exchange for the US dollar against various currencies as of Friday,July 9, 2004. Unless otherwise noted, all rates listed are middle rates of interbank bid and asked quotes, and are expressed in foreign currency units per oneUS dollar.
Value Value Value Value Value ValueCountry (Currency) 07/09 07/02 Country (Currency) 07/09 07/02 Country (Currency) 07/09 07/02
Albania (Lek) 100.850 100.300 Gambia (Dalasi) 29.7500 29.7500 (Kina) 3.1109 3.1090Algeria (Dinar) 71.0100 71.0100 Ghana (Cedi) 9,027.5 9,025.0 Paraguay (Guarani) d 5,920.0 5,920.0Angola (New Kwanza) 83.9911 83.7239 Gibraltar (Pound) 0.6269 0.6269 Peru (Nuevo Sol) d 3.4507 3.4686Angola Greenland Philippines (Peso) 55.8036 55.8659(Readj Kwanza) 83.9911 83.7239 (Danish Krone) 5.9905 6.0347 Pitcairn IslandAntigua Grenada (NZ $) 1.5200 1.5444(East Caribbean $) 2.6700 2.6700 (East Caribbean $) 2.6700 2.6700 Poland (Zloty) o 3.6460 3.6750Argentina (Peso) 2.9499 2.9464 Guadeloupe (Franc) 7.4330 7.4330 Puerto Rico (US $) 1.0000 1.0000Armenia (Dram) 531.25 533.25 Guam (US $) 1.0000 1.0000 Qatar (Rial) 3.6398 3.6399Aruba (Florin) 1.7900 1.7900 Guatemala (Quetzal) 7.8950 7.8850 Réunion, Ile de laAustralia (Dollar) 1.3835 1.4021 Guinea Bissau (Franc) 7.4330 7.4330Azerbaijan (Manat) 4,920.0 4,915.0 (CFA Franc) 528.63 532.93 Romania (Leu) 32,943.0 32,964.0Bahamas (Dollar) 1.0000 1.0000 Guinea Rep. (Franc) 2,055.0 2,055.0 Russia (Ruble) m, b 29.1121 29.0107Bahrain (Dinar) 0.3770 0.3770 Guyana (Dollar) 179.000 179.000 Rwanda (Franc) 563.25 562.75Bangladesh (Taka) 59.1500 59.2500 Halti (Gourde) 33.1070 32.5000 Saint ChristopherBarbados (Dollar) 1.9900 1.9900 Honduras Rep. (East Caribbean $) 2.6700 2.6700Belarus (Ruble) 2,165.5 2,163.0 (Lempira) 18.2200 18.2100 Saint Helena (Pound) 0.6269 0.6269Belize (Dollar) 1.9700 1.9700 Hong Kong (Dollar) 7.8003 7.8003 Saint LuciaBenin (CFA Franc) 528.63 532.93 Hungary (Forint) 203.335 203.542 (East Caribbean $) 2.6700 2.6700Bermuda (Dollar) 1.0000 1.0000 Iceland (Krona) 70.9900 72.1000 Saint Pierre (Franc) 7.4330 7.4330Bhutan (Ngultrum) 47.6250 47.6250 India (Rupee) m 45.6204 45.7038 Saint VincentBolivia Indonesia (Rupiah) 8,896.8 9,132.4 (East Caribbean $) 2.6700 2.6700(Boliviano) f 7.9298 7.9385 Iran (Rial) o 8,656.0 8,645.0 Samoa, AmericanBosnia & Herzeg. Israel (Shekel) 4.4823 4.4723 (US $) 1.0000 1.0000(Convertible Mark) 1.5828 1.6113 Ivory Coast Samoa, WesternBotswana (Pula) 4.5403 4.5883 (CFA Franc) 528.63 532.93 (Tala) 2.8063 2.7540Bouvet Island Jamaica (Dollar) o 60.8100 60.7200 Sã Tomé and Principe(Krone) 6.8192 6.9052 Japan (Yen) 108.331 108.366 (Dobra) 8,700.0 8,700.0Brazil (Real) 3.0423 3.0386 Jordan (Dinar) 0.7090 0.7090 Saudi Arabia (Riyal) 3.7509 3.7495Brunei (Dollar) 1.7040 1.7155 Kazakhstan (Tenge) 135.300 135.850 Senegal (CFA Franc) 528.63 532.93Bulgaria (Lev) 1.5755 1.5874 Kenya (Shilling) 79.7000 79.4500 Seychelles (Rupee) 5.1800 5.1800Burkina Faso Kiribati Sierra Leone (Leone) 2,455.0 2,455.0(CFA Franc) 528.63 532.93 (Australia $) 1.3836 1.4022 Singapore (Dollar) 1.7021 1.7114Burundi (Franc) 1,075.3 1,075.5 Korea, North (Won) 2.2000 2.2000 Slovakia (Koruna) 32.1440 32.2997Cambodia (Riel) 3,990.0 3,990.0 Korea, South (Won) 1,149.4 1,154.5 Slovenia (Tolar) 193.230 194.690Cameroon (CFA Franc) 528.63 532.93 Kuwait (Dinar) 0.2948 0.2948 Solomon IslandsCanada (Dollar) 1.3184 1.3242 Laos, People DR (Dollar) 7.2697 7.4375Cape Verde Isl (Kip) 7,882.0 7,882.0 Somalia (Shilling) d 2,620.0 2,620.0(Escudo) 108.950 108.950 Latvia (Lat) 0.5341 0.5371 South AfricaCayman Islands Lebanon (Pound) 1,509.0 1,514.0 (Rand) c 6.0864 6.1162(Dollar) 0.8200 0.8200 Lesotho (Maloti) 6.1000 6.1510 Sri Lanka (Rupee) 102.780 102.350Central African Rep. Liberia (US $) 1.0000 1.0000 Sudan (Dinar) c 259.540 259.540(CFA Franc) 528.63 532.93 Libya (Dinar) 1.3233 1.3233 Sudan Rep. (Pound) 2,595.4 2,595.4Chad (CFA Franc) 528.63 532.93 Liechtenstein Suriname (Guilder) 2,515.0 2,515.0Chile (Peso) 634.92 630.12 (Swiss Franc) 1.2234 1.2327 SwazilandChina (Yuan) 8.2781 8.2781 Lithuania (Lita) 2.7815 2.8027 (Lilangeni) 6.1510 6.1510Colombia (Peso) o 2,668.8 2,670.2 Macau (Pataca) 8.0066 8.0066 Sweden (Krona) 7.4074 7.4571Comoros (Franc) 454.327 454.327 Macedonia (Denar) 49.8200 51.5400 Switzerland (Franc) 1.2235 1.2326Congo Dem. Rep. Madagascar DR Syria (Pound) 48.5200 50.2170(CFA Franc) 528.63 532.93 (Malagasy Franc) 9,508.0 9,305.0 Taiwan (Dollar) o 33.5345 33.5458Congo, People Rep. Malawi (Kwacha) 108.750 108.550 Tanzania (Shilling) 1,100.0 1,107.0(CFA Franc) 528.63 532.93 Malaysia (Ringgit) e 3.8000 3.8000 Thailand (Baht) 40.7332 40.6669Costa Rica (Colon) 438.770 438.000 Maldives (Rufiyaa) 12.8000 12.8000 Togo, Rep.Croatia (Kuna) 5.9379 5.9805 Mali Rep. (CFA Franc) 528.63 532.93 (CFA Franc) 528.63 532.93Cuba (Peso) 1.0000 1.0000 Malta (Lira) 0.3437 0.3465 Tonga IslandsCyprus (Pound) 0.4688 0.4718 Martinique (Franc) 7.4330 7.4330 (Pa’anga) 1.9608 1.9863Czech. Republic Mauritania (Ouguiya) 254.250 254.400 Trinidad & Tobago(Koruna) 25.3743 25.8131 Mauritius (Rupee) 28.2400 28.2100 (Dollar) 6.1500 6.1500Denmark (Krone) 5.9916 6.0350 Mexico (Peso) 11.4903 11.4482 Tunisia (Dinar) 1.2432 1.2473Djibouti (Franc) 175.000 175.000 Moldova (Leu) 11.8500 11.8550 Turkey (Lira) h 1,449,275.4 1,449,275.4Dominica Mongolia (Tugrik) m 1,180.0 1,174.0 Turks & Cakos(East Caribbean $) 2.6700 2.6700 Montserrat (US $) 1.0000 1.0000Dominican Rep. (Peso) 43.5000 45.0940 (East Caribbean $) 2.6700 2.6700 Uganda (Shilling) 1,741.5 1,761.5Ecuador (US $) g 1.0000 1.0000 Morocco (Dirham) 8.8756 8.9315 Ukraine (Hryvnia) 5.3183 5.3190Egypt (Pound) 6.2364 6.2201 Mozambique (Metical) 22,650.0 22,628.5 United Arab Emir.El Salvador Myanmar (Kyat) 6.4200 6.4200 (Dirham) 3.6730 3.6730(Colon) d 8.7520 8.7520 Namibia (Dollar) 6.0500 6.1900 United KingdomEquatorial Guinea Nauru Island (Pound Sterling) 0.5378 0.5454(CFA Franc) 528.63 532.93 (Australia $) 1.3836 1.4022 Uruguay (Peso) m 29.4118 29.5858Estonia (Kroon) 12.6050 12.7063 Nepal (Rupee) 72.0000 72.0000 Vanuatu (Vatu) 113.220 115.000Ethiopia (Birr) o 8.5800 8.6795 Netherlands Antilles VenezuelaEuropean Union (Guilder) 1.7800 1.7800 (Bolivar) d 1,919.4 1,919.4(Euro) 0.8057 0.8116 New Zealand (Dollar) 1.5200 1.5444 Vietnam (Dong) o 15,721.0 15,734.0Faeroe Islands Nicaragua Virgin Islands(Danish Krone) 5.9905 6.0347 (Cordoba Oro) 15.8400 15.8300 (US $) 1.0000 1.0000Falkland Islands Nigeria (Naira) m 134.550 133.300 Yemen (Rial) a 184.520 184.520(Pound) 0.6269 0.6269 Norway (Krone) 6.8213 6.9061 YugoslaviaFiji (Dollar) 1.7449 1.7715 Oman (Sul Rial) 0.3850 0.3850 (New Dinar) 58.6293 58.9989French Guiana Pakistan (Rupee) 58.2072 58.3431 Zambia (Kwacha) 4,780.0 4,763.0(Franc) 7.4330 7.4330 Panama (Balboa) 1.0000 1.0000 Zimbabwe (Dollar) 5,350.9 5,338.8Gabon (CFA Franc) 528.63 532.93 Papua New Guinea
*US $ per national currency unit. a, Parallel; b, Russian Central Bank rate; c, commercial; d, free market; e, government rate; f, financial; h, floating rate asof 2/22/01; m, market; o, official.Source: The Wall Street Journal, July 12, 2004, p. C13.

S I X T H E D I T I O N
G L O B A L C O R P O R A T E F I N A N C Et e x t a n d c a s e s
Suk H. Kim University of Detroit Mercy
and
Seung H. KimSt. Louis University

© 2006 by Suk H. Kim and Seung H. Kim
BLACKWELL PUBLISHING
350 Main Street, Malden, MA 02148-5020, USA9600 Garsington Road, Oxford OX4 2DQ, UK550 Swanston Street, Carlton, Victoria 3053, Australia
The right of Suk H. Kim and Seung H. Kim to be identified as the Authors of this Work has been asserted inaccordance with the UK Copyright, Designs, and Patents Act 1988.
All rights reserved. No part of this publication may be reproduced, stored in a retrieval system, or transmitted, in anyform or by any means, electronic, mechanical, photocopying, recording or otherwise, except as permitted by the UKCopyright, Designs, and Patents Act 1988, without the prior permission of the publisher.
This edition published 2006 by Blackwell Publishing Ltd
1 2006
Library of Congress Cataloging-in-Publication Data
Kim, Suk H.Global corporate finance : text and cases / Suk H. Kim, Seung H. Kim.—6th ed.
p. cm.Includes bibliographical references and index.ISBN-13: 978-1-4051-1990-0 (hardcover : alk. paper)ISBN-10: 1-4051-1990-X (hardcover : alk. paper) 1. International business enterprises—Finance.
2. International finance. 3. International business enterprises—Finance—Case studies. I. Kim, Seung Hee.II. Title.
HG4027.5.K557 2006658.15¢99—dc22
2005022069
A catalogue record for this title is available from the British Library.
Set in 10 on 12 pt Adobe Garamondby SNP Best-set Typesetter Ltd, Hong KongPrinted and bound in the United Kindomby TJ International, Padstow, Cornwall
The publisher’s policy is to use permanent paper from mills that operate a sustainable forestry policy, and which hasbeen manufactured from pulp processed using acid-free and elementary chlorine-free practices. Furthermore, thepublisher ensures that the text paper and cover board used have met acceptable environmental accreditation standards.
For further information onBlackwell Publishing, visit our website:www.blackwellpublishing.com

List of Figures xiiList of Tables xvPreface and Acknowledgments xviiiAbout the Authors xxvii
Part I: The Global Financial Environment 1
Chapter 1: Introduction 3Opening Case 1: TIAA-CREF Goes Global with Corporate Governance 31.1 Reasons to Study International Finance 51.2 Company Goals and Functions of Financial Management 81.3 Multinational Companies and their Performance 101.4 Principles of Global Finance 141.5 Agency Theory and Corporate Governance 181.6 Environmental Differences 211.7 The Structure of this Book 23
Summary 23Questions 24References 24Case Problem 1: What Is a National Company? 25
Chapter 2: Motives for World Trade and Foreign Investment 28Opening Case 2: The Effect of Foreign Investment on Exports 282.1 Motives for Foreign Trade 292.2 Economic Integration 38
Contents
2.3 Motives for Foreign Investment 432.4 A Synthesis of Foreign Trade and Investment Theories 46
Summary 47Questions 47Problems 48References 49Case Problem 2: The Fruits of Free Trade Under the World Trade Organization 49
Chapter 3: The Balance of Payments 54Opening Case 3: Opportunity Cost and Comparative Advantage 543.1 An Overview of the Balance of Payments 553.2 Balance-of-Payments Accounts 573.3 The Actual Balance of Payments 633.4 How to Reduce a Trade Deficit 70
Summary 72Questions 72Problems 73References 73Case Problem 3: USA–China Trade Relations 74
Chapter 4: The International Monetary System 78Opening Case 4: The Euro – A Story of Change 784.1 A Successful Foreign-Exchange System 814.2 A Brief History of the International Monetary System 874.3 The International Monetary Fund 944.4 The European Monetary Union 984.5 Proposals for Further International Monetary Reform 102
Summary 104Questions 105References 105Case Problem 4: The Mexican Peso Crisis of December 1994 106
Part II: Corporate Foreign-Exchange Risk Management 111
Chapter 5: The Foreign-Exchange Market and Parity Conditions 113Opening Case 5: The Volume of Foreign-Exchange Trading 1135.1 Major Participants in the Exchange Market 1155.2 Spot Exchange Quotation: The Spot Exchange Rate 1205.3 Forward Exchange Quotation: The Forward Exchange Rate 1255.4 International Parity Conditions 1285.5 Arbitrages 136
vi CONTENTS

Summary 142Questions 142Problems 143References 145Case Problem 5: The Big Mac Hamburger Standard: February 2003 146
Chapter 6: Currency Futures and Options 148Opening Case 6: Derivatives Risks 1486.1 The Currency Futures Market 1506.2 The Currency Options Market 1576.3 Futures Options 169
Summary 170Questions 171Problems 171References 173Case Problem 6: Merck’s Use of Currency Options 174
Chapter 7: Financial Swaps 177Opening Case 7: Why have Gillette and GE Chosen a Higher Cost of Funding? 1777.1 The Emergence of the Swap Market 1797.2 Plain Vanilla Swaps 1837.3 Motivations for Swaps 187
Summary 191Questions 192Problems 192References 193Case Problem 7: Regulations of Derivatives Markets 193
Chapter 8: Exchange Rate Forecasting 196Opening Case 8: Mundell Wins Nobel Prize in Economics 1968.1 Measuring Exchange Rate Changes 1978.2 The Forecasting Needs of the Multinational Company 1998.3 Forecasting Floating Exchange Rates 2018.4 Forecasting Fixed Exchange Rates 210
Summary 216Questions 216Problems 217References 218Case Problem 8: General Motors Operations in Mexico, and the Peso Crisis 218
Chapter 9: Managing Transaction Exposure and Economic Exposure 221Opening Case 9: Avon’s Actions to Protect Against Volatile Currencies 2219.1 The Basic Nature of Foreign-Exchange Exposures 222
CONTENTS vii

9.2 Transaction Exposure Management 2269.3 Economic Exposure Management 2339.4 Currency Exposure Management Practices 235
Summary 238Questions 238Problems 239References 241Case Problem 9: Western Mining’s Economic Exposure Management 241
Chapter 10: Translation Exposure Management 243Opening Case 10: Main Features of Accounting Exposure 24310.1 Translation Rules 24410.2 FASBs 8 and 52 24710.3 Hedging Translation Exposure 251
Summary 252Questions 253Problems 254References 256Case Problem 10: Dell Mercosur 256
Part III: The Global Financing Strategy 261
Chapter 11: International Financial Markets 263Opening Case 11: Foreign Investors Load Up with Asia’s Shares 26311.1 Eurocurrency Markets 26411.2 The Eurocurrency Interbank Market 26911.3 The Asian Currency Market 27411.4 The International Bond Market 27611.5 The International Equity Market 28111.6 Long-Term Capital Flows to Developing Countries 285
Summary 286Questions 287Problems 288References 289Case Problem 11: The Rise and Fall of the US Stock Market 290
Chapter 12: International Banking Issues and Country Risk Analysis 293Opening Case 12: Argentina’s Currency Crisis 29312.1 International Banking Operations 29512.2 International Loans 29812.3 Country Risk Analysis 309
viii CONTENTS

Summary 314Questions 314Problems 314References 315Case Problem 12: The World Bank 316
Chapter 13: Financing Foreign Trade 319Opening Case 13: US Export–Import Bank Seeks Private Investors 31913.1 Basic Documents in Foreign Trade 32013.2 The Payment Terms of Export Transactions 32613.3 Sources of Financing Foreign Trade 333
Summary 339Questions 340Problems 341References 342Case Problem 13: Arms Dealers Get Creative with Offsets 342
Chapter 14: Financing Foreign Investment 345Opening Case 14: Failed US–Vietnamese Joint Ventures 34514.1 Internal Sources of Funds 34614.2 External Sources of Funds 34914.3 Development Banks 357
Summary 362Questions 363Problems 363References 364Case Problem 14: IBM’s Strategic Alliances 364
Part IV: Global Investment Strategy 367
Chapter 15: International Working Capital Management 369Opening Case 15: An Efficient Global Treasury Structure 36915.1 The Basic Concepts of Working Capital Management 37015.2 Cash Management 38215.3 Accounts Receivable Management 38815.4 Inventory Management 389
Summary 392Questions 393Problems 393References 395Case Problem 15: Navistar International’s Netting System 395
Chapter 16: International Portfolio Investment 398Opening Case 16: LE Group Shows how Korea Inc. Might Restructure 39816.1 Key Terminology 400
CONTENTS ix

16.2 The Benefits of International Diversification 40716.3 Methods of International Diversification 413
Summary 419Questions 419Problems 420References 421Case Problem 16: Investing in DaimlerChrysler in the USA 421
Chapter 17: Corporate Strategy and Foreign Direct Investment 425Opening Case 17: How Can Companies Get the Most Out of Their Foreign Investment? 42517.1 An Overview of Foreign Direct Investment 42617.2 Foreign Direct Investment in Developing Countries 42917.3 Cross-Border Mergers and Acquisitions 433
Summary 441Questions 441Problems 442References 443Case Problem 17: BP’s Acquisition of Amoco 443
Chapter 18: International Capital Budgeting Decisions 447Opening Case 18: External Factors Affecting Foreign Project Analysis 44718.1 The Foreign Investment Decision-Making Process 44818.2 Portfolio Theory 45818.3 Capital Budgeting Theory and Practice 46018.4 Political Risk Management 462
Summary 468Questions 468Problems 469References 471Case Problem 18: Multinational Capital Budgeting Practices 472
Chapter 19: The Cost of Capital for Foreign Projects 474Opening Case 19: GM’s Target Debt Ratio in its Overseas Expansion 47419.1 The Weighted Average Cost of Capital 47619.2 The Optimum Capital Structure 48019.3 The Marginal Cost of Capital and Investment Decisions 48219.4 Cultural Values and Capital Structure 484
Summary 486Questions 486Problems 487References 488Case Problem 19: Do Multinational Firms Have Lower Debt Ratios than Domestic Firms? 488
x CONTENTS
Chapter 20: Corporate Performance of Foreign Operations 490Opening Case 20: Offshore Workers Increase IBM’s Profits 49020.1 The Global Control System and Performance Evaluation 49120.2 International Taxation 49920.3 Transfer Pricing and Tax Planning 506
Summary 509Questions 510Problems 510References 513Case Problem 20 : Advanced Technology’s Ethical Dilemma 514
Web Resources and Internet Exercises 518Answers to Selected End-of-Chapter Problems 538Glossary 545Index 564
CONTENTS xi

1.1 An integrated decision-making model in global finance 151.2 Expanded opportunity set for international business 162.1 Economic freedom and consumption 352.2 The Mercosur trade group 402.3 Progress on tariffs 502.4 The tax on trade 512.5 An organizational chart of the World Trade Organization 523.1 Global capital flows: sources and uses of global capital in 2001 693.2 The J-curve effect 713.3 US trade balances with Mexico and China 754.1 Argentine pesos per US dollar (inverted scale) 834.2 Market determination of exchange rates 844.3 How an increase in demand for pounds affects the equilibrium 854.4 How an increase in supply of pounds affects the equilibrium 864.5 The US dollar under floating exchange rates 904.6 The US dollar’s doldrums fuel the euro’s rise 1014.7 Mexican international reserves in 1994 1074.8 Mexican pesos per US dollar (inverted scale) 1085.1 Shares of the reported foreign-exchange trading volume, 2001 1145.2 A map of major foreign-exchange markets with time zones 1175.3 Bank of Japan intervention 1195.4 Relationships among various financial rates 1365.5 Covered-interest arbitrage 1396.1 The number of currency futures contracts traded on the Chicago
Mercantile Exchange 1586.2 The market share for currency futures, 2001 158
Figures

6.3 The market value of a call option 1666.4 The market value of a put option 1676.5 Profit–loss profiles for an option holder 1687.1 The structure of a parallel loan 1797.2 An interest rate swap 1847.3 A currency swap 1867.4 Motivation for the interest rate swap 1887.5 Motivation for the currency swap 1907.6 The size of the over-the-counter derivatives market 1948.1 Technical analysis: charting and the filter rule; peaks, troughs, trends,
resistance, and support levels illustrated for the $/DM 2058.2 Technical analysis: moving-average rule (5- and 20-day moving averages) 2069.1 Survey results of 110 chief financial officers 237
10.1 Exchange rates for the Brazilian real and the US dollar 25711.1 Asian markets boom as foreigners pile in 26411.2 International interest rate linkages 27211.3 Major stock exchanges as a share of world stock market capitalization 28311.4 Developing countries’ privatization revenues 28411.5 (a) Net financial flows to developing countries, 1995–2002; (b) net
financial flows to developing countries from the private sector, 1995–2002 28511.6 Stock prices and gross domestic product 29011.7 The boom and bust of the US and Japanese stock markets 29212.1 The real exchange rate between Argentina and Brazil 29412.2 Currency devaluations for five crisis countries 30312.3 Stock market drops for five crisis countries 30313.1 The process of a typical trade transaction 32613.2 US arms exports and offset obligations 34315.1 Corporate paradise 37915.2 The recent financial performance of Navistar International 39616.1 All for one, and one for all 39916.2 The security market line 40316.3 An efficient frontier 40716.4 An optimal portfolio 40816.5 Gains from international diversification 40916.6 Risk–return trade-offs of international portfolios, 1926–97 41116.7 Efficient international portfolios 41316.8 Total American investment in foreign securities 41516.9 Hedge funds: the number of funds and the net new assets 41616.10 Key financial statistics of DaimlerChrysler 42316.11 DaimlerChrysler’s revenues and profits 42317.1 Net inward FDI flows to developing countries, 1995–2003 43017.2 FDI as the share of GDP in developing countries, 1995–2003 43117.3 Privatization and M&A in developing countries, 1995–2003 43117.4 Incentives for foreign direct investment 43217.5 Corporate ownership in five major countries 43417.6 A pickup in merger activity 437
FIGURES xiii

17.7 Major oil companies: their reserves and market capitalization 44418.1 The risk–return trade-off and company goals 46118.2 Expropriation acts, by year 46519.1 GM’s Asia-Pacific forays 47519.2 Debt ratio and the cost of capital 48219.3 Optimum capital budget: domestic firm versus multinational 483
xiv FIGURES

2.1 Production alternatives of wheat and cameras 312.2 Gains to both nations from specialization and trade 312.3 The cost of protectionism 373.1 The US balance of payments (billions of US dollars) 603.2 The US dollar as a fraction of government reserves around the world 623.3 Major-country balances on current account (billions of US dollars) 643.4 Major-country balances on financial account (billions of US dollars) 643.5 World merchandise trade 653.6 The international investment position of the USA (billions of US dollars) 663.7 The international investment position of Japan (billions of US dollars) 664.1 The history of the international monetary system 954.2 The composition of the special drawing rights 974.3 How the EU and the USA stack up as of December 2002 1005.1 Currency cross rates and exchange rates 1215.2 The hamburger standard 1476.1 Currencies traded on the Chicago Mercantile Exchange 1516.2 Currency futures quotations in the CME: the Australian dollar 1536.3 Buying two franc futures contracts on February 1 1566.4 Reversing the earlier futures contracts on March 1 1566.5 Currency options prices traded on the Philadelphia Exchange 1596.6 Swiss franc option quotations 1606.7 Option: in the money, out of the money, or at the money? 1616.8 Futures positions after an option exercise 1697.1 The value of outstanding swaps (billions of US dollars) 1828.1 A summary of intervention survey responses 2148.2 Selected economic indicators for the USA and Mexico 219
Tables

8.3 Mexico’s balance of payments (millions of US dollars) 2199.1 Major differences among three types of exposure 2279.2 The relative importance of different exchange exposures 236
10.1 Exchange rates used to translate balance-sheet items 24610.2 A comparison of the four translation methods 24710.3 Translation of foreign-currency operations under FASBs 8 and 52 25011.1 Money market instruments 26811.2 Euronote issue facilities (billions of US dollars) 26911.3 Selected indicators on the size of the capital markets, 2001
(billions of US dollars) 27611.4 Outstanding amounts of international debt securities (billions of US dollars) 27911.5 The percentage breakdown of the total bond market by instrument
(billions of US dollars) 28111.6 Developing countries’ debt-to-equity ratios, 1997 and 2002 28611.7 The performance of the major US stock indexes 29112.1 The world’s 10 largest financial companies and the world’s 10 largest
economies (billions of US dollars as of December 31, 2002) 29612.2 Characteristics of US foreign banking offices 29812.3 International syndicated loans (billions of US dollars) 30712.4 The total external debt of 138 developing countries (billions of US dollars) 30712.5 Classification of developing countries by debt ratios 31112.6 Country risk rankings 31212.7 Bond ratings by Moody’s and Standard & Poor’s 31212.8 Sovereign ratings by Moody’s and Standard & Poor’s 31312.9 The organization of the World Bank Group 31713.1 Differences between factoring and forfaiting 33713.2 The usage of export-financing methods 33815.1 Days working capital for selected US and European technology hardware and
equipment companies 37215.2 The international payments matrix 37515.3 The multilateral netting schedule 37515.4 The effects of low versus high transfer price on the flow of funds 37715.5 The tax effect of low versus high transfer price 37815.6 Bundled versus unbundled contribution to consolidated income 38215.7 The use of international cash management techniques 38815.8 The effect of pricing on profits 39216.1 Betas for selected firms in two industries 40216.2 Average returns for US stock funds from July 17, 1998, to August 31, 1998 40316.3 Correlations of major stock market returns from 1980 to 2001 40916.4 Dollar-adjusted rates of return and standard deviations 41217.1 Foreign direct investment (billions of US dollars) 43017.2 The effects of a tax loss carryforward 43918.1 Projected earnings after taxes for the proposed project 45618.2 Depreciation cash flows 45718.3 The parent’s net present value 45718.4 Net cash flows under different weather conditions 459
xvi TABLES

18.5 Types of political risk and their importance 46318.6 The use of primary project evaluation techniques 47219.1 Three different financial plans 48119.2 Debt ratios for seven regions 48520.1 The impact of inflation on financial statements 49320.2 The impact of currency fluctuations on profits 49420.3 The tax effects of low versus high transfer prices 50720.4 Key statistics for Computer Engineering and High Tech 516
TABLES xvii

The Intended Market
The sixth edition of Global Corporate Finance is suitable for both undergraduate- and graduate-level courses in international finance, no matter where in the world it is taught, because it doesnot adopt any specific national viewpoint. Moreover, it is self-contained, and it combines theoryand applications. The earlier editions of Global Corporate Finance have been adopted by teach-ers in over 200 colleges, universities, and management development programs worldwide, par-ticularly because the book stresses practical applications in a user-friendly format. As evidence ofits wide-ranging appeal, a translation of the fourth edition into Chinese Complex Characters waspublished in 2001 by a major Chinese publishing company in Taiwan.
A Highly Competitive Set of Supplements
The following textbook-related items are available: a Study Guide, transparency masters of lecturenotes in Microsoft® Word and PowerPoint, prepared by the authors, and currency symbols andcodes. The Study Guide is provided at www.blackwellpublishing.com/kim. Each chapter in theStudy Guide includes a list of chapter objectives, detailed chapter outlines, a list of key termsand concepts with definitions, multiple-choice questions, and review problems with solutions forkey chapters. The transparency masters of lecture notes, and the currency symbols and codes arealso provided on the website.
A comprehensive Instructor’s Manual is also available on the website. The manual contains acomplete set of ancillary materials, including chapter outlines, chapter objectives, key terms andconcepts with definitions, answers to end-of-chapter questions, solutions to end-of-chapter prob-lems, answers to end-of-case questions, a test bank of 500 multiple-choice questions, and trans-parency masters of key tables and figures from the book.
Preface andAcknowledgments

Adopters of this book can also request a complimentary subscription to Multinational Busi-ness Review (MBR). MBR publishes application-oriented articles and cases dealing with interna-tional aspects of accounting, finance, and economics. Some MBR articles may be used assupplemental materials for international finance courses.
The Underlying Philosophy
CORPORATE PERFORMANCE OF FOREIGN OPERATIONS Overall, this book explores two ques-tions: Why do companies increase profits as they boost their foreign presence? Why are they farmore successful than domestic firms? By extending the exploration of these questions into detailedoperations and strategies, students learn the successful concepts and techniques of multinationalfirms. For example, students are introduced to seven key principles of global finance. Only thencan they grasp the platform on which multinational firms build their strategic plans and, at thesame time, sharply define the limited outlook of domestic companies that operate without theseseven principles. The sixth edition relentlessly pursues the techniques and concepts that boostthe performance of global companies until, almost as if by second nature, students can pinpointthe formula for growth in foreign markets. We then conclude the book by discussing how multi-national companies can use international accounting, taxation, and transfer pricing to improvetheir overall performance even further. This is why we are confident that this book will enablestudents to develop the requisite skills in international finance, which are essential to improvecorporate performance through foreign operations.
SHAREHOLDER VALUE AND CORPORATE GOVERNANCE Global Corporate Finance treats share-holder value and effective corporate governance as its foundation. Why? The maximization ofshareholder value through effective corporate governance is the best way to strengthen the welfareof all corporate constituents. The stockholders are the owners of the company, and they supplythe risk capital that protects the welfare of other constituents. Thanks to them, a higher stockprice makes it easier for a company to attract additional equity capital. Effective corporate gov-ernance is especially crucial to the success of multinational companies with operations all overthe world.
GLOBAL STRATEGY To be competitive in the new economy, which is characterized by infor-mation and global competition, companies need to think globally. Thus, this book emphasizesglobal strategy in order to equip readers with fresh ideas and concepts for successful businessoperations on a global basis.
AN EMPHASIS ON THE BASICS We believe that students learn most effectively when they firstachieve a firm grasp of basics. To stress the basics, we have initially devoted several chapters tothe fundamental concepts of international finance. Once the basics have been learned, theadvanced material flows naturally. As more advanced topics are developed in later chapters, wetie this material back into the fundamentals, in order to facilitate the learning process and toprovide students with the big picture.
USER-FRIENDLINESS This book builds on knowledge derived from basic courses in economicsand corporate finance. All traditional areas of corporate finance are explored, but from the view-
PREFACE AND ACKNOWLEDGMENTS xix

point of global financial managers. Tables, figures, and numerical examples clarify discussions offinancial concepts and techniques. All end-of-chapter questions and problems are tied or keyed tomajor topics presented in the chapter. Solutions to most end-of-chapter problems can be found atthe end of the text. Additionally, we have made an extra effort to clearly define every key term, whichwe highlight in bold type. This book also provides a quick reference glossary with 400 key terms.
COMPLETE REVISION Since the first edition of this book, we have applied the same principlein consequent revisions; that is, planning anew rather than simply adding on to what we hadalready written. This approach has undoubtedly helped us avoid two problems: we have not over-looked important changes in international finance, and we have not unnecessarily increased thelength of the book. This sixth edition contains many new cases, new sections, and new practi-cal examples, but it is shorter in length than the previous edition.
A SUMMARY OF THE UNDERLYING PHILOSOPHY Instructors who want students to possess prac-tical, job-oriented skills in international finance will find that Global Corporate Finance speaks totheir needs. Corporate recruiters often criticize business schools for turning out graduates whocannot contribute immediately. At the core of this criticism is the belief that, while students areeducated in various theories, little emphasis is placed on developing practical skills. For thatreason, we have been especially careful to ensure that such criticism will not apply to those whoadopt a book that aims at developing students’ skills in international finance. In fact, we expectthat many students will keep this book as a useful reference work after they have completed theircourses.
Learning Features
A CASE-STUDY APPROACH Students find different ways to master a subject, but we believe thatthe case-study approach is the most effective. Although this book is not a casebook, it centerson a series of real-life, current, and decision-oriented cases. We provide actual cases from the realworld to begin and end each chapter. In other words, all 40 cases are bona fide real cases.
GLOBAL FINANCE IN ACTION In this edition, students will find 50 discussions under theheading of “Global Finance in Action.” We further catch the readers’ attention by setting thesetopics apart on the page. These boxes include real-life examples, contemporary issues, and impor-tant research findings, as well as new financial instruments and techniques. Among the topicscovered in these boxes are the impact of the September 11, 2001 attacks on the world economy,the high cost of protectionism, and the US accounting scandal of 2002 and its impact on cor-porate governance.
INTERNET RESOURCES We have added a list of appropriate website addresses and a set of Inter-net questions for every chapter: these are located at the end of the book to help students findspecific online sources of information about current company, market, and business events. Inaddition, we have designed the questions to help students use real-time resources in preparingexecutive briefings and in solving global finance problems.
REAL-WORLD EXAMPLES Global Corporate Finance focuses primarily on corporate finance prac-tice. Throughout, numerous real-world examples present actual applications of financial theories
xx PREFACE AND ACKNOWLEDGMENTS

and techniques. These discussions center on how managerial decision-makers work within aglobal business with specific areas of responsibility for corporate finance. Specifically, this bookis solidly grounded in the theory of modern corporate finance and yet has strong ties to the realworld of international finance. We discuss and illustrate just about every theory and concept withactual data and/or practical examples.
READABILITY This book is readable and easy to understand because it discusses the basic toolsand techniques of global finance without a complex treatment of theoretical concepts. Studentsbecome frustrated when they have to study mathematical formulas without correspondingnumerical examples. Practically all of the formulas used in this book are accompanied by prac-tical, but straightforward, numerical examples. We emphasize readability because we believe thatit will motivate readers to pursue further knowledge in international finance.
Pedagogical Features
For ease of learning, each chapter of Global Corporate Finance follows a common format:
• At the beginning of each chapter, a mini-case is provided to achieve two objectives: (1) tobuild student interest with regard to the upcoming chapter and (2) to introduce a real-worldexample that will be explained further by theories and research findings presented in thechapter.
• The introductory mini-case is followed by a chapter overview, which describes the chapterthemes and the content of the major sections.
• Real-world illustrations, numerical examples, figures, tables, and special boxes are integratedthroughout the text to clarify discussions of financial concepts and techniques.
• Key terms and concepts are presented in bold type when they are first introduced. We havealso concentrated on clearly defining key terms.
• A short summary provides students with a handy overview of key concepts for review.• Those references used in each chapter are listed to allow readers to find sources that provide
additional information about specific topics discussed in the chapter.• A generous number of questions and problems support text discussions; they reemphasize
definitions, concepts, and the application of theory.• An analytic mini-case concludes each chapter. The closing case problems serve a different
purpose from the opening ones. They present situations for which students must analyze pos-sible actions on the basis of what they have learned in the chapter. In other words, the openingcases enhance interest and recall essential facts; the closing case problems enhance the devel-opment of critical reasoning skills. Moreover, Internet exercises have been added at the endof each case problem, to explain how the Internet may be used to access international finan-cial data and obtain information on the case concepts.
To the Student
While you may use this book in whatever way you find most comfortable, the following tips maygive your learning experience added value. In each chapter:
PREFACE AND ACKNOWLEDGMENTS xxi

• Read the opening case, to view the upcoming material through a real-world example.• Read the chapter text.• Read the chapter summary.• Study the key terms and concepts that are highlighted in bold type. The website consolidates
all of the key terms and concepts, with end-of-chapter definitions.• Rework any numerical examples provided in the chapter.• Read our lecture notes for the chapter.• Prepare notes using your professor’s lectures, lecture notes, and the textbook. Make those
notes your own.
Changes to the Sixth Edition
We have carefully revised the sixth edition to reflect changes in global finance. In response to reader suggestions, we have eliminated four chapters, added two new chapters, added 16 new cases, developed 20 Internet resources, and discussed many new practical examples in special boxes under the heading “Global Finance in Action.” We have also revised 40 Internet exercises for students who take international finance courses. We have expanded ourcoverage on shareholder value and corporate governance. We have discussed the introduction ofthe euro and its impact in several chapters. We have also discussed several new topics in manychapters – the impact of the September 11, 2001, attacks on the world economy, the growingeconomic power of China, and the 2002 corporate scandal in the United States and its impacton corporate governance. To enhance the international focus of the sixth edition, we havedropped those topics that took specifically American viewpoints while increasing our coverage ofemerging markets. Finally, we have replaced the currencies of 12 eurozone countries with othercurrencies throughout the text, the Instructor’s Manual, and the Study Guide. These and otherchanges are designed to place the focus of the book on managerial finance for multinational companies.
Chapter 1, “Introduction,” has been extensively rewritten to eliminate a few existing topicsand to discuss three new topics: the corporate governance of a major pension fund as an openingcase; the impact of the September 11, 2001, attacks on the world economy; and the orientationof globalization. Chapter 2, “Motives for World Trade and Foreign Investment,” examines theimpact of economic freedom on consumption, the cost of protectionism, and the fruits of freetrade under the World Trade Organization. Chapter 3, “The Balance of Payments,” considersthe implications of the huge US trade deficit and the trade friction between the USA and China.Chapter 4, “The International Monetary System,” discusses the euro as an opening case, com-presses the history of the international monetary system, and expands the coverage of the euro.
In chapter 5, “The Foreign-Exchange Market and Parity Conditions,” we have replaced boththe opening case and the ending cases with new ones, shortened our discussion on the overviewof the foreign-exchange market, and, in a box, examined the effectiveness of official exchangeintervention. Chapter 6, “Currency Futures and Options,” discusses the risk of financial deriva-tives more explicitly and analyzes the reasons for the decline in the importance of currencyfutures. We have substantially revised chapter 7, “Financial Swaps,” to reflect new informationin the opening case, to describe the US accounting scandal of 2002, and to explain the motivesfor the use of financial swaps. Chapter 8, “Exchange Rate Forecasting,” tracks the fluctuation ofthe US dollar in a box and discusses the reasons for central bank intervention in currency markets.
xxii PREFACE AND ACKNOWLEDGMENTS

The fifth edition of this book had only one chapter about foreign-exchange risk management,but the sixth edition discusses this important topic in two separate chapters: chapter 9, “Man-aging Transaction Exposure and Economic Exposure,” and chapter 10, “Translation ExposureManagement.” This means that we have covered foreign-exchange risk management in itsentirety.
Chapter 11, “International Financial Markets,” has been completely rewritten to shorten ourcoverage of a few existing topics and to discuss four new topics: the attractiveness of Asian shares,international interest rate linkages and corporate governance reform as a matter of global concern,new trends in stock markets, and the rotation from debt to equity by developing countries.Chapter 12, “International Banking Issues and Country Risk Analysis,” has undergone extensiverevision to discuss Argentina’s currency crisis, the World Bank, and the World’s largest financialcompanies. Chapter 13, “Financing Foreign Trade,” evaluates countertrade in a new section andexplains how to collect overdue accounts in a new topic. Chapter 14, “Financing Foreign Invest-ment,” examines motives for strategic alliances in a new topic. Chapter 15, “InternationalWorking Capital Management,” has been shortened. Chapter 16, “International Portfolio Invest-ment,” has a new opening case and discusses most topics with updated information. Chapter 17,“Corporate Strategy and Foreign Direct Investment,” looks at the reasons for the recent growthin new mergers and discusses the impact of reduced foreign direct investment in the USA.Chapter 18, “International Capital Budgeting Decisions,” has been substantially revised toinclude political risk analysis in a major new section. In chapter 19, “The Cost of Capital forForeign Projects,” a few topics have been dropped but we discuss cultural values and capital struc-ture in a new section. Chapter 20, “Corporate Performance of Foreign Operations,” is a newchapter that discusses those factors affecting the corporate performance of foreign operations.
Suk H. Kim and Seung H. Kim
Acknowledgments
Many colleagues have provided constructive advice critical to the successful development of thesixth edition. We would like to express our thanks to Dean Bahman Mirshab (University ofDetroit Mercy) and Dean Ellen F. Harshman (St. Louis University) for their support and encour-agement. Our special thanks go to a number of magnanimous reviewers, who provided detailedwritten suggestions for this edition in a response to the publisher’s request for their review. Weare also grateful to Dan Baack (St. Louis University) and Stacey Banks (Cleary University) fordeveloping a Study Guide to complement this book. Several students deserve special acknowl-edgment for their contributions: Eun-Young Choi, Yalda Ghorashyzadeh, and Kala Raman. We also wish to thank the staff of Blackwell Publishing who made many valuable contributionsto this edition: Seth Ditchik, Joanna Pyke, Rhonda Pearce, Laura Stearns, and Geoffrey D.Palmer. Finally, and importantly, we thank the following reviewers for their recommendationsand insights:
Sadhana Alangar, Cleary UniversityMazin Aljanabi, Al Akhawayn University Ifrane, MoroccoStephen F. Borde, University of Central FloridaBruce Brorby, University of Detroit Mercy
PREFACE AND ACKNOWLEDGMENTS xxiii

Alva Wright Butcher, University of Puget SoundHai Yang Chen, Youngstown State UniversityJohn S. Cotner, Loyola College, BaltimoreReid W. Click, George Washington UniversityJay Choi, Temple UniversityKaren Craft Denning, West Virginia UniversityRhonda DeLong, Eastern Michigan UniversityAnthony Diemo, Detroit College of BusinessJohn H. Dunning, Rutgers UniversityEverton Dockery, Staffordshire UniversityBrian Fitzpatrick, Rockhurst UniversityStanley Flax, St. Thomas UniversityRamesh Garg, Eastern Michigan UniversityClaire Gilmore, Saint Joseph’s UniversityGary A. Giamartino, University of Detroit MercyGunita Grover, University of DelawareNell S. Gullett, University of Tennessee at MartinMahfuzul Haque, Indiana State UniversityChi-Cheng Hsia, Portland State UniversityChang Soo Huh, GS HoldingsYoun-Suk Kim, Kean University of New JerseyRobert K. Kleiman, Oakland UniversityRichard Kowalczyk, University of Detroit MercyCharles O. Kroncke, University of Wisconsin–MilwaukeeJohn W. Lang, Cambridge UniversityDonald Lessard, Massachusetts Institute of TechnologyWeiping Liu, University of Wisconsin–Green BayJay R. Marchand, Westminster CollegeWilliam T. Moore, University of South CarolinaAtsuyuki Naka, University of New OrleansGeorge Ogum, La Sierra UniversitySpencer Pack, Connecticut CollegeChong S. Pyun, University of MemphisHarri Ramcharran, Universtiy of AkronHongkeun Rim, Shippensburg UniversityAlan Robinson, Simmons CollegeNeil Seitz, St. Louis UniversityKilman Shin, Ferris State UniversityTai S. Shin, Virginia Commonwealth UniversityRobert Singer, St. Louis UniversityMartha Soleau, University of Detroit MercySankar Sundarrajan, Tarleton State UniversityPeter Tsirigotis, The Securities and Exchange CommissionRobert Uptegraff, Central Michigan UniversityDavid VanerLinden, Kent State UniversityJoseph K. Winsen, University of Newcastle
xxiv PREFACE AND ACKNOWLEDGMENTS

Regan Whitworth, American University of ArmeniaFred Yeager, St. Louis UniversityYeomin Yoon, Seton Hall UniversityDon Welty, Westminster CollegeJohn Zietlow, Lee University
The authors and publishers gratefully acknowledge the following for permission to reproducecopyright material:
“World Value of the Dollar” table: courtesy The Wall Street Journal, July 12, 2004, p. C13.Reprinted by permission.
Figure 2.2: The Mercosur Trade Group, courtesy The Wall Street Journal, June 16, 2003,p. A13. Reprinted by permission.
Figure 2.3: Progress on Tariffs, from International Business: Environments and Opera-tions, 10th edn, by J. D. Daniels, L. H. Radebaugh, and D. P. Sullivan.Copyright © 2004. Reprinted by permission of Pearson Education, Inc.,Upper Saddle River, NJ, chapter 6.
Figure 3.3: US Trade Balances with Mexico and China, courtesy The Wall Street Journal,Aug. 4, 2003 p. A4. Reprinted by permission.
Figure 4.1: Argentine Pesos Per US Dollar, courtesy The Wall Street Journal, July 2,2003, p. A6. Reprinted by permission.
Figure 4.6: US Dollar’s Doldrums Fuel Euro’s Rise, courtesy The Wall Street Journal,Jan. 2, 2004, p. R13. Reprinted by permission.
Table 5.1: Key Currency Cross Rates, courtesy The Wall Street Journal, July 12, 2004,p. C13. Reprinted by permission.
Table 11.1: Money Rates, courtesy The Wall Street Journal, June 22, 2004, p. C16.Reprinted by permission.
Figure 11.1: Asian Markets Boom, courtesy The Wall Street Journal, July 17, 2003, p. C12. Reprinted by permission.
Figure 13.2: US Arms Exports and Offset Obligations, courtesy The Wall Street Journal,April 20, 2000, p. A18 (from the US Department of Commerce). Reprintedby permission.
Figure 15.1: A Hot Spot, courtesy The Wall Street Journal, June 29, 2000, p, A21.Reprinted by permission.
Figure 16.1: All for One, and One for All, courtesy The Wall Street Journal, Sept. 8, 2003,p. A10. Reprinted by permission.
Figure 16.8: Americans Look Abroad, courtesy The Wall Street Journal, July 2, 2001, p. C20. Reprinted by permission.
Figure 16.9: The Money Pours In, courtesy The Wall Street Journal, July 7, 2004, p. C1.Reprinted by permission.
Figure 16.10: DaimlerChrysler’s Dilemma, from J. Ball, “DaimlerChrysler Frets over Lossof US Shareholders,” The Wall Street Journal, Mar. 24, 1999, p. B4.Reprinted by permission.
Figure 16.11: “The Struggling Chrysler Group,” courtesy The Detroit News, Feb. 29,2001, p. A4. Reprinted by permission.
PREFACE AND ACKNOWLEDGMENTS xxv

Figure 17.5: Closely Held, courtesy The Wall Street Journal, Apr. 26, 1999, p. R15.Reprinted by permission.
Figure 17.6: A Pickup in Merger Activity, courtesy The Wall Street Journal, Jan. 2, 2004,p. R15. Reprinted by permission.
Figure 18.2: Expropriation Acts, by Year, from C. R. Kennedy, “Multinational Corpo-rations and Expropriation Risk,” Multinational Business Review, Spring1993, p. 45. Reprinted by permission of Suk Kim.
Case Problem 10: Dell Mercosur, from International Business Environments and Operations,10th edn, by J. D. Daniels, L. H. Radebaugh, and D. P. Sullivan. Copy-right © 2004. Reprinted by permission of Pearson Education, Inc., UpperSaddle River, NJ, pp. 623–6.
The publishers apologize for any errors or omissions in the above list and would be grateful tobe notified of any corrections that should be incorporated in the next edition or reprint of thisbook.
xxvi PREFACE AND ACKNOWLEDGMENTS

Suk H. Kim
Suk H. Kim, a professor of international finance, is the program coordinator of finance and inter-national business at the University of Detroit Mercy. Professor Kim has authored or coauthored14 finance textbooks and 60-plus refereed journal publications. According to an article by AllenMorrison and Andrew Inkpen ( Journal of International Business Studies, First Quarter, 1991),Professor Kim was among the top 25 international business researchers in the 1980s. He was aFulbright Scholar in international finance at Yonsei University in Seoul, Korea, in 1993. He is the editor of North Korean Review (www.northkoreanreview.com) and the founding editor of Multinational Business Review. Dr Kim received his MBA from Pepperdine University and hisPhD in finance from St. Louis University. He has received awards for excellence in teaching andresearch.
Seung H. Kim
Seung H. Kim, Paul G. Lorenzini Endowed Professor in International Business, is Director ofthe Boeing Institute of International Business at St. Louis University. He has authored or coau-thored seven books and 30 refereed journal publications. Professor Kim received an outstandingteacher award at the School of Business and Administration, St. Louis University. He has servedas a consultant for multinational companies and international banks, and on the boards of thefollowing organizations: the Missouri District Export Council, appointed by the US CommerceSecretary; the State of Missouri Governor’s Office; the World Trade Center of St. Louis; and theWorld Affairs Council of St. Louis. Dr Kim attended the Seoul National University Law School,and received his MBA and PhD from New York University.
About the Authors


Part I of this text (chapters 1–4) presents an overview of the global financial environment.Chapter 1 develops the goal of the multinational company to be used in the financial decision-making process and examines the role of global finance in achieving this goal. Chapter 2 exam-ines motives for world trade and foreign investment. Before considering foreign trade and foreigninvestment separately in the coming chapters, we will discuss key trade and investment theoriesin this chapter. Chapter 3 describes the balance of payments and its relationship to currencyregimes. Chapter 4 looks at an overview of the international monetary system and how the choiceof system affects exchange rates.
PART I
The Global FinancialEnvironment


Opening Case 1: TIAA-CREF Goes Global with Corporate Governance
Teachers Insurance and Annuity Association College Retirement Equities Fund (TIAA-CREF) is one of the largest financial service providers in the world, and has provideda variety of financial services to the faculty and staff of America’s education andresearch communities for more than 80 years. As one of the world’s largest institu-tional investors, TIAA-CREF historically acted on behalf of shareholders to improvethe way US companies operate. Now, it is applying this expertise abroad with stockholdings in international companies. With the CREF Stock Account holding more than$200 billion in net assets and equity investments, TIAA-CREF is one of the largestproactive shareholder activists in the US market. In the past few years, its experiencedcorporate governance team has expanded efforts to ensure fair representation forshareholders of the international companies whose stock is held in the CREF StockAccount, the CREF Global Equities Account, and CREF’s other international investments.
First stop: Western Europe. With international holdings in about 30 countriesworldwide, TIAA-CREF has the luxury of starting with any region, but the team pickedWestern Europe, and for good reasons. TIAA-CREF approaches Western Europe asone economic entity because of the European Union, which makes corporate gover-nance changes easier to initiate on a regional basis than in other parts of the world.“Europe is a market that is ripe for accepting change,” says Peter Clapman, TIAA-CREF senior Vice President and Chief Counsel. Although European and US corpora-tions are increasingly similar, European shareholders lack representation – such as invoting rights and disclosure practices. “In many countries, there are companies wherethere is an absence of one share–one vote for shareholders. And disclosure practices,
CHAPTER 1
Introduction

4 INTRODUCTION
such as timely quarterly data, are not as good as in the US,” says Clapman. “Thereis also a lesser degree of accountability to corporate boards.”
TIAA-CREF works for generalized, improved European corporate governance stan-dards both on its own and through global organizations. In fact, TIAA-CREF intendsto use greater resources in corporate governance programs in Western Europe in orderto foster changes in both national policies and in specific companies. Its corporategovernance team focuses on issues on a country-by-country basis, meeting with gov-ernment regulators, stock exchange officers, and company executives. As in its deal-ings with US companies, TIAA-CREF initially approaches European executives behindthe scenes, without much fanfare, to discuss the need to make changes. Respectingcultural differences takes top priority. “We have to be careful that our approach is cal-ibrated to respect their culture, while at the same time making them understand ourconcerns and appreciate that it is to their benefit to reasonably accommodate ourrequests,” Clapman stated.
Although maintaining cultural sensitivity abroad, TIAA-CREF still files resolutionsto seek change on behalf of shareholders if companies ignore its concerns. In France,for example, the government tried to force a company to transfer a percentage ofassets for political influence. TIAA-CREF successfully stopped the action by filing ashareholder resolution, which had support from shareholders and others within thecountry. In another instance, in 2000 an Italian telephone company planned to sellsome of its assets at an unreasonably low price to a major corporate shareholder.TIAA-CREF communicated with regulators in Italy and stifled the corporate action.
Clapman believes that corporate governance initiatives will continue to improve inEurope and expand to Asia and Latin America, because countries and companiesincreasingly recognize that they will not otherwise receive necessary capital frominvestors. A recent study by the consulting firm McKinsey & Company, in coopera-tion with the World Bank and Institutional Investor’s regional institutes, indicates thatinvestors are willing to pay, on average, a premium of about 20 percent for shares ina well-governed European company. The average varies from 17.9 percent for com-panies in the United Kingdom to 19.8 percent in France, 20.2 percent in Germany,and 22 percent in Italy. In Asia, the average premium in well-established markets, suchas Korea and Japan, is 24.2 percent and 20.2 percent, respectively.
TIAA-CREF’s governance team discusses shareholder issues with the InternationalCorporate Governance Network and the Organization for Economic Cooperation andDevelopment, both of which have major European representation. For its part, WesternEurope has become receptive to TIAA-CREF’s efforts, but “there is still room to grow,”says Clapman. “It is two steps forward, one step back, but the momentum is there.”
Source : www.tiaa-cref.org.
Globalization stands for the idea of integrating the world marketplace, creating a so-called “bor-derless world” for goods and services. In addition, to some extent, we already have such a world.Consider physical communications (mail, the telephone, the Internet, and airline and ocean ship-ping networks); entertainment (film and TV, music, news, and sports); economic and business

exchange (banking and insurance networks, dependable foreign-exchange and stock markets, andreciprocal trade arrangements); and even ideas and competing spiritual values through evangeli-cal Christianity, Islam, and others (Harry 2001).
The increasing economic integration of goods, services, and financial markets presents oppor-tunities and challenges for governments, business firms, and individuals. Although business oper-ations in countries across the globe have existed for centuries, the world has recently entered anera of unprecedented worldwide production and distribution. Worldwide production and dis-tribution are critical for the survival of the multinational corporation (MNC) – its ability toproduce products and sell them at a profit. International finance is an integral part of total man-agement and cuts across functional boundaries because it expresses inputs, outputs, plants, andresults in monetary terms.
This book deals with the financial decisions of an MNC, decisions that both large and smallMNCs must make. Thus, the underlying financial principles are basically the same for both typesof companies. In this introductory chapter, we lay the foundation for the entire text with six sep-arate sections. The first section explains reasons to study international finance. The second sectionidentifies the primary goal of the MNC and the functions of the financial manager necessary toachieve this primary goal. The third section analyzes MNCs and their performance. The fourthsection discusses the major principles of global finance that favor MNCs over domestic compa-nies. The fifth section describes two major constraints that impede an MNC’s effort to achieveits goal: large agency costs and environmental differences. The last section gives an overview ofthe book.
1.1 Reasons to Study International Finance
A college student, such as yourself, should study international finance. “I am not an internationalfinance major,” you say. “Why should I have to take a course in international finance?” That isa reasonable question. It is true that most readers of this book will not necessarily work in theinternational finance department of a large company such as IBM or the foreign-exchange depart-ment of a large bank such as Chase Manhattan. All textbooks on business and economics teachthat resources are scarce. We know that your time is one of those scarce resources. Hence, wewill give you just a few reasons why you should study international finance.
To understand a global economy
The world has recently reached the climax in a drama of economic change. No one can denythe effects of these changes on our hopes for peace and prosperity: the disintegration of the SovietUnion; political and economic freedom in Eastern Europe; the emergence of market-orientedeconomies in Asia; the creation of a single European market; trade liberalization through regionaltrading blocs, such as the European Union, and the world’s joint mechanisms, such as the WorldTrade Organization. As global integration advances amid intensified international competition,the United States, Japan, and Europe are expected to lead the world toward a system of free tradeand open markets.
Three recent changes have had a profound effect on the international financial environment:the end of the Cold War, the emergence of growing markets among the developing countries of
REASONS TO STUDY INTERNATIONAL FINANCE 5

East Asia and Latin America, and the increasing globalization of the international economy.Understanding these changes should help you see where the international economy is headed inthe future so that you can more effectively respond to these challenges, fulfill your responsibili-ties, and take advantage of these opportunities.
THE END OF THE COLD WAR In 1989, the Soviet Union relaxed its control over the EasternEuropean countries that had suffered its domination for over 40 years. These countries imme-diately seized the opportunity to throw off authoritarian communist rules. Two years later, theSoviet Union itself underwent a political and ideological upheaval, which quickly led to itsbreakup into 15 independent states. Most of these and other formerly centrally plannedeconomies are now engaged in a process of transition from central planning and state ownershipto market forces and private ownership. In fact, the market reforms of some former communistcountries, such as the Czech Republic, Hungary, and Poland, have become so advanced that theywere able to join the European Union in 2004.
THE INDUSTRIALIZATION AND GROWTH OF THE DEVELOPING WORLD The second greatchange of recent years has been the rapid industrialization and economic growth of countries inseveral parts of the world. The first of these emerging markets were the four Asian “tigers”: HongKong, Singapore, South Korea, and Taiwan. China and other Asian countries have followed intheir footsteps. Having overcome the debt crisis of the 1980s and undertaken economic andpolitical reforms, some of the Latin American countries – Argentina, Brazil, Chile, Mexico, andVenezuela – have also begun to see faster, more sustained growth. As a result, some countriesclassified as developing countries until not too long ago – Mexico and South Korea – are nowmembers of the Organization for Economic Cooperation and Development (OECD), which isoften called “the rich man’s club” because it consists of 30 of the wealthiest nations in the world.
INCREASED GLOBALIZATION The third major change in the international financial environ-ment is even more sweeping than the first two. National economies are becoming steadily moreintegrated as political, regulatory, technological, and economic forces radically change the globalcompetitive environment. Some of these forces include the collapse of communism, the privati-zation of state-owned enterprises around the world, the revolution in information technologies,massive deregulation, the adoption of global standards by many developing countries, and thewave of mergers, leveraged buyouts, and takeovers.
Advances in information technologies and reductions in trade barriers have played a particu-larly important role in the globalization process of the world economy. Reductions in techno-logical barriers have occurred as transportation and communication costs have dropped. “Thisdeath of distance” (OECD 1999) facilitates international production activities, enlarges tradingareas, and enables companies to exploit international cost differentials. Government-made bar-riers have also fallen as tariffs and nontariff barriers have been reduced in a series of multilateralnegotiations and trading blocs since World War II. These falling technological and government-made barriers have caused trade and foreign direct investment to increase several times faster thanworld output since 1985.
There are also many examples of the growing importance of international operations for indi-vidual companies. Coca Cola, Dow Chemical, ExxonMobile, DaimlerChrysler, Hewlett Packard,IBM, Johnson & Johnson, and McDonald’s earn more than half of their total operating profitsthrough international operations. MNCs, such as BP Amoco, General Motors, and Sony, do
6 INTRODUCTION

business in more than 150 countries around the world. Nestlé, Philips Electronics, Ford, andIBM have more workers overseas than in their own home countries. In 2002, Nestlé SA, forexample, had 245,000 workers overseas compared with only 10,000 workers in its home country,Switzerland.
By the same token, global finance has also become increasingly important as it serves worldtrade and foreign investment. International earning assets for the Bank of America, for example,represent more than half of its total earning assets. Deutsche Bank maintains more than 500overseas branches in over 100 countries. Simply stated, each nation is economically related toother nations through a complex network of international trade, foreign investment, and inter-national loans.
Most large and many medium-size companies around the world have international businessoperations. In recent years, it has become clear that international events significantly affect com-panies that do not have foreign operations. Business school graduates have an advantage inmoving their companies forward if they understand the basic elements of international finance.Apart from career interests, persons who want to improve their knowledge of the world will beseriously handicapped if they do not understand the economic dynamics and policy issues offinance, trade, and investment flows among nations.
REASONS TO STUDY INTERNATIONAL FINANCE 7
Global Finance in Action 1.1Have the September 11, 2001, Attacks Ended Globalization?
The last great period of globalization ended effectively in 1914, when an act of vio-lence – the assassination of Archduke Ferdinand in Sarajevo – touched off World WarI. More than a half-century passed before cross-border trade and investment wouldagain play such a prominent role in the global economy. After the September 11attacks against the World Trade Center in New York and the Pentagon in Washing-ton, DC, economists worried that the year 2001 would go down in history as anotherhigh-water mark in an era of globalization. Recession, security concerns at home, andresentment abroad seemed to neutralize forces that drove America’s search for newmarkets and cheap supplies overseas during the 1990s.
A survey in November 2001 of 171 business executives at large US multinationalcompanies by PricewaterhouseCoopers found that their commitment to internationalexpansion rose after the September 11 attacks. Twenty-seven percent of the respon-dents planned some form of geographical expansion during the year ahead, up 19percent before the attacks. Starbucks Corp., for example, opened more than 70 inter-national stores between the end of September and the end of November, an 8 percentincrease. Dell Computer Corp., meanwhile, picked up market share abroad, althoughGateway retreated.
Furthermore, policy-makers have generally moved toward free trade since Sep-tember 11, 2001. China, the world’s most populous nation, has officially entered theWorld Trade Organization. In Doha, Qatar, 142 nations agreed in November 2001to start a new round of talks to lower trade barriers. In addition, the US Congressvoted to extend to President George W. Bush “fast track” authority to negotiate trade

To make intelligent personal decisions
When you graduate from college and decide to take a job, you may have the advantage of com-paring two job offers: one from Merrill Lynch and another one from Nomura Securities. Whenyou decide to buy a car, your choice between the latest models offered by General Motors andVolkswagen may well depend on the exchange rate between the dollar and the euro. When youbegin a career and save for your retirement, you may choose between US securities and non-USsecurities. When you take your next vacation, you may spend it at Tokyo Disneyland or at EuroDisneyland. Although these are not international finance jobs, they all require significant knowl-edge of international finance to make intelligent decisions. In all of these cases, the importantpoint is that you will participate not just in the US economy but in economies around the world.
1.2 Company Goals and Functions of Financial Management
1.2.1 Multinational company goals
Management is motivated to achieve a number of objectives, some of which conflict with eachother. Such conflicts arise because the firm has a number of constituents, such as stockholders,employees, customers, creditors, suppliers, and the local community, whose desires do not nec-essarily coincide. It is management’s responsibility to satisfy such differing desires. Hence, theconflicting objectives that confront management raise the problem of setting priorities. In addi-tion, it is essential for management to set priorities for the most efficient use of a company’sscarce resources. The setting of priorities by an MNC is particularly important and difficultbecause it has highly diversified groups of constituents in many countries.
The commonly accepted objective of an MNC is to maximize stockholder wealth on a globalbasis, as reflected by stock price. The stock price reflects the market’s evaluation of the firm’sprospective earnings stream over time, the riskiness of this stream, the dividend policy, and qualityaspects of the firm’s future activities. Quality aspects of future activities include stability, diversi-fication, and growth of sales.
Stockholder wealth maximization is generally accepted as the primary goal of a company inthe USA and the UK. In some other countries such as Germany and Japan, however, the goalof a company is to maximize corporate wealth. “Corporate wealth” includes not only thecompany’s stockholder wealth but also its marketing, technical, and human resources. Under thismodel, a company should treat shareholders on a par with other corporate constituents. In other
8 INTRODUCTION
deals that lawmakers can approve or disapprove but cannot amend. The very sameforces that drove globalization during the 1990s signal no turning back on the roadto “a borderless world.”
Source: Jon E. Hilsenrath, “Globalization Persists in Precarious New Age,” The Wall Street Journal,Dec. 31, 2001, p. 1A.

words, management should strive to increase the corporate wealth for the benefit of all constituents.
There are a number of compelling reasons for management to focus on stockholder wealthmaximization. First, because stockholders are the owners of the company, management has afiduciary obligation to act in their best interests. Second, stockholders provide the risk capitalthat protects the welfare of other constituents. Third, stockholder wealth maximization – a highstock price – provides the best defense against a hostile takeover or a forced corporate restruc-turing. Fourth, if a company enhances shareholder value, it is easier for the company to attractadditional equity capital. For these and other reasons, many financial economists believe thatstockholder wealth maximization is the only way to maximize the economic welfare of all constituents (Shapiro 2003).
1.2.2 The functions of the international financial manager
In order to achieve the firm’s primary goal of maximizing stockholder wealth, the financialmanager performs three major functions: (1) financial planning and control (supportive tools);(2) the efficient allocation of funds among various assets (investment decisions); and (3) theacquisition of funds on favorable terms (financing decisions).
FINANCIAL PLANNING AND CONTROL Financial planning and control must be consideredsimultaneously. For purposes of control, the financial manager establishes standards, such asbudgets for comparing actual performance with planned performance. The preparation of thesebudgets is a planning function, but their administration is a controlling function.
The foreign-exchange market and international accounting play a key role when an MNCattempts to perform its planning and control function. For example, once a company crossesnational boundaries, its return on investment depends on not only its trade gains or losses fromnormal business operations but also on exchange gains or losses from currency fluctuations. For example, Thailand’s chemical giant Siam Cement PCL incurred a foreign-exchange loss of$517 million in the third quarter of 1997 due to currency turmoil in Asia during the second halfof 1997. The company had $4.2 billion in foreign loans, and none of it was hedged. The exchangeloss wiped out all the profits that the company earned between 1994 and 1996 (Glain 1997).
International reporting and controlling have to do with techniques for controlling the oper-ations of an MNC. Meaningful financial reports are the cornerstone of effective management.Accurate financial data are especially important in international business, where business opera-tions are typically supervised from a distance.
ALLOCATION OF FUNDS (INVESTMENT) When the financial manager plans for the allocationof funds, the most urgent task is to invest funds wisely within the firm. Every dollar invested hasalternative uses. Thus, funds should be allocated among assets in such a way that they will max-imize the wealth of the firm’s stockholders.
There are 200 countries in the world where large MNCs, such as General Electric and theRoyal Dutch/Shell Group, can invest their funds. Obviously, there are more investment oppor-tunities in the world than in a single country, but there are also more risks. International finan-cial managers should consider these two simultaneously when they attempt to maximize theirfirm’s value through international investment.
COMPANY GOALS AND FUNCTIONS OF FINANCIAL MANAGEMENT 9

ACQUISITION OF FUNDS (FINANCING) The third role of the financial manager is to acquirefunds on favorable terms. If projected cash outflow exceeds cash inflow, the financial managerwill find it necessary to obtain additional funds from outside the firm. Funds are available frommany sources at varying costs, with different maturities, and under various types of agreements.The critical role of the financial manager is to determine the combination of financing that mostclosely suits the planned needs of the firm. This requires obtaining the optimal balance betweenlow cost and the risk of not being able to pay bills as they become due.
There are still many poor countries in the world. Thus, even Citigroup, the world’s largestbank in 2003, cannot acquire its funds from 200 countries. Nevertheless, MNCs can still raisetheir funds in many countries thanks to recent financial globalization. This financial globaliza-tion is driven by advances in data processing and telecommunications, liberalization of restric-tions on cross-border capital flows, and deregulation of domestic capital markets. Internationalfinancial managers use a puzzling array of fund-acquisition strategies. Why? The financialmanager of a purely domestic company has just one way to acquire funds – instruments thathave varying costs, different maturities, and different types of agreements. The financial managerof an MNC, on the other hand, has three different ways to acquire funds: by picking instru-ments, picking countries, and picking currencies.
THE CHANGING ROLE OF THE FINANCIAL MANAGER The role of the financial manager hasexpanded in recent years. Instead of merely focusing on the efficient allocation of funds amongvarious assets and the acquisition of funds on favorable terms, financial managers must nowconcern themselves with corporate strategy. The consolidation of the corporate strategy and thefinance function – a fundamental change in financial management – is the direct result of tworecent trends: the globalization of competition and the integration of world financial marketsfacilitated by improved ability to collect and analyze information. For example, financial man-agers increasingly participate in corporate strategic matters – from basic issues such as the natureof their company’s business to complex issues such as mergers and acquisitions.
The chief financial officer as strategic planner is emerging. In an era of heightened global com-petition and hard-to-make-stick price increases, the financial fine points of any new strategy aremore crucial than ever before. Many finance chiefs can provide that data, as well as shrewd judg-ment about products, marketing, and other areas. The key place where everything comes togetheris finance. In a recent survey by headhunters Korn/Ferry International, Fortune 100 chief financial officers almost unanimously described themselves as “more of a partner with the ChiefExecutive Officer (CEO)” than they used to be.
1.3 Multinational Companies and their Performance
1.3.1 What is a multinational corporation?
In 1963, the term “multinational corporation” became a household term after a cover story aboutthe institution in Business Week. Ever since, international business guided by MNCs has pros-pered as a result of the need for poor countries to develop, the end of the Cold War, privatiza-
10 INTRODUCTION

tion of state-owned businesses and banks, and the growing economic power of the global triad– Asia, the USA, and Europe (Baker 1997). There are approximately 60,000 multinational com-panies in the world with 500,000 foreign affiliates. These multinational companies and theirforeign affiliates account for roughly 25 percent of global output, one third of it in host coun-tries (The Economic Report of the President to Congress 2004). In the twenty-first century, theseMNCs are expected to play an even greater role in international business, because they have theknow-how, money, and experience.
The World Book Encyclopedia defines a multinational corporation (MNC) as “a business orga-nization that produces a product, sells a product, and provides a service in two or more coun-tries.” The US Department of Commerce defines an American MNC as “the US parent and allof its foreign affiliates.” A US parent is a person, resident in the USA, who owns or controls aminimum of 10 percent voting equity in a foreign firm. “Person” is broadly defined to includeany individual, branch, partnership, associated group, association, estate, trust, corporation, otherorganization, or any government entity. A foreign affiliate is a foreign business enterprise inwhich a US person owns or controls a minimum of 10 percent voting equity. A majority-ownedforeign affiliate is a foreign affiliate in which the combined ownership of all US parents exceeds50 percent.
Donald Lessard (1991), a professor of international finance at MIT, classifies all MNCs intothree groups: (1) international opportunists – companies that focus on their domestic marketsbut engage in some international transactions; (2) multi-domestic competitors – companies com-mitted to a number of national markets with substantial value added in each country, but withlittle cross-border integration of activities; and (3) global competitors – companies that focus ona series of national and supranational markets, with substantial cross-border integration of activities.
1.3.2 From multinational company to global company
What Lessard called “a global competitor” has come to be known as a global company, a genericterm used to describe an organization that attempts to standardize and integrate operations world-wide in all functional areas. Here are three possible definitions of a global company – an orga-nization that attempts to:
1 Have a worldwide presence in its market.2 Integrate its operations worldwide.3 Standardize operations in one or more of the company’s functional areas.
For example, if a company designs a product with a global market segment in mind and/ordepends on many countries for the production of a product, it qualifies as a global company. Inthis type of company, the development of capabilities and the decisions to diffuse them globallyare essentially made in the company’s home office. Some people believe that a global companymust possess all these three characteristics. Critics of this definition say that there is no globalcompany by that definition (see Global Finance in Action 1.2).
MULTINATIONAL COMPANIES AND THEIR PERFORMANCE 11

12 INTRODUCTION
Global Finance in Action 1.2Is Globalization Myth or Reality?
The answer to this question depends on whether you look at globalization in tangible terms (i.e., production and trade volumes) or in intangible terms (i.e., information and knowledge). Professor Alan R. Rugman, at Indiana University inBloomington, Indiana, argues that multinational business enterprises (MNEs) – whichare the agents of international business – largely operate within their home-basedmarkets in each part of the “triad” of North America, the European Union, andJapan/Asia. Empirical evidence suggests that even the 20 most “international” MNEs(those with the highest ratio of foreign-to-total sales) are mainly home-triad basedin their activities.
Globalization has been defined in business schools as producing and distributinggoods and services of a homogeneous type and quality on a worldwide basis – simplyput, providing the same output to countries everywhere. To back up their claims,some analysts often point to the fact that foreign sales account for more than 50percent of the annual revenues of companies such as Dow Chemical, ExxonMobile,and IBM. Accurate as they may be, those figures do not explain that most of salesof “global” companies are made on a “triad” regional basis. For example, more than85 percent of all automobiles produced in North America are built in North American factories; over 90 percent of the cars produced in the EU are sold there;and more than 93 percent of all cars registered in Japan are manufactured domesti-cally. The same holds true for specialty chemicals, steel, energy, transportation, andheavy electrical equipment. Furthermore, MNEs cannot develop homogeneous prod-ucts for world markets or dominate local markets no matter how efficient productiontechniques are. MNEs have to adapt their products for the local market. For example,there is no worldwide, global car. Rather, there are regionally based American, European, and Japanese factories that are supported by local regional suppliers.
“Rugman’s perspective is based on homogeneity of markets and comparativeadvantage concepts whereby commodity and unskilled labor markets are majordrivers of world trade and commerce,” Professor Paul Simmons, at Florida State University in Tallahassee, Florida, points out. “Unfortunately, this perspective is moresuited to trade concepts of the 18th and 19th centuries where economists argued thevalue of absolute and comparative advantage.” Market homogeneity is not the majordeterminant of globalization; it is market interdependency. Supply and demand imbal-ances create linkages between markets. A standardized product or service in allmarkets is only one of several options available to satisfy those linkages. A definitionof globalization that focuses on the ability of firms to leverage certain resources andcompete in worldwide markets suggests that globalization does exist in interdepen-dent markets.
Global branding is an illustrative example. Whether franchising or product brand-ing, firms seek interconnectivity throughout their competitive domains to leveragetheir intangible assets. Everyone is familiar with McDonald’s. Strict control of key

1.3.3 The performance of multinational companies
Evidence indicates that US MNCs earn more money as they boost their presence in foreignmarkets. In 1974, for example, Business International reported that 90 percent of 140 Fortune500 companies surveyed achieved higher profitability on foreign assets. This trend continued intothe 1990s, but the percentage of those companies with higher profitability on foreign assets hasdeclined in recent years (Ball et al. 2004). The US Department of Commerce found that thereturn on assets for nonfinancial US MNCs has exceeded the return on assets for all US non-financial companies from 1989 to 2003, but that the excess of the return on assets for US MNCsover the return on assets for US domestic companies has declined since 1991. Apparently, thecost and competition drivers to globalization have reduced the differences between overseas andhome-country profits, but all analysts predict that US MNCs will earn more money than USdomestic companies for years to come.
Foreign-based companies with a higher degree of international business have also experiencedsuperior performance in recent years. Foreign-owned companies in the world’s most highly devel-oped countries are generally more productive and pay their workers more than comparable locallyowned businesses, according to the Organization for Economic Cooperation and Development(OECD). The Paris-based organization also says that the proportion of the manufacturing sectorunder foreign ownership in European Union countries rose substantially during the 1990s, a signof increasing economic integration. The finding underlines the increasing importance in theworld economy of large companies with bases scattered across the globe. Gross output peremployee, a measure of productivity, in most OECD countries, tends to be greater in multina-tional companies than in locally owned companies (Marsh 2002). Why do multinational com-panies perform better than domestic companies? In the following section, we attempt to answerthis important question.
MULTINATIONAL COMPANIES AND THEIR PERFORMANCE 13
operational aspects in food preparation and delivery are consistent globally despitevaried additions to menu offerings that accommodate local tastes and customs.McDonald’s expects customer experiences in any of its locations to generate certainexpectations between locations because of its brand identity. Thus, the interdepen-dence of knowledge and information among the various locations are circuital toMcDonald’s competitive success. The most relevant definition of globalization, there-fore, is the ability to transfer information and knowledge globally. Products and ser-vices may be produced, delivered, and traded on a regional basis, but global diffusionof knowledge makes this possible. Globalization exists because bits and bytes – thatis, process knowledge and other intangible assets – can be transferred globally atminimal costs. The result is greater integrated trade flows.
Sources: Alan M. Rugman, “Multinational enterprises are regional, not global,” Multinational Business Review, Spring 2003, pp. 3–12; Alan M. Rugman, “The myth of global strategy,” AIBNewsletter, Second Quarter 2001, pp. 11–14; and Paul Simmonds, “Globalization: another viewpoint,” AIB Newsletter, Second Quarter 2001, pp. 15–16.

1.4 Principles of Global Finance
The primary objective of this book is to help the reader understand basic principles of globalfinance. Before we advance too far into the material, perhaps it would be helpful to take a brieflook at some of these principles so that you may see where we are heading.
As discussed earlier, the financial manager has three major functions: financial planning andcontrol, the acquisition of funds, and the allocation of funds. However, each of these three func-tions shares most principles of global finance and their relationships. Seven important principlesof global finance are introduced in this section. In addition, these principles should help youunderstand why MNCs perform better than domestic companies.
1.4.1 The risk–return trade-off
The maximization of stockholder wealth depends on the trade-off between risk and profitabil-ity. Generally, the higher the risk of a project, the higher is the expected return from the project.For example, if you are offered a chance to invest in a project that offers an extremely high rateof return, you should immediately suspect that the project is very risky.
The risk–return trade-off does not apply to 100 percent of all cases, but in a free enterprisesystem, it probably comes close. Thus, the financial manager must attempt to determine theoptimal balance between risk and profitability that will maximize the wealth of the MNC’s stock-holders. Figure 1.1 shows how the financial manager assesses the various risk–return trade-offsavailable and incorporates them into the wealth maximization goal. Given the risk–return trade-offs, various financial decisions are made to maximize stockholder wealth. Practically all finan-cial decisions involve such trade-offs. Such decisions include foreign-exchange risk management,global reporting and controlling, global financing decision, and global investment decision.
An investor’s risk–return trade-off function is based on the standard economic concepts ofutility theory and opportunity sets. An opportunity set shows different combinations of businessopportunities, which make the investor equally happy in terms of risk–return trade-offs.
Companies can benefit from an expanded opportunity set as they venture into global markets.It seems reasonable to assume that international business is riskier than domestic business. However,this is not necessarily true, because returns on foreign investments are not highly positively corre-lated with returns on domestic investments. In other words, MNCs may be less risky than compa-nies that operate strictly within the boundaries of any one country. Consequently, to minimize risk,companies should diversify not only across domestic projects but also across countries.
Possible revenue opportunities from international business are also larger than possible revenueopportunities from purely domestic business. MNCs can locate production in any country ofthe world to maximize their profits and raise funds in any capital market where the cost of capitalis the lowest. MNCs may see another advantage from currency gains. These two factors – lowerrisks and larger profitability for international business – suggest the possibility that an MNC canachieve a better risk–return trade-off than a domestic company.
Figure 1.2 shows that international business pushes out the opportunity set, thus allowingMNCs to reduce risk, increase return, or attain both. As shown in figure 1.2, we can think ofthree possible cases in which international operations are better than domestic operations. Rela-tive to US project A, international project B has the same return but less risk; international projectC has the same risk but higher return; and international project D has higher return but less risk.
14 INTRODUCTION

1.4.2 Market imperfections
Perfect competition exists when sellers of goods and services have complete freedom of entryinto and exit out of any national market. Under such a condition, goods and services would bemobile and freely transferable. The unrestricted mobility of goods and services creates equalityin costs and returns across countries. This cost–return uniformity everywhere in the world wouldremove the incentive for foreign trade and investment.
Factors of production, such as land, capital, and technology, are unequally distributed amongnations. Even with such comparative advantages, however, the volume of international businesswould be limited if all factors of production could be easily transferred among countries. Thereal world has imperfect market conditions, where the resources available for the production ofgoods are somewhat immobile.
The trend toward a global economy through the World Trade Organization and the European Union will undoubtedly remove market imperfections that restrict the international
PRINCIPLES OF GLOBAL FINANCE 15
Initiate planYES
Plan = goalNO
Reexamine assumptions
Goal (Part I)Maximization of
stockholder wealth
Supportive tools (Parts II and V)Planning and control
Allocation and acquisitionof funds
(Remainder of text)
Globalfinancingstrategy(Part III)
Globalinvestment
strategy(Part IV)
Rate of returnImpact of risk
Trade-offs:financial decisions
Value of firm
Financial package;plan and analysis
Figure 1.1 An integrated decision-making model in global finance

flows of goods and services. However, a variety of barriers still impede free movements of goods,services, and financial assets across national boundaries. These barriers include government con-trols, excessive transportation and transaction costs, lack of information, and discriminatory tax-ation. Consequently, companies can still benefit from imperfections in national markets forfactors of production, products, and financial assets. In other words, imperfect national marketscreate a variety of incentives for companies to seek out international business. For example, Japan-ese automakers, such as Toyota, have established automobile transplants in the USA to avoid UStrade restrictions.
1.4.3 The portfolio effect (diversification)
The portfolio effect states that as more assets are added to a portfolio, the risk of the total port-folio decreases. There are some qualifying conditions that we will add to this principle later, butdiversification is a very valuable quality.
This principle explains much of the rationale for large MNCs to diversify their operationsnot only across industries but also across countries and currencies. Some MNCs, such as Nestléof Switzerland, have operations in countries as varied as the USA, Japan, Hong Kong, France,Russia, Mexico, Brazil, Vietnam, Nigeria, and North Korea. Because it is impossible to predictwhich countries will outperform other countries in the future, these companies are “hedging theirbets.”
Domestic investment projects tend to correlate less with foreign investment projects than withother domestic projects. As a result, international diversification is more effective than domestic
16 INTRODUCTION
Return
Opportunity set: international business
Opportunity set: domestic business
Relative to project A:1. Project B has the same return but less risk.2. Project C has the same risk but higher return.3. Project D has higher return and less risk.
Risk0
AB
DC
Figure 1.2 Expanded opportunity set for international business
diversification. The economic cycles of different countries, such as the USA and Japan, do nottend to be totally synchronized. On the other hand, most domestic projects tend to be highlycorrelated with each other because they depend on the same state of economy. The energy oper-ations of ExxonMobil in Saudi Arabia, for example, may be hurt if world oil prices unexpect-edly take a nosedive. However, this might be offset by its operations in energy-consumingcountries such as France. Overall, the MNC earns its desired rate of return even if the prof-itability of its investment in individual countries may not be that predictable.
1.4.4 Comparative advantage
You have perhaps heard on the news that the Japanese and the Americans are competitors in theglobal economy. In some ways, this is true, because American and Japanese companies producemany of the same goods. Ford and Toyota compete for the same customers in the market forautomobiles. However, trade between the USA and Japan is not like a sports contest, where oneteam wins and the other team loses. In fact, the opposite is true. Trade between two countriescan make each country better off.
The classical argument for free trade is based on the principle of comparative advantage.Assume that US workers are better at producing computer software than workers in China andthat Chinese workers are better at producing shoes than workers in the USA. Comparative advan-tage states that trade between the two countries – the USA exporting software and China export-ing shoes – can boost living standards in both. This is because the USA has comparative advantagein producing software while China has comparative advantage in producing shoes. Trade allowscountries to specialize in what they do best and to enjoy a greater variety of goods and services.At the same time, companies earn profits from trade because most trade is carried out by indi-vidual companies.
1.4.5 The internationalization advantage
Why do some companies prefer to export while others build overseas manufacturing facilities?When a company expands its operations beyond national borders for the first time, it tends toexploit a foreign market through exports. An export-oriented strategy serves a company well forsome time. However, to become part of a global market, a company should have a world pres-ence. Because the world presence cannot be sustained by exports alone, the company shouldeventually invest.
The advantages of internationalization influence companies to invest directly in foreign coun-tries. These advantages depend on three factors: location, ownership, and internationalization.ExxonMobil has ownership advantages, such as technology, marketing expertise, capital, andbrand names. Venezuela has location advantages, such as crude oil, abundant labor, and low taxes.Thus, ExxonMobil has built oil refineries in Venezuela. These factories magnify both wages ofworkers in Venezuela and profits of ExxonMobil from the use of its technology and capital. Thesemagnified portions of location advantages and ownership advantages are called international-ization advantages, and they allow MNCs to enjoy superior earnings performance over domes-tic companies.
PRINCIPLES OF GLOBAL FINANCE 17

1.4.6 Economies of scale
There are economies of scale in the use of many assets. Economies of scale take place due to asynergistic effect, which is said to exist when the whole is worth more than the mere sum of itsparts. When companies produce or sell their primary product in new markets, they may increasetheir earnings and shareholder wealth due to economies of scale. Economies of scale explain whyso many Asian companies invested in North America in preparation for the North American FreeTrade Agreement of 1994. As the European Union removed trade barriers in 1993 and adoptedthe euro as its common currency in 1999, they allowed US MNCs to achieve greater economiesof scale through their investment in Western Europe.
Companies can gain from greater economies of scale when their real-capital and monetaryassets are deployed on a global basis. The expansion of a company’s operations beyond nationalborders allows it to acquire necessary management skills and spread existing management skillsover a larger operation. There are also opportunities to eliminate duplicate facilities and consol-idate the functions of production and marketing. In addition, MNCs can raise funds at the lowercost of capital and reduce the pool of money without loss in the level of production. These typesof operating and financial economies along with better management can cause an MNC toincrease its profit margin and reduce its risks as well.
1.4.7 Valuation
The valuation principle states that the value of an asset is equal to the present value of its expectedearnings. Because the values of all assets stem from streams of expected earnings, all such assetsare valued in essentially the same way. First, the earning is estimated. Second, the required rateof return for each earning is established. Third, each earning is discounted by its required rateof return, and these present values are then summed to find the value of the asset. Alternatively,the value of an entire firm is determined by dividing the firm’s earnings after taxes or net cashflows by its required rate of return.
The value of an MNC is usually higher than the value of a domestic company for two reasons.First, studies show that MNCs earn more profits than domestic companies. Second, earnings oflarger companies are capitalized at lower rates. The securities of MNCs have better marketabil-ity than those of domestic companies. MNCs are also better known among investors. Thesefactors lead to lower required rate of returns and higher price–earnings ratios. When MNCsattempt to maximize their overall company value, they also face various constraints. Those con-straints that hamper an MNC’s efforts to maximize its stockholder wealth include large agencycosts and environmental differences.
1.5 Agency Theory and Corporate Governance
1.5.1 Agency theory: management versus stockholders
Agency theory deals with the conflict of interest between managers and shareholders. We maythink of managers as agents of the owners. Stockholders delegate decision-making authority tomanagers on the condition that the agents will act in the stockholders’ best interest. However, it
18 INTRODUCTION

has often been argued that the objectives of managers may differ from those of the firm’s stock-holders. Because the stockholders of most MNCs today are well diversified, the control of thesecompanies is separated from ownership. This situation allows managers to act in their own bestinterest rather than in the best interest of the stockholders. Thus, some managers may be con-cerned with their own welfare, such as their own income, power, self-esteem, and prestige. Thewelfare of managers, therefore, could be increased by management decisions that tend to lowerstockholder wealth.
To ensure that managers act in the best interest of the stockholders, the managers must bemonitored and rewarded with appropriate incentives. Incentives could include stock options,bonuses, and perquisites. Monitoring can be carried out by reviewing management perquisites,auditing financial statements, and limiting management decisions. Agency costs include incen-tives and monitoring costs. It is reasonable to assume that managers will undertake actions thatare relatively consistent with stockholder wealth maximization. This is because over the long run,their own goals, including survival, will largely depend on the value of the firm.
In this text, we explain the issues and concepts of international finance as though managersact on behalf of the firm’s stockholders. Nevertheless, the size of some MNCs can make it diffi-cult to determine whether all managers make decisions on the basis of this single corporate objec-tive – stockholder wealth maximization on a global basis. For example, financial managers ofMNCs with many subsidiaries may be tempted to make decisions that would maximize the valueof their respective subsidiaries at the expense of their parent company. Consequently, the agencycosts of assuring that managers try to maximize stockholder wealth can be larger for MNCs thanfor purely domestic companies.
1.5.2 Corporate governance
Few issues in the literature and in practice on corporate finance have received as much attentionin recent years as corporate governance. In the USA and in other countries, there is new inter-est in how firms’ decision-making structures are organized, the priorities of these structures, andthe structures’ effect on shareholders. Corporate governance refers to the way in which major stakeholders exert control over operations of a company. The rights of the company’s stake-holders in corporate governance are determined by each nation’s laws, legal institutions and con-ventions, and regulations. However, corporate governance is often narrowly defined as theprudent exercise of ownership rights toward the goal of increased shareholder value (Gillan &Starks 1998). In the USA, corporate governance has evolved from a system with a few yet influ-ential individual investors around the turn of the last century to the present environment inwhich large institutional investors flex their shareholder muscle. Institutional investors includepension funds, mutual funds, university and other nonprofit endowments, and insurance companies.
Today, large institutional investors actively encourage effective corporate governance practicesto maximize their investment returns. Major corporate governance issues include board inde-pendence, executive compensation, and anti-takeover devices. Unlike other stakeholders that havedealings with the corporation – customers, suppliers, lenders, and labor – common sharehold-ers do not have contractual protection of their interests. Thus, shareholder activism is an impor-tant part of corporate governance to ensure that managers take actions to mitigate agencyproblems (conflicts) and thus increase shareholder value.
AGENCY THEORY AND CORPORATE GOVERNANCE 19

SHAREHOLDER ACTIVISM Any activity by an investor that tries to change the status quothrough voice, without the control of the company, is known as shareholder activism. The voicereflected in the most common form of shareholder activism covers a broad spectrum of activi-ties, such as a shareholder proposal for proxy fight, direct negotiation with management, andpublic targeting of a corporation.
Proxy represents the assignment of the voting right to management or a group of outsiders.If earnings are poor and stockholders are dissatisfied, an outside group may solicit the proxies inan effort to overthrow management and take control of the business. This is known as a proxyfight. When performance analysis reveals problems with a company’s governance practices, share-holders will directly negotiate with management for needed changes in the company’s practicesand policies. Public targeting is the use of media to send information to other investors aboutthe problems and needed changes at a company. The issues addressed by these voice activitiesspan a wide range of topics, but most often pertain to issues of social policy or corporate gover-nance reform.
CHANGES IN CORPORATE GOVERNANCE Since 1980, a number of changes have made US man-agers more responsive to the interests of shareholders. These changes include a more activetakeover market, an increased usage of executive incentive plans that increase the link betweenmanagement performance and corporate performance, and more active institutional sharehold-ers, who have demonstrated a growing tendency to vote against management (Grinblatt &Titman 1998). In addition, as one corporate scandal after another broke in 2002, PresidentGeorge W. Bush signed into law the Sarbanes–Oxley Act on July 30, 2002, which would likelyreduce agency problems (Nofsinger & Kim 2003).
First, the threat of a hostile takeover for inefficiently managed companies tends to encouragemanagers to make decisions that enhance stockholder wealth. Other companies are more likelyto acquire undervalued companies at a low price and might layoff existing managers.
Second, these days many companies partially compensate their executives with stock optionsthat encourage managers to make decisions that maximize their company’s stock price. Stockoptions and other types of incentive plans such as bonuses are designed to increase the linkbetween management performance and corporate performance.
Third, institutions have become more active as shareholders and have compelled managers toact in the stockholders’ best interest. Increased shareholder activism by institutions has occurredat the same time as the rapid increase in institutional investor holdings during the past twodecades. These holdings have grown from approximately one-quarter of US equity markets in1980 to over one-half today. Two rule changes in the early 1990s by the US Security andExchange Commission have also sparked the active role of institutional investors. The firstchange, which required complete disclosure of executive compensation packages, put managersunder greater pressure to perform up to their level of compensation. The second change madeit easier for shareholders to get information about other shareholders and reduced the cost ofstaging a proxy fight.
Fourth, a series of recent accounting scandals at companies such as Enron and WorldComcompelled the government to introduce a host of new laws and regulations so that managers maynot pursue their own private interests at the expense of shareholders. For example, the PublicCompany Accounting Reform and Investor Protection Act of 2002, otherwise known as the Sarbanes–Oxley Act, sets up a new overseeing body to regulate auditors, creates new laws toincrease corporate responsibility, and increases punishments for corporate white-collar criminals.The Act establishes a nonprofit organization called the Public Company Accounting Oversight
20 INTRODUCTION

Board to oversee the audit of public companies and to protect the accuracy of audit reports.These and other reforms introduced after recent corporate scandals are expected to strengthenUS corporate governance practices.
NATIONAL DIFFERENCES IN CORPORATE GOVERNANCE Although national legal systems inindustrialized countries share many common elements, laws for corporate governance havenotable differences. The UK and the USA are often viewed as prototypes of a market-orientedfinancial system (the AS model), whereas Continental Europe (France and Germany) and Japanare generally regarded as typical representatives of a bank- or relationship-based system (the CEJmodel).
In AS countries, institutional investors make up an important part of the financial system. InCEJ countries, banks represent the most important part of the financial system. Equity financeis important in AS countries, and institutional shareholders exert a great deal of corporate control.The accepted objective of the AS model is to maximize shareholder value. In 1998, an interna-tional advisory panel to the Organization for Economic Cooperation and Development (OECD)endorsed shareholder value maximization as the primary goal of companies. On May 27, 1999,the OECD officially adopted “OECD Principles of Corporate Governance” recommended byits advisory panel. Consequently, corporate policies throughout the world are now undertakenwith more awareness about their impact on the stock price. Other countries have just begun toadopt American-style corporate governance practices in an effort to force local companies to makedecisions that would satisfy their respective stockholders.
OECD Principles of Corporate Governance are intended to achieve two goals. The first goalis to assist member and nonmember governments in their effort to improve the legal, institu-tional, and regulatory framework for corporate governance in their countries. The second goalis to provide guidance and suggestions for stock exchanges, investors, corporations, and otherparties that have a role in the process of developing good corporate governance. The documentfor the OECD Principles of Corporate Governance covers five areas: (1) the rights of share-holders, (2) the equitable treatment of shareholders, (3) the role of stakeholders, (4) disclosureand transparency, and (5) the responsibilities of the board.
Although securities markets are more important in market-based systems, banks are promi-nent in both systems. A crucial distinction concerns the roles that banks play. In AS countries,banks are one of many sources of external finance for companies. They compete with bond andcommercial paper markets, along with markets for equity, to provide funds to companies. Andbank loans are typically provided through arm’s-length market transactions. In CEJ countries,particularly in Japan, banks are the main source of funds for many companies and thus take anactive role in monitoring the decisions of the borrowing firm’s management. The influence of Japanese banks is further enhanced by their stock ownership. In contrast with the USA, Japanese banks can hold common stock up to 5 percent of a company’s shares. In addition, thelarge cross-holdings of Japanese firms make corporate decision-making heavily influenced by closepersonal relationships between top executives, who sit on each other’s boards of directors. Individual shareholders have little voice and this results in relatively low return on capital.
1.6 Environmental Differences
From a financial manager’s point of view, what are the differences between MNCs and domes-tic companies? An efficient allocation of funds among assets (investment) and an acquisition of
ENVIRONMENTAL DIFFERENCES 21

funds on favorable terms (financing) are conceptually the same for both types of companies.However, these two types of companies differ because they do business in different environments.International financial managers must understand these differences if they are to succeed in theinternational environment.
For successful international operations, a manager must have information about environ-mental factors that affect business operations in foreign countries. Domestic methods should beadjusted to accommodate customs, attitudes, economic factors, and political factors that prevailin the country of operation.
How do management practices in one country differ from those in other countries? In prin-ciple, concepts in accounting, economics, finance, management, and marketing are as relevantto business management in one country as they are in another country. However, when a busi-ness crosses national boundaries, the environment differs for these functions. In other words,multinational financial managers are confronted with various environmental constraints whenthey attempt to maximize their firm’s value on a global basis. The three types of environmentalconstraints described in this section are (1) various risks, (2) conflicts of interest, and (3) multi-ple environments. These constraints are not mutually exclusive, nor do they exhaust the differ-ences that we might find in international business.
1.6.1 Types of risk
Three major risks in international business are political, financial, and regulatory. Political risksrange from moderate actions, such as exchange controls, to extreme actions, such as confiscationof assets. Financial risks involve varying exchange rates, divergent tax laws, different interest andinflation rates, and balance-of-payments considerations. Regulatory risks are differences in legalsystems, overlapping jurisdictions, and restrictive business practices against foreign companies.
If a company plans to invest heavily in foreign countries, it must consider all of these risks.Business operations that cross national boundaries add dimensions of risk that are rarely con-fronted in domestic business operations. Ideally, a company should analyze these risks to under-stand their underlying causal forces, so that the company may develop specific measures to handlethem.
1.6.2 Conflicts of interest
Conflicts of interest may occur for a variety of reasons. Owners, employees, suppliers, and cus-tomers may have different national identities. The interests of sovereign national states may bedivergent. The goals of MNCs and host countries may conflict. Some conflicts of interest mayexist within an MNC. Furthermore, the MNC and the external environment may clash.
Companies tend to have home-country nationals in key positions for foreign operations, butthey tend to hire local persons for nonmanagerial positions. Thus, disparities in salaries and wagesare inevitable. Most developing countries require MNCs to hire and train local people for man-agement positions in exchange for local business operations. External conflicts relate to profit-motivated decisions that involve the transfer of funds, production, exports, imports, andemployment from one country to another. For instance, an MNC’s wish for foreign-exchangeremittances frequently conflicts with a local government’s restrictions on these remittances.
22 INTRODUCTION

1.6.3 Multiple environments
In addition to risk and conflict, MNCs can have operational problems because they operate inseveral international environments. These environmental diversities require different concepts,analytic methods, and information. Therefore, MNCs should identify, evaluate, and predict allenvironmental variables. Some important environmental variables are the form of business orga-nization, different institutional settings, and cultural differences.
1.7 The Structure of this Book
This book has five major parts. Part I (chapters 1–4) provides an overview of the global finan-cial environment, such as motives for foreign trade and investment, the balance of payments,and the international monetary system. In other words, this part develops the primary goal ofan MNC and the basics of international finance.
Part II (chapters 5–10) deals with the forces that affect the relative prices of currencies in international markets. This part is devoted to financial derivatives – currency forwards, futures, options, and swaps – with an emphasis on their relationships to foreign-exchange riskmanagement.
Part III (chapters 11–14) describes sources of global corporate finance. One major facet ofcorporate finance is to raise funds on favorable terms. In the case of global corporate finance,financing involves the sources of funds for international trade and foreign investment.
Part IV (chapters 15–20) discusses the management of assets. The second major facet of cor-porate finance is the efficient allocation of funds among assets. A decision to invest abroad musttake into account various environmental differences, such as disparities in exchange rates, dif-ferences in taxes, and differences in risk factors.
THE STRUCTURE OF THIS BOOK 23
SUMMARY
The international financial manager has the same objective as every other manager in the multina-tional firm: to maximize the wealth of the stockholders. If the firm’s stock price goes up as a resultof the manager’s decisions, the decisions were good ones. The stockholders would recognize that thevalue of the company has been enhanced by the manager’s efforts. In order to achieve the firm’sprimary goal of maximizing stockholder wealth, the financial manager performs three major func-tions: financial planning and control, the efficient allocation of funds, and the acquisition of fundson favorable terms.
MNCs have superior performance over domestic companies because they enjoy a betterrisk–return trade-off, market imperfections, the portfolio effect, comparative advantage, interna-tionalization advantage, economies of scale, and a higher valuation. However, when MNCs attemptto maximize their overall company value, they face various constraints, such as large agency costs,a variety of risks, conflicts of interest, and multiple environments.

24 INTRODUCTION
Questions
1 What is the primary goal of multinational companies? Why is stockholder wealth maxi-mization more important than profit maximization?
2 Discuss the agency problem of multinational companies.3 In order to achieve a firm’s primary goal of maximizing stockholder wealth, the financial
manager performs a number of important functions. What are the three major functionsof financial management?
4 Why do multinational companies perform better than domestic companies?5 Explain environmental constraints that conflict with the primary goal of multinational
companies.6 The concept of a perfect market depends on a number of conditions. What are these con-
ditions? Would inflation rates, interest rates, and wages among countries be more similaror less similar under conditions of a perfect market than under conditions of an imperfectmarket?
7 Global companies can become so well known throughout the world that they lose theirassociation with any single country. Can you match the following companies with thelocation of their headquarters?
1 Xerox A Atlanta, Georgia, USA2 Royal Philips Electronics B Ludwigshafen, Germany3 ABB C Montreal, Canada4 BASF D Ludvika, Sweden5 Alcan Aluminum E Stamford, Connecticut, USA6 Nestlé F Eindhoven, the Netherlands7 Coca Cola G Vevey, Switzerland
8 What are the two major sets of external forces that are causing fundamental change infinancial management?
9 Explain why management should focus on stockholder wealth maximization.10 What is corporate governance? What are the changes that have made US managers more
responsive to the interests of shareholders since 1980?11 What is meant by Japanese-style corporate governance structures?
REFERENCES
Baker, J. C., International Finance, Upper SaddleRiver, NJ: Prentice Hall, 1998.
Ball, D. A., W. H. McCulloch, J. M. Geringer, P. L.Frantz, and M. S. Minor, International Business,New York: McGraw-Hill/Irwin, 2004, ch. 1.
Economic Report of the President to Congress, The,Washington, DC: US Government PrintingOffice, 2004.
Eun, C. S. and G. S. Resnick, International Finan-cial Management, Boston: McGraw-Hill/Irwin,2004.
Glain, S., “Asian Firms, Amid Currency Turmoil,Turn to Hedging Experts to Cut Risk,” The WallStreet Journal, Nov. 19, 1997, p. A18.
Gillan, S. L. and L. T. Starks, “A Survey of Shareholder Activism: Motivation and Empirical

CASE PROBLEM 1 25
Evidence,” Contemporary Finance Digest, Autumn1998, pp. 10–34.
Grinblatt, M. and S. Titman, Financial Markets andCorporate Strategy, New York: Irwin/McGraw-Hill, 1998, ch. 17.
Groshen, E. L., “Special Issue: Corporate Gover-nance: What Do We Know and What Is Differ-ent About Banks,” Economic Policy Review,Federal Reserve Bank of New York, Apr. 2003.
Harry, T. R., “Globalization . . . Let’s Get ItStraight,” O’Fallon, MO, 2001.
Lessard, D. R., “Global Competition and CorporateFinance in the 1990s,” Journal of Applied Corpo-rate Finance, Winter 1991, pp. 59–72.
Madura, J., International Financial Management, StPaul, MN: West, 2003.
Mankiw, N. G., Principles of Economics, New York:The Dryden Press, 2003.
Marsh, P., “Measuring Globalization: The Role ofMultinationals in OECD Countries,” The Finan-cial Times, Mar. 20, 2002, p. 6.
Moffett, M. H., A. I. Stonehill, and D. K. Eiteman,Foundations of Multinational Finance, New York:Addison-Wesley, 2003.
Nofsinger, J. and K. Kim, Infectious Greed: RestoringConfidence in America’s Companies, Upper SaddleRiver, NJ: Prentice Hall, 2003.
OECD (The Organization for Economic Cooperation and Development), ed., The Futureof the Global Economy, Paris: OECD, 1999, p. 119.
Rugman, A. M., “Multinational Enterprises AreRegional, Not Global,” Multinational BusinessReview, Spring 2003, pp. 3–12.
Santomero, A. M., “Corporate Governance andResponsibility,” Business Review, Federal ReserveBank of Philadelphia, Second Quarter 2003, pp.1–5.
Scism, L., “Benefiting From Operating Expe-rience, More Finance Chiefs Become Strategists,” The Wall Street Journal, June 8, 1993,p. B1.
Shapiro, A. C., Multinational Financial Manage-ment, New York: John Wiley, 2003.
Simison, R. L., “Firms Worldwide Should Adopt Ideas of US Management, Panel TellsOECD,” The Wall Street Journal, Apr. 2, 1998, p. A4.
Case Problem 1: What is a National Company?
Evidence indicates that it has become increasingly difficult to define a national company inrecent years. “There is no longer any such thing as a purely national economy. The rest of theworld is just too big to ignore, either as a market or as a competitor. If business schools donothing other than to train their students to think internationally, they would have accom-plished an important task” (John Young, CEO of Hewlett-Packard). “There is no German,French, or American capital market any more. It is a global capital market, and we all have toplay by the same rules” (Ulrich Hartmann, CEO of Veba AG). On the one hand, many non-US companies such as Toyota Motor and BP Amoco are also listed on the New York StockExchange. On the other hand, US companies, such as IBM and GM, are listed on most European stock exchanges. A management team from Ford took over Mazda Motor of Japanin 1996. In 1999, capital raised in several countries by Deutsche Bank financed its acquisitionof Bankers Trust New York, which had taken over management of overseas clients from NipponCredit Bank of Japan in 1996.
Companies have pursued international business for many years – in order to expand sales,acquire resources, diversify sources of sales and supplies, and minimize competitive risk.However, they have recently entered an era of unprecedented worldwide production, distrib-

26 INTRODUCTION
ution, and financing due to several factors: expansion of technology, liberalization of cross-border movements, increased global competition, and the development of supporting institu-tional arrangements.
In today’s global economy, it is not easy to define “a national company,” especially a UScompany. In his recent interview with The Wall Street Journal, Edmund Fitzgerald, Chairmanof Northern Telecom, said: “My company has its headquarters in Canada, but most of its salesare in the United States. It employs about as many Americans as Canadians. A big chunk ofits shares are owned by Americans. Whose company is it anyway?”
In 1993, US government economic officials attempted to prepare papers on the issue anddebated it at the National Economic Council. The outcome of these discussions would deeplyinfluence trade and technology policies, ranging from who builds next-generation televisionsets to US negotiations with Japan. The US government needs a set of guidelines to follow,so that government economic officials can handle such questions as “What is an Americancompany?” and “Whose interests do they advocate?”
When Labor Secretary Robert Reich was an academic, he posed a simple-sounding but fundamental question to US capitalism: “Who is us?” In an age of global business, he asked,do US-owned companies still represent the USA?
Mr Reich argued that American workers should come first, because America’s standard ofliving depends primarily on improving worker skills. “American” companies are those thatprovide high-skill jobs for American workers in America – regardless of whether those com-panies are owned by American, German, or Japanese shareholders. The flag that flies over afactory or corporate headquarters is less and less relevant, he said.
Not at all, responded chief White House economist Laura Tyson, who said that the nation-ality of a company still largely determines where it will locate the bulk of its sales, production,and research and development. In her paper entitled, “They Are Not Us,” written before eithershe or Mr Reich joined the government, Tyson argued that “the economic fate of nations isstill tied closely to the success of their domestically-based corporations.”
With the globalization of trade, dumping cases can be difficult. Under American law, onlyUS companies are eligible to bring charges. In case law, though not by statute, the firm is considered to be a US company when half or more of a product is made in the USA. A USsubsidiary of a Japanese firm, Brother Industries USA, makes portable electric typewriters inthe USA. In 1993, it won a dumping case against Smith-Corona, a US company that makesits typewriters in Singapore.
Case Questions
1 What are the reasons for the recent growth in international business?2 What are the possible definitions of a US company described in the case?3 Why is it so important to be a US company?4 Explain how Japanese negotiators have cited Mr Reich’s theories in talks with the USA over
opening the Japanese government procurement market to foreign computer makers (seeReich 1990).

CASE PROBLEM 1 27
5 Can you guess how Mr Reich reacted to the fact that the Bush Administration helped Toys“R” Us Inc. set up stores in Japan? Do you think that President Clinton’s Japan team hadthe same reaction as Mr Reich’s?
6 How would Mr Reich rank companies owned by Americans and/or with US operations?7 The website of the White House, www.whitehouse.gov/, gives direct access to US Federal
services, a virtual library of the White House press releases, executive orders, and manyother pieces of information. Access the above website to answer the following questions:How and when was the National Economic Council (NEC) created? Who is the currentchairman of the NEC? What are the principal functions of the NEC?
Sources: D. B., “Clinton Aids Grapple With Definition of a US Company in Global Economy,” The Wall StreetJournal, July 2, 1993; R. B. Reich, “Who Is Us?” Harvard Business Review, Jan./Feb., 1990, pp. 53–64; andM. Starr, “Who Is the Boss? The Globalization of US Employment Law,” Business Lawyer, May 1996, pp.635–52.

Opening Case 2: The Effect of Foreign Investment on Exports
In 1989, Mexico significantly liberalized its foreign investment regulations to allow100 percent foreign ownership. The North American Free Trade Agreement of 1994extends the areas of permissible foreign direct investment (FDI) and protects foreigninvestors with a dispute settlement mechanism. In addition, Mexico has recently takena series of additional actions to increase FDI in Mexico. As a consequence, the US FDIin Mexico has increased more rapidly in recent years than ever before. Mexico is nowthe third-largest host country for US FDI after the United Kingdom and Canada.
Because FDI is generally used to set up foreign production, US exports to Mexicoshould have dropped as a result of increased US FDI in Mexico. Right? Apparentlynot, according to a 1999 study by Wilamoski and Tinkler. The study found that USFDI in Mexico raises total US exports to Mexico and has a positive effect on the US trade balance with Mexico. The removal of barriers to investment has allowed USfirms to establish a presence in Mexico. This has required the Mexican subsidiary toimport inputs from the US parent firms and capital goods from unaffiliated US firms.
International investment flows can boost efficiency and the flow of informationacross borders. In addition, FDI is closely linked to export expansion. For example,FDI by US companies can open the way for US exports, both as inputs to foreign pro-duction and as consumer goods to supply foreign demand. It also offers US compa-nies a toehold in foreign markets, from which they can further expand sales. In manycases, investment in distribution and other essential services increases a supplier’sability to export into a market. Trade between firms and their foreign affiliates(intrafirm trade) can be an efficient means of international trade, particularly whenproblems of imperfect information exist. Over a third of US exports and two-fifths of
CHAPTER 2
Motives for World Tradeand Foreign Investment

MOTIVES FOR FOREIGN TRADE 29
This book deals with both foreign trade and foreign investment. Because these two types of inter-national transactions are extremely interdependent, this chapter examines motives for foreigntrade and foreign investment. The knowledge and understanding of these motives are essentialif we are to appreciate the economic dynamics and policy issues of trade and investment flowsamong nations. Thus, in this important overview, we will discuss key trade and investment theories before we consider them separately in the coming chapters. This chapter also describesglobal and regional market agreements designed to eliminate trade barriers.
2.1 Motives for Foreign Trade
Human desires for goods and services are unlimited, yet our resources are limited. Thus, one ofour most important tasks is to seek new knowledge necessary to bridge the gap between desiresand resources. The traditional concept of economic man assumed that man allocates his scarceresources between competing uses in the most economical manner. In Robinson Crusoe’s world,for example, he would allocate his time for labor between different alternatives. He would useone level site on the uncharted island as either the location for a hut (shelter) or as a vegetablegarden (food). Of course, the real world consists of many persons and nations that are interde-pendent for sociological and economic reasons. Most societies face problems similar to thosefaced by Robinson Crusoe, but in more complex forms.
The advantages of economic interdependence between persons and nations center mainly onthe efficiency of specialization. Specialization of function or division of labor allows each personor nation to utilize any peculiar differences in skills and resources in the most economical manner.There are a number of reasons why specialization produces a greater amount of goods and services:
1 Natural talents among people are different. If intelligent people specialized only in mentaltasks while physically strong people specialized only in physical tasks, the total amount oftheir output would be greater than if each person tried to do both for him- or herself.
2 Even if the natural abilities of two persons are identical, specialization is advantageous becauseit creates the opportunity for improved skills and techniques through repetition of tasks.
3 The simplification of function through specialization leads to mechanization and the use oflarge-scale machinery.
4 Personal specialization saves time, because one person does not have to shift from one taskto another.
The theories of comparative advantage, factor endowments, and product life cycle have been sug-gested as three major motives for foreign trade.
US imports are estimated to be intrafirm. Worldwide, about a third of trade is intrafirmtrade. In fact, many recent studies have confirmed that FDI is closely linked to exportexpansion.
Source: Peter Wilamoski and Sarah Tinkler, “The Trade Balance Effect of US Foreign Direct Invest-ment in Mexico,” Atlantic Economic Journal, Mar. 1999, pp. 24–37.

30 MOTIVES FOR WORLD TRADE AND FOREIGN INVESTMENT
2.1.1 The theory of comparative advantage
The classical economic theory of comparative advantage explains why countries exchange theirgoods and services with each other. Here, the underlying assumption is that some countries canproduce some types of goods more efficiently than other countries. Hence, the theory of com-parative advantage assumes that all countries are better off if each specializes in the productionof those goods that it can produce more efficiently and buys those goods that other countriesproduce more efficiently.
WHY COMPARATIVE ADVANTAGE OCCURS The theory of comparative advantage depends ontwo elements:
1 Factors of production, such as land, labor, capital, and technology, are unequally distributedamong nations.
2 Efficient production of various goods and services requires combinations of different eco-nomic resources and different technologies.
For instance, Canada has vast amounts of fertile land resources and relatively few people. In con-trast, Japan has little land and abundant skilled labor. Thus, Canada may produce such land-intensive goods as wheat more economically than Japan, while Japan may produce suchlabor-intensive goods as cameras more economically than Canada.
However, it is important to recognize that the distribution of economic resources and tech-nology can change over time. This change may alter the relative efficiency of production. In thepast 10–20 years, some developing countries have considerably upgraded the quality of theirlabor forces and have substantially expanded their stock of capital. Therefore, they now producecapital-intensive products such as steel, machinery, and automobiles. Moreover, some newlydeveloped countries, such as Korea, Taiwan, and Brazil, now produce high-technology products,such as computers and computer software.
Example 2.1
Suppose, for the time being, that the world has two nations (Canada and Japan) and twocommodities (wheat and cameras). For a fixed amount of $1,000 in land, labor, capital, andtechnology, Canada and Japan can produce either of the two commodities listed in table2.1. In other words, if each country were to make one or the other, Canada could produce180 bushels of wheat or six cameras, while Japan could produce 80 bushels of wheat oreight cameras. If there is no trade, then Canada can produce 90 bushels of wheat and threecameras, while Japan can produce 50 bushels of wheat and three cameras.
It is clear from table 2.1 that under full employment conditions, Canada’s exchange ratiofor the two products is one camera (C) for 30 bushels of wheat (W), or 1C = 30W. Japan’s

MOTIVES FOR FOREIGN TRADE 31
exchange ratio for the two products is one camera for 10 bushels of wheat, or 1C = 10W.Thus, Canada has a greater advantage in the production of wheat, whereas Japan has abetter advantage in the production of cameras. In other words, these two countries produceboth products but at different levels of economic efficiency. If they specialize according totheir comparative advantage, Canada must produce only wheat while Japan must produceonly cameras. If they trade with each other, larger outputs of both wheat and cameraswould be available to both nations, because specialization allocates world resources moreefficiently.
The exchange ratios for the two products differ in the two countries. This differencebecomes the basis for mutually beneficial specialization and trade. Trade requires a newexchange ratio between the two products, so that Canada may obtain one camera for lessthan 30 bushels of wheat and Japan may obtain more than 10 bushels of wheat for onecamera. Thus, the terms of trade lie somewhere between 1C = 30W and 1C = 10W, or30W > 1C > 10W. The actual exchange ratio will depend on world conditions of supplyand demand. However, assume that the international exchange ratio for the two productsis 1C = 20W. The quantities of the two products available to both countries after spe-cialization and trade would be greater than the optimum product mixes before specializa-tion and trade.
Table 2.2 shows the gains of the two nations from specialization and trade. If Canadawere to export 80 bushels of wheat (out of 180 bushels) for four cameras, it would enjoy100 bushels of wheat and four cameras. Hence, Canada would have 10 more bushels ofwheat and one more camera than the optimum product mix that existed before specializa-tion and trade. If Japan were to trade four cameras (out of eight cameras) for 80 bushelsof wheat, Japan would enjoy four cameras and 80 bushels of wheat. Thus, Japan wouldenjoy one more camera and 30 more bushels of wheat than its optimum product mixwithout specialization and trade.
Table 2.1 Production alternatives of wheat and cameras
Country Wheat Cameras
Canada 180 6Japan 80 8
Table 2.2 Gains to both nations from specialization and trade
Exports (-) GainsBefore After and After from
Country specialization specialization imports (+) trade trade
Canada 90W 180W -80W 100W 10W3C 0C +4C 4C 1C
Japan 50W 0W +80W 80W 30W3C 8C -4C 4C 1C

32 MOTIVES FOR WORLD TRADE AND FOREIGN INVESTMENT
2.1.2 The theory of factor endowments
Countries are endowed differently in their economic resources. Thus, Colombia is more efficientin the production of coffee and the United States is more efficient in the production of com-puters. Colombia has the soil, weather, and abundant supply of unskilled labor necessary toproduce coffee more economically than the USA. The USA possesses the facilities, key parts, andample supply of skilled labor necessary to produce computers more efficiently than Colombia.
Differences in these national factor endowments explain differences in comparative factor costsbetween the two countries. Capital costs are lower in the USA than in China because the USAhas more capital than China. Labor costs are lower in China than in the USA because China hasmore labor than the USA. Simply stated, the more abundant the supply of any factor, the loweris the cost of that factor.
The theory of factor endowments says that countries are mutually benefited if they spe-cialize in the production of those goods that use a large amount of abundant factors and tradethose goods among them. This means that a country must specialize in the production and exportof any good that uses large amounts of abundant factors. It must import those commodities that use large amounts of production factors that are scarce at home. On the one hand, mostdeveloping countries have a comparative cost advantage in the production of labor-intensive com-modities. On the other hand, most industrialized countries enjoy a comparative cost advantagein the production of capital-intensive commodities. Thus, specialization and trade can be mutu-ally beneficial if industrialized countries specialize in the production and export of capital-intensive goods, and if developing countries specialize in the production and export of labor-intensive commodities.
2.1.3 The product life cycle theory
All products have a certain length of life. During this lifetime, they go through certain stages. Aproduct’s life begins with its market introduction; its market grows rather rapidly; its demandreaches maturity; its market declines; and finally, its life ends.
This product life cycle theory attempts to explain both world trade and foreign investmentpatterns on the basis of stages in a product’s life. In the context of international trade, the theoryassumes that certain products go through four stages:
1 A large company introduces a new product in response to some change in the home-country market. After a time lag, this home country establishes itself as an exporter with amonopoly position.
Specialization and trade permit the two countries in our model to obtain a total of 180bushels of wheat and a total of eight cameras. It is important to note that the two coun-tries had a total of 140 bushels of wheat and a total of six cameras before specializationand trade. Thus, larger outputs of both wheat and cameras are available to the two coun-tries from specialization and trade.
2 Increasing transportation and tariff costs make it less attractive to export the product. Thus,the firm begins to produce its product in some foreign countries. This international pro-duction replaces home-country exports in certain foreign markets.
3 Some foreign companies begin to compete in third-country markets. This competition leadsto a further reduction in home-country exports.
4 Some foreign companies export the product back to the home country. Many factors, suchas low labor costs, economies of scale, and government subsidies, make it possible for foreigncompanies to invade the home-country market.
2.1.4 Other motives for world trade
ECONOMIES OF SCALE A synergistic effect is said to exist when the whole is worth more thanthe mere sum of its parts. It is this effect, which has frequently been defined as “2 + 2 = 5,” thatleads to economies of scale. Hence another important cause of international trade is that costsmay fall as outputs expand. Economies of mass production can be realized if each country spe-cializes in a limited number of products in which it has a comparative advantage. Mass produc-tion and mass marketing improve skills and technologies. Opportunities to eliminate duplicatefacilities occur. There are also opportunities to consolidate the functions of production, market-ing, and purchasing. These types of operating economies and improved skills can lead to largeroutputs of goods and services even if no differences existed in comparative costs among countries.
DIFFERENCES IN TASTES Even if differences in comparative costs among countries andeconomies of scale were absent, world trade might take place due to differences in tastes. Supposethat both Canada and Japan produce the same amount of fish and meat. If Canadians prefermeat and Japanese prefer fish, then a mutually beneficial export of meat from Japan to Canadaand fish from Canada to Japan would take place. Both countries would gain from this trade,because the sum total of satisfaction derived from the trade would be greater than would be pos-sible under isolated self-sufficiency without trade.
2.1.5 Benefits of open trade
Open, competitive trade promotes the economic welfare of all countries that engage in it, anddoes so in four ways. Open trade secures the benefits of national comparative advantage; increasesdomestic competitive pressures; accelerates the flow of technology and ideas; and broadens thevariety of goods and services available to both producers and consumers.
ALLOCATION EFFICIENCY FROM COMPARATIVE ADVANTAGE A more traditional approachdepicts a world in which markets are competitive and economies of scale do not exist. In thesesituations, gains stem from comparative advantage. Under the concept of comparative advantage,each country imports those goods produced more efficiently abroad and exports those goods pro-duced more cheaply at home. Such types of trade allow each trading country to devote more ofits resources to producing those goods and services that it can produce more efficiently. Because
MOTIVES FOR FOREIGN TRADE 33

34 MOTIVES FOR WORLD TRADE AND FOREIGN INVESTMENT
free trade leads to the most efficient use of scarce resources, all countries that engage in free tradewould obtain economic gains.
INCREASED COMPETITION Foreign trade strengthens competitive pressures in the domesticeconomy, stimulating efficiency and growth. An open trade regime effectively increases thenumber of both actual and potential competitors in the domestic market by including thoselocated beyond a nation’s borders. This encourages domestic producers to innovate and becomemore competitive. Consumers, both at home and abroad, reap the benefits.
INCREASED PRODUCTIVITY FROM PRODUCTION EFFICIENCY Access to international marketsthrough foreign trade stimulates the flow of information across borders. Domestic companiesengaged in international competition assimilate new ideas about production methods, productdesign, organizational structure, and marketing strategy. These new ideas allow domestic com-panies to employ their resources more efficiently. Thus, open competition through free tradeincreases productivity.
Open trade also creates opportunities for economies of scale or synergistic effects. The reduc-tion of barriers automatically increases total demand. As economic resources shift to the moreefficient producers due to increased competition, companies can expand production to takeadvantage of the larger market. This dynamic change in market size allows companies to spreadfixed costs over more and more units of production.
AN EXPANDED MENU OF GOODS Foreign trade expands the menu of goods and services avail-able to both producers and consumers. Companies gain access to a wider variety of inputs. Con-sumers get to choose from a broader assortment of goods and services. By expanding the choices,foreign trade boosts efficiency and improves living standards.
Global Finance in Action 2.1Economic Freedom and Consumption
People who live in free countries enjoy substantially higher living standards than thoseliving in repressive countries. The World Bank collects data on per capita consump-tion by country. Two independent research groups – the Heritage Foundation inWashington, DC, and the Fraser Institute in Canada – measure economic freedomacross the world using a broad variety of criteria based on key components of freeenterprise, including trade policies and openness to foreign investment. Relating theconsumption to freedom data sets, one finds that per capita consumption in the eco-nomically freest fifth of countries is eight to nine times that of the least free fifth (seefigure 2.1).
Source: Robert D. McTeer, Jr, The Fruits of Free Trade: 2002 Annual Report, Federal Reserve Bankof Dallas, 2002, p. 13.

MOTIVES FOR FOREIGN TRADE 35
2.1.6 Free trade versus protectionism
The possibility of a foreign embargo on sales of certain products and the needs of national defensemay cause some countries to seek self-sufficiency in some strategic commodities. Political andmilitary questions constantly affect international trade and other international business opera-tions. Conflicts have historically taken place between multinational companies (typicallyexporters) and host countries (typically importers) over political ideology, national sovereignty,control of key industries, balance of payments, and control of export markets.
REASONS FOR PROTECTIONISM There are a variety of arguments for protectionism: (1)national security, (2) unfair competition, (3) the infant-industry argument, (4) domestic employ-ment, and (5) diversification.
First, if a country wishes to be a world power, it must maintain key sectors, such as steel, fornational security. By maintaining strategic commodities, it is assured of supplies in the event ofglobal conflicts and boycotts.
Second, labor-intensive industries in developed countries argue that low wages in foreigncountries constitute unfair competition. In addition to low wages, countries with industrial poli-cies enjoy unfair competitive advantage because of their public policies, such as special tax incen-tives, subsidies, and selective protection to overcome the competition.
Third, the logic of the infant-industry argument is that protective measures are essential fornewly begun domestic industries to establish themselves. They need time and thus protection torealize the economies of mass production.
Fourth, protection maintains domestic employment and living standards. The costs from unem-ployment may be higher than the costs of inefficient domestic production for certain products.
Heritage studyFraser study
20,000
18,000
16,000
14,000
12,000
10,000
8,000
6,000
4,000
2,000
0Least free 2nd 3rd 4th Most free
Quintile
Per capita consumption ($)
Figure 2.1 Economic freedom and consumption

Fifth, highly specialized economies, such as Kuwait’s oil economy, depend on internationalmarkets for incomes. If they are to reduce their dependence upon world markets for one or twoproducts, these countries need some protection to diversify the economy.
FORMS OF TRADE CONTROL Tariffs, import quotas, and other trade barriers are three primarymeans of protectionism.
Tariffs are duties or taxes imposed on imported commodities. Tariffs on imported com-modities may be imposed for purposes of revenues or protection. Tariffs are usually modest whenthey are used to increase revenues. However, tariffs are typically high when they are imposed to protect domestic companies from foreign competition. Although protective tariffs do not eliminate the importation of foreign products completely, they clearly put foreign sellers at acomparative disadvantage. Here, consumers must pay more for foreign goods, thereby reducingtheir consumption of imported commodities.
Import quotas specify maximum amounts of certain products to be imported during a givenperiod of time, usually 1 year. Import quotas may also be used to shield domestic producers fromforeign competition. They are sometimes more effective than tariffs in reducing the importationof certain products. Even if tariffs are high, certain commodities may still be imported in rela-tively large quantities. In contrast, low import quotas totally prohibit imports beyond a quota.Hence, it is no wonder why many countries have recently imposed quotas on the importationof certain goods.
There are other trade barriers. The general trend around the world since World War II hasbeen to reduce such obvious trade barriers as quotas and tariffs. This trend has compelled govern-ments to replace them with less obvious forms of protection which, according to a survey by Balland McCulloch (1999), number over 800. Three major classes of such other trade barriers are:
1 Direct government participation in trade.2 Customs and other administrative procedures.3 Technical and health regulations or standards.
First, a government’s participation in trade covers export subsidies, countervailing duties, andantidumping duties; when engaged in these activities, the government prefers national overforeign bidders. Countervailing duties are additional import duties imposed to offset an exportsubsidy by another country. Antidumping duties are customs duties imposed on an importedproduct whose price is lower than that of the same product in the home market.
Second, customs and other administrative procedures include customs classification, valuation,and procedures. Import duties imposed on certain products often depend on how they are classi-fied into the tariff schedule and how they are valued by customs authorities. In addition, customsinspectors can discriminate against a good or a country by delaying the importation process.
Finally, technical and health regulations make up the standards that can hinder imports. Governments apply many safety rules and regulations on imports, in the form of marking, labeling, packaging, and technical standards. These standards tend to discriminate against importsby imposing greater hardship on foreign than domestic companies.
Other trade barriers can have a significant impact on international trade. For example, Japanis criticized by some countries for its nontariff barriers, such as extremely stringent product standards on imported products. Some economists argue that these barriers are major causes ofthe lingering US trade deficit with Japan. Others, however, attribute the deficit to Japan’s supe-rior quality and production efficiencies based on teamwork, quality education, and work ethic.
36 MOTIVES FOR WORLD TRADE AND FOREIGN INVESTMENT

MOTIVES FOR FOREIGN TRADE 37
Global Finance in Action 2.2The High Cost of Protectionism
How much does it cost to protect a job? An average of $231,289, figured across just20 of the many protected industries (see table 2.3). Costs range from $132,870 perjob saved in the costume jewelry business to $1,376,435 in the benzenoid chemicalindustry. Protectionism costs US consumers nearly $100 billion annually. It increasesnot just the cost of the protected items but downstream products as well. Protectingsugar raises candy and soft drink prices; protecting lumber raises home-building costs;protecting steel makes car prices higher; and so forth. Then there are the job lossesin downstream industries. Workers in steel-using industries outnumber those in steel-producing industries by 57 to 1. In addition, the protection does not even work. Sub-sidies to steel-producing industries since 1975 have exceeded $23 billion; yet industryemployment has declined by nearly two-thirds.
Table 2.3 The cost of protectionism
Total cost Annual costProtected industry Jobs saved (in millions) per job saved
1 Benzenoid chemicals 216 $297 $1,376,4352 Luggage 226 290 1,285,0783 Softwood lumber 605 632 1,044,2714 Sugar 2,261 1,868 826,1045 Polyethylene resins 298 242 812,9286 Dairy products 2,378 1,630 685,3237 Frozen concentrated orange juice 609 387 635,1038 Ball bearings 146 88 603,3689 Maritime services 4,411 2,522 571,668
10 Ceramic tiles 347 191 551,36711 Machine tools 1,556 746 479,45212 Ceramic articles 418 140 335,87613 Women’s handbags 773 204 263,53514 Canned tuna 390 100 257,64015 Glassware 1,477 366 247,88916 Apparel and textiles 168,786 33,629 199,24117 Peanuts 397 74 187,22318 Rubber footwear 1,701 286 168,31219 Women’s nonathletic footwear 3,702 518 139,80020 Costume jewelry 1,067 142 132,870
Source: Robert D. McTeer, Jr, The Fruits of Free Trade: 2002 Annual Report, Federal Reserve Bankof Dallas, 2002, p. 13.

38 MOTIVES FOR WORLD TRADE AND FOREIGN INVESTMENT
2.2 Economic Integration
World leaders have recognized that the reduction or elimination of artificial barriers to trade isnecessary for expanding world trade. The worldwide postwar efforts to expand foreign tradeincluded the elimination of tariff barriers through the World Trade Organization and the stabi-lization of currencies through the International Monetary Fund. At the same time as these effortswent forward on the international level, many countries around the world also pursued economiccooperation at the regional level. Regional economic cooperation is based on the premise thatcountries in a region connected by historical, geographical, cultural, economic, and political similarities may be able to strike more intensive cooperative agreements for mutually beneficialeconomic advantages.
2.2.1 From GATT to WTO
In 1947, 23 countries signed the General Agreement on Tariffs and Trade (GATT) in Geneva.To join GATT, countries must adhere to the most favored nation (MFN) clause, which requiresthat if a country grants a tariff reduction to one country, it must grant the same concession toall other countries. For example, if the USA cuts its tariff from 20 percent to 10 percent on woolsweaters from Australia, it must grant the same concession on wool sweaters from all other coun-tries. The MFN clause also applies to quotas and licenses.
GATT members have held many talks since 1947 to expand and promote world trade. First,GATT members held periodic meetings from 1947 to 1952 to cut specific tariffs. Second, theKennedy Round (1964–7) covered across-the-board tariff reductions on industrial products.Perhaps the most important part of the Kennedy Round was to reduce trade barriers betweenthe USA and the European Economic Community. Third, the Tokyo Round (1973–9) of mul-tilateral trade negotiations discussed the reduction of nontariff barriers. The most important partof these agreements is a series of detailed codes spelling out permissible and nonpermissible“good” behavior by governments in almost all nontariff measures. Fourth, the Uruguay Round(1986–93) discussed the expansion of trade liberalization to include services, intellectual property rights, and agricultural products.
The new organization, known as the World Trade Organization (WTO), has replaced the GATT since the Uruguay Round accord became effective on January 1, 1995. Today, theWTO’s 144 members account for more than 97 percent of world trade. The WTO has five major functions: (1) administrating its trade agreements; (2) acting as a forum for trade nego-tiations; (3) monitoring national trade policies; (4) offering technical assistance and training for developing countries; and (5) cooperating with other international organizations. Chinajoined the WTO in 2001. China’s WTO membership has further legitimized the idea of freetrade.
The WTO has more power to enforce the rules of international trade than the GATT. Underthe WTO there is a powerful dispute-resolution system, with three-person arbitration panels.Countries may bring charges against their trading partners to a WTO panel. WTO memberscannot veto the panel’s rulings, as was the case under GATT. If an offending country fails tocomply with panel recommendations, its trading partners are guaranteed the right to compen-sation. As a final resort, the trading partners are given the right to impose countervailing sanc-tions against the offending country.

ECONOMIC INTEGRATION 39
In November 2001, WTO members began to explore a new round of talks with the aim offurther liberalizing global commerce. Major issues include a moratorium on tariffs for electro-nic commerce, easier access to foreign markets for high-tech, banking, and insurance exports,elimination of agricultural subsidies, tougher labor standards around the world, revision of USantidumping laws, and more time for developing countries to liberalize trade.
2.2.2 Trading blocs: types of economic cooperation
A trading bloc is a preferential economic arrangement between a group of countries that reducesintraregional barriers to trade in goods, services, investment, and capital. There are more than50 such arrangements at the present time. There are five major forms of economic cooperationamong countries: the free trade area, the customs union, the common market, the economicunion, and the political union.
The free trade area type of cooperation requires member countries to remove all tariffs amongthemselves. However, the member nations are allowed to have their own tariff arrangements withnonmember countries. The North American Free Trade Agreement among the USA, Canada,and Mexico illustrates the free trade area type of agreement.
Under the customs union arrangement, member nations not only abolish internal tariffsamong themselves but also establish common external tariffs. The trading bloc called Mercosurin Spanish constitutes a customs union. The four members of Mercosur – Argentina, Brazil,Paraguay, and Uruguay (see figure 2.2) – account for 70 percent of South America’s total output.The aims of this customs union are designed to establish free trade among member countriesand to impose a common tariff of 5–20 percent on products imported from the outside. Fur-thermore, the leaders of these four countries wish to develop a unified strategy for trade nego-tiations with the USA over the proposed Free Trade Area of the Americas.
In a common market type of agreement, member countries abolish internal tariffs amongthemselves and levy common external tariffs. Moreover, they allow the free flow of all factors ofproduction, such as capital, labor, and technology. The Central American Common Marketexemplifies a common market type of agreement among Costa Rica, El Salvador, Guatemala,Honduras, and Nicaragua. This common market wishes to permit the free flow of productionfactors among its member countries, but its goal is hampered by the nonuniformity of economicconditions among them.
The economic union combines common market characteristics with harmonization of eco-nomic policy. Member nations are required to pursue common monetary and fiscal policies. Thismeans that economic union members have to synchronize taxes, money supply, interest rates,and regulation of capital markets. The current version of the European Union (EU) representsan economic union. The name of the European Economic Community (EEC) was officiallychanged to the EU on November 1, 1993, when the Maastricht Treaty of the EEC came intoeffect.
The political union combines economic union characteristics with political harmony amongthe member countries. Essentially, countries merge with each other to create a new nation. Thus,it is the ultimate market agreement among nations. In the 1950s, Egypt, Syria, and Yemen formeda political union, but it did not last long. Thus, in its pure form, an example of the politicalunion does not exist. However, the recently created commonwealth of 11 former Soviet republicscould be considered a political union.

2.2.3 Regional economic agreements
The world has been swiftly moving toward trading blocs in recent years. Economists dividetrading nations into three groups based on the euro, the dollar, and the yen. The world’s futureeconomic landscape will see that companies will compete within the boundaries of trading blocs– whether in Europe, North America, or Asia. Each of these trading blocs is expected to pose itsown challenges. If countries continue to compete with one another as single nations, they couldlose their competitiveness in the world marketplace. Many world leaders loudly assail regionaltrading blocs that serve as protectionist trade umbrellas. However, they also concede that tradingblocs may be an unfortunate but emerging trend.
THE EUROPEAN ECONOMIC AREA Six European countries – Belgium, France, West Germany,Italy, Luxembourg, and the Netherlands – established the EEC through the Treaty of Rome inMarch 1957, to remove trade barriers among the member countries. Since then, the EEC hasadded Denmark, Greece, Ireland, Portugal, Spain, and the United Kingdom.
According to the 1957 Treaty of Rome, EEC member countries agreed to: (1) abolish tariffs,quotas, and other trade restrictions among member countries; (2) impose a uniform tariff on
40 MOTIVES FOR WORLD TRADE AND FOREIGN INVESTMENT
Year *Through April
1997
1998
1999
2000
2001
2002
2003
*0
5
10
15
$20
US exports
US trade with Mercosur countries ($ billions)
South America's Mercosur tradegroup is discussing greaterintegration, including a unifiedstrategy for free-trade negotiationswith the USA.
US imports
Strength in Numbers GUYANASURINAM
FRENCH GUIANA
VENEZUELA
COLOMBIA
ECUADOR
PERU
BOLIVIA
CHILE
Mercosur countries
ARGENTINA
URUGUAY
PARAGUAY
BRAZIL
Figure 2.2 The Mercosur trade group
Source: The Wall Street Journal, June 16, 2003, p. A13.

imports from nonmember countries; (3) remove restrictions on movements of capital and laborwithin the six-nation group; (4) establish a common policy on transportation, agriculture, com-petition, and business conduct; (5) coordinate and synchronize member countries’ monetary andfiscal policies; and (6) set up a “social fund” to compensate workers who might experience eco-nomic injury due to the integration process.
The 12 member countries created a single market on January 1, 1993, through the Single European Act of 1987. The EU identified three general barriers for complete removal: (1) physical barriers, such as customs controls and border formalities; (2) technical barriers, such as different health and safety standards; and (3) fiscal barriers, such as differences in value-added tax rates and excise duties. These goals are identical with those established under the 1957Treaty of Rome. The EU made 280 regulatory changes to create a genuine single market inEurope.
In December 1993, the EU ratified a treaty to create the European Economic Area (EEA).The treaty took effect on January 1, 1994. It extends most of the then 12-country EU’s single-market legislation to Austria, Finland, and Sweden, which are members of the European FreeTrade Association (EFTA). On January 1, 1999, the European Central Bank began to conductmonetary policy for 11 of the 15 EU nations with a single currency known as the euro (Greecejoined in 2001). The existing 12 central banks expect to become regional banks in the next fewyears, much like the 12 Federal Reserve Banks in the US Federal Reserve System. The EUaccepted 10 new members on May 1, 2004. Several EU member countries are expected to jointhe eurozone in the next few years.
THE NORTH AMERICAN FREE TRADE AGREEMENT On January 2, 1988, President Reaganand Canadian Prime Minister Mulroney signed the US–Canada Free Trade Agreement (FTA),which came into effect on January 1, 1989. The USA and Canada are each other’s most impor-tant trading partners. The FTA liberalizes the largest trading relationship in the world. Through-out the 1990s, the FTA phased out tariffs, liberalized investment laws, and granted “nationaltreatment” to companies on both sides of the border.
In August 1992, representatives of Canada, Mexico, and the USA concluded their negotiationsof the North American Free Trade Agreement (NAFTA), which became effective on January 1,1994. As of January 1, 1994, NAFTA created the world’s largest trading bloc, with 365 millionpeople and $7 trillion in purchasing power. NAFTA eliminates tariffs among the three countriesover a period of 15 years, it substantially reduces nontariff barriers over the same period, and itimmediately ensures the free flow of capital throughout its region. Business leaders, govern-ment officials, and scholars view the NAFTA as a natural trading bloc because of American technology, Canadian resources, and Mexican labor. In 2001, the USA and 33 other countries ini-tiated trade negotiations for a free trade area of the Americas, which would include allNorth–South American countries and some countries in the Caribbean Sea. Chile has become thefirst Latin American country to forge a free trade agreement with the USA in 2003, one step towardwhat the Bush Administration foresees as a new era of open markets around the Americas.
ASIAN INTEGRATION EFFORTS Asia represents the third major region of the world economy,although it is difficult to clearly delineate its boundaries. Hence, the development in Asia hasbeen quite different from that in Europe and in the Americas. While European and North American agreements have been driven by political will, market forces may force more formalintegration on the politicians in Asia. If Asian countries continue to compete in the world
ECONOMIC INTEGRATION 41

marketplace as single nations, they could lose their competitiveness in the world marketplace.While Japan is the dominant force in the area to take leadership in such an endeavor, neitherthe Japanese themselves nor the other nations wanted Japan to do it.
As a result, Asia does not have a strong trading bloc such as NAFTA or EU, but it has twoloose affiliations: the Association of South East Asian Nations (ASEAN) and the Asian PacificEconomic Cooperation (APEC). Created in 1967, ASEAN consists of Brunei, Burma (currentlyMyanmar), Indonesia, Malaysia, the Philippines, Singapore, Thailand, and Vietnam; since then,ASEAN has added Cambodia and Laos. In November 2001, China and 10 ASEAN countriesagreed to create a free trade area within 10 years. Trade liberalization already under way in theregion, through the ASEAN Free Trade Area, which began in 2002, will cut tariffs on all foreigntrade to a maximum of 5 percent by January 1, 2008.
APEC was formed in 1989 to promote multilateral economic cooperation on issues of tradeand investment. APEC consists of 18 countries that account for half of world output and itincludes the world’s three largest economies: the USA, Japan, and China. In 1994, APEC leadersagreed to achieve free and open trade in the region by 2010 for the industrial nations and 2020for the rest of the members.
Japan has sought to cut the best trade deals for itself by negotiating through the multilateralWorld Trade Organization instead of making bilateral or regional pacts. This continued in recentyears even as many countries around the world formed regional trading blocs, such as the NAFTAand the EU. However, Japanese officials and business executives have grown alarmed as regionalblocs have continued to put Japanese exporters at a disadvantage. Thus, Japan and Singaporerecently signed a bilateral free trade agreement, in a move that eventually could change the wayin which Japan conducts its long-troubled trade relations. There has already been talk of Japanforging trade zones with such Pacific Rim countries as Korea, Mexico, and the USA. Other Asiancountries have recently stepped up to cut their own trade deals with their fellow Asian countriesand countries from other regions. For example, South Korea and Chile formed a free trade agree-ment in 2003, and the USA signed a free trade agreement with Singapore in 2004.
2.2.4 Corporate response to trading blocs
Corporations’ investments are an important consideration in the proliferation of trading blocs.On the one hand, investments are made in various blocs to ensure continued access to the marketsshould protectionist barriers be erected. In a sense, this necessity may foster inefficiency, becauseinvestments would not be made with the objective of optimization in mind. However, if tradingblocs attract nations with similar consumer profiles, these investments do make sense from anoverall business-development and customer-service point of view. Regional strategies may, in turn,accelerate the concentration of the different markets that comprise the trading blocs.
Many companies may not have the resources or the time to invest in all of the emerging tradingblocs. To ensure future competitive capability, many strategic alliances have been forged acrossnational and regional borders in recent years. These alliances involve arrangements ranging fromcontract manufacturing to joint research and development. Corporate mergers have occurredacross regional borders to guarantee access to blocs as local entities.
What impact will these corporate investments and alliances have on blocs and the argumentthat they are indeed basically protectionist? The “stateless” corporation may be able to move pro-duction and investment wherever it gets its best return without concern for a particular countryor a region. Technology has made such transfer relatively swift and quite painless.
42 MOTIVES FOR WORLD TRADE AND FOREIGN INVESTMENT

MOTIVES FOR FOREIGN INVESTMENT 43
First, corporations and their assets can no longer be held hostage by a dismayed governmentor even a supranational organization. Second, it is becoming increasingly difficult to establish aproduct’s national/regional origin, which makes protectionist moves correspondingly difficult.Finally, the interdependence that is being formed by companies may also spill over in a majorway to the national and regional levels as well. As has been shown recently, tariff barriers erectedagainst Japanese and European imports into the USA have ended up hurting US businesses aswell. In 1991, IBM urged the US government to remove an antidumping duty that it hadimposed on certain computer display screens imported from Japan. The effect of this duty wasthat American-built computers using this component became uncompetitive against models builtcompletely in Japan.
2.3 Motives for Foreign Investment
In recent years, many companies have been induced to enter into new and profitable marketsabroad. Economic and political forces in the host countries, along with their desire to sell moreabroad, are largely responsible for the expansion of direct foreign investment. Companies find itincreasingly easier to reach foreign markets through direct investment. The product life cycletheory, the portfolio theory, and the oligopoly model have been suggested as bases for explain-ing and justifying foreign investment.
2.3.1 The product life cycle theory
The theory of product life cycles explains changes in the location of production. When new pro-ducts are introduced in home-country markets, their sales and profits tend to increase sharplyuntil they reach maturity. Competition increases rapidly as these products approach their matu-rity point; this competition narrows profit margins. At this stage, companies may utilize foreignmanufacturing locations to lower production costs and sustain profit margins.
This theory assumes that larger companies in highly advanced countries have a comparativeadvantage in new products over the companies in developing nations. Companies in developingcountries, however, have a comparative advantage in fabricating mature products. Highlyadvanced technologies, highly educated labor resources, and abundant capital are essential todevelop new products. They are readily available to larger firms in advanced countries. Largermarkets and necessary alteration requirements in early production stages are additional reasonswhy larger companies in the developed areas of the world first introduce new products in thehome-country markets.
As products become mature, product defects and technological imperfections inherent in newproducts are ironed out, so that the method of production becomes standardized. Competitionbegins to appear during the stage of market growth and becomes highly intensive during thestage of market maturity. At this point, some companies will shift their standardized manufac-turing methods to developing countries for a number of good reasons:
1 Standard production methods require many unskilled workers.2 Most developing countries have an abundant supply of unskilled labor.3 Labor costs are lower in developing countries than in advanced countries.

2.3.2 The portfolio theory
The portfolio theory indicates that a company is often able to improve its risk–return perfor-mance by holding a diversified portfolio of assets. This theory represents another rationale forforeign investment. This theory rests on two variables: risk and return. Risk is the variability ofreturns associated with an investment project. Two projects may have the same long-term averagerate of return. But one project may fluctuate widely in annual return while the other may havea stable return. A project whose returns fluctuate widely is said to be more risky than the otherwhose returns are stable.
Typically, only a few financial variables are known in advance. Business executives andinvestors are, basically, risk averse. Thus, they desire to minimize the overall degree of risk fortheir investment projects. Fortunately, there are many business situations in which the risks ofindividual projects tend to offset each other. As a consequence, successful diversification makesit possible for investors to have a portfolio with risk less than the sum of the risks of the indi-vidual projects in the portfolio.
A study by Levy and Sarnat (1970) indicated that a company is often able to improve itsrisk–return performance by holding an internationally diversified portfolio. The key element inthe portfolio theory is the correlation coefficient between projects in the portfolio. When pro-jects with low degrees of correlation are combined with each other, a company is able to reduceits risk of expected return. The Levy–Sarnat model assumes that foreign investment projects tendto be less correlated with each other than domestic investment projects. The economic cycles ofdifferent countries – the USA and Saudi Arabia, for example – do not tend to be totally syn-chronized. On the other hand, most domestic projects tend to be highly correlated with eachother, because they depend on the same state of economy.
2.3.3 The oligopoly model
If you decide to buy tennis balls in the USA, you will end up with one of four brands: Wilson,Penn, Dunlop, or Spalding. These four companies make almost all of the tennis balls sold in theUSA. Together, these four firms determine the quantity of tennis balls and the price at whichtennis balls are sold. Analysts say that only a small number of giant multinational companies ineach major industry also dominate the world market in that segment.
An oligopoly exists where there are only a few firms whose products are usually close substi-tutes for one another. Because a few firms dominate a market, each of these firms has a largeshare of the market. Thus, the policies of one firm have repercussions on the other firms.
The oligopoly model offers a way of explaining why multinational companies (MNCs) investin foreign countries. The oligopoly model assumes that business firms make foreign investmentsto exploit their quasi-monopoly advantages. The advantages of an MNC over a local companymay include technology, access to capital, differentiated products built on advertising, superiormanagement, and organizational scale.
Horizontal investments for foreign production of the same goods as made in a home marketare made to produce operational economies of scale. A horizontal investment may reduce thenumber of competitors, eliminate duplicate facilities, and expand a firm’s operation in an exist-ing product line. Vertical investments for foreign production of raw materials are usually madeto control input sources. The control of input sources may make it possible for companies in an
44 MOTIVES FOR WORLD TRADE AND FOREIGN INVESTMENT

MOTIVES FOR FOREIGN INVESTMENT 45
oligopolistic industry to raise barriers to the entry of new competitors and to protect their oli-gopoly position. Some companies make defensive investments to prevent others from gaining anunanticipated advantage.
2.3.4 Other studies of motives for foreign investment
Many foreign investors are motivated by strategic decisions. Although there are numerous sortsof strategic considerations, we can group them into two categories: those from the standpoint ofinvestors and those from the standpoint of host countries.
CONSIDERATIONS FROM THE STANDPOINT OF INVESTORS Nehrt and Hogue (1968) suggestedthat companies invest abroad for several purposes:
1 New markets.2 Raw materials.3 Production efficiency.4 New knowledge.
First, many companies attempt to satisfy local demand or expand their markets through foreignmanufacturing locations. For example, Japanese automobile manufacturers have built theirassembly plants in the USA to satisfy local demand and to expand their market.
Second, oil companies, mining companies, and lumber companies find it difficult or costlyto obtain raw materials at home. Hence, they invest their money abroad to obtain these rawmaterials.
Third, some production efficiency-oriented companies look for low costs of production, suchas low labor costs. This is one of the most important reasons why MNCs choose countries inAfrica, Asia, and South America for their overseas investment.
Fourth, some companies invest abroad to seek new knowledge and managerial expertise. Forexample, German, Japanese, and Korean companies have acquired US-located electronic firmsfor their technology.
CONSIDERATIONS FROM THE STANDPOINT OF HOST COUNTRIES The National IndustrialConference Board (1969) surveyed a sample of 60 nations and found that many developing coun-tries have various incentive programs for private foreign investments. They include tax incen-tives, tariff exemptions, financial assistance, remittance guarantees, administrative assistance,protection against competitive investments and imports, and protection against nationalizationand political risk. These and other incentive programs would undoubtedly motivate MNCs toinvest in those nations offering them.
MIXED CONSIDERATIONS Aharoni (1966) studied the process for foreign investment decisions.After surveying 38 American companies that had invested in Israel, he found the following invest-ment motives:

46 MOTIVES FOR WORLD TRADE AND FOREIGN INVESTMENT
1 Outside proposals, such as those from foreign governments.2 Fear of losing a market.3 The bandwagon effect, which means that successful foreign operations reported by a company
induce competitors to go abroad.4 Strong competition from abroad in the home market.
In addition to these four motives, the survey also detected a number of auxiliary motives forforeign investment:
1 Utilization of old machinery.2 Capitalization of know-how; spreading of research, development, and other fixed costs.3 Creation of a market for components and other products.4 Indirect return to a lost market through investment in a country that has commercial agree-
ments with these lost territories.
2.4 A Synthesis of Foreign Trade and Investment Theories
Traditionally, economists concentrated on trade only at the national level, while managementscholars focused almost exclusively on the behavior of MNCs. Both groups of scholars thus failedto incorporate trade and investment theories into a single theory of international involvement. Thiswas not a serious problem when foreign trade was largely carried on by intermediaries, while producers remained at home. However, MNCs have recently crossed the confines of individualnation-states to carry on their operations throughout the world. Consequently, motives for foreigntrade and investment are too closely interrelated with each other to consider them separately.
2.4.1 Eclectic theory
The eclectic theory, associated with Dunning (1981), attempts to explain a logical link betweenthe international allocation of resources and the exchange of goods between countries. In otherwords, this theory makes the case for an integrated approach to international economic involve-ment based on the advantages of both a country’s location and a company’s ownership. Loca-tion-specific advantages, such as natural resources and low labor costs, are advantages that areavailable only or primarily in a single location. Ownership-specific advantages, such as capitalfunds and technology, are advantages that favor MNCs over local companies. The eclectic theoryimplies that location-specific advantages favor a host foreign country, while ownership-specificadvantages favor an investing firm. Thus, the eclectic theory helps to explain cross-country dif-ferences in patterns of MNCs’ international involvement.
When a company expands its operations beyond national borders for the first time, it tendsto exploit a foreign country’s markets through exports. A company favors investment in a foreigncountry only if it is most profitable for the company to internationalize its advantages in thatcountry. Dunning argues that a company is willing to invest in overseas production facilities ifthe company has the following three kinds of advantages:
1 Ownership-specific advantages: this is the extent to which a company has tangible and intan-gible assets unavailable to other firms.

QUESTIONS 47
SUMMARY
Several theories explain the motives for world trade and foreign investment. The theory of com-parative advantage and the theory of factor endowments explain why countries exchange their goodsand services with each other. The theory of comparative advantage depends on two assumptions.First, economic resources are unequally distributed among nations. Second, efficient production ofvarious products requires combinations of different economic resources and different technologies.
Both the product life cycle theory and the portfolio theory provide a conceptual rationale forforeign investment. The product life cycle theory assumes that a country uses foreign manufactur-ing locations when products approach their maturity point. The portfolio theory maintains that acompany invests overseas because internationally diversified portfolios of assets improve risk–returnperformance.
A synthesis of foreign trade and investment theories is needed to form a single theory of inter-national economic involvement. We can integrate trade and investment theories into a model thatdemonstrates how these theories influence a firm’s choice of entry mode best suited to a particularcountry. The eclectic theory postulates that specific factors of both firm and country are necessaryfor a firm’s foreign investment. When it is most profitable for a multinational firm to interna-tionalize its oligopolistic advantages in a given foreign country, it will invest in that country; oth-erwise, it will exploit the country through exports.
Questions
1 Explain the theory of comparative advantage as a motive for foreign trade. What is thelogic behind this theory?
2 The theory of the product life cycle is used as a motive for foreign trade as well as amotive for foreign investment. Discuss this theory as a motive for both foreign trade andforeign investment.
3 What are economies of scale?4 Describe reasons for trade protectionism.
2 Internalization advantages: it is in the company’s best interest to use its ownership-specificadvantages rather than license them to foreign owners.
3 Location-specific advantages: the company will profit by locating part of its production facil-ities overseas.
It is important to note that empirical tests of the eclectic theory show that the major part offoreign direct investment is made by large, research-intensive companies in oligopolistic indus-tries. These companies find it profitable to invest overseas because they enjoy both location andownership advantages.

48 MOTIVES FOR WORLD TRADE AND FOREIGN INVESTMENT
5 Assume that world leaders attempt to reduce or eliminate artificial barriers to trade through many forms of economic integration. Describe the different types of economiccooperation.
6 What are the major functions of the World Trade Organization?7 What are the major benefits of market integration?8 Why do many companies diversify their operations internationally when there are many
opportunities for domestic diversification?9 Explain the oligopoly model as a motive for foreign direct investment.
10 Lee Nehrt and Dickerson Hogue suggested that companies invest abroad for new markets,raw materials, production efficiency, and new knowledge. Discuss each of these fourmotives for foreign investment.
11 What is the eclectic theory?
Problems
Assume that production possibilities data for the USA and Taiwan are as follows:
Production alternatives
Country Product A B C
USA Clothing 0 30 90Food 30 20 0
Taiwan Clothing 0 20 60Food 15 10 0
1 What is the comparative cost of clothing and food in the USA?2 What is the comparative cost of clothing and food in Taiwan?3 Identify the product that each country should specialize in according to comparative
advantage.4 Assume that both countries decided to specialize in a product according to the compara-
tive advantage. With 1 food = 31/2 clothing terms of trade, the USA exchanges 10 tons ofits food for 35 units of Taiwanese clothing. With the assumption that B is the optimum-product mix, prepare a table such as table 2.2.
5 With a fixed investment of $10,000, the USA produces more in both clothing and foodthan Taiwan. Does this mean that specialization and trade do not provide any benefits forthe USA?

CASE PROBLEM 2 49
REFERENCES
Aharoni, Y., The Foreign Investment Decision Process, Boston, MA: Harvard University Press,1966.
Ball, D. A. and W. H. McCulloch, InternationalBusiness, Homewood, IL: Irwin, 1999, ch. 3.
Coughlin, C. C., “The Controversy Over FreeTrade: The Gap Between Economists and theGeneral Public,” Review, Federal Reserve Bank ofSt. Louis, Jan./Feb. 2002, pp. 1–21.
Dunning, J. H., International Production and theMultinational Enterprise, London: George Allenand Unwin, 1981.
Dunning, J. H. and S. Bansal, “The Cultural Sensitivity of the Eclectic Paradigm,” Multina-tional Business Review, Spring 1997, pp. 1–16.
Gruben, W. C., “Was NAFTA behind Mexico’sHigh Maquiladora Growth?” Economic and
Financial Review, Federal Reserve Bank of Dallas,Third Quarter 2001, pp. 11–21.
Levy, H. and M. Sarnat, “International Diversifi-cation of Investment Portfolios,” American Economic Review, Sept. 1970, pp. 668–75.
National Industrial Conference Board, Obstaclesand Incentives to Private Foreign Investment, NewYork: Conference Board, 1969.
Nehrt, L. and D. W. Hogue, “The Foreign Invest-ment Decision Process,” Quarterly Journal ofAISEC International, Feb.–Apr. 1968, pp. 43–8.
Ronkainen, I. A., “Trading Blocs: Opportunity orDemise for Trade?” Multinational Business Review,Spring 1993, pp. 1–9.
Wall, H. J., “The NAFTA and the Geography of NorthAmerican Free Trade,” Review, Federal Reserve Bankof St. Louis, Mar./Apr. 2003, pp. 13–26.
Case Problem 2: The Fruits of Free TradeUnder the World Trade Organization
The essential difference between free trade and protection is this: Under a system of free tradeexcellence of the product is the only means by which it can secure a market, while under pro-tection an inferior article can dominate the market through the aid of legislation. The neces-sary effect of free trade is, therefore, to encourage efficiency in production, while the necessaryeffect of protection is to encourage skill in corruption. Prosperity is an abundance of com-modities. The merit of any policy or system can be tested by its effect on the volume of com-modities available for the use of the people.
William Bourke Cockran, In the Name of Liberty, 1925
In 1947, in Geneva, 23 countries signed the General Agreement on Tariffs and Trade (GATT),a voluntary association of countries designed to promote free trade. GATT members have heldmany talks since 1947 to expand and promote world trade. As shown in figure 2.3, such talkshave resulted in vast tariff reductions for industrialized countries. Many developing countrieshave implemented similar tariff reductions. These tariff reductions have caused world trade toincrease twice as fast as world output since 1950, thereby boosting the standard of living formillions of people around the world.

50 MOTIVES FOR WORLD TRADE AND FOREIGN INVESTMENT
The general trend around the world since World War II has been to reduce obvious tradebarriers, such as tariffs. Tariff reductions through several rounds of trade negotiations are anindication not only that countries are committed to working jointly toward freer trade but alsothat tariffs are the easiest trade barrier to tackle. In addition, negotiating rounds have dealtwith the increasingly important and complex nontariff issues. Nevertheless, many governmentshave replaced obvious trade barriers with less obvious forms of protection. A growing numberof nontariff barriers, such as those shown in figure 2.4 and others, threaten to undo the goodwork.
The biggest change to emerge from the Uruguay Round of trade negotiations (1986–93)was the agreement to replace the GATT with the World Trade Organization (WTO). Underthe WTO, there is a clearly defined dispute-settlement mechanism. This dispute-settlementsystem allows small and developing countries to have an influence for the first time in dealingwith trade practices in other countries. Further, by bringing cases to the panel, accused coun-tries may agree to settle before a ruling is made. Consequently, the WTO’s settlement bodyhas had a much heavier caseload than existed under the old GATT system. China joined theWTO in 2001, thereby further legitimizing the idea of free trade. As of January 2003, the WTOconsisted of 144 countries and 34 observer countries, all of which are in the process of apply-ing for membership. Based in Geneva, Switzerland, the WTO has a staff of 550 individuals
50
40
30
20
10
01950 1960 1970 1980 1990 2000
Year
(Percentage)
Average tariffson imports inindustrial countries
Figure 2.3 Progress on tariffs
Source: John D. Daniels and Lee H. Radebaugh, International Business, New York: Addison-Wesley, 2002, p. 263.

CASE PROBLEM 2 51
from 60 different countries and a budget of 143 million Swiss francs. Today, WTO membersaccount for 97 percent of world trade.
The WTO is a consensus-based organization: decisions are made by the entire membership.A majority vote is also possible, but it has never been used in the WTO and was extremelyrare under the WTO’s predecessor, GATT. The WTO’s agreements have been ratified in all ofthe members’ legislative bodies. As shown in figure 2.5, the WTO’s top-level decision-makingbody is the Ministerial Conference, which meets at least once every two years. There havebeen five WTO Ministerial Conferences so far, held in Cancun, Mexico (November 2003),Doha, Qatar (November 2001), Seattle, Washington (November 1999), Geneva, Switzerland(May 1998), and Singapore (December 1996).
Below the Ministerial Conference is the General Council, which meets several times a yearin the Geneva headquarters. The General Council also meets as the Trade Policy Review Bodyand the Dispute Settlement Body. At the next level, the Goods Council, the Services Council,and the Intellectual Property Council report to the General Council and meet frequently. Atthe last level, numerous specialized committees, working groups, and working parties deal withthe individual agreements and other areas such as the environment, development, member-ship applications, and regional trade agreements.
The WTO Secretariat, with offices only in Geneva, is headed by a Director-General. Becausedecisions are only made by members, the Secretariat has no decision-making powers. Its main
Year
Nontariff barriers: the new enemies of trade 1 Import quotas 2 Voluntary export restraints 3 Antidumping laws 4 Exchange rate controls 5 Countervailing duties 6 Government subsidies 7 Licensing, labeling, and packaging restrictions 8 Quality controls and technical standards 9 Domestic-content laws10 Political rhetoric11 Embargoes and sanctions12 Most/least-favored nation status
Ratio of duties to imports (%)
30
25
20
15
10
5
01900 1910 1920 1930 1940 1950 1960 1970 1980 1990 2000
Reduced tariff rates lowered trade barriers and helped stimulate economic growth in recent decades. A growing number of nontariff barriers, however, threaten to undo the good. Voluntary export restraints; antidumping laws; government subsidies; licensing, labeling and packaging restrictions; domestic-content laws and others have emerged as the new enemies of free trade.
Figure 2.4 The tax on trade

52 MOTIVES FOR WORLD TRADE AND FOREIGN INVESTMENT
MinisterialConference
General Council meeting asDispute Settlement Body
General Council meeting asTrade Policy Review
BodyGeneral Council Trade Negotiations
Comminitee
Appellate BodyDispute settlement panels
Council forTrade in Goods
Council forTrade in Services
Council forTrade-Related Aspects of
Intellectual PropertyRights
Committees on
Committees on Committees on
Trade and EnvironmentTrade and Development
Subcommittee on Least- Developed Countries
Regional Trade Agreements
Balance of Payments RestrictionsBudget, Finance, and Administration
Working parties on
Working parties on
Working groups on
Accession
The relationship between trade and investment
The interaction between trade and competition policy
Transparency in government procurement
Trade, debt and finance
Trade and transfer of technology
Market AccessAgriculture
Sanitary and Phytosanitary Measures
Trade in Financial Services
Technical Barriers to TradeSubsidies and Countervailing MeasuresAnti-Dumping PracticesCustoms ValuationRules of OriginImport LicensingTrade-Related Investment MeasuresSafeguards
Textiles Monitoring Body
Working party onState-trading enterprises
Committee of Participantson the Expansion of Trade inInformation TechnologyProducts
Specific Commitments
Domestic regulationGATS rules
PlurilateralsCommittee on Trade inCivil Aircraft
Committee on Government Procurement
Council for Trade in Services, Special SessionNegotiating Group on Market AccessNegotiating Group on RulesCommittee on Trade and Environment, Special Session
Committee on Agriculture, Special Session
Committee on Trade and Development, Special Session
Council for TRIPS, Special Session
Dispute Settlement Body, Special Session
Figure 2.5 An organizational chart of the World Trade Organization
duties are to supply technical and professional support for the various councils and commit-tees, to provide technical assistance for developing countries, to monitor and analyze devel-opments in world trade, to provide information to the public and the media, and to organizethe ministerial conferences. The Secretariat also provides some forms of legal assistance in thedispute settlement process and advises governments wishing to become Members of the WTO.

CASE PROBLEM 2 53
Case Questions
1 What are the main responsibilities of the WTO and what enforcement powers does it have?2 What are the reasons for protectionism? Would the World Trade Organization consider any
of them justified?3 Many countries have begun to use less obvious trade barriers as a form of protection. What
are these different approaches and how do they make the WTO’s ability to monitor trademore difficult?
4 Free trade is a highly political issue. Why do you think this is? What steps can be taken tounpoliticize this issue?
5 During the past decade, the WTO has been subject to fierce criticism and attention-grab-bing protests from a variety of political and social groups. Complete some independentresearch on these protests. What are the main criticisms of the WTO that these groupshave? Do you think they are justified?
6 The website of the World Trade Organization, www.wto.org, contains a range of infor-mation about WTO activities. Use this website to find out what steps the WTO has takento respond to the protests and criticism. Do you think that these steps are effective?
Sources: Don Ball and Wendell McCulloch, International Business, New York: Irwin/McGraw-Hill, 2002, ch.3; Cletus C. Coughlin, “The Controversy Over Free Trade: The Gap Between Economists and the GeneralPublic,” Review, Federal Reserve Bank of St. Louis, Jan./Feb. 2002, pp. 1–21; John D. Daniels, Lee H. Radebaugh, and Daniel P. Sullivan, International Business: Environments and Operations, New York: Addison-Wesley, 2002, ch. 6; and Robert D. McTeer, Jr, The Fruits of Free Trade: 2002 Annual Report, Federal ReserveBank of Dallas, 2002.

Opening Case 3: Opportunity Cost and Comparative Advantage
Let’s assume that with a fixed investment of $1 million, the United Kingdom producesmore computers than Australia, while Australia produces more coal than the UK. Thismeans that neither the UK nor Australia has an absolute advantage in producing bothproducts. Consequently, the UK and Australia are better off if each country special-izes in what it produces best and then trades with the other. Does this mean that spe-cialization and trade provide no benefits for a country that produces more in bothproducts than another country with a given amount of investment? Let’s say that LisaSmith, a great trial lawyer, happens to be a very good typist – so good that she issomewhat faster than her secretary, Jack Lee. But just because Lisa can type fasterthan Jack, does this mean that she should? To answer this question, you can use theconcepts of opportunity cost and comparative advantage. Assume that Lisa can typea legal document in 2 hours. In that 2 hours, she could defend her client in the courtand earn $1,000. By contrast, Jack can type the same legal document in 3 hours. Inthat same 3 hours, he could work at McDonald’s and earn $30.
In this example, Lisa’s opportunity cost of typing the document is $1,000 and Jack’sopportunity cost is $30. Lisa has an absolute advantage in typing the documentbecause she can type it in less time. Yet Jack has a comparative advantage in typingthe document because he has the lower opportunity cost. The gains from trade in thisexample are tremendous. Rather than typing the document, Lisa should defend herclient and let Jack type the document. As long as she pays him more than $30 andless than $1,000, both of them are better off.
The original eighteenth-century model of international trade, known as the theoryof comparative advantage, assumes complementary trade. Some countries can
CHAPTER 3
The Balance of Payments

AN OVERVIEW OF THE BALANCE OF PAYMENTS 55
A country’s balance of payments is commonly defined as the record of transactions between itsresidents and foreign residents over a specified period. These transactions include exports andimports of goods and services, cash receipts and payments, gifts, loans, and investments. Resi-dents may include business firms, individuals, and government agencies.
The balance of payments helps business managers and government officials to analyze acountry’s competitive position and to forecast the direction of pressure on exchange rates. Theability of multinational companies (MNCs) to move money across national boundaries is criti-cal. MNCs depend on this ability for exports, imports, payment of foreign debts, and dividendremittances. Many factors affect a firm’s ability to move funds from one country to another. Inparticular, a country’s balance of payments affects the value of its currency, its ability to obtaincurrencies of other countries, and its policy toward foreign investment.
This chapter has three objectives: (1) to define the balance-of-payments accounts, (2) todiscuss the actual balance of payments, and (3) to explain the means for correcting a balance-of-payments deficit.
3.1 An Overview of the Balance of Payments
3.1.1 Sources and uses of funds
The balance of payments is a sources-and-uses-of-funds statement reflecting changes in assets,liabilities, and net worth during a specified period. Transactions between domestic and foreignresidents are entered in the balance of payments either as debits or credits. In other words,balance-of-payments statistics are gathered on a single-entry basis.
In dealing with the rest of the world, a country earns foreign exchange on some transactionsand expends foreign exchange on others. Transactions that earn foreign exchange are often called
produce some goods more efficiently than other countries. Therefore, all countriesbenefit if they specialize in producing goods that they can produce more efficientlythan others and if they buy those goods that other countries can produce more effi-ciently. There are no losers in complementary trade. In other words, differences inopportunity cost and comparative advantage create the gains from specialization andtrade. When each country specializes in producing the good for which it has a com-parative advantage, total production in the world economy rises. And this increase inthe size of the economic pie can be used to make every country around the worldbetter off.
Since the middle of the nineteenth century, the growth sector in the internationaleconomy has been competitive trade between developed countries. Under competi-tive trade, two countries buy from each other similar goods that both can producealmost equally efficiently. In this type of trade, some countries may lose, althoughmost will gain.
Source: N. Gregory Mankiw, Principles of Economics, New York: The Dryden Press, 1997, ch. 45.

credit transactions and represent sources of funds. These transactions are recorded in the balanceof payments as credits and are marked by plus signs (+). The following transactions representcredit transactions:
1 Exports of goods and services.2 Investment and interest earnings.3 Transfer receipts from foreign residents.4 Investments and loans from foreign residents.
Transactions that expend foreign exchange are sometimes called debit transactions and representuses of funds. These transactions are recorded in the balance of payments as debits and are markedby minus signs (-). The following transactions represent debit transactions:
1 Imports of goods and services.2 Dividends and interest paid to foreign residents.3 Transfer payments abroad.4 Investments and loans to foreigners.
We can apply these elementary principles to the recording of transactions in the balance of pay-ments. Some hypothetical transactions may illustrate this single-entry approach.
56 THE BALANCE OF PAYMENTS
Example 3.1
(a) An American company sells $30,000 worth of machinery to a British company (earnforeign exchange); (b) an American woman visits her husband in Japan. She cashes $5,000worth of US traveler’s checks at a Japanese hotel and spends the $5,000 in Japan beforereturning to the United States (expend foreign exchange); (c) the US Red Cross sends$20,000 worth of flood-relief goods to Chile (expend foreign exchange); (d) an Americanpurchases $5,000 worth of French bonds (expend foreign exchange); and (e) a US banklends $10,000 to a Canadian firm for 90 days (expend foreign exchange).
3.1.2 The balance of payments as a whole
A country incurs a “surplus” in its balance of payments if credit transactions exceed debit trans-actions or if it earns more abroad than it spends. On the other hand, a country incurs a “deficit”in its balance of payments if debit transactions are greater than credit transactions or if it spendsmore abroad than it earns.
Essentially, analysts focus on those transactions that occur because of self-interests. These so-called autonomous transactions include exports, imports, unilateral transfers, and investments.The arithmetic sum of these autonomous transactions, sometimes called “above-the-line items,”represents the balance-of-payments surplus or deficit. A balance-of-payments surplus occurs when
autonomous receipts exceed autonomous payments. By the same token, a balance-of-paymentsdeficit takes place when autonomous payments exceed autonomous receipts. On the other hand,compensating transactions occur to account or compensate for differences between internationalpayments and receipts. These compensating items, called “below-the-line items,” are used to elim-inate international disequilibrium.
Surpluses and deficits in the balance of payments are of considerable interest to banks, com-panies, portfolio managers, and governments. They are used to:
1 Predict pressures on foreign-exchange rates.2 Anticipate government policy actions.3 Assess a country’s credit and political risks.4 Evaluate a country’s economic health.
The transactions of cases (a)–(e) in example 3.1 represent autonomous transactions. In case (a),the export of US machinery earns a foreign exchange of $30,000 and is thus a credit. Transac-tions of cases (b)–(e) cause the USA to expend a foreign exchange of $40,000 and are thereforedebits. Consequently, the USA has an overall deficit of $10,000 in its balance of payments andmust undertake $10,000 worth of compensating transactions to make up the difference. In thiscase, the compensating transactions of the USA involve sales of its gold, reductions in its balanceof convertible foreign currencies, or increases in the balance of the US dollars held by othernations.
Now, for a moment, suppose that the USA has a surplus in its balance of payments ratherthan a deficit. To account for this surplus in the US balance of payments, US reserves, such asgold and convertible foreign currencies, would increase by $10,000, or the balance of the USdollars held by other nations would decrease by $10,000. These transactions, designed to accountfor the surplus in the balance of payments, are also called compensating transactions.
3.2 Balance-of-Payments Accounts
The balance of payments identifies transactions along functional lines. The International Mon-etary Fund (IMF) classifies balance-of-payments transactions into five major groups:
A The current account: merchandise, services, income, and current transfers.B The capital account: capital transfers, nonproduced assets, and nonfinancial assets.C The financial account: direct investments, portfolio investments, and other investments.D Net errors and omissions.E Reserves and related items.
We can classify balance-of-payments transactions into several different groups. However, it isimportant to note that a country interacts with other countries in two ways. First, it buys andsells goods and services in world product markets. Second, it buys and sells financial assets inworld financial markets. You could use your $3,000 to buy a personal computer from Toshiba,but instead you could use that money to buy stock in the Toshiba Corporation. The first trans-action would represent a flow of goods, while the second would represent a flow of financialassets. Here we discuss these two activities and the close relationship between them.
BALANCE-OF-PAYMENTS ACCOUNTS 57

The IMF format in table 3.1 below is regarded as useful for analyzing balance-of-paymentsdevelopments in a uniform manner. In other words, the format facilitates a variety of analyticperspectives. Each of the five major data categories has a name and a particular analytic use. Table3.1 also shows data codes, which are used by the IMF and other international organizations tofacilitate international data reporting.
3.2.1 The current account – group A
BALANCE ON GOODS Balance on goods refers to the balance between exports and imports ofphysical goods such as automobiles, machinery, and farm products. Merchandise exports andimports are the largest single components of total international payments for most countries. Ineach year from 1995 to 2002, the USA ran a deficit on its trade balance. In 2002, the USAexported $685 billion of merchandise and imported $1,165 billion for a balance on goods of$479 billion. The minus sign for a balance indicates a deficit.
SERVICES International trade involves exports and imports of both goods and services. Servicesinclude such invisible items as insurance and financial services, travel and transportation, com-puter and information services, plus fees and royalties. A country’s purchases of services repre-sent imports with debits recorded. A country’s sales of these services to foreigners represent exportswith credits recorded. The balance between exports and imports of goods and services is calledthe balance on goods and services.
These services represent a significant portion of the overall balance of payments for manyindustrial countries. For example, table 3.1 shows that US exports of services have consistentlyexceeded US imports of services by an appreciable margin. In fact, service transactions have playeda crucial role in lowering the US trade deficit, but this has tended to escape our attention forseveral reasons. First, some service-trade categories reflect transactions that rarely come to mindwhen the topic is trade. Second, service items have remained a relatively minor part of the overalltrade volume. Third, international trade negotiations have tended to focus on barriers to mer-chandise trade.
INCOME Income on investments includes interest, dividends, and compensation of employees.Investment income represents the flow of earnings from foreign direct and portfolio investmentsmade in prior years. For example, the income that US investors currently earn on their previousforeign investments falls into the income balance. The initial foreign investment of capital,however, was a capital outflow recorded in either the capital account or the financial accountduring the year when it was originally made. The balance of exports and imports between goods,services, and investment income is known as the balance on goods, services, and income. In 2002,the USA earned $256 billion in income while paying out $260 billion.
CURRENT TRANSFERS All transfers that are not transfers of capital are current transfers; theydirectly affect the level of disposable income and should influence the current consumption ofgoods and services. Current transfers include gifts and grants by both private parties and govern-ments. Private gifts and grants include personal gifts of all kinds, philanthropic activities, and ship-ments by relief organizations. For example, money sent by immigrants to their families in their
58 THE BALANCE OF PAYMENTS

native countries represents private transfers. Government transfers include money, goods, and ser-vices given as aids to other countries. For instance, goods and services provided by the US gov-ernment to other countries as part of a drought relief program represent government transfers.
THE CURRENT ACCOUNT The current account includes merchandise exports and imports,earnings and expenditures for invisible trade items (services), income on investments, and currenttransfers. Entries in this account are “current” in nature because they do not give rise to futureclaims. The balance of payments on the current account is the broadest measure of a country’sinternational trade because it includes investment income as well as trade in goods and services.A surplus on the current account represents an inflow of funds, while a deficit represents anoutflow of funds.
The first line in table 3.1 shows that the US deficit on current account reached a peak of $481billion in 2002. In 1991, the USA enjoyed a rare surplus of $4 billion in its balance on currentaccount (table 3.1 does not show this figure). Analysts view the actual balance on current accountas a deficit of approximately $39 billion, because $43 billion of US receipts in 1991 were currenttransfers from Gulf War (Desert Storm) allies.
3.2.2 The capital account – group B
The capital account consists of capital transfers and the acquisition or disposal of nonproduced,nonfinancial assets. The major types of capital transfers include the transfer of title to fixed assets,the transfer of funds linked to the sale or acquisition of fixed assets, debt forgiveness by credi-tors, and migrants’ transfers of goods and financial assets as they leave or enter the country. Non-produced, nonfinancial assets include the sale or purchases of nonproduced assets (i.e., the rightsto natural resources) and the sale or purchases of intangible assets (i.e., patents, copyrights, trade-marks, and leases). Though conceptually important, capital-account transactions are generallysmall in most countries.
3.2.3 The financial account – group C
The financial account consists of foreign direct investments, foreign portfolio investments, andother investments. Foreign direct investments (FDIs) are equity investments such as purchasesof stocks, the acquisition of entire firms, or the establishment of new subsidiaries. The US Depart-ment of Commerce defines FDI as investments in either real capital assets or financial assets witha minimum of 10 percent ownership in a foreign firm. If McDonald’s opens up a fast-food outletin Germany, that is an example of foreign direct investment.
Up to 1995, the USA ran a huge deficit in its FDI flows, which means that Americans investedmore abroad than did foreigners in the USA. The US deficit in FDI flows, however, has declinedrapidly in recent years; in 1997, foreigners invested more in the USA than did US residents inforeign countries. Some of this change in directions was caused by the strong economic perfor-mance of the USA during the late 1990s; prospects for the US economy had been sufficientlybright for Americans and foreigners to make investment in the USA more attractive than invest-ment elsewhere. FDI inflows into the USA have dropped since 2000, as the boom in the USeconomy and its stock market ended in March 2000.
BALANCE-OF-PAYMENTS ACCOUNTS 59

Tabl
e 3.
1Th
e U
S ba
lanc
e of
pay
men
ts (
billi
ons
of U
S do
llars
)
Cod
e19
9519
9619
9719
9819
9920
0020
0120
02
A.
Cur
rent
acc
ount
*49
93 Z
.-1
05.1
9-1
17.1
6-1
27.6
8-2
04.6
7-2
90.8
7-4
11.4
6-3
93.7
4-4
80.8
6G
oods
: ex
port
s f.
o.b
2100
. .57
7.04
614.
0168
0.33
672.
3868
6.27
774.
6372
1.84
685.
38G
oods
: im
port
s f.
o.b
3100
. .-7
49.3
7-8
03.1
1-8
76.5
1-9
17.1
2-1
,029
.99
-1,2
24.4
3-1
,145
.95
-1,1
64.7
6B
alan
ce o
n go
ods
4100
. .-1
72.3
3-1
89.1
0-1
96.1
8-2
44.7
4-3
43.7
2-4
49.7
9-4
24.1
1-4
79.3
8Se
rvic
es:
cred
it22
00. .
216.
6923
6.89
253.
5526
0.19
279.
2029
5.42
285.
7428
8.72
Serv
ices
: de
bit
3200
. .-1
39.4
3-1
50.6
3-1
64.4
4-1
78.5
9-1
96.7
0-2
21.0
1-2
19.4
4-2
27.3
8B
alan
ce o
n go
ods
and
serv
ices
4991
..-9
5.07
-102
.84
-107
.06
-163
.14
-261
.23
-375
.38
-357
.82
-418
.04
Inco
me:
cre
dit
2300
..21
1.96
226.
2826
1.05
258.
6629
0.20
346.
8627
7.36
255.
54In
com
e: d
ebit
3300
..-1
86.8
9-2
01.7
4-2
40.3
7-2
51.7
4-2
73.0
9-3
27.2
5-2
66.6
7-2
59.5
1B
alan
ce o
n go
ods,
ser
vice
s, a
nd i
ncom
e49
92..
-70.
00-7
8.30
-86.
38-1
56.2
3-2
44.1
2-3
55.7
8-3
47.1
3-4
22.0
1C
urre
nt t
rans
fers
: cr
edit
2379
Z.
8.64
10.3
99.
869.
648.
8510
.78
8.56
11.5
0C
urre
nt t
rans
fers
: de
bit
3379
..-4
3.82
-49.
25-5
1.16
-58.
07-5
5.60
-66.
46-5
5.18
-70.
35B
.C
apit
al a
ccou
nt*
4994
Z.
-.93
-.65
-1.0
4-.
74-4
.84
-.80
-1.0
6-1
.29
Cap
ital a
ccou
nt:
cred
it29
94 Z
.1.
03.8
9.8
3.9
31.
081.
081.
051.
11C
apita
l acc
ount
: de
bit
3994
..-1
.96
-1.5
5-1
.87
-1.6
7-5
.92
-1.8
7-2
.11
-2.3
9To
tal,
grou
ps A
plu
s B
4981
..-1
06.1
2-1
17.8
1-1
28.7
2-2
05.4
1-2
95.7
1-4
12.2
6-3
94.8
0-4
82.1
4C
.Fi
nanc
ial
acco
unt*
4995
W.
95.9
113
0.54
220.
1882
.51
227.
8245
6.63
420.
5053
1.68
Dire
ct in
vest
men
t ab
road
4505
..-9
8.78
-91.
88-1
04.8
2-1
42.6
4-2
24.9
3-1
59.2
1-1
19.9
6-1
37.8
4D
irect
inve
stm
ent
in U
nite
d St
ates
4555
Z.
57.8
086
.52
105.
5917
9.03
289.
4432
1.27
151.
5839
.63
Port
folio
inve
stm
ent
asse
ts46
02..
-122
.51
-149
.83
-118
.98
-124
.20
-116
.24
-121
.91
-84.
6415
.80
Equi
ty s
ecur
ities
4610
..-6
5.41
-82.
85-5
7.58
-101
.36
-114
.31
-106
.71
-109
.10
-17.
68D
ebt
secu
ritie
s46
19..
-57.
10-6
6.98
-61.
40-2
2.84
-1.9
3-1
5.19
24.4
733
.48
Port
folio
inve
stm
ent
liabi
litie
s46
52 Z
.21
0.35
332.
7833
3.11
187.
5628
5.60
420.
0042
5.08
421.
44Eq
uity
sec
uriti
es46
60..
16.5
211
.06
67.0
341
.96
112.
2919
3.60
121.
4253
.20
Deb
t se
curit
ies
4669
Z.
193.
8332
1.72
266.
0814
5.61
173.
3122
6.40
303.
6636
8.24
Fina
ncia
l der
ivat
ives
4910
....
....
....
....
....
....
....
....
..Fi
nanc
ial d
eriv
ativ
es a
sset
s49
00..
....
....
....
....
....
....
....
....
Fina
ncia
l der
ivat
ives
liab
ilitie
s49
05..
....
....
....
....
....
....
....
....
Oth
er in
vest
men
t as
sets
4703
..-1
21.3
8-1
78.8
7-2
62.8
2-7
4.20
-171
.22
-288
.39
-140
.43
-53.
27M
onet
ary
auth
oriti
es47
01..
....
....
....
....
....
....
....
....
Gen
eral
gov
ernm
ent
4704
..-.
98-.
99.0
7-.
422.
75-.
94-.
49-.
03Ba
nks
4705
.. .
-75.
11-9
1.56
-141
.12
-35.
57-7
6.26
-148
.66
-134
.95
-21.
36O
ther
sec
tors
4728
..-4
5.29
-86.
33-1
21.7
7-3
8.20
-97.
70-1
38.7
9-5
.00
-31.
88O
ther
inve
stm
ent
liabi
litie
s47
53 W
.17
0.43
131.
8226
8.09
56.9
616
5.17
284.
8618
8.87
245.
91M
onet
ary
auth
oriti
es47
53 W
A46
.72
56.8
8-1
8.85
6.88
24.5
9-6
.70
35.2
964
.91
Gen
eral
gov
ernm
ent
4753
ZB
.90
.73
-2.7
0-3
.25
-.98
-.39
-4.7
82.
66Ba
nks
4753
ZC
64.1
822
.18
171.
3130
.27
67.2
012
2.72
88.4
010
8.72
Oth
er s
ecto
rs47
53 Z
D58
.63
52.0
311
8.33
23.0
774
.37
169.
2469
.96
69.6
2To
tal,
grou
ps A
thr
ough
C49
83..
-10.
2112
.73
91.4
6-1
22.8
9-6
7.89
44.3
725
.70
49.5
4D
.N
et e
rror
s an
d om
issi
ons
4998
..19
.96
-19.
39-9
0.45
129.
6359
.16
-44.
08-2
0.77
-45.
84To
tal,
grou
ps A
thr
ough
D49
84..
9.75
-6.6
71.
016.
73-8
.73
.29
4.93
3.69
E.R
eser
ves
and
rela
ted
item
s48
02 A
.-9
.75
6.67
-1.0
1-6
.73
8.73
-.29
-4.9
3-3
.69
Res
erve
ass
ets
4802
..-9
.75
6.67
-1.0
1-6
.73
8.73
-.29
-4.9
3-3
.69
Use
of
Fund
cre
dit
and
loan
s47
66..
....
....
....
....
....
....
....
....
Exce
ptio
nal fi
nanc
ing
4920
....
....
....
....
....
....
....
....
..
*Exc
lude
s co
mpo
nent
s th
at h
ave
been
cla
ssifi
ed in
the
cat
egor
ies
of G
r oup
E.
Sour
ce:
The
Inte
rnat
iona
l Mon
etar
y Fu
nd,
Bal
ance
of
Paym
ents
and
Sta
tist
ics
Year
book
, 20
03,
p. 9
57.

Foreign portfolio investments are purchases of foreign bonds, stocks, financial derivatives,or other financial assets without a significant degree of management control. Desires for return,safety, and liquidity in investments are the same for international and domestic portfolioinvestors. However, international portfolio investments have additional risks such as changes inexchange rates, wars and revolutions, and expropriations. Portfolio investments in utilities, gov-ernments, and government agencies are active because the risk of loss in these fields is less thanin other fields. If an American buys bonds in the Volkswagen Corporation of Germany, that isan example of foreign portfolio investment. In each year from 1995 to 2002, the USA ran a hugesurplus in its balance on financial account, which means that foreigners purchased US securitiesmore than did Americans foreign securities.
Other investments include changes in trade credit, loans, currency, and deposits. Both port-folio investment and other investments consist of short-term capital flows and long-term capitalflows. Some short-term capital flows occur due to changes in the current account or changes inlong-term investment. More specifically, these changes may take place because of merchandisetrade, service trade, current transfers, and investments. Short-term capital movements inducedby such transactions are sometimes called compensating or accommodating adjustments. Thesecompensating accounts change only for one reason – to finance other items in the balance ofpayments. In contrast, other short-term flows are attributable to differences in interest ratesamong nations and to expected changes in foreign-exchange rates. Short-term capital movementscaused by such changes are frequently called autonomous adjustments. These autonomousaccounts change for purely economic reasons.
3.2.4 Net errors and omissions – group D
In theory, the balance of payments should always actually balance, because all debits are offsetby credits and vice versa. But it rarely does balance in practice, for a number of reasons. Balance-of-payments data gathered from many different sources are incomplete and may be interpreteddifferently by individuals and agencies. Many transactions are not recorded but are known tohave occurred because other components of the balance of payments reveal an imbalance. Thus,the debits and credits may not balance at the end of a year. This is why the net errors and omis-sions are treated as a “plug” item to keep the balance-of-payments accounts in balance.
Net errors and omissions occur for several reasons. First, they may be due to unreportedforeign funds coming to a country for investment in some form of asset. Second, increased tradingin foreign currencies, in combination with the flexible exchange system, undoubtedly introduceslarge errors in payments figures. Third, because most data on the balance of payments dependon personnel in banks and other business offices completing federal forms, these people some-times make multimillion-dollar mistakes.
TOTAL – GROUPS A–D Usually known as the overall balance of payments or above-the-lineitems, this balance is the net result of trading, capital, and financial activities. It constitutes thesum of all autonomous transactions that must be financed by the use of official reserves. Theoverall balance of payments is often used to evaluate a country’s competitive position in termsof all private transactions with the rest of the world. Table 3.1 shows that the overall balance ofthe USA has been relatively small in recent years.
BALANCE-OF-PAYMENTS ACCOUNTS 61

3.2.5 Reserves and related items – group E
Group E consists of official reserve assets, the use of IMF credit and loans, and exceptional financ-ing. These categories represent only purchases and sales by official monetary authorities, such asthe Federal Reserve System of the USA or the Bank of England. Changes in reserves and relateditems are necessary to account for the deficit or surplus in the balance of payments.
Reserve assets are government-owned assets. They include monetary gold, convertible foreigncurrencies, deposits, and securities. For most countries, the principal convertible currencies arethe US dollar, the British pound, the euro, and the Japanese yen. Credit and loans from the IMFare usually denominated in special drawing rights. Special drawing rights (SDRs), sometimescalled “paper gold,” are rights to draw on the IMF. SDRs can be used as means of internationalpayment. Exceptional financing is financing mobilized by a country’s monetary authorities thatis not regarded as official reserves. Examples of this account include postponing the repaymentof foreign-currency debt and drawing on private bank loans to finance transactions that wouldotherwise deplete the country’s reserve assets.
The reserve account of a country also includes its liabilities to foreign official holders, whichconstitute foreign authorities’ reserves. A country’s liabilities to foreign official holders are some-times called its foreign reserve assets. For example, US liabilities to foreign official holders, suchas the European Central Bank or the Bank of Japan, refer to foreign official deposits with USbanks and official holdings of US Treasury securities. Foreign governments frequently wish tohold such assets in the USA because of their interest earnings.
Foreign currencies account for approximately 90 percent of the total reserve assets held byIMF member countries. Among foreign exchanges, the US dollar has been, and still is, the mostimportant asset. Table 3.2 shows that the dollar share of world foreign-exchange reserves declinedfrom 1987 to 1990, increased from 1993 to 1998, and has been relatively flat at around 68percent since 1998.
Some economists forecast that the dollar, which represented 76 percent of world reserves in1976, will lose market share in the years ahead. Because Europe created its new single currency,known as the euro (€), on January 1, 1999, some governments and many private investors arelikely to switch some of their reserves out of dollars and into euros. The creation of the euro isregarded as the most important development in the international monetary system since the end
62 THE BALANCE OF PAYMENTS
Table 3.2 The US dollar as a fraction of government reserves around the world
Year Dollar as percent of total reserves Year Dollar as percent of total reserves
1987 56.1% 1995 57.0%1988 55.3% 1996 60.3%1989 52.0% 1997 62.4%1990 50.1% 1998 65.9%1991 51.3% 1999 68.4%1992 55.3% 2000 68.2%1993 56.7% 2001 68.3%1994 56.6% 2002 68.6%
Source: The International Monetary Fund, Washington, DC.

of the Bretton Woods Agreement in 1973. In addition, many governments desire to diversifytheir reserve portfolios.
The net result of all activities in groups A–D in table 3.1 must be financed by changes inreserves and related items. Thus, these two items – “Total, groups A–D” and “Group E” – areidentical except that the sign is reversed. In other words, the net result of all activities in groupsA–D was financed by various accounts in group E.
ACCOUNTING TREATMENT OF THE RESERVE ACCOUNT The reserve account presents a greatdifficulty when one tries to classify its transactions either as debits or credits. On the one hand,an increase in any of the reserve assets represents a use of funds or a debit entry (-) in the balanceof payments. On the other hand, a decrease in any reserve asset indicates a source of funds or acredit entry (+). By the same token, a decrease in any official liability is entered as a debit, andan increase in any official liability is recorded as a credit. In other words, any transaction thatfinances the balance-of-payments surplus should be recorded as a debit (increase in reserve assetsand decrease in official liability); any transaction that finances the balance-of-payments deficitshould be recorded as a credit (decrease in reserve assets and increase in official liability).
3.2.6 The balance-of-payments identity
We have seen that a country interacts with the rest of the world in two ways: world markets forgoods and services (the current account) and world markets for financial assets (net foreigninvestment = capital account, financial account, net errors and omissions, plus reserves and relateditems). The current account and net foreign investment each measure a type of imbalance inthese markets. The current account measures an imbalance between a country’s exports andimports. Net foreign investment measures an imbalance between the amount of foreign assetsbought by domestic residents and the amount of domestic assets bought by foreigners.
The balance-of-payments identity states that the combined balance of the current account(CuA), the capital account (CaA), the financial account (FiA), net errors and omissions (NEO),and reserves and related items (RR) must be zero:
(3.1)
In other words, current-account deficits or surpluses are offset by corresponding net foreign-investment surpluses or deficits. An important fact of accounting states that for an economy asa whole, these two imbalances must offset each other. Under this assumption, current accountis equal in size, but opposite in sign, to net foreign investment. Thus, equation 3.1 is the balance-of-payments identity that must hold.
3.3 The Actual Balance of Payments
3.3.1 Major-country balances on current and financial accounts
Table 3.3 shows the current-account balances of China, Germany, Japan, the UK, and the USAfrom 1994 to 2001. Several inferences may be drawn from the table. First, the two largest
CuA CaA FiA NEO RR+ + + + = 0
THE ACTUAL BALANCE OF PAYMENTS 63

economies in the world – the USA and Japan – have incurred massive current-account imbal-ances since 1994. Second, the British current-account balance has been in large deficit since 1999.Third, the Chinese current-account balance has increased sharply since 1994.
The current-account balances of China, Japan, and the USA since 1995 largely reflect theAsian financial crisis of 1997–8. Several factors have been singled out as leading causes of a hugerise in the US deficit for current-account balance from 1998 to 2002: faster economic growthin the USA than in its major trading partners, the strong US dollar, and reduced US exports tothose Asian countries hit hard by the Asian crisis.
Table 3.4 shows the financial-account balances of China, Germany, Japan, the UK, and theUSA from 1994 to 2002. Apparently, the US current-account deficit was largely offset by massiveinflows of capital (the financial account). On the other hand, the financial account of Japan,which reflects the net financial outflow from the trade surplus, has been systematically negative.China had mostly maintained surpluses in both the current account and the financial accountuntil 1996, thereby increasing its reserve assets. After 1996, however, China’s current-accountsurplus declined until 2001 and its financial-account balance had reversed as it entered the WTOin 2001.
3.3.2 The world balance of payments
Table 3.5 shows that the expansion of world trade averaged 6.4 percent per year between 1991and 1999, while the growth of global output averaged only 2.4 percent per year during the same
64 THE BALANCE OF PAYMENTS
Table 3.3 Major-country balances on current account (billions of US dollars)
Country 1994 1995 1996 1997 1998 1999 2000 2001 2002
China 7 2 7 37 31 21 21 17 32Germany -21 -19 -8 -3 -6 -19 -20 2 46Japan 130 114 66 97 119 115 120 87 112UK -10 -14 -13 -3 -8 -32 -29 -29 -14USA -118 -106 -118 -128 -204 -293 -410 -393 -480
Source: The International Monetary Fund, Balance of Payments Statistics Yearbook, 2002 and 2003, variouspages.
Table 3.4 Major-country balances on financial account (billions of US dollars)
Country 1994 1995 1996 1997 1998 1999 2000 2001 2002
China 2 16 8 -14 -13 -3 -9 -12 -42Germany 32 37 5 5 4 16 41 -21 -75Japan -110 -123 -63 -127 -106 -115 -127 -89 -109UK 3 8 9 -8 0 32 21 28 12USA 130 86 137 219 64 265 409 382 527
Source: The International Monetary Fund, Balance of Payments Statistics Yearbook, 2002 and 2003, variouspages.

period. As a result of the 1997–8 Asian crisis, world output grew 1.9 percent in 1998 and 2.9percent in 1999. With such a slow output growth, world trade growth fell from 1997’s excep-tional 9.5 percent, but maintained a 4–5 percent pace in 1998 and 1999. These statistics indi-cate that the share of production traded increased substantially during the 1990s; this reflects therelative openness of markets and the ongoing integration of the global economy.
The value of world merchandise trade reached a new record of $6 trillion in 2002. Table 3.5shows that world trade had grown about 2.7 times as fast as world output in the 1990s. In 2001,world merchandise grew slower than world output for the first time in modern history, perhapsdue to the September 11, 2001, attacks. However, the World Bank forecasts that world mer-chandise trade will grow two or three times as fast as world output from 2002 through 2005again. It seems that the excess of trade over output in the twenty-first century will be as great asthat in the 1990s. The head of economic research at the World Trade Organization has said thatthe gap between exports and output “is the handiest practical measurement of the pace of glob-alization” of manufacturing.
Globalization represents a huge opportunity for countries at all levels of development. Therapid increase in trade volume over the past 30 years has been one of the most important factorsin the rise of living standards across the globe. Because a fresh wave of market-opening initia-tives alters economies, many forecasts predict an annual global-trade growth of 10 percent forthe next two decades.
3.3.3 The international investment position
Trade balance is a flow concept because it measures the economic activities of a country over a1-year period. The international investment position is a stock concept because it summarizesa country’s assets and liabilities on a given date. Tables 3.6 and 3.7 show the international invest-ment position of the USA and of Japan from 1994 to 2002.
These two tables reveal striking differences in the international investment position betweenthe two countries. First, the USA is the largest net debtor nation in the world, while Japan is thelargest net creditor nation. For the USA and Japan over the same period, a largely reciprocal rela-
THE ACTUAL BALANCE OF PAYMENTS 65
Table 3.5 World merchandise trade
Year(s) World trade growth World output growth
1991–9 6.4% 2.4%2000 13.1% 3.8%2001 0.4% 1.2%2002 3.0% 1.7%2003f 6.2% 2.3%2004f 8.1% 3.2%2005f 8.1% 3.1%
Note: f = forecast.Sources: The World Bank, Global Development Finance, Washington,DC, 2000, 2003, and 2004, various pages.

tionship is evident. Growth in the net international investment position of the USA coincidedwith the rapid increase of Japan’s net investment position during the 1990s. The US net over-seas investment evolved steadily from $6 billion in 1919 to $358 billion in 1983. This long-termincrease in the US net investment position has decreased dramatically since 1983. In 1987, theUSA became a net debtor nation for the first time since World War I. As shown in table 3.7, itsforeign debt reached $2.6 trillion in 2002. This is about 60 percent of the combined total debtof some 140 developing countries. Huge trade and budget deficits, caused by major shifts inmacroeconomic policy in the first half of the 1980s, turned the USA from creditor to debtor.Persistent trade and budget deficits, along with more foreign acquisitions of US assets than USacquisitions of foreign assets, caused US foreign debt to grow continually.
Second, FDI in the US accounts for approximately 35 percent of foreign assets in the USA,but FDI in Japan amounts to about 10 percent of foreign assets in Japan. Critics charge thatJapanese firms participate in keiretsu to insulate themselves from outside competitors in all aspects
66 THE BALANCE OF PAYMENTS
Table 3.6 The international investment position of the USA (billions of US dollars)
Type of investment 1994 1996 1998 1999 2000 2001 2002
US assets 3,327 4,631 6,174 7,387 7,351 6,863 6,473Direct investment 1,115 1,608 2,280 2,805 2,674 2,289 2,036Portfolio investment 949 1,468 2,053 2,583 2,389 2,111 1,847Other investment 1,100 1,394 1,695 1,863 2,160 2,333 2,432Reserve assets 163 161 146 136 128 130 159
US liabilities 3,450 5,018 7,269 8,441 8,934 9,172 9,079FDI 758 1,229 2,179 2,798 2,766 2,527 2,007Portfolio investment 1,414 2,291 3,217 3,605 3,866 4,132 4,339Other investment 1,278 1,498 1,873 2,038 2,302 2,513 2,733
Net position -123 -387 -1,095 -1,583 -1,583 -2,309 -2,605
Sources: The International Monetary Fund, Balance of Payments Statistics Yearbook, 2002 and 2003, variouspages.
Table 3.7 The international investment position of Japan (billions of US dollars)
Type of investment 1994 1996 1998 1999 2000 2001 2002
Japanese assets 2,424 2,653 2,986 3,013 2,970 2,882 3,052Direct investment 276 259 270 249 278 300 304Portfolio investment 859 933 1,056 1,242 1,306 1,290 1,394Other investment 1,162 1,243 1,444 1,234 1,025 892 882Reserve assets 127 218 216 288 361 400 468
Japanese liabilities 1,734 1,762 1,833 2,185 1,812 1,521 1,590Direct investment 19 30 26 46 50 50 78Portfolio investment 631 556 633 1,165 884 666 610Other investment 1,084 1,176 1,174 974 878 805 898
Net position 690 891 1,153 858 1,158 1,361 1,462
Sources: The International Monetary Fund, Balance of Payments Statistics Yearbook, 2002 and 2003, variouspages.
of operations. In Japanese, the word “keiretsu” stands for large, financially linked groups of com-panies, but foreign critics translate it as meaning something else – an “economic barrier to non-Japanese companies.” They wag their fingers at keiretsu as barriers to everything: trade, FDI inJapan, and financing for Japanese firms in the USA. The relatively small amount of FDI in Japanindicates that Japanese firms are more sheltered from foreign competition in their home marketthan firms in other industrial countries.
Third, the USA’s other investment abroad accounts for nearly 30 percent of its total foreignassets, while Japan’s amounts to more than 45 percent. Most of the other investments are short-term capital flows such as trade credit, short-term bank loans, and currency. Moreover, portfo-lio investments also include short-term capital flows such as short-term government securitiesand money market funds. Apparently, Japan keeps most of its foreign assets in short-term capitalas compared with the USA and other industrial countries, which do not. No wonder, then, somany Japanese banks are still suffering from bad short-term loans that they have made abroadin the past.
Net international investment positions themselves are not particularly meaningful. This is whymany economists look at three broad categories of the international investment position: directinvestment, portfolio investment, and other investment. In other words, analysts break downinternational investment holdings into several categories so that they can draw policy implica-tions from each category about the liquidity status of a country.
Short-term foreign assets in the USA, such as bank deposits and government securities, aremeaningful because foreigners can withdraw these holdings on very short notice. For example,if they fear capital losses from further depreciation of the dollar, or if interest rates decline, foreigninvestors may turn away from dollar-denominated short-term assets. Such actions by foreigninvestors may endanger the stability of the US financial system. Foreign official assets in the USAare also significant. If foreign monetary authorities decide to liquidate their holdings of US gov-ernment securities, the financial strength of the dollar will fall. Long-term investments, such aslong-term corporate securities and direct investment, are less important because they respond tobasic economic trends and are not subject to erratic withdrawals.
THE ACTUAL BALANCE OF PAYMENTS 67
Global Finance in Action 3.1Is there Another Wave of American Decline?
The collapse of the Soviet Union in 1991, along with the unusually strong perfor-mance of both the US economy and its stock market during the 1990s, elevated theUSA to unsurpassed economic, militarily, and cultural power. However, in the early2000s, the USA faced another wave of decline since the 1950s, a phenomenon largelytriggered by its economic problems. Every single empire and great nation of historyhas been destroyed or has greatly diminished in world influence. Why should weassume that the USA, today’s great nation, could prevail over the pattern of history?If we assume for the moment American decline, the European Union or China seemslikely to emerge as a great power, which might end the dominance of the USA in the

68 THE BALANCE OF PAYMENTS
game of influence on world affairs. We can base the current wave of decline on threebodies of evidence: (1) mounting US budget and trade deficits; (2) continuing declinesin the US economy and its stock market; and (3) a growing European Union’s resis-tance to American unilateral actions.
A massive tax cut of $1.7 trillion and a military buildup larger than during the ColdWar shifted the government budget from a record surplus of $387 billion predictedfor 2004 a few years beforehand to a record deficit of $500 in 2004 itself. Observersbelieve that this huge budget deficit is unsustainable and thus will eventually ruin theUS economy.
It is no secret that US economic expansion in the 1990s had been sustained withmoney borrowed abroad. American companies accrued huge debts, often to buy backcompany shares. American consumer debt is enormous and continues to grow, withno end in sight. In addition, the spending boom has generated record trade deficits,including $500 billion in 2002. To finance current-account deficits, the USA has beenforced to borrow approximately $2 billion every working day, most of which comesfrom foreign investors. Japanese and other foreign investors continue to fund the USeconomy even today (see figure 3.1), but the boom in the US economy and its stockmarket ended in 2000. In addition, nobody thinks that this kind of inflow can be sus-tained indefinitely as war and terrorism fears mount, a change that may boost theinflation rate and hurt corporate profits, the US dollar, and investment returns. Thefinancial reversal would also bring about the collapse of US security policy and of itscalculated strategy of world pacification.
When President George W. Bush took office on January 25, 2000, his aides assuredallies that America was a team player and would practice “multilateralism.” However,Bush opposed a considerable number of multilateral treaties and agreements within6 months of taking office. Consequently, Bush encountered hostility from US allies inEurope, Asia, and other parts of the world, as the USA shifted its foreign policy frommultilateralism under the Clinton Administration to unilateralism under the BushAdministration. Critics charge that international crises, such as arms conflicts in Iraqand North Korea, simultaneously are “the natural consequences of Bush’s unilateral-ism, his militaristic new doctrine of preemption, and his insistence on expanding ajustified war against al Qaeda to a misconstrued axis of evil.”
The weak performance of both the US economy and its stock market in the pastfew years, the sinking confidence of American people in their government’s ability togovern, and a growing anti-Americanism around the world indicate a possible declineof US power economically and militarily. A decline in American hegemony may playitself out over this decade and the next. In turn, the USA could lose interest in playingthe role of global protector, as the European Union becomes a new center of globalpower and renews competition for international dominance. If the USA is compelledto give away its global power to a more dangerous environment, the chief threat maycome not from the likes of Osama bin Laden, but from the return of traditional geopo-litical rivalry.
Source: S. H. Kim, North Korea at a Crossroads, Jefferson, NC: McFarland, 2003, ch. 9.

Countries that export capital1
Countries that import capital3
Other countries2
24.4%
Other countries4
12.4%
Japan20.2%
Russia7.3%
Norway6.0%Switzerland
5.7%
France5.5%
Canada4.5%
Taiwan4.4%
Singapore 4.0%
China 4.0%
Saudi Arabia3.3%
Belgium 3.0%
Hong Kong SAR2.8%
The Netherlands 2.4%
Kuwait 2.4%
Australia 1.6%Portugal 1.8%
Spain 2.7%Mexico 3.1%Brazil4.1%
UK5.2%
USA69.2%
Source: International Monetary Fund, World Economic Outlook database.1As measured by countries’ current (capital) account surplus (deficit).2Other countries include all countries with shares of total surplus less than 2.4%.3As measured by countries’ current (capital) account deficit (surplus).4Other countries include all countries with shares of total deficit less than 1.6%.
Figure 3.1 Global capital flows: sources and uses of global capital in 2001
Source: The International Monetary Fund, Global Financial Stability Report, Washington, DC, 2004, p. 105.

3.4 How to Reduce a Trade Deficit
Some countries have had trade deficits for many years. But compensating transactions cannot bemaintained indefinitely. Therefore, some adjustments must be made to correct trade deficits. Atrade deficit may be reduced in several ways: by deflating the economy, by devaluing the cur-rency, and by establishing public control.
3.4.1 Deflating the economy
If a country adopts tight monetary and fiscal policies, its inflation and income decrease. Lowerinflation and income are expected to increase exports and reduce imports, thus improving thetrade balance. To reduce its trade deficit, therefore, a country should control government budgetdeficits, reduce growth of money supply, and institute price and wage controls. On the otherhand, these policies may slow the economy.
3.4.2 Devaluing the currency
A country may reduce its trade deficit by devaluating its currency against the currencies of majortrading partners. A currency devaluation may improve the trade balance because a weak currencymakes imported goods more expensive and exported goods less expensive. However, currencydevaluation might not correct a trade deficit: (1) if foreign markets do not buy more goods inresponse to lower prices; (2) if domestic companies do not have the capacity to produce moregoods for export; (3) if domestic residents continue to import foreign goods regardless of theirhigher prices; and (4) if middlemen do not pass on changes in prices to their customers.
3.4.3 Establishing public control
In general, there are two types of public controls: foreign-exchange controls and trade controls.Think, for a moment, of a case in which increased Mexican imports create a shortage in its foreignexchange. Under exchange controls, the Mexican government would force its exporters and otherrecipients to sell their foreign exchange to the government or to designated banks. Then, the gov-ernment would allocate this foreign exchange among the various users of foreign exchange. Inthis way, the Mexican government could restrict Mexican imports to a certain amount of foreignexchange earned by Mexican exports. Thus, imports under exchange controls would be less thanthey would be under free market conditions.
When governments are faced with a serious payment deficit, they may manipulate exportsand imports through tariffs, quotas, and subsidies. High tariffs on imported goods and importquotas by Mexico would reduce Mexican imports. On the other hand, the Mexican governmentmight subsidize certain Mexican exports to make them competitive in world markets and toincrease the volume of exports. Special taxes on foreign direct investments by Mexican firmswould tend to reduce Mexican capital outflows. However, these protectionist policies mightincrease inflation, erode purchasing power, and lower the standard of living.
70 THE BALANCE OF PAYMENTS

3.4.4 The J-curve
There are a variety of reasons why currency depreciation will not necessarily improve the balanceof trade. One possible reason why a weak currency will not always reduce the trade deficit hasto do with the J-curve effect. The J-curve is the term most commonly used by economists todescribe the relationship between the trade balance and currency devaluation. As illustrated infigure 3.2, the J-curve effect holds that a country’s currency depreciation causes its trade balanceto deteriorate for a short time, followed by a flattening-out period, and then a significant improve-ment occurs for an extended period. When a country’s currency depreciates against the curren-cies of major trading partners, the country’s exports tend to rise and imports fall, which improvesthe trade balance. In the short run, however, a country’s trade deficit may deteriorate just afterits currency depreciates, because the higher cost of imports will more than offset the reducedvolume of imports.
This J-curve effect received wide attention in the mid-1980s when the US dollar plunged inthe foreign-exchange market, while the US trade deficit hit new peaks (Forsyth 1986). Specifi-cally, the US dollar began to decline after reaching its peak in March 1985, but the US tradedeficit hit a new record each year from 1985 through 1987. The US trade deficit began to fallwith the rapid expansion of American exports in 1988. Economists estimate that trade patternstypically lag currency changes by at least 18 months. Edwards (1989) and Oskooee and Malixi(1992) examined various cases of devaluations carried out by developing countries in the 1960sthrough the 1980s. Their studies confirmed the existence of the J-curve effect in about 40 percentof the cases.
HOW TO REDUCE A TRADE DEFICIT 71
Currencydepreciation
Trade balanceeventually improves
Trade balanceinitially deteriorates
Time
Change in thetrade balance 0
+
–
Figure 3.2 The J-curve effect

72 THE BALANCE OF PAYMENTS
SUMMARY
The balance of payments summarizes all international transactions between residents of a countryand residents of foreign countries during a specified period. The systematic record of these inter-national transactions requires preestablished principles. These principles include rules or procedures,such as debits and credits, and definitions of terminology, such as the current account.
The balance of payments is neither an income statement nor a balance sheet. The balance of pay-ments is a sources-and-uses-of-funds statement reflecting changes in assets, liabilities, and net worthduring a specified period. Increases in assets and decreases in liabilities or net worth constitute debits(uses of funds). On the other hand, decreases in assets and increases in liabilities or net worth rep-resent credits (sources of funds). Some international transactions, such as exports or imports, occurdue to purely economic reasons. These transactions are called autonomous transactions. Such trans-actions as sales of gold or increases in foreign debt take place to account for differences betweeninternational payments and receipts. These transactions are often called compensating transactions.
Some countries have had deficits for many years. These deficits cannot be financed indefinitelyby compensating transactions. The balance-of-payments deficit can be corrected by deflating theeconomy, devaluing the currency, and establishing public control. The first two methods are sup-posed to correct international disequilibrium through changes in prices, income, and interest rates.Government controls, such as exchange and trade controls, can be used to alleviate or correct thebalance-of-payments deficit.
Questions
1 What are the four major components of the current account?2 Briefly describe the financial account.3 If a country has a deficit on its current account, what are the consequences for the
country’s balance of payments on financial account? Assume that the country practicesa flexible exchange rate system.
4 What is the role of net errors and omissions in the balance of payments? What are themajor causes of the net errors and omissions?
5 Most developing countries (excluding oil-exporting countries) have incurred hugebalance-of-payments deficits for many years. What alternatives are available to thesecountries for dealing with their balance-of-payments problems?
6 The US current-account trade deficit has risen sharply since 1997. Discuss some reasonsfor such a dramatic increase.
7 What is the major difference between the balance of payments and the internationalinvestment position? When did the USA become a net debtor nation for the first timesince World War I? Explain why the USA became a net debtor nation.
8 What is the balance-of-payments identity?

REFERENCES 73
9 What is adversarial trade? Why do both sides (the buyer and the seller) lose in adver-sarial trade?
10 Explain why a currency depreciation will not necessarily improve the balance of trade.11 What is the J-curve?
Problems
1 Answer questions 1(a) through 1(c) using example 3.1.(a) Prepare the balance of payments in a good form.(b) Does the country have a balance-of-payments deficit or surplus?(c) How can the country account for this payments imbalance?
2 Assume that a country has a current-account deficit of $10,000 and a financial-accountsurplus of $12,000. Assume that the capital account and net errors and omissions arenegligible.(a) Does the country have a balance-of-payments deficit or surplus?(b) What will happen to the country’s official reserve account?
3 A country has a merchandise trade surplus of $5,000, an income balance of zero, a currenttransfer surplus of $3,000, and a current-account deficit of $4,000. What is the servicetrade balance?
4 Assume that: (1) a country has a current-account surplus of $10,000; (2) its financialaccount has a deficit of $15,000; and (3) its other two accounts – the capital accountand net errors and omissions – are negligible. What is the balance of the country’s reserveaccount? How can the country eliminate the $5,000 imbalance on its balance of payments?
REFERENCES
Bergin, P., “Should We Worry about the Large USCurrent Account Deficit?” FRBSF EconomicLetter, Dec. 22, 2002.
Brown, S. and P. Caputo, “China’s Growing Eco-nomic Influence in East Asia After WTO,” South-west Economy, Federal Reserve Bank of Dallas,May/June 2002, pp. 13–15.
The Council of Economic Advisors, EconomicReport of the United States, Washington, DC:
US Government Printing Office, various issues.
Edwards, S., Real Exchange Rates, Devaluation, andAdjustment: Exchange Rate Policy in DevelopingCountries, Cambridge, MA: The MIT Press,1989.
Fieleke, N. S., What Is the Balance of Payments?Boston, MA: Federal Reserve Bank of Boston,1996.

74 THE BALANCE OF PAYMENTS
Forsyth, R. W., “No Overnight Cure: The TradeDeficit Follows the J Curve,” Barron’s, Feb. 10,1986, p. 28.
International Monetary Fund, Balance of PaymentsStatistics Yearbook, various issues.
International Monetary Fund, Balance of PaymentsManual, Washington, DC: IMF, 1976.
Kim, S. H., North Korea at a Crossroads, Jefferson,NC: McFarland, 2003.
Oskooee, M. B. and M. Malixi, “More Evidence onthe J Curve from LDCs,” Journal of Policy Mod-eling, Oct. 1992, pp. 641–53.
Rosensweig, J. A. and P. D. Koch, “The US Dollarand the Delayed J-Curve,” Economic Review,Federal Reserve Bank of Atlanta, July/Aug. 1988,pp. 1–15.
The US Department of Commerce, Survey ofCurrent Business, various issues.
Case Problem 3: USA–China Trade Relations
The history of Chinese trade is long and distinct, with the twentieth century being markedby large shifts in policy. A focus on the history of trade between the USA and China helpsto reveal some of the fundamental moments in the history of Chinese trade. In 1936, theUSA accounted for 22 percent of China’s exports and 20 percent of its imports. In 1949, theChinese Communist Party seized control of China and, after decades of struggle, foundedthe People’s Republic of China. Under this new regime, the economy was completely statecontrolled. These changes, the Korean War from 1950 to 1953, and the subsequent embargotoward China caused a sharp decline in USA–China trade relations. In 1972, the Americanshare of China’s total trade accounted for only 1.6 percent.
In 1978, under the new leadership of Deng Xiaoping, China began the long process ofeconomic reform. Initially focused on just agricultural reform, these economic reforms even-tually became a transition to a capitalist and globally integrated economy. Focused on thefour modernizations – the modernization of industry, agriculture, science and technology, andnational defense – these reforms represented a deep-seated shift in policy and helped to spura steady growth of USA–China trade. Between 1990 and 2000, total trade rose from $20million to over $116 billion. By 2000, America had become China’s second-largest tradepartner and China was the USA’s fourth-largest importer, supplying a wide variety of goods.Moreover, investors poured money into China, with $400 billion invested in 2001, $28.5billion of this coming from the USA alone. It is estimated that by 2010, China’s total importswill reach three trillion dollars, a large share of which will come from the USA.
For 13 years, China had applied for WTO membership, but this effort had not been suc-cessful, mainly due to US opposition. This opposition was based on a laundry list of economicand political issues, including concerns with human rights, tension between Taiwan and China,China’s nuclear arsenal, objections from labor unions in the USA, and the use of protection-ist policies by China. “As bad as our trade deficit with China is today, it will grow even worseif we approve a permanent trade deal,” said House Minority Whip David Bonior (D., Mich.)back in October 1999. Even with this opposition, on November 15, 1999, an historic agree-ment was reached between Chinese and American trade negotiators, which set the stage forChina’s formal entry into the WTO.

CASE PROBLEM 3 75
One of the major worries by those who opposed the normalization of trade relations withChina was concern about a growing trade imbalance between the two countries. Accordingto US trade data, the trade deficit with China was $69 billion in 1999, $83 billion in 2000,$85 billion in 2001, and $103 billion in 2002 (see figure 3.3). Many believed that this growingdeficit was due to China’s high tariffs and numerous restrictions on American exports. Injoining the WTO on December 11, 2001, China agreed to lower its average tariff from 16.7percent in 2000 to 10 percent in 2005, and to reduce the number of items under importlicense and quota from approximately 300 to zero in the next 5 years. In addition, Chinaagreed to liberalize foreign investment in banking, insurance, financial services,wholesale/retail trade, and telecommunications. All these industries had been under tightgovernment control until recently.
In return, the USA granted China permanent normalized trade relations status. Withoutthis legislation, China’s trade status would be open to yearly debate, as it had been in thepast. Additionally, China, as a member of the WTO, now enjoys open markets with all otherWTO members, including the USA. One area in which this has provided a great advantagefor China’s exports is in its textile industry. Textiles have been one of the Chinese major exportitems but, for years, the USA had imposed a quota on them. With the removal of these tariffs,the Chinese textile industry has boomed and it grew by 27 percent in 2001.
Many US multinational companies are in the midst of an unprecedented wave of shiftingcapital and technology to plants in China and other low-cost locales. This wave pulls awayvast chunks of business that formerly filtered down through the intricate networks of sup-pliers and producers inside the USA. While the tension is most acute in trade associations andother industry groups, it has recently gained political momentum that threatens to spill overinto political debates. To be sure, there are some things that all manufacturers can rally
Mexico China
Surplus ($ billions)$0
–25
–50
–75
–100
–125
1990 1992 1994 1996 1998 2000 2002
NAFTApasses
Deficit($ billions)
Chinajoins WTO
Year
Figure 3.3 US trade balances with Mexico and China
Source: The Wall Street Journal, Aug. 4, 2003, p. A4.

76 THE BALANCE OF PAYMENTS
around, such as the broad push to get China to stop pegging the value of the yuan to thedollar at what many believe is an artificially low level. Some economists believe that theChinese currency is undervalued by as much as 40 percent, which gives Chinese goods abuilt-in advantage against identical US products. Even with the unanimity, the Bush Admin-istration does not appear eager to get involved.
In dollar terms, China’s economy is about 10 percent of the US economy and 20 percentof Japan’s. After adjusting for differences in the cost of living (purchasing power parity),however, China’s economy is more than half as large as the US economy and surpassed Japanto become the world’s second-largest economy; in 2002, the gross domestic product was$10.1 trillion for the USA, $6 trillion for China, and $3.6 for Japan. It grew 7.3 percent in2001 and an average of about 9 percent annually between 1980 and 2000. China expectsits economy to grow at an annual rate of 6–7 percent over the next 10 years. China’s mem-bership of the WTO represents another great step as it continues to move toward a morecapitalistic economy. It will increase the opportunities for Chinese growth and will help Chinaplay an increasingly large role in the global economy. All of these trends together point tothe emergence of China as a dominant, if not the dominant, economic power for the comingcentury.
China’s first manned space shot – the blastoff of a rivalry with the USA and Russia in civilspace exploration and military innovation – happened in a flash but reflects the long, method-ical effort of a serious program. The Shenzhou V spacecraft, launched on October 15, 2003,circled Earth 14 times before safely parachuting onto the grasslands of Inner Mongolia. TheShenzhou’s progress heightened already strong public enthusiasm for the 11-year-old mannedprogram as a symbol of China’s rising economic and technical prowess.
Case Questions
1 What are some of the sources of trade friction between China and the USA? Why dosome scholars view this friction as a positive sign?
2 What is managed trade and how does it apply to China and the USA?3 Discuss what steps the USA can take to reduce its trade deficit with China. Mention the
deflation of economies, devaluation of the currency, and the establishment of publiccontrol.
4 Suppose that the value of the US dollar sharply depreciates. Under these conditions, howwould the J-curve discussed in this chapter apply to the trade relationship between Chinaand the USA?
5 Discuss in broad terms the major changes since World War II in the trade relationsbetween China and the USA in terms of actual balance of payments and foreign directinvestment.
6 The website of the US Central Intelligence Agency, www.cia.gov, and the website of theUS Census Bureau, www.census.gov, both contain economic data and statistics on trade.

CASE PROBLEM 3 77
Use specific numbers from these two sites to support some of your claims in the answerto question 5.
Sources: Anonymous, “American Firms Rushing to Build in China,” USA Today, Aug. 2002; anonymous,“Competing with China,” Business Mexico, July 2002; T. Aeppel, “US–China Trade Becomes a Delicate Issueof Turf,” The Wall Street Journal, July 23, 2003; F. M. Armbrecht, Jr, “WTO Entry, Government’s WelcomeCould Spur Foreign R&D in China,” Research Technology Management, Sept./Oct. 2002; S. Brown and P.Caputo, “China’s Growing Economic Influence in East Asia After WTO,” Southwest Economy, Federal ReserveBank of Dallas, May/June 2002, pp. 13–15; C. Y. Cheng, “The future prospects of US–China economic rela-tions,” USA Today, Sept. 2002; H. Cooper, “Trade Gap Sets Record for March – Oil’s Rise is Cited; DebateNow Focuses on Status of China,” The Wall Street Journal, May 22, 2000; and P. Wonacott and G. Wine-stock, “A Global Journal Report: China and US Make Progress on Trade Rifts,” The Wall Street Journal, Sept.26, 2002.

Opening Case 4: The Euro – A Story of Change
On January 1, 2002, the euro (€) officially became the national currency for 300million people in 12 countries – Austria, Belgium, Finland, France, Germany, Greece,Ireland, Italy, Luxembourg, Portugal, Spain, and the Netherlands. This move consti-tuted a major change in the region and has resulted in many fundamental changes.In this case, the broad changes will be discussed, and then some of the specifics ofthe process will be explored by focusing on Italy’s transition from the lira to the euro.
The euro was first used by monetary authorities and businesses on January 1, 1999.On July 1, 2002, euro coins and notes officially replaced the national coins and notesof the 12 Euroland countries. In recent years, the euro has been associated with deepercapital markets and increasing demands by shareholders for better corporate gover-nance. Steps have also been taken to pool economic data and to better coordinatebanking oversight across national boundaries. And the euro has helped drive longoverdue industry consolidations, from telecommunications to airlines. Overall, theeuro has become the world’s second-largest currency in terms of gross domesticproduct and has assisted in the recent trend of slow but sure market-opening liberal-ization in Europe.
The euro has also resulted in positive daily life benefits for European citizens. Forexample, when these citizens travel to other euro countries, they can more easilycompare prices, and they will not have to stop at a foreign-exchange window andhand over a foreign-exchange commission. Consumers are already gaining from theirnew ability to compare prices in one currency. In 2001, the website of the Frenchnational railway system started quoting a single, euro-denominated price, instead of12 different prices; the result was consumer savings of as much as 20 percent. In short,
CHAPTER 4
The International Monetary System

OPENING CASE 4 79
economic life in Europe has become simpler, and this is generally good for both con-sumers and businesses.
To help further examine the impact of the currency change, the history of the euroin one nation, Italy, will be discussed. Like most of its European Union (EU) partners,Italy opted to phase in the euro gradually over 2 months. The lira, which traces itsorigins back to AD 794 and Charlemagne’s libra, ran alongside the new currency fromJanuary 2002 until the end of February 2002, before it was officially decommissionedon March 1, 2002 (although it is still possible to exchange lira for euros at the Bankof Italy for another 10 years).
This transition period was not easy for Italy. According to the retailers’ associationConfcommercio, only 37 percent of Italians were aware that checks must be writtenin euros as of January 1, 2002, while about 80 percent believed that the lira wouldcontinue to circulate after February 28, 2002. Furthermore, a survey conducted in July2001 by a public think tank showed that 30 percent of Italians were still not sure whatthe euro was, about 43 percent were unaware of the timetable for the changeover,and only 21 percent knew how much a euro would actually be worth (1,936.27 lira).
Beyond these public knowledge problems, the transition was not free. It is esti-mated that the total changeover cost approximately 5 trillion lira ($2.3 billion). Muchof this expense fell on the business sector, which carried the overall costs of trainingand upgrading equipment, estimated at $934 million. Confcommercio figured that bigretailers spent some 0.3 percent of yearly sales preparing for the euro, while smallshopkeepers ended up investing as much as 2 percent of their revenues.
To combat these problems, the Italian government took some preventive steps.First, shops and supermarkets were required to offer euro–lira calculators at check-out points, and special toll-free numbers were created to help customers to reportirregularities. Second, little yellow and blue euro converters were sent to every Italianhome. In the end though, after the anxieties of the first few days of the changeoverhad passed, Italians decided that the gadget really was not very useful and becamecomfortable with the new currency.
There were also some practical changes that came with the new currency. Thesingle euro is a coin and the bills are larger than the lira bills. Therefore, the biggestChristmas present in Italy in 2001 was a euro-sized wallet. Also, vending machines,which are ubiquitous in Italy, had to be refitted for the euro. This often resulted inpricing changes. In one humorous example, access to the only public toilet in Voghera,a small town in northern Italy, now costs almost twice as much as it did before thechangeover. “It is all a question of coins,” the local administrators replied. “It is toocomplicated to modify the token dispenser.”
This example also illustrates the single biggest problem Italy has had with the transition – inflation. Before the euro was implemented, prices for goods could varyby as much as 50 percent between nations. The transition therefore resulted in pricefluctuations to correct these differences; and it was southern countries such as Italyin particular, which are poorer than their northern neighbors, that felt the impact ofthese fluctuations. Additionally, there was suspicion in Italy, as in other countries, thatprices were raised due to opportunistic rounding during the changeover. With an

80 THE INTERNATIONAL MONETARY SYSTEM
official exchange rate fixed at 1,936.27 lira per euro, opportunistic round-numberreadjustments were inevitable.
Therefore, the changeover to the euro resulted in inflation, especially for the smallthings that people buy every day – food, coffee, and haircuts. Higher-priced items,such as cars and computers, have held steady or even in some cases declined in pricedue to increased competition across the European Union. As the economist KatinkaBarish of the Centre for European Reform noted, “You might have competition on aEuro-wide basis for cars, but you cannot do that on things like kebabs.” For example,prices in cafés and restaurants rose 4.3 percent in 2002 – nearly double the generalinflation rate. Importantly, this is the inflation that people notice most, resulting in alarge difference between perceived inflation and actual inflation.
Italian consumers have been particularly indignant about price increases and somegroups have led strikes in which consumers vowed to stop buying things for a day.One consumer, Jose Elorrieta, a Milan engineer and university professor with twoyoung daughters, says that the price of the high-end cured ham his family buys forChristmas nearly doubled in 2002, to 60 euros a kilogram, or about $28 a pound,compared with 36 euros a kilogram, or $16.80 a pound, at the end of 2001. “It isthe same story with clothes, with shoes – everything has gone up brutally, and it isalmost exclusively due to the introduction of the euro,” complains Mr Elorrieta, whosays he has cut back on holiday spending as a result.
The government has taken steps to combat inflation. The prime minister’s mothercomplained that pasta prices had trebled since the euro’s launch and, in response, hetook action. To combat Italy’s fast-rising prices, he called for a 3-month freeze onelectric, gas, and postal prices. Even with these initial hiccups, however, the intro-duction of the euro should be positive for both Italy and the continent. The move toa standardized system, cooperation, and more accountability should result in economicgrowth for the region. As the examination of Italy’s process shows, the change hasnot been completely smooth, but overall it has been positive.
Sources: Anonymous, “Happy New Euro,” The Wall Street Journal, Dec., 2001; J. Casison, “Cur-rency Conversion: The Euro Becomes a Reality,” Incentive, Jan. 2002; N. D’Aquino, “Rome: Berlus-coni Gets Popular Points for Euro Converter,” Europe, Apr. 2002; A. Galloni, “Euro’s First Noel HitsSour Notes With Shoppers,” The Wall Street Journal, Dec., 2002; S. Jewkes, “Arrivederci Lira,”Europe, Dec./Jan. 2002; G. Winestock and G. T. Sims, “What the Euro Has Been Up To for thePast Three Years – Tuesday is Debut of Cash, but Common Currency Already Has Made a Mark,”The Wall Street Journal, Dec., 2001; and T. Vlahou and C. Power, “Europe’s Gouging Gap; Createdto Unite the Continent, the Euro has Inspired Fury over Price Rises, Particularly in the Poorer South,”Newsweek, Oct. 2002.
The international monetary system consists of laws, rules, institutions, instruments, and pro-cedures, which involve international transfers of money. These elements affect foreign-exchangerates, international trade and capital flows, and balance-of-payments adjustments. Foreign-exchange rates determine prices of goods and services across national boundaries. These exchangerates also affect international loans and foreign investment. Hence the international monetary

system plays a critical role in the financial management of multinational business and economicpolicies of individual countries.
This chapter has five major sections. The first section provides an overview of a successfulforeign-exchange system. The second section presents a history of the international monetarysystem, from the gold standard of the late nineteenth century to the hybrid exchange system thatprevails today. The third section describes the International Monetary Fund and special drawingrights. The fourth section discusses the European Monetary System. The fifth section examinesproposals for further international monetary reform.
4.1 A Successful Foreign-Exchange System
A multinational company’s access to international capital markets and its freedom to move fundsacross national boundaries are subject to a variety of national constraints. These constraints arefrequently imposed to meet international monetary agreements on determining exchange rates.Constraints may also be imposed to correct the balance-of-payments deficit or to promotenational economic goals.
A successful exchange system is necessary to stabilize the international payment system. To besuccessful, an exchange system should meet three conditions:
1 Balance-of-payments deficits or surpluses by individual countries should not be too large orprolonged.
2 Such deficits or surpluses should be corrected in ways that do not cause unacceptable infla-tion or physical restrictions on trade and payments for either individual countries or thewhole world.
3 The maximum sustainable expansion of trade and other international economic activitiesshould be facilitated.
Theoretically, continuous balance-of-payments deficits and surpluses cannot exist around theworld. Under a system of freely flexible exchange rates, a foreign-exchange market clears itself in the same way a competitive market for goods does. Just like every commodity price, eachexchange rate moves to a level at which demand and supply are equal. Under a system of fixedexchange rates, central banks or other designated agencies buy and sell on the open market toabsorb surpluses and to eliminate deficiencies of foreign currencies at the fixed exchange rates.
4.1.1 Currency values and terminology
A foreign-exchange rate is the price of one currency expressed in terms of another currency. Afixed exchange rate is an exchange rate that does not fluctuate or that changes within a prede-termined band. The rate at which the currency is fixed or pegged is called the “par value.” Afloating or flexible exchange rate is an exchange rate that fluctuates according to market forces.
Although governments do not attempt to prevent fundamental changes in the exchange ratebetween their own currency and other currency, they typically attempt to maintain orderlytrading conditions in the market. A flexible exchange system has a number of advantages:
A SUCCESSFUL FOREIGN-EXCHANGE SYSTEM 81

1 Countries can maintain independent monetary and fiscal policies.2 Flexible exchange rates permit a smooth adjustment to external shocks.3 Central banks do not need to maintain large international reserves to defend a fixed exchange
rate.
However, a flexible exchange system has several disadvantages. First, exchange rates under a pureversion of this system are highly unstable, thereby discouraging the flow of world trade and invest-ment. Second, flexible exchange rates are inherently inflationary, because they remove the exter-nal discipline on government economic policy.
A system of fixed exchange rates provides the stability of exchange rates, but it has some disadvantages:
1 The stability of exchange rates may be too rigid to take care of major upheavals such as wars,revolutions, and widespread disasters.
2 Central banks need to maintain large international reserves to defend a fixed exchange rate.3 Fixed exchange rates may result in destabilizing speculation that causes the exchange rate
to “overshoot” its natural equilibrium level. Overshoot (beyond fair value) is natural afterdevaluation. For example, all three developing-country financial crises since 1980 – the LatinAmerican crisis of the 1980s, the Mexican peso crisis of 1994, and the Asian crisis of 1997–8– occurred under fixed exchange rate regimes.
Four concepts – appreciation, depreciation, revaluation (upvaluation), and devaluation – are allrelated to changing the value of a currency. An appreciation is a rise in the value of a currencyagainst other currencies under a floating-rate system. A depreciation is a decrease in the valueof a currency against other currencies under a floating-rate system. Under a system of floatingrates, a country’s exchange rate will appreciate if it raises interest rates to attract capital. Simi-larly, its exchange rate will “depreciate” if it reduces interest rates.
A revaluation is an official increase in the value of a currency by the government of that cur-rency under a fixed-rate system. A devaluation is an official reduction in the par value of a cur-rency by the government of that currency under a fixed-rate system. Under a system of fixedrates, a country may “devalue” its exchange rate by setting a lower intervention price at which itwill intervene in the foreign-exchange market. It may “revalue” or “upvalue” its exchange rate bysetting a higher intervention price.
4.1.2 Currency boards
A currency board is a monetary institution that only issues currency to the extent that it is fullybacked by foreign reserves. In other words, a currency board is an extreme form of the fixedexchange rate regime under which local currency is fully backed by the US dollar or any otherchosen currency. Its major attributes include:
1 An exchange rate that is fixed not just by policy, but by law.2 A reserve requirement to the extent that a country’s reserves are equal to 100 percent of its
notes and coins in circulation.3 A self-correcting balance-of-payments mechanism, where a payments deficit automatically
contracts the money supply and thus the amount of spending as well.4 No central bank under a currency board system.
82 THE INTERNATIONAL MONETARY SYSTEM

Thus, in addition to promoting price stability, a currency board also compels the government tofollow a responsible fiscal policy.
The first currency board was established in Mauritius, which was then a colony of GreatBritain, in 1849. The use of currency boards eventually spread to 70 British colonies. The intro-duction of currency board like arrangements in Hong Kong (1983), Estonia (1990), Argentina(1991), Lithuania (1994), Bulgaria (1997), and Bosnia (1998) constitutes a small resurgence intheir use worldwide.
Characteristics of countries that are candidates for currency boards include: a small, openeconomy; a desire for further close integration with a particular neighbor or trading partner; astrong need to import momentary stability; and a well-regulated financial system. During theAsian financial crisis of 1997–8, advocates of currency boards had pushed for their wider use –in particular, for Indonesia, Russia, and the Ukraine. A currency board, however, is unlikely tobe successful without the solid fundamentals of adequate reserves, fiscal discipline, and a well-supervised financial system, in addition to the rule of law.
A recent episode with the Argentine peso shows that even a currency board arrangementcannot be completely safe from a possible collapse. The currency board structure fixed thepeso–dollar exchange rate at parity through much of the 1990s by requiring that every peso incirculation be backed by either gold or the US dollar. Argentina’s adoption of a currency boardsystem in 1991 curtailed its chronic inflation dramatically and attracted a substantial amount offoreign investment for the first few years. However, a strong dollar eventually hurt exports fromArgentina and caused a protracted economic downturn. Argentina abandoned the peso–dollarparity in January 2002 by first devaluing the peso to Ps1.40 per dollar and then floating it com-pletely. As shown in figure 4.1, daily peso changes have become a way of life since then.
Perhaps the most prominent form of a rigidly fixed system is dollarization, the use of the USdollar as the official currency of the country. Several countries have adopted the US dollar astheir official currency because they have suffered currency devaluation for many years. Panamahas used the dollar as its official currency since 1907. Ecuador adopted the dollar as its official
A SUCCESSFUL FOREIGN-EXCHANGE SYSTEM 83
2002
Year
2003
1
2
3
4
Peso
Figure 4.1 Argentine pesos per US dollar (inverted scale)
Source: The Wall Street Journal, July 2, 2003, p. A6.

currency in January 2000. In January 2001, El Salvador became the third country south of theRio Grande to abandon its domestic currency in favor of the dollar. A country that dollarizesremoves any currency volatility, thereby eliminating the possibility of future currency crises. Onemajor argument against dollarization has to do with the loss of sovereignty over monetary policy.
4.1.3 Market equilibrium
Demand for foreign exchange comes from debit items in the balance of payments, such as importsand capital outflows. As the foreign-exchange rate falls, the corresponding quantity of the foreignexchange demanded rises. Alternatively, as the exchange rate increases, the corresponding quan-tity demanded falls. In short, there is an inverse relationship between the exchange rate and thequantity demanded. This inverse relationship explains why the demand curve for foreignexchange is downward sloping.
The supply of foreign exchange comes from credit items in the balance of payments, such asexports and capital inflows. As the foreign-exchange rate falls, the corresponding quantity offoreign exchange supplied also falls. As the exchange rate increases, the corresponding quantitysupplied also increases. This direct relationship between exchange rate and quantity suppliedexplains why the supply curve for foreign exchange is upward sloping.
Figure 4.2 shows the downward-sloping demand curve D and the upward-sloping supplycurve S. The intersection of these two curves indicates the equilibrium exchange rate (E1) andquantity (Q1). If the actual exchange rate is below the equilibrium point E1, the rate will even-tually rise because demand exceeds supply. If the actual exchange rate is above point E1, the ratewill eventually fall because supply exceeds demand.
84 THE INTERNATIONAL MONETARY SYSTEM
Exchange rate($ per £)
S
D
Q1
E1
Quantity of foreign exchange (£)
Figure 4.2 Market determination of exchange rates
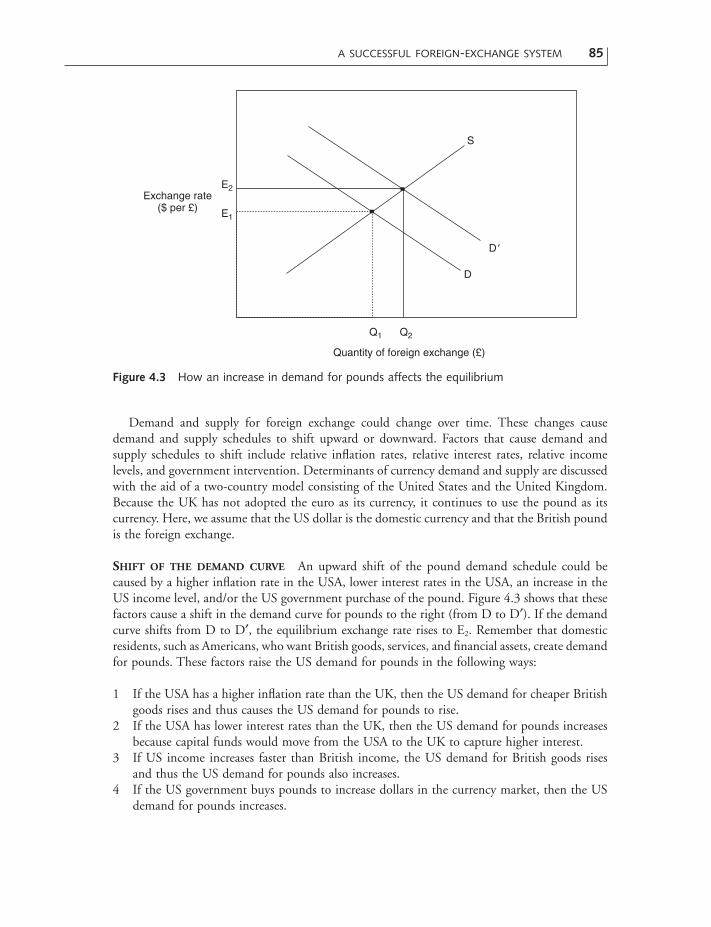
Demand and supply for foreign exchange could change over time. These changes causedemand and supply schedules to shift upward or downward. Factors that cause demand andsupply schedules to shift include relative inflation rates, relative interest rates, relative incomelevels, and government intervention. Determinants of currency demand and supply are discussedwith the aid of a two-country model consisting of the United States and the United Kingdom.Because the UK has not adopted the euro as its currency, it continues to use the pound as itscurrency. Here, we assume that the US dollar is the domestic currency and that the British poundis the foreign exchange.
SHIFT OF THE DEMAND CURVE An upward shift of the pound demand schedule could becaused by a higher inflation rate in the USA, lower interest rates in the USA, an increase in theUS income level, and/or the US government purchase of the pound. Figure 4.3 shows that thesefactors cause a shift in the demand curve for pounds to the right (from D to D¢). If the demandcurve shifts from D to D¢, the equilibrium exchange rate rises to E2. Remember that domesticresidents, such as Americans, who want British goods, services, and financial assets, create demandfor pounds. These factors raise the US demand for pounds in the following ways:
1 If the USA has a higher inflation rate than the UK, then the US demand for cheaper Britishgoods rises and thus causes the US demand for pounds to rise.
2 If the USA has lower interest rates than the UK, then the US demand for pounds increasesbecause capital funds would move from the USA to the UK to capture higher interest.
3 If US income increases faster than British income, the US demand for British goods risesand thus the US demand for pounds also increases.
4 If the US government buys pounds to increase dollars in the currency market, then the USdemand for pounds increases.
A SUCCESSFUL FOREIGN-EXCHANGE SYSTEM 85
Exchange rate($ per £)
S
D
D'
Q1 Q2
E1
E2
Quantity of foreign exchange (£)
Figure 4.3 How an increase in demand for pounds affects the equilibrium

You now know why these four events could increase the US demand for pounds. Because thequantity of pounds demanded at any exchange rate is higher, the demand curve shifts to theright. That is why the equilibrium exchange rate appreciates (or rises) from E1 to E2.
SHIFT OF THE SUPPLY CURVE A downward shift of the pound supply schedule could be causedby a higher inflation rate in the UK, lower interest rates in the UK, an increase in the UK incomelevel, and/or the UK government purchase of the dollar. Figure 4.4 shows that these factors causea shift in the supply curve for pounds to the right (from S to S¢). If the supply curve shifts fromS to S¢, the equilibrium exchange rate falls from E1 to E3. Remember that non-US residents, suchas British people, who want American goods, services, and financial assets, determine the supplyof pounds. These factors raise the supply of pounds in the following ways:
1 If the UK has a higher inflation rate than the USA, then the supply of pounds rises becauseBritish people will convert pounds to dollars to buy more US goods.
2 If the UK has lower interest rates than the USA, then capital funds will move from the UKto the USA and thus the supply of pounds rises.
3 If UK income rises faster than US income, then the supply of pounds increases because Britishpeople will buy more US goods.
4 If the UK government buys dollars to release more pounds in the currency market, then thesupply of pounds increases.
You should now understand why these four events could increase the supply of pounds. Becausethe quantity of pounds supplied at any exchange rate is higher, the supply curve shifts to theright. This is why the equilibrium exchange rate depreciates (falls) from E1 to E3.
86 THE INTERNATIONAL MONETARY SYSTEM
Exchange rate($ per £)
S
D
S'
Q1 Q3
E1
E3
Quantity of foreign exchange (£)
Figure 4.4 How an increase in supply of pounds affects the equilibrium

4.1.4 Prevailing exchange rate arrangements
As part of a move to greater flexibility since 1976, the International Monetary Fund (IMF) hasallowed member countries to have an exchange rate arrangement of their choice, as long as theyproperly communicate their arrangement to the IMF. Each year, the IMF receives informationfrom its member countries and classifies each country into one of eight categories. Each of theseregimes is explained below. The numbers in parentheses indicate the number of countries thatemployed each exchange rate arrangement as of January 31, 2003:
• Exchange arrangements with no separate legal tender (40). The currency of another country cir-culates as the sole legal tender, or the member belongs to a monetary or currency union inwhich the members of the union share the same legal tender.
• Currency board arrangements (8). A monetary regime based on an implicit legislative com-mitment to exchange domestic currency for a specified foreign currency at a fixed exchangerate, combined with restrictions on the issuing authority to ensure the fulfillment of its legalobligation.
• Other conventional fixed-peg arrangements (40). The country pegs its currency (formally or defacto) at a fixed rate to a major currency or a basket of currencies, where the exchange ratesfluctuate within a narrow margin of at most ±1 percent around a central rate.
• Pegged exchange rates within horizontal bands (5). The value of the currency is maintainedwithin margins of fluctuations around a formal or de facto fixed peg that are wider than ±1percent around a central rate.
• Crawling pegs (4). The currency is adjusted periodically in small amounts at a fixed, pre-announced rate or in response to changes in selective quantitative indicators.
• Exchange rates within crawling bands (6). The currency is maintained within certain fluctua-tion margins around a central rate that is adjusted periodically at a fixed pre-announced rate,or in response to changes in selective quantitative indicators.
• Managed floating with no pre-announced path for the exchange rate (42). The monetary author-ity influences the movements of the exchange rate through active intervention in the foreign-exchange markets, without specifying or pre-committing to a pre-announced path for theexchange rate.
• Independent floating (41). The exchange rate is market determined, with any foreign-exchangeintervention aimed at moderating the rate of change and preventing undue fluctuations inthe exchange rate, rather than at establishing a level for it.
4.2 A Brief History of the International Monetary System
4.2.1 The pre-1914 gold standard: a fixed exchange system
In the pre-1914 era, most of the major trading nations accepted and participated in an interna-tional monetary system called the gold standard. Under the gold standard, countries used goldas a medium of exchange and a store of value. The gold standard had a stable exchange rate.During this period before World War I, a nation’s monetary unit was defined as a certain weightof gold.
A BRIEF HISTORY OF THE INTERNATIONAL MONETARY SYSTEM 87

The gold standard as an international monetary system worked adequately before World WarI because of London’s dominance in international finance. The keystone of the system was con-fidence in the stability of the British financial system. London was the financial center for almost90 percent of world trade, which was organized around sterling as the sole reserve currency. Com-mercial transactions such as factoring receivables and discounting bills from all corners of theworld took place in London. Sterling was convenient because it was universally used and con-vertible into gold at the Bank of England. Trade and loans were denominated in sterling ratherthan gold.
The Bank of England backed sterling with an unbelievably small amount of gold reserve, esti-mated at 2 or 3 percent of the total money supply. The Bank of England maintained this smallgold reserve because it manipulated the bank rate to safeguard the gold stock. The bank rate wasthe rate at which the Bank of England rediscounted commercial paper. Gold outflows increasedthe bank rate, thus attracting short-term deposits into London. Gold inflows were met bydecreases in the bank rate. Such manipulations produced unmatched stability in the capitalmarkets.
4.2.2 Monetary disorder: 1914–45: a flexible exchange system
The gold standard, as an international monetary system, worked well until World War I inter-rupted trade patterns and ended the stability of exchange rates for currencies of major industrialcountries. The value of currencies fluctuated fairly widely in terms of gold during World War Iand in the early 1920s. After World War I, the UK was not the world’s only major creditornation; the USA started to emerge as a leading creditor too.
Several attempts were made to restore the gold standard during the 1920s. The USA returnedto the gold standard in 1919, the UK in 1925, and France in 1928. However, these attemptsfailed, mainly because of the Great Depression of 1929–32 and the international financial crisisof 1931. In other words, country after country devalued its currency to stimulate its exports.Governments also resorted to exchange controls in an attempt to manipulate their net exports.Of course, with the onslaught of World War II, hostile countries used foreign-exchange controlsto finance their war effort.
4.2.3 Fixed exchange rates: 1945–73
The international monetary disorder of the 1930s justified the relative rigidity of the postwar parvalue system designed at Bretton Woods in 1944. The Bretton Woods Agreement was signedby representatives of 44 countries at Bretton Woods, New Hampshire, in 1944, to establish asystem of fixed exchange rates. Under this system, each currency was fixed by government actionwithin a narrow range of values relative to gold or some currency of reference. The US dollarwas used most frequently as a reference currency to establish the relative prices of all other currencies.
At the end of World War II, the leading nations of the free world recognized that the recon-struction of the world economy would depend on establishing a workable international mone-tary system. At the international conference held at Bretton Woods, they agreed to establish anew monetary order, which centered on the IMF and the International Bank for Reconstruction
88 THE INTERNATIONAL MONETARY SYSTEM

and Development (the World Bank). The IMF provides short-term balance-of-payments adjust-ment loans, while the World Bank makes long-term development and reconstruction loans. Thebasic purpose of this new monetary system was to facilitate the expansion of world trade and touse the US dollar as a standard of value.
The Bretton Woods Agreement emphasized the stability of exchange rates by adopting theconcept of fixed but adjustable rates. The keystones of the system were that no provision wasmade for the USA to change the value of gold at $35 per ounce and that each country was oblig-ated to define its monetary unit in terms of gold or dollars. While other currencies were notrequired to exchange their currencies for gold, US dollars remained convertible into gold at $35per ounce. Thus, each country established par rates of exchange between its currency and thecurrencies of all other countries. Each currency was permitted to fluctuate within ±1 percent ofpar value by buying or selling foreign exchange and gold as needed. However, if a country’s cur-rency became too weak to maintain par value, it could devalue its currency up to 10 percentwithout formal approval by the IMF.
4.2.4 The breakdown of the Bretton Woods system
Depreciation and appreciation occurred rarely before 1971, thanks to the fixed exchange ratesystem administered by the IMF. The key elements of the Bretton Woods system were the stablevalue of the US dollar in terms of gold and its convertibility into gold at least for foreign centralbanks. The late 1940s marked the beginning of large deficits in the US balance of payments. By1971, the US payments deficit exploded. America’s chronic payments deficits turned into a spec-tacular dilution of US gold and other reserves during the 1960s and early 1970s. Hence manypeople were not surprised to observe that the dollar had to be devalued in 1971 and again in1973. Moreover, on August 15, 1971, President Nixon, in a famous speech designed to deal withUS inflation and international monetary problems, stated that the USA had decided to:
1 Suspend the conversion of dollars into gold.2 Permit the dollar to float in relation to other currencies.3 Impose a 10 percent surcharge on most imports.4 Impose direct controls on wages and prices.
All of these actions were taken without prior consultation with the IMF.
THE SMITHSONIAN AGREEMENT From August to December 1971, most major currencies werepermitted to fluctuate. US dollars fell in value against a number of major currencies. Severalcountries caused major concern by imposing some trade and exchange controls. It was fearedthat such protective measures might become sufficiently widespread to curtail international com-merce. In order to solve these problems, the world’s leading trading countries, called the “Groupof Ten,” produced the Smithsonian Agreement on December 18, 1971. This “Group of Ten”consisted of the USA, Belgium, England, France, West Germany, Italy, Japan, the Netherlands,Sweden, and Switzerland.
The USA agreed to devalue the dollar from $35 per ounce of gold to $38 (an 8.57 percentdevaluation). In return, the other countries agreed to revalue their currencies against the dollar.Actual revaluations ranged from 7.4 percent by Canada to 16.9 percent by Japan. Finally, these
A BRIEF HISTORY OF THE INTERNATIONAL MONETARY SYSTEM 89

10 countries agreed to expand the trading band from 1 percent to 2.25 percent in either direction.
The Smithsonian Agreement was a historical event in international monetary affairs, but itfailed to reduce speculation. Government controls on foreign exchange, likewise, did not decrease.For all practical purposes, the Agreement came to an end in March 1973, because most “Groupof Ten” countries allowed their currencies to float according to market forces. Thus, the systemof pegged but adjustable rates, based on the 1944 Bretton Woods Agreement, collapsed.
4.2.5 The post-1973 dirty floating system
Figure 4.5 shows the nominal exchange rate index of the US dollar from 1978 to 2004, alongwith two other exchange rates: the dollar–euro rate and the dollar–yen rate. This index is an indi-cator how the external value of the US dollar has moved relative to other industrial-country currencies.
As shown in figure 4.5, daily exchange rate changes have become a way of life since 1973,when the Bretton Woods Agreement collapsed. Moreover, since then, exchange rates have becomemuch more volatile and less predictable due to a number of unexpected events affecting inter-national monetary order. The most important events include the oil crisis of late 1973, loss ofconfidence in the US dollar between 1977 and 1978, the second oil crisis in 1978, the forma-tion of the European Monetary System in 1979, diversification of monetary reserves by centralbanks after 1979, the surprising strength of the US dollar between 1981 and 1985, the sinkingUS dollar between February 1985 and 1988, the surprising strength of the US dollar betweenJanuary and June 1989, the end of the Marxist revolution in 1990, the dissolution of the SovietUnion in December 1991, European currency crises in September 1992 and in July 1993, thecreation of a single European market in 1993, a 40 percent depreciation of the Mexican pesobetween December 1994 and January 1995, the Asian financial crisis in 1997–8, other emerg-
90 THE INTERNATIONAL MONETARY SYSTEM
ECU(right scale)
Yen(right scale)
euro(right scale)
Major currency index(left scale)
Exchange rates index, March 1973 = 100Yen/US$
100 X (ECU or euro/US$)375
300
225
150
75
0
160
140
120
100
80
6079 80 81 82 83 84 85 86 87 88 89 90 91 92 93 94 95 96 97 98 99 00 01 02 03 04
Year
Figure 4.5 The US dollar under floating exchange rates
Source: National Economic Trends, Federal Reserve Bank of St. Louis, May 2004, p. 18.

ing market currency crises (such as Russia in 1998, Brazil in 1999, Turkey in 2001, and Argentinaand Venezuela in 2002), and the replacement of eurozone currencies with the euro in 2002.
From the end of World War II to 1973, international business and multinational corpora-tions operated under a fixed exchange system. Since 1973, most industrial and many developingcountries have permitted their currencies to float, with frequent government intervention in theexchange market. This monetary system is known by various terms, such as free float, managedfloat, dirty float, partial float, and others on a primarily market-determined exchange rate. Gov-ernments have frequently intervened to maintain orderly markets and to keep their averageexchange rate at a level desirable for their economic policy.
4.2.6 The Jamaica Agreement of January 1976
Because the Bretton Woods Agreement was based on the system of fixed exchange rates, the IMFhad to change its Articles of Agreement in order to permit floating exchange rates. The JamaicaAgreement of 1976 formalized the existing system of floating exchange rates. Important IMFmember countries held a series of negotiations during 1973–6, which led to an agreement tochange some aspects of the Bretton Woods system. The Board of Governors of the IMF approvedthese changes in April 1976, and they came into effect 2 years later. This amendment legalizedthe existing system of floating exchange rates and permitted each member to peg or to float thevalue of its currency. The amendment also terminated the par value system based on gold. Thus,the fixed exchange system based on the Bretton Woods Agreement officially ended in 1976,although, practically speaking, it had died in 1973.
4.2.7 The Plaza Agreement and the Louvre Accord
As shown in figure 4.5, the dollar’s spectacular rise in the period 1980–5 and its equally spec-tacular fall in the period 1985–8 deserve some discussion. The US dollar peaked in March 1985and then began a long downhill slide. The slide is largely attributable to the Plaza Agreement ofSeptember 1985. In late September 1985, leaders of the Group of Five (the USA, France, Japan,the UK, and West Germany) met at the Plaza Hotel in New York and reached the so-called “PlazaAgreement.” They announced that it would be desirable for major currencies to appreciate againstthe US dollar and they pledged to intervene in exchange markets to achieve this objective.
This coordinated program to bring down the value of the US dollar worked too well. In Feb-ruary 1987, major industrial countries reconvened at the Louvre, in Paris, and reached a newagreement known as the “Louvre Accord.” They agreed that exchange rates had been realignedsufficiently and pledged to support stability of exchange rates around their current levels. ThePlaza Agreement and the Louvre Accord ended the dollar’s dramatic rise and fall during the periodfrom 1980 to 1987.
4.2.8 The September 1992 currency crisis in Europe
The Maastricht Treaty, named after the provincial Dutch town that hosted the EEC summit inmid-December 1991, signaled to many a no-turning-back on the road to European unity.
A BRIEF HISTORY OF THE INTERNATIONAL MONETARY SYSTEM 91

However, Europe’s plans for economic union experienced a setback in September 1992, becauseturbulent trading amid the chaos surrounding an apparent breakdown of the European Mone-tary System (EMS) racked world currency markets. Although the roots of the currency crisis layin Germany’s high interest rates, the UK took center stage. The crisis began when NormanLamont, Chancellor of the Exchequer, announced on September 16 that the UK would with-draw from the EMS.
Pressures leading to this turmoil had built up for several months since the Danes, in a refer-endum in May 1992, narrowly opposed ratification of the Maastricht Treaty. Europe’s once-solidmonetary system was suddenly plunged into turmoil. On September 17, 1992, the UK and Italyboth suspended their currencies from the EMS, after the values of the pound and the lira fellbelow the floor set by that system. The UK, Italy, and Spain then devalued their currencies.Ireland, Spain, and Portugal reimposed limited controls on capital flows. European currency fluc-tuations against the US dollar from September 11 to September 18 ranged from as little as 4percent for the Belgian franc to as much as 12 percent for the Italian lira. Sweden, not an EMSmember, increased its key lending rate to 500 percent to defend the informal link between itskrona and the mark.
Currency traders and analysts estimate that Europe’s major central banks lost $6 billion intheir futile attempts to support weak currencies in September 1992. British, French, German,Italian, and Spanish central banks together spent approximately $150 billion to assist the pound,franc, lira, peseta, and krona. Even with an affirmative French vote on the Maastricht Treaty inthe referendum of September 20, many analysts doubted whether the movement toward mone-tary, economic, and political union would continue.
THE CAUSES OF THE CRISIS At the center of this turmoil in currency markets was Germany’sBundesbank. To control inflation caused by Germany’s own reunification, the German centralbank raised interest rates. Germany’s problems can be dated to mid-1990, when West Germanyhanded East Germans one powerful Western mark for each Eastern mark. This action was fol-lowed by commitments from Bonn to invest heavily in the rehabilitation of East Germany andto finance the withdrawal of Russian troops from Germany.
These events resulted in an inflation rate of almost 4 percent – high by German standards.The German Bundesbank sought to control the inflation with a single instrument: short-terminterest rates pegged between 8 and 9 percent. In other words, Germany’s tight money policyposed enormous problems for Europe’s weaker economies, none of which would have imposedtheir high interest rates had their currencies not been tied to the mark by the exchange ratesystem. The governments of countries such as the UK, Italy, and Spain then faced a difficultchoice: either raise interest rates or spend the huge sums of money required to boost their cur-rencies to the agreed-upon levels. In fact, these countries had used both approaches for sometime, but they were too little and too late to save the EMS.
4.2.9 The July 1993 currency crisis in Europe
On July 1, 1993, wave after wave of currency selling by investors forced European governmentsto all but abandon their system of managing exchange rates. The economics ministers of the EUrushed off to the EU headquarters in Brussels that weekend, scrambling to save the EMS. Thiscrisis had been triggered by the German central bank’s decision not to lower its discount rate.The ministers debated all manner of possible solutions, including devaluing most of the curren-
92 THE INTERNATIONAL MONETARY SYSTEM

cies, or even removing the mark from the EMS. By July 4 (Monday), they finally agreed to dras-tically widen the bands within which member currencies could fluctuate against other membercurrencies, to 15 percent of a central value, from ±2.25 percent, in most cases. The net effect oftheir decision was essentially a free float that meant that European central banks were no longerforced to prop up their currencies every time speculators pushed a currency to the limits of thenarrower fluctuation band.
Pundits assumed that governments would abandon their commitment to a stable monetarypolicy and their dedication to the anti-inflation fight. However, the wider band had worked prettywell. The unsettling results on European currencies from the July actions uncovered fundamen-tal weaknesses in the plan for a united Europe, but they also increased the chances of stabilityand growth. The July currency crisis has actually imposed a discipline on governments and centralbanks. Most EU countries have made progress on reducing their total debt as a percentage ofGDP. Despite more generous central-bank credit policies, consumer prices have increased at amoderate rate across the continent. At the same time, the central banks have lowered key inter-est rates to help lift their economies out of recession. These salutary effects have occurred becausemost European countries had high interest rates and low inflation. Since then, there have beenmultiple expansions in European markets due to interest rate reductions and expectations ofimproved earnings. This chaos actually improved the possibility of the formation of the EU’smonetary union on January 1, 1999.
4.2.10 The Mexican peso crisis of December 1994
In December 1994, Mexico faced a balance-of-payments crisis. Investors lost confidence inMexico’s ability to maintain the exchange rate of the peso within its trading band. Intense pressure on the peso in foreign-exchange markets threatened to exhaust Mexico’s internationalreserves.
On December 20, the Mexican government announced its decision to devalue the peso againstthe dollar by 14 percent. This decision, however, touched off a panic situation to sell pesos. Asa result, on December 22, the peso fell against the dollar by as much as 40 percent, compellingthe Mexican government to float the peso. A rash of speculative attacks against other Latin American currencies – Argentina (peso), Brazil (real), Peru (new sol), and Venezuela (bolivar) –broke out immediately through what became known as the “tequila” effect. Several countries thatare not part of Latin America – Thailand, Hong Kong, the Philippines, and Hungary – also suf-fered brief speculative attacks. However, only few countries actually devalued their currencies.Argentina was the only other country that suffered a sharp recession as a result of the Mexicanpeso crisis.
On January 31, 1995, the IMF and the US government put together a $50 billion packageto bail out Mexico. We discuss this peso crisis in detail through two mini-cases: one at the endof this chapter and another at the end of chapter 9.
4.2.11 The Asian financial crisis of 1997–8
For three decades, East Asian countries were held up as economic icons. Their typical blend ofhigh savings and investment rates, autocratic political systems, export-oriented businesses,restricted domestic markets, government capital allocation, and controlled financial systems were
A BRIEF HISTORY OF THE INTERNATIONAL MONETARY SYSTEM 93

hailed as ideal ingredients for strong economic growth for developing countries. Well, such agovernment-directed economic strategy turned out to be outdated in the late 1990s, as globaleconomic integration began to advance amid intensified international competition. As a result,in July 1997, currency turmoil erupted in Thailand, spreading to other Asian countries, then toRussia, and ultimately to Latin America. In fact, this crisis, the worst since the 1980s debt crisis,had pushed one third of the globe into recession during 1998.
During the second half of 1997, currencies and stock markets plunged across East Asia, whilehundreds of banks, builders, and manufacturers went bankrupt. In the fourth quarter of 1997,the IMF arranged emergency rescue packages of $18 billion for Thailand, $43 billion for Indone-sia, and $58 billion for Korea. By the end of 1998, the Asian crisis of 1997 had spread to Russia,Brazil, and many other countries. Again, the IMF arranged bailout packages of $23 billion forRussia in July 1998 and $42 for Brazil in November 1998. This means that from late 1997 tolate 1998, IMF-led rescue packages for Asia, Russia, and Brazil racked up some $184 billion tokeep world markets safe. We will discuss this crisis in detail in chapter 11. Table 4.1 shows majorcurrency events from 1914 to 2002.
4.3 The International Monetary Fund
The International Monetary Fund (IMF) was created at the Bretton Woods conference as aweak kind of central banks’ central bank, to make the new monetary system feasible and work-able. Its major purpose was to assist members that would have structural trade problems or cur-rencies that were highly unstable in value. The IMF permitted its deficit members to buy withtheir local currencies some of its own holdings of convertible currencies. These deficit countrieswere expected to buy back, with gold or other convertible currencies, the local currencies theyhad sold to the IMF after they had improved their balance of payments. Thus, the IMF’s majorweapon is the power to declare its members ineligible to utilize its holdings of internationalreserves.
The IMF was created in 1944 by 30 countries, but today it consists of some 180 membercountries. Article I of the IMF Articles of Agreement clearly set forth its objectives as follows:
1 To promote international monetary cooperation.2 To facilitate the balanced growth of international trade.3 To promote exchange stability.4 To eliminate exchange restrictions.5 To create standby reserves.
The IMF established rules and procedures to keep participating countries from going too deeplyinto balance-of-payments deficits. Those countries with short-term payments difficulties coulddraw upon their reserves. The amount of such reserves is defined in relation to each member’squota. This quota is determined on the basis of such factors as trade, national income, and inter-national payments. Each member is required to contribute 75 percent of its quota in its owncurrency and 25 percent in special drawing rights or convertible currencies.
These quotas for IMF members are reviewed at least every 5 years, to determine whetherquotas should be increased to accommodate the growth of the world economy. Germany andJapan share second place in terms of quota size after the USA, followed by France and the UK,
94 THE INTERNATIONAL MONETARY SYSTEM

Table 4.1 The history of the international monetary system
1914 The breakdown of the gold standard; monetary disorder began1934 The US dollar pegged at $35 per ounce of gold1944 The conference at Bretton Woods, New Hampshire, established a fixed exchange
system based on the US dollar; the IMF and the World Bank created1958 The European Economic Community established1963 The USA levied “Interest Equalization Tax” on foreign borrowings in US capital
markets1963 The USA imposed voluntary controls on capital outflows from US banks and
companies1968 The USA imposed mandatory controls on foreign investment by US companies1970 Special drawing rights created1971 On August 15, the US dollar floated; the convertibility of the US dollar eliminated; an
import surcharge imposedOn December 17, the Smithsonian Agreement reached; the US dollar devalued from
$35 per ounce of gold to $381972 A snake (2.25%) within a tunnel (4.5%) established1973 The US dollar devalued from $38 to $42.22 in March1973 The Organization for Petroleum Exporting Countries (OPEC) imposed an oil embargo,
eventually quadrupling world prices of oil1976 An IMF meeting in Jamaica, known as the “Jamaica Agreement,” legalized the
existing floating system1978 The EEC established the European Monetary System (EMS), which officially replaced a
snake within a tunnel; this was a joint floating system1982 The Latin American debt crisis1985 The “Group of Five” countries reached the Plaza Agreement, to reduce the value of
the US dollar1987 The major industrialized countries reached the Louvre Accord, to support stability and
exchange rates around their current levels1992 High German interest rates caused the “September 1992 currency crisis in Europe”;
Italy and the UK withdrew from the EMS1993 The July 1993 currency crisis in Europe forced the EEC to widen the allowable
deviation band to ±15%1993 A single European Community was created; the name of the EEC was changed to the
European Union (EU)1994 The Mexican peso suffered major devaluation (40%) and began to float1997 In July, currency turmoil erupted in Thailand and spread to Indonesia, South Korea,
and other South Asian countries1999 On January 1, 11 European countries launched a single European currency called the
euro, with a common monetary policy established by an independent EuropeanCentral Bank
2001 On January 1, Greece adopted the euro2001 On January 8, the Argentine peso, whose value had been fixed to the US dollar at
parity since 1991 through a currency board, was first devalued to Ps1.4 per dollarand then floated
2002 On January 1, the euro began public circulation and was traded alongside the nationalcurrencies; on March 1, the euro replaced the national currencies of eurozonecountries
2004 On May 1, the EU accepted 10 new members

which have equal quotas. The voting power of the members is determined by 250 “basic votes,”plus one vote for each SDR 100,000 of quota. Because of its large quota, the USA still holdsclose to 20 percent of the total votes.
IMF members borrow by exchanging their own currencies for convertible currencies of othermember countries. A member country may draw, virtually at will, 100 percent of its quota fromthe IMF at any time; the 100 percent of its quota is called the reserve tranche. A country couldborrow beyond this amount up to an additional 100 percent of its quota; this 100 percent iscalled the credit tranche. Thus, a member country could conceivably borrow 200 percent of itsquota in convertible currencies. But in order to borrow more than 100 percent of its quota, amember must accept restrictions imposed by the IMF to ensure that steps are being taken tocorrect the borrower’s currency problems.
96 THE INTERNATIONAL MONETARY SYSTEM
Global Finance in Action 4.1The Case for an Asian Monetary Fund
Between 1990 and 1996, capital inflows to emerging market countries rose from $60billion to $194 billion. No one carefully monitored these capital flows. When prob-lems developed in Asia in 1997, neither the IMF nor the private lenders knew thetrue magnitude of the debts of some of these countries. The provision of the IMFArticles of Agreement requiring surveillance and the decision to strengthen surveil-lance following the 1995 Mexican crisis had proved to be of little use.
In exchange for the IMF emergency aid package of $119 billion, Korea, Indonesia,and Thailand agreed to adopt contractional macroeconomic policies and to undergostructural economic reforms. However, the IMF quickly lifted these traditional con-tractional measures, because these three countries had relatively small amounts offoreign debt and current-account deficits. This policy mistake on the part of the IMFprompted the East Asian economies to revive the idea of creating an Asian MonetaryFund (AMF). In September 1997, Japan surprised the international community byoffering $100 billion as initial capital for creating the AMF, to stabilize the exchangerates in the region. A Japanese version of the AMF did not materialize because of pres-sure from the IMF and the USA, but the concept has continued to persist.
Some economists hold that there are at least four rationales for a regional mone-tary fund. First, a regional monetary fund is needed because any IMF support packageis not sufficient in a case of currency crisis for middle-income countries, such as theEast Asian countries. Second, the East Asian countries are underrepresented in thequota formula of the IMF. Third, contagions of currency crisis tend to be geographi-cally concentrated, as demonstrated in the 1997–8 Asian crisis. Fourth, both regionalsurveillance and peer pressures are important in an attempt to prevent a currency crisis.
Sources: S. H. Kim and M. Haque, “The Asian Financial Crisis of 1997: Causes and Consequences,”Multinational Business Review, Spring 2002, pp. 37–44; Youn Suk Kim, “Rationale for An AsianMonetary Fund,” The Journal of Korean Economy, Fall 2001, pp. 229–48; and Allen H. Metzer,“Asian Problems and the IMF,” The Cato Journal, Winter 1998, pp. 267–8.

4.3.1 Special drawing rights
The IMF had been concerned about the lack of growth in gold holdings and about the conse-quent lack of growth in international reserves, which was slower than the growth in world trade.To solve these problems, the IMF created special drawing rights (SDRs) as an artificial inter-national reserve in 1970.
The IMF uses a simplified basket of several major currencies to determine its daily valuation.The weight for each currency is changed periodically. As shown in table 4.2, the current per-centage weights for these currencies are 45 percent for the US dollar, 29 percent for the euro,15 percent for the Japanese yen, and 11 percent for the British pound. The weight reflects therelative importance of each country in world trade and the amount of the currency held as reservesby members of the IMF.
THE USE OF SPECIAL DRAWING RIGHTS The IMF has the authority to extend the range ofofficial holders of SDRs beyond its member countries and the IMF’s General Resources Account.It has designated about 20 organizations as prescribed holders. Each of these institutions canacquire and use SDRs in transactions and operations with other prescribed holders and with anyof the IMF’s member countries. Prescribed holders have the same degree of freedom as IMFmembers to use SDRs for a variety of international transactions.
IMF members may also use SDRs in a variety of voluntary transactions and operations byagreement among themselves and with prescribed holders. More specifically, IMF members andprescribed holders buy and sell SDRs both spot and forward; borrow, lend, or pledge SDRs; useSDRs in swaps and in settlement of financial obligations; or make donations (grants) using SDRs.
The SDR is an international reserve asset created by the IMF in 1970 and allocated to itsmembers to supplement existing reserve assets. All member countries of the IMF are eligible toreceive allocation of SDRs and may use SDRs in transactions and operations among themselves,with prescribed holders, and with the IMF itself.
The SDR is used as a unit of account, or as a basis for the unit of account, by a number ofinternational and regional organizations. The SDR has also been used to denominate privatefinancial instruments. The use of the SDR as a unit of account is explained, in part, by the factthat the value of the SDR tends to be more stable than that of any single currency in the basket,since it is a weighted average of the exchange rates of the four major currencies in which theprices of goods and services in international trade are denominated.
THE INTERNATIONAL MONETARY FUND 97
Table 4.2 The composition of the special drawing rights
Currency 1981–5 1986–90 1991–5 1996–2000 2001–5
US dollar 42% 42% 40% 39% 41%Euro – – – – 33%German mark 19% 19% 21% 21% –Japanese yen 13% 15% 17% 18% 15%British pound 13% 12% 11% 11% 11%French franc 13% 12% 11% 11% –
Source: The International Monetary Fund, Washington, DC.

4.4 The European Monetary Union
Many attempts to establish monetary unions across national borders have failed, but a few suc-cessful unions still exist today. For example, member countries of the Central African Franc Zoneand the Eastern Caribbean Currency Union use the franc and the Eastern Caribbean dollar astheir respective single common currencies. A monetary union is a formal arrangement in whichtwo or more independent countries agree to fix their exchange rates or to employ only one cur-rency to carry out all transactions. One of the most ambitious efforts to date has to do with theEU, which has strived toward a European Monetary Union (EMU) since 1957. Full union wasachieved on January 1, 2002, which enabled participating member countries to carry out trans-actions with one currency through one central bank, under one monetary policy. This sectionpresents a history of the European monetary system (EMS), from the snake within a tunnel ofthe 1970s to the EU’s recent moves in the direction of monetary union.
4.4.1 The snake within a tunnel
In May 1972, the EEC agreed to allow its currencies to fluctuate a maximum of 2.25 percentagainst one another, while permitting a 4.5 percent fluctuation against other currencies. Thissystem became known as a “snake within a tunnel.” The “snake” was the narrower band of 2.25percent permitted among the EEC countries and the “tunnel” was the wider band of 4.5 percentallowed by the Smithsonian Agreement.
The UK, Ireland, and Denmark joined the EEC in 1973. This was followed by a series ofinternational monetary crises, such as the devaluation of the US dollar in February. In mid-March, the values of all major currencies were permitted to fluctuate according to market forces.Thus, the tunnel was gone in March 1973, but EEC countries had tried to maintain the snake.Some of these attempts were short-lived. For instance, France, after withdrawing from the snakeand rejoining it several times, finally abandoned the snake in March 1976. Many causes of con-flict between domestic economic goals and exchange stability intensified domestic pressures onmany other participating countries to abandon the snake. The number of participating countriesin the snake fell to six by late 1978: the German mark, the Dutch guilder, the Norwegian krone,the Belgian franc, the Danish krone, and the Luxembourg franc. The three main initial membersof the snake – the UK, France, and Italy – had abandoned it some years earlier.
4.4.2 The European Currency Unit
Serious problems had raised questions about the snake’s survival. The sharp decline in theexchange rate of the US dollar during the second half of 1978 further bolstered the desire ofEuropean countries for exchange stability. On December 5, 1978, the EEC adopted a resolutionto establish the EMS, which came into effect on March 13, 1979. The EMS was a complexexchange rate and intervention system combined with large credit facilities. The institutionalarrangements of the EMS included (1) a currency basket, (2) an exchange rate mechanism withrules of intervention, and (3) several credit facilities.
First, the European Currency Unit (ECU) was the cornerstone of the EMS. The ECU wasused as the denominator for the exchange rate mechanism; that is, as the basis for a “divergence
98 THE INTERNATIONAL MONETARY SYSTEM

indicator” to show when one currency diverges from the average of the other participating cur-rencies. The ECU was also used as the denominator for operations under both the interventionand credit mechanisms. The value of an ECU was a weighted average value of a basket of allEEC currencies. Each currency’s weight was decided by the relative importance of that country’seconomy in the total EEC output and the overall share of that country’s trade in the total intra-EC trade. Weights were normally revised every 5 years.
Second, the ECU was based on a fixed, but adjustable, exchange rate system. Each partici-pating currency has a central rate in terms of ECUs. These central rates determined a grid ofbilateral central rates. Participating currencies were allowed to fluctuate within a margin of ±2.25percent (±6 percent for Italy and Spain) from their bilateral central rates. Italy and Spain wereallowed to fluctuate their currency up to 6 percent on either side of their bilateral central rates.However, a number of currency crises in recent years forced EU governments to drastically widenthe band after July 1993.
Third, to facilitate compulsory intervention, EMS participants created short-term andmedium-term financing facilities. A short-term facility provides short-term financing for tem-porary balance-of-payments deficits. A medium-term facility was also available for balance-of-payments assistance, but its use was subject to certain conditions.
4.4.3 From the European Currency Unit to the euro
The EU’s decision to switch their monetary union from the ECU to the euro came about inDecember 1991, when EU leaders met at Maastricht, in the Netherlands, and signed the Maas-tricht Treaty. The Maastricht Treaty specified a timetable for the creation of a monetary union.Under their accord, EU leaders agreed to establish a single European currency, called the euro,by January 1, 1999, with a common monetary policy established by an independent EuropeanCentral Bank.
Since the crises of September 1992 and July 1993, EU countries had repeatedly affirmed theirintent to continue the process of economic and financial integration. In order to join the mon-etary union, European countries were required to meet the five convergence criteria:
1 An inflation rate that is no more than 1.5 percentage points above the average of the threelowest-inflation countries.
2 A long-term government bond rate that is no more than 2 percentage points above the averagebond rate of the three lowest-inflation countries.
3 A deficit that does not exceed 3 percent of gross domestic product (GDP).4 Government debt that does not exceed 60 percent of GDP.5 An exchange rate that had remained within the standard bands (±2.25 percent) of the
exchange rate mechanism for at least 2 years prior to joining the monetary union.
The eurozone, commonly known as Euroland, came into being on January 1, 1999 with 11 ofthe EU’s 15 members – Austria, Belgium, Finland, France, Germany, Ireland, Italy, Luxembourg,the Netherlands, Portugal, and Spain. The UK, Sweden, and Denmark met the five financialrequirements for qualification, but chose not to join the eurozone. Greece was the only countrythat failed to meet the required economic criteria, but Greece joined the eurozone on January 1,2001. The EU accepted 10 new members on May 1, 2004: Cyprus, the Czech Republic, Estonia,Hungary, Latvia, Lithuania, Malta, Poland, Slovakia, and Slovenia. Table 4.3 shows that the com-
THE EUROPEAN MONETARY UNION 99

bination of 25 European countries and the new currency could create a powerful global tradecompetitor to the USA and the dollar. The EU will become even stronger for years to come, asthere are currently seven other applicants working toward membership: Bulgaria, Turkey, Croatia,the Ukraine, Russia, Georgia, and Switzerland.
THE CREATION OF THE EURO Economists regard the creation of the euro as the most impor-tant development in the international monetary system since the Bretton Woods Agreement col-lapsed in 1973. The euro is a new currency unit, which replaced the individual currencies of theparticipating member countries and the ECU over a 3-year period from 1999 to 2002.
Effective January 1, 1999, the European Central Bank (ECB) began to conduct monetarypolicy with the euro. For up to 3 years after that date, national governments, many banks, andsome businesses conducted transactions in a single currency. New EU bank notes and coins didnot reach the person on the street until the start of 2002. On January 1, 2002, euro bank notesand coins were issued. National currencies continued to be accepted in trade for a short transi-tion period, which ended in all participating member countries by the end of February 2002.This means that national notes and coins had coexisted with the euro for 2 months. Conse-quently, Europe’s age-old dream of creating a single unified currency became a reality on January1, 2002.
The adoption of the euro as a common currency would eliminate exchange rate risk betweeneurozone countries and facilitate cross-border price comparisons. Lower risk and price trans-parency would encourage more trade and capital flows across European borders. Another advan-tage of a single European currency is the elimination of currency costs associated with transactionsbetween European countries. The EU has estimated that businesses in Europe spent $13 billionper year to convert money from one EU currency to another. Thus businesses, along with ordi-nary citizens, would clearly benefit from the euro through such lower currency conversion costsacross European borders. A monetary authority known as the Eurosystem manages the new cur-rency. A European Central Bank (ECB) and the national central banks of participating countriesmake up the Eurosystem. But the ECB, with a staff of 520, actually sets monetary policy for the12 nations of the eurozone. It is housed in a silver-colored skyscraper in the heart of Frankfurt,Germany’s traditional banking capital.
100 THE INTERNATIONAL MONETARY SYSTEM
Table 4.3 How the EU and the USA stack up as of December2002
Economic variables USA European Union
Population 293 million 452 millionImports $1.26 trillion $2.783 trillionExports $714.5 billion $2.88 trillionForeign-exchange reserves $83 billion $520 billionTotal GDP $10.45 trillion $11.0 trillionUnemployment rate 6.2% 8.3%
Sources: The CIA Factbook, The Economist Intelligence Unit, London, andthe International Monetary Fund, Washington, DC.

The bank’s key aim is to maintain price stability, a mandate written into the 1992 MaastrichtTreaty. The bank has so far guarded its independence fiercely, so that it can support the economicpolicies of EU nations without the expense of price stability. The chiefs of the national centralbanks travel to Frankfurt twice a month to debate and decide common policies.
Figure 4.6 depicts the euro’s percentage change against the dollar since its inception. OnDecember 1, 1999, the euro fell to parity with the US dollar for the first time since its intro-duction at $1.18 per euro on January 1 of that year. The continuous depreciation of the euroreached a low point of $0.80 per euro in October 2000, which indicates a 32 percent decline ofthe euro against the dollar for the first 2 years since its inception. The depreciation of the euroduring this period reflects the strong performance of the US economy and the large Europeaninvestment in the USA.
From the start of 2002, however, the euro began to appreciate against the dollar, reachedroughly its original exchange rate of $1.18 by the early 2003, and tumbled to $1.2579 on Decem-ber 31, 2003. “The dollar faces a long-term slow-motion crisis of confidence for several negativefactors,” said Anne Parker Mills, a foreign-exchange economist at Brown Brothers Harriman &Company in New York (Sesit 2004). These negative factors include the twin deficits in the USfederal budget (-$500 billion in 2004) and the US current account (-$500 billion in 2003),continued risks of terrorist attacks against the USA, the resurgence of protectionism, and thepossibility that Asian central banks could choose to reduce their huge dollar holdings.
THE EUROPEAN MONETARY UNION 101
$1.20
1.10
1.00
0.90
0.801999 2000 2001 2002 2003
All-time low:$0.827
All-time high:$1.2579
The euro surges against the dollar ...How many US dollars one euro buys
130
120
110
100
901999 2000 2001 2002 2003
Low for this period:101.6
High for this period:134.79
And the buck loses some of its bangHow many yen one dollars buys
Year
Figure 4.6 The US dollar’s doldrums fuel the euro’s rise
Source: The Wall Street Journal, Jan. 2, 2004, p. R13.

4.5 Proposals for Further International Monetary Reform
The Bretton Woods system had three basic defects: (1) pegged parities, (2) dollar disequilibrium,and (3) inadequate international reserves. Some important reforms introduced to solve theseproblems include special drawing rights, the Smithsonian Agreement, the snake within a tunnel,and the EMS. Nevertheless, these reforms were inadequate to maintain orderly markets.
4.5.1 Volatile exchange rates
When major industrial countries abandoned the fixed exchange rate system in 1973 in favor ofa floating-rate system, they saw their decision as a triumph for the free market. Many economistsexpected exchange rates to be fairly stable under the flexible exchange rate system. They alsoexpected that the flexible exchange rate system would reduce national trade imbalances. Majorexchange rates have been more volatile since 1974. The trade imbalances of many countries havebeen larger and more persistent since 1974.
In other words, the costs of flexible exchange rates have been greater than expected. Conse-quently, a consensus has grown that the world should return to stable but flexible policy rules.These and other problems have recently increased the need for further international monetaryreform. Proposals for further international monetary reform may be divided into two broad cat-egories: proposals for greater flexibility and other proposals.
102 THE INTERNATIONAL MONETARY SYSTEM
Global Finance in Action 4.2Europe’s Ambitious Bid for a More Perfect Union
At a summit in Greece on June 20, 2003, European heads of state inspected the latestEU draft constitution. The draft aims to emulate the Founding Fathers of the USA. Ifthe draft becomes the legal foundation of Europe, it would create a perfect union ofthe 25 member states as of 2004. These 25 states have a combined population of450 million and an economy nearly 90 percent as large as that of the USA.
One of the long-term French goals has been to give the EU a common foreignand defense policy. The draft reflects that goal by proposing a powerful “foreign min-ister” and requiring that member states unreservedly support the union’s policies in“a spirit of loyalty and solidarity.” Some heads of member governments suspect thatthe purpose here is to fulfill the Gaullist dream of Europe becoming a world powerthat would rival the USA. Their fears were reinforced when France opposed the USinvasion of Iraq in early 2003.
Source: George Melloan, “Europe’s Ambitious Bid for a More Perfect Union,” The Wall StreetJournal, June 17, 2003, p. A17.

4.5.2 Proposals for greater flexibility
A system of additional flexibility, or even a system of freely flexible exchange rates, has been sug-gested to restructure the current international monetary system so that deficit countries mightsolve their payments problems. It seems reasonable to assume that fixed exchange rates, whichexisted under the gold standard before World War I, are now practically impossible. Moreover,fixed but adjustable exchange rates could not accommodate highly diversified modern economiesmore than one half-century after the Bretton Woods Agreement. Countries differ too much inprice levels, wage costs, monetary policies, and international capital flows to keep fixed exchangerates.
A WIDER BAND A wider band has been frequently suggested as an alternative to the presentinternational monetary system. The Bretton Woods Agreement allowed a band of 2.25 percent,and the Smithsonian Agreement approved a band of 4.5 percent. Proponents of this wider bandwould like to see it expanded further. They argue that a wider band would allow central banksto enjoy freedom to pursue independent monetary policies.
THE CRAWLING PEG The crawling peg is a proposal that would provide for regular modifi-cation of par value according to an agreed-upon formula. Under this system, a country wouldpermit its currency to appreciate or depreciate slowly, rather than fight to maintain a band ofcertain percentages around par value. The crawling peg would provide relatively stable exchangerates for those nations, which consider this stability essential for international transactions.Balance-of-payments problems would also be self-adjusted through the international price mech-anism rather than through exchange controls, restrictions on the growth of national income andemployment, price controls, or other unpopular internal policies.
THE CRAWLING BAND A crawling band combines a wider band and a crawling peg. In otherwords, this proposal is a compromise between the inflexible exchange rates of the gold standardand a system of completely fluctuating exchange rates. Each parity level would be adjusted upwardor downward as a moving average of the actual exchange rates that could fluctuate within a widerband: (1) within 1 year, the exchange rate parity would be allowed to move a predeterminedmaximum – say, 2 percent – and this 2 percent is called the annual crawling peg; (2) this slowlycrawling peg would be surrounded by a wider band within which the actual exchange rate couldfluctuate.
4.5.3 Other proposals
A number of proposals ask for the creation of a super-central institution that would perform thesame function for an international economy as the commercial banking system performs for adomestic economy. John Keynes (Machlup 1964), for instance, proposed the establishment ofan International Clearing Union that would create an international currency called the “bancor.”Under this system, deficit countries would be able to borrow bancors to finance their deficits.
To illustrate another viewpoint, Robert Triffin (1968) proposed the creation of reserves by aninternational institution such as the IMF. Under this proposal, surplus countries would berequired to deposit a portion of their holdings in key currencies (dollars, special drawing rights,
PROPOSALS FOR FURTHER INTERNATIONAL MONETARY REFORM 103

yen, and pounds) in the IMF instead of holding them as monetary reserves. On the basis of thesedeposits, the IMF could create necessary international monetary reserves through its loans todeficit countries.
Another proposal calls for enlarging the number of reserve countries. To reduce exchange risk,many central banks have recently diversified their portfolios of reserve assets to include Japaneseyen, euros, special drawing rights, and gold. An increased number of reserve countries wouldspread the reserve-currency burden more evenly than before and leave the monetary system lessvulnerable to attack. Freely flexible exchange rates, discussed in the earlier part of this chapter,have been frequently suggested to reform the international monetary system. Completely flexible exchange rates have never been tried. It is unlikely that they ever will be.
104 THE INTERNATIONAL MONETARY SYSTEM
SUMMARY
Financial managers must understand the international monetary system if they are to manage multi-national businesses efficiently. Foreign-exchange rates determine the prices of goods and services thatmultinational companies buy and sell across national boundaries. These exchange rates also have animpact on foreign investments.
Considered historically, the international monetary system of the late nineteenth century evolvedinto the current dirty floating system. The pre-1914 gold standard represents one extreme of theinternational monetary system. Under this system, the exchange rate for each currency was fixed interms of gold. The flow of gold restored the balance-of-payments equilibrium. In the case of a deficit,a gold outflow would take place to finance an external deficit. In the case of a surplus, a gold inflowwould occur to eliminate an external surplus.
World War I ended the stability of exchange rates for currencies of major trading partners. Theworld then experienced international monetary disorder from 1914 to 1945. The Great Depressionof 1929–32 and the international financial crisis afterwards resulted in international monetary chaos.To summarize the international monetary system from 1914 to 1945, we find a mixture of widelyfluctuating exchange rates and controlled exchange rates.
The Bretton Woods Agreement of 1944 marked a new era for the operation of the internationalmonetary system, which was a system of fixed exchange rates based on a revised gold standard, calledthe gold exchange standard. Each currency was fixed within a narrow range of value in relation togold or the US dollar. Many member countries were unable or unwilling to abide by the BrettonWoods Agreement, because its provisions were complex and because their interests conflicted. Nev-ertheless, the Bretton Woods Agreement and the activity of the IMF were the main features of theinternational monetary system from 1945 to 1973.
Two problems raised serious questions about the function of the Bretton Woods Agreement asthe international monetary system. First, the growth of monetary reserves was inadequate. Second,effective balance-of-payments adjustments could not be achieved under the Agreement. Attemptsto save the Bretton Woods Agreement through the introduction of SDRs and the SmithsonianAgreement failed when the whole system collapsed in 1973. Since 1973, the international mone-tary system has been characterized by a confusing mixture of freely floating, managed floating, jointfloating, and fixed rates.

REFERENCES 105
Questions
1 Some governments and economists have repeatedly suggested that the internationalmonetary system return to a system of fixed exchange rates. Discuss the pros and consof the fixed exchange rate system.
2 Why did the US dollar become so weak and the Bretton Woods Agreement fail in 1973?3 Analysts said that President Nixon’s speech delivered on August 15, 1971 was designed
to prepare Americans for a multipolar world, because American decline – both eco-nomically and militarily – was inevitable. List the decisions announced in this famousspeech.
4 List those events that would change a country’s demand for and supply of foreignexchange.
5 What are some alternative exchange rate systems?6 List the objectives of the International Monetary Fund (IMF).7 What are special drawing rights (SDRs)? How is the value of the SDR determined?8 What is a currency board? What are the solid fundamentals in order to have a success-
ful currency board? How did the currency board that pegged the Argentinian peso tothe US dollar during the 1990s affect Argentina’s current account and thus its economy?
9 What is dollarization? What are the arguments for and against dollarization?10 When do volatile exchange rates exist?11 The major industrialized countries have practiced the floating exchange rate system since
1973. Under the floating-rate system, economists expected exchange rates to be fairlystable and trade imbalances to fall. Have these two expectations been realized?
12 What are the advantages of a common currency such as the euro?
REFERENCES
Antinolfi, G. and T. Keister, “Dollarization as aMonetary Arrangement for Emerging MarketEconomies,” Review, Federal Reserve Bank of St.Louis, Nov./Dec. 2001, pp. 29–39.
Bloughten, J. M., Fifty Years After Bretton Woods: TheFuture of IMF and World Bank, Washington, DC:International Monetary Fund, 1995.
Cooper, R. N., The International Monetary System:Essays in World Economics, Cambridge, MA: TheMIT Press, 1987.
Hickman-Riggs, L. and W. A. Riggs, “The Creationof the Euro,” Management Accounting Quarterly,Spring 2001, pp. 35–40.
Kim, S. H. and M. Haque, “The Asian FinancialCrisis of 1997: Causes and Consequences,”Multinational Business Review, Spring 2002, pp.37–44.
Kim, Y. S., “Rationale for An Asian MonetaryFund,” The Journal of Korean Economy, Fall 2001,pp. 229–48.
Kopcke, R. W., “Currency Boards: Once and FutureMonetary Regimes,” New England EconomicReview, May/June 1999, pp. 21–37.
Machlup, F., Plans for Reform of the InternationalMonetary System, Princeton, NJ: Princeton Uni-versity Press, 1964.

106 THE INTERNATIONAL MONETARY SYSTEM
Metzer, A. H., “Asian Problems and the IMF,” TheCato Journal, Winter 1998, pp. 267–8.
Sesit, M. R., “Dollar Face Further Pressure underUS Deficits, Protectionism,” The Wall StreetJournal, Jan. 2, 2004, p. R13.
Triffin, R., Our International Monetary System: Yes-terday, Today, and Tomorrow, New York: RandomHouse, 1968.
White, J. A., “Flexible Exchange Rates: An IdeaWhose Time Has Passed?” Economic Review,Federal Reserve Bank of Atlanta, Sept./Oct.1990, pp. 2–15.
Wynne, M. A., “The European System of Central Banks,” Economic Review, FederalReserve Bank of Dallas, First Quarter 1999, pp. 2–13.
Case Problem 4: The Mexican Peso Crisis ofDecember 1994
Before the December 1994 devaluation, the Mexican government had essentially pegged thepeso to the US dollar through its exchange rate stabilization program. Mexico permitted itsexchange rate to fluctuate within a band of 2 percent. However, in December 1994 Mexicofaced a balance-of-payments crisis. Investors lost confidence in Mexico’s ability to maintainthe exchange rate of the peso within its trading band, in part because of Mexico’s largecurrent-account deficit, which had reached almost $28 billion in that year. Intense pressureon the peso in foreign-exchange markets threatened to exhaust Mexico’s internationalreserves. This pressure eventually compelled the Mexican government to float the peso andled to the now-famous peso crisis between December 1994 and early 1995.
Exchange rate stabilization programs by developing countries are very difficult to pursueeffectively over protracted periods. In programs such as that of Mexico, devaluation is notunusual, even when care is taken to address the typical problems by using exchange ratepegging as only a part of the overall program. After taking office on December 1, 1988, Pres-ident Carlos Salinas used “pegging” as an important element of a broader program thatincluded reduced government spending, tax reform, deregulation, privatization, and signifi-cant trade liberalization – including rapid reductions in tariffs and quotas through entries intothe General Agreement on Tariffs and Trade (GATT), into the North American Free TradeAgreement (NAFTA), and into the Organization for Economic Cooperation and Development(OECD). This broader economic program reduced the number of government-owned enter-prises from 1,100 in 1987 to 220 in 1994, decreased inflation from 159 percent in 1987 to7 percent in 1994, eliminated the nation’s budget deficit, increased exports to the USA by35 percent, and cut wage increases in half between 1987 and 1994. The real sector of theMexican economy was healthy, not sick.
The key, then, was not to balance the current account with the rest of the world, but tobalance trade deficits with voluntary investment inflows. Mexico ran current-account deficitsof $25 billion in 1992 and $23 billion in 1993, and during this time not only maintained thepeso at around $3.1, but accumulated large foreign reserves. In 1994, the current-accountdeficit was only slightly higher – $27 billion after 11 months. The problem came with theinflows, as political turmoil shook investor confidence.

CASE PROBLEM 4 107
The biggest shock came in March 1994, when presidential candidate Luis Colosio wasassassinated. Ernesto Zedillo, who had been Salinas’s Planning and Budget Minister, wasColosio’s hastily selected replacement; he was elected in August as the new president.Colosio’s killing, a year-long peasant rebellion in southern Mexico, and the September 1993assassination of the ruling party secretary Francisco Ruiz had combined to weaken interna-tional investor confidence, while creating an image of Mexico as politically unstable. Conse-quently, foreign-exchange reserves had fallen from a peak of $30 billion before the Colosioassassination on March 23 to about $12 billion at the Zedillo inauguration on December 1(see figure 4.7).
Mexico decided to devalue, widening the bands on the exchange rate on December 20and going to a freely floating rate on December 22. The latter decision was actually forced,because the earlier one collapsed as investor confidence in the peso disappeared. Wideningthe bands clearly presaged devaluation and led to a massive capital flight from the peso, andloss of $6 billion – or half of the remaining reserves – in one day. Judging by their public eco-nomic plans, the Mexican authorities had in mind an exchange rate of 4.07 pesos to thedollar, a 14 percent devaluation from the earlier 3.50 floor. But with confidence imploding,the peso dropped immediately to 5.80, a 40 percent devaluation (see figure 4.8).
Colosio assassination
Carpizoresignationthreat
Ruiz massresignation
$ millions
30,000
25,000
20,000
15,000
10,000
5,000
0J J JF M MA A S O N D
1994
Figure 4.7 Mexican international reserves in 1994

108 THE INTERNATIONAL MONETARY SYSTEM
Case Questions
1 Normally, economists suggest that exchange rate pegging by developing countries suchas Mexico ought to be a temporary stabilization tool, ultimately followed by a managedfloat, a crawling band, or a floating exchange rate system. Briefly define each of thesethree exchange regimes.
2 Approximately $24 billion had fled Mexico in a run on the peso between April 1 andDecember 21, 1994. What is capital flight? How does it differ from capital flows? Whatwere the major causes of capital flight in Mexico?
3 Explain the Mexican rescue package of $50 billion arranged by the USA and the Inter-national Monetary Fund to avert a broader financial crisis.
4 In making this unusual commitment (a $50 billion rescue package), was the world unin-tentionally rewarding Mexican mismanagement? What was to keep the same problemsfrom causing another financial crisis that would require another rescue plan in the future?
5 Given all of Mexico’s problems, how risky was the US $20 billion aid package?
3
4
5
6
7November December January Feb.
1994 1995
Figure 4.8 Mexican pesos per US dollar (inverted scale)

CASE PROBLEM 4 109
6 The home page of the International Monetary Fund (IMF), www.imf.org, provides IMF-related news, their contracts, and an update on their most recent activities. Use this webpage to find out about current IMF loans to its member countries.
Sources: T. Carrington, “Some Questions and Answers About Clinton’s New Plan to Aid Mexico,” The WallStreet Journal, Feb. 2, 1995, p. A5; T. Carrington, T. D. Rogers, and R. Wartzman, “Clinton Hastily DropsMexican Rescue Plan, Gives New Aid Instead,” The Wall Street Journal, Feb. 1, 1995, pp. A1, A6.


In 1997, two American finance professors – Robert Merton of Harvard University and MyronScholes of Stanford University – received the Nobel Prize in economics for their groundbreak-ing work on option pricing that helped spawn the present $100 trillion derivatives industry. Inthe early 1970s, Professor Scholes invented an insightful method of pricing options and warrantsat a time when investors and traders still relied on educated guesses to determine the value ofvarious stock market products. Professor Merton later demonstrated the broad applicability ofthis options-pricing formula, which led to the incredible growth in the derivatives market.
Part II (chapters 5–10) explains relationships between exchange rates and economic variables,with an emphasis on foreign-exchange risk management. This part covers not only the spotmarket but also the derivatives market. Currency derivatives – forwards, futures, options, futuresoptions, and swaps – are contracts whose values are derived from the prices of underlying currencies. They are offered through two channels: organized exchanges and over-the-countermarkets. Organized exchanges such as the Chicago Mercantile Exchange and similar exchangesaround the world have expanded their menu of products. Over-the-counter (OTC) markets, suchas banks and some other financial institutions, also offer and are willing to tailor make theseproducts for their customers. Before we consider currency derivatives separately in coming chap-ters, we will describe the key derivatives terminology below.
Derivatives and Terminology
cap An option that protects the buyer from a rise in a particular interest rate above a certainlevel.
collar The simultaneous purchase of a cap and sale of a floor, with the objective of maintain-ing interest rates within a defined range.
dealer A counterparty that enters into a swap in order to earn fees or trading profits, servingcustomers as an intermediary.
PART II
Corporate Foreign-ExchangeRisk Management

derivative A contract whose value depends on, or is derived from, the value of an underlyingasset.
end-user A counterparty that engages in a swap to manage its interest rate or currency exposure.
exercise (strike) price The price at which some currency underlying a derivative instrument canbe purchased or sold on or before the contract’s maturity date.
floor An option that protects the buyer from a decline in a particular interest rate below a certainlevel.
forward An OTC contract obligating a buyer and a seller to trade a fixed amount of a particu-lar asset at a set price on a future date.
future A highly standardized forward contract traded on an exchange.futures option A contract giving the holder the right, but not the obligation, to buy or sell a
futures contract at a set price during a specified period.hedging The reduction of risk by eliminating the possibilities of foreign-exchange gains or losses.notional value The principal value upon which interest and other payments in a transaction
are based.option A contract giving the holder the right, but not the obligation, to buy or sell a fixed
amount of an asset at a set price during a specified period.over-the-counter (OTC) market The market in which currency transactions are conducted
through a telephone and computer network connecting currency dealers, rather than on thefloor of an organized exchange.
swap A forward-type contract in which two parties agree to exchange a series of cash flows inthe future according to a predetermined rule.
swaption An option giving the holder the right to enter or cancel a swap transaction.underlying The asset, reference rate, or index whose price movement determines the value of
the derivative.
112 CORPORATE FOREIGN-EXCHANGE RISK MANAGEMENT

Opening Case 5: The Volume of Foreign-Exchange Trading
Can you figure out which one is larger: the volume of foreign-exchange trading orthe volume of world trade? The single statistic that perhaps best illustrates the dra-matic expansion of international financial markets is the volume of trading in theworld’s 48 foreign-exchange markets. The volume of foreign-exchange trading inthese markets in April 2001 was $1.2 trillion per day. In comparison, the global volumeof exports of goods and services for all of 2001 was $6 trillion, or about $16.5 billionper day. In other words, foreign-exchange trading was about 73 times as great astrade in goods and services. Derivatives market transactions (67 percent) exceededspot market transactions (33 percent). The market for foreign exchange is the largestfinancial market in the world by any standard. It is open somewhere in the world 365days a year, 24 hours a day.
Interestingly, this number actually represents a drop in overall trading levels. Thevolume of foreign-exchange trading had grown by 26 percent from 1995 to 1998and by 46 percent from 1992 to 1995. From 1998 to 2001, however, this trend wasreversed and the volume of foreign-exchange trading decreased by 19 percent. Themain causes for this decrease were the worldwide economic problems caused by therecession in the United States, the September 11 attacks, and the bursting of the tech-nological stock bubble. Additionally, the switch to the euro lowered the volume oftrading, because Europe’s common currency eliminates the need to trade one euro-zone currency for another.
Figure 5.1 shows that in 2001, the largest amount of foreign-exchange tradingtook place in the United Kingdom (33 percent). Indeed, the trading volume in Londonwas so large that a larger share of currency trading in US dollars occurred in the UK
CHAPTER 5
The Foreign-ExchangeMarket and Parity Conditions

The efficient operation of the international monetary system has necessitated the creation of aninstitutional structure, usually called the foreign-exchange market. This is a market where onecountry’s currency can be exchanged for that of another country. Contrary to what the termmight suggest, the foreign-exchange market actually is not a geographical location. It is an infor-mal network of telephone, telex, satellite, facsimile, and computer communications betweenbanks, foreign-exchange dealers, arbitrageurs, and speculators. The market operates simultane-ously at three tiers:
114 THE FOREIGN-EXCHANGE MARKET AND PARITY CONDITIONS
than in the USA. The USA had the second-largest exchange market (17 percent), fol-lowed by Japan (10 percent) and Singapore (7 percent). This means that 67 percentof all global currency trading occurred in just four countries – the UK, the USA, Japan,and Singapore.
The introduction of the euro affected the major centers for currency trading. WhileLondon and New York were by far the most important cities for currency trading,Frankfurt, Germany, closed its gap with Tokyo and Singapore and jumped past HongKong, Paris, and Zurich in the volume of foreign-exchange trading. This was largelydue to the prominent role that Frankfurt, the host city of the European Central Bank,plays in euro trading.
Sources: www.wto.org and www.bis.org/publ/rpfx02.htm.
UK33%
USA17%
Japan 10%
Singapore 7%
Germany 6%
Switzerland 5%
Hong Kong SAR 5%
Australia 4%
France 3%
Canada 3%
The Netherlands 2% Sweden 2%Denmark 2%
Italy 1%
Countries withshares less than1% not included
Figure 5.1 Shares of the reported foreign-exchange trading volume, 2001Source: The Federal Reserve Bank of New York, www.ny.frb.org

1 Individuals and corporations buy and sell foreign exchange through their commercial banks.2 Commercial banks trade in foreign exchange with other commercial banks in the same finan-
cial center.3 Commercial banks trade in foreign exchange with commercial banks in other financial
centers.
The first type of the foreign-exchange market is called the retail market, and the last two areknown as the interbank market.
We must first understand the organization and dynamics of the foreign-exchange market inorder to understand the complex functions of global finance. This chapter explains the roles ofthe major participants in the exchange market, describes the spot and forward markets, discussestheories of exchange rate determination (parity conditions), and examines the roles of arbitrageurs.
5.1 Major Participants in the Exchange Market
The foreign-exchange market consists of a spot market and a forward market. In the spot market,foreign currencies are sold and bought for delivery within two business days after the day of atrade. In the forward market, foreign currencies are sold and bought for future delivery.
There are many types of participants in the foreign-exchange market: exporters, governments,importers, multinational companies (MNC), tourists, commercial banks, and central banks. Butlarge commercial banks and central banks are the two major participants in the foreign-exchangemarket. Most foreign-exchange transactions take place in the commercial banking sector.
5.1.1 Commercial banks
Commercial banks participate in the foreign-exchange market as intermediaries for customerssuch as MNCs and exporters. These commercial banks also maintain an interbank market. In other words, they accept deposits of foreign banks and maintain deposits in banks abroad.Commercial banks play three key roles in international transactions:
1 They operate the payment mechanism.2 They extend credit.3 They help to reduce risk.
OPERATING THE PAYMENT MECHANISM The commercial banking system provides the mech-anism by which international payments can be efficiently made. This mechanism is a collectionsystem through which transfers of money by drafts, notes, and other means are made interna-tionally. In order to operate an international payments mechanism, banks maintain deposits inbanks abroad and accept deposits of foreign banks. These accounts are debited and credited whenpayments are made. Banks can make international money transfers very quickly and efficientlyby using telegraph, telephones, and computer services.
MAJOR PARTICIPANTS IN THE EXCHANGE MARKET 115

EXTENDING CREDIT Commercial banks also provide credit for international transactions andfor business activity within foreign countries. They make loans to those engaged in internationaltrade and foreign investments on either an unsecured or a secured basis.
REDUCING RISK The letter of credit is used as a major means of reducing risk in internationaltransactions. It is a document issued by a bank at the request of an importer. In the document,the bank agrees to honor a draft drawn on the importer if the draft accompanies specified doc-uments. The letter of credit is advantageous to exporters. Exporters sell their goods abroad againstthe promise of a bank rather than a commercial firm. Banks are usually larger, better known, andbetter credit risks than most business firms. Thus, exporters are almost completely assured ofpayment if they meet specific conditions under letters of credit.
EXCHANGE TRADING BY COMMERCIAL BANKS Most commercial banks provide foreign-exchange services for their customers. For most US banks, however, currency trading is not animportant activity and exchange transactions are infrequent. These banks look to correspondentsin US money centers to execute their orders.
A relatively small number of money-center banks conduct the bulk of the foreign-exchangetransactions in the United States. Virtually all the big New York banks have active currencytrading operations. Major banks in Chicago, San Francisco, Los Angeles, Boston, Detroit, andPhiladelphia also are active through head office operations as well as affiliates in New York andelsewhere. Thus, all commercial banks in the USA are prepared to buy or sell foreign-currencybalances for their commercial customers as well as for the international banking activities of theirown institutions.
Bank trading rooms share common physical characteristics. All are equipped with moderncommunications equipment to keep in touch with other banks, foreign-exchange brokers, andcorporate customers around the world. Over 30 US banks have direct telephone lines with theFederal Reserve Bank of New York. Traders subscribe to the major news services to keep currenton financial and political developments that might influence exchange trading. In addition, thebanks maintain extensive “back office” support staffs to handle routine operations such as con-firming exchange contracts, paying and receiving dollars and foreign currencies, and keepinggeneral ledgers. These operations generally are kept separate from the trading room itself to assureproper management and control.
In other important respects, however, no two trading rooms are alike. They differ widelyaccording to the scale of their operations, the roster of their corporate customers, and their overallstyle of trading. The basic objectives of a bank’s foreign-exchange trading policy are set by seniormanagement. That policy depends upon factors such as the size of the bank, the scope of itsinternational banking commitments, the nature of trading activities at its foreign branches, andthe availability of resources.
THE GLOBAL MARKET AND NATIONAL MARKETS Banks throughout the world serve as marketmakers in foreign exchange. They comprise a global market in the sense that a bank in onecountry can trade with another bank almost anywhere. Banks are linked by telecommunicationsequipment that allows instantaneous communication and puts this “over-the-counter” market asclose as the telephone or the telex machine.
Because foreign exchange is an integral part of the payment mechanism, local banks maybenefit from closer access to domestic money markets. They usually have an advantage in trading
116 THE FOREIGN-EXCHANGE MARKET AND PARITY CONDITIONS

their local currency. For instance, the buying and selling of pounds sterling for dollars is mostactive among the banks in London. Similarly, the major market for Swiss francs is in Zurich; andthat for Japanese yen, in Tokyo. But the local advantage is by no means absolute. Hence,dollar–euro trading is active in London and dollar–sterling trading is active in Zurich. Further-more, New York banks trade just as frequently with London, German, or Swiss banks in all majorcurrencies as they do with other New York banks.
Foreign exchange is traded in a 24-hour market. Somewhere in the world, banks are buyingand selling dollars for, say, euros at any time during the day. Figure 5.2 shows a map of majorforeign-exchange markets around the globe, with time zones included for each major market.This map should help readers understand the 24-hour operation of major foreign-exchangemarkets around the world. Banks in Australia and the Far East begin trading in Hong Kong, Singapore, Tokyo, and Sydney at about the time most traders in San Francisco go home forsupper. As the Far East closes, trading in Middle Eastern financial centers has been going on fora couple of hours, and the trading day in Europe has just begun. Some of the large New Yorkbanks have an early shift to minimize the time difference of 5–6 hours with Europe. By the timeNew York trading gets going in full force around 8 a.m., it is lunch time in London and Frank-furt. To complete the circle, West Coast banks also extend “normal banking hours” so they cantrade with New York or Europe, on one side, and with Hong Kong, Singapore, or Tokyo, on theother.
One implication of a 24-hour currency market is that exchange rates may change at any time.Bank traders must be light sleepers so that they can be ready to respond to a telephone call inthe middle of the night, which may alert them to an unusually sharp exchange rate movementon another continent. Many banks permit limited dealing from home by senior traders tocontend with just such a circumstance.
MAJOR PARTICIPANTS IN THE EXCHANGE MARKET 117
London
New York
San Francisco
12 6 0 6 12
Bahrain
Singapore
Hong Kong
Tokyo
Hours difference from Greenwich Mean Time
Figure 5.2 A map of major foreign-exchange markets with time zones

5.1.2 Central banks
Central banks, such as the Federal Reserve System of the USA and the Bank of Japan, attemptto control the growth of the money supply within their jurisdictions. They also strive to main-tain the value of their own currency against any foreign currency. In other words, central bankoperations reflect government transactions, transactions with other central banks and variousinternational organizations, and intervention to influence exchange rate movements.
Central banks serve as their governments’ banker for domestic and international payments.They handle most or all foreign-exchange transactions for the government as well as for impor-tant public-sector enterprises. They may also pay or receive a foreign currency not usually heldin official reserves. For example, the Federal Reserve Bank of New York handles a substantialvolume of foreign-exchange transactions for its correspondents who wish to buy or sell dollarsfor other currencies. Moreover, most central banks frequently enter into exchange transactionswith international and regional organizations that need to buy or sell the local currency. Themost important role of central banks in exchange market operations is their intervention in theexchange market to influence market conditions or the exchange rate. They carry out interven-tion operations either on behalf of the country’s treasury department or for their own account.
In a system of fixed exchange rates, central banks usually absorb the difference between supplyof and demand for foreign exchange in order to maintain the par value system. Under this system,the central banks agree to maintain the value of their currencies within a narrow band of fluc-tuations. If pressures such as huge trade deficits and high inflation develop, the price of a domes-tic currency approaches the lower limit of the band. At this point, a central bank is obliged tointervene in the foreign-exchange market. This intervention is designed to counteract the forcesprevailing in the market.
In a system of flexible exchange rates, central banks do not attempt to prevent fundamentalchanges in the rate of exchange between their own currency and any other currency. However,even within the flexible exchange rate system, they intervene in the foreign-exchange market tomaintain orderly trading conditions rather than to maintain a specific exchange rate (see GlobalFinance in Action 5.1).
118 THE FOREIGN-EXCHANGE MARKET AND PARITY CONDITIONS
Global Finance in Action 5.1Is Official Exchange Intervention Effective?
Many governments have intervened in foreign-exchange markets to try to dampenvolatility and to slow or reverse currency movements. Their concern is that excessiveshort-term volatility and long-term swings in exchange rates may hurt their economy,particularly sectors heavily involved in international trade. And the foreign-exchangemarket certainly has been volatile recently. For example, one euro cost about $1.15in January 1999, dropped to only $0.85 by the end of 2000, and climbed to over$1.18 by March 2003. Over this same period, one US dollar bought as much as 133Japanese yen and as little as ¥102, a 30 percent fluctuation. Many other currencieshave also experienced similarly large price swings in recent years.

MAJOR PARTICIPANTS IN THE EXCHANGE MARKET 119
Conventional academic wisdom holds that “sterilized” interventions have littleimpact on the exchange rate and are a waste of time and of the government’s foreign-exchange reserves. In a sterilized intervention, the central bank offsets the purchaseor sale of foreign exchange by selling or purchasing domestic securities to keep thedomestic interest rates at its target. Because the domestic interest rate usually is con-sidered the main determinant of the value of the domestic currency, many argue, itmust change in order to influence the exchange rate.
Despite academic skepticism, many central banks intervene in foreign-exchangemarkets. The largest player is Japan (see figure 5.3). Between 1991 and December2000, for example, the Bank of Japan bought US dollars on 168 occasions for a cumu-lative amount of $304 billion and sold US dollars on 33 occasions for a cumulativeamount of $38 billion. A typical case: on Monday, April 2, 2000, the Bank of Japanpurchased $13.2 billion in US dollars in the foreign-exchange market in an attemptto stop the 4 percent depreciation of the dollar against the yen that had occurredduring the previous week.
Source: Michael Hutchinson, “Is Official Exchange Rate Intervention Effective?” FRBSF EconomicLetter, Federal Reserve Bank of San Francisco, July 18, 2003, pp. 1–3.
$ billions15
10
5
0
–5
–10
–15
–20
–25
1991
1992
1993
1994
1995
1996
1997
1998
1999
2000
Year
Figure 5.3 Bank of Japan intervention

5.2 Spot Exchange Quotation: The Spot Exchange Rate
The foreign-exchange market employs both spot and forward exchange rates. The spot rate isthe rate paid for delivery of a currency within two business days after the day of the trade. Theforward exchange rate is discussed in the following section.
Practically all major newspapers in the world, such as The Wall Street Journal and The Finan-cial Times (London) print a daily list of exchange rates. Table 5.1 shows cross rates for seven cur-rencies, spot rates for most currencies, and forward rates for major currencies that appeared inThe Wall Street Journal on July 1, 2004. These quotes apply to transactions among banks inamounts of $1 million or more. When interbank trades involve dollars, these rates will beexpressed in either American terms (dollars per unit of foreign currency) or European terms (unitsof foreign currency per dollar).
As shown in the bottom half of table 5.1, The Wall Street Journal quotes in both Americanand European terms are listed side by side. Column 2 (or 3) of table 5.1 shows the amount ofUS dollars required to buy one unit of foreign currency. Given this amount, one can determinethe number of foreign currency units required to buy one US dollar. This conversion can beachieved by simply taking the reciprocal of the given quotation. In other words, the relationshipbetween US dollars and British pounds can be expressed in two different ways, but they havethe same meaning. Column 4 (or 5) presents the reciprocals of the exchange rates in column 2(or 3). Column 4 (or 5) equals 1.0 divided by column 2 (or 3).
Some currencies, such as the Uruguayan new peso, have different rates for financial or com-mercial transactions. For some major currencies, such as the British pound and the Swiss franc,rates also are given for future delivery. Foreign-exchange risk can be minimized by purchasing orselling foreign currency for future delivery at a specified exchange rate. For large amounts, thiscan be accomplished through banks in what is called the forward market; the 30-, 90-, and 180-day rates in table 5.1 reflect this.
The conversion rate for the SDR near the bottom of table 5.1 represents the rate for specialdrawing rights, which is a reserve asset created by the International Monetary Fund for settle-ments among central banks. It is also used as a unit of account in international bond marketsand by commercial banks. Based 45 percent on the US dollar, 29 percent on the euro, 15 percenton the Japanese yen, and 11 percent on the British pound, the SDR’s value fluctuates less thanany single component currency. At the bottom of table 5.1 is the euro, the European commoncurrency that replaced the national currencies of eurozone countries on March 1, 2002.
5.2.1 Direct and indirect quotes for foreign exchange
Foreign-exchange quotes are frequently given as a direct quote or as an indirect quote. In thispair of definitions, the home or reference currency is critical. A direct quote is a home currencyprice per unit of a foreign currency, such as $0.2300 per Saudi Arabian riyal (SR) for a US resident. An indirect quote is a foreign-currency price per unit of a home currency, such asSR4.3478 per US dollar for a US resident. In Saudi Arabia, the foreign-exchange quote,“$0.2300,” is an indirect quotation, while the foreign-exchange quote, “SR4.3478,” is a directquotation. In the USA, both quotes are reported daily in The Wall Street Journal and other financial press.
120 THE FOREIGN-EXCHANGE MARKET AND PARITY CONDITIONS

Table 5.1 Currency cross rates and exchange ratesKey currency cross rates Late New York Trading Friday, July 9, 2004
Dollar Euro Pound SFranc Peso Yen CdnDlr
Canada 1.3184 1.6364 2.4513 1.0775 .11474 .01217 . . .Japan 108.33 134.46 201.42 88.539 9.428 . . . 82.169Mexico 11.4903 14.2617 21.364 9.3910 . . . .10607 8.7154Switzerland 1.2235 1.5187 2.2749 . . . .10648 .01129 .9281UK .53780 .6676 . . . .4396 .04681 .00496 .40795Euro .80570 . . . 1.4980 .65848 .07012 .00744 .61110USA . . . 1.2412 1.8593 .81730 .08703 .00923 .75850
Source: Reuters.
Exchange rates July 9, 2004The foreign exchange mid-range rates below apply to trading amongbanks in amounts of $1 million and more, as quoted at 4 p.m. Easterntime by Reuters and other sources. Retail transactions provide fewerunits of foreign currency per dollar.
CURRENCYUS$ EQUIVALENT PER US$
Country Fri. Thu. Fri. Thu.
Argentina (Peso)-y .3390 .3384 2.9499 2.9551Australia (Dollar) .7228 .7196 1.3835 1.3897Bahrain (Dinar) 2.6525 2.6526 .3770 .3770Brazil (Real) .3287 .3272 3.0423 3.0562Canada (Dollar) .7585 .7595 1.3184 1.3167
1-month forward .7580 .7590 1.3193 1.31753-months forward .7574 .7584 1.3203 1.31866-months forward .7569 .7579 1.3212 1.3194
Chile (Peso) .001575 .001575 634.92 634.92China (Renminbi) .1208 .1208 8.2781 8.2781Colombia (Peso) .0003747 .0003741 2,668.80 2,673.08Czech. Rep. (Koruna)
Commercial rate .03941 .03935 25.374 25.413Denmark (Krone) .1669 .1667 5.9916 5.9988Ecuador (US Dollar) 1.0000 1.0000 1.0000 1.0000Egypt (Pound)-y .1604 .1604 6.2364 6.2364Hong Kong (Dollar) .1282 .1282 7.8003 7.8003Hungary (Forint) .004918 .004937 203.33 202.55India (Rupee) .02192 .02188 45.620 45.704Indonesia (Rupiah) .0001124 .0001113 8,897 8,985Israel (Shekel) .2231 .2229 4.4823 4.4863Japan (Yen) .009231 .009191 108.33 108.80
1-month forward .009241 .009202 108.21 108.673-months forward .009268 .009229 107.90 108.356-months forward .009317 .009290 107.33 107.64
Jordan (Dinar) 1.4104 1.4104 .7090 .7090Kuwait (Dinar) 3.3920 3.3921 .2948 .2948Lebanon (Pound) .0006627 .0006614 1,508.98 1,511.94Malaysia (Ringgit)-b .2632 .2632 3.7994 3.7994Malta (Lira) 2.9097 2.9031 .3437 .3445
CURRENCYUS$ EQUIVALENT PER US$
Country Fri. Thu. Fri. Thu.
Mexico (Peso)Floating rate .0870 .0868 11.4903 11.5221
New Zealand (Dollar) .6579 .6557 1.5200 1.5251Norway (Krone) .1466 .1463 6.8213 6.8353Pakistan (Rupee) .01718 .01718 58.207 58.207Peru (new Sol) .2898 .2893 3.4507 3.4566Philippines (Peso) .01792 .01789 55.804 55.897Poland (Zloty) .2743 .2740 3.6456 3.6496Russia (Ruble)-a .03435 .03436 29.112 29.104Saudi Arabia (Riyal) .2666 .2667 3.7509 3.7495Singapore (Dollar) .5875 .5862 1.7021 1.7059Slovak Rep. (Koruna) .03111 .03103 32.144 32.227South Africa (Rand) .1643 .1657 6.0864 6.0350South Korea (Won) .0008700 .0008692 1,149.43 1,150.48Sweden (Krona) .1350 .1349 7.4074 7.4129Switzerland (Franc) .8173 .8166 1.2235 1.2246
1-month forward .8180 .8173 1.2225 1.22353-months forward .8196 .8188 1.2201 1.22136-months forward .8220 .8213 1.2165 1.2176
Taiwan (Dollar) .02982 .02980 33.535 33.557Thailand (Baht) .02455 .02451 40.733 40.800Turkey (Lira) .00000069 .00000069 1,449,275 1,449,275UK (Pound) 1.8593 1.8494 .5378 .5407
1-month forward 1.8542 1.8443 .5393 .54223-months forward 1.8445 1.8345 .5422 .54516-months forward 1.8308 1.8235 .5462 .5484
United Arab (Dirham) .2723 .2723 3.6724 3.6724Uruguay (Peso)
Financial .03400 .03400 29.412 29.412Venezuela (Bolivar) .000521 .000521 1,919.39 1,919.39
SDR 1.4810 1.4780 .6752 .6766Euro 1.2412 1.2393 .8057 .8069
Special Drawing Rights (SDR) are based on exchange rates for the US,British, and Japanese currencies. Source: International Monetary Fund.a, Russian Central Bank rate; b, government rate; y, floating rate.
Source: The Wall Street Journal, July 12, 2004, p. C13.

5.2.2 Cross rates
A cross rate is an exchange rate between two nonhome currencies. In just about every country,foreign currencies are quoted against the home currency, but there are instances in which MNCsshould know the exchange rate between two nonhome currencies. For example, a US companymay want to know the exchange rate between the Mexican peso and the British pound. Becauseforeign currencies are quoted against the dollar in the USA, their exchange rate is determinedthrough their relationship to the US dollar. The type of exchange rate desired here is known as thecross rate because it reflects the value of one foreign currency against another foreign currency.
Once we understand how two currencies in an exchange quote can be converted into eachother, we can learn how the relationships among three or more currencies are reflected in exchangequotes. For example, if the Australian dollar (A$) is selling for $0.60 and the buying rate for theSouth African rand (R) is $0.15, then the A$ and R cross rate is R4 per A$, and the R and A$cross rate is A$0.25 per rand.
122 THE FOREIGN-EXCHANGE MARKET AND PARITY CONDITIONS
Example 5.1
A somewhat more complicated cross rate calculation may be necessary for some foreign-exchange users. Let us assume that the dollar price of the British pound is $1.6000 perpound and that the Mexican peso price of the dollar is Mex$4 per dollar.
To determine the price of pounds in terms of Mexican pesos or the price of Mexicanpesos in terms of pounds, one must convert both quotations to a common denominator –in other words, the US dollar:
Because the prices of dollars are now quoted in terms of both pounds and pesos, we canobtain the price of pounds in terms of pesos:
Similarly, we can determine the price of pesos in terms of pounds:
The exchange rate between two currencies is called the cross rate if it is obtained from therates of these two currencies in terms of a third currency. The top portion of table 5.1 showscross rates for seven major currencies that appeared in The Wall Street Journal on July 9, 2004.
£ $..
£ . $Mex Mex= =0 62504 0000
0 1563
Mex Mex$ £..
$ . £= =4 00000 6250
6 4000
£ . $ $ . £: £ $ .
$ . $
0 6250 1 6000 1 1 6000
4 0000
=( )Mex as initially given

5.2.3 Measuring a percentage change in spot rates
MNCs frequently measure the percentage change in the exchange rate between two specific pointsin time: for example, the current spot rate and the forecasted spot rate 1 year ahead. For example,if the Australian dollar appreciates from $0.6400 to $0.6800 over a 1-year period, US MNCsare likely to raise questions such as: What is the percentage increase in the dollar value of the Australian dollar? What is the percent increase in the dollar value of Australian dollar-denominated accounts receivable or accounts payable held by Americans?
DIRECT QUOTATIONS When the home currency price for a foreign currency (direct quote) isused, the percentage change in the value of the foreign currency is computed by the followingformula:
(5.1)percentage changeending rate beginning rate
beginning rate=
-
SPOT EXCHANGE QUOTATION: THE SPOT EXCHANGE RATE 123
Example 5.2
Assume that the spot rate changes from $0.6400 per A$ (Australian dollar) to $0.6800 perA$ over a 1-year period. The percentage change in the Australian dollar spot rate usingdirect quotes for a US company is calculated as follows:
In this case, the Australian dollar has become 6.25 percent stronger than the US dollar overthe 1-year period.
percentage change = - =$ . $ .$ .
.0 6800 0 6400
0 64000 0625
INDIRECT QUOTATIONS When the foreign-currency price of a home currency (indirect quote)is used, the formula to compute the percentage change in the spot rate for a foreign currencybecomes:
(5.2)percentage changebeginning rate ending rate
ending rate=
-
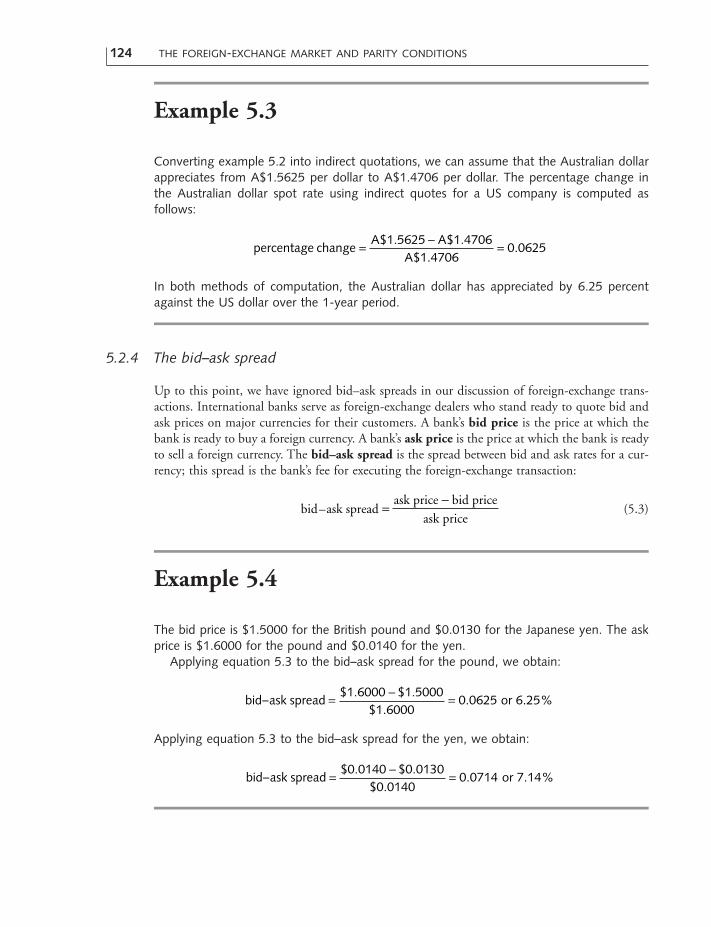
5.2.4 The bid–ask spread
Up to this point, we have ignored bid–ask spreads in our discussion of foreign-exchange trans-actions. International banks serve as foreign-exchange dealers who stand ready to quote bid andask prices on major currencies for their customers. A bank’s bid price is the price at which thebank is ready to buy a foreign currency. A bank’s ask price is the price at which the bank is readyto sell a foreign currency. The bid–ask spread is the spread between bid and ask rates for a cur-rency; this spread is the bank’s fee for executing the foreign-exchange transaction:
(5.3)bid–ask spreadask price bid price
ask price=
-
124 THE FOREIGN-EXCHANGE MARKET AND PARITY CONDITIONS
Example 5.3
Converting example 5.2 into indirect quotations, we can assume that the Australian dollarappreciates from A$1.5625 per dollar to A$1.4706 per dollar. The percentage change inthe Australian dollar spot rate using indirect quotes for a US company is computed asfollows:
In both methods of computation, the Australian dollar has appreciated by 6.25 percentagainst the US dollar over the 1-year period.
percentage changeA A
A= - =$ . $ .
$ ..
1 5625 1 47061 4706
0 0625
Example 5.4
The bid price is $1.5000 for the British pound and $0.0130 for the Japanese yen. The askprice is $1.6000 for the pound and $0.0140 for the yen.
Applying equation 5.3 to the bid–ask spread for the pound, we obtain:
Applying equation 5.3 to the bid–ask spread for the yen, we obtain:
bid ask spread– .= - =$ .0140 $ .0130$ .0140
or 7.14%0 0
00 0714
bid ask spread–. .
..= - =$ $
$ or 6.25%
1 6000 1 50001 6000
0 0625

Spot or forward rate Canadian dollars Swiss francs
90-day forward rate $0.7900 $0.6000Less: spot rate 0.8000 0.5800
90-day forward quote in points -100 +200
In giving a forward quote for the Canadian dollar, a trader might say “minus 100” or “adiscount of 100.” For the Swiss franc, the trader would say “plus 200” or “a premium of200.” Thus, when the forward rate is less than the spot rate, it is said to be at a discount.When the forward rate is greater than the spot rate, it is said to be at a premium. Outrightquotations are normally used for retail customers of the bank, while point quotations areusually employed for traders.
5.3 Forward Exchange Quotation: The Forward Exchange Rate
The forward rate is the rate to be paid for delivery of a currency at some future date. Theexchange rate is established at the time the contract is made, but payment and delivery are notrequired until maturity. Forward rates are usually quoted for fixed periods of 30, 90, or 180 daysfrom the day of the contract. In some instances, actual contracts in major currencies can bearranged for delivery at any specified date up to 1 year.
Table 5.1 shows the forward rates for only four major currencies: British pounds, Canadiandollars, Japanese yen, and Swiss francs. The current spot rate and the forward rate may be thesame during a period of foreign-exchange stability. However, there usually is a difference betweenthe spot rate and the forward rate; this difference is known as the spread.
FORWARD EXCHANGE QUOTATION: THE FORWARD EXCHANGE RATE 125
Example 5.5
Forward quotations are made either “outright” or in terms of the spread on the spot rate.Suppose that the 90-day outright forward quotation is $0.7900 per Can$ for Canadiandollars and $0.6000 per SFr for Swiss francs, and that the spot rate is $0.8000 per Can$and $0.5800 per SFr. The spread between the forward rate and the spot rate is stated interms of points; one point equals 0.01 percent or $0.0001. Point quotations for the two90-day forward rates are determined as follows:
A forward premium or discount is sometimes expressed in terms of the annualized percentagedeviation from the spot rate. The premium or discount is computed using the following formula:

(5.4)
Applying equation 5.4 to the 90-day forward quote for Canadian dollars given in example 5.5,we obtain:
Applying equation 5.4 to the 90-day forward quote for Swiss francs given in example 5.5, weobtain:
5.3.1 Key reasons for forward exchange transactions
Actual exchange market participants are banks, companies, individuals, governments, and otherfinancial institutions. However, these participants are called arbitrageurs, traders, hedgers, or spec-ulators, depending on the purpose of their participation in the exchange market. Arbitrageursseek to earn riskless profits by taking advantage of differences in interest rates among countries.Traders use forward contracts to eliminate possible exchange losses on export or import ordersdenominated in foreign currencies. Hedgers, mostly MNCs, engage in forward contracts toprotect the home-currency value of foreign currency denominated assets and liabilities. Specula-tors deliberately expose themselves to exchange risk by engaging in forward contracts in order tomake a profit from exchange rate fluctuations.
Individuals and corporations buy and sell forward currencies to provide protection againstfuture changes in exchange rates. So long as we do not have a single world currency, some degreeof exchange risk exists in any system. We cannot eliminate some possibility of foreign-exchangelosses in either the fixed exchange rate system or the flexible exchange rate system.
forward premium or =-
¥ = + +$ . $ .
$ .. . %
0 6000 0 58000 5800
36090
0 1379 13 79
forward discount or =-
¥ = - -$ . $ .
$ .. . %
0 7900 0 80000 8000
36090
0 05 5 00
premium discount-day forward rate spot rate
spot rate( ) =
-¥
nn
360
126 THE FOREIGN-EXCHANGE MARKET AND PARITY CONDITIONS
Example 5.6
Assume that an American firm purchases machinery through its UK branch for £10,000 withterms of 90 days. Let us also assume that the spot rate for pounds is $1.70 per pound andthe 90-day forward rate for pounds is $1.80 per pound. Payment should be made in Britishpounds 90 days from the day of the shipment.
Actually, there are two alternative methods of payment available to the American firm.First, the firm could buy pounds in the spot market 90 days from the day of the shipmentto pay the credit. If the spot rate for pounds rises to $2.00 during this time, the Americanfirm should spend $20,000 to buy the sum of £10,000. Second, it could also buy £10,000

5.3.2 Speculation in the foreign-exchange market
Foreign-exchange markets facilitate both commercial and private transactions such as foreigntrade, loans, and investments. In addition, they give rise to exchange speculation. The purposeof speculation in the foreign-exchange market is to make a profit from exchange rate fluctuationsby deliberately taking an uncovered position. Speculation can be undertaken in both the spotmarket and the forward market.
SPECULATING IN THE SPOT MARKET Suppose that a speculator anticipates that the spot rateof the Swiss franc will appreciate in 90 days. The speculator will purchase francs at today’s spotrate, will hold them for 90 days, and will resell them at a higher rate.
FORWARD EXCHANGE QUOTATION: THE FORWARD EXCHANGE RATE 127
in the forward market for $18,000 to pay the credit on the due date. By so doing, the American firm would avoid the risk of a $2,000 loss ($20,000–$18,000). However, if thespot rate for pounds declines to $1.50 during this period, the American firm would lose$3,000 ($15,000–$18,000) under the forward contract.
Example 5.7
The present spot rate for francs is $0.4000 per SFr. A speculator’s expectation of the spotrate for francs in 90 days is $0.4500. If the speculator’s expectation proves correct, whatwould be his dollar profit from speculating $10,000 in the spot market?
With $10,000, the speculator could buy SFr25,000 ($10,000/$0.4000) in the spotmarket, hold them for 90 days, and resell them at $0.4500 per SFr for a gross of $11,250(SFr25,000 ¥ $0.4500). As a result, the speculator would earn a net profit of $1,250, or12.50 percent, on the original $10,000 of capital. But spot speculation is risky. If the spotrate were to decline to $0.3500 during this period, the SFr25,000 would have an endingvalue of $8,750 (SFr25,000 ¥ $0.3500) for a net loss of $1,250. Theoretically speaking, nolimit exists to the potential profit, but the maximum loss would be $10,000.
A speculator is not locked into an absolute 90-day terminal date but may simply holdthe currency until a date that seems to be most profitable. This is possible because the spec-ulator could close out the position before 90 days or hold it longer than 90 days if his expec-tation changes after the spot purchase.
SPECULATING IN THE FORWARD MARKET Suppose that a speculator anticipates that the Swissfranc’s spot rate in 90 days will exceed its 90-day forward rate as quoted today. The speculatorbuys francs for 90-day future delivery at today’s forward rate, waits for 90 days, and then sellsthe francs spot to close the position.

5.4 International Parity Conditions
In this section, specific attention is paid to the theory of foreign-exchange rate determination.This theory is based on a relationship between the money market and the foreign-exchangemarket; this relationship prevails without restrictions imposed by government policy on the extentto which rates can move. Such a free market situation will establish the nature of interrelation-ships among the money markets and the foreign-exchange markets. In other words, we can pos-tulate a simple set of parity conditions that should hold among inflation rates, interest rates, spotrates, and forward rates. This idea, commonly known as the law of one price, is enforced by arbitrageurs who, by following the famous dictum of “buy low, sell high,” prevent all but minordeviations from equality.
There are five major theories of exchange rate determination:
1 The theory of purchasing power parity.2 The Fisher effect.3 The international Fisher effect.4 The theory of interest rate parity.5 The forward rate as an unbiased predictor of the future spot rate.
It is important to remember that the economic relationships of these five theories result fromarbitrage activities.
128 THE FOREIGN-EXCHANGE MARKET AND PARITY CONDITIONS
Example 5.8
The present 90-day forward rate for francs is $0.4300. A speculator’s expectation of thespot rate for francs in 90 days is $0.4500. If the speculator’s expectation proves correct,what would be his dollar profit from speculating $10,000 in the forward market?
The speculator could buy SFr23,256 forward for $10,000 at the forward quotation of$0.4300, receive them in 90 days, and then sell them at the spot rate of $0.4500 for agross of $10,465. Profit would be $465. The profit of $465 in this case cannot be relatedto any investment base to determine a rate of return, because no capital was invested atthe time the contract was entered.
Clearly, there is greater risk for a speculator in forward transaction than in spot transac-tion. Forward market speculation involves a more remote payment date and a greaterchance of unfavorable fluctuations. There are two types of risk here. The first risk is thepossibility that foreign-exchange rates will fluctuate. The second risk is the possibility thatthe forward contract will not be carried out. The first risk will affect the speculator only ifhe carries an open position in the forward contract. The speculator can eliminate this riskby purchasing an offsetting forward contract. Although the speculator has a net position ofzero, he still carries the second risk because he stands in the middle.

5.4.1 Efficient exchange markets
Investors make risk–return decisions in the framework of available exchange markets. We willbase our discussion of the theories of exchange rate determination on the assumption of efficientexchange markets. Efficient exchange markets exist when exchange rates reflect all availableinformation and adjust quickly to new information. Because exchange markets are highly com-petitive in such a situation, the market participants buy and sell foreign exchange in a way thateliminates all profits in excess of the minimum required to sustain their continued participation.In other words, the concept of efficient exchange markets depends on three hypotheses:
1 Market prices such as product prices, interest rates, spot rates, and forward rates should reflectthe market’s consensus estimate of the future spot rate.
2 Investors should not earn unusually large profits in forward speculation. Because exchangerate forecasts based on market prices are accurate, publicly available forecasts of the futurespot rate do not lead to unusual profits in forward speculation.
3 It is impossible for any market analyst to beat the market consistently.
Certainly, these conditions are not completely met in practice. Thus, exchange markets areassumed efficient if the conditions are only reasonably met. There are many indications thatsupport the efficient market assumption for international money and exchange markets. First,foreign currencies and other financial assets are traded by companies and individuals who havebroad market contacts, sophisticated analytic capabilities, and modern communications. Becausenew information is widely, quickly, and cheaply disseminated to investors, market prices arerapidly adjusted to reflect significant developments. Second, since 1973 the major trading countries of the world have adopted the system of freely floating rates, and their governmentalinterference in exchange markets has been minimal.
5.4.2 The theory of purchasing power parity
The theory of purchasing power parity (PPP) explains why the parity relationship existsbetween inflation rates and exchange rates. The PPP theory has an absolute version and a rela-tive version. The absolute version of the PPP theory maintains that the equilibrium exchangerate between domestic and foreign currencies equals the ratio between domestic and foreignprices. For example, if one American dollar can buy one bushel of wheat and one British poundcan buy two bushels of wheat, the exchange rate between the two currencies is $0.50 per pound.
Specifically, the PPP theory in its simplest form holds that the exchange rate must change interms of a single currency to equate the prices of goods in both countries. For example, if theprices of British goods rise relative to the prices of US goods, the British pound should depreci-ate to keep the dollar price of goods in the United Kingdom the same as the dollar prices ofidentical goods in the United States. Otherwise, arbitrageurs would have an incentive to pur-chase goods in the USA and sell them in the UK until these prices were again equalized.
Unfortunately for this analysis, the world is more complex than this simple example. The realworld is characterized by transportation costs, tariffs, quotas, and all sorts of impediments to theequalization of prices for identical goods worldwide. Thus, it is not difficult to understand whythe absolute PPP relationship does not hold very well for any pair of countries.
INTERNATIONAL PARITY CONDITIONS 129

The relative version of the PPP doctrine states that in the long run, the exchange rate betweenthe home currency and the foreign currency will adjust to reflect changes in the price levels ofthe two countries. In other words, it relates equilibrium changes in the exchange rate to changesin the ratio of domestic and foreign prices:
(5.5)
where et is the dollar price of one unit of foreign currency in period t, e0 is the dollar price ofone unit of foreign currency in period 0, Id is the domestic inflation rate, and If is the foreigninflation rate. If we solve equation 5.5 for the new exchange rate (et), we obtain:
(5.6)e eI
It
dt
ft
= ¥+( )+( )
01
1
ee
I
I
t dt
ft
0
1
1=
+( )+( )
130 THE FOREIGN-EXCHANGE MARKET AND PARITY CONDITIONS
Example 5.9
This time, let us assume that the exchange rate between US dollars and British pounds is$2 per pound. Let us further accept the fact that the USA will have an inflation rate of 10percent for the coming year and that the UK will have an inflation rate of 20 percent overthe same period.
The new exchange rate of $1.83 per pound is obtained in this way:
e1 21 0 101 0 20
1 83= ¥ +( )+( ) =$
.
.$ . £
Example 5.9 indicates that the US dollar price of the pound should decrease in value by about10 percent from $2 per pound to $1.83 per pound to equalize the dollar price of goods in twocountries. If the exchange rate does not fall by the amount suggested by the PPP theory, thenwe could say that the US dollar is undervalued or the British pound is overvalued.
The main justification for the PPP theory is that if the exchange rate stays the same at $2 per pound, British exports of goods and services will become less competitive with comparableproducts produced in the USA. British imports from the USA will also become more price-competitive with higher-priced British products.
AN APPRAISAL OF THE PPP THEORY The PPP theory not only explains how relative inflationrates between two countries can influence their exchange rate, but it can also be used to forecastexchange rates. It is important to remember that the PPP doctrine is supposed to work well undera freely floating exchange rate system. With the termination of the fixed exchange rate system in1973, the relative price levels and exchange rates in most industrial countries have fluctuated

widely. The experience of 1975–98 indicates that, while movements in dollar exchange rates forsome major currencies reflected differences in inflation rates, that was not the case for sharp short-period fluctuations in these rates. In addition, the PPP theory did not work that well for someother currencies.
There are some obvious weaknesses of the PPP theory. First, it assumes that goods are easilytraded. This is not the case for such goods as housing and medical services. The PPP theory,moreover, relies on an index of prices such as the consumer price index. Such an index may bemisleading because only traded goods directly affect the balance on goods and services. However,even nontraded goods indirectly affect the price of traded goods through their impact on theoverall cost of living and on wage demands.
Second, the PPP theory assumes that tradable goods are identical across countries. However,even tradable goods are not always identical when they are produced in different countries. Forexample, some Americans prefer Japanese cars, and others prefer American cars. Moreover, cus-tomer preferences for automobiles change over time. If Japanese cars suddenly become morepopular, the increase in demand will drive up the price of Japanese cars. But despite the pricedifferential between the two markets, there might be no opportunity for profitable arbitrage,because customers do not view the Japanese and American cars as equivalent.
Third, we must compare a similar basket of goods in each country with its trading partnersin order to test the PPP theory. If we try to compare the prices of dissimilar goods, we have torely on price indexes. It then becomes a question of which index is most reflective of goods tradedbetween countries.
Fourth, many other factors influence exchange rates besides relative prices. These include rel-ative interest rates, relative income levels, and government interference in the foreign-exchangemarket. Thus, it is difficult to measure the precise magnitude of exchange rate movements attrib-utable to differences in inflation rates.
In spite of these limitations, the PPP theory is quite useful and seems to be valid over thelong run. If a country’s inflation rate remains higher than that of its trading partners for a longperiod, that country’s currency will tend to depreciate in order to prevent the country from beingforced out of the export market. According to many empirical studies, this fact exists whether itis caused by the PPP theory alone or by a combination of factors.
5.4.3 The Fisher effect
The Fisher effect, named after economist Irving Fisher, assumes that the nominal interest ratein each country is equal to a real interest rate plus an expected rate of inflation:
(5.7)
The real interest rate is determined by the productivity in an economy and a risk premium com-mensurate with the risk of a borrower. The nominal interest rate embodies an inflation premiumsufficient to compensate lenders or investors for an expected loss of purchasing power. Conse-quently, nominal interest rates are higher when people expect higher rates of inflation and arelower when people expect lower rates of inflation.
The real interest rate is thought to be relatively stable over time. Moreover, in a free marketwhere investors can buy any interest-bearing securities, real interest rates are identical everywhere,
nominal rate real rate inflation= +
INTERNATIONAL PARITY CONDITIONS 131

but nominal interest rates will vary by the difference in expected rates of inflation. The Fishereffect asserts that real interest rates are equalized across countries through arbitrage. For example,if expected real rates of interest were higher in Switzerland than in the USA, capital would flowfrom the USA to Switzerland. On the other hand, if real rates of interest were higher in the USAthan in Switzerland, capital would flow from Switzerland to the USA. This process of arbitragewould continue, in the absence of government intervention, until the expected real rates of inter-est are equalized in both countries.
AN APPRAISAL OF THE FISHER EFFECT Empirical studies have found that most of the variation in nominal interest rates, particularly for short-term government securities, can beattributed to changing inflationary expectations. The hypothesis of the Fisher effect, based onlong-term securities, suffers from an increased financial risk inherent in fluctuations of a bondmarket value prior to maturity. Comparisons of corporate securities are influenced by unequalcreditworthiness of the issuers. In addition, changes in long-term interest rates and changes ininflation rates are not concurrent, because long-term rates relative to short-term rates are not thatsensitive to changes in prices. However, the Fisher effect based on long-term maturities hasworked fairly well in recent years. First, long-term interest rates, adjusted for inflation, have beenrelatively stable in most industrial countries since 1980. Second, long-term real rates of interestin most countries have been relatively close together since 1980.
5.4.4 The international Fisher effect
The international Fisher effect states that the future spot rate should move in an amount equalto, but in the opposite direction from, the difference in interest rates between two countries. Afuture spot rate of a currency with a higher interest rate would depreciate in the long run; a futurespot rate of a currency with a lower interest rate would appreciate in the long run. For example,if the interest rate over the next year is 4 percent in the USA and 10 percent in Switzerland, thefranc would depreciate against the dollar by 6 percent.
When investors purchase the currency of a country to take advantage of higher interest ratesabroad, they must also consider any possible losses due to fluctuations in the value of the foreigncurrency prior to maturity of their investment. To clarify this point, assume that interest ratesare higher in Switzerland than in the USA. In this case, US investors in Swiss securities must berewarded with a higher interest rate to offset the expected depreciation of a spot rate for the francwhen they convert the principal and interest into dollars. Swiss investors in US securities mustbe rewarded with a higher future spot rate for the dollar to offset the lower interest rate in theUSA. In other words, the international Fisher effect holds that the interest differential betweentwo countries should be an unbiased predictor of the future change in the spot rate.
SHORT-RUN BEHAVIOR The relationship between interest rates and exchange rates is a complexone, which incorporates numerous behavioral parameters. The short-run behavior of interest andexchange rates, quite contrary to their long-run behavior, shows that a rise in interest rates in agiven country is expected to raise the value of that country’s currency, and vice versa. In otherwords, currencies of countries with higher interest rates than the USA tend to appreciate in valueagainst the dollar. Higher interest rates in a given country would raise the value of its currencybecause higher interest rates could attract capital from investors in other countries. By the same
132 THE FOREIGN-EXCHANGE MARKET AND PARITY CONDITIONS

token, currencies of countries with lower interest rates than the USA tend to depreciate in valueagainst the dollar because investors in other countries would sell their currencies in exchange forthe dollar. Hence, the exchange rate moves in the same direction as the difference in interest ratesbetween two countries.
5.4.5 The theory of interest rate parity
The movement of short-term funds between two countries to take advantage of interest differ-entials is a major determinant of the spread between forward and spot rates. According to theinterest parity theory, the spread between a forward rate and a spot rate should be equal butopposite in sign to the difference in interest rates between two countries. In a free market, thecurrency with the higher interest rate would sell at a discount in the forward market, while the currency with the lower interest rate would sell at a premium in the forward market. In fact,the forward discount or premium is closely related to the interest differential between the twocurrencies.
The interest rate parity theory holds that the difference between a forward rate and a spotrate equals the difference between a domestic interest rate and a foreign interest rate:
(5.8)
where n-day F is the n-day forward rate, S is the spot rate, id is the domestic interest rate, and if
is the foreign interest rate.
n F SS n
i id f-day -
¥ = -360
INTERNATIONAL PARITY CONDITIONS 133
Example 5.10
Let us assume four things: (1) the Swiss interest rate is 9 percent; (2) the US interest rateis 7 percent; (3) the spot rate for the Swiss franc is $0.4000; and (4) the 180-day forwardrate for the Swiss franc is $0.3960.
In this case, the percentage discount on the 180-day forward rate is equal to the inter-est rate differential:
Swiss securities would earn 2 percent more than American securities, but Swiss francs wouldsell in the forward market at a 2 percent discount.
This outcome is brought about by arbitrageurs who enter into forward contracts to avoidthe exchange rate risk. If interest rates are higher in Switzerland than in the USA, arbi-trageurs in search of a higher yield could move their funds from the USA to Switzerland. In
$ . $ .$ .
. .
. .
0 3960 0 40000 4000
360180
0 07 0 09
0 02 0 02
- ¥ = -
- = -

5.4.6 The forward rate and the future spot rate
If speculators think that a forward rate is higher than their prediction of a future spot rate, theywill sell the foreign currency forward. This speculative transaction will bid down the forward rateuntil it equals the expected future spot rate. By the same token, if speculators believe that aforward rate is lower than an expected future spot rate, they will buy a foreign currency forward.This speculative transaction will bid up the forward rate until it reaches the expected future spotrate. Under this condition, there is no longer any incentive to buy or sell a foreign currencyforward, because forward rates are unbiased predictors of future spot rates.
5.4.7 A synthesis of international parity conditions
In the absence of predictable exchange market intervention by central banks, an expected rate ofchange in a spot rate, differential rates of national inflation and interest, and forward premiumsor discounts are all directly proportional to each other. Because money, capital, and exchangemarkets are efficient, these variables adjust very quickly to changes in any one of them. Conse-quently, the forward rate is the best possible forecaster of the future spot rate. Example 5.11 andfigure 5.4 illustrate all of the fundamental parity relations simultaneously with the aid of a two-currency model: the US dollar and the Swiss franc.
134 THE FOREIGN-EXCHANGE MARKET AND PARITY CONDITIONS
order to avoid the exchange rate risk at maturity, the arbitrageurs would sell the francs inexchange for dollars in the forward market. Consequently, the forward rate for the Swissfranc with the higher interest rate would depreciate, while the forward rate for the US dollarwith the lower interest rate would appreciate. Such transactions would continue until theinterest differential in favor of Switzerland was equal to the forward discount for the Swissfranc. Under this condition, there is no incentive for capital to move in either direction,because the interest differential is offset by the forward discount.
Example 5.11
Let us assume the following:
1 The current spot rate for the Swiss franc: SFr1 = $0.5000.2 The 1-year forward rate for the Swiss franc: SFr1 = $0.4750.3 The expected spot rate in 1 year for the Swiss franc: SFr1 = $0.4750.4 The expected rate of inflation for 1 year: Switzerland = 10 percent; US = 5 percent.5 Interest rates on 1-year government securities: Switzerland = 12 percent; US = 7 percent.
Discuss international parity relationships among spot rates, forward rates, inflation rates,and interest rates, using these five assumptions.

INTERNATIONAL PARITY CONDITIONS 135
First, the PPP theory holds that any change in the differential rate of inflation betweentwo countries tends to be offset by an equal but opposite change in the spot rate. A 5percent higher rate of inflation in Switzerland is offset by a 5 percent depreciation in thespot rate for the franc. This 5 percent depreciation in the spot rate for the franc is com-puted by equation 5.1:
Second, the Fisher effect suggests that real interest rates are identical everywhere and thatnominal interest rates will vary by the difference in expected rates of inflation. The real infla-tion-adjusted interest rate in both countries is computed by equation 5.7: nominal rate =real rate + inflation.
The US: 7% = real rate + 5%; real rate = 2%
Switzerland: 12% = real rate + 10%; real rate = 2%
The nominal interest rate in Switzerland (12 percent) is 5 percent higher than the nominalinterest rate in the USA (7 percent). This difference is identical to the 5 percent differencein expected rates of inflation between Switzerland (10 percent) and the USA (5 percent).
Third, the international Fisher effect states that a future spot rate should move in anamount equal to, but in the opposite direction from, the difference in interest rates betweentwo countries. The 5 percent interest differential in favor of Switzerland is equal to the 5percent depreciation in the future spot rate for the franc (remember that the 5 percent francdepreciation was computed in relation to the PPP theory).
Fourth, the Interest Parity Theory assumes that the spread between the forward rate andthe spot rate should be equal but opposite in sign to the difference in interest rates betweenthe two countries. The 5 percent higher rate of interest in Switzerland is consistent with the5 percent forward discount for the Swiss franc. The 5 percent forward discount for the francis computed by equation 5.4:
Finally, under a freely floating exchange rate system, the forward rate is an unbiased pre-dictor of the future spot rate. The 1-year forward rate of $0.4750 for the franc is identicalto the expected spot rate in 1 year of $0.4750 for the franc. This means that the 5 percent1-year forward discount for the franc is an unbiased predictor that the franc will depreci-ate by 5 percent over the next year.
premium (discount)-day forward rate spot rate
spot rate
f discount or
= - ¥
= - = = - -
nn
360
orward0 4750 0 5000
0 5000360360
0 05 5. .
.. %
percentage changeending rate beginning rate
beginning rate
percentage change or
= -
= - = - -0 4750 0 50000 5000
0 05 5. .
.. %

Figure 5.4 illustrates these five key theories of exchange rate determination and their relation-ships on the basis of example 5.11: the theory of purchasing power parity (relationship A), theFisher effect (relationship B), the international Fisher effect (relationship C), the theory of inter-est rate parity (relationship D), and the forward rate as an unbiased predictor of the future spotrate (relationship E). Relationship F does not represent any particular theory, but it has to betrue by definition if relationships A–E are all true. This framework emphasizes the links that existamong spot exchange rates, forward rates, interest rates, and inflation rates.
5.5 Arbitrages
Arbitrage is the purchase of something in one market and its sale in another market to takeadvantage of a price differential. Professional arbitrageurs quickly transfer funds from one cur-rency to another in order to profit from discrepancies between exchange rates in different markets.The process of arbitrage also works through the foreign-exchange market to bring interest ratesin national markets closer together. Even small discrepancies between the exchange rates andinterest rates in different markets would motivate enough arbitrage to eliminate these discrep-ancies quickly.
136 THE FOREIGN-EXCHANGE MARKET AND PARITY CONDITIONS
Forecastrate of change of
spot exchange rate–5%
Forecastdifference in
rate of inflation+5%
Difference ininterest rates
+5%
Forward premiumor discount
–5%
E C
F
A
D B
Figure 5.4 Relationships among various financial rates

5.5.1 Geographical arbitrage
In principle, the exchange rate for a given currency should be the same in every geographicalmarket. However, geographical arbitrage could arise when local demand-and-supply conditionsmight create temporary discrepancies among various markets. Arbitrage specialists would buy thecurrency in a market where its price is lower and then sell the currency where its price is higher.If the exchange rate differential is larger than the transaction cost, an arbitrage profit would bemade.
TWO-POINT ARBITRAGE The arbitrage transaction between two currencies is called a two-point arbitrage. Suppose, for example, that the quotes of the South African rand against the USdollar are $0.20 in New York and $0.25 in Johannesburg. The price of rands in terms of dollarsis higher in Johannesburg than in New York. An arbitrageur could benefit by buying rands withdollars in New York and then selling the rands in exchange for dollars in Johannesburg. Arbi-trage tends to wipe out the exchange rate differential that originally triggered it. The purchaseof rands in New York would drive the price of rands against the dollar up toward the Johannes-burg rate. The sale of rands in Johannesburg would drive the price of rands against the dollardown toward the New York rate. This arbitrage process would continue until the price of randsin terms of the dollar was the same in both markets.
The basic economic principle of “buy low and sell high” dominates the arbitrage transactionof buying and selling currencies in two national money markets. Exchange rates in two differ-ent locations must be stated in a given currency if this principle is to be applied in foreignexchange. Thus, the arbitrage process becomes slightly more difficult to understand if exchangerates are quoted in different currencies. Let us restate our previous example in a slightly differ-ent way. The price of rands against the dollar is $0.20 in New York. The price of dollars againstthe rand is R4 in Johannesburg. The quotes in both locations in terms of $/R are as follows:
ARBITRAGES 137
New York Johannesburg
$0.20/R (as initially given) $0.25/R (1 ∏ 4)
The rand enjoys a higher price against the dollar in Johannesburg than in New York. This pricedifferential would lead to the following transactions in each market:
1 In New York, investors would buy rands and sell dollars.2 In Johannesburg, investors would sell rands and buy dollars.
THREE-POINT ARBITRAGE An arbitrage transaction among three currencies is called a three-point arbitrage and is also commonly known as a triangle arbitrage. This type of arbitrage canoccur if any of the three cross rates is out of line. Consider the possibility that the cross rates ofexchange are Rs60/$, Rs10/HK$, and HK$3/$. An arbitrageur could make a profit of $1. Shewould buy 60 Indian rupees for $1, then purchase six Hong Kong dollars for 60 Indian rupees,and finally buy $2 for the six Hong Kong dollars. A large volume of such transactions wouldstrengthen the rupee against the dollar, strengthen the Hong Kong dollar against the rupee, and

strengthen the dollar against the Hong Kong dollar. This arbitrage process causes some consis-tent patterns of rates to emerge at which no further arbitrage would be profitable. In other words,the arbitrage will continue until dollars can no longer be bought more cheaply in one marketthan the price at which they are sold in another market. Currency cross rates such as those givenin table 5.1 can be prepared to ensure that the exchange rates are consistent with each other inall markets.
5.5.2 Covered-interest arbitrage
Covered-interest arbitrage is the movement of short-term funds between countries to takeadvantage of interest differentials with exchange risk covered by forward contracts. Wheninvestors purchase the currency of a foreign country to take advantage of higher interest ratesabroad, they must also consider any losses or gains. Such losses or gains might occur due to fluc-tuations in the value of the foreign currency prior to the maturity of their investment. Gener-ally, investors cover against such potential losses by contracting for the future sale or purchase ofa foreign currency in the forward market.
Their actions, aimed at profits from interest rate differentials between countries, lead, in equi-librium, to the condition of so-called interest parity. The interest rate parity theory says that anyexchange gains or losses incurred by a simultaneous purchase and sale in the spot and forwardmarkets are offset by the interest rate differential on similar assets. Under these conditions, thereis no incentive for capital to move in either direction, because the effective returns on foreignand domestic assets have been equalized.
Figure 5.5 presents a graphic representation of the theoretical relationship between the forwardpremium or discount and the interest rate differential. The vertical axis represents the interestdifferential in favor of the foreign currency and the horizontal axis shows the forward premiumor discount on that currency. The interest parity line shows the equilibrium state. This chapterignores transaction costs for simplicity. However, it is important to recognize the fact that trans-action costs cause the interest parity line to be a band rather than a thin line. Transaction costsinclude the foreign-exchange brokerage costs on spot and forward contracts as well as the invest-ment brokerage cost on buying and selling securities.
Point A of figure 5.5 shows that the forward discount for foreign exchange is 1 percent andthat the foreign interest rate is 2 percent higher than the domestic interest rate. In this case, thearbitrageur could employ the so-called covered-interest arbitrage to make a profit. Specifically,the arbitrageur would earn 2 percent more on her investment in foreign securities and lose 1percent on the repurchase of the domestic currency in the forward market by taking the follow-ing actions: (1) buying spot foreign currency with domestic currency; (2) investing the foreigncurrency in foreign securities; and (3) selling the foreign currency in the forward market. Thenet result is that the arbitrageur would make a profit of 1 percent from this covered-interest arbitrage transaction.
The arbitrageur would have to convert the foreign currency to domestic currency at the endof maturity. The exchange rate may fall before the arbitrageur has returned her funds to her homecountry. For that reason, the arbitrage transaction involves foreign-exchange risks. To avoid theserisks, she will cover the transaction by selling forward the same amount of the foreign currencyat 1 percent discount. The investment protected by forward sales is called covered-interest arbitrage.
138 THE FOREIGN-EXCHANGE MARKET AND PARITY CONDITIONS

ARBITRAGES 139
A
B
Arbitrageoutflow
Arbitrageinflow
Interest rate parity
Interest differential in favor offoreign currency in percent per year
+3
+2
+1
0
–1
–2
–3–3 –2 –1 +1 +2 +30
Forward premium or discount in percent per year
Figure 5.5 Covered-interest arbitrage
Example 5.12
Suppose: (1) the Swiss interest rate is 10 percent; (2) the US interest rate is 8 percent; (3)the spot rate for Swiss francs is $0.5000; and (4) the 180-day forward rate for Swiss francsis $0.4975.
The forward discount for the franc is obtained by using equation 5.4:
The interest differential is 2 percent (10 percent - 8 percent) in favor of the Swiss franc.The covered-interest arbitrage would work as follows:
f discount or orward = - ¥ = - -$ . $ .$ .
. %0 4975 0 5000
0 5000360180
0 01 1

140 THE FOREIGN-EXCHANGE MARKET AND PARITY CONDITIONS
1 Borrow dollars in the USA -8%Buy francs spot with the dollars
2 Invest the francs in Swiss securities +10%3 Sell francs forward against dollars at a discount -1%
Net profit +1%
These transactions would cause four tendencies in foreign-exchange markets and moneymarkets:
1 The spot rate of the franc against the dollar would tend to appreciate as investors boughtfrancs against dollars.
2 The forward rate of the franc against the dollar would tend to depreciate as investorssold francs against dollars.
3 The US interest rate would tend to rise as investors borrowed dollars.4 The Swiss interest rate would tend to fall as investors lent francs.
The first two tendencies would increase the original forward discount of 1 percent towardthe initial interest differential of 2 percent. The last two tendencies would reduce the initialinterest differential of 2 percent toward the original forward discount of 1 percent. Thesefour tendencies would continue until the forward discount for the franc equaled the inter-est rate differential in favor of the franc.
At point B of figure 5.5, the foreign interest rate is 1 percent higher than the domesticinterest rate. The cost of forward cover (forward discount) is 2 percent. In this case, thearbitrageur would sell the foreign currency for the domestic currency, invest this domesticcurrency in home-country securities, and repurchase the foreign currency in the forwardmarket at a discount. She would lose 1 percent on this investment in home-country secu-rities, but she would earn 2 percent on the repurchase of the foreign currency. Hence, thearbitrageur would make a profit of 1 percent.
Example 5.13
Suppose: (1) the Canadian interest rate is 10 percent; (2) the US interest rate is 9 percent;(3) the spot rate for Canadian dollars is $0.8500; and (4) the 180-day forward rate forCanadian dollars is $0.8415.
The forward discount for the Canadian dollar is obtained by using equation 5.4:
f discount or orward = - ¥ = - -$ . $ .$ .
. %0 8415 0 8500
0 8500360180
0 02 2

The interest differential is 1 percent (10 percent - 9 percent) in favor of the Canadian dollar.The covered-interest arbitrage would work as follows:
1 Borrow Canadian dollars in Canada -10%Buy US dollars with the Canadian dollars
2 Invest the US dollars in US securities +9%3 Sell US dollars forward at a premium +2%
Net profit +1%
These transactions would cause four tendencies in foreign exchange and money markets:
1 The spot rate of the Canadian dollar against the US dollar would tend to depreciate asinvestors sold Canadian dollars against US dollars.
2 The forward rate of the Canadian dollar against the US dollar would tend to appreciateas investors bought Canadian dollars against US dollars.
3 The US interest rate would tend to fall as investors lent US dollars.4 The Canadian interest rate would tend to rise as investors borrowed Canadian
dollars.
The first two tendencies would reduce the original forward discount of 2 percent towardthe initial interest differential of 1 percent. The last two tendencies would increase the initial interest differential of 1 percent toward the original forward discount of 2 percent. These forces would work until the interest rate differential equaled the forward discount.
Any point above the interest parity line, such as point A, has the following two features:(1) the first step of the arbitrage process would be to borrow money in the home country;and (2) funds would move from the home country to the foreign country (arbitrageoutflow). Any point below the interest parity line, such as point B, has the following twofeatures: (1) the first step of the arbitrage process would be to borrow money in the foreigncountry, and (2) funds would move from the foreign country to the home country (arbitrage inflow).
The interest parity line of figure 5.5 identifies the equilibrium position for the relation-ship between interest rate differentials and forward premiums or discounts. Every point on this line represents a situation in which the interest rate differential equals the forwardpremium or discount. In this case, arbitrageurs would have no incentive to transfer fundsfrom one country to the other. However, at any point off the line, there should be an incentive to move funds from one country to another. Such transfers of funds would cause interest differentials or forward premiums (discounts) to move toward the interestparity line.
The theoretical equilibrium position exists only under a free market system. Because there are a variety of artificial barriers and intervention by government authorities in both foreign exchange and money markets, this equilibrium condition hardly ever exists inpractice.
ARBITRAGES 141

142 THE FOREIGN-EXCHANGE MARKET AND PARITY CONDITIONS
SUMMARY
Exchange rates represent prices of one currency in terms of another currency. They are determinedby the forces of supply and demand under a free market system. The primary function of the foreign-exchange market is to transfer purchasing power denominated in one currency to another, therebyfacilitating foreign trade and investment. The foreign-exchange market consists of two tiers: theinterbank market, in which banks trade with each other, and the retail market, in which banks dealwith their nonbank customers.
A major problem of multinational corporations is the fact that cash flows must cross nationalboundaries. These flows are subject to various constraints imposed by government authorities andexchange rate fluctuations. Trades in currencies take place in the foreign-exchange markets for imme-diate delivery (spot market) and future delivery (forward market). The foreign-exchange market isa worldwide network of telephone and computer communications between banks.
The five major theories of exchange rate determination are (1) the theory of purchasing powerparity, (2) the Fisher effect, (3) the international Fisher effect, (4) the interest rate parity theory, and(5) the forward rate as an unbiased predictor of the future spot rate. These five theories illustratethe links that exist among spot rates, interest rates, inflation rates, and forward rates. In efficientexchange markets, spot exchange rates are theoretically determined by the interplay of differentialnational rates of inflation and interest, and the forward premium or discount.
Essentially, the PPP doctrine and the interest parity theory explain why, in the long run, exchangerates move toward positions of equilibrium in which prices in different countries and their interestrates are the same. This is because arbitrageurs buy currencies in one market and sell them in anothermarket in order to take advantage of price or interest differentials prevailing at differential nationalmarkets. Thus, the process of arbitrage works through the foreign-exchange market to bring infla-tion and interest rates in different markets closer together.
Questions
1 What are the major roles that commercial banks play in international transactions?2 What is the cross rate? Why do we have to compute the cross rate?3 When will a forward exchange contract backfire?4 List the hypotheses on which the concept of efficient exchange markets depends.5 Assume that the inflation rate is higher in the USA than in Japan. How should this affect
the US demand for Japanese yen, the supply of the yen for sale, and the equilibriumvalue of the yen?
6 Discuss some causes of deviations from purchasing power parity.7 Assume that the interest rate is higher in the UK than in the USA. How should this affect
the US demand for British pounds, the supply of pounds for sale, and the equilibriumvalue of the pound?

PROBLEMS 143
8 Under what conditions will a higher inflation rate of a country lead to a correspondingincrease of its interest rate for that country?
9 If the US trade balance with the UK is expected to improve next year, what is the likelyrelationship between the forward rate on the British pound and its current spot rate?
10 Assume that the difference between the US interest rate and the Mexican interest rateis 11 percent in favor of Mexico, but the forward discount rate for the Mexican peso is20 percent. The discrepancy between the interest differential and the forward discountseem to open incentives for arbitrage. Could it be possible to take advantage of theopportunity for covered-interest arbitrage?
Problems
1 If the Swiss franc is selling for $0.5618 and the Japanese yen is selling for $0.0077, whatis the cross rate between these two currencies?
2 (a) If the spot rate changes from $0.11 per peso to $0.10 per peso over a 1-year period,what is the percentage change in the value of the Mexican peso?(b) If the spot rate changes from Mex$10.00 per dollar to Mex$9.00, what is the per-
centage change in the value of the Mexican peso?3 If a bank’s bid price is $1.60 for the British pound and its ask price is $1.65, what is the
bid–ask spread for the pound?4 Assume: (1) the spot rate for Canadian dollars is $0.8089; (2) the 180-day forward rate
for Canadian dollars is $0.8048; (3) the spot rate for Swiss francs is $0.4285; and (4) the180-day forward rate for Swiss francs is $0.4407. Determine the 180-day forward dis-count or premium on both the Canadian dollar and the Swiss franc.
5 Fill in the following blank spaces:
British pounds Swiss francs
Direct (outright)Spot $2.0787 $0.410830-day forward 0.412090-day forward 0.4144Points (spread)30-day forward -1390-day forward -60Percentage discount or premium a year30-day forward90-day forward

144 THE FOREIGN-EXCHANGE MARKET AND PARITY CONDITIONS
6 Assume that the current exchange rate is $2.00 per pound, the US inflation rate is 10percent for the coming year, and the British inflation rate is 5 percent over the sameperiod. What is the best estimate of the pound future spot rate 1 year from now?
7 Assume that you can buy a particular basket of goods for $108 in the USA and ¥14,000in Japan.(a) What should the ¥/$ exchange rate be according to the absolute purchasing power
parity?(b) If the actual exchange rate were ¥120 per dollar, would the dollar be considered
undervalued or overvalued?8 The following quotations and expectations exist for the Swiss franc:
Present spot rate $0.500090-day forward rate 0.5200Your expectation of the spot rate in 90 days 0.5500
(a) What is the premium or discount on the forward Swiss franc?(b) If your expectation proves correct, what would be your dollar profit or loss from
investing $4,000 in the spot market? How much capital would you need now tocarry out this operation? What are the major risks associated with this speculation?
(c) If your expectation proves correct, what would be your dollar profit or loss frominvesting $4,000 in the forward market? How much capital would you need nowto speculate in the forward market? What are the major risks associated with thespeculation?
9 An American firm purchases $4,000 worth of perfume (Mex$20,000) from a Mexicanfirm. The American distributor must make the payment in 90 days, in Mexican pesos.The following quotations and expectations exist for the Mexican peso:
Present spot rate $0.200090-day forward rate 0.2200Your expectation of the spot rate in 90 days 0.2500US interest rate 15%Mexican interest rate 10%
(a) What is the premium or discount on the forward Mexican peso? What is the inter-est differential between the USA and Mexico? Is there an incentive for covered-interest arbitrage?
(b) If there is an incentive for covered-interest arbitrage, how can an arbitrageur takeadvantage of the situation? Assume: (1) the arbitrageur is willing to borrow $4,000or Mex$20,000; and (2) there are no transaction costs.
(c) If transaction costs are $100, would an opportunity still exist for covered-interestarbitrage?
(d) What alternatives are open to the importer if she wants to cover her transactionagainst the foreign-exchange risk?

REFERENCES 145
(e) Assume that your expectation proves correct and that the importer decides to coverthis transaction. What would be the opportunity cost of each alternative? Whichalternative is more attractive and why?
(f) Would you advise the American firm to cover its foreign transaction? Why or whynot?
10 You must make a $100,000 domestic payment in Los Angeles in 90 days. You have$100,000 now and decide to invest it for 90 days either in the USA or in the UK. Assumethat the following quotations and expectations exist:
REFERENCES
Alec, C. K., “A Guide to Foreign ExchangeMarkets,” Review, Federal Reserve Bank of St.Louis, Mar. 1984, pp. 5–18.
Baker, J. C., International Finance, Upper SaddleRiver, NJ: Prentice Hall, 1998, ch. 3.
Hopper, G. P., “Is the Foreign Exchange MarketInefficient?” Business Review, Federal ReserveBank of Philadelphia, May/June 1994, pp.17–27.
Hutchinson, M., “Is Official Exchange Rate Inter-vention Effective?” FRBSF Economic Letter,Federal Reserve Bank of San Francisco, July 18,2003, pp. 1–3.
Kubarych, R. M., Foreign Exchange Markets in theUnited States, Federal Reserve Bank of New York,Mar. 1983.
Levich, R. M., International Financial Markets, NewYork: Irwin/McGraw-Hill, 1997, ch. 3.
Marrinan, J., “Exchange Rate Determination:Sorting Out Theory and Evidence,” New EnglandEconomic Review, Federal Reserve Bank ofBoston, Nov./Dec. 1989, pp. 39–51.
Stockman, A. C., “The Equilibrium Approach toExchange Rates,” Economic Review, FederalReserve Bank of Richmond, Mar./Apr. 1987, pp.12–30.
Present spot rate per pound $1.800090-day forward rate per pound $1.7800US interest rate 8%UK interest rate 10%
(a) Where should you invest your $100,000 to maximize your yield with no risk?(b) Given the US interest rate, the UK interest rate, and the spot rate, what would be
an equilibrium forward exchange quotation? This equilibrium situation shouldprovide you with no advantage or disadvantage associated with investing in onecountry or the other.
(c) Given the spot rate, the forward rate, and the US interest rate, what is the equilib-rium UK interest rate?
11 Assume that ¥1 = $0.0077 in New York, $1 = SKr2.00 in London, and SKr1 = ¥65 inTokyo.(a) If you have ¥10,000 on hand, how could you use a triangle arbitrage to earn a
profit?(b) If you ignore transaction costs, what is the arbitrage profit per yen initially traded?

146 THE FOREIGN-EXCHANGE MARKET AND PARITY CONDITIONS
Case Problem 5: The Big Mac HamburgerStandard: February 2003
The theory of purchasing power parity (PPP) is one of the oldest theories in international eco-nomics. The theory states that, in the long run, the exchange rates between two currenciesshould move toward the rate that would equalize the prices of an identical basket of goodsand services in the two countries. As a theoretical proposition, it serves as a solid foundationfor thinking about the conditions under which prices in international markets adjust to attainlong-term equilibrium. As a practical matter, however, PPP has been a more puzzling concept.
The Economist, a monthly business publication, has established another, yet somewhat morerecent, tradition: the Big Mac PPP. Since 1986, The Economist has evaluated prevailingexchange rates on the basis of Big Mac price differentials in various countries around the world.A similar index has also been developed by the Union Bank of Switzerland in its annual com-parison of prices and incomes around the globe. These light-hearted studies of internationalburger prices have predictably stimulated the passion of the popular media and the financialpress. The Big Mac index was devised as an enjoyable guide to whether currencies are at their“correct” level. As The Economist puts it, “the index is not intended to be a predictor ofexchange rates, but a tool to make economic theory more digestible.” An identical basket ofgoods and services in this particular case is a McDonald’s Big Mac, which is made to roughlythe same recipe in more than 100 countries. The Big Mac PPP is the exchange rate that wouldmake a burger cost the same in America as it does abroad. Comparing Big Mac PPPs withactual exchange rates is one test of whether a currency is undervalued or overvalued.
The second column of table 5.2 shows the local-currency prices of a Big Mac: the third con-verts them into dollars. The fourth column shows Big Mac PPPs. For example, dividing theSwiss price by the American gives a dollar PPP of SFr2.48. The actual rate on February 11,2003, was SFr1.37, implying that the Swiss franc is 81 percent overvalued against the dollar.The average American price is $2.54. Argentina is a place for bargain hunters: a Buenos AiresBig Mac costs only $0.80. At the other extreme, the Swiss price of $4.61 is enough to makeBig Mac fans choke on their all-beef patties. This implies that the Argentinean peso is the mostundervalued currency (by 69 percent), and the Swiss franc is the most overvalued (by 81percent). In general, the dollar is undervalued against the currencies of most big industrialcountries, but overvalued against the currencies of developing countries.
Case Questions
1 Name the currencies of the 15 countries listed in table 5.2 and write down their traditionalsymbols.

2 Calculate the dollar price of a Big Mac (column 3), the implied PPP of the dollar (column4), and the local currency under(-)/over(+)valuation (column 6) for Denmark and HongKong.
3 In 2003, it cost $0.80 to buy a Big Mac in Argentina, $2.54 to buy a Big Mac in the USA,and $4.61 to buy a Big Mac in Switzerland. How do we explain these deviations from PPP?
4 A web page of OANDA.com (see www.oanda.com/products/bigmac/bigmac.shtml) pro-vides exchange rate trends of various currencies. Use this web page to obtain the latestversion of the hamburger standard shown in table 5.2.
Sources: www.oanda.com/products/bigmac/bigmac.shtml as of Feb. 11, 2003; R. E. Cumby, “ForecastingExchange Rates and Relative Prices With the Hamburger Standard: Is What You Want What You Get WithMcParity?” Manuscript, Georgetown University, 1995; and M. R. Pakko and P. S. Pollard, “For Here or ToGo? Purchasing Power Parity and the Big Mac,” Review, Federal Reserve Bank of St. Louis, Jan./Feb. 1996,pp. 3–21.
CASE PROBLEM 5 147
Table 5.2 The hamburger standard
Implied Actual Local currencyIn local PPP of exchange under(-)/over(+)
Country currency In dollars dollar rate valuation
USA 2.54 2.54 – – –Switzerland 6.30 4.61 2.48 1.37 +81Denmark 24.75 3.57 9.74 6.92 +40UK 1.99 3.24 1.28 1.63 +27Sweden 24.0 2.81 9.45 9.45 +11Eurozone 2.57 2.76 0.99 0.93 +6South Korea 3,000 2.51 1,181 1,196.70 -1Japan 294 2.42 116 121.30 -4Taiwan 70.0 2.01 27.6 34.90 -21Hong Kong 10.2 1.31 4.02 7.80 -48China 9.9 1.19 3.90 8.29 -53South Africa 9.70 1.13 3.82 8.57 -55Russia 35.00 1.10 13.80 31.82 -57Brazil 3.30 1.00 1.52 3.59 -58Argentina 2.50 0.80 0.98 3.13 -69

Opening Case 6: Derivatives Risks
Do you know how many days it took for a son to lose $150 million in foreign-exchange trading that it had taken his father decades to accumulate? The answer isjust 60 days. The following story illustrates how volatile the currency derivativesmarket was in the 1990s.
“Dad, I lost a lot of money,” Zahid Ashraf, a 44-year-old from the United ArabEmirates, confessed to his ailing father, Mohammad. “Maybe no matter,” the fathersaid, recalling the conversation in court testimony. Mohammad Ashraf, who had builtone of the largest gold and silver trading businesses in the Persian Gulf, then asked,“How much have you lost?” The answer – about $150 million – mattered plenty tothe stunned 69-year-old family patriarch.
In 2 months of foreign-currency trading in 1996, Zahid wasted much of a fortune($250 million) that it had taken his father decades to build. The tight-knit Ashraf familyestimates that Chicago-based commodities giant Refco Inc. collected about $11million in commissions for the trades. So they sued Refco for $75 million of their losses.The Ashrafs contended that “Refco brokers conspired Zahid Ashraf to execute massiveunauthorized speculative trading in currency futures and options” and “to concealthese trades from other family members.” However, after a seven-day trial in Febru-ary 1999, the jury ruled against the Ashrafs, not only rejecting their claim, but alsofinding that the family’s Eastern Trading Co. still owed Refco $14 million on Zahid’suncovered losses. Because it involved a family business whose home turf is far fromthe world’s financial capitals, such as New York or London, the debacle transpired vir-tually unnoticed. But it serves as yet another reminder of hazards posed by the volatilederivatives markets of the 1990s.
CHAPTER 6
Currency Futures andOptions

Multinational companies (MNCs) normally use the spot and forward markets for internationaltransactions. They also use currency futures, currency options, and currency futures options forvarious corporate functions. While speculators trade currencies in these three markets for profit,MNCs use them to cover open positions in foreign currencies.
This chapter is divided into three closely related sections. The first section discusses currencyfutures. With a currency futures contract, one buys or sells a specific foreign currency for deliv-ery at a designated price in the future. The second section describes currency options. A cur-rency option is the right to buy or sell a foreign currency at a specified price through a specifieddate. The third section examines currency futures options. A currency futures option is the rightto buy or sell a futures contract of a foreign currency at any time for a specified period.
OPENING CASE 6 149
Financial derivatives, such as futures, options, and swaps, are supposedly hedginginstruments designed to alleviate or eliminate a variety of risks. These hedging instru-ments are generally considered safe for short-term purposes, but they are not risk freeeither. Even some reputable companies, such as Procter & Gamble, have incurred largederivative-related losses in recent years (see Case Problem 7: Regulation of Deriva-tives Markets). Such corporate disasters related to financial derivatives continue to bea problem in global business. As is the case with so many issues in modern society,technology is not at fault, but rather human error in its use.
Sources: “How Currency Trading Run Amok Crushed a Family,” The Wall Street Journal, Apr. 8,1999, pp. C1, C13; and M. H. Moffett, A. I. Stonehill, and D. K. Eiteman, Fundamentals of Multinational Finance, Boston, MA: Addison-Wesley, 2003, p. 157.
Global Finance in Action 6.1More Bang for Your Buck in Currency Trading
The potential of CME foreign-currency futures and options on futures is easy tounderstand.
They are volatile. They offer low margins. And they are exceptionally liquid, withan average daily volume close to 100,000 contracts.
Most important, CME currency contracts trend well, year after year. And theyrespond to familiar, fundamental economic factors – the kind of information youfollow every day in the news.
What is more, with CME foreign-currency options, you can take advantage ofopportunities in the market with limited risk.
Of course, trading foreign-currency futures and options at the CME does involverisk. But if you can afford to assume it, they offer everything a speculator could want.
More bang for the buck. The euro. And the yen. To learn more, call your futuresbroker.
Source: Chicago Mercantile Exchange (CME).

6.1 The Currency Futures Market
The Chicago Mercantile Exchange (CME), known as “The Merc,” was founded in 1919 as anonprofit organization to trade spot and futures commodity contracts. In 1972, the CME intro-duced futures trading in foreign currencies through the International Monetary Market (IMM)as an alternative to regular forward contracts offered by commercial banks. Most major exchangesaround the world have added currency futures in recent years. They include the PhiladelphiaBoard of Trade, the New York Board of Trade, the Deutsche Termin Borse in Frankfurt, theHong Kong Futures Exchange, the London International Financial Futures Exchange, the NewZealand Futures Exchange, the Singapore International Monetary Exchange, the StockholmOptions Market, the Tokyo International Financial Futures Exchange, the Mer Der Exchange inMexico, the BM&F Exchange in Brazil, the Budapest Commodity Exchange, and the KoreanFutures Exchange.
6.1.1 Futures market participants
Futures contracts are deals made now to take place in the future. In a futures contract, the buyerand the seller agree on:
1 A future delivery date.2 The price to be paid on that future date.3 The quantity of the currency.
The currency futures market was created for those who use foreign exchange in business. Busi-nesses, which deal with international transactions, routinely buy and sell foreign exchange in thespot market. They enter the futures market only to protect themselves against risks from volatileexchange rates. The currency futures contract is like an insurance policy against changes inexchange rates. In practice, most currency futures contracts are nullified by opposing trades, sofutures traders rarely take delivery of a foreign currency; in fact, nearly 98 percent of them areterminated before delivery.
There are two distinct classes of traders in the currency futures market: hedgers and specula-tors. Hedgers buy and sell currency futures contracts to protect the home currency value offoreign currency denominated assets and liabilities. They include MNCs, importers, exporters,bankers, and brokers, who require protection against adverse exchange rate movements. Theyexpect their profits to come from managerial skills in conducting their business activities, notfrom incidental fluctuations in exchange rates. Speculators, on the other hand, buy and sell cur-rency futures contracts for profit from exchange rate movements. They trade futures strictly forprofit; they can make or lose fortunes. A speculator trades currency futures but never uses thecurrency.
A hedger may place a contract with another hedger who wishes to cover currency needs inthe opposite direction, but the other party to the contract typically is a speculator. Though crit-icized for greed, speculators play a vital role in futures markets by assuming the risk of the hedger.Their presence not only gives the market liquidity and continuity but also eases entry and exit.
Currency futures trading can take place for hedging or speculation, as well as for arbitrage.In particular, some traders quickly take advantage of any profitable differential, for the same
150 CURRENCY FUTURES AND OPTIONS
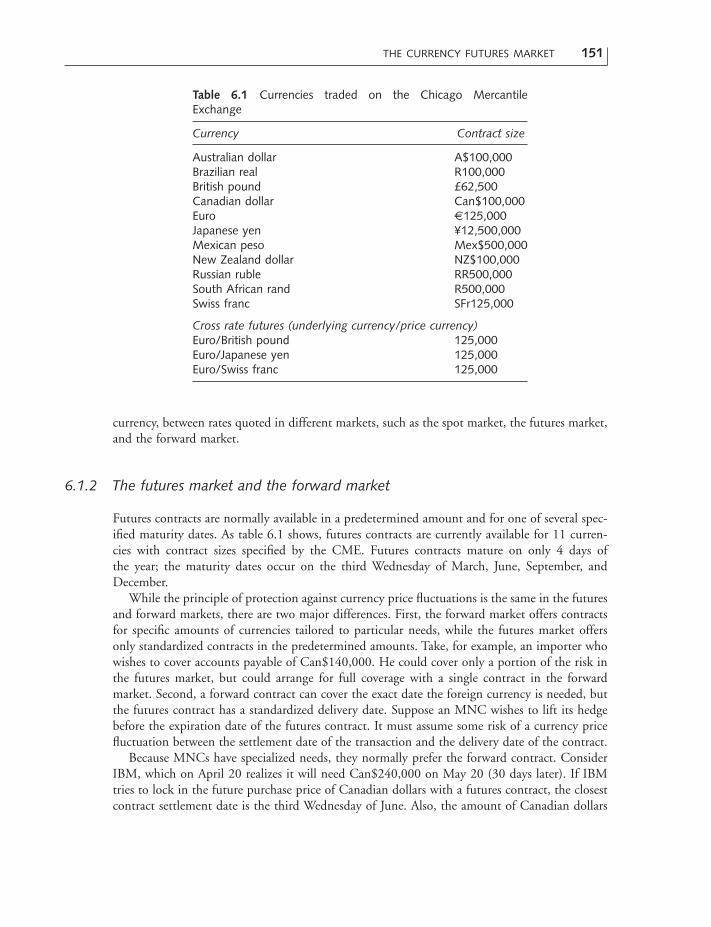
currency, between rates quoted in different markets, such as the spot market, the futures market,and the forward market.
6.1.2 The futures market and the forward market
Futures contracts are normally available in a predetermined amount and for one of several spec-ified maturity dates. As table 6.1 shows, futures contracts are currently available for 11 curren-cies with contract sizes specified by the CME. Futures contracts mature on only 4 days of the year; the maturity dates occur on the third Wednesday of March, June, September, andDecember.
While the principle of protection against currency price fluctuations is the same in the futuresand forward markets, there are two major differences. First, the forward market offers contractsfor specific amounts of currencies tailored to particular needs, while the futures market offersonly standardized contracts in the predetermined amounts. Take, for example, an importer whowishes to cover accounts payable of Can$140,000. He could cover only a portion of the risk inthe futures market, but could arrange for full coverage with a single contract in the forwardmarket. Second, a forward contract can cover the exact date the foreign currency is needed, butthe futures contract has a standardized delivery date. Suppose an MNC wishes to lift its hedgebefore the expiration date of the futures contract. It must assume some risk of a currency pricefluctuation between the settlement date of the transaction and the delivery date of the contract.
Because MNCs have specialized needs, they normally prefer the forward contract. ConsiderIBM, which on April 20 realizes it will need Can$240,000 on May 20 (30 days later). If IBMtries to lock in the future purchase price of Canadian dollars with a futures contract, the closestcontract settlement date is the third Wednesday of June. Also, the amount of Canadian dollars
THE CURRENCY FUTURES MARKET 151
Table 6.1 Currencies traded on the Chicago MercantileExchange
Currency Contract size
Australian dollar A$100,000Brazilian real R100,000British pound £62,500Canadian dollar Can$100,000Euro €125,000Japanese yen ¥12,500,000Mexican peso Mex$500,000New Zealand dollar NZ$100,000Russian ruble RR500,000South African rand R500,000Swiss franc SFr125,000
Cross rate futures (underlying currency/price currency)Euro/British pound 125,000Euro/Japanese yen 125,000Euro/Swiss franc 125,000

needed (Can$240,000) is more than the standardized amount (Can$100,000) specified in thecontract. The best IBM can do is to buy two futures contracts (Can$200,000), but the forwardmarket can be tailored to meet the individual needs of MNCs. IBM can buy a forward contractof Can$240,000 with a maturity date of 30 days from BankAmerica.
Currency futures contracts and forward contracts are acquired for hedging, speculation, orarbitrage. Yet, the futures market is more centralized, standardized, and less customer-orientedthan the forward market. The futures market and the forward market differ in notable ways:
1 Price range. Because the CME specifies a maximum daily price range for each day, a futuresmarket participant is not exposed to more than a limited amount of daily price change. Butforward contracts have no daily limits on price fluctuations.
2 Maturity. CME futures contracts are available for delivery on one of only four maturitydates per year, but banks offer forward contracts for delivery on any date.
3 Size of contract. The futures market offers only standardized contracts in predeterminedamounts, but the forward market offers contracts for specific amounts of currencies tailoredto specific needs.
4 Regulation. The futures market is regulated by the Commodity Futures Commission, butthe forward market is self-regulating.
5 Settlement. Less than 2 percent of the CME futures contracts are settled by actual delivery,but more than 90 percent of forward contracts are settled by delivery.
6 Location. Futures trading takes place on organized exchanges, but forward trading is nego-tiated directly between banks and their clients.
7 Credit risk. The CME guarantees to deliver the currency on schedule if the seller defaults,or to acquire it if the buyer defaults. On the other hand, a bank dealing in the forwardmarket must satisfy itself that the party with whom it has a contract is creditworthy.
8 Speculation. CME brokers accommodate speculative transactions, whereas banks generallydiscourage speculation by individuals.
9 Collateral. A security deposit (margin) must back every futures contract, but forward con-tracts do not require any margin payment. Compensating balances are required in mostforward contracts.
10 Commission. In the futures market, commissions of intermediaries depend on published bro-kerage fees and negotiated rates on block trades. In the forward market, a “spread” betweenthe bank’s buy and sell prices sets the commissions of intermediaries.
11 Trading. Futures contracts are traded in a competitive arena, but forward contracts are tradedby telephone or telex.
6.1.3 How to read currency futures quotes
The Wall Street Journal and other major newspapers carry currency futures quotations, thoughthey do not list the newest or least active contracts. To explain how to read currency futuresquotes, we will focus on the Australian dollar futures traded on the CME. Table 6.2 presents theAustralian dollar futures prices reported in The Wall Street Journal on July 1, 2004. Because thereis a one-day time lag between the transactions of foreign exchange and the report of these trans-actions, we obtained the June 30 quotations from the July 1 issue of The Wall Street Journal.
The top, bold-faced line gives the name of the currency, in this case the Australian dollar (AUD); the exchange on which it is traded according to a key in the table, such as the
152 CURRENCY FUTURES AND OPTIONS
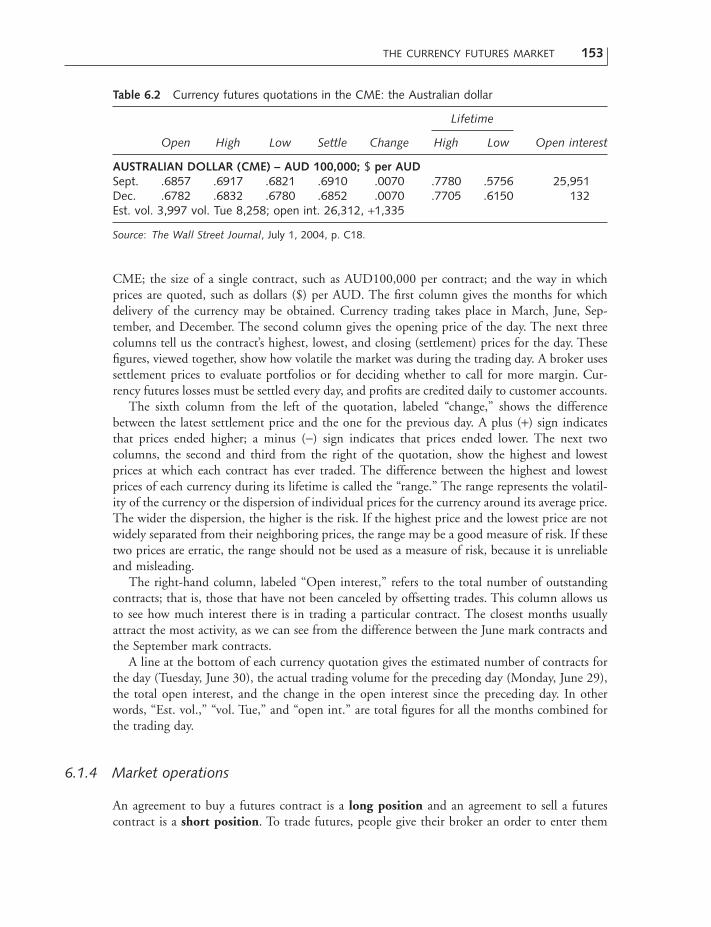
CME; the size of a single contract, such as AUD100,000 per contract; and the way in whichprices are quoted, such as dollars ($) per AUD. The first column gives the months for whichdelivery of the currency may be obtained. Currency trading takes place in March, June, Sep-tember, and December. The second column gives the opening price of the day. The next threecolumns tell us the contract’s highest, lowest, and closing (settlement) prices for the day. Thesefigures, viewed together, show how volatile the market was during the trading day. A broker usessettlement prices to evaluate portfolios or for deciding whether to call for more margin. Cur-rency futures losses must be settled every day, and profits are credited daily to customer accounts.
The sixth column from the left of the quotation, labeled “change,” shows the differencebetween the latest settlement price and the one for the previous day. A plus (+) sign indicatesthat prices ended higher; a minus (-) sign indicates that prices ended lower. The next twocolumns, the second and third from the right of the quotation, show the highest and lowestprices at which each contract has ever traded. The difference between the highest and lowestprices of each currency during its lifetime is called the “range.” The range represents the volatil-ity of the currency or the dispersion of individual prices for the currency around its average price.The wider the dispersion, the higher is the risk. If the highest price and the lowest price are notwidely separated from their neighboring prices, the range may be a good measure of risk. If thesetwo prices are erratic, the range should not be used as a measure of risk, because it is unreliableand misleading.
The right-hand column, labeled “Open interest,” refers to the total number of outstandingcontracts; that is, those that have not been canceled by offsetting trades. This column allows usto see how much interest there is in trading a particular contract. The closest months usuallyattract the most activity, as we can see from the difference between the June mark contracts andthe September mark contracts.
A line at the bottom of each currency quotation gives the estimated number of contracts forthe day (Tuesday, June 30), the actual trading volume for the preceding day (Monday, June 29),the total open interest, and the change in the open interest since the preceding day. In otherwords, “Est. vol.,” “vol. Tue,” and “open int.” are total figures for all the months combined forthe trading day.
6.1.4 Market operations
An agreement to buy a futures contract is a long position and an agreement to sell a futurescontract is a short position. To trade futures, people give their broker an order to enter them
THE CURRENCY FUTURES MARKET 153
Table 6.2 Currency futures quotations in the CME: the Australian dollar
Lifetime
Open High Low Settle Change High Low Open interest
AUSTRALIAN DOLLAR (CME) – AUD 100,000; $ per AUDSept. .6857 .6917 .6821 .6910 .0070 .7780 .5756 25,951Dec. .6782 .6832 .6780 .6852 .0070 .7705 .6150 132Est. vol. 3,997 vol. Tue 8,258; open int. 26,312, +1,335
Source: The Wall Street Journal, July 1, 2004, p. C18.

into a contract as either a buyer (the long position) or as a seller (the short position), dependingon which way they think the market is heading.
MARGIN REQUIREMENTS Some form of deposit ensures that each party fulfills its commit-ment; this type of deposit is called the margin. The exchanges set a minimum margin for each contract, but brokers often require larger margins from clients. The amount of a futuresmargin depends on the volatility of the contract value and hence on the risk. Margin levels also vary for hedging and speculating accounts. For example, exchanges and brokerage firms nor-mally require lower margins for hedging accounts because they carry less risk than speculatingaccounts.
The two basic types of margins are required: the initial margin and the maintenance margin.The initial margin is the amount market participants must deposit into their margin accountat the time they enter into a futures contract. Then, on a daily basis, the margin account is debitedor credited to protect buyers and sellers against the possibility of contract default. Initial marginsfor futures contracts typically range between 1 and 4 percent of a contract’s face value and areset by the exchanges where the contracts are traded.
The maintenance margin is a set minimum margin customers must always maintain in theiraccount. On any day that market losses reduce funds in the account below the maintenancemargin, the broker calls on his customer for an additional deposit to restore the account to theinitial margin level. Requests for additional money are known as margin calls. The maintenancemargin is usually 75 percent of the initial margin.
In addition to these two basic types of margins, market participants are required to post performance bond margins, which are financial guarantees imposed on both buyers and sellers to ensure that they fulfill the obligation of the futures contract. In other words, they are required to make or take delivery of the futures contract unless their position is offset before the expiration of the contract. The purpose of a performance bond margin is to provideintegrity.
154 CURRENCY FUTURES AND OPTIONS
Example 6.1
Lisa George buys Australian dollar futures contracts to cover possible exchange losses onher import orders denominated in Australian dollars. She has to put up an initial margin of$3,000. The maintenance margin imposed by the exchange is 75 percent of the initialmargin, or $2,250. When would she get a margin call from her broker?
If the spot rate for Australian dollars declines, the value of Ms George’s position declines.As long as the decline is less than $750, Lisa George does not need to put up any addi-tional margin. Yet, if the cumulative decline in value comes to $751, her margin accountwould stand at $2,249. She would get a margin call from her brokerage firm and mustrestore the account to the initial level of $3,000. Otherwise, the exchange will sell out herposition and return any remaining balance in her account.

SPECULATION IN THE FUTURES MARKET Speculation offers potentially large profits or lossesdue to the highly leveraged nature of futures trading. Because margin requirements average lessthan 4 percent of the contract’s full value, it is possible to control large amounts of currencieswith little capital. Speculators deliberately expose themselves to exchange risk by engaging infutures contracts in order to make profits from exchange rate movements.
THE CURRENCY FUTURES MARKET 155
Example 6.2
Kenneth Lee, a speculator, enters into a futures contract for March delivery of SFr125,000on February 1. The futures exchange rate of the Swiss franc for March delivery (March 15)is $0.5939 per franc. The margin requirement is 2 percent. His expectation of the spot ratefor francs on March 15 is $0.6117. If his expectation proves correct, what would be his rateof return on investment?
Because the margin requirement is 2 percent, Mr Lee may control this delivery ofSFr125,000 for $1,484.75 (SFr125,000 ¥ $0.5939 ¥ 0.02). He could buy SFr125,000 futuresfor $74,237.50 at the futures quotation of $0.5939, receive them on March 15, and thensell them at the spot rate of $0.6117 for a gross of $76,462.50. Profit would be $2,225.So, he would earn a net profit of $2,225, or 150 percent on the original investment of $1,484.75. Here, the exchange rate would rise by only 3 percent [(0.6117 -0.5939)/0.5939], but the rate of return on investment would be 150 percent. Yet the sameleverage could lead to equally substantial losses. If the spot rate were to decline by 3 percentduring this period, Mr Lee would lose about 150 percent of his investment.
HEDGING IN THE FUTURES MARKET A single forward contract can arrange for the preciseamount and maturity that the bank’s customer desires. A single futures contract is available only ina predetermined amount for one of the four maturity dates each year. These two features of thefutures market may force MNCs to assume some risks of coverage and of currency fluctuation,because they usually need a specified amount of a currency on a specified date. Still, these risks canbe minimized in a properly structured hedge. Prices in the spot and futures markets move in thesame direction by similar amounts due to arbitrage transactions between these two markets.
Example 6.3
On February 1, an American firm imports 5,000 Swiss watches at a cost of SFr250,000 withpayment and delivery due on March 1. The Swiss firm, being a tough negotiator, hasdemanded that the payment be made in Swiss francs upon the delivery of the watches. Theexchange rates are $0.6667 per franc in the spot market and $0.6655 per franc in thefutures market for delivery on March 15.

156 CURRENCY FUTURES AND OPTIONS
Given the costs of marketing the watches, the importer decides that the futures exchangerate is low enough for the company to purchase them and make a profit on the transac-tion. However, the importer must pay for the watches on March 1, although the expirationdate of the futures contract is March 15. The importer can hedge most of its exposure bybuying March Swiss franc contracts on February 1, with the intention of lifting the hedgeon March 1. Because franc contracts are available from the CME in units of 125,000, theimporter would purchase two March contracts, as shown in table 6.3.
The importer could trade out of the contracts by selling them before receiving a deliv-ery notice on March 15. The only risk that the company still faces comes from the differ-ence in the value of the contract on March 1 and its value on March 15. Assume that byMarch 1 the following two things would happen: (1) the spot rate would appreciate to$0.7658 and (2) the futures rate would rise to $0.7650. The importer could close out thefranc futures contracts by selling them on March 1, as shown in table 6.4.
On March 1, the importer purchases SFr250,000 in the spot market for $191,450 andsettles its import bill. However, this $191,450 is higher ($24,775) than its original value onFebruary 1 ($166,675); in other words, the exchange loss from the spot transaction is$24,775. The futures contract that the company sold on March 1 ($191,250) is higher($24,875) than the $166,375 the company anticipated in the futures contract that it pur-chased on February 1; in other words, the exchange gain from the futures transaction is$24,875. The $24,875 gain from the futures transaction exceeds the $24,775 loss from thespot transaction. The risk that the importer assumed on February 1 by purchasing two con-tracts whose maturity did not coincide with the March 1 usage date of the currency resultedin a windfall exchange gain of $100 ($24,875 - $24,775). This $100 gain arose from thedifference between the spot rate and the futures rate prevailing on the day the contractswere liquidated. This difference is the “basis.”
The basis, unlike the spot rate itself, is relatively stable and narrows toward zero as thecontract moves toward maturity. For example, the basis on February 1 was $0.0012 per
Table 6.3 Buying two franc futures contracts on February 1
Futures market forSpot market March 15 delivery
Exchange rate $0.6667/SFr $0.6655/SFrCost of SFr250,000 $166,675 $166,375Action taken None Buy two March 15
contracts
Table 6.4 Reversing the earlier futures contracts on March 1
Futures market forSpot market March 15 delivery
Exchange rate $0.7658/SFr $0.7650/SFrCost of SFr250,000 $191,450 $191,250Action taken Buy SFr250,000 Sell two March 15
contracts

THE CURRENCY OPTIONS MARKET 157
In example 6.3, the difference of $0.0004/SFr in the basis between February 1 and March 1accounted for the windfall exchange gain of $100. This gain might easily have been an exchangeloss of a similar amount if the exchange rate of the Swiss franc had depreciated during the sameperiod. The important point is that the importer was protected from any major loss regardlessof exchange rate movements. For example, if the importer had not purchased the futures con-tract and had bought SFr250,000 in the spot market on March 1, the watches would have costan additional $24,775.
Frequent futures traders may try to coordinate trading between two different markets or twodifferent currencies through a strategy called spread trading, which means buying one contractand simultaneously selling another contract. They will always make money on one contract andlose money on the other contract. Thus, they may make or lose more money on the one con-tract than they lose or make on the other, but they are protected from major loss regardless ofexchange rate movements.
THE TRADING VOLUME IN CURRENCY FUTURES The currency futures market is a good sourceof funds for multinational companies, but it is relatively small and inflexible. In spite of its draw-backs, the futures market grew rapidly until 1992, with total volume falling from that high inrecent years. As shown in figure 6.1, the number of currency futures contracts traded on the CMEincreased from only 199,920 in 1975 to 38 million in 1992. Since 1992, volume has trendeddownward and was cut almost in half by 2001, when only 20 million contracts were traded. Thisdownward trend took place for at least two major reasons. First, the progress toward EuropeanUnion and the growing importance of the euro have made trading in most European currenciesobsolete. Second, the decline in importance of foreign-currency futures is a consequence of thecontinuing growth of the over-the-counter market. In the 1990s, the swap market grew to an enor-mous size and now dwarfs the futures market in general and the currency futures market in par-ticular. Figure 6.2 shows the currency composition of currency futures and their market share in2001. According to the figure, the euro has emerged as the second most important currency interms of trading volume, accounting for 28 percent of the total market in 2001.
6.2 The Currency Options Market
Founded in 1790, the Philadelphia Stock Exchange, the oldest securities market in the UnitedStates, started currency options trading in 1983; since then, the Chicago Mercantile Exchangeand the Chicago Board Options Exchange have added currency options trading. Currencyoptions are now traded on exchanges throughout the world, including those in the USA, London,Amsterdam, Hong Kong, Singapore, Sydney, Vancouver, and Montreal.
As shown in table 6.5, currency options are currently available in six currencies at the Philadel-phia Exchange: the Australian dollar, the British pound, the Canadian dollar, the euro, the
franc ($0.6667 - $0.6655), while by March 1 it had shrunk to $0.0008 ($0.7658 - $0.7650).The degree of uncertainty about the futures price diminishes further as the contractapproaches its March 15 expiration date. On March 15, the futures rate, in effect, becomesthe spot rate.

45
40
35
30
25
20
15
10
5
01977 1980 1983 1986 1989 1992 1995 1998 2001
Year
Volume (millions of contracts)
Figure 6.1 The number of currency futures contracts traded on the Chicago MercantileExchangeSource: The Currency Futures Trading Commission, Annual Report, various issues.
Euro(28.13%)
Canadian $(14.75%)
Swiss franc(14.69%)
Japanese yen(22.43%)
British pound(10.07%)
Mexican peso(5.80%)
Australian $(4.12%)
Figure 6.2 The market share for currency futures, 2001Source: The Currency Futures Trading Commission, Annual Report, various issues.

THE CURRENCY OPTIONS MARKET 159
Japanese yen, and the Swiss franc. These currency options are traded in standard contracts halfthe size of the CME futures contracts. For example, the pound option contract represents 31,250units, which is half of the 62,500 units represented by the pound futures contract. In addition,a significant amount of currency options is traded outside the organized exchanges. Many banksand other financial institutions have just begun to offer currency options that have exercise pricesand exercise dates to meet the specific needs of their corporate clients.
6.2.1 Basic terms
Currency options give the holder the right to buy or sell a foreign currency at a set price on orbefore a specified date. There are two types of options: calls and puts. A currency call optiongives the buyer the right, but not the obligation, to buy a particular foreign currency at a spec-ified price at any time during the life of the option. A currency put option gives the buyer theright, but not the obligation, to sell a particular foreign currency at a specified price at any timeduring the life of the option. The grantor of an option – the writer – must deliver the currencyif a holder calls, or he must buy it if it is put to him by a put holder. For this obligation, thewriter receives a fee or premium.
The holder of a call option will benefit if the underlying currency’s price rises, while the holderof a put option will benefit if it falls. If the currency’s price does not change much during thelife of the option, the holder of the option loses his entire investment. For this reason, optionsare risky, but there is a potential for large profits in options. To buy a foreign currency outrightin the spot market, an investor must pay the entire purchase price of the currency, but the priceof an option is a small fraction of the price of the underlying currency.
The strike price, or the exercise price, is the price at which the buyer of an option has theright to buy or sell an underlying currency. Option buyers can decide whether or not to gothrough with the deal at any time up until the expiration date. Options pay no interest andbecome worthless at expiration unless the price of the underlying currency changes. Only certainexpiration dates are available: the exchange, which lists the option, chooses these expiration dates.
Options differ from all other types of financial instruments in the profit–loss patterns thatthey produce. The beauty of options is that the holder of an option has the possibility of unlim-ited profit, but his maximum loss would be limited to the amount of premium paid. The holderhas the choice of exercising the option or allowing it to expire unused. The holder will exercisethe option only when it becomes profitable. On the down side, the holder can let the option
Table 6.5 Currency options prices traded on the PhiladelphiaExchange
Currency Contract size
Australian dollar A$50,000British pound £31,250Canadian dollar Can$50,000Euro €62,500Japanese yen ¥6,250,000Swiss franc SFr62,500

expire and walk away with a loss no more than the premium paid for it. On the other hand, thepossibility of unlimited profit or loss exists in the spot market, the forward market, and thefutures market. The profit structures for long and short positions in both the forward marketand the futures market exactly mirror each other. In other words, the long or short position onan underlying currency produces a one-to-one gain or loss depending on where the spot rateends up relative to the contracted futures rate. The buyer of a futures contract earns one dollarfor every dollar the seller of the futures contract loses, and vice versa.
6.2.2 How to read currency option quotes
To explain how to read currency option quotes, we will focus on the Swiss franc option tradedon the Philadelphia Stock Exchange. Table 6.6 reflects typical quotes in The Wall Street Journalfor options on the Swiss franc. Although the table does not show them, there are two sets offigures for each of most currencies. One set consists of quotes for European-style options andanother set of quotes for American-style options. A European-style option can be exercised onlyat the time of expiration. An American-style option can be exercised at any time between thedate the option is written and its maturity date. Because American-style options are more flexi-ble than European-style options, American-style options are typically more valuable than European-style options for a given strike price, exchange rate volatility, and period to maturity.There are also a number of cross rate options contracts available for several sets of two curren-cies, such as Euro–Japanese yen.
The first column shows the spot rate of the underlying currency. In table 6.6, “Option &underlying” means that 58.51 cents, or $0.5851, was the spot dollar price of one Swiss franc atthe close of trading on the preceding day. The second column shows various strike prices, pricesof the underlying currency at which options confer the right to buy or sell. There are several different strike prices listed for the Swiss franc, which means that there were several options available for the Swiss franc.
Then follow two groups of three figures. The first group gives the closing prices or premiumsfor call options at a given strike price valid until each maturity date (Aug., Sept., and Dec.). Thesecond group gives the closing prices or premiums for put options at a given strike price validuntil each maturity date (Aug., Sept., and Dec.). Options mature on the Saturday before thethird Wednesday of the expiration month.
Generally, prices are highest for call options whose strike price is below the spot rate and forput options whose strike price is above the spot rate. The volume of options trading is frequently
160 CURRENCY FUTURES AND OPTIONS
Table 6.6 Swiss franc option quotations
Option & StrikeCalls – last Puts – last
underlying price Aug. Sept. Dec. Aug. Sept. Dec.
58.51 56.5 – – – 0.0 0.03 1.1658.51 58 0.71 1.05 1.28 0.27 0.81 1.1858.51 59.5 0.15 0.40 – 2.32 – –

THE CURRENCY OPTIONS MARKET 161
large relative to trading in the underlying currency. This reflects trading by professionals whomake their money on numerous but short-term transactions and by holders of foreign exchangewho hedge large blocks with options. Such hedging provides a price protection similar to thatoffered by currency futures.
6.2.3 Currency option premiums
An option that would be profitable to exercise at the current spot rate is said to be in the money.An option that would not be profitable to exercise at the current spot rate is said to be out ofthe money. When the strike price of any call or put option equals the current spot rate, theoption is said to be “at the money.” Table 6.7 should help you determine whether any call optionor put option is in the money, out of the money, or at the money.
A currency option premium is the price of either a call or a put that the option buyer mustpay the option seller (option writer). This premium depends on market conditions, such assupply, demand, and other economic variables. Regardless of how much the market swings, themost an option buyer can lose is the option premium. He deposits the premium with his broker,and the money goes to the option seller. Option buyers are not required to maintain margin(deposit) accounts because of this limited and known risk.
Option sellers, on the other hand, face risks similar to those of participants in the spot orfutures markets. For example, because the seller of a call option is assigned a short position, therisk is the same as for someone who initially bought a foreign currency. The option seller postsmargin to demonstrate his or her ability to meet any potential contractual obligations.
Even though the marketplace is the ultimate determinant of an option premium, there aresome basic guidelines that traders use to calculate option premiums. In general, an optionpremium is the sum of intrinsic value and time value:
total value (premium) = intrinsic value + time value (6.1)
However, it is important to note that both intrinsic value and time value are influenced by thevolatility of the difference between a strike price and the price of the underlying currency.
INTRINSIC VALUE Intrinsic value is the difference between the current exchange rate of theunderlying currency and the strike price of a currency option. In other words, intrinsic valueequals the immediate exercise value of the option, but it cannot be lower than zero, because
Table 6.7 Option: in the money, out of the money, or at themoney?
Call option Put option
In the money Spot > strike Spot < strikeAt the money Spot = strike Spot = strikeOut of the money Spot < strike Spot > strike

investors can let their option expire unexercised in case of a possible loss. As a result, any optionwith an intrinsic value is said to be “in the money.” As an example, consider a put option witha strike price of $1.70 per pound and a current spot rate of $1.50 per pound. The intrinsic valueof this put is $0.20 ($1.70 - $1.50) in the money, because the immediate exercise of the putwould give a $0.20 cash inflow.
TIME VALUE The second major component of an option premium is the time value, which isthe amount of money that options buyers are willing to pay for an option in the anticipationthat over time a change in the underlying spot rate will cause the option to increase in value. Ingeneral, the longer the length of time before the settlement date, the higher is the optionpremium. This is because the right to buy or sell something is more valuable to a market par-ticipant if you have 4 months to decide what to do with the option rather than just 1 month.For example, an expiration date in June has four additional months beyond February for the spotrate to change above or below the strike price. As the option approaches its maturity, the timevalue declines to zero.
THE VALUE OF EXCHANGE RATE VOLATILITY Volatility of the underlying spot rate is one of the most important factors that influences the value of the option premium. Volatility mea-sures the fluctuation in price over a given period of time. The greater the variability of the cur-rency, the higher is the probability that the spot rate will be below or above the strike price. Thus,more volatile currencies tend to have higher option premiums.
SUMMARY Typically, options have positive values even if they are out of the money (i.e., havezero intrinsic value). Investors will usually pay something today for out of the money options onthe chance of profit before maturity. They are also likely to pay some additional premium todayfor in the money options on the chance of an increase in intrinsic value before maturity. Thus,the price of an option is always somewhat greater than its intrinsic value.
6.2.4 Currency call options
A currency call option is a contract that gives the buyer the right to buy a foreign currency at aspecified price during the prescribed period. People buy currency call options because they antic-ipate that the spot rate of the underlying currency will appreciate. Currency option trading cantake place for hedging or speculation.
HEDGING IN THE CALL OPTIONS MARKET MNCs with open positions in foreign currenciescan utilize currency call options. Suppose that an American firm orders industrial equipmentfrom a German company, and its payment is to be made in euros upon delivery. A euro calloption locks in the rate at which the US company can purchase euros for dollars. Such anexchange between these two currencies at the specified strike price can take place before the set-tlement date. Thus, the call option specifies the maximum price that the US company must payto obtain euros. If the spot rate falls below the strike price by the delivery date, the Americanfirm can buy euros at the prevailing spot rate to pay for its equipment and can simply let its calloption expire.
162 CURRENCY FUTURES AND OPTIONS

THE CURRENCY OPTIONS MARKET 163
SPECULATING IN THE CALL OPTIONS MARKET Individuals may speculate with currency calloptions based on their expectations of exchange rate fluctuations for a particular currency. Thepurpose of speculation in the call options market is to make a profit from exchange rate move-ments by deliberately taking an uncovered position. If a speculator expects that the future spotrate of a currency will increase, he makes the following transactions: The speculator will (1) buycall options of the currency, (2) wait for a few months until the spot rate of the currency appre-ciates highly enough, (3) exercise his option by buying the currency at the strike price, and (4)then sell the currency at the prevailing spot rate. When a speculator buys and then exercises acall option, his profit (loss) is determined as follows:
profit (loss) = spot rate - (strike price + premium) (6.2)
Example 6.4
Let’s see how call options may be used to cover possible exchange losses on import ordersdenominated in foreign currencies. Assume that on February 1 an American firm has pur-chased a mainframe computer from a Swiss firm for SFr625,000; its payment must be madein Swiss francs on June 1. Let us further assume that the premium for a franc call optionwith a strike price of $0.5000 and a June expiration date is 0.03 cents per franc. Becausethere are 62,500 units per franc option, the US firm will need 10 call options to buySFr625,000. The current spot rate for francs is $0.4900; the US company’s bank believesthat the spot rate by June 1 will rise to $0.6000.
There are two alternatives available to the US company: do not hedge, or hedge in theoptions market. If the US company does not want to cover its open position, it would waitfor 4 months, buy francs at the prevailing exchange rate in the spot market, and use thesefrancs to pay for its imports. If the bank’s forecast is accurate, the US company will spend$375,000 to purchase SFr625,000 at the spot rate of $0.6000.
The price of 10 franc call options is $187.50 (0.03 cents ¥ 10 options ¥ 62,500 units percontract). If the US company decides to hedge its position in the options market, on June1 it would exercise its right to buy SFr625,000 for $312,500 ($0.500 ¥ SFr625,000). Con-sequently, the US firm would spend a total of $312,687.50 ($187.50 + $312,500) to pur-chase SFr625,000. By doing so, the American firm would avoid the risk of a $62,312.50loss ($375,000 - $312,687.50). Still, if the future spot rate for francs remains below thestrike price of $0.5000, the US company can let its options expire and buy Swiss francs atthe prevailing spot rate when it must pay for its imports. Here, the US firm would lose itsoption premium of $187.50.

164 CURRENCY FUTURES AND OPTIONS
Example 6.5
Suppose that the call premium per British pound on February 1 is 1.10 cents, the expira-tion date is June, and the strike price is $1.60. Richard Smith anticipates that the spot rateof the pound will increase to $1.70 by May 1. If Mr Smith’s expectation proves correct,what would be his dollar profit from speculating one pound call option (31,250 units percontract) in the call options market?
Richard Smith could make a profit of $2,781.25 by making the following trades:
1 Buy call options on February 1 -$0.0110 per pound2 Exercise the option on May 1 -$1.6000 per pound3 Sell the pound on May 1 +$1.7000 per pound
4 Net profit as of May 1 +$0.0890 per pound5 Net profit per contract: £31,250 ¥ $0.0890 = $2,781.25
Richard’s profit of $0.0890 per pound can also be obtained by equation 6.2:
profit = $1.700 - ($1.6000 + $0.0110) = $0.0890
Richard Smith does not need to exercise his call options in order to make a profit. Currencycall option premiums rise and fall as the exchange rates of their underlying currency riseand fall. If call options become profitable, their premiums will rise. They can be sold, on anexchange, just like any foreign currency itself. So a call option holder such as Mr Smith cansave the expense and bother of taking possession of the currency and selling it.
Global Finance in Action 6.2Options on Economic Data
On October 1, 2002, Goldman Sachs and Deutsche Bank began auctioning optionson economic news releases. The first auction was for options on the September USnonfarm payrolls report, released on October 4, while later contracts would includeUS retail sales, gross domestic product, measures of consumer confidence, inflation,and German data.
The seller of the option is obligated to pay the buyer if the option ends up in themoney – having a positive payout. For regulatory reasons, and to reduce the risk thatoptions sellers might default on their obligations to the buyers, only institutionalinvestors and hedge funds may participate in the auctions, and Goldman Sachs and/orDeutsche Bank will be the official counterparties to the buyers.

THE CURRENCY OPTIONS MARKET 165
GRAPHIC ANALYSIS OF A CALL OPTION PRICE Figure 6.3 shows the typical relationshipbetween the market value of a call option and its intrinsic value. Up to the point at which thestrike price equals the spot rate, the time value increases as the spot rate increases, but the marketvalue exceeds the intrinsic value for all spot rates. Call options have positive values even if theyare out of the money, because they have time value. It is also important to note that the intrin-sic value of a call option becomes zero whenever the strike price exceeds the spot rate. In otherwords, the intrinsic value is zero until the spot rate reaches the strike price, and then rises linearly (one cent for a one-cent increase in the spot rate).
6.2.5 Currency put options
A currency put option is simply a contract that gives the holder the right to sell a foreign cur-rency at a specified price during a prescribed period. People buy currency put options becausethey anticipate that the spot rate of the underlying currency will depreciate.
What economic good do these options on economic statistics provide? They permitcompanies and individuals to hedge risk, to reduce the danger that bad (or good)economic statistics will reduce their profit/wealth. For example, a construction firmmight buy a put option on housing starts to hedge its risk against a slowdown in theindustry. If announced housing starts are less than the strike price of the firm’s putoption, the firm will receive a payment that will make up for the reduced revenuethat accompanies fewer housing starts. Similarly, a cruise line might hedge itselfagainst a downturn in travel by using options on consumer confidence.
These options not only allow firms and individuals to share the risk of uncertaineconomic outcomes, but they also provide publicly available information about thelikelihood of these outcomes. In other words, the options prices could help to fore-cast the distribution of the economic statistics. For example, the difference betweenthe price of call options on September payroll growth with strike prices of 100 and120 might be used to predict how likely it is that employment growth will be between100,000 and 120,000. Because such forecasts are generated by firms “putting theirmoney where their mouth is,” they might be more accurate than free forecasts. Ifthis market succeeds, such implied forecasts might help both private decision-makersand policy-makers. A Goldman Sachs press release reported that the October 1auction implicitly predicted a drop of 38,000 in the September nonfarm payrolls. TheOctober 3 auction predicted a drop of 18,000 jobs. In fact, the actual decline was43,000. Thus, both predictions from the option market bested the consensus fore-cast of +20,000 published on September 30 in The Wall Street Journal. Only timewill tell if such good predictions from the economic derivatives market are the excep-tion or the rule.
Source: C. J. Neely, “Options on Economic Data,” International Economic Trends, Federal ReserveBank of St. Louis, Nov. 2002.

MNCs with open positions in foreign currencies can employ currency put options to coversuch positions. Consider an American company that has sold an airplane to a Japanese firm andhas agreed to receive its payment in Japanese yen. The exporter may be concerned about the pos-sibility that the yen will depreciate by the time it is scheduled to receive its payment from theimporter. To protect itself against such a yen depreciation, the exporter could buy yen put options,which would enable it to sell yen at the specified strike price. In fact, the exporter would lock inthe minimum exchange rate at which it could sell Japanese yen in exchange for US dollars overa specified period of time. On the other hand, if the yen appreciates over this time period, theexporter could let the put options expire and sell the yen at the prevailing spot rate.
Individuals may speculate with currency put options based on their expectations of exchangerate fluctuations for a particular currency. For example, if speculators believe that the Swiss francwill depreciate in the future, they can buy franc put options, which will entitle them to sell francsat the specified strike price. If the franc’s spot rate depreciates as expected, they can buy francsat the spot rate and exercise their put options by selling these francs at the strike price. If a spec-ulator buys and then exercises a put option, his profit (loss) is determined as follows:
profit (loss) = strike price - (spot rate + premium) (6.3)
For example, the profit for the holder of a put option with a strike price of $0.585/SFr, a premiumof $0.005/SFr, and a spot rate of $0.575/SFr is:
profit = $0.585 - ($0.575 + $0.005) = $0.005/SFr
Speculators do not need to exercise their put options in order to make a profit. They could alsomake a profit from selling put options, because put option premiums fall and rise as exchange
166 CURRENCY FUTURES AND OPTIONS
Time value(shaded area)
Market value(solid line)
Intrinsic value(dashed line)
Spotrate
Strike price
"At the money"
"In the money""Out of the money"
Profit (+)or loss (–)
Figure 6.3 The market value of a call option

THE CURRENCY OPTIONS MARKET 167
rates of the underlying currency rise and fall. The seller of put options has the obligation to pur-chase the specified currency at the strike price from the owner who exercises the put option. Ifspeculators anticipate that the currency will appreciate, they might sell their put options. But ifthe currency indeed appreciates over the entire period, the put options will not be exercised. Onthe other hand, if speculators expect that the currency will depreciate, they will keep their putoptions. Then they will sell their put options when the put option premiums go up.
GRAPHIC ANALYSIS OF A PUT OPTION PRICE Figure 6.4 shows the typical relationship betweenthe market value of a put option and its intrinsic value. Up to the point at which the strike priceequals the spot rate, the time value declines as the spot rate increases, but the market value exceedsthe intrinsic value for all spot rates. Put options have positive values even if they are out of themoney, because they have time value. It is also important to note that the intrinsic value of a putoption becomes zero whenever the spot rate exceeds the strike price.
6.2.6 Profit–loss profiles of options
Figure 6.5 presents “profit–loss profiles” that trace the relationship between the exchange rate atexpiration of the contract and the net gain (loss) to the trader.
Assume that the call premium per British pound is $0.04, the strike price is $1.50, and thecontract matures in 2 months. The vertical axes of figures 6.5(a) and 6.5(b) measure profit orloss for the call option trader at different spot rates (horizontal axes) for the pound at the timeof maturity. For the buyer of a call option on the pound, the loss is limited to the price origi-
Time value(shaded area)
Market value(solid line)
Intrinsic value(dashed line)
Spotrate
Strike price
"At the money"
"In the money" "Out of the money"
Profit (+)or loss (–)
Figure 6.4 The market value of a put option

nally paid for the option. The entire price ($0.04) would be lost if the spot rate was $1.50 orless. The call option holder would earn $0.04 at $1.54, but this gain would be offset by the $0.04premium. Thus, this point ($1.54) is called the break-even point. The call option holder wouldrealize a one-to-one gain (unlimited profit) at any spot rate above $1.54.
For the seller of a call option, the gain is limited to the premium originally charged for theoption. The entire premium ($0.04) would be earned if the spot rate was $1.50 or less. The calloption seller would suffer a one-to-one loss at any spot rate above $1.54.
Assume that the put premium per British pound is $0.06, the strike price is $1.50, and thecontract matures in 2 months. Figures 6.5(c) and 6.5(d) show the profit–loss profiles of a putoption trader. The buyer of a put option would obtain a one-to-one gain at any rate below $1.44,but only up to the point at which the profit–loss profile of the put option holder intercepts thevertical axis. The break-even spot rate of $1.44 is the price at which the holder neither gains norloses on exercise of the option: this is the point at which the gain of $0.06 is offset by the premiumof $0.06. The holder would lose money at spot rates above $1.44, but the loss would be limitedto the premium originally paid for the option.
The seller of a put option would suffer a one-to-one loss at any spot rate below $1.44, butonly up to the point at which the profit–loss profile intercepts the vertical axis. For the seller ofa put option, the gain is limited to the premium originally charged for the option. The entirepremium ($0.06) would be earned if the spot rate was $1.50 or higher.
168 CURRENCY FUTURES AND OPTIONS
+$.12
+$.08
+$.04Future spot rate
–$.04
–$.08
–$.12
$1.42 $1.46 $1.50 $1.54 $1.58
(a) Buyer of a pound call
Exercise price = $1.50Premium = $ .04
Net
pro
fit p
er u
nit
+$.12
+$.08
+$.04
Future spot rate–$.04
–$.08
–$.12
$1.42 $1.46 $1.50 $1.54 $1.58
(b) Seller of a pound call
Exercise price = $1.50Premium = $ .04
Net
pro
fit p
er u
nit
+$.12
+$.08
+$.04Future spot rate
–$.04
–$.08
–$.12
$1.42 $1.46 $1.50 $1.54 $1.58
(c) Buyer of a pound put
Exercise price = $1.50Premium = $ .06
Net
pro
fit p
er u
nit
+$.12
+$.08
+$.04
Future spot rate–$.04
–$.08
–$.12
$1.42 $1.46 $1.50 $1.54 $1.58
(d) Seller of a pound put
Exercise price = $1.50Premium = $ .06
Net
pro
fit p
er u
nit
Figure 6.5 Profit–loss profiles for an option holder
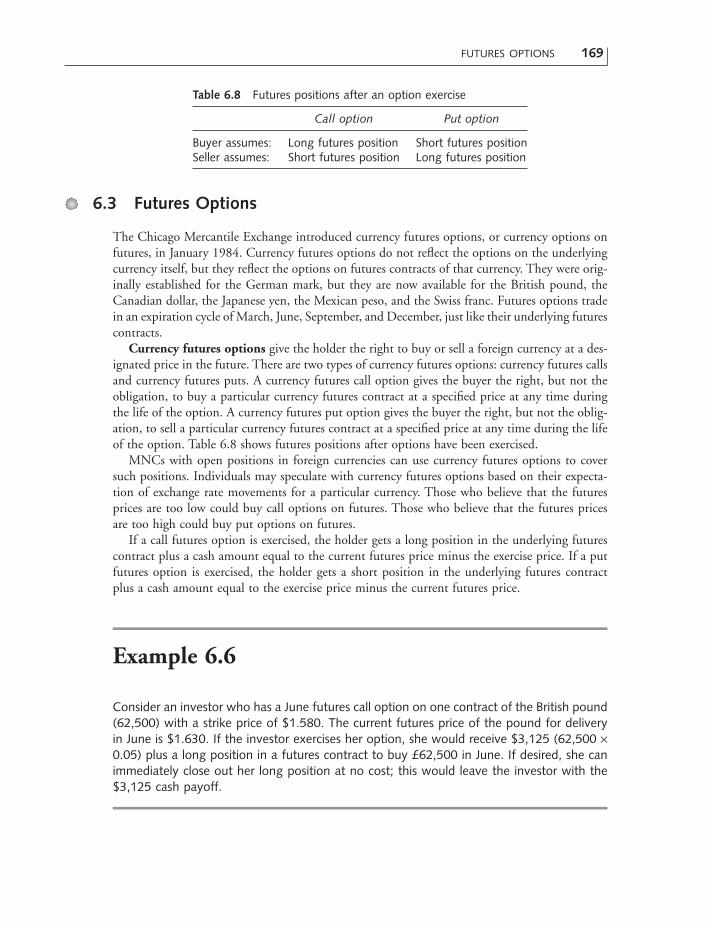
FUTURES OPTIONS 169
6.3 Futures Options
The Chicago Mercantile Exchange introduced currency futures options, or currency options onfutures, in January 1984. Currency futures options do not reflect the options on the underlyingcurrency itself, but they reflect the options on futures contracts of that currency. They were orig-inally established for the German mark, but they are now available for the British pound, theCanadian dollar, the Japanese yen, the Mexican peso, and the Swiss franc. Futures options tradein an expiration cycle of March, June, September, and December, just like their underlying futurescontracts.
Currency futures options give the holder the right to buy or sell a foreign currency at a des-ignated price in the future. There are two types of currency futures options: currency futures callsand currency futures puts. A currency futures call option gives the buyer the right, but not theobligation, to buy a particular currency futures contract at a specified price at any time duringthe life of the option. A currency futures put option gives the buyer the right, but not the oblig-ation, to sell a particular currency futures contract at a specified price at any time during the lifeof the option. Table 6.8 shows futures positions after options have been exercised.
MNCs with open positions in foreign currencies can use currency futures options to coversuch positions. Individuals may speculate with currency futures options based on their expecta-tion of exchange rate movements for a particular currency. Those who believe that the futuresprices are too low could buy call options on futures. Those who believe that the futures pricesare too high could buy put options on futures.
If a call futures option is exercised, the holder gets a long position in the underlying futurescontract plus a cash amount equal to the current futures price minus the exercise price. If a putfutures option is exercised, the holder gets a short position in the underlying futures contractplus a cash amount equal to the exercise price minus the current futures price.
Table 6.8 Futures positions after an option exercise
Call option Put option
Buyer assumes: Long futures position Short futures positionSeller assumes: Short futures position Long futures position
Example 6.6
Consider an investor who has a June futures call option on one contract of the British pound(62,500) with a strike price of $1.580. The current futures price of the pound for deliveryin June is $1.630. If the investor exercises her option, she would receive $3,125 (62,500 ¥0.05) plus a long position in a futures contract to buy £62,500 in June. If desired, she canimmediately close out her long position at no cost; this would leave the investor with the$3,125 cash payoff.

170 CURRENCY FUTURES AND OPTIONS
Example 6.7
Consider an investor who has a June futures put option on one contract of the Swiss franc(125,000) with a strike price of $0.65. The current futures price of the franc for delivery inJune is $0.55. If the investor exercises her option, she receives $12,500 (125,000 ¥ 0.10)plus a short position in a futures contract to sell SFr125,000. If desired, she can immedi-ately close out her short position at no cost; this would leave the investor with the $12,500cash payoff.
SUMMARY
Three major instruments of the foreign-exchange market are currency futures, currency options,and currency futures options. The three types of contracts are similar because they are all used bythose who have specific expectations about future exchange rate movements. Yet they differ because:(1) holders of currency futures must buy or sell the currency on the settlement date; (2) owners ofcurrency options have the right to buy or sell the currency at a specified price; and (3) holders ofcurrency futures options have the right to buy or sell the futures on the currency.
These three types of currency contract are acquired for hedging, speculation, or arbitrage. Theyappeal to individuals and small companies because they offer standard contracts in predeterminedamounts and their purchase prices are small. MNCs with open positions in foreign currencies canuse these three markets to cover such positions as an alternative to the forward market offered bycommercial banks.
The trading of futures and options involves six major classes of risk: credit, market, liquidity,legal, settlement, and operations. Credit risk derives from the extension of credit to counterpartiesthat may be unwilling or unable to fulfill their contractual obligations. Market risk refers to theeffect of changes in the price of the underlying instrument on the value of an open derivative posi-tion. Liquidity risk is the risk that a securities firm or bank is unable to liquidate or offset a posi-tion because of a lack of counterparties in the market. Legal risk arises when contracts areunenforceable or inadequately documented. Settlement risk happens when a counterparty fails toprovide funds or instruments at the agreed time. Operations risk is a loss that results from humanerror or deficiencies in systems or controls.

PROBLEMS 171
Questions
1 What are the major differences between forward and futures contracts?2 What is the most important difference between futures and options contracts?3 What are the major types of margin with respect to a futures contract? What is the role
of a margin requirement?4 How can speculators use currency futures?5 How can US companies use currency futures?6 What are the components of an option premium?7 Why is the price of an option always greater than its intrinsic value?8 Why can’t the intrinsic value of an option be less than zero?9 Assume that a company wants to use either a currency option or a forward contract to
hedge against exchange rate fluctuations. What are the advantages and disadvantagesof currency options in this case?
10 When should a company buy a call option for hedging? When should a company buy aput option?
11 When should speculators buy a call option? When should speculators buy a put option?12 What are currency futures options?13 Why has the number of currency futures contracts tended downward in recent years?
Problems
1 An American company sells yen futures contracts to cover possible exchange losses onits export orders denominated in Japanese yen. The amount of the initial margin is$20,000, and the maintenance margin is 75 percent of the initial margin. The value ofthe company’s position declines by $6,000 because the spot rate for yen has increased.(a) What is the dollar amount of the maintenance margin?(b) Should the broker issue margin calls to the company?(c) What is the amount of additional deposit needed to restore the account to the initial
margin level?2 A speculator enters a futures contract for September delivery (September 19) of £62,500
on February 2. The futures exchange rate is $1.650 per pound. He believes that the spotrate for pounds on September 19 will be $1.700 per pound. The margin requirement is2 percent.(a) If his expectations are correct, what would be his rate of return on the investment?(b) If the spot rate for pounds on September 19 is 5 percent lower than the futures
exchange rate, how much would he lose on the futures speculation?

172 CURRENCY FUTURES AND OPTIONS
(c) If there is a 65 percent chance that the spot rate for pounds will increase to $1.700by September 19, would you speculate in the futures market?
3 On March 20, a Detroit investor decides to invest $1 million in a British 3-month certifi-cate of deposit (CD) with an annual yield of 20 percent. He expects that this 20 percentrate of return on the British CD will be more than he could have realized by investing inthe domestic market. The investor buys British pounds in the spot market and purchasesthe CD from a British bank. The exchange rates are $2.0000 per pound in the spot marketand $2.0050 per pound in the futures market for June delivery (June 20).(a) The investor buys enough British pounds in the futures market to cover the princi-
pal and accrued interest at the time of maturity. Summarize the transaction.(b) By June 20, the British pound has depreciated to $1.8500 per pound. Remember
that the spot rate and the futures rate become the same by the delivery date. OnJune 20, the investor decides to close the position by selling British pounds in thespot market and reversing the futures contracts. Summarize the transaction.
(c) Compare the exchange gain (loss) from the futures transaction with the exchangeloss (gain) from the spot transaction. What is the windfall profit (net exchange gain)?
(d) If the investor had not hedged his investment, how much exchange loss would hehave suffered on the transaction? Remember that the British pound has depreciatedto $1.8500 on June 20.
4 The call premium per British pound on March 1 is $0.04, the expiration date is Septem-ber 19, and the strike price is $1.80. A speculator believes that the spot rate for the poundwill rise to $1.92 by September 19.(a) If the speculator’s expectations are correct, what would be her dollar profit from
speculating two pound call options (£62,500)?(b) If the spot rate were $1.76 per pound when the option expired, would the specu-
lator exercise the options? What would be her loss from this speculation?5 The put premium per British pound on March 1 is $0.04, the settlement date is Sep-
tember 19, and the strike price is $1.80. A speculator anticipates that the spot rate forthe pound will fall to $1.72 by September 19. If the speculator’s expectations are correct,what would be his dollar profit from speculating two put options (£62,500)?
6 A US company has bought 30 personal computers from a British company for £62,500.Its payment must be made in British pounds 90 days from now. The premium for a poundcall option with a strike price of $1.60 and a 90-day expiration date is $0.04 per pound.The current spot rate for pounds is $1.58; the US company expects that the spot rate in90 days will rise to $1.66. The US company has two alternatives: do not hedge and hedgein the options market. Should the US company choose the call option hedge or the nohedge?
7 A US exporter is scheduled to receive SFr125,000 in 60 days. The premium for a francput option with a strike price of $0.50 and a 90-day settlement date is $0.03 per franc.The company anticipates that the spot rate in 90 days will be $0.46. Should the companyhedge its accounts receivable in the options market? If the spot rate were $0.51 in 90days, how would it affect the company’s decision?
8 The exchange rate for Japanese yen is $0.0069 per yen, and a call option has a strikeprice of $0.0065. An investor has two yen call options. If the investor were to exercise

REFERENCES 173
the call options, how much profit would he realize? (Hint: see table 6.5 for the size of acontract for yen call options and ignore option premiums.)
9 The exchange rate for Japanese yen is $0.0069 per yen, and a put option has a strikeprice of $0.0070. An investor has two yen put options. If the holder were to exercise theput option, how much profit would he realize? (Hint: see table 6.5 for the size of a con-tract for yen put options and ignore option premium.)
10 On October 23, the closing exchange rate of British pounds was $1.70. Calls that wouldmature the following January with a strike price of $1.75 were traded at $0.10.(a) Were the call options in the money, at the money, or out of the money?(b) Compute the intrinsic value of the call.(c) If the exchange rate of British pounds rises to $1.90 prior to the January option
expiration date, what is the percentage return on investment for an investor whopurchased a call on October 23?
11 With reference to problem 10, put options with the same strike price and a January matu-rity for British pounds were traded at $0.05 on October 23.(a) Were the put options in the money, at the money, or out of the money?(b) Compute the intrinsic value of the put.(c) If the exchange rate of British pounds falls to $1.65 just prior to expiration, what is
the percentage return on investment for an investor who purchased a put onOctober 23?
REFERENCES
Black, F. and M. Scholes, “The Pricing of Optionsand Corporate Liabilities,” Journal of PoliticalEconomy, May/June 1973, pp. 637–59.
Chicago Board of Trade, Commodity TradingManual, Chicago: Board of Trade of the City ofChicago, 1989.
Chicago Mercantile Exchange, Using CurrencyFutures and Options, 1987.
Giddy, I. H., “Foreign Exchange Options,” Journalof Futures Markets, Summer 1983, pp. 145–65.
Giddy, I. H., “The Foreign Exchange Option as aHedging Tool,” in Joel M. Stern and Donald H.
Chew, eds., New Developments in InternationalFinance, New York: Blackwell, 1988, pp. 83–93.
Hopper, G. P., “A Primer on Currency Derivatives,”Business Review, Federal Reserve Bank of Philadel-phia, May/June 1995, pp. 3–14.
Huckins, N. W. and A. Rai, “Market Risk forForeign Currency Options: Basle’s SimplifiedModel,” Financial Management, Spring 1999, pp. 99–109.
Merton, R., “Theory of Rational Option Pricing,”Bell Journal of Economics and Management Science,Winter 1973, pp. 141–83.

174 CURRENCY FUTURES AND OPTIONS
Case Problem 6: Merck’s Use of CurrencyOptions
The effect of foreign-currency fluctuations on a company depends on a company’s businessstructure, its industry profile, and its competitive environment. This case recounts how Merckassessed its foreign-exchange exposure and decided to hedge those exposures.
The Company
In 2001, Merck celebrated its 110th anniversary in discovering, developing, producing, anddistributing human and animal health pharmaceutical products. Today, the company does busi-ness in more than 100 countries around the world. Thus, it is part of an industry that makesits products available for the prevention, relief, and cure of disease throughout the world.
Approximately 50 percent of worldwide sales for Merck come from foreign operations.International earnings assets for the company account for 40 percent of its total earnings assets.The pharmaceutical industry is highly competitive, with no company holding more than 5percent of the worldwide market. Merck ranks first in pharmaceutical sales in the world, buthas slightly less than 5 percent market share worldwide.
As Merck became increasingly global, it continued to establish and enhance strategicalliances here in the USA and abroad, in order to discover, develop, and market innovativeproducts. Moreover, Merck understands that future competition will be more global in nature.To prepare its managers for this broader challenge, Merck continues to expand the interna-tional nature of its management training. Programs focus increasingly on international issuessuch as foreign-exchange risk management, and training program participants reflect theworldwide nature of the company’s businesses. For example, the senior-level managers whoattended its Executive Development Programs in recent years came from 30 countries.
US pharmaceutical companies have expanded into foreign markets significantly more thanhave their counterparts in other industries, because they have to fund high risk and growingresearch expenditures. These companies also differ in their method of doing business overseas.Although many US exporters bill their customers in US dollars, most pharmaceutical compa-nies bill their customers in local currencies. Consequently, the impact of exchange rate volatil-ity tends to be more immediate and direct.
Foreign subsidiaries of pharmaceutical companies are typically importers of product at somestage of production. And these subsidiaries are responsible for completing, marketing, and dis-tributing the product within the country of incorporation. Sales are denominated in local cur-rency, but costs are denominated in a combination of local currency and the parent-countrycurrency.
The Identification and Measurement of Exchange Exposure
Every company faces exposure to foreign-exchange risk as soon as it chooses to maintain a physical presence in a foreign country. Foreign-exchange fluctuations can affect a US

CASE PROBLEM 6 175
multinational company in three ways. First, the dollar value of net assets held in foreign cur-rencies may be changed. This type of exposure is called translation or accounting exposure; itmeasures the effect of an exchange rate change on published financial statements of a firm.Second, the expected results of outstanding transactions, such as accounts receivable and/oraccounts payable, may be changed. This sort of exposure is known as transaction exposure; itmeasures the effect of an exchange rate change on outstanding obligations that existed beforeexchange rates changed but were settled after the exchange rate change. The third type ofexposure is referred to as economic exposure; it involves the potential effects of exchange ratechanges on all facets of a firm’s operations: product market, factor market, and capital market.Economic exposure consists of future revenue exposure and competitive exposure. Futurerevenue exposure is the possibility that the dollar value of future revenues expected to beearned overseas in foreign currencies may be changed. Competitive exposure is the possibil-ity that a company’s competitive position may be changed – for example, a competitor whosecosts are denominated in a weak currency will have greater pricing flexibility and thus a poten-tial competitive advantage.
Competitive exposure has been the subject of recent academic study on exchange risk man-agement. Such exposures are best exemplified by the adverse effect of the strong dollar onthe competitive position of US industry in the early 1980s. This was true not only in exportmarkets but also in the US domestic market, where the strengthening US dollar gave Japan-ese and European-based manufacturers a large competitive advantage in dollar terms overdomestic US producers.
With its significant presence worldwide, Merck has exposures in approximately 40 curren-cies. As a first step in assessing the effect of exchange rate movements on revenues and netincome, Merck constructed a sales index that measures the relative strength of the dollaragainst a basket of currencies, weighted by the size of sales in those countries. The companyused 1978 as the base year of its sales index. When the index is above 100 percent, foreigncurrencies have strengthened against the dollar, thereby indicating a positive exchange effecton dollar revenues (exchange gains). When the index is below 100 percent, the dollar hasstrengthened against the foreign currencies, thereby resulting in a negative exchange impacton dollar revenues (exchange losses). Merck evaluated its sales index from 1972 to 1988 andfound that it had significant exchange exposure of its net overseas revenues.
Given the significant exchange exposure of its overseas revenues, Merck then decided toreview its global allocation of resources across currencies; the main purpose of this review wasto determine the extent to which revenues and costs were matched in individual currencies.The review revealed that the distribution of the company’s assets differs somewhat from thesales mix, primarily because of the concentration of research, manufacturing, and headquar-ters operations in the USA.
Hedging Exposures with Financial Instruments
Having concluded that a diversified strategy (resource deployment) was not an appropriateway for Merck to address exchange risk, it considered the alternative of financial hedging.Thinking through this alternative involved the following five steps: (1) projecting exchange ratevolatility; (2) assessing the impact of the 5-year strategic plan; (3) deciding on hedging the

176 CURRENCY FUTURES AND OPTIONS
exposure; (4) selecting the appropriate financial instruments; and (5) constructing a hedgingprogram. Based on this five-step process, Merck decided to choose currency options as its riskmanagement tool.
Identifying a company’s exchange risk and deciding what action should be taken requireextensive analysis. Merck management felt that, as a result of this analysis of its currency expo-sures, it had developed an appropriate financial hedging plan – one that insures against poten-tially damaging effects of currency volatility on the company’s strategic plan.
Apparently, this hedging strategy has worked well for Merck since 1989 (Schlesinger 2000).Because Merck does about half its business overseas, the dollar surge in the 1980s “really puta crimp in the performance of the company” as the dollar value of foreign revenue fell, recallsChief Financial Officer Judy Lewent. In response, the company was repeatedly forced intosudden cutbacks in planned research and development spending and capital investments.Beginning in 1989, Merck started hedging against foreign-exchange movements, a practicehoned throughout the decade. Thus, even as the dollar surged against the euro last year, MsLewent says, “we were able to go through the year and continue our budget commitmentsto our operating people.”
Case Questions
1 Why do you think Merck did not neutralize the impact of unexpected exchange ratechanges on its future revenues through a diversification strategy?
2 Describe each of the five steps in Merck’s foreign-exchange risk management process: theexchange forecasts, the impact of the strategic plan, the hedging rationale, the financialinstruments, and the hedging program.
3 Why did Merck select “options” as its major hedging instrument?4 The website of the Chicago Mercantile Exchange, www.cme.com, and the website of the
Philadelphia Stock Exchange, www.phlx.com/, show a variety of information about cur-rency futures and options. Use these websites to depict the prices of British pound futuresand options.
Sources: J. C. Lewent and A. John Kearney, “Identifying, Measuring, and Hedging Currency Risk at Merck,”Journal of Applied Corporate Finance, Winter 1990, pp. 19–28; and J. M. Schlesinger, “Why the Long Boom?It Owes a Big Debt to the Capital Markets,” The Wall Street Journal, Feb. 1, 2000, pp. A1, A6.

Opening Case 7: Why have Gillette and GE Chosen a Higher Costof Funding?
Gillette did a strange thing in January 1999. To finance its European operations, itraised money through a Eurobond deal denominated in euros, even though it wouldhave been cheaper to issue in US dollars and then swap the proceeds to euros.Gillette’s decision not to execute the currency swap on the 5-year deal cost thecompany about 10 basis points or €300,000 per year. In fact, Gillette was not theonly US borrower to forfeit a lower cost of funding. General Electric issued €250million in Eurobonds rather than offering bonds in dollars and then swapping for euros.Lynn Seymour, Gillette’s controller, explains that currency swaps have formed an inte-gral part of the company’s borrowing strategy in the past. “We have borrowed in USdollars, swapped to floating, foreign-denominated debt, like deutsche marks, becauseit was cheaper,” she said. However, under the new accounting rules, this procedurebecomes more troublesome.
Gillette’s action exemplifies the fact that companies will frequently choose a costlier option to avoid government regulations. When the Financial Accounting Standards Board (FASB) issued its FASB 133 in 1998, some US companies, such asGillette Corp., decided to undertake the costlier transaction rather than face problemsunder FASB 133. The FASB 133 standard requires companies to report the fair marketvalue of their derivatives in their balance sheets and to include derivatives gains andlosses in their income statements. Business executives argue that such accountingtreatments of derivatives will distort their company earnings.
According to Ira Kawaller of Kawaller & Associates, a New York management con-sulting firm, currency swaps and interest rate swaps must be marked to market as the
CHAPTER 7
Financial Swaps

A swap is an agreement between two parties, called counterparties, that exchange sets of cashflows over a period of time in the future. When exchange rates and interest rates fluctuate, risksof forward market and money market positions are so great that the forward market and themoney market may not function properly. Currency futures and options are inflexible and avail-able only for selected currencies. In such cases, multinational companies (MNCs) and govern-ments may use swap arrangements to protect the value of export sales, import orders, andoutstanding loans denominated in foreign currencies.
Financial swaps are now used by MNCs, commercial banks, world organizations, and sover-eign governments to minimize currency and interest rate risks. These swaps compete with otherexchange risk management tools, such as currency forwards, futures, and options, but they alsocomplement these other instruments.
This chapter consists of three major sections. The first section describes the emergence of theswap market. The second section discusses two major types of financial swap – interest rate swapsand currency swaps. The third section evaluates motivations for swaps.
178 FINANCIAL SWAPS
present value of cash flows and recorded in current income, subjecting the companyto earnings volatility. “This is going to be a big problem for multinational companies,”he noted. Bob Sullivan, managing partner of PricewaterhouseCoopers, agreed: “Forthe top Fortune 100 companies, this is a major issue,” adding that, as far as debtmarkets are concerned, this is the “biggest topic” raised by FASB 133. Although it istoo early to tell exactly how the FASB will interpret the new rules, it is already clearthat FASB 133 is a major headache for American issuers in international debt markets.Thus some companies, such as Gillette and General Electric, would rather pay greaterfunding costs than face balance-sheet and income volatilities.
In developing the standard, the FASB reached six decisions that became the cornerstones of FASB 133. First, derivative instruments represent rights or obligationsthat meet the definitions of assets or liabilities. Second, fair value is the only relevantmeasure for derivative instruments. Third, only items that are assets or liabilities shouldbe reported as such on the balance sheet. Fourth, therefore, all derivatives are reportedat fair value on the balance sheet. Fifth, special hedge accounting is appropriate forderivatives designed and effective in offsetting changes in fair values or cash flowsfor the risk being hedged. Six, changes in fair value for derivatives not designated andqualifying as hedges are currently recorded in earnings. FASB 133 permits an entityto use the fair-value accounting model and the cash flow hedge accounting model.Under these two accounting models, the entity must recognize gains or losses onderivative hedging instruments as earnings.
Sources: Simon Boughey, “US Issuers in Euromarket are Snakebit by FAS 133,” Investment DealersDigest, Feb. 22, 1999, p. 13; and Arjen Ronner and Mark Blok, “Hedging Foreign Currency Expo-sure: Consequences of FAS 133,” Journal of Applied Finance, Vol. 11, No. 1, 2001, pp. 25–34.

7.1 The Emergence of the Swap Market
The origins of the swap market can be traced back to the late 1970s, when currency traders devel-oped currency swaps to evade British controls on the movement of foreign currency. The markethas grown rapidly since then. In this section, we consider the origins of the swap market, draw-backs of parallel and back-to-back loans, and the growth of the swap market.
7.1.1 The origins of the swap market
Financial swaps are usually regarded as an outgrowth of parallel and back-to-back loans. Thesework similarly except in one respect; parallel loans involve four firms, while back-to-back loansinvolve only two firms. These two instruments attained prominence in the 1970s, when theBritish government imposed taxes on foreign-currency transactions to prevent capital outflows.The parallel loan became a widely accepted vehicle by which these taxes could be avoided. Theback-to-back loan was a simple modification of the parallel loan, and the currency swap was anatural extension of the back-to-back loan.
PARALLEL LOANS A loan that involves an exchange of currencies between four parties, with apromise to re-exchange the currencies at a predetermined exchange rate on a specified future date,is referred to as a parallel loan. Typically, though not always, the parties consist of two pairs ofaffiliated companies. Parallel loans are commonly arranged by two multinational parent compa-nies in two different countries.
The structure of a typical parallel loan is illustrated in figure 7.1. Assume that: (1) a parentcorporation (IBM) in the United States with a subsidiary in Australia wants to obtain a 1-yearAustralian dollar loan and (2) a parent corporation (WMC: Western Mining Company) in Australia with a subsidiary in the USA wishes to obtain a 1-year US dollar loan. In other words,each parent wants to lend to its subsidiary in the subsidiary’s currency. These loans can bearranged without using the foreign-exchange market. IBM lends the agreed amount in US dollars
THE EMERGENCE OF THE SWAP MARKET 179
USA
IBM WMC
Australia
Direct loan inAustralian dollars
IBM'sAustralian subsidiary
WMC'sUS subsidiary
Direct loanin US dollars
Indirect
Indirect
Financing
Financing
Figure 7.1 The structure of a parallel loan

to the American subsidiary of WMC. In return for this loan, WMC lends the same amount ofmoney in Australian dollars to the Australian subsidiary of IBM. Parallel loan agreements involvethe same loan amount and the same loan maturity. Of course, each loan is repaid in the sub-sidiary’s currency. The parallel loan arrangement avoids foreign-exchange risk because each loanis made and repaid in one currency.
BACK-TO-BACK LOANS A loan that involves an exchange of currencies between two parties,with a promise to re-exchange the currencies at a specified exchange rate on a specified futuredate, is referred to as a back-to-back loan and it involves two companies domiciled in two dif-ferent countries. For example, AT&T agrees to borrow funds in the USA and then to lend thoseborrowed funds to Toyota in Japan, which, in return, borrows funds in Japan and then lendsthose funds to AT&T in the USA. By this simple arrangement, each firm has access to the capitalmarkets in the foreign country without any actual cross-border flows of capital. Consequently,both companies avoid exchange rate risk in a back-to-back loan.
7.1.2 Drawbacks of parallel and back-to-back loans
While parallel and back-to-back loans offer definite benefits to participating companies, threeproblems limit their usefulness as financing tools. First, it is difficult to find counterparties withmatching needs. Second, one party is still obligated to comply with such an agreement even if another party fails to do so. Third, such loans customarily show up on the books of the participating parties.
Currency swaps can overcome these problems fully or partly, and this explains their rapidgrowth. First, a company in one country with a use for this type of financing must find anothercompany in another country with matching needs; that is, mirror-image financing requirements.These requirements include currencies, principals, types of interest payments, the frequency ofinterest payments, and the length of the loan period. Search costs for finding such a companymay be considerable, if it is possible. Currency swaps largely resolve the problem of matchingneeds because they are arranged by specialized swap dealers and brokers who recruit prospectivecounterparties.
Second, parallel and back-to-back loans are actually two loans with two separate agreements,which exist independently of each other. If the first company defaults on its obligations to thesecond company, the second company is not legally relieved of its obligations to the first company.To avoid this problem, a separate agreement, defining the right of offset, must be drafted. If thisagreement is not registered, the situation and outcome described above may still arise. On theother hand, registration itself may cause problems. With currency swaps, however, the right ofoffset is usually embodied in the agreement.
Third, parallel and back-to-back loans are carried on the books of the participating parties.In other words, the exchange of principals under these two instruments involves net increases inboth assets and liabilities; these amounts are customarily recorded in full on the counterparties’books. With currency swaps, however, the principal amounts usually do not show up on the par-ticipants’ books. Many commercial banks prefer currency swaps to parallel and back-to-back loansto keep the transactions off their books. These off-book transactions of currency swaps and otherderivatives may enable banks to avoid increases in their capital requirements under applicableregulations. However, such off-book transactions may be disallowed in the near future, as
180 FINANCIAL SWAPS
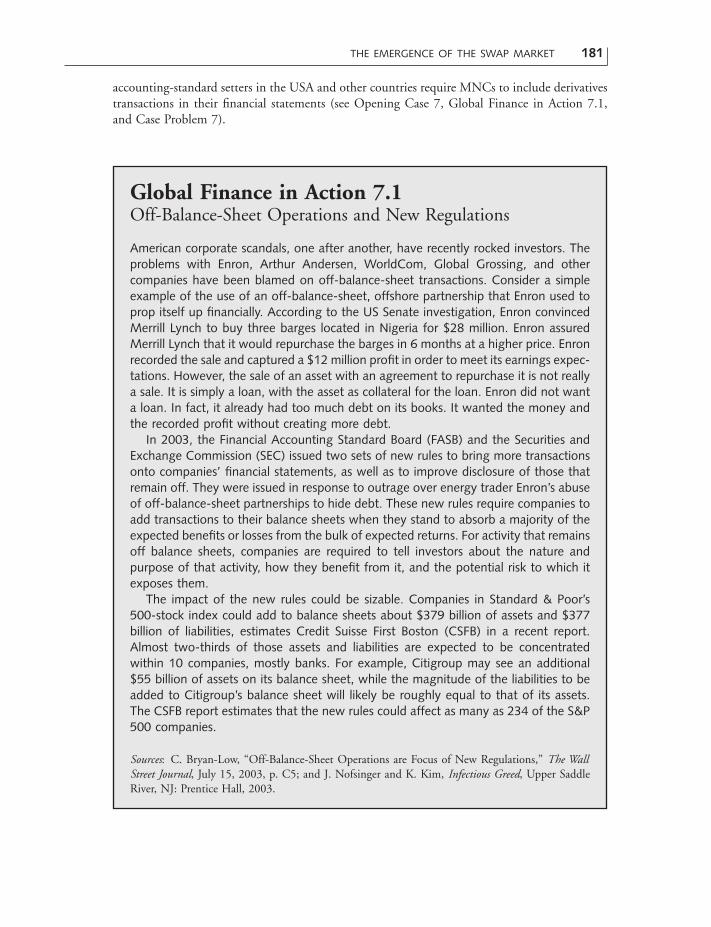
accounting-standard setters in the USA and other countries require MNCs to include derivativestransactions in their financial statements (see Opening Case 7, Global Finance in Action 7.1,and Case Problem 7).
THE EMERGENCE OF THE SWAP MARKET 181
Global Finance in Action 7.1Off-Balance-Sheet Operations and New Regulations
American corporate scandals, one after another, have recently rocked investors. Theproblems with Enron, Arthur Andersen, WorldCom, Global Grossing, and other companies have been blamed on off-balance-sheet transactions. Consider a simpleexample of the use of an off-balance-sheet, offshore partnership that Enron used toprop itself up financially. According to the US Senate investigation, Enron convincedMerrill Lynch to buy three barges located in Nigeria for $28 million. Enron assuredMerrill Lynch that it would repurchase the barges in 6 months at a higher price. Enronrecorded the sale and captured a $12 million profit in order to meet its earnings expec-tations. However, the sale of an asset with an agreement to repurchase it is not reallya sale. It is simply a loan, with the asset as collateral for the loan. Enron did not wanta loan. In fact, it already had too much debt on its books. It wanted the money andthe recorded profit without creating more debt.
In 2003, the Financial Accounting Standard Board (FASB) and the Securities andExchange Commission (SEC) issued two sets of new rules to bring more transactionsonto companies’ financial statements, as well as to improve disclosure of those thatremain off. They were issued in response to outrage over energy trader Enron’s abuseof off-balance-sheet partnerships to hide debt. These new rules require companies toadd transactions to their balance sheets when they stand to absorb a majority of theexpected benefits or losses from the bulk of expected returns. For activity that remainsoff balance sheets, companies are required to tell investors about the nature andpurpose of that activity, how they benefit from it, and the potential risk to which itexposes them.
The impact of the new rules could be sizable. Companies in Standard & Poor’s500-stock index could add to balance sheets about $379 billion of assets and $377billion of liabilities, estimates Credit Suisse First Boston (CSFB) in a recent report.Almost two-thirds of those assets and liabilities are expected to be concentratedwithin 10 companies, mostly banks. For example, Citigroup may see an additional$55 billion of assets on its balance sheet, while the magnitude of the liabilities to beadded to Citigroup’s balance sheet will likely be roughly equal to that of its assets.The CSFB report estimates that the new rules could affect as many as 234 of the S&P500 companies.
Sources: C. Bryan-Low, “Off-Balance-Sheet Operations are Focus of New Regulations,” The WallStreet Journal, July 15, 2003, p. C5; and J. Nofsinger and K. Kim, Infectious Greed, Upper SaddleRiver, NJ: Prentice Hall, 2003.

7.1.3 The growth of the swap market
Salomon Brothers arranged the first currency swap in August 1981, with the World Bank and IBMas counterparties. The World Bank wanted to obtain Swiss francs and German marks to financeits operations in Switzerland and West Germany without having to tap the capital markets of thesetwo countries directly. On the other hand, IBM, which had previously acquired fixed-rate oblig-ations in francs and marks, obtained an unrealized capital gain in terms of dollars when the dollarappreciated. Because IBM’s management believed that the dollar’s appreciation would not con-tinue, it wanted to realize the capital gain and remove itself from its mark–franc exposure.
It was a short step from currency swaps to interest rate swaps. If swaps could be used to convertone type of currency obligation to another at the applicable interest rate on each currency, asimilar type of contract could be used to convert one type of borrowing (fixed rate) to another(floating rate). The first interest rate swap was put together in London in 1981, and their usespread to the USA the next year. The swap concept was extended in 1986 when the Chase Manhattan Bank introduced the commodity swap. In 1989, Bankers Trust introduced the firstreported equity swap.
Equity swaps are the newest type of swap and are a subset of a new class of instruments knownas synthetic equity. Equity swaps generally function as an asset swap that converts the interestflows on a bond portfolio into cash flows linked to a stock index. The stock indexes that havebeen used include the Standard & Poor’s (S&P) 500, the Tokyo Stock Price Index and Nikkei225 (Japan), The Chambre des Agents de Change 240 (France), the Financial Times StockExchange 100 (United Kingdom), and the Toronto Stock Exchange 300 (Canada).
Table 7.1 shows the amount of outstanding swaps at year-end from 1987 to 2002. By theend of 2002, the total swap market had reached approximately $73 trillion, with about 93 percent
182 FINANCIAL SWAPS
Table 7.1 The value of outstanding swaps (billions of US dollars)
Year Interest rate swaps Currency swaps Total swaps
1987 683 183 8661988 1,010 317 1,3271989 1,539 435 1,9741990 2,311 578 2,8891991 3,065 807 3,8721992 3,851 860 4,7111993 6,178 900 7,0781994 8,816 915 9,7311995 12,811 1,197 14,0081996 19,170 1,600 20,7701997 22,291 1,823 24,1141998 36,262 2,253 38,5151999 38,372 2,444 40,8162000 47,995 2,605 50,6002001 57,220 4,302 61,5222002 68,274 4,560 72,834
Source: The International Monetary Fund, International FinancialMarkets, various issues.

PLAIN VANILLA SWAPS 183
of the swaps being interest rate swaps and the remaining 7 percent being currency swaps. USdollars account for about 30 percent of these swaps, while the Japanese yen, the euro, the Britishpound, and the Swiss franc account for most of the remaining 70 percent. The value of out-standing swaps increased over 84 times between 1987 and 2002.
7.2 Plain Vanilla Swaps
The basic form of a swap – the simplest kind – is called a plain vanilla swap. Although many variants of the plain vanilla swap exist, all swaps have the same basic structure. Two counterparties agree to make payments to each other on the basis of some quantity of underly-ing assets. These payments include interest payments, commissions, and other service payments.The swap agreement contains a specification of the assets to be exchanged, the rate of interestapplicable to each, the timetable by which the payments are to be made, and other provisions.The two parties may or may not exchange the underlying assets, which are called notional prin-cipals, in order to distinguish them from physical exchanges in the cash markets. In the sectionsthat follow, we discuss the two forms of a plain vanilla swap: interest rate swaps and currencyswaps.
7.2.1 Swap banks
It is difficult and time-consuming for two end users to arrange a swap directly. A more efficientstructure for them is to obtain a financial intermediary that serves as counterparty to both endusers. This counterparty is called a swap bank. A swap bank is a generic term used to describea financial institution that assists in the completion of a swap. The swap bank profits from thebid–ask spread it imposes on the swap coupon.
The swap bank serves as either a broker or a dealer. A swap broker is a swap bank that actsstrictly as an agent without taking any financial position in the swap transaction. In other words,the swap broker matches counterparties but does not assume any risk of the swap. The brokerreceives a commission for this service. A swap dealer is a swap bank that actually transacts forits own account to help complete the swap. In this capacity, the swap dealer assumes a positionin the swap and thus assumes certain risks.
7.2.2 Interest rate swaps
An interest rate swap is a swap in which counterparties exchange cash flows of a floating rate for cash flows of a fixed rate, or exchange cash flows of a fixed rate for cash flows of a float-ing rate. No notional principal changes hands, but it is a reference amount against which theinterest is calculated. Maturities range from under 1 year to over 15 years, but most transactionsfall within a 2-year to 10-year period. While swaps are inherently international in nature, inter-est rate swaps can be purely domestic. However, when they are arranged in the Eurocurrencymarket, interest rate swaps have counterparties from different countries or foreign arrangingbanks.

In a typical interest rate swap, one company has an initial position in a fixed-rate debt instru-ment, while another company has an initial position in a floating-rate obligation. In this initialposition, the company with the floating-rate obligation is exposed to changes in interest rates.By swapping this floating-rate obligation with the fixed-rate obligation, this company eliminatesexposure to changing interest rates.
Borrowers may want to arrange an interest rate swap for a number of reasons. First, changes in financial markets may cause interest rates to change. Second, borrowers may have different credit ratings in different countries. Third, some borrowers have different pre-ferences for debt service payment schedule. Because market imperfections exist in different international financial markets with diversified borrowers and lenders, the objectives of interest rate swaps can be achieved easily and readily. Interest rate swaps are normally arrangedby an international bank that serves as a swap broker or a swap dealer. Through interest rate swaps, borrowers obtain a lower cost of debt service payments and lenders obtain profit guarantees.
184 FINANCIAL SWAPS
Example 7.1
Assume that a swap agreement covers a 5-year period and involves annual interest pay-ments on a $10 million principal amount. Party A agrees to pay a fixed rate of 7 percentto party B. In return, party B agrees to pay a floating rate of LIBOR + 3 percent to party A.LIBOR stands for the London Interbank Offered Rate.
Figure 7.2 shows the basic features of this transaction. Party A pays 7 percent intereston $10 million or $700,000 each year to party B. Party B makes an interest payment on$10 million each year to party A in return, but the actual amount of the interest paymentsdepends on the prevailing LIBOR.
If the LIBOR is 5 percent at the time of the first payment, party B will have to pay$800,000 to party A. Party A still owes $700,000 to party B, because its interest is fixed at7 percent on a $10 million loan. If these mutual interest obligations offset each other, partyB owes only $100,000 to party A. Typically, only payment of the net amount, the differ-ence between the two interest obligations, actually takes place. This practice avoids unnec-essary payments.
Party A Party B
Fixed: 7%
Floating: LIBOR + 3%
Swap dealer
Figure 7.2 An interest rate swap

PLAIN VANILLA SWAPS 185
7.2.3 Currency swaps
A currency swap is a swap in which one party provides a certain principal in one currency toits counterparty in exchange for an equivalent amount in a different currency. For example, aBritish company may be anxious to swap British pounds for US dollars. Similarly, a US companymay be willing to exchange US dollars for British pounds. Given these needs, the two compa-nies may engage in a currency swap.
Currency swaps achieve an economic purpose similar to that of parallel loans. However, currency swaps have effectively displaced parallel loans, because companies seeking parallel loans have difficulty matching needs, have no right of offset, and must place such loans on thecounterparties’ books.
A typical currency swap involves three sets of cash flows. First, at the initiation of the swap,the two parties actually exchange the currencies in which the principals are denominated. Thisdiffers from the interest rate swap, in which both parties may deal in the same currency and canpay the net interest amount. Second, the parties make periodic interest payments to each otherduring the life of the swap agreement. Third, at the termination of the swap, the parties againexchange the currencies in which the principals are denominated.
Example 7.2
Assume that the current spot rate for British pounds is £0.5 per dollar ($2 per pound), theUS interest rate is 10 percent, and the British interest rate is 8 percent. BT (British Telecom-munications) wishes to exchange £5 million for dollars. In return for these pounds, GMwould pay $10 million to BT at the initiation of the swap. The term of the swap is 5 years,and the two firms will make annual interest payments.
With the interest rates given above, GM will pay 8 percent on the £5 million it received;so the annual payment from GM to BT will be £400,000. BT received $10 million and willpay interest at 10 percent; so BP will pay $1 million each year to GM. In actual practice,the counterparties will make only net payments. For example, if the spot rate for poundschanges to £0.45 per dollar at year 1, one pound is worth $2.22. Valuating the interestobligations in dollars at this exchange rate, BT owes $1 million and GM owes $888,000(£400,000 ¥ $2.22). Hence, BT will pay the $112,000 difference. At other times, theexchange rate could be different, thereby making the net payment reflect the differentexchange rate.
At the end of 5 years, the two counterparties again exchange principal. In this example,BT would pay $10 million and GM would pay £5 million. This final payment terminates thecurrency swap. Figure 7.3(a) shows the initial exchange of principal; figure 7.3(b) repre-sents the annual interest payment; and figure 7.3(c) shows the second exchange of princi-pal that completes the swap.

7.2.4 Swaptions, caps, floors, and collars
In this section, we consider several related instruments before we complete our survey of finan-cial swaps. These instruments are swaptions, caps, floors, and collars.
A swaption is an option to enter into a plain vanilla interest rate swap. A call swaption givesthe holder the right to receive fixed-interest payments. A put swaption gives the holder the rightto make fixed-interest payments. Call swaptions are attractive when interest rates are expected tofall. Put swaptions are attractive when interest rates are expected to rise. Banks and investmentfirms usually act as dealers rather than as brokers. In other words, these banks and investmentfirms stand ready to enter into swaptions on either the buying or selling side.
Swaptions are an alternative to caps, floors, and collars, all of which are traded by the same bank personnel who trade swaptions. An interest rate cap sets a maximum rate on floating-rate interest payments; an interest rate floor sets a minimum rate on floating-rate interest payments; and an interest rate collar combines a cap with a floor. A buyer of one of these instruments pays to the seller a one-time premium, which is a small percentage of the notional principal. The buyer of a cap receives a cash payment from the seller when the floating reference rate for the cap is higher than the cap’s strike rate when the two rates arematched against each other on a given date. The buyer of a floor receives a cash payment fromthe seller when the floating reference rate for the floor is lower on a given date than the floor’sstrike rate.
186 FINANCIAL SWAPS
BT GM
£5 million
$10 million
Swap dealer
(a) Initial cash flow
BT GM
£400,000
$1 million
Swap dealer
(b) Annual interest payment
BT GM
£5 million
$10 million
Swap dealer
(c) Repayment of principal
Figure 7.3 A currency swap

7.3 Motivations for Swaps
There are three basic motivations for swaps. First, companies use swaps to provide protectionagainst future changes in exchange rates. Second, companies use swaps to eliminate interest raterisks arising from normal commercial operations. Third, companies use swaps to reduce financ-ing costs.
7.3.1 Currency risk management
Companies use currency swaps to eliminate currency risks arising from overseas commercial oper-ations. A currency swap can take many forms. One type of currency swap accommodates twocompanies that have long-term needs in two different currencies. Assume the following twothings: first, a US firm, hired to build several power plants in Canada, expects to receive paymentin Canadian dollars in 3 years; and, second, a Canadian firm has bought machinery from theUSA and will make payment in US dollars in 3 years. These two companies could arrange a cur-rency swap that allows for an exchange of Canadian dollars for US dollars in 3 years at a prede-termined exchange rate. In this way, the US firm could lock in the number of US dollars it willreceive in exchange for the Canadian dollar payment in 3 years. By the same token, the Cana-dian firm could lock in the number of Canadian dollars it will receive in exchange for the USdollar payment in 3 years.
7.3.2 Commercial needs
Consider a typical mortgage company that accepts deposits and lends these funds for long-termmortgages. Deposit rates must adjust to changing interest rates because depositors can withdrawtheir funds on short notice. Most mortgagors, on the other hand, wish to borrow at a fixed ratefor a long time. This may leave a mortgage company with floating-rate liabilities and fixed-rateassets, thereby making it vulnerable to rising rates. If interest rates rise, the mortgage companywill be forced to increase the rate it pays on deposits, but it cannot increase the interest rate itcharges on mortgages that have already been issued. To avoid this interest rate risk, the mortgagecompany might use interest rate swaps to transform its fixed-rate assets into floating-rate assets,or transform its floating-rate liabilities into fixed-rate liabilities.
MOTIVATIONS FOR SWAPS 187
Example 7.3
Let’s extend example 7.1 to make the discussions on motivations for swaps concrete. Amortgage company (party A) has just lent $10 million for 5 years at 7 percent with annualpayments, and it pays a deposit rate that equals LIBOR + 1 percent. With these rates, thecompany would lose money if the LIBOR were to exceed 6 percent. This vulnerability mightprompt the mortgage company to consider an interest rate swap. In other words, in

In example 7.3, the mortgage company now has a fixed-rate inflow of 2 percent, and it has succeeded in escaping its exposure to interest rate risk. No matter what happens to the level of interest rates, the company will enjoy a net cash flow of 2 percent on $10 million. This example clarifies why a company has a strong motivation to enter the swap market. The mort-gage company faces exposure to changing interest rates because of the very nature of the mort-gage industry. However, the company secures a fixed-rate position by engaging in an interest rateswap.
7.3.3 Comparative advantage
In many instances, one company may borrow money at a lower rate of interest in the capitalmarket than another firm. For example, a US company (GM) may borrow money at a favorablerate in the USA, but it might not have favorable access to the capital market in the UK.
188 FINANCIAL SWAPS
exchange for the fixed-rate mortgages that it holds, the company might want to pay a fixedrate of interest and receive a floating rate of interest.
Figure 7.4 shows example 7.1 (figure 7.2) with additional information about the mort-gage company (party A). The company receives payments at a fixed rate of 7 percent onthe mortgage. After it enters the swap, the company also pays 7 percent on a notional prin-cipal of $10 million to party B. In effect, it receives mortgage payments and passes themthrough to party B under the swap agreement. In return, party A receives a floating rate ofLIBOR + 3 percent from party B. From this cash flow, the company pays its depositors LIBOR+ 1 percent and thus this leaves a periodic inflow of 2 percent to the company.
Party A Party B
Fixed: 7%
Fixed: 7%
Floating: LIBOR + 3%
Floating: LIBOR + 1%
Swap dealer
Depositors
Mortgagor
Figure 7.4 Motivation for the interest rate swap

Similarly, a British company (BT) may have good borrowing opportunities domestically, but pooropportunities in the USA.
These comparative advantages usually exist because of market imperfections or differences in risk. US banks may not have the same information as British banks have, or they may evaluate information differently. Tax considerations or some kind of government-sanctioned discrimination might cause foreign borrowers to be treated differently from domestic bor-rowers. Borrowers’ risks might also vary from country to country, so that domestic firms might be considered to be less risky than foreign firms. Companies can frequently use swaps not only to save money but also to diversify their funding sources (see Global Finance in Action 7.2).
MOTIVATIONS FOR SWAPS 189
Example 7.4
In example 7.2, we assumed that two companies (GM and BT) faced the same rate for eachcurrency. Let’s now assume that BT has access to pounds at a rate of 7 percent, while GMmust pay 8 percent to borrow pounds. On the other hand, GM can borrow dollars at 9percent, while BT must pay 10 percent for its dollar borrowings. As a result, BT enjoys acomparative advantage in borrowing pounds and GM has a comparative advantage in bor-rowing dollars. These rate differentials raise the possibility that each firm can exploit its com-parative advantage and share the gains by reducing overall borrowing costs. This possibilityis shown in figures 7.5(a)–(c), which resemble figures 7.3(a)–(c).
In figure 7.5(a), BT borrows £5 million from a British lender at 7 percent, while GMborrows $10 million from a US lender at 9 percent. After these borrowings, both compa-nies have the funds to engage in a currency swap that we have already analyzed in example7.2. To initiate the swap, BT forwards the £5 million it has just borrowed to GM, which reciprocates with the $10 million it has borrowed. In effect, the two companies have madeindependent borrowings and then exchanged the proceeds.
Figure 7.5(b) shows that the swap terms are identical with these two loan terms. BT paysinterest payments of 9 percent ($900,000) on the $10 million it received from GM, and GMpays interest payments at 7 percent (£350,000) on the £5 million it received from BT. Notethat these rates are the same ones that the two firms must pay their lenders. Now we canclearly see how the swap benefits both parties. Had each party borrowed the other cur-rency on its own, BT would have paid a full 10 percent and GM would have paid a full 8percent. By using the swap, both parties achieve an effective borrowing rate that is 1 percentlower than they could have obtained by borrowing the currency that they needed directly.By engaging in the swap, both firms use the comparative advantage of the other to reduceborrowing costs. Figure 7.5(c) shows the termination of cash flows for the swap when bothparties repay the principal.

BT GM
£5 million
$10 million
Swap dealer
£5 million $10 million
LenderLender
(a) Initial cash flows with lenders
BT GM
£350,000
$900,000
Swap dealer
£350,000 $900,000
LenderLender
(b) Interest payments with lenders
BT GM
£5 million
$10 million
Swap dealer
£5 million $10 million
LenderLender
(c) Repayment of principal with lenders
Figure 7.5 Motivation for the currency swap

SUMMARY 191
Global Finance in Action 7.2Companies Use Swaps to Save Money and Diversify their Funding Sources
The European Investment Bank (EIB) and the Tennessee Valley Authority (TVA)entered into a back-to-back swap deal that gave both cheaper funding than theycould have entered through conventional bond issue. Lehman Brothers, which wasthe co-bookrunner for both deals, said that in addition to saving money, both organizations diversified their funding sources. Some 65 percent of the TVA bondwas placed in Europe, 20 percent in Asia, and 15 percent in the USA. About half ofthe EIB issue was placed in the USA, 35 percent in Europe, and 15 percent in Asia
Are derivatives safe? Clearly, companies can misuse derivative instruments.However, used properly, they can be remarkably effective. Proper risk managementinvolves a three-stage process: (1) identify where the risks lie; (2) design an appro-priate strategy for managing them; and (3) select the right tools to execute the strat-egy. Professor Merton Miller, a Nobel Prize winner in economics, is a firm advocateof derivatives. “Contrary to the widely held perception, derivatives have made theworld a safer place,” Miller argues. Pointing to statistics that show that volatility islower now than it was in many previous decades, he says, “They have made it possible for firms and institutions to deal efficiently and cost-effectively with risks andhazards that have plagued them for decades.” One point he makes is that the world’sbanks have thrown away vastly more money in bad real estate deals than they willever lose on intelligently managed derivatives portfolios.
Source: D. A. Ball, W. H. McCulloch, J. M. Geringer, P. L. Frantz, and M. S. Minor, InternationalBusiness, Boston, MA: McGraw-Hill/Irwin, 2004, pp. 636–737.
SUMMARY
The swap market has emerged largely because financial swaps escape many of the limitations inher-ent in currency futures and options markets. First, because swaps are custom tailored to the needsof two parties, swap agreements are more likely to meet the specific needs of the counterpartiesthan currency futures and options. Second, major financial institutions are readily identifiable onfutures and options exchanges, but only the counterparties know that the swap takes place. Hence,the swap market affords a privacy that cannot be obtained in foreign-exchange trading. Finally, cur-rency futures and options trading are subject to considerable government regulation, but the swapmarket has virtually no government regulation.
Nevertheless, financial swaps have limitations of their own. First, to have a swap transaction,one potential counterparty must find another counterparty that is willing to take the opposite sideof the transaction. Second, a swap agreement cannot be altered without the agreement of bothparties, because the swap agreement is a contract between two counterparties. Third, the exchangeseffectively guarantee currency futures and options contracts for all parties, but the swap market hasno such guarantor.

192 FINANCIAL SWAPS
Questions
1 Why have currency swaps replaced parallel loans?2 Explain both interest rate swaps and currency swaps. Which instrument has a greater
credit risk: an interest rate swap or a currency swap?3 How can a typical mortgage company use an interest rate swap to escape the interest
rate risk?4 How can multinational companies utilize a currency swap to reduce borrowing costs?5 If you expect short-term interest rates to rise more than the yield curve should suggest,
would you rather pay a fixed long-term rate and receive a floating short-term rate, orreceive a fixed long-term rate and pay a floating short-term rate?
6 What is the role of the notional principal in understanding swap transactions? Why is thisprincipal amount regarded as only notional?
7 Comment on the following statement: “If one party benefits from a swap, the other partymust lose.”
8 What are call swaptions and put swaptions? Compare a call swaption with an interestrate cap.
9 Describe an interest rate collar. How will it be used?10 What are advantages of financial swaps over currency futures and options?11 What are major limitations of financial swaps?
Problems
1 A swap agreement covers a 5-year period and involves annual interest payments on a $1million principal amount. Party A agrees to pay a fixed rate of 12 percent to party B. Inreturn, party B agrees to pay a floating rate of LIBOR + 3 percent to party A. The LIBORis 10 percent at the time of the first payment. What is the difference (the net payment)between the two interest obligations?
2 Assume that the current spot rate for the Polish zloty is 2.5 zlotys per dollar ($0.40 per zloty),the US interest rate is 10 percent, and the Polish interest rate is 8 percent. Party C wishes toexchange 25 million zlotys for dollars. In return for these zlotys, party D would pay $10million to party C at the initiation of the swap. The term of the swap is 5 years and the twofirms will make annual interest payments. The spot rate for the zloty changes to 2.2222 zlotysper dollar or $0.45 per zloty at year 1. What is the net payment for year 1?
3 A mortgage company (party E) has just lent $1 million for 5 years at 12 percent withannual payments, and it pays a deposit rate that equals LIBOR + 1 percent. With theserates, the company would lose money if the LIBOR exceeds 11 percent. This vulnerabil-
CASE PROBLEM 7 193
ity prompts the mortgage company to enter an interest rate swap with party F. This swapagreement covers a 5-year period and involves annual interest payments on a $1 millionprincipal amount. Party E agrees to pay a fixed rate of 12 percent to Party F. In return,party F agrees to pay a floating rate of LIBOR + 3 percent to party E. Determine an annualnet cash flow available for the mortgage company.
4 The current spot rate for the Polish zloty is 2.5 zlotys per dollar or $0.40 per zloty. PartyG has access to zlotys at a rate of 7 percent, while party H must pay 8 percent to borrowzlotys. On the other hand, party H can borrow dollars at 9 percent, while party G mustpay 10 percent for its dollar borrowings. Party G wishes to obtain $10 million in exchangefor 25 million zlotys, while party H wants to obtain 25 million zlotys in exchange for $10million. How can these two parties achieve a lower borrowing rate?
REFERENCES
Abken, P. A., “Beyond Plain Vanilla: A Taxonomyof Swaps,” Economic Review, Federal ReserveBank of Atlanta, Mar./Apr. 1991, pp. 12–29.
Ball, D. A., W. H. McCulloch, J. M. Geringer, P. L.Frantz, and M. S. Minor, International Business,Boston, MA: McGraw-Hill/Irwin, 2004, ch. 19.
Einzig, R. and B. Lange, “Swaps at Transamerica:Analysis and Applications,” Journal of Applied Corporate Finance, Winter 1990, pp.59–71.
Feinberg, P., “Swaps, Caps and Collars ProtectCompanies from Interest Rate Swings,” CashFlow, Aug. 1988, pp. 54–5.
Marks, R. D. and L. A. Herald, “An Interest-RateGame Plan,” Financial Executive, Nov./Dec.1992, pp. 39–42.
Nofsinger, J. and K. Kim, Infectious Greed, UpperSaddle River, NJ: Prentice Hall, 2003.
Orlando, D. K., “Swaptions Offer New Keys toBetter Protection,” Corporate Cash Flows, July1990, pp. 33–6.
Picker, I., “Son of Swaps,” Institutional Investor, Feb.1991, pp. 83–8.
Ronner, A. and M. Blok, “Hedging Foreign Currency Exposure: Consequences of FAS 133,”Journal of Applied Finance, Vol. 11, No. 1, 2001,pp. 25–34.
Case Problem 7: Regulations of DerivativesMarkets
Financial derivatives – forwards, futures, options, and swaps – are contracts whose values arelinked to or derived from values of underlying assets, such as securities, commodities, and cur-rencies. There are two types of markets for financial derivatives: organized exchanges andover-the-counter (OTC) markets. Organized exchanges such as the Chicago MercantileExchange are regulated by governments, while OTC markets such as banks are unregulated.Derivatives are used by corporations, banks, and investors to reduce a variety of risks, suchas exposure to currency movements (hedging), or to make leveraged bets on the market direc-tion of these instruments (speculation).

194 FINANCIAL SWAPS
Derivatives markets have shown extraordinary growth over the past few years. For example,the size of the global OTC derivatives markets increased from $21 trillion of contracts in 1992to $130 trillion of contracts in 2002 (see figure 7.6); the amount of outstanding exchange-traded derivatives exceeded $20 trillion in 2002. In addition, recent years have witnessednumerous accounts of derivative-related losses on the part of established and reputable firms.Large losses associated with the use of derivatives include the US oil subsidiary of Metallge-sellschaft ($1 billion), Daiwa Bank of Japan ($1 billion), Kashima Oil of Japan ($1.5 billion),Showa Shell of Japan ($1.5 billion), Sumitomo Corp. of Japan ($1.8 billion), Orange County,California ($1.7 billion), Barings of the UK ($1.3 billion), Long-Term Capital Management ofthe USA ($3 billion), and Allied Irish Bank of the USA/UK ($691 million). All these derivative-related losses have occurred since 1994. The recent rapid growth of derivatives markets andlarge derivative-related losses have triggered concern and even alarm over the dangers posedby the widespread use of derivatives.
On February 27, 1995, speculative trading by a 28-year-old trader contributed to bringingdown Barings PLC, the oldest merchant bank in the UK. In the days that followed, investiga-tors found that the bank’s total losses from 1992 to 1995 exceeded $1 billion, a sum largerthan its entire $860 million in equity capital. Barings had hired the British trader Nicholas Leesonfrom Bankers Trust in 1992 to build global fixed-income securities in Singapore. The cause ofthese losses was a breakdown in Barings’ risk management system that allowed Leeson toaccumulate and conceal an unhedged $27 billion position in various exchange-traded futuresand options contracts.
$ trillions
140
120
100
80
60
40
20
01992 1994 1996 1998 2000 2002
Year
Figure 7.6 The size of the over-the-counter derivatives marketSource: Authors’ graphic based on data from several issues of The Wall Street Journal.

CASE PROBLEM 7 195
What lessons do these losses and growth hold for policy-makers? Do they indicate the needfor more strict government supervision of derivatives markets or for new laws and regulationsto limit the use of these instruments? Apparently, US regulatory authorities think that deriva-tives pose inherent dangers. In the first half of 1997, Congress had introduced some half-dozenbills designed to ban or limit derivatives. In January 1997, the Securities and Exchange Com-mission (SEC) adopted a regulation requiring companies to present estimates of losses theycould suffer from financial instruments. The Financial Accounting Standard Board (FASB)adopted its Statement 133, Accounting for Derivative Instruments and Hedging Activities, in1998. FASB 133 requires companies to report the fair market value of their derivatives on theirbalance sheets and to include some derivatives gains or losses on their income statements. Thelegal status of derivatives was further cast into doubt in 1998, when the Commodity FuturesTrading Commission (CFTC) suggested that it had the right to regulate trading in these instru-ments under the Commodity Futures Trading Commission Act of 1974. Especially big targetsof these reforms are privately negotiated contracts through OTC markets.
Since 1997, several hundred letters from big companies, accountants, and even FederalReserve Chairman Alan Greenspan have laid out the potential damage of these derivatives reg-ulations. In February 2000, a White House panel on OTC derivatives urged Congress to exemptthe $80 trillion derivatives market from government regulation. Nevertheless, standard-settersaround the world – the USA, the UK, Canada, other industrial countries, and the InternationalAccounting Standards Committee – have recently proposed and/or issued their standards toincrease disclosure of off-balance-sheet derivatives transactions.
Case Questions
1 What are the major classes of risk in derivatives trading?2 What is the potential damage of government derivative rules on derivatives users?3 Had there been any warning signs that should have alerted the management of Barings to
problems with its Singapore futures subsidiary?4 What lessons for the management of financial institutions to be learned from the failure
of Barings?5 The website of the Securities and Exchange Commission (SEC), www.sec.gov, and the
website of the Financial Accounting Standards Board (FASB), www.fasb.org, describe stan-dard practices for financial reporting by companies in the USA. Access the above websitesto learn proposed accounting standards and the status regarding reactions to these proposed standards.
Sources: R. Kolb, Futures, Options, and Swaps, 3rd edn, Malden, MA: Blackwell, 2000, pp. 779–83; S. McGeeand E. MacDonald, “Pre-emptive Strike by Derivatives Players,” The Wall Street Journal, Feb. 21, 1997, pp.C1, C13; A. Kuprianov, “Derivatives Debacles: Case Studies of Large Losses in Derivatives Markets,” EconomicQuarterly, Federal Reserve Bank of Richmond, Fall 1995, pp. 1–39.

Opening Case 8: Mundell Wins Nobel Prize in Economics
One major finding by Robert A. Mundell, who won the Nobel Prize in economics in1999, has become conventional wisdom: when money can move freely across borders,policy-makers must choose between exchange rate stability and an independent mon-etary policy. They cannot have both. Professor Mundell remains a fan of the goldstandard and fixed exchange rates at a time when they are out of favor with mosteconomists. “You have fixed rates between New York and California, and it worksperfectly,” he has said. This statement implies that if the US dollar works well for 50US states, a common currency such as the euro should also work well for its memberstates, the eurozone countries.
The Nobel committee praised Mundell’s research into common-currency zones forlaying the intellectual foundation for the 11-country euro. In 1961, when Europeancountries were still faithful to national currencies, he described circumstances in whichnations could share a common currency. Mundell’s Nobel Prize in economics hasrenewed the focus on the fixed exchange rate system. First, economists and policy-makers failed to forecast recent currency crises in Asia, Europe, Latin America, andRussia. Second, advocates of flexible exchange rates had argued that under the float-ing-rate system, exchange rates would be stable, trade imbalances would fall, andcountries would not need reserves, but none of these predictions proved to be true.
“The benefits of the euro will derive from the transparency of pricing, stability ofexpectations, lower transaction costs, and a common monetary policy run by the bestminds that Europe can muster,” Mundell wrote in 1998. The stability of expectationsunder a single currency would reduce exchange rate uncertainty, prevent speculativeattacks, and eliminate competitive devaluations. The benefits of switching to a single
CHAPTER 8
Exchange Rate Forecasting

Because future exchange rates are uncertain, participants in international markets never knowwith certainty what the spot rate will be in 2 months or in 1 year. Thus, currency forecasts area necessity. In other words, the quality of a company’s decisions depends on the accuracy ofexchange rate projections. If investors forecast future spot rates more accurately than the rest ofthe market, they have an opportunity to realize large monetary gains.
This chapter covers four related topics: (1) measuring a change in exchange rates; (2) fore-casting the needs of a multinational company (MNC); (3) forecasting floating exchange rates;and (4) forecasting fixed exchange rates. Floating exchange rates are rates of foreign exchangedetermined by the market forces of supply and demand, without government intervention onhow much rates can fluctuate. Fixed exchange rates are exchange rates which do not change, orthey fluctuate within a predetermined band.
8.1 Measuring Exchange Rate Changes
An exchange rate is the price of one currency expressed in terms of another currency. As eco-nomic conditions change, exchange rates may become substantially volatile. A decrease in a cur-rency’s value relative to another currency is known as depreciation, or devaluation. Likewise, anincrease in a currency’s value is known as appreciation, or revaluation. MNCs frequently measurea percentage change in the exchange rate between two specific points in time; that is, the currentexchange rate and the forecasted exchange rate 1 year ahead.
When the exchange rates from two specific points in time are compared, the beginningexchange rate is denoted as e0 and the ending exchange rate is denoted as e1. The percentage
MEASURING EXCHANGE RATE CHANGES 197
currency come with costs, however. Probably the biggest cost is that each countryrelinquishes its right to set monetary policy to respond to domestic economic prob-lems. In addition, exchange rates between countries can no longer adjust in responseto regional problems. Still, economists and policy-makers believe that the benefits ofthe euro far exceed its costs.
Mundell believes that the euro will eventually challenge the dollar for global domi-nance. He said in 1998: “The creation of the euro will set new precedents. For thefirst time in history, an important group of independent countries have voluntarilyagreed to relinquish their national currencies, pool their monetary sovereignties, andcreate a supercurrency of continental dimensions. The euro will create an alternativeto the dollar in its role as unit of account, reserve currency, and intervention currency.”As a result, he regards the introduction of the euro as the most important event inthe history of the international monetary system since the dollar took over from thepound the role of dominant currency during World War I.
Sources: G. Eudey, “Why is Europe Forming a Monetary Union?” Business Review, Federal ReserveBank of Philadelphia, Dec. 1998, p. 21; R. Mundell, “The Case for the Euro,” The Wall Street Journal,Mar. 25, 1998; and M. M. Phillips, “Mundell Wins Nobel Prize in Economics,” The Wall StreetJournal, Oct. 14, 1999, pp. A2, A8.

change in the value of a foreign currency relative to the home currency is computed as follows:
(8.1)
Alternatively, the percentage change in the value of a domestic currency is computed as follows:
(8.2)
A positive percentage change represents a currency appreciation, while a negative percentagechange represents a currency depreciation.
percentage change =-( )e ee
0 1
1
percentage change =-( )e ee
1 0
0
198 EXCHANGE RATE FORECASTING
Example 8.1
Assume that the exchange rate for the Swiss franc changed from $0.64 on January 1 to$0.68 on December 31. In this case, the percentage change in the exchange rate for thefranc against the dollar can be expressed in two different ways, but they have the samemeaning. From a franc perspective, we can say that the franc’s value against the dollarappreciated from $0.64 to $0.68. From a dollar perspective, we can say that the dollar’svalue against the franc depreciated from $0.64 to $0.68.
The percentage change in the spot rate for the franc (a foreign currency) can be com-puted by using equation 8.1:
Alternatively, the percentage change in the spot rate for the dollar (a domestic currency)against the foreign currency can be computed by using equation 8.2:
Thus, a change in the exchange rate from $0.64 to $0.68 is equivalent to a franc appreci-ation of 6.25 percent or a dollar depreciation of 5.88 percent. It is important to note thatthe two exchange rate changes are not equal to each other. The amount of franc appreci-ation is not equal to the amount of dollar depreciation, because the value of one currencyis the inverse of the value of the other currency. In other words, the percentage change inthe exchange rate differs because the base rate from which it is measured differs.
percentage change = - = -$ . $ .$ .
.0 64 0 68
0 680 0588
percentage change = - = -$ . $ .$ .
.0 68 0 64
0 640 0625

8.2 The Forecasting Needs of the Multinational Company
Virtually all aspects of multinational operations may be influenced by changes in exchange rates.Thus, an MNC needs foreign-exchange forecasts for many of its corporate functions, althoughfuture foreign-exchange rates are not easy to forecast (see Global Finance in Action 8.1).
THE FORECASTING NEEDS OF THE MULTINATIONAL COMPANY 199
Global Finance in Action 8.1Tracking the US Dollar
The dollar goes up, the dollar goes down. Recently, it has been down. From January2, 2002, to March 7, 2003, the dollar fell 20 percent against the euro, 10 percentagainst the British pound, and 13 percent against the Japanese yen. Historically, suchfluctuations are not unusual, though they are seldom easy to explain.
Ask an economist to describe the reasons for the greenback’s recent decline, andthe reply will include a furrowed brow. Few subjects are as complicated or con-founding to us as the foreign-currency exchange rate market – the deepest, mostliquid, and one of the least regulated markets in the world.
Each day, more than $1 trillion in currency trades in the foreign-exchange market.Many participants and factors affect the value of one currency versus another. Themarket consists of a worldwide cast of businesses, investors, speculators, govern-ments, and central banks, acting and reacting on the basis of a mix of forces such astrade patterns, interest rate differentials, capital flows, and international relations.
As the dollar has recently undergone its worst slide against European currenciessince 1987, the overarching reason can be attributed to a reduced demand to placeinvestment funds in the USA, a situation quite different from that of the late 1990s.Between 1995 and 2000, the attractiveness of US capital markets resulted in the dollarrising 20 percent against other major currencies. Recently, with the decline in the USstock market as well as lower interest rates on US government securities, outsideinvestors have turned skittish. Other confidence crushers include the corporateaccounting scandal of 2002 and rising tensions with Iraq and North Korea.
A weakened dollar, despite the negative connotation, does carry certain benefits.Although American travelers and businesses are not able to stretch their money asfar on foreign soil, the opposite is also true: foreign consumers are able to purchasemore US goods with their beefed-up currency. Such behavior, in theory, could helpreduce the US trade deficit, which swelled to a record $44.2 billion in December 2002.
If the dollar’s recent decline can be attributed to the slowdown in the US economy,along with corporate governance and geopolitical uncertainties, then recent weak-ness in the dollar is not a matter for serious concern. As the economy rebounds, wewould expect foreign investment to make a comeback, and the dollar with it. So,remember: the dollar goes up, the dollar goes down. These are normal fluctuationsin a well-functioning and vigorously competitive market.
Source: William Poole, “Tracking the US Dollar,” A Quarterly Review of Business and Economic Conditions, Apr. 2003, p. 3.

8.2.1 The hedging decision
MNCs have a variety of foreign currency denominated payables and receivables: credit purchasesand credit sales whose prices are stated in foreign currencies, borrowed and loaned funds denom-inated in foreign currencies, and uncovered forward contracts. These payables and receivables areexposed to foreign-exchange risks due to unexpected changes in the future exchange rate. Acompany’s decision to hedge against these potential losses may be determined by its forecasts offoreign-currency values.
8.2.2 Working capital management
Working capital management consists of short-term financing and short-term investment deci-sions. The value of the currency borrowed or invested will change with respect to the borrower’sor the investor’s local currency over time. The actual cost of a foreign bank credit to the bor-rower depends on the interest rate charged by the bank and the movement in the borrowed cur-rency’s value over the life of the loan. Likewise, the actual rate of return on a short-term foreigninvestment consists of the rate of return on the investment in a local currency and the amountof the change in the local currency value.
When MNCs borrow money, they have access to a number of different currencies. As a result,they would wish to borrow money in a currency whose rate of interest is low and whose valuewill depreciate over the life of the loan. MNCs sometimes have a substantial amount of excessfunds available for a short-term investment. Large short-term investments may be made in anumber of different currencies. The ideal currency for such an investment should have a highinterest rate and should appreciate in value over the investment period.
8.2.3 Long-term investment analysis
The evaluation of foreign direct and portfolio investments requires exchange rate forecasts wellinto the future. An important feature of foreign investment analysis is the fact that project cashinflows available to the investor depend partially on future exchange rates. There are several waysin which exchange rates can influence the estimated cash inflows. The key point here, however,is that accurate forecasts of future exchange rates will improve the estimates of the cash inflowsand thus improve a company’s decision-making process.
Some institutions, such as pension funds and insurance companies, invest a substantial portionof their money in foreign stocks and bonds. As with short-term investors, portfolio investors wishto invest in a currency that would have a high rate of return and would appreciate in value overthe investment period.
8.2.4 The long-term financing decision
When MNCs issue bonds to obtain long-term funds, they can denominate their bonds in foreigncurrencies. Like short-term financing, companies would prefer to denominate the bonds in a cur-
200 EXCHANGE RATE FORECASTING

rency that would depreciate in value over the life of the bond. To estimate the cost of issuingbonds, companies will have to forecast exchange rates.
8.2.5 Other uses
There are additional situations that require companies to use exchange rate forecasts. First, com-panies need exchange rate forecasts to assess foreign subsidiary earnings. Most MNCs are requiredto consolidate the earnings of subsidiaries into those of the parent if the parent owns more thana certain percentage of the subsidiary’s voting shares. In other words, when an MNC reports itsearnings, it has to consolidate and translate subsidiary earnings into the parent currency. Fore-casts of exchange rates, therefore, play an important role in the overall estimate of a company’sconsolidated earnings.
Second, if a company wishes to buy or sell a product in a foreign currency, it has to forecastthe effective exchange rate at the time of transaction. Third, if a company wants to remit itsforeign profits to the parent country at some point in the future, it has to forecast the effectiveexchange rate at the time of remittance.
8.3 Forecasting Floating Exchange Rates
This section opens by first questioning the validity of generating exchange rate forecasts. Thisquestion is based on the assumption that market exchange rates reflect all currently availableinformation, thereby making it futile to attempt forecasting exchange rates.
8.3.1 Currency forecasting and market efficiency
Banks and independent consultants offer many currency-forecasting services. Some MNCs havein-house forecasting capabilities. Yet, no one should pay for currency-forecasting services ifforeign-exchange markets are perfectly efficient. The efficient market hypothesis holds that: (1)spot rates reflect all current information and adjust quickly to new information; (2) it is impos-sible for any market analyst to consistently “beat the market”; and (3) all currencies are fairlypriced.
Foreign-exchange markets are efficient if the following conditions hold: First, there are manywell-informed investors with ample funds for arbitrage opportunities when opportunities presentthemselves. Second, there are no barriers to the movement of funds from one country to another.Third, transaction costs are negligible. Under these three conditions, exchange rates reflect allavailable information. Thus, exchange rate changes at a given time must be due to new infor-mation alone. Because information that is useful for currency forecasting tends to arrive ran-domly, exchange rate changes follow a random walk. In other words, no one can consistentlybeat the market if foreign-exchange markets are efficient. Because all currencies are fairly pricedin efficient exchange markets, there are no undervalued currencies and therefore no investors canearn unusually large profits in foreign-exchange markets.
Financial theorists define three forms of market efficiency: (1) weak-form efficiency, (2) semi-strong-form efficiency, and (3) strong-form efficiency. Weak-form efficiency implies that all
FORECASTING FLOATING EXCHANGE RATES 201

information contained in past exchange rate movements is fully reflected in current exchangerates. Hence, information about recent trends in a currency’s price would not be useful for fore-casting exchange rate movements. Semistrong-form efficiency suggests that current exchangerates reflect all publicly available information, thereby making such information useless for fore-casting exchange rate movements. Strong-form efficiency indicates that current exchange ratesreflect all pertinent information, whether publicly available or privately held. If this form is valid,then even insiders would find it impossible to earn abnormal returns in the exchange market.
Efficiency studies of foreign-exchange markets using statistical tests, various currencies, anddifferent time periods have not provided clear-cut support of the efficient market hypothesis.Nevertheless, all careful studies have concluded that the weak form of the efficient market hypoth-esis is essentially correct. Empirical tests have also shown that the evidence of the semistrong-form efficiency is mixed. Finally, almost no one believes that strong-form efficiency is valid.
Dufey and Giddy (1978) suggested that currency forecasting can only be consistently usefulor profitable if the forecaster meets one of the following four criteria:
1 The forecaster has exclusive use of a superior forecasting model.2 The forecaster has consistent access to information before other investors.3 The forecaster exploits small but temporary deviations from equilibrium.4 The forecaster predicts the nature of government intervention in the foreign-exchange
market.
Three methods – fundamental analysis, technical analysis, and market-based forecasts – arewidely used to forecast exchange rates. Fundamental analysis relies heavily on economic models.Technical analysis bases predictions solely on historical price information. Market-based forecastsdepend on a number of relationships that are presumed to exist between exchange rates and interest rates.
8.3.2 Fundamental analysis
Fundamental analysis is a currency forecasting technique that uses fundamental relationshipsbetween economic variables and exchange rates. The economic variables used in fundamentalanalysis include inflation rates, national income growth, changes in money supply, and othermacroeconomic variables. Because fundamental analysis has become more sophisticated in recentyears, it now depends on computer-based econometric models to forecast exchange rates. Modelbuilders believe that changes in certain economic indicators may trigger changes in exchangerates in a similar way to changes that occurred in the past.
THE THEORY OF PURCHASING POWER PARITY The simplest form of fundamental analysis usesthe theory of purchasing power parity (PPP). In chapter 5, we learned that the PPP doctrinerelates equilibrium changes in the exchange rate to changes in the ratio of domestic and foreignprices:
(8.3)e eI
It
dt
ft
= ¥+( )+( )
01
1
202 EXCHANGE RATE FORECASTING

where et is the dollar price of one unit of foreign currency in period t, e0 is the dollar price ofone unit of foreign currency in period 0, Id is the domestic inflation rate, and If is the foreigninflation rate.
FORECASTING FLOATING EXCHANGE RATES 203
Example 8.2
The spot rate is $0.73 per Australian dollar. The USA will have an inflation rate of 3 percentper year for the next 2 years, while Australia will have an inflation rate of 5 percent peryear over the same period. What will the US dollar price of the Australian dollar be in 2years?
Using equation 8.3, the US dollar price of the Australian dollar in 2 years can be com-puted as follows:
Thus, the expected spot rate for the Australian dollar in 2 years is $0.7025.
e2
2
20 73
1 0 031 0 05
0 7025= ¥ ++
=$ .( . )( . )
$ .
MULTIPLE REGRESSION ANALYSIS A more sophisticated approach for forecasting exchange ratescalls for the use of multiple regression analysis. A multiple regression forecasting model is asystematic effort at uncovering functional relationships between a set of independent (macro-economic) variables and a dependent variable – namely, the exchange rate.
US MNCs frequently forecast the percentage change in a foreign currency with respect to theUS dollar during the coming months or years. Consider that a US company’s forecast for thepercentage change in the British pound (PP) depends on only three variables: inflation rate dif-ferentials, US inflation minus British inflation (I); differentials in the rate of growth in moneysupply, the growth rate in US money supply minus the growth rate in British money supply (M);and differentials in national income growth rates, US income growth rates minus British incomegrowth rates (N):
(8.4)
where b0, b1, b2, and b3 are regression coefficients, and m is an error term.
PP b b I b M b N= + + + +0 1 2 3 m

8.3.3 Technical analysis
Technical analysis is a currency forecasting technique that uses historical prices or trends. Thismethod has been applied to commodity and stock markets for many years, but its applicationto the foreign-exchange market is a recent phenomenon. Yet technical analysis of foreign-exchange rates has attracted a growing audience. This method focuses exclusively on past pricesand volume movements, rather than on economic and political factors. Success depends onwhether technical analysts can discover forecastable price trends. However, price trends will beforecastable only if price patterns repeat themselves.
Charting and mechanical rules are the two primary methods of technical analysis. These twotypes of technical analysis examine all sorts of charts and graphs to identify recurring price pat-terns. Foreign-exchange traders will buy or sell certain currencies if their prices deviate from pastpatterns. Trend analysts seek to find price trends through mathematical models, so that they candecide whether particular price trends will continue or shift direction.
204 EXCHANGE RATE FORECASTING
Example 8.3
Assume the following values: b0 = 0.001, b1 = 0.5, b2 = 0.8, b3 = 1, I = 2 percent (the infla-tion rate differential during the most recent quarter), M = 3 percent (the differential in therate of growth in money supply during the most recent quarter), and N = 4 percent (thedifferential in national income growth rates during the most recent quarter).
The percentage change in the British pound during the next quarter is
Given the current figures for inflation rates, money supply, and income growth rates, thepound should appreciate by 7.5 percent during the next quarter. The regression coefficientsof b0 = 0.001, b1 = 0.5, b2 = 0.8, and b3 = 1 can be interpreted as follows. The constantvalue, 0.001, indicates that the pound will appreciate by 0.1 percent when the United Statesand the United Kingdom have the same inflation rate, the same growth rate in moneysupply, and the same growth rate in national income. If there are no differentials in thesethree variables, I, M, and N are equal to zero. The value of 0.5 means that each 1 percentchange in the inflation differential would cause the pound to change by 0.5 percent in thesame direction, other variables (N and M) being held constant. The value of 0.8 implies thatthe pound changes by 0.8 percent for each 1 percent change in the money supply differ-ential, other variables (I and N) being held constant. The value of 1 indicates that the poundis expected to change by 1 percent for every 1 percent change in the income differential,other variables (I and M) being held constant.
PP = + + += + + +=
0 001 0 5 2 0 8 3 1 4
0 1 1 2 4 4
7 5
. . ( %) . ( %) ( %)
. % % . % %
. %.

CHARTING To identify trends through the use of charts, practitioners must first find “peaks”and “troughs” in the price series. A peak is the highest value of the exchange rate within a spec-ified period of time, while a trough is the lowest price of the exchange rate within the sameperiod. As shown in figure 8.1, a trendline is drawn by connecting two local troughs based ondata of the dollar–mark rate (Neely 1997). Although figure 8.1 does not show it, another trend-line may be drawn by connecting two local peaks. After these two trendlines have been estab-lished, foreign-exchange traders buy a currency if an uptrend is signaled and sell the currency ifa downtrend seems likely.
MECHANICAL RULES Chartists admit that their subjective system requires them to use judg-ment and skill in finding and interpreting patterns. A class of mechanical rules avoids this sub-jectivity. These rules impose consistency and discipline on technical analysts by requiring themto use rules based on mathematical functions of present and past exchange rates.
Filter rules and moving averages are the most commonly used mechanical rules. Figure 8.1illustrates some of the buy-and-sell signals generated by a filter rule with a filter size of 0.5 percent.Local peaks are called resistance levels, and local troughs are called support levels. This filter rulesuggests that investors buy a currency when it rises more than a given percentage above its recentlowest value (the support level) and sell the currency when it falls more than a given percentagebelow its highest recent value (the resistance level).
Figure 8.2 illustrates the behavior of a 5-day and a 20-day moving average of the dollar–markrate from February 1992 to June 1992. A typical moving average rule suggests that investors buya currency when a short-moving average crosses a long-moving average from below; that is, whenthe exchange rate is rising relatively fast. This same rule suggests that investors sell the currencywhen a short-moving average crosses a long-moving average from above; that is, when theexchange rate is falling relatively fast.
FORECASTING FLOATING EXCHANGE RATES 205
$ per DM
0.72
0.70
0.68
0.66
0.64
0.62
0.60May June July Aug. Sept.
1992
Resistance level
Sell signal from a0.5% filter rule
Local troughs
Local peakTrendline
Buy signal from a 0.5% filter ruleSupport level
Figure 8.1 Technical analysis: charting and the filter rule; peaks, troughs, trends, resistance, andsupport levels illustrated for the $/DMSource: C. J. Neely, “Technical Analysis in the Foreign Exchange Market: A Layman’s Rule,”Review, Federal Reserve Bank of St. Louis, Sept./Oct. 1997, p. 24.

8.3.4 Market-based forecasts
A market-based forecast is a forecast based on market indicators such as forward rates. Theempirical evidence on the relationship between exchange rates and market indicators implies thatthe financial markets of industrialized countries efficiently incorporate expected currency changesin the spot rate, the forward rate, and in the cost of money. This means that we can obtain currency forecasts by extracting predictions already embodied in spot, forward, and interest rates. Therefore, companies can develop exchange forecasts on the basis of these three marketindicators.
SPOT RATES Some companies track changes in the spot rate and then use these changes to esti-mate the future spot rate. To clarify this point, assume that the Mexican peso is expected to depre-ciate against the dollar in the near future. Such an expectation will cause speculators to sell pesostoday in anticipation of their depreciation. This speculative action will bid down the peso spotrate immediately. By the same token, assume that the peso is expected to appreciate against thedollar in the near future. Such an expectation will encourage speculators to buy pesos today,hoping to sell them at a higher price after they increase in value. This speculative action will bidup the peso spot rate immediately. The present value of the peso, therefore, reflects the expecta-tion of the peso’s value in the very near future. Companies can use the current spot rate to forecast the future spot rate because it represents the market’s expectation of the spot rate in thenear future.
FORWARD RATES The expectation theory assumes that the current forward rate is a consensusforecast of the spot rate in the future. For example, today’s 30-day yen forward rate is a marketforecast of the spot rate that will exist in 30 days.
206 EXCHANGE RATE FORECASTING
$ per DM
0.65
0.64
0.63
0.62
0.61
0.60
0.59Feb. Mar. Apr. May June
1992
Exchange rate
5-day moving average
20-day moving averageSell signal,movingaverage rule
Buy signal, moving average rule
Figure 8.2 Technical analysis: moving-average rule (5- and 20-day moving averages)Source: C. J. Neely, “Technical Analysis in the Foreign Exchange Market: A Layman’s Rule,”Review, Federal Reserve Bank of St. Louis, Sept./Oct. 1997, p. 24.

INTEREST RATES Although forward rates provide simple currency forecasts, their forecastinghorizon is limited to about 1 year, because long-term forward contracts are generally nonexis-tent. Interest rate differentials can be used to predict exchange rates beyond 1 year. The market’sforecast of the future spot rate can be found by assuming that investors demand equal returnson domestic and foreign securities:
where et is the dollar price of one unit of foreign currency in period t, e0 is the dollar price of oneunit of foreign currency in period 0, id is the domestic interest rate, and if is the foreign interest rate.
e ei
it
dt
ft
=+( )+( )
01
1
FORECASTING FLOATING EXCHANGE RATES 207
Example 8.4
The spot rate is $0.8000 per Canadian dollar. The 90-day forward discount for Canadiandollars is 5 percent. What is the expected spot rate in 90 days?
To solve this problem, use equation 5.4:
Applying equation 5.4 to the 90-day forward discount for Canadian dollars given above,we obtain:
- = - ¥
=
0 0590 0 8000
0 800036090
90 0 7900
.$ .
$ .$ .
-day forward rate
or -day forward rate
premium (discount)-day forward rate spot rate
spot rate= - ¥n
n360
Example 8.5
The spot rate is $2 per pound. The annual interest rates are 10 percent for the USA and 20percent for the UK. If these interest rates remain constant, then what is the market fore-cast of the spot rate for the pound in 3 years?
The market’s forecast of e3 – the spot rate in 3 years – can be found as follows:
e3
3
32
1 0 101 0 20
1 5405= ¥ ++
=$( . )( . )
$ .

8.3.5 The evaluation of exchange forecast performance
Because exchange forecasts are not free, MNCs must monitor their forecast performance to deter-mine whether the forecasting procedure is satisfactory. Forecast performance can be evaluated bymeasuring the forecast error as follows:
where RSE is the root square error as a percentage of the realized value, FV is the forecasted value,and RV is the realized value. Average forecasting accuracy is usually measured by the root meansquare error. The error is squared because a positive error is no better than a negative error. TheRSE averages the squared errors over all forecasts. A forecasting model is more accurate than theforward rate if it has a smaller RSE than the forward rate.
In order to avoid a possible offsetting effect when we determine the mean forecast error, anabsolute value (a squared error) is used to compute the forecast error. To clarify why the forecasterror must have an absolute value, assume that the forecast error is 20 percent in the first quarterand -20 percent in the second quarter. If the absolute value is not used, the mean error over thetwo quarters is zero. The mean error of zero in this case, however, is misleading, because the fore-cast was not perfect in either quarter. If the absolute value is used here, the mean error over thequarters is 20 percent. Thus, the absolute value avoids such a distortion.
RSEFV RV
RV=
-( )2
208 EXCHANGE RATE FORECASTING
Example 8.6
The forecasted value for the Canadian dollar is $0.7300 and its realized value is $0.7500.The forecasted value for the Mexican peso is $0.1100 and its realized value is $0.1000.What is the dollar difference between the forecasted value and the realized value for boththe Canadian dollar and the Mexican peso? What is the forecast error for each of thesetwo currencies?
The dollar difference between the forecasted value and the realized value is $0.0200 forthe Canadian dollar and $0.0100 for the peso. This does not necessarily mean that the fore-cast of the peso is more accurate. When we consider the relative size of the difference, wecan see that the Canadian dollar has been forecasted more accurately on a percentage basis.The forecast error of the Canadian dollar is computed as follows:
The forecasted error of the peso is computed as follows:
RSE = - =($ . $ . )$ .
.0 7300 0 7500
0 75000 023
2

EMPIRICAL EVIDENCE Several studies have analyzed the forecasting effectiveness of market-based forecasts, technical analysis, fundamental analysis, and exchange forecasting firms. In addi-tion to their mixed results, these studies are not comparable because they include differentcurrencies and cover different time periods. Nevertheless, we discuss the results of two most rep-resentative studies: one that focuses on the accuracy of several forecasting models and the otherthat analyzes the accuracy of several forecasting firms.
Meese and Rogoff (1983) evaluated the forecasting effectiveness of seven models – two market-based forecasts (spot rate and forward rate), two technical models, and three fundamental models– for the time period between November 1976 and June 1981. For each currency, they analyzedforecasting horizons of 1, 6, and 12 months. Using the RSE between the forecasted value andthe realized value for three currencies – the German mark, the Japanese yen and the British pound– they concluded that the market-based forecasts were more accurate than both the technical andfundamental models; and of the two market-based forecasts, the spot rate performed slightlybetter than the forward rate.
Goodman (1979) evaluated the record of six fundamentally oriented forecasting firms on thebasis of their predictive accuracy for six currencies – the Canadian dollar, the French franc, theGerman mark, the Japanese yen, the Swiss franc, and the British pound – from January 1976 toJune 1979. His study evaluated the performance of these forecasting firms using two measures:accuracy in predicting trend and the accuracy of their point estimates. He used the forward rateas a benchmark to judge the effectiveness of the forecasting firms. His study found that no indi-vidual firm was significantly more accurate than the forward rate in predicting trend. On average,these firms did not perform better than the forward rate.
Goodman’s study also computed the accuracy of the point estimate by measuring the per-centage of times that the predicted rates were closer to the actual spot rate than forward rate.Some of the firms performed better than others, but their overall forecast performance was worsethan that of the forward rate. A 1982 study by Levich also found that professional forecastingfirms clearly failed to outperform the forward exchange rate. In a more recent study, Eun andSabherwal (2002) evaluated the forecasting performance of 10 major commercial banks fromaround the world. Their study concluded that, in general, these 10 banks could not beat therandom walk model in forecasting the British pound, the German mark, the Swiss franc, andthe Japanese yen. More surprising, no bank, including the Japanese bank, could beat the randomwalk model in forecasting the Japanese yen. In other words, these studies failed to beat the market.Thus, the performance of these companies does not refute the efficient market hypothesis of theforeign-exchange market.
SKEPTICS OF THE EFFICIENT MARKET HYPOTHESIS Many financial economists believe thatthe exchange rate can be well approximated by a random walk. Using the efficient market hypoth-
FORECASTING FLOATING EXCHANGE RATES 209
These computations, thus, confirm the fact that the Canadian dollar has been predictedmore accurately than the peso.
RSE = - =($ . $ . )$ .
.0 1100 0 1000
0 10000 032
2

esis, they argue that the forward rate is the best available predictor of future spot rates. However,some recent studies by Taylor and Allen (1992), LeBaron (1996), and Szakmary and Mathur(1997) cast doubts on the efficient market hypothesis.
In 1997, for example, Neely tested six filter rules and four moving-average rules on data ofdaily US dollar bid–ask quotes for the German mark, the Japanese yen, the British pound, andthe Swiss franc. All exchange rates data begin on March 1, 1974, and end on April 10, 1997.These four series are the dollar–mark rate, the dollar–yen rate, the dollar–pound rate, and thedollar–franc rate. These 10 rules that were tested had positive excess returns of 4.4 percent overthe whole sample period. These test results cast doubts on the efficient market hypothesis, whichholds that no trading strategy should be able to earn positive excess returns.
8.4 Forecasting Fixed Exchange Rates
Since the breakdown of the fixed exchange rate system in 1971, exchange rates are believed tobe determined by a floating exchange rate system. However, many International Monetary Fund(IMF) member countries have used some form of fixed exchange rates since 1971. The annualreport published by the IMF describes the exchange arrangements and exchange restrictions ofits member countries. The 2003 report (see chapter 4), which covered 186 countries, listed 97cases of fixed exchange rates as of January 31, 2003. Exchange rate forecasting under a fixedexchange rate system can be very useful for MNCs with operations in countries that employ fixedexchange rates.
Jacque (1978) suggests the following four-step sequence as a general forecasting procedureunder a fixed-rate system. First, through a review of key economic indicators, the forecaster shouldidentify those countries whose balance of payments is in fundamental disequilibrium. Second,for the currencies of such countries, the forecaster should evaluate the pressure that market forcesexert on prevailing exchange rates. Third, the forecaster should assess the level of central banks’international reserves to ascertain whether the central bank is in a position to defend the pre-vailing exchange rate. Finally, the forecaster should try to predict the type of corrective policiesthat political decision-makers are likely to implement.
A rule of thumb suggests that in a fixed-rate system, the forecaster ought to focus on the gov-ernment decision-making structure, because the decision to devalue a currency at a given timeis clearly a political one. The basic forecasting approach in this case is to first ascertain the pres-sure to devalue a currency and then determine how long the nation’s leaders can persist with thisparticular level of disequilibrium. We discuss each of the four steps below.
8.4.1 Step one: assessing the balance-of-payments outlook
Step one is an early warning system that will assist the forecaster in identifying those countrieswhose currencies are likely to be adjusted. Currencies are rarely devalued without prior indica-tion of weakness. Many researchers in this area have attempted to forecast currency devaluationon the basis of key economic indicators that are critical in assessing a country’s balance-of-pay-ments outlook. Some of these indicators are the international monetary reserves, internationaltrade, inflation, monetary supply, and exchange spread between official versus market rates. Theseeconomic indicators are also used to forecast foreign-exchange controls.
210 EXCHANGE RATE FORECASTING

FORECASTING FIXED EXCHANGE RATES 211
INTERNATIONAL RESERVES International reserves reflect the solvency of a country – its abilityto meet international obligations. Debt repayment obligations, profit and royalty obligations,and payments of purchases on credit represent international obligations. Continued balance-of-payments deficits decrease the international reserves of a country that maintains fixed exchangerates, unless these deficits are offset by increased short-term loans or investment. This situationincreases the likelihood of devaluation or depreciation.
THE BALANCE OF FOREIGN TRADE Trends and forecasts for the balance of foreign trade indi-cate the direction in which the value of a currency is to be adjusted. If a country spends moremoney than it obtains from abroad over a sustained period, the possibility of devaluationincreases. If the country receives more money from abroad than it spends abroad, the probabil-ity of revaluation increases.
INFLATION Economic forces link the prices of real assets (inflation rates) with the prices of cur-rencies (exchange rates). The relationship between inflation rates and exchange rates is providedby the purchasing power parity doctrine. According to this doctrine, currencies of countries withhigher inflation rates than that of the USA tend to depreciate in value against the dollar. By thesame token, currencies of countries with lower inflation rates than that of the USA tend to appre-ciate in value against the dollar.
MONEY SUPPLY Money supply consists of currency in circulation and demand deposits. Simplystated, inflation is the consequence of a country’s spending beyond its capacity to produce. Asan economy approaches full employment, any additional increase in money supply can serve onlyto make prices spiral upward. Some foreign-exchange forecasters rely on the money supply as atimely indicator of price changes and exchange rate changes for maintaining purchasing powerparity.
OFFICIAL VERSUS MARKET RATES Many foreign-exchange forecasters use the exchange spreadbetween official and market rates as a valid indicator of currency health. In their comparison,forecasters observe the value that outsiders place on a particular currency. Under a freely flexibleexchange system, no spread exists between these two exchange rates. However, some spread ispractically inevitable where currencies are pegged and exchange controls are imposed on the convertibility of local currency into hard currencies. In this situation, one measures the fallingconfidence in a local currency by checking the widening spread between official and free market rates.
A rise in the spread between official and market rates serves as an indication of increasingapprehension in the near future. Thus, the increasing divergence from a free market rate over anofficial rate may be used as a valuable piece of information to forecast devaluation.
8.4.2 Step two: measuring the magnitude of the required adjustment
Once currency forecasters single out a currency for adjustment, they will carry out the secondstep of the forecasting procedure – that is, determining the size of the change in the exchangerate required to restore the balance-of-payments equilibrium. Essentially, there are three ways ofdoing this: (1) generalized application of the purchasing power parity (PPP) hypothesis; (2) using

forward exchange rates as predictors of future spot exchange rates; and (3) using free market orblack market rates as indicators of future spot exchange rates.
GENERALIZED APPLICATION OF THE PPP THEORY Under the generalized application of thePPP hypothesis, the percentage change in the exchange rate between any two currencies can beestimated by inflation rate differentials between the two countries. The PPP hypothesis, however,is inapplicable if either country or both countries impose controls on prices. Many countries witha fixed exchange system tend to have price controls.
FORWARD PREMIUM OR DISCOUNT An unbiased estimate of the future percentage revaluationor devaluation of a currency may be provided by forward premium or discount. Speculators whothink that a forward rate is higher than their prediction of a future spot rate will sell the foreigncurrency forward. This transaction tends to reduce the forward rate until it equals the expectedfuture spot rate. By the same token, speculators who believe a forward rate is lower than anexpected future spot rate will buy a foreign currency forward. This transaction tends to increasethe forward rate until it reaches the expected future spot rate.
THE FREE MARKET RATE In the absence of a forward exchange market, the exchange ratequoted by the free market can be used as an indicator of the future spot rate. In the absence ofa free market, the black market rate provides a good proxy estimate of the equilibrium exchangerate. These black markets for foreign currencies are likely to appear whenever exchange controlscreate a divergence between the equilibrium exchange rate and the controlled exchange rate.However, both the free market rate and the black market rate normally overestimate the extentof the devaluation required to bring the balance of payments into fundamental equilibrium.
8.4.3 Step three: the timing of the adjustment
Once forecasters have estimated the pressure on a country’s currency based on the discrepancybetween the forecasted rate and the actual rate, they will evaluate the resistance capacity of thecountry under pressure to adjust. The country’s ability to resist or to postpone the implementa-tion of corrective policies depends upon two factors: the ability to borrow hard currencies andthe overall amount of international reserves.
Countries with good credit ratings can easily borrow money from a number of capital markets,such as Euromarkets, local capital markets, foreign capital markets, and international financialinstitutions. International reserves and borrowed funds can be used to finance the balance-of-payments deficit caused by the fundamental disequilibrium. Consequently, those countries witha large amount of international reserves and with good credit ratings can resist or delay the imple-mentation of their corrective policies. However, if disequilibrium persists, even these countrieswill run out of reserves and borrowing capacity.
8.4.4 Step four: the nature of the adjustment
Whether a country will devalue its currency or let it float downward is ultimately a political deci-sion. No matter how necessary a devaluation may be from an economic point of view, political
212 EXCHANGE RATE FORECASTING
FORECASTING FIXED EXCHANGE RATES 213
factors have the final word before choosing between the implementation of corrective policiesand a change in the par value of the currency.
CORRECTIVE POLICIES In the case of a structural balance-of-payments deficit, policy-makerswill first attempt to implement a number of corrective policies: deflate the economy and insti-tute strict exchange controls, among others.
A government may adopt tight monetary and fiscal policies. To stem inflation, it shouldcontrol budget deficits, reduce the growth in the money supply, and institute wage and pricecontrols. These deflationary policies should reduce aggregate domestic demand for both domes-tic and foreign goods, so that the demand for imports falls and the supply of exports rises. Inaddition, external controls on capital account transactions should further reinforce improvementin the balance of payments.
Under foreign-exchange controls, a country would force its exporters and other recipients tosell their foreign exchange proceeds to the central bank. Then, the government would allocatethis foreign exchange only to the various users of foreign exchange. In this way, the governmentrestricts the country’s imports to an amount of foreign exchange earned by the country’s exports. Thus, imports under exchange controls are less than they would be under free marketconditions.
Although deflationary policies appear to be a good way to fix balance-of-payments deficits, theyare not without costs. Deflationary policies may slow the economy. Exchange controls may hurtforeign investment and tourism. In other words, the cost of such corrective policies for the balance-of-payments deficit is high unemployment, which is unlikely to arouse popular enthusiasm.
8.4.5 Devaluation
A country will devalue its currency when various corrective policies prove economically ineffectiveor politically unacceptable. To determine how much longer a devaluation can be delayed for purelypolitical reasons, the currency analyst will have to review political factors in a qualitative manner.At this point, the key question is whether the decision-makers in power can afford the expectedpolitical cost of higher unemployment. The answer to this question depends on the economicphilosophies of the party in power, government attitudes toward devaluation, the type of govern-ment currently in power, patterns of political behavior, and norms for stability. Background infor-mation on the political environment of the government goes far beyond understanding anAdministration’s attitudes and policies toward devaluation. Currency forecasters should understandthe path along which all policies toward devaluation have been made in the past.
8.4.6 Why and how central banks intervene in currency markets
In a system of fixed exchange rates, central banks frequently intervene in the foreign-exchangemarket to maintain the par value system. Even within the flexible exchange rate system, centralbanks intervene in the foreign-exchange market to maintain orderly trading conditions. Mone-tary authorities normally intervene in the foreign-exchange market (1) to smooth exchange ratemovements, (2) to establish implicit exchange rate boundaries, and (3) to respond to temporarydisturbances. Depending on market conditions, a central bank may:

1 Coordinate its action with other central banks or go it alone.2 Enter the market aggressively to change attitudes about its views and policies.3 Call for reassuring action to calm markets.4 Intervene to reverse, resist, or support a market trend.5 Operate openly or indirectly through brokers (Cross 2002).
In 1999, the Bank for International Settlements (BIS) sent a questionnaire on the practice ofexchange market intervention to 44 central banks, including the European Central Bank. Of 44institutions, 22 responded to some or all of the questions asked. The Reserve Bank of NewZealand was the only authority to report that it had not intervened in the past 10 years. Table8.1 shows summary statistics of the intervention survey responses. The survey of central banks’intervention practices reveals that a number of monetary authorities do intervene with some fre-quency in foreign-exchange (mostly spot) markets. The desire to check short-run trends or correctlonger-term misalignments often motivates intervention, whereas the size of the interventionoften depends on market reaction to initial trades. Although intervention typically takes placeduring business hours, most monetary authorities will also intervene outside of these hours ifnecessary. While there is unanimous agreement that intervention does influence exchange rates,there is much disagreement about the horizon over which the full effect of this influence is felt,with estimates ranging from a few minutes to more than a few days.
214 EXCHANGE RATE FORECASTING
Table 8.1 A summary of intervention survey responses
No. ofresponses Minimum Median Maximum
1 In the last decade, on approximately what 14 0.5 4.5 40.0percentage of business days has your monetary authority conducted intervention?
No. ofresponses Never Sometimes Always
2 Foreign-exchange intervention changes the 20 40.0 30.0 30.0domestic monetary base.
3 Intervention transactions are conducted with the following counterparties:
Major domestic banks 21 0.0 28.6 71.4Major foreign banks 18 16.7 72.2 11.1Other central banks 17 76.5 23.5 0.0Investment banks 16 68.8 25.0 6.3
4 Intervention transactions are conducted in the following markets:
Spot 21 0.0 4.8 95.2Forward 17 47.1 52.9 0.0Future 16 93.8 6.3 0.0Other (please specify in margin) 15 93.3 6.7 0.0

Table 8.1 continued
No. ofresponses Never Sometimes Always
5 Intervention transactions are conducted by:Direct dealing with counterparties via 20 0.0 30.0 70.0
telephoneDirect dealing with counterparties via 16 56.3 31.3 12.5
electronic communicationLive FX brokers 19 36.8 52.6 10.5Electronic brokers (e.g., EBS, Reuters 2002) 16 87.5 0.0 12.5
6 The following strategies determine the amount of intervention:
A prespecified amount is traded 17 17.6 70.6 11.8Intervention size depends on market 20 5.0 55.0 40.0
reaction to initial trades
7 Intervention is conducted at the following times of day:
Prior to normal business hours 16 56.3 43.8 0.0Morning of the business day 21 0.0 85.7 14.3Afternoon of the business day 20 0.0 90.0 10.0After normal business hours 17 35.3 64.7 0.0
8 Is intervention sometimes conducted through 21 76.2 23.8 0.0indirect methods, such as changing the regulations regarding foreign exchangeexposure of banks?
9 The following are factors in intervention decisions:
To resist short-term trends in exchange rates 19 10.5 42.1 47.4To correct long-run misalignments of 18 33.3 44.4 22.2
exchange rates from fundamental valuesTo profit from speculative trades 17 100.0 0.0 0.0Other 16 62.5 25.0 12.5
10 Intervention transactions are conducted secretly for the following reasons:
To maximize market impact 17 23.5 35.3 41.2To minimize market impact 14 42.9 57.1 0.0For portfolio adjustment 11 100.0 0.0 0.0Other 12 75.0 16.7 8.3
11 In your opinion, how long does it take to observe the full effect of intervention on exchange rates?
A few minutes 18 38.9A few hours 18 22.2One day 18 0.0A few days 18 27.8More than a few days 18 11.1Intervention has no effect on exchange 18 0.0
rates
Note: Question 1 shows the minimum, median, and maximum responses (from 0 to 100) on the percentage of daysintervention was conducted in the last decade. Questions 2 through 10 show the percentage of responses of “Never,”“Sometimes,” and “Always” to those questions. Question 11 shows the percentage of responses indicating that thefull effects of intervention were felt at each horizon.Source: C. J. Neely, “The Practice of Central Bank Intervention,” Review, Federal Reserve Bank of St. Louis, May/June2001, p. 5.

216 EXCHANGE RATE FORECASTING
Questions
1 Describe corporate motives for currency forecasting.2 If foreign-exchange markets are perfectly efficient, why should no one pay for the ser-
vices of currency forecasting firms?3 Most empirical studies have found that foreign-exchange markets are at least weak-
form efficient. Does this mean that investors can earn extra profits by using technicalanalysis?
4 Explain fundamental analysis as a technique for forecasting exchange rates.5 Explain technical analysis as a technique for forecasting exchange rates.6 Explain the market-based forecast as a technique for forecasting exchange rates.7 How can we assess performance in forecasting exchange rates?
SUMMARY
This chapter has discussed four closely related topics: measuring exchange rate changes, forecast-ing needs, forecasting floating exchange rates, and forecasting fixed exchange rates. MNCs needexchange rate forecasts to make decisions on hedging foreign-currency payables and receivables,working capital management, long-term investment analysis, and long-term financing.
The quality of a company’s decision depends on the accuracy of exchange rate predictions. Manyforecasters believe that for the major floating currencies, foreign-exchange markets are efficient andforward exchange rates are unbiased predictors of future spot rates. No one should solicit the ser-vices of forecasting firms if foreign-exchange markets are perfectly efficient.
Fundamental analysis, technical analysis, and market-based forecasts are the most common fore-casting techniques. Currently, two dozen forecasting firms exist, and their annual service costsseveral thousands of dollars. Many traders and MNCs have in-house forecasting services. Investorsmay earn extra profits by using forecasting techniques and forecasting firms if foreign-exchangemarkets are inefficient. While many financial economists believe that the foreign-exchange marketis highly efficient, some recent studies cast doubts on the efficient market hypothesis. In fact, surveydata from a variety of sources indicates a large and growing influence of technical forecasting tech-niques, especially for very short horizons.
Under a fixed exchange rate system, central banks are committed to maintain exchange rateswithin a narrow band around the par value. This par value may be changed whenever the follow-ing successive events occur. First, the balance of payments of a country moves into fundamentaldisequilibrium. Second, various corrective policies prove economically ineffective or politicallyunacceptable. Under such conditions, a change in the exchange rate is a discrete, one-way adjust-ment of a relatively considerable magnitude, with the new rate to be expected to prevail for sometime.

PROBLEMS 217
8 In the early 1990s, some former Eastern-bloc countries allowed the exchange rates oftheir currencies to fluctuate against the dollar. Would the use of fundamental analysis beuseful for forecasting the future exchange rates of these currencies?
9 Explain the events that would force the par value to change.10 A general rule suggests that in a fixed-rate system, the forecaster ought to focus on the
government decision-making structure. Explain.11 Why do the central banks of countries with flexible exchange rate systems intervene in
the foreign-exchange market?
Problems
1 The beginning spot rate is $0.1854 per South African rand and the ending spot rate is$0.20394 per rand.(a) Calculate the percentage change in the exchange rate for the rand against the dollar.(b) Calculate the percentage change in the exchange rate for the dollar against the rand.
2 The beginning spot rate is $0.1040 per Chinese yuan and the ending spot rate is $0.0936per yuan.(a) What is the percentage change in the exchange rate for the yuan?(b) What is the percentage change in the exchange rate for the dollar?
3 The spot rate is $0.60 per Swiss franc. The 4-year annualized inflation rate is 9 percent inthe USA and 6 percent in Switzerland.(a) What is the expected percentage appreciation or depreciation of the franc over the
4-year period?(b) What is the forecast for the franc’s spot rate in 4 years?
4 A US company’s forecast for the percentage change in the British pound (BP) depends ononly three variables: inflation rate differentials, US inflation minus British inflation (I); dif-ferentials in the rate of growth in money supply, the growth rate in US money supplyminus the growth rate in British money supply (M); and differentials in national incomegrowth, US income growth minus British income growth (N). The coefficients are b0 =0.002, b1 = 0.8, b2 = 1.0, and b3 = 0.5. Finally, differentials in inflation rate, money supply,and income growth are I = 4 percent, M = 2 percent, and N = 0 percent during the mostrecent quarter. What is the percentage change in the British pound during the next quarter?
5 The spot rate is $0.5800 per Singapore dollar. The 90-day forward premium for Singaporedollars is 13.79 percent. What is the expected spot rate in 90 days?
6 The spot rate is $0.08 per Spanish peseta. The annual interest rates are 4 percent for theUSA and 9 percent for Spain. What is the market’s forecast of the spot rate in 2 years?
7 The forecasted value for the Mexican peso is $0.1200 and its realized value is $0.1000.What is the forecast error (root square error) for the peso?

218 EXCHANGE RATE FORECASTING
REFERENCES
Cross, S. Y., All About the Foreign Exchange Marketin the United States, Federal Reserve Bank of NewYork, 2002, pp. 92–3.
Dufey, G. and I. H. Giddy, The International MoneyMarket, Englewood Cliffs, NJ: Prentice Hall,1978.
Eun, C. and S. Sabherwal, “Forecasting ExchangeRates? Do Banks Know Better?” Global FinanceJournal, 2002, pp. 195–215.
Goodman, S. H., “Foreign Exchange Rate Forecast-ing Techniques: Implications for Business andPolicy,” Journal of Finance, May 1979, pp.415–27.
Hopper, G. P., “Is the Foreign Exchange MarketInefficient?” Business Review, Federal ReserveBank of Philadelphia, May/June 1994, pp.17–27.
Jacque, L. L., Management of Foreign Exchange Risk,Lexington, MA: Lexington Books, 1978.
LeBaron, B., “Technical Trading Rule Profitabilityand Foreign Exchange Intervention,” NBER,Working Paper 5505, Mar. 1996.
Levich, R. M., “Evaluating the Performance of theForecasters,” in R. Ensor, ed., The Managementof Foreign Exchange Risk, Euromoney Publication,1982, pp. 121–34.
Meese, R. and K. Rogoff, “Empirical Exchange RateModels of the Seventies: Do They Fit Out of
Sample?” Journal of International Economics, Feb.1983, pp. 3–24.
Neely, C. J., “Technical Analysis in the ForeignExchange Market: A Layman’s Rule,” Review,Federal Reserve Bank of St. Louis, Sept./Oct.1997, pp. 23–38.
Neely, C. J., “Technical Analysis and the Profitabil-ity of US Foreign Exchange Intervention,”Review, Federal Reserve Bank of St. Louis,July/Aug. 1998, pp. 3–17.
Neely, C. J., “The Practice of Central Bank Inter-vention: Looking Under the Hood,” Review,Federal Reserve Bank of St. Louis, May/June2001, pp. 1–10.
Neely, C. J. and L. Sarno, “How Well Do MonetaryFundamentals Forecast Exchange Rates,” Review,Federal Reserve Bank of St. Louis, Sept./Oct.2002, pp. 51–74.
Szakmary, A. C. and I. Mathur, “Central BankIntervention and Trading Rules Profits in ForeignExchange Markets,” Journal of InternationalMoney and Finance, Aug. 1997, pp. 513–36.
Taylor, M. P. and H. Allen, “The Use of TechnicalAnalysis in the Foreign Exchange Market,”Journal of International Money and Finance, June1992, pp. 304–14.
Case Problem 8: General Motors Operations inMexico, and the Peso Crisis
Although Mexico had allowed its peso to fluctuate within a narrow band, the government hadvirtually pegged the peso to the US dollar since 1990. However, on December 20, 1994,Mexico unexpectedly announced its decision to float the peso and a 40 percent devaluationfollowed in the next 2 days. The peso devaluation and the peso float, at first glance, seemedto have caused serious problems for General Motors (GM), whose manufacturing facilities inMexico depend heavily on materials and components from the USA. An emergency meetingof the GM Executive Committee was called on December 24 in Detroit, to deal with the con-sequences of the devaluation and the float. Gary Henson, President and Managing Director

CASE PROBLEM 8 219
of GM de Mexico since December 1992, knew that all of the company’s top executives wouldbe attending the meeting and felt certain that he would be asked why the devaluation andthe float had caught him off guard. He decided to analyze economic statistics for both Mexicoand the USA (see tables 8.2 and 8.3) along with the news clippings in his file on the Mexicanpeso.
Concern over the possibility of devaluation had existed for years, from 1990 to December20, 1994, because real exchange rates for the peso had skyrocketed. However, many observersfelt that President Salinas’s economic reforms had improved Mexico’s economy to such anextent that devaluation would not be necessary.
Henson was, therefore, not the only person caught off guard by the size of the devalua-tion and by the timing of the float. When the Mexican Central Bank opened on December 22,it began quoting pesos at 5.5 per US dollar, then as low as 6.33; the peso dropped to 5.8 bythe end of the day. By December 23, foreign-exchange experts had become sharply dividedon how far the peso might fall. Some said that the foreign-exchange market had already over-reacted, but others saw no end in sight to the peso’s depreciation. Analysts also disagreed onwhether the valuation and the float would be sufficient to correct the country’s balance-of-payments difficulties and other economic problems. All these conflicting and perplexing pointsof view made it more difficult for Henson to assess the effects of the float and the devalua-tion on GM’s operations in Mexico.
Although there are some historical exceptions, exchange rate stabilization programs com-monly result in a specific dynamic of consumption and investment patterns, current-accountdeficits, and exchange rate pressures. The typical pattern of exchange rate stabilization pro-grams includes the following (Gruben 1996). First, despite reductions in inflation, the real
Table 8.2 Selected economic indicators for the USA and Mexico
3rd Q 4th Q1990 1991 1992 1993 1993 1994
Exchange rate (pesos per $) 2.9454 3.0710 3.1154 3.1059 3.4040 5.3250Mexican CPI 100.0 122.7 141.7 155.5 167.4 170.5US CPI 100.0 103.1 105.0 106.9 109.2 110.1US money supply 100.0 108.6 124.0 136.7 135.9 139.1Mexican money supply 100.0 223.9 257.6 303.3 276.2 306.6
Source: The International Monetary Fund, International Financial Statistics, Washington, DC, June 1995.
Table 8.3 Mexico’s balance of payments (millions of US dollars)
3rd Q 4th QAccounts 1990 1991 1992 1993 1994 1994
Goods and services -3,110 -9,369 -18,619 -16,010 -15,466 -21,054Current account -7,451 -14,888 -24,442 -23,400 -21,525 -28,784International receivers 9,863 17,726 18,942 25,110 16,374 6,278
Source: The International Monetary Fund, International Financial Statistics, Washington, DC, June 1995.

220 EXCHANGE RATE FORECASTING
exchange rate rises because some inflation remains and is not offset by nominal exchange ratemovements. Second, the trade and current-account balances deteriorate. Third, in the earlystages of the program, capital inflows finance the excess of consumption and investment overdomestic production, allowing a boom to ensure, but the inflows ultimately reverse. Fourth,with this reversal, the growing current-account deficit can no longer be financed, the con-sumption boom ends, and the exchange rate stabilization program collapses.
Case Questions
1 Do you think that the peso had fallen far enough as of December 22 or that it would con-tinue to lose value? (Hint: answer this question using equation 8.3.) Is the predictedexchange rate usually accurate?
2 Could the peso float have been forecasted? (Hint: answer this question using economicindicators such as the balance of payments, international reserves, inflation, and moneysupply.)
3 What alternatives were available to the Mexican government for dealing with its balance-of-payments problems?
4 Assume that Mexico imposed prolonged foreign-exchange controls and thus GM deMexico, the Mexican subsidiary of General Motors, could not import crucial materials andcomponents from the USA. Briefly outline courses of action that GM de Mexico shouldtake to cope with the foreign-exchange controls.
5 Is there any evidence that the typical pattern of exchange rate stabilization programs sug-gested by researchers such as William Gruben took place in Mexico?
6 The website of the Chicago Mercantile Exchange, www.cme.com, provides information oncurrency futures prices, including recent quotes and trends. Because a futures contract issimilar to a forward contract, it can be used to forecast the value of a currency. Use thiswebsite to review the recent trend of futures prices for the Mexican peso and to answerthe following question: Why do you think that the futures prices of the peso have changedover the past few months? Discuss how this information could be of assistance to Mr GaryHenson, President and Managing Director of GM de Mexico. The website of Olsen andAssociates, www.olsen.ch, provides information on technical forecasts. Visit this website toobtain technical information for several currencies.
Sources: The International Monetary Fund, International Financial Statistics, Washington, DC: IMF, variousissues; W. C. Gruben, “Policy Priorities and the Mexican Exchange Rate Crisis,” Economic Review, FederalReserve Bank of Dallas, First Quarter 1996, pp. 19–29; C. Ramirez, “GM Pulls into Leader Spot in MexicoSale,” Automotive News, July 17, 1995, p. 33; and D. Wessel, P. B. Carroll, and T. T. Vogel, “How Mexico’sCrisis Ambushed Top Minds in Officialdom, Finance,” The Wall Street Journal, July 6, 1995, pp. A1, A3.

Opening Case 9: Avon’s Actions to Protect Against Volatile Currencies
Avon Products, Inc. is a global manufacturer and marketer of beauty and related prod-ucts. In 1996, the Asian market accounted for 16 percent of Avon’s total revenues($4.8 billion). This case recounts how Avon minimized its currency exposure to theAsian financial crisis of 1997—8 through the use of three hedging techniques: thebalance-sheet hedge, leads and lags, and forward contracts.
First, Avon produces and sells nearly all its own products in 10 Asian countries. Thisstrategy, known as the balance-sheet hedge, has enabled Avon to maintain the sameamount of exposed assets and exposed liabilities in Asian currencies. Avon sufferedneither a gain nor a loss from the Asian crisis, because devaluations of the Asian cur-rencies affected both the company’s assets and liabilities equally.
Second, when the crisis began in Thailand in July 1997, Avon had its Asian unitremit its earnings weekly rather than monthly (leads) and had, moreover, delayed itsdollar payments to some Asian suppliers (lags).
Third, just before other Asian countries allowed their currencies to depreciate, Avonsold about $50 million worth of five Asian currencies forward against the dollar forperiods of up to 15 months.
Source: Fred R. Bleakly, “How US Firm Copes with Asian Crisis: Avon Moves to Protect againstVolatile Currencies,” The Wall Street Journal, Dec. 26, 1997, pp. A2, A4.
CHAPTER 9
Managing TransactionExposure and EconomicExposure

Foreign-exchange risk is the risk of loss due to changes in the international exchange value ofnational currencies. For example, in 1999 Sony was the victim of a 40 percent increase in theyen against currencies of its major trading partners in 1999 (Landers 1999). In October 1999,Sony reported impressive accomplishments for the first half of that year: new products, productand distribution rationalization, and increased sales and profits across the board in local-currencyterms. But the same report broke bad news in dollar terms: sales had dropped by 7.6 percent,operating income by 45 percent, and net income by 25 percent. These results underline theimpact of the high yen on Japanese exporters such as Sony. In fact, these days many companiesare at the mercy of foreign-exchange rates.
So long as we do not have a single world currency, some degree of exchange risk will exist, no matter what the system. Fluctuations in the value of currency had been quite fre-quently pronounced even under the fixed exchange rate system. A study by DeVries (1968), for example, shows that during the 20-year period from 1948 to 1968, 96 countries devaluedtheir currencies by more than 40 percent, and 24 countries devalued their currencies by more than 75 percent. This problem has become more complicated in the past three decades,because most countries have permitted their currencies to float since 1973. Daily currency fluc-tuations and frequent currency crises have become a way of life since then. Daily currency fluc-tuations and the increasing integration of the world economy are two major reasons whymultinational companies (MNCs) consider exchange rate risk as the most important amongmany risks.
This chapter has four major sections. The first section describes the basic nature of foreign-exchange exposure. The second section explains how transaction exposure can be measured andhedged. The third section explains how economic exposure can be measured and hedged. Thefourth section covers the use of exchange risk management instruments by MNCs. In addition,this section explores the possibility that a hedge can be risky, by using the maturity mismatch ina German firm’s oil futures hedge as an example.
9.1 The Basic Nature of Foreign-Exchange Exposures
Foreign-exchange exposure refers to the possibility that a firm will gain or lose because ofchanges in exchange rates. Every company faces exposure to foreign-exchange risk as soon as itchooses to maintain a physical presence in a foreign country. Likewise, a firm faces exposure toexchange risk when it chooses to finance its operations in foreign currencies. Both exchange risksare analyzed in the context of investing and financing decisions. In addition, foreign trade andloans may involve foreign-exchange risk. An important task of the international financial manageris to compare potential losses with the cost of avoiding these losses.
Three basic types of exchange exposure are translation exposure, transaction exposure, and economic exposure. Translation exposure is the accounting-based changes in consoli-dated financial statements caused by exchange rate changes. Transaction exposure occurs when exchange rates change between the time when an obligation is incurred and the time when it is settled, thereby affecting actual cash flows. Economic exposure reflects the change inthe present value of the firm’s future cash flows because of an unexpected change in exchangerates.
222 MANAGING TRANSACTION EXPOSURE AND ECONOMIC EXPOSURE

9.1.1 Exposure management strategy
Most large MNCs manage their foreign-exchange risk by using a pre-established exposure man-agement strategy. For example, Merck uses the following five steps for currency exposure man-agement: (1) projecting exchange rate volatility, (2) assessing the impact of the 5-year strategicplan, (3) deciding on hedging the exposure, (4) selecting the appropriate financial instruments,and (5) constructing a hedging program (for details, see Case Problem 6: Merck’s Use of Cur-rency Options). To protect assets adequately against risks from exchange rate fluctuations, MNCsmust (1) forecast the degree of exposure, (2) develop a reporting system to monitor exposure andexchange rate movements, (3) assign responsibility for hedging exposure, and (4) select appro-priate hedging tools.
FORECASTING THE DEGREE OF EXPOSURE To develop a viable hedging program, an MNCmust forecast the degree of exposure in each major currency in which it operates. Approachesrange from gut feelings to sophisticated economic models, each of which has had varying degreesof success. Whatever the approach, the MNC should estimate and use ranges within which itexpects a currency to vary over the forecasting period. Some companies develop in-house capa-bilities to monitor exchange rates, using economists who also try to obtain a consensus ofexchange rate movements from the banks with which they deal. Their concern is to forecast thedirection, magnitude, and timing of an exchange rate change. Other companies contract out theirforecasting needs.
DEVELOPING A REPORTING SYSTEM TO MONITOR EXPOSURE AND EXCHANGE RATE MOVE-MENTS Once the MNC has decided how to forecast the degree of exposure, it should developa reporting system that will assist in protecting it against risk. To achieve this goal, substantialparticipation from foreign operations must be combined with effective central control. Becauseexchange rates change frequently, MNCs should obtain input from those who are attuned to theforeign country’s economy. Central control of exposure protects resources more efficiently thanletting each subsidiary monitor its own exposure. The management of the MNC should devisea uniform reporting system for all of its subsidiaries. The report should identify the exposedaccounts that it wants to monitor, the amount of exposure by currency of each account, and thedifferent times under consideration.
ASSIGNING RESPONSIBILITY FOR HEDGING EXPOSURE It is important for management to decide at what level hedging strategies will be determined and implemented. Most MNCstoday continue to centralize exchange exposure management, because it is impossible for regionalor country managers to know how their foreign-exchange exposure relates to other affiliates. Athree-country study of exchange risk management by Belk (2002) found that 66 percent of thesample companies highly centralized their exposure management, 19 percent lowly centralizedtheir exposure management, and only 15 percent decentralized their exposure management.However, a centralized policy may miss opportunities to detect the possibility of currency fluc-tuations in certain regions or countries. Thus, some MNCs decentralize some exposure man-agement decisions so that they can react quickly to a more rapidly changing internationalenvironment.
THE BASIC NATURE OF FOREIGN-EXCHANGE EXPOSURES 223

SELECTING APPROPRIATE HEDGING TOOLS Once an MNC has identified its level of exposureand determined which exposure is critical, it can hedge its position by adopting operational tech-niques and financial instruments (see Global Finance in Action 9.1). Operational techniquesare operational approaches to hedging exchange exposure that include diversification of acompany’s operations, the balance-sheet hedge, and exposure netting. Financial instruments arefinancial contracts to hedging exchange exposure that include currency forward and futures con-tracts, currency options, and swap agreements. This chapter and chapter 10 will discuss theseand other hedging devices in detail.
224 MANAGING TRANSACTION EXPOSURE AND ECONOMIC EXPOSURE
Global Finance in Action 9.1Coca Cola’s Exposure Management
Coca Cola is a good example of how MNCs use operational techniques and finan-cial instruments for their foreign-exchange exposure management. Because CocaCola earns about 80 percent of its operating income from foreign operations, foreign-currency changes can have a major impact on reported earning. The companymanages its currency exposures on a consolidated basis, which allows it to net expo-sures from different operations around the world and takes advantage of naturaloffsets – for example, cases in which Japanese yen receivables offset Japanese yenpayables. It also uses financial contracts to further reduce its net exposure to currencyfluctuations. Coca Cola enters into currency forward contracts and purchases cur-rency options in several countries, most notably the euro and Japanese yen, to hedgefirm sales commitments. It also buys currency options to hedge certain anticipatedsales.
Source: J. D. Daniels, L. H. Radebaugh, and D. P. Sullivan, International Business: Environmentsand Operations, 10th edn, Upper Saddle River, NJ: Prentice Hall, 2004, p. 620.
9.1.2 Transaction exposure
Gains or losses may result from the settlement of transactions whose payment terms are statedin a foreign currency. Transaction exposure refers to the potential change in the value of out-standing obligations due to changes in the exchange rate between the inception of a contract andthe settlement of the contract. Transactions that are subject to transaction exposure include creditpurchases and credit sales whose prices are stated in foreign currencies, borrowed and loanedfunds denominated in foreign currencies, and uncovered forward contracts.
Receipts and payments denominated in foreign currencies are considered to be exposed. Ifexposed receipts are greater than exposed payments, foreign-currency depreciations will causeexchange losses, and foreign-currency appreciations will cause exchange gains. On the other hand,if exposed receipts are smaller than exposed payments, foreign-currency depreciations will createexchange gains, and foreign-currency appreciations will create exchange losses.

9.1.3 Economic exposure
Economic exposure, also called operating exposure, competitive exposure, or revenue exposure,measures the impact of an exchange rate change on the net present value of expected future cashflows from a foreign investment project. Future effects of changes in exchange rates occur underthe general category of economic risk. An MNC may have established its subsidiary in a countrywith price stability, readily available funds, a favorable balance of payments, and low rates of tax-ation. These positive features may disappear over time if the economic situation of the countrydeteriorates. Eventually, the local currency will devalue or depreciate. The subsidiary is likely toface immediate operational problems if it has to pay for its imports in hard currencies or if it hasborrowed from abroad. Exchange rate changes may also affect economic factors such as infla-tionary forces, price controls, the supply of loanable funds, and local labor availability.
Economic exposure is a broader and more subjective concept of exposure than either transla-tion or transaction exposure, because it involves the potential effects of exchange rate changes onall facets of a firm’s operations. Economic exposure is difficult to measure, but may be more sig-nificant than the others because it relates to the long-term profit performance and hence thevalue of the firm.
THE BASIC NATURE OF FOREIGN-EXCHANGE EXPOSURES 225
Example 9.1
An American firm has sold machinery to a British firm through its UK subsidiary for £10,000,with terms of 180 days. The payments must be received in pounds. The spot rate for poundsis $1.70 and the US seller expects to exchange £10,000 for $17,000 when payment isreceived.
Transaction exposure arises because of the risk that the US exporter will receive some-thing other than $17,000 when the British pound receipts are exchanged for dollars. If thespot rate were to decline to $1.40 180 days from today, the US exporter would receive only$14,000, $3,000 less than the expected $17,000. However, if the spot rate were to rise to$1.90 during the same period, the exporter would receive $19,000, an increase of $2,000over the amount expected. If the US exporter had invoiced in dollars, the transaction expo-sure would have shifted to the British importer. Unlike translation gains and losses, trans-action gains and losses have a direct impact on actual cash flows.
Example 9.2
For the coming year, a Malaysian subsidiary of an American firm is expected to earn 35million ringgits after taxes, and its depreciation charge is estimated at 5 million ringgits. Theexchange rate is expected to decrease from M$4 per dollar at present to M$5 per dollarfor the next year.

9.1.4 A comparison of the three exposures
The management of foreign-exchange risk based on translation exposure is basically static andhistorically oriented. By definition, translation exposure does not look to the future impact ofan exchange rate change that has occurred or may occur. In addition, it does not involve actualcash flows. In contrast, both transaction and economic exposures look to the future impact ofan exchange rate change that has occurred or may occur. These exposures also involve actual orpotential cash flow changes.
Transaction risk and economic risk are the same in kind, but they differ in degree. For example,economic risk is essentially subjective, because it depends on estimated future cash flows for anarbitrary time horizon. Transaction risk, on the other hand, is essentially objective, because it depends on outstanding obligations that existed before changes in exchange rates but weresettled after changes in exchange rates. Table 9.1 illustrates the major differences among thesethree exposures.
9.2 Transaction Exposure Management
An action that removes transaction risk is said to “cover” that risk. A cover involves the use offorward contracts, a combination of spot market and money market transactions, and other tech-niques to protect a foreign-exchange loss in the conversion from one currency to another. Theterm “conversion” relates to transaction exposure because the transaction exposure involves theactual conversion of exposed assets and liabilities from one currency to another. If MNCs decideto cover their transaction exposure, they may select from a variety of financial instruments andoperational techniques. Operational techniques, such as exposure netting, leading and lagging,and price adjustments through transfer prices, will be discussed in chapter 10. This chapter willfocus on the following four financial instruments.
226 MANAGING TRANSACTION EXPOSURE AND ECONOMIC EXPOSURE
The difference between the first-year cash flows with and without devaluation is com-puted as follows:
Profit after taxes M$35 millionDepreciation +5 million
Cash flows from operation M$40 million
Predevaluation rate (M$4 = $1) M$40 million = $10 millionPostdevaluation rate (M$5 = $1) M$40 million = -$8 million
Potential exchange loss $2 million
The subsidiary’s economic loss is a decline in Malaysian ringgit cash flows equal to $2 millionover the next 12 months. The translation loss or the transaction loss is a one-time loss, butthe economic loss is an open-ended event. If the anticipated business activity were to staythe same for the next 5 years, cash flows would decrease by $2 million per year for 5 years.

1 The forward market hedge.2 The money market hedge.3 The options market hedge.4 Swap agreements.
9.2.1 The forward market hedge
A forward-exchange market hedge involves the exchange of one currency for another at a fixedrate on some future date to hedge transaction exposure. The purchase of a forward contract substitutes a known cost for the uncertain cost due to foreign-exchange risk caused by the pos-sible devaluation of one currency in terms of another. Although the cost of a forward contractis usually smaller than the uncertain cost, the forward contract does not always assure the lowestcost due to foreign-exchange rate change. The forward contract simply fixes this cost in advance,thus eliminating the uncertainty caused by foreign-exchange rate changes. For example, an American company may have a euro import payable in 9 months. The American company cancover this risk by purchasing euros at a certain price for the same date forward as the paymentmaturity.
9.2.2 The money market hedge
A money market hedge involves a loan contract and a source of funds to carry out that con-tract in order to hedge transaction exposure. In this case, the contract represents a loan agree-ment. Assume that an American company has a British pound import payable in 90 days. To
TRANSACTION EXPOSURE MANAGEMENT 227
Table 9.1 Major differences among three types of exposure
Variables Translation exposure Transaction exposure Economic exposure
Contract Specific Specific GeneralDuration A point in time Period of contract Project lifeGains (losses) Easy to compute Intermediate to Difficult to compute
computeGains (losses) Paper in nature Actual ActualMeasurement Depends on Depends on changes Depends on changes
accounting rules in actual spot rates in actual spot ratesHedging Easy Intermediate DifficultExtent of exposure Determined by Determined by the Determined by
accounting rules nature of the product and marketcontract factors
Value Book value of assets Contract value of Market value ofand liabilities assets and assets
liabilitiesManagement of By the Treasury By the Treasury By all departments
exposure Department Department

hedge transaction exposure from this import payable, the American company may borrow indollars (loan contract), convert the proceeds into British pounds, buy a 90-day British Treasurybill, and pay the import bill with the funds derived from the sale of the Treasury bill (source offunds). Of course, it can buy British pounds in the foreign-exchange spot market when the importbill becomes due, but this approach involves transaction risk.
A money market hedge is similar to a forward market hedge. The difference is that the costof the money market hedge is determined by differential interest rates, while the cost of theforward market approach is determined by the forward premium or discount. If foreign-exchangemarkets and money markets are in equilibrium, the forward market approach and the moneymarket approach incur the same cost.
9.2.3 The options market hedge
If a company has a foreign-currency receivable or a foreign-currency payable, the options markethedge can protect the company from exchange rate fluctuations. By buying a call option on theforeign currency, a US company can lock in a maximum dollar price for its foreign-currencyaccounts payable. By purchasing a put option on the foreign currency, the company can lock ina minimum dollar price for its foreign-currency accounts receivable.
Companies understand that hedging techniques such as the forward market hedge and themoney market hedge can backfire or may even be costly when an accounts payable currencydepreciates or an accounts receivable currency appreciates over the hedged period. Under thesecircumstances, an uncovered strategy might outperform the forward market hedge or the moneymarket hedge. The ideal type of hedge should protect the company from adverse exchange ratemovements but allow the company to benefit from favorable exchange rate movements. Theoptions market hedge features these attributes.
To see how currency options provide such a flexible optional hedge against transaction expo-sure, assume that Boeing exports a DC 10 to British Airways and bills £10 million in 1 year. IfBoeing purchases a put option on £10 million, this transaction provides Boeing with the right,but not the obligation, to sell up to £10 million at a fixed exchange rate, regardless of the futurespot rate. With its pound receivable, Boeing would protect itself by exercising its put option ifthe pound were to weaken, but would benefit by letting its put option expire unexercised if thepound were to strengthen.
9.2.4 The swap market hedge
When exchange rates and interest rates fluctuate too widely, the risks of forward market andmoney market positions are so great that the forward market and the money market may notfunction properly. Currency options are available only for a selected number of currencies andare inflexible. In such cases, MNCs may use swap arrangements to protect the value of exportsales, import orders, and outstanding loans denominated in foreign currencies.
The swap market hedge involves an exchange of cash flows in two different currenciesbetween two companies. Swaps take many forms, but one type of swap — the currency swap —accommodates an MNC’s needs to cover its transaction risk. In a currency swap, one companyprovides a certain principal in one currency to another company in exchange for an equivalent
228 MANAGING TRANSACTION EXPOSURE AND ECONOMIC EXPOSURE

amount in a different currency. For example, a Swiss company may be anxious to swap Swissfrancs for US dollars. Similarly, a US company may be willing to exchange US dollars for Swissfrancs. Given these needs, the two companies engage in a currency swap.
TRANSACTION EXPOSURE MANAGEMENT 229
Example 9.3
To see how forward-exchange market, money market, options market, and swap markethedges may be utilized to protect against transaction exposure, assume that an Americanfirm has sold an airplane to a Swiss firm for SFr100,000, with terms of 90 days. Let usfurther assume that the spot rate for francs is $0.5233, the 90-day forward rate for francsis $0.5335, the Swiss 90-day interest rate is 10 percent, and the US 90-day interest rate is17.8 percent. The interest rates are in equilibrium with forward-exchange quotations, andthis is confirmed by the following computation, using equation 5.8:
The US company’s bank believes that the spot rate in 90 days will rise to $0.6000, whichis higher than the implicit unbiased forecast of $0.5335 that exists in the currency forwardquotation. In addition, assume that put options with a 3-month settlement date have astrike price of $0.5369 per franc and a premium of $0.01 per franc. Finally, a swap dealersays that she will find a Swiss company that is willing to swap Swiss francs for US dollarsat an exchange rate of $0.5400 per franc.
Five alternatives are available to the US company: do not hedge (take the transactionrisk), hedge in the forward market, hedge in the money market, hedge in the optionsmarket, or use swap agreements.
If the US company decides to accept the transaction risk, it would receive SFr100,000 in90 days and sell them in the foreign-exchange market for dollars. If the bank’s forecast isaccurate, the US company would receive $60,000 ($0.6000 ¥ SFr100,000) in 90 days.However, that receipt is subject to foreign-exchange risk. If the franc were to decline to$0.4000, the US company would receive only $40,000, which is $20,000 less than expected.The $40,000 could in fact be insufficient to cover the manufacturing cost of the airplane.On the other hand, if the franc should increase in value even more than the bank’s fore-cast, the US company would receive substantially more than $60,000.
If the US company wishes to hedge its transaction exposure in the forward market, itwould sell SFr100,000 in the forward market for $53,350. This is known as a covered trans-action, in which the US firm no longer has foreign-exchange risk. In 90 days, the US firmwould receive SFr100,000 from the Swiss importer, deliver the proceeds to the bank againstits forward sale, and receive $53,350. It should be recognized that the certain $53,350 is
n F SS
-daydomestic rate foreign rate
$0.5335
- ¥ = -
- ¥ = -
=
36090
0 52330 5233
36090
17 8 10 0
7 8 7 8
$ .$ .
. % . %
. % . %

OPTIONS VERSUS FORWARD CONTRACTS A forward contract is often an imperfect hedginginstrument, because it is a fixed agreement to buy or sell a foreign currency at a specified pricein the future. However, in many practical situations, companies are not sure whether their hedgedforeign-currency cash flows will materialize. Consider the situations in which: (1) an overseasdeal may fall through; (2) a bid on a foreign-currency contract may be rejected; or (3) a foreignsubsidiary’s dividend payments may exceed the expected amount. In such cases, companies maynot need the obligation, but the right, to buy or sell a foreign currency at a specified price inorder to reduce their exchange rate risk. Giddy (1983) suggested that companies should use thefollowing rules to choose between forward contracts and currency options for hedging purposes:
1 When the quantity of a foreign-currency cash outflow is known, buy the currency forward;when the quantity is unknown, buy a call option on the currency.
2 When the quantity of a foreign-currency cash inflow is known, sell the currency forward;when the quantity is unknown, buy a put option on the currency.
3 When the quantity of a foreign-currency flow is partially known and partially uncertain, usea forward contract to hedge the known portion and an option to hedge the maximum valueof the uncertain remainder.
230 MANAGING TRANSACTION EXPOSURE AND ECONOMIC EXPOSURE
less than the uncertain $60,000 expected from the unhedged position, because the forwardmarket quotation is not identical with the bank’s forecast.
In addition to the forward market approach, the US company can also cover its trans-action against foreign-exchange risk through the money market approach. The moneymarket approach works as follows: (1) borrow SFr97,561 from a Swiss bank at 10 percentper annum (2.5 percent per quarter) in exchange for a promise to pay SFr100,000(SFr97,561 ¥ 1.025); (2) receive $51,054 (SFr97,561 ¥ $0.5233) by exchanging theSFr97,561 for dollars at the current spot rate of $0.5233; and (3) invest this sum in the USmoney market at 17.8 percent per annum (4.45 percent per quarter) and receive $53,326($51,054 ¥ 1.0445) at the end of 3 months. This sum should be equal to the sum receivedin the forward market hedge described earlier. The small difference between these two sumsis due to a compounding error.
The US firm can cover its franc receivables with the put option. The US firm buys putoptions for a total premium of $1,000 (SFr100,000 ¥ $0.01), exercises its options in 90days, and sells SFr100,000 at a strike price of $0.5369 for $53,690. Thus, the US firm wouldobtain a net amount of $52,690 ($53,690 — $1,000) in exchange for SFr100,000 at theend of 3 months. If the spot rate of the Swiss franc should exceed $0.5369 in 90 days, theUS firm would let the option contract expire unexercised and convert the SFr100,000 at theprevailing spot rate.
Finally, the US firm can cover its transaction risk with currency swaps. The US firm isanxious to swap its SFr100,000 for US dollars. Through a swap dealer, it may be able tofind a Swiss company that may be willing to exchange US dollars for SFr100,000. Giventhese needs, the two companies could arrange a currency swap that allows for an exchangeof SFr100,000 for US dollars at a predetermined exchange rate of $0.5400. In this way, theUS company could lock in the number of US dollars at $54,000 that it will receive inexchange for SFr100,000 in 90 days.

CROSS-HEDGING A cross-hedge is a technique designed to hedge exposure in one currency bythe use of futures or other contracts on another currency that is correlated with the first currency.Frequently, futures or forward markets are not available for some currencies. In these situations,MNCs may be able to use a substitute or proxy for the underlying currency that is available. Theidea behind cross-hedging is this. If MNCs cannot find a forward contract on a particular cur-rency in which they have an exposure, they may wish to hedge their exposure through a forwardcontract on a related currency.
Assume the following four things: (1) a US company has accounts payable in Hong Kongdollars 90 days from now; (2) the Hong Kong dollar is expected to appreciate against the USdollar; (3) forward contracts or other hedging techniques are not available for the Hong Kongdollar; and (4) the British pound and the Hong Kong dollar tend to move in a similar directionagainst the US dollar. In this case, the US firm could effectively hedge this position by using thepound as a proxy forward. In other words, the US firm can eliminate its exchange risk by pur-chasing the British pound in the forward market.
9.2.5 Swap agreements
Swaps take many forms, but they can be divided into four general categories: currency swaps,credit swaps, interest rate swaps, and back-to-back loans.
CURRENCY SWAPS An agreement between two parties to exchange local currency for hard cur-rency at a specified future date is called a currency swap. In other words, a company purchasesthe specified amount of local currency in the foreign-exchange market and simultaneously buysa forward contract to sell this amount of local currency for hard currency at a future date. Theformer transaction is a spot transaction, and the latter transaction is a forward transaction. Thus,the currency swap is a simultaneous spot and forward transaction. This arrangement allows thecompany to recover the foreign exchange at a predetermined exchange rate.
To see how a currency swap works, assume that a US parent company wants to lend Britishpounds to its British subsidiary and to avoid foreign-exchange risk. The parent company wouldbuy pounds in the spot market and lend them to the subsidiary. At the same time, the parentfirm would sell the same amount of pounds in exchange for dollars in the forward market forthe period of the loan. The parent company would receive the loan repayment in terms of poundsfrom the subsidiary at maturity and exchange the pounds with the dollars to close the forwardcontract. Alternatively, the US parent could enter into a swap agreement with a foreign-exchangedealer whereby they trade dollars for pounds now and pounds for dollars at maturity.
CREDIT SWAPS This hedging device is similar to the foreign-currency swap. The credit swaparrangement is a simultaneous spot and forward loan transaction between a private company anda bank of a foreign country. Suppose that an American company deposits a given amount ofdollars in the New York office of a Colombian bank. In return for this deposit, the bank lendsa given amount of pesos to the company’s subsidiary in Colombia. The same contract providesthat the bank could return the initial amount of dollars to the company on a specified date, andthat the subsidiary could return the original amount of pesos to the bank on the same day. Byso doing, the American company recovers the original dollar amount of its deposit, and theColombian bank obtains a free hard-currency loan in the United States.
TRANSACTION EXPOSURE MANAGEMENT 231

232 MANAGING TRANSACTION EXPOSURE AND ECONOMIC EXPOSURE
Example 9.4
A subsidiary in Israel requires the Israel shekel equivalent of $1 million at the currentexchange rate of NIS4 per dollar, or NIS4 million. To obtain NIS4 million for the subsidiaryin Israel, the parent must open a $1 million credit in favor of an Israeli bank. The Israelibank charges the parent 10 percent per annum on the NIS4 million made available to thesubsidiary and pays no interest on the $1 million that the parent has deposited in favor ofthe bank. The parent’s opportunity cost on the $1 million deposit is 20 percent.
The total cost of this swap consists of the parent’s opportunity cost and the interestcharge on the local currency loan. The opportunity cost at 20 percent on the $1 million is$200,000 and the 10 percent interest on the NIS4 million (NIS400,000) is $100,000 at theprevailing rate of NIS4 per dollar. Thus, the total swap cost is $300,000 on a loan equiva-lent of $1 million, or 30 percent. This example suggests that a direct loan costs the parent20 percent while the credit swap costs it 30 percent. The parent cannot choose betweenthese two alternatives solely on the basis of comparative costs, because the direct loan isunhedged while the credit swap is hedged. The meaningful comparison of the two lendingalternatives requires the parent to explicitly consider foreign-exchange fluctuations. Thedirect loan is 10 percent cheaper only if the exchange rate stays the same.
If the MNC is unable to predict future exchange rate changes with a fair degree of accu-racy, it may attempt to identify the future exchange rate that equates the cost of the creditswap with the cost of the direct loan; that is, the exchange rate at which the MNC wouldbe indifferent between the two financing alternatives. Assume that this exchange rate isdenoted by y. The cost of the direct loan from the parent consists of 200,000y, which equalsthe Israeli shekel cost equivalent of the direct loan ($1 million ¥ 20 percent) plus (1,000,000y— 4,000,000), which equals the potential foreign-exchange loss from the repayment of theloan principal ($1 million). The cost of the credit swap consists of 200,000y, which equalsthe Israeli shekel cost equivalent of the $1 million deposited in favor of the Israeli bank plus400,000, which equals the interest paid on the NIS4 million loan extended by the Israelibank at 10 percent per annum. Because the cost of the direct loan and the cost of the creditswap are the same at the exchange rate of y, we obtain:
If the MNC company believes that the foreign-exchange rate will not deteriorate to theequilibrium exchange rate of NIS4.4 per dollar, it should choose the unhedged alternative,which will be less costly. It should select the hedged alternative whenever its subjectiveassessment indicates that there is a significant chance for the foreign-exchange rate to dete-riorate beyond NIS4.4 per dollar.
direct loan cost200,000
credit swap cost200,000y y y
y
+ -=
+=
( , , , , ) ,
.
1 000 000 4 000 000 400 000
4 4

INTEREST RATE SWAPS This device can be used to alter the exposure of a portfolio of assets orliabilities to interest rate movements. An interest rate swap is a technique whereby companiesexchange cash flows of a floating rate for cash flows of a fixed rate, or exchange cash flows of afixed rate for cash flows of a floating rate. Interest rate swaps are actively used when companieshave costs of debt that are fixed but revenues that vary with the level of interest rates.
Take the example of a French company that borrowed $100 million from the Bank of Americaa year ago at 9.5 percent. The long-term interest rate in the USA has started to fall and the Frenchcompany believes that it will continue to fall. To take advantage of this drop in interest rates, theFrench company decides to enter an interest rate swap in dollars. It swaps $100 million with afixed rate of 9.5 percent for $100 million with a floating rate equal to a 6-month SDR rate. Ineffect, the French company is now protected against a downward movement in interest rates.Conversely, a reverse swap is arranged if the French company believes that the US interest ratewill increase.
BACK-TO-BACK LOANS Back-to-back loans, or parallel loans, are arranged by two parent com-panies in two different countries. Suppose that a US parent has a subsidiary in Japan and that aJapanese parent has a subsidiary in the USA. Let us further assume that each parent wants tolend to its subsidiary in the subsidiary’s currency. These loans can be arranged without using theforeign-exchange market. The US parent lends the agreed amount in dollars to the Americansubsidiary of the Japanese parent. In return for this loan, the Japanese parent lends the sameamount of money in yen to the Japanese subsidiary of the American parent. Parallel loan agree-ments involve the same amount of loan and the same loan maturity. Of course, each loan isrepaid in the subsidiary’s currency. The parallel loan arrangement avoids foreign-exchange riskbecause each loan is made and repaid in one currency.
There are a number of variations on this basic swap scheme. A variation may involve blockedfunds. Assume that General Motors (GM) and IBM have their subsidiaries in Colombia. TheColombian subsidiary of GM has idle pesos but cannot remit to the USA because of Colombianrestrictions on the remittance of funds. On the other hand, the Colombian subsidiary of IBMneeds peso loans for expansion. In this case, in Colombia the GM subsidiary lends pesos to theIBM subsidiary; while in the USA, IBM lends dollars to GM.
9.3 Economic Exposure Management
Companies can easily hedge translation and transaction exposures, because these risks are basedon projected foreign-currency cash flows. However, it is very difficult, if not impossible, for com-panies to hedge economic exposure for several reasons. The scope of economic exposure is broad,because it can change a company’s competitiveness across many markets and products. Acompany always faces economic risks from competition. When based in foreign currencies, therisks are long term, hard to quantify, and cannot be dealt with solely through financial hedgingtechniques.
As a result, international financial managers should assess economic exposure comprehensively.Their analysis should account for how variations in exchange rates influence: (1) a company’ssales prospects in foreign markets (the product market); (2) the costs of labor and other inputsto be used in overseas production (the factor market); and (3) the home-currency value of finan-
ECONOMIC EXPOSURE MANAGEMENT 233

cial assets and liabilities denominated in foreign currencies (the capital market). Consequently,those techniques used to eliminate translation and transaction risks — forwards, money markets,options, swaps, leads and lags of intersubsidiary accounts, and transfer pricing adjustments —are not feasible for hedging economic exposure.
Economic exposure management is designed to neutralize the impact of unexpected exchangerate changes on net cash flows. Diversified operations and financing can reduce economic expo-sure. They permit the MNC to react to those opportunities that disequilibrium conditions inthe foreign-exchange, capital, and product markets present. Moreover, diversification strategiesdo not require that management predict disequilibrium conditions. Still, they require that it rec-ognize them when they occur. In other words, the primary technique to minimize economic riskis strategic management in choosing product markets, pricing policies, promotion, and invest-ment and financing alternatives.
When managing economic exposure, MNCs resort to maneuvers across functional areas ofoperations. The functional areas of business operations for MNCs are production, marketing,and finance. Production and marketing are clearly critical because they determine a company’sexistence – its ability to produce products and to sell them at a profit. But finance is an integralpart of total management and cuts across functional boundaries.
Economic exposure management depends on the assumption that disequilibrium conditionsexist in national markets for factors of production, products, and financial assets. For example,consider the cases in which there are temporary deviations from purchasing power parity and theinternational Fisher effect. Companies could observe changes in comparative costs, profitmargins, and sales volume in one country compared to another.
9.3.1 Diversified production
Several production strategies can deal with economic exposure when disequilibrium conditionsexist: (1) plant location, (2) input mix, (3) product sourcing, and (4) productivity increase.
First, companies with manufacturing facilities in many countries can quickly lengthen theirproduction runs in one country and shorten them in another in line with the changing currencycosts of production. Second, well-managed companies can substitute their input mix betweendomestic and imported inputs, depending on the relative prices of inputs and the degree of pos-sible substitution. Third, well-diversified companies can make shifts in sourcing raw materials,components, and products in accordance with currency value fluctuations. Fourth, companiesassaulted by wide swings in currency values can improve productivity by closing inefficient plants,automating production processes, and negotiating concessions from unions.
9.3.2 Diversified marketing
Marketing programs are normally adjusted only after changes in exchange rates. Yet marketinginitiatives under conditions of exchange rate changes can obtain competitive leverage by meansof: (1) product strategy, (2) pricing strategy, (3) promotional options, and (4) market selection.
First, product differentiation, diversification, and deletions reduce the impact of exchange ratefluctuations on worldwide corporate earnings. Second, prices may be adjusted to cope with theconsequences of currency-value changes. A pricing strategy is affected by a variety of factors such
234 MANAGING TRANSACTION EXPOSURE AND ECONOMIC EXPOSURE

as market share, profit margin, competition, and price elasticity. Third, the size of promotionalbudgets for advertising, personal selling, and merchandising could be adjusted to reflect changesin currency values. For example, a devaluation of the Japanese yen may well be the time to increasea US company’s advertising budget in Japan. Fourth, a worldwide distribution system enablescompanies to neutralize the impact of unexpected exchange rate changes on overall company revenues.
9.3.3 Diversified financing
On the financial side, additional tools to protect against economic risk are the currency denom-ination of long-term debt, the place of issue, the maturity structure, the capital structure, andleasing versus buying. For example, LSI Logic, a manufacturer of custom-made microchips basedin California, uses four financial instruments: (1) equity markets in London and other Europeanmarkets; (2) Japanese equity through institutional investors such as Nomura Securities; (3) localJapanese credit markets through its joint venture partners; and (4) Eurobond issues through Swissand US securities firms.
Diversified financing sources allow a company to improve its overall financial performancebecause interest rate differentials do not always equal expected changes in exchange rates. In addi-tion to taking advantage of unexpected differentials in diversified markets, companies reduce eco-nomic risk by matching the mix of currencies in loan portfolios or operating expenses to the mixof currencies in expected revenues.
9.3.4 A summary of economic exposure management
Purely domestic companies do not have as many options for reacting to international disequi-librium conditions as MNCs. International diversification neutralizes the impact of unexpectedexchange rate changes on corporate cash flows. Exchange rate changes under conditions of dis-equilibrium are likely to increase competitiveness in some markets and to reduce it in others.However, at least one serious constraint may limit the feasibility of a diversification strategy: com-panies with worldwide production systems may have to relinquish large economies of scale.However, these companies could still diversify sales functions and financing sources.
9.4 Currency Exposure Management Practices
9.4.1 The relative importance of different exchange exposures
Table 9.2 shows the relative importance of different exchange exposures from two perspectives:the amount of attention given to each exposure and hedging preference for each exposure. Asurvey of 125 US MNCs by Malindretos and Tsanacas (1995) revealed that transaction expo-sure was the overwhelming choice of chief financial officers (CFOs) in terms of the attentionthat it must receive, with 64 percent ranking it as the most important one. Twenty-six percentof these CFOs picked economic exposure as their number one choice, while only 13 percentconsidered translation exposure as their most important exposure. A survey of large US MNCs
CURRENCY EXPOSURE MANAGEMENT PRACTICES 235

by Business International and Arthur Andersen & Co. found that 65 percent of the sample com-panies hedged their transaction exposure, while only 26 percent hedged their translation expo-sure. Apparently, not many executives of MNCs think that they should hedge paper gains andlosses for translation exposure and potential exchange gains and losses from future operations(economic exposure). In addition, these executives do not pay too much attention to these twotypes of exposure, because they believe that these exposures are not as important as transactionexposure.
9.4.2 The use of hedging techniques by MNCs
Burston-Marsteller, a consulting firm in currency risk management, conducted a survey of 110chief financial officers at a November 1997 CFO forum in Manila, Philippines. Figure 9.1 showsthat these CFOs consider foreign-exchange risk (38 percent) as the most important one amongthe many risks that they face. The next most frequently cited risks are interest rate risk (32percent) and political risk (10 percent). Other risks (20 percent) consist of credit risk at 9 percent,liquidity risk at 7 percent, and inflation risk at 4 percent.
Figure 9.1 also shows that the traditional forward contract was the most commonly usedinstrument to manage foreign-exchange risks. Of all respondents, 42 percent used the forwardcontract as the primary hedging instrument. Four other hedging techniques discussed in part IIof this book – currency swaps, interest rate swaps, currency options, and futures – were almostequally used by these respondents. Another recent survey by Jesswein et al. (1995) also foundthat the forward contract is the most popular hedging instrument. In addition, their other find-ings confirm most of the Burston-Marsteller survey results.
9.4.3 A maturity mismatch in MGRM’s oil futures hedge
Metallgesellschaft (MG) is Germany’s 14th largest industrial company, with interests in engi-neering, metals, and mining. In early 1994, the US subsidiary of the company, MGRM, reportedthe world’s largest derivative-related losses — $1.3 billion from its positions in energy futuresand swaps. This incident brought MG to the brink of bankruptcy. After dismissing the company’schief executive officer and several other senior managers, MG’s board of supervisors was forcedto negotiate a $1.9 billion rescue package with the company’s 120 creditor banks. Many analysts
236 MANAGING TRANSACTION EXPOSURE AND ECONOMIC EXPOSURE
Table 9.2 The relative importance of different exchange exposures
Type of exposure Most important exposure Hedging preference
Translation exposure 13% 26%Transaction exposure 64% 65%Economic exposure 26% 39%
Sources: J. Malindretos and D. Tsanacas, “Hedging Preferences and Foreign Exchange Exposure Manage-ment,” Multinational Business Review, Fall 1995, pp. 56–66; and D. M. Perkins, “Treasury. Accounting MustWork Together to Fashion Foreign Exchange Hedging Strategy,” Corporate Cashflow, Jan. 1993, pp. 34–6.

remain puzzled over how a company could lose over $1 billion by hedging. This debacle hassparked a lively debate on the drawbacks of the company’s hedging strategy and on the lessonsto be learned from the incident.
In 1992, MGRM began to implement an aggressive marketing program in which it offeredlong-term customers firm price guarantees for up to 10 years on gasoline, heating oil, and dieselfuel. These long-term price guarantees included: (1) firm-fixed contracts that guaranteed a setprice over the life of the contract; (2) firm-flexible contracts with prices that fluctuated with spotoil prices; and (3) guaranteed margin contracts that pegged the price of refined oil products toprices paid by local competitors. Through these contracts, MGRM had assumed most of the oilprice risk of its customers.
To hedge the risk of these delivery obligations, MGRM bought a combination of short-datedoil swaps and futures contracts as part of a strategy known as a “stack-and-roll” hedge. In its sim-plest form, a stack-and-roll hedge involves repeated purchases of a stack of near-term futures con-tracts to hedge a long-term exposure. In other words, the long (buy) position was rolled overeach month into the next month’s contract. MGRM used a one-to-one hedging strategy in whichlong-term obligations were hedged dollar-for-dollar with positions in near-term oil futures con-tracts.
As discussed in chapter 6, market gains or losses from fluctuations in the price of futures con-tracts are debited or credited on a daily basis to protect market participants against the possibil-ity of contract default. Had oil prices risen, the accompanying gain in the value of MGRM’sfutures contracts would have produced positive cash flows; this gain in turn would have offsetlosses arising from its commitments to deliver oil at below-market prices. However, short-termcash drains must be incurred to meet margin calls when futures prices fall. Margin calls are abroker’s request for additional money to restore the margin account to a certain minimum level.As it happened, oil prices fell sharply in 1993.
Significantly lower oil prices in 1993 caused MGRM to incur huge unrealized losses and sub-sequent margin calls on its derivative positions. After several consecutive months of falling oilprices during the latter part of 1993, MGRM’s German parent liquidated its hedge and realizedlosses in excess of $1 billion. The mismatch between the long-term delivery obligations of oil
CURRENCY EXPOSURE MANAGEMENT PRACTICES 237
Foreign exchange38%
Interest rate32%
Other20%
(a) Current business risks (b) Hedging instruments used
Forwardcontracts
Cross-currency swaps
Interestrate swaps
Currencyoptions
Futures 11%
11%
18%
18%
42%
Political10%
Figure 9.1 Survey results of 110 chief financial officersSource: The Wall Street Journal, Nov. 19, 1997, p. A18; reprinted by kind permission.

and the short-term long position in oil futures created chaos for MGRM. In other words, fluc-tuations in the price of short-dated futures contracts resulted in widely fluctuating short-termcash flow needs that did not match the maturity of MGRM’s long-term contracts.
238 MANAGING TRANSACTION EXPOSURE AND ECONOMIC EXPOSURE
SUMMARY
This chapter has discussed two foreign-exchange exposures and their management. Every singlecompany faces an exposure to gain or loss from changes in exchange rates, because globalization istotally reshaping the way we live and do business. Transaction exposure refers to possible gains orlosses that may result from the settlement of transactions whose payment terms are stated in aforeign currency. Economic exposure measures the total impact of exchange rate changes on a firm’sprofitability.
In essence, a hedge or a cover is a type of insurance that provides security against the risk of lossfrom a change in exchange rates. When devaluation seems likely, the MNC must determine whetherit has any unwanted net exposure to foreign-exchange risk. When the company finds that it has anunwanted net exposure to exchange risk, it can use a variety of operational techniques and finan-cial instruments to reduce this net exposure. These include the forward market hedge, the moneymarket hedge, the options market hedge, swaps, and others. These financial instruments are pri-marily used to minimize transaction exposures. Economic exposure can be managed by balancingthe sensitivity of revenues and expenses of changes to exchange rates through diversification andstrategic planning.
Questions
1 Explain the conditions under which items and/or transactions are exposed to foreign-exchange risks.
2 This chapter has discussed transaction exposure and economic exposure. Briefly explaineach of these two types of exposure.
3 How should appreciation of a company’s home currency affect its cash inflows? Howshould depreciation of a company’s home currency affect its cash inflows?
4 What should management do to protect assets adequately against risks from exchangerate fluctuations?
5 What are the two major types of hedging tools?6 Which exposure is more difficult to manage: transaction exposure or economic exposure?7 How could a US company hedge net payables in Japanese yen in terms of forward and
options contracts?8 How could a US company hedge net receivables in Japanese yen in terms of forward and
options contracts?

PROBLEMS 239
9 Are there any special situations in which options contracts are better than forward con-tracts or vice versa?
10 What are the major problems of economic exposure management?11 What is the basic purpose of economic exposure management?12 How do most companies deal with their economic exposure?
Problems
1 A US company negotiated a forward contract to buy 100,000 British pounds in 90 days.The company was supposed to use the £100,000 to buy British supplies. The 90-dayforward rate was $1.40 per pound. On the day the pounds were delivered in accordancewith the forward contract, the spot rate of the pound was $1.44. What was the real costof hedging the pound payables in this example?
2 Boeing sells an airplane to Korean Airlines for 840 million won with terms of 1 year. Boeingwill receive its payment in Korean won. The spot rate for the Korean currency is 700 wonper dollar and Boeing expects to exchange 840 million won for $1.2 million (840 million∏ 700) when payment is received.(a) If the spot rate for won rises to 600 won per dollar 1 year from today, what is the
potential transaction gain or loss?(b) If the spot rate for won declines to 1,000 won per dollar at maturity, what is the
potential transaction gain or loss?3 For the coming year, a Singapore subsidiary of an American company is expected to earn
an after-tax profit of S$25 million and its depreciation charge is estimated at S$5 million.The exchange rate is expected to rise from S$2.00 per dollar to S$1.5 per dollar for thenext year.(a) What is the potential economic gain or loss?(b) If the anticipated business activity were to stay the same for the next 3 years, what
would be the total economic gain or loss for 3 years?4 A US company purchased several boxes of watches from a Swiss company for SFr300,000.
This payment must be made in Swiss francs 90 days from today. The following quotationsand expectations exist:
90-day US interest rate 4.00%90-day Swiss interest rare 3.00%90-day forward rate for francs $0.400Spot rate for francs $0.404
Would the company be better off using the forward market hedge or the money markethedge?

240 MANAGING TRANSACTION EXPOSURE AND ECONOMIC EXPOSURE
5 For the coming year, a British subsidiary of an American company is expected to incur anafter-tax loss of £50 million and its depreciation charge is estimated at £10 million. Theexchange rate is expected to rise from $1.5 per pound to $1.7 per pound for the nextyear. What is the potential economic gain or loss?
6 A US company has bought a number of TV sets from a Japanese company for ¥100,000.This payment must be made in Japanese yen 180 days from today. The following quota-tions and expectations exist:
Present spot rate $0.0050180-day forward rate $0.0051Japanese interest rate 7.00%US interest rate 11.00%Highest expected spot rate 180 days hence $0.0052Lowest expected spot rate 180 days hence $0.0046
The US company does not have any idle dollar balances at present, but it expects to haveadequate cash in 180 days. Identify the alternatives available for making payment.
7 An American firm has just sold merchandise to a British customer for £100,000, withpayment in British pounds 3 months from now. The US company has purchased from itsbank a 3-month put option on £100,000 at a strike price of $1.6660 per pound and apremium cost of $0.01 per pound. On the day the option matures, the spot exchange rateis $1.7100 per pound. Should the US company exercise the option at that time or sellBritish pounds in the spot market?
8 Assume that a subsidiary in New Zealand needs NZ$500,000 and that a credit swap hasbeen proven the least costly hedged alternative. Further assume that the best unhedgedalternative is the direct loan from the parent and that the cost of the direct loan is 20percent. The current exchange rate is $0.5000 per New Zealand dollar. To obtainNZ$500,000 for the subsidiary in New Zealand, the parent must open a $250,000 credit($0.5000 ¥ NZ$500,000) in favor of a New Zealand bank. The New Zealand bank charges10 percent per year on the NZ$500,000 made available to the subsidiary and pays nointerest on the $250,000 deposit that the parent has deposited in the bank.(a) What is the exchange rate that would make the direct loan and the credit swap
equally attractive?(b) If most market analysts predict that the exchange rate will be NZ$2 per dollar in 180
days, which alternative would you recommend?(c) If most market analysts predict that the exchange rate will be NZ$3 per dollar in 180
days, which alternative would you recommend?(d) If the New Zealand bank should pay 5 percent interest on the $250,000 credit, what
is the exchange rate that would make the direct loan and the credit swap equallyattractive?

CASE PROBLEM 9 241
REFERENCES
Belk, P. A., “The Organization of Foreign ExchangeRisk Management: A Three-Country Study,”Managerial Finance, Vol. 28, No. 11, 2002, pp.43–52.
Brown, G., “Managing Foreign Exchange Risk withDerivatives,” Journal of Financial Economics,May/June 2001, pp. 406–48.
Choi, J. J., “Diversification, Exchange Risk, andCorporate International Investment,” Journal ofInternational Business Studies, Spring 1989, pp.145–55.
DeVries, M. G., “The Magnitude of ExchangeDevaluation,” Finance and Development, No. 2,1968, pp. 8–16.
Giddy, I. H., “The Foreign Exchange Option as aHedging Tool,” Midland Corporate Finance, Fall1983, pp. 32–43.
Giddy, I. H. and G. Dufey, “The Random Behav-ior of Flexible Exchange Rates,” Journal of Inter-national Business Studies, Spring 1975, pp. 1–32.
Jesswein, K., C. Y. Kwock, and W. Folks, “Corpo-rate Use of Foreign Exchange Risk ManagementProducts,” Columbia Journal of World Business,Fall 1995, pp. 70–82.
Kuprianov, A., “Derivatives Debacles: Case Studiesof Large Losses in Derivatives Markets,” EconomicReview, Federal Reserve Bank of Richmond, Fall1995, pp. 1–39.
Landers, P., “Sony’s Net Falls 25%, UnderliningStrong Yen’s Impact on Exports,” The Wall StreetJournal, Oct. 28, 1999, p. A21.
Malindretos, J. and D. Tsanacas, “Hedging Prefer-ences and Foreign Exchange Exposure Manage-ment,” Multinational Business Review, Fall 1995,pp. 56–66.
Perkins, D. M., “Treasury. Accounting Must WorkTogether to Fashion Foreign Exchange HedgingStrategy,” Corporate Cashflow, Jan. 1993, pp.34–6.
Case Problem 9: Western Mining’s EconomicExposure Management
Western Mining Company (WMC) is an Australia-based minerals producer with business inter-ests in 19 countries. It is the world’s third largest nickel producer, owns 40 percent of theworld’s largest alumina producer (Alcoa World Alumina and Chemicals), and is a major pro-ducer of copper, uranium, gold, fertilizer, and talc. WMC builds its business on large, low-cost,and long-life assets that are globally competitive.
Most commodities produced by Australian mining companies, including WMC, are exportedand priced in US dollars. Thus, these companies would suffer significantly and their Australiandollar revenue would drop if the Australian dollar appreciated sharply against the US dollar.Given such an exposure, the conventional wisdom held that borrowing in US dollars wouldprovide a “natural” hedge against their dollar revenue stream. When forward markets beganto develop in the mid-1970s, Australian mining companies often hedged up to 100 percent offorecasted revenues with a combination of debt servicing and forward contracts — often forperiods up to 10 years. In the early and mid-1980s, the Australian dollar declined sharplyagainst the US dollar, and the “natural” hedge proved not to be a hedge at all, but rather anuncovered short position in the US dollar. As expected, the decline in the Australian dollar

242 MANAGING TRANSACTION EXPOSURE AND ECONOMIC EXPOSURE
increased the cost of serving US dollar debt. And those companies that had also sold forwardtheir expected dollar revenue stream also suffered further foreign-exchange losses as thesecontracts matured. The positive effect of the stronger US dollar on dollar-denominated rev-enues was offset by a prolonged slump in mineral commodity prices.
Although WMC also experienced some currency losses, it fared better than many of itscompetitors for two reasons. First, it had relied more on the equity markets to finance capitalexpenditures. Second, it had not participated in new major projects in the early 1980s. In1984, however, the company contemplated investment in a new copper, uranium, and goldmine, with capital costs expected to be about $750 million. Under arrangements with a jointventure partner, the company planned to finance its share of the mine solely with debt, therebyincreasing its total debt by a magnitude of two or three times.
When confronted with the need to decide the currency denomination of the debt, WMCconcluded that taking a short position in US dollars, whether by borrowing or selling forwards,would not stabilize the volatility of its home-country operating profits. Consequently, WMCdecided to borrow in a basket of currencies that included Australian dollars, US dollars, Japan-ese yen, British pounds, and deutsche marks. The company also decided to discontinue itspractice of selling forward US dollar revenues, except when actual sales had been made.
Case Questions
1 Evaluate the pros and cons of various exchange-hedging instruments and techniques.2 What are the different types of foreign-exchange risk that WMC will encounter?3 Explain why borrowings in US dollars and forward sales of US dollar revenues by Aus-
tralian mining companies in the 1980s had backfired.4 Explain why WMC decided to borrow in a basket of currencies rather than exclusively in
US dollars or Australian dollars.5 What are two possible ways to hedge economic exposure?6 Explain why WMC decided not to hedge its economic exposure (i.e., future US-dollar rev-
enues).7 The websites for various multinational companies disclose exchange rate hedging activi-
ties and their exchange gains or losses. (Hint: see footnotes of annual reports.) On thebasis of the website of WMC, www.wmc.com.au, or the website of IBM, www.ibm.com,describe the management of foreign-exchange risk for either company.
Sources: N. Abuaf, “The Nature and Management of Foreign Exchange Risk,” Journal of Applied CorporateFinance, Fall 1986, pp. 39–44; P. J. Maloney, “Managing Currency Exposure: The Case of Western Mining,”Journal of Applied Corporate Finance, Winter 1990, pp. 29–34; WMC’s Annual Reports, various issues; andwww.wmc.com.au.

Opening Case 10: Main Features of Accounting Exposure
Translation exposure has these main features:1 Because accounting exposure, commonly known as translation exposure, is
based on book values only, it does not reflect the true economic value acompany has at risk. By the same token, the gains and losses of foreign-exchange trading as measured by this concept bear no relationship to the realimpact exchange rate changes have on the value of the firm itself. They arepurely of a paper nature.
2 In connection with the above feature, accounting exposure is incapable ofencompassing the various and complex ways in which exchange rate changeswill really affect a company.
3 Accounting exposure is a function of the method used in translating foreign-currency financial statements. The application of different translation methodsmay lead to very different account exposures and to different bases for cor-porate decision-making.
4 Accounting exposure is a concept that is static and historically oriented ratherthan dynamic and geared toward the future; in other words, it measures assetsand liabilities for given past dates instead of flows of currencies over futureperiods of time. Under this accounting concept, the exposure of two compa-nies may show exactly the same values although they can be in different eco-nomic situations and would be affected differently by exchange rate changes.
Source: Martin Glau, “Strategic Management of Exchange Rate Risks,” Long Range Planning, Aug.1990, pp. 65–71.
CHAPTER 10
Translation ExposureManagement

Translation exposure, sometimes called accounting exposure, measures the effect of an exchangerate change on published financial statements of a firm. Foreign-currency assets and liabilitiesthat are translated at the current exchange rate are considered to be exposed. In accounting terms,the difference between exposed assets and exposed liabilities is frequently called net exposure. Ifexposed assets are greater than exposed liabilities, foreign-currency depreciations will result inexchange losses and foreign-currency appreciations will produce exchange gains. On the otherhand, if exposed assets are smaller than exposed liabilities, foreign-currency depreciations willlead to exchange gains and foreign-currency appreciations will lead to exchange losses.
This chapter has three major sections. The first section discusses four translation rules com-monly used by multinational companies (MNCs) to consolidate their worldwide operations intohome currency. The second section analyzes major differences between two major translationrules: FASB 8 and FASB 52. The third section considers some techniques designed to reducetranslation risk.
10.1 Translation Rules
Before we discuss translation rules, we will look at a numerical example to see how net exchangegains or losses occur.
244 TRANSLATION EXPOSURE MANAGEMENT
Example 10.1
A US parent company has a single wholly owned subsidiary in Malaysia. This subsidiary hasexposed assets of 100 million ringgits and exposed liabilities of 50 million ringgits. Theexchange rate declines from M$4 per dollar to M$5 per dollar.
The potential foreign-exchange loss on the company’s exposed net assets of 50 millionringgits would be $2.5 million:
Exposed assets M$100 millionExposed liabilities -50 million
Net exposure M$ 50 million
Predevaluation rate (M$4 = $1) M$50 million = $12.5 millionPostdevaluation rate (M$5 = $1) M$50 million = -$10.0 million
Potential exchange loss $2.5 million
These translation gains and losses do not involve actual cash flows because they are onlytranslated into dollars, not converted into dollars. In other words, they are purely of a paper nature. Some companies are concerned about this risk, because it affects their abilityto raise capital, the cost of capital, their earnings per share, their stock price, and key finan-cial ratios.

10.1.1 The current/noncurrent method
In using this, one assumes that financial-statement accounts should be grouped according tomaturity. Under the current/noncurrent method, all current assets and current liabilities offoreign affiliates are translated into the parent currency at current exchange rates. All noncurrentassets, noncurrent liabilities, and owners’ equity are translated at historical exchange rates.
10.1.2 The monetary/nonmonetary method
Under the monetary/nonmonetary method, monetary assets and monetary liabilities are trans-lated at current exchange rates. Nonmonetary assets, nonmonetary liabilities, and owners’ equityare translated at historical rates. Monetary assets include cash, accounts receivable, and notesreceivable. Nonmonetary assets include inventory and fixed assets. In general, all liabilities aremonetary liabilities.
10.1.3 The temporal method
Under generally accepted accounting principles of historical accounting in the United States, thetemporal method produces essentially the same results as the monetary/nonmonetary method.The only difference is that under the monetary/nonmonetary method, inventory is always trans-lated at the historical rate. Under the temporal method, inventory is usually translated at the his-
TRANSLATION RULES 245
Financial statements are intended to present information about the performance, finan-cial position, and cash flows of a company. To meet this purpose, the financial statementsof separate entities within a business enterprise are consolidated and presented as thoughthey were the financial statements of a single economic entity. Financial statements are fre-quently restated or translated from one currency into another to assist the users of the finan-cial statements, such as investors and creditors.
Accounting for foreign-currency translation is undoubtedly one of the most controver-sial technical issues facing MNCs. Many of the problems associated with currency transla-tion derive from the fact that foreign-exchange rates, used to carry out the translationprocess, are seldom fixed. Consequently, actual operating results can vary, often markedly,from reported results because of differences in the translation rates employed. This is whyforeign-currency translation has become even more controversial and important since 1973,when the flexible exchange rate system was established. This flexible exchange system abol-ished the old fixed exchange rate system that was established in 1944, on the basis of theBretton Woods Agreement.
If exchange rates have changed since the previous accounting period, the translation offinancial statement items denominated in foreign currencies will result in foreign-exchangegains or losses. The possible extent of these gains or losses often depends on the rules thatgovern translation. The four translation methods most widely used by MNCs arecurrent/noncurrent, monetary/nonmonetary, temporal, and current rate.

torical rate, but it could be translated at the current rate if inventory is carried at market pricesor at replacement costs.
10.1.4 The current-rate method
The current-rate method is the simplest; all assets and liabilities are translated at the currentrate. Existing equity accounts such as common stock and paid-in capital are translated at the his-torical rate.
10.1.5 A comparison of the four translation methods
All financial-statement items restated in terms of the parent currency are the foreign-currencyamount multiplied by the appropriate exchange rate. Table 10.1 compares the four translationmethods – current/noncurrent, monetary/nonmonetary, temporal, and current-rate – in termsof the exchange rate for each balance-sheet item.
246 TRANSLATION EXPOSURE MANAGEMENT
Table 10.1 Exchange rates used to translate balance-sheet items
Current/ Monetary/Balance-sheet accounts noncurrent nonmonetary Temporal Current-rate
Cash C C C CReceivables C C C CPayables C C C CInventory C H H or C CFixed assets H H H CLong-term debt H C C CNet worth H H H H
Note: C represents the current rate and H represents the historical rate.
Example 10.2
Assume that a foreign subsidiary of a US MNC has the following (FC = functional currency):(1) cash = FC100; (2) accounts receivable = FC150; (3) inventory = FC200; (4) fixed assets= FC250; (5) current liabilities = FC100; (6) long-term debt = FC300; and (7) net worth =FC300. Let us further assume that the historical exchange rate is $2 = FC1, the currentexchange rate is $1 = FC1, and inventory is carried at market prices. Remember that thefunctional currency depreciates from $2 per FC to $1 per FC.
Table 10.2 illustrates the effect of each translation method on the balance sheet.Exchange gains or losses are shown here as a separate plug (balancing) account to show

10.2 FASBs 8 and 52
The accounting profession has recognized the growing importance of foreign-currency transac-tions and/or foreign operations. In October 1975, the Financial Accounting Standards Board(FASB) issued its Statement 8, Accounting for the Translation of Foreign Currency Transactions andForeign Currency Financial Statements. FASB 8 formerly required US companies to translate theirforeign-currency financial statements into dollars by applying the appropriate exchange rate tothe measurement basis of each account; the appropriate exchange rate may be the historical rate,the current rate, or the average rate. This statement also requires companies to show all foreign-exchange gains or losses in their quarterly and annual income statements, regardless of whetherthese gains or losses were realized or unrealized.
FASB 8 was a product of considerable effort, including extensive exposure drafts and discus-sion memoranda, by the FASB to resolve the translation issue. However, from its inception inautumn 1975, FASB 8 was the subject of extensive debate; most of the criticism centered on rec-ognizing foreign-exchange gains or losses. Companies claimed that FASB 8 grossly distorted theirearnings because of the sharp fluctuations in foreign-exchange rates. The FASB issued its State-ment 52, Foreign Currency Translation, on December 7, 1981. FASB 52 supersedes FASB 8. In1982, US companies were allowed to utilize either FASB 8 or FASB 52. Ford used FASB 52 in1982 to exclude its translation loss of about $220 million from the income statement. In the
FASBS 8 AND 52 247
Table 10.2 A comparison of the four translation methods
Foreign Current/ Monetary/ Current-Accounts currency noncurrent nonmonetary Temporal rate
Cash FC100 1 $100 1 $100 1 $100 1 $100Receivables 150 1 150 1 150 1 150 1 150Inventory 200 1 200 2 400 1 200 1 200Fixed assets 250 2 500 2 500 2 500 1 250
Total FC700 $950 $1,150 $950 $700
Current debts FC100 1 $100 1 $100 1 $100 1 $100Long-term debt 300 2 600 1 300 1 300 1 300Net worth 300 2 600 2 600 2 600 2 600Gains (losses) - (350) 150 (50) (300)
Total FC700 $950 $1,150 $950 $700
how they would be derived. However, in actual practice net worth would be used as a plugfigure, or exchange gains and losses would be closed out to retained earnings.
Under the current/noncurrent method, an exchange loss of $350 is recorded, becausecurrent assets are greater than current liabilities. On the other hand, under the mone-tary/nonmonetary method, an exchange gain of $150 is recorded, because monetary lia-bilities exceed monetary assets. Under the current-rate method, the exchange loss is $300for two reasons: (1) all accounts except net worth are translated at the current exchangerate; and (2) exposed assets are greater than exposed liabilities.

same year, General Motors employed FASB 8 to include its translation gain of about $384 millionin the income statement.
FASB 52 requires the use of the current exchange rate in translating foreign-currency finan-cial statements into US dollars. Such translation adjustments are placed directly in stockholders’equity rather than income. Thus, FASB 52 has substantially reduced fluctuations in many com-panies’ reported earnings caused by gyrations in foreign-exchange rates under FASB 8.
10.2.1 Functional currency
In this section, two terms are extensively used: parent currency and functional currency. Parentcurrency, sometimes called reporting currency, is the currency of the country where the parentcompany is located. For example, the parent currency of US-based MNCs is the dollar. The func-tional currency, usually called foreign currency or local currency, is the currency of the countrywhere the foreign operation of an MNC is located. The functional currency of an entity, asdefined in FASB 52 (paragraph 39), is “the currency of the primary economic environment inwhich the entity operates; normally, that is the currency of the environment in which an entityprimarily generates and expends cash.”
The term “functional currency” was first used in the translation literature in conjunction withFASB 52. Functional currency is, in fact, a key feature of FASB 52, because it determines thechoice of translation method. This feature is very important, because the translation methodemployed determines the translation rate and the disposition of exchange gains and losses. If theforeign currency is determined to be the functional currency, FASB 52 is used to carry out thetranslation process. On the other hand, if the US dollar is deemed to be the functional currency,FASB 8 is used to remeasure foreign-currency operations in dollars.
Normally, a foreign subsidiary’s functional currency is the currency of the foreign country inwhich it operates and generates net cash flows. For example, a French subsidiary with relativelycontained and integrated operations in France would have the euro as its functional currency.Such translation adjustments do not affect cash flows and are not included in net income. Con-sequently, translation adjustments are placed directly in stockholders’ equity. However, if theFrench subsidiary has some transactions and open-account balances denominated in Swiss francsfrom a Swiss customer, those balances must be restated in euros, and gains or losses must beincluded in the subsidiary’s net income before the statements are translated into US dollars duringthe consolidation process.
The functional currency of an entity is not always identical with the currency of the countryin which the foreign operation is located or the currency of the country in which the records aremaintained. The dollar is the functional currency, and exchange gains or losses must be includedin the net income for those foreign operations whose cash flows directly affect the parent’s USdollar cash flows on a current basis. Such a situation may occur when the foreign entity is merelyan extension of the parent company. In this case, the functional currency is the reporting cur-rency of the parent company. For example, if the Mexican subsidiary of a US parent companyreceived all of its raw materials from the USA and resold all of its output back to the USA, theUS dollar should be the functional currency.
Foreign subsidiaries in countries with runaway inflation are another case in which the report-ing currency is used as the functional currency. FASB 52 (paragraph 11) states that “the finan-cial statements of a foreign entity in a highly inflationary economy shall be remeasured as if the
248 TRANSLATION EXPOSURE MANAGEMENT

functional currency were the reporting currency.” A highly inflationary economy is defined asone that has cumulative inflation of approximately 100 percent or more over a 3-year period.The cumulative inflation for 3 years is a compounded rate; as a result, an annual inflation rateof about 26 percent produces a cumulative inflation of 100 percent over 3 years.
10.2.2 Differences between FASBs 8 and 52
The underlying assumption of FASB 8 was that consolidated financial statements should reflectthe transactions of the consolidated group as though all operations, including foreign operations,were extensions of the parent’s domestic operations. This premise failed to recognize the fact thatin many cases the operations of foreign subsidiaries exist in other environments and involveforeign-currency cash flows in those other environments. Thus, the results of accounting aftertranslation did not correctly portray the foreign-currency cash flows.
FASB 52 is intended to portray foreign-currency cash flows. Companies using the functionalcurrency approach and the current-rate method can maintain compatible income and cash flowsbefore and after translation. Financial summary indicators, such as profit margin, gross profit,and debt-to-equity ratio, are almost the same after translation into the reporting currency as theyare in the functional currency. In addition, the volatility of a company’s reported earnings shouldbe reduced under FASB 52, because its foreign-exchange gains or losses are placed directly instockholders’ equity rather than in income.
10.2.3 Translation of foreign-currency financial statements
FASB 8 had formally required US firms to use the temporal method from 1976 until the FASBreplaced it with FASB 52 in December 1981. According to the temporal method, balance-sheetitems carried at current or future prices should be translated at the current exchange rate, whilebalance-sheet items carried at historical prices should be translated at the applicable historicalrate. Under this method, sales revenue and operating expenses are translated at the averageexchange rate, while cost of goods sold and depreciation are translated at the applicable histori-cal rate. Exchange gains or losses from the translation of the balance sheet should be included inthe income statement.
Under FASB 52, the current exchange rate method is used to translate foreign-currencybalance sheets from their functional currency into the reporting currency. The current exchangerate method is the easiest to apply because under this method, all assets and liabilities are trans-lated at the current exchange rate. Only owners’ equity is translated at the historical exchangerate. Unlike the controversial FASB 8, FASB 52 does not require companies to include transla-tion adjustments in net income. Instead, a company will report these translation adjustmentsseparately and accumulate them in a separate component of equity until it sells or substantiallyliquidates the foreign net investment.
Under FASB 52, all income-statement elements are translated in a manner that producesapproximately the same result as using the exchange rate in effect on the dates on which theseelements are recognized. However, paragraph 12 of FASB 52 provides that “because translationat the exchange rates on the dates the numerous revenues, expenses, gains, and losses are recog-nized is generally impractical, an appropriately weighted average exchange rate for the periodmay be used to translate those elements.”
FASBS 8 AND 52 249

Table 10.3 Translation of foreign-currency operations under FASBs 8 and 52
FASB 8 FASB 52
Canadian Rates US Rates USdollars used dollars used dollars
Balance sheetCash and receivables 100 .75 75 .75 75Inventory 300 .81* 243 .75 225Fixed assets, net 600 .85 510 .75 450
Total 1,000 828 750Current liabilities 180 .75 135 .75 135Long-term debt 700 .75 525 .75 525Common stock 100 .85 85 .85 85Retained earnings 20 83 16Equity adjustments
from translation - -11
Total 1,000 828 750
Income statementRevenue 130 .80 104 .80 104Cost of goods sold -60 .83* -50 .80 -48Depreciation -20 .85* -17 .80 -16Other expenses -10 .80 -8 .80 -8Exchange gain (loss) - 70 -
Income before tax 40 99 32Income tax -20 .80 -16 .80 -16
Net income 20 83 16
RatiosNet income to revenue 0.15 0.80 0.15Gross profit margin 0.54 0.52 0.54Long-term debt to equity 5.83 3.13 5.83
*Historical rates for inventory, cost of goods sold, and depreciation of fixed assets.
250 TRANSLATION EXPOSURE MANAGEMENT
Example 10.3
The Canadian subsidiary of a US multinational corporation with a Canadian dollar functionalcurrency started business and acquired fixed assets on January 1, 2004, when the Canadiandollar/US dollar exchange rate was 0.85. Table 10.3 applies the temporal method and thecurrent exchange rate method to hypothetical financial statements that are affected by an11.8 percent devaluation of the Canadian dollar. For this devaluation, the exchange rate onDecember 31, 2004, was 0.75 and the weighted average rate for the period was 0.80.
Table 10.3 shows that fluctuations in reported earnings in this example are reduced sig-nificantly under FASB 52, because we used a single rate in translating balance-sheet items

10.3 Hedging Translation Exposure
When a devaluation or upvaluation seems likely, a company must determine whether it has anunwanted net exposure to exchange risk. Management’s basic objective with any exposure is tominimize the amount of probable exchange losses and the cost of protection. A hedge is anapproach designed to reduce or offset a possible loss. An arrangement that eliminates translationrisk is said to hedge that risk. A hedge is designed to substitute a known cost of buying protec-tion against foreign-exchange risk for an unknown translation loss. One can use a variety of tech-niques to deal with translation exposure. These techniques consist of one major group of hedgingdevices: a balance-sheet hedge.
10.3.1 The balance-sheet hedge
Balance-sheet hedges are generally employed to minimize translation exposure. A balance-sheethedge involves the selection of the currency in which exposed assets and liabilities are denomi-nated so that an exchange rate change would make exposed assets equal to exposed liabilities. Toattain this objective, a company must maintain the same amount of exposed assets and exposedliabilities in a particular currency. A devaluation would affect both types of balance-sheet accountsequally; thus, the company would suffer neither a gain nor a loss.
When an MNC has several subsidiaries, a variety of funds-adjustment techniques can be usedto reduce its translation loss. These techniques require the company to adopt the following twobasic strategies:
1 The company must decrease soft-currency assets and increase soft-currency liabilities.2 The company must increase hard-currency assets and decrease hard-currency liabilities.
Hard currencies are those currencies that are likely to appreciate; soft currencies are those cur-rencies that are likely to depreciate.
Most techniques for hedging an impending local-currency (soft-currency) devaluation reducelocal-currency assets and/or increase local-currency liabilities to generate local-currency cash. Inorder to reduce translation exposure, these local-currency funds must be converted into hard-
HEDGING TRANSLATION EXPOSURE 251
and reported translation adjustments in equity. Under the new standard, moreover, the netincome of the US parent company is the same as what is expected based on the level ofearnings in Canadian dollars.
Under FASB 52, a translation loss of $11 is the expected economic effect of the Cana-dian dollar, whose value declined against the US dollar. This translation loss of $11 isreported in the balance sheet as “equity adjustments from translation.” On the other hand,FASB 8 required the US parent company to report a translation gain of $70 in the incomestatement.
Under FASB 52, key Canadian-dollar ratios, such as net income to revenue, gross profit,and long-term debt to equity, are maintained after translation from the Canadian dollar tothe US dollar. However, these ratios in the Canadian dollar are significantly different fromthose in the US dollar under FASB 8.

currency assets. This conversion can be accomplished, either directly or indirectly, by a varietyof funds-adjustment techniques. Direct funds-adjustment techniques include pricing exports inhard currencies and imports in the local currency, investing in hard-currency securities, andreplacing hard-currency loans with local-currency loans.
10.3.2 Indirect funds-adjustment methods
A variety of indirect funds-adjustment methods can be used to reduce foreign-currency exposure.
EXPOSURE NETTING MNCs can net certain exposures from different operations around theworld so that they may hedge only their net exposure. For example, when an MNC has bothreceivables and payables in a given foreign currency, these receivables and payables can be offsetthrough netting, which will reduce the amount of foreign-exchange exposure. Exposure nettingis a method of offsetting exposures in one currency with exposures in the same or another cur-rency in such a way that gains or losses on the first exposure will be offset by losses or gains onthe second exposure. Unlike the simple case of exposure netting on a currency-by-currency basisthat we discussed above, MNCs have a portfolio of currency positions. If MNCs want to applyexposure netting aggressively, it helps to centralize their exposure management function in onelocation.
LEADING AND LAGGING Leading and lagging is another operational technique that MNCs canuse to reduce foreign-exchange exposure. Leading means to pay or collect early, whereas laggingmeans to pay or collect late. MNCs should lead soft-currency receivables and lag hard-currencyreceivables to avoid the loss from the depreciation of the soft currency and to obtain the gainfrom the appreciation of the hard currency. For the same reason, MNCs will try to lead hard-currency payables and to lag soft-currency payables.
TRANSFER PRICING Transfer prices are prices of goods and services sold between relatedparties, such as a parent and its subsidiary. Transfer prices are frequently different from arm’s-length prices (fair market prices) so that they can be used to avoid foreign-currency exposure.For example, an MNC can remove funds from soft-currency countries by charging higher trans-fer prices on goods sold to its subsidiaries in those countries. For the same reason, an MNC cankeep funds at those subsidiaries in hard-currency countries by charging lower prices on goodssold to its subsidiaries in those countries. Governments usually assume that MNCs manipulatetheir transfer prices to avoid financial problems or to improve financial conditions. Thus, mostgovernments set up policing mechanisms to review the transfer pricing policies of MNCs.
252 TRANSLATION EXPOSURE MANAGEMENT
SUMMARY
Translation exposure occurs when companies translate financial-statement accounts from a foreigncurrency to their home currency. The possible extent of translation gains and losses often dependson the rules that govern translation. The four translation methods most widely used by MNCs are

QUESTIONS 253
current/noncurrent, monetary/nonmonetary, temporal, and current-rate. This chapter presented anumerical example to compare these four recognized methods.
US companies were required to use FASB 8 (the temporal method) from 1975 until the FASBissued its Statement 52 (the current-rate method) in 1981. The FASB issued its Statement 52because accountants and executives raised two major complaints about FASB 8. First, FASB 8required US companies to show gains and losses in their current income statement, thereby dis-torting their earnings. Second, FASB 8 required US companies to use different rates for differentbalance-sheet items. Under FASB 52, all gains and losses are treated as net worth, and all balance-sheet items are translated at the current exchange rate except net worth.
MNCs can use a variety of methods to deal with translation exposure. These methods consistof one major group of hedging devices: balance-sheet hedges, which are generally employed to min-imize translation exposure. A balance-sheet hedge involves the selection of the currency in whichexposed assets and liabilities are denominated so that an exchange rate change would make exposedassets equal to exposed liabilities. Because translation gains and losses are purely of a paper nature,most MNCs do not employ financial instruments, such as currency forwards, futures, and options.
Questions
1 Explain the conditions under which items and/or transactions are exposed to foreign-exchange risks.
2 Three basic types of exchange exposure are translation exposure, transaction exposure,and economic exposure. Briefly explain each of these three types of exposure.
3 What is the basic purpose of exposure netting?4 How does FASB 8 differ from FASB 52?5 What is the basic translation hedging strategy?6 How will the weakened US dollar affect the reported earnings of a US company with sub-
sidiaries all over the world? How will the strengthened US dollar affect the reported earn-ings of a US company with subsidiaries all over the world?
7 How could an MNC use leading and lagging to hedge its soft-currency receivables and itssoft-currency payables?
8 Which method do most MNCs use to hedge their translation exposure: financial instru-ments or operational techniques?

254 TRANSLATION EXPOSURE MANAGEMENT
Problems
1 A US company has a single, wholly owned affiliate in Japan. This affiliate has exposedassets of ¥500 million and exposed liabilities of ¥800 million. The exchange rate appreci-ates from ¥150 per dollar to ¥100 per dollar.(a) What is the amount of net exposure?(b) What is the amount of the translation gain or loss?(c) If the Japanese yen declines from ¥150 per dollar to ¥200 per dollar, what would be
the amount of the translation gain or loss?2 The British subsidiary of a US company had current assets of £1 million, fixed assets of £2
million, and current liabilities of £1 million at both the beginning and the end of the year.There are no long-term liabilities. The pound depreciated during the year from $1.50 perpound to $1.30 per pound.(a) What is the amount of net exposure?(b) What is the amount of the translation gain or loss?
3 Assume that a Malaysian subsidiary of a US company has the following: (1) cash =M$1,000; (2) accounts receivable = M$1,500; (3) inventory = M$2,000; (4) fixed assets= M$2,500; (5) current liabilities = M$1,000; (6) long-term debt = M$3,000; (7) net worth= M$3,000; and (8) net income before translation gain or loss = M$225. Let us furtherassume that the historical exchange rate is $0.25 per ringgit, the current exchange rate is$0.20 per ringgit, the average exchange rate is $0.225 per ringgit, and inventory is carriedat cost.(a) Prepare the balance sheet of the US subsidiary in Malaysia.(b) Determine the dollar net income without the translation gain or loss.(c) Determine the translation gain or loss under FASBs 8 and 52.(d) If the functional currency is determined to be the US dollar, which translation method
should be used? What kind of impact would it have on the company’s net income?(e) Compute the Malaysian ringgit debt ratio, the return on investment, and the long-
term debt-to-equity ratio. Compare these ratios with the ratios in dollars under FASBs8 and 52.
4 In 1982, Ford incurred an after-tax loss of $658 million, adopted FASB 52, and had a trans-lation loss of $220 million. In the same year, General Motors earned an after-tax profit of$963 million, used FASB 8, and had a translation gain of $348 million.(a) Why do you think that in 1982, Ford adopted a new accounting rule FASB 52, while
GM used an old accounting rule FASB 8?(b) What would have been Ford’s reported net loss if it had used FASB 8 instead of FASB
52?(c) What would have been GM’s reported net income if it had adopted FASB 52 instead
of FASB 8?5 Assume that a subsidiary in New Zealand needs NZ$500,000 and that a credit swap has
been proven to be the least costly hedged alternative. Further assume that the best

PROBLEMS 255
unhedged alternative is the direct loan from the parent and that the cost of the direct loanis 20 percent. The current exchange rate is $0.5000 per New Zealand dollar. To obtainNZ$500,000 for the subsidiary in New Zealand, the parent must open a $250,000 credit($0.5000 ¥ NZ$500,000) in favor of a New Zealand bank. The New Zealand bank charges10 percent per year on the NZ$500,000 made available to the subsidiary and pays nointerest on the $250,000 deposit that the parent has deposited in the bank.(a) What is the exchange rate that would make the direct loan and the credit swap
equally attractive?(b) If most market analysts predict that the exchange rate will be NZ$2 per dollar in 180
days, which alternative would you recommend?(c) If most market analysts predict that the exchange rate will be NZ$3 per dollar in 180
days, which alternative would you recommend?(d) If the New Zealand bank should pay 5 percent interest on the $250,000 credit, what
is the exchange rate that would make the direct loan and the credit swap equallyattractive?
6 The current exchange rate of Saudi Arabian riyal is SR4 per $1. The Exton Company, theSaudi Arabian subsidiary of a US multinational company, has the following balance sheet:
Assets Claims on assets
Cash SR 500Accounts receivable 600 Accounts payable SR 100Inventory (cost) 400 Notes payable 200Inventory (market price) 800 Other payables 1,000
Total current assets SR2,300 Total current liabilities SR1,300Long-term debt 800
Plant and equipment 2,400 Common stock 1,000Accumulated depreciation (1,400) Retained earnings 200
Net plant and equipment 1,000 Exchange loss or gain -
Total assets SR3,300 Total claims SR3,300
If the Saudi Arabian riyal devalues from SR4 per $1 to SR5 per $1, what would be thetranslation loss (gain) under each of the following methods: current/noncurrent, mone-tary/nonmonetary, temporal, and current-rate?

256 TRANSLATION EXPOSURE MANAGEMENT
REFERENCES
Coopers & Lybrand, Foreign Currency Translationand Hedging, New York: Coopers & Lybrand,Feb. 1994.
DeVries, M. G., “The Magnitude of ExchangeDevaluation,” Finance and Development, No. 2,1968, pp. 8–16.
Ford Motor Company, Annual Report 1982, Dear-born, MI: Ford Motor Company, 1982, pp.22–35.
General Motors Corporation, Annual Report 1982,Detroit: General Motors Corporation, 1982, pp.17–27.
Glau, M., “Strategic Management of Exchange RateRisks,” Long Range Planning, Aug. 1990, pp.65–71.
Houston, C. O., “Translation Exposure HedgingPost FASB No. 52,” Journal of InternationalFinancial Management and Accounting, Summerand Autumn 1990, pp. 145–70.
Veazey, R. E., and S. H. Kim, “Translation ofForeign Currency Operations: SFAS No. 52,”Columbia Journal of World Business, Winter 1982,pp. 17–22.
Case Problem 10: Dell Mercosur
At the end of 2002, Todd Pickett, CFO of Dell Mercosur, was faced with conflicting predic-tions of the value of the Brazilian currency, the real, and what to do to hedge Dell’s operationin Brazil. Although Pickett was concerned about Dell’s exposure in the other Mercosur coun-tries, especially Argentina, Brazil was clearly the largest concern. The year 2002 began withthe shocks resulting from the Argentine financial crisis that started at the end of 2001, and itended with the election in October of Luiz Ina’cio Lula da Silva, known simply as Lula, as thepresident of Brazil. Lula, the leader of the Worker’s Party and long-time leftist politician, hadheld the lead throughout the year. The markets were skeptical of Lula’s potential leadership,a factor that caused the real to fall from 2.312 reals per US dollar at the end of 2001 to arecord 4 reals to one US dollar at one point just prior to the election. After the election, thereal began to strengthen somewhat, but Pickett had to base his strategies on whether the realwould continue to strengthen or would weaken again. Figure 10.1 shows the Brazilian real/USdollar exchange rate changes for 1995 through 2002.
The History of Dell
Founded in 1984 by Michael Dell, the computer company operates in 34 countries with 36,000employees (of which about 14,400 are outside the USA) and recorded $32 billion in sales for2002. In the past 5 years, Dell has expanded beyond PCs, to servers, storage, and communi-cations equipment. Most PC manufactures have claimed poor results since the technologybubble burst in 2000 – IBM left the industry in 2000 and Compaq and Hewlett-Packard (HP)merged in 2001 in hopes of boosting their competitive position. Unlike its competitors, Dellhas thrived in the past few years, moving from a market share of 12 percent to 15 percent in

CASE PROBLEM 10 257
2001, the number one spot in the industry. Fiscal 2002 was one of the toughest years to datein the PC industry. Because of the softening of the global economy and the events of Sep-tember 11, demand for PCs was down sharply. Dell responded with an aggressive price strat-egy and reduced costs through workforce reductions and facility consolidations. Althoughglobal industry shipments fell in 2002 by 5 percent, Dell’s unit shipments increased by 15percent, thus enabling the company to retain its number one position.
Dell bases its success on its build-to-order, direct sales model. Dell has eliminated resellersand retailers and sells directly to the customer by phone or over the Internet. Dell customizesevery computer to the customer’s needs and waits to build the computer until it is ordered.As a result, Dell requires little inventory (4 days on average) and is able to deliver the newesttechnology to its customers. Costs are kept to a minimum compared to its competitors,because it has no costly retail outlets and little inventory.
Dell began assembling computers in Round Rock, Texas, in 1985 and moved to global pro-duction in the following order:
1990 Opened manufacturing plant in Ireland1996 Opened manufacturing plant in Malaysia1998 Opened manufacturing plants in China1999 Opened manufacturing plants in Tennessee and Brazil
Dell’s 2002 Form 10K Reports
Sales outside the USA accounted for approximately 35 percent of the company’s revenues infiscal year 2002. The company’s future growth rates and success are dependent on contin-ued growth and success in international markets. As is the case with most international oper-ations, Dell’s overseas sales are subject to numerous risks and uncertainties, including localeconomic and labor conditions, political instability, unexpected changes in the regulatory envi-
Real/dollar4.0
3.5
2.5
2.0
1.5
1.0
0.5
0.0
1995
1996
1997
1998
1999
2000
2001
2002
3.0
Year
Figure 10.1 Exchange rates for the Brazilian real and the US dollar

258 TRANSLATION EXPOSURE MANAGEMENT
ronment, trade protection measures, tax laws (including US taxes on foreign operations), andforeign-currency exchange rates.
Dell in Brazil
Dell’s production facility in Brazil is in Eldorado do Sul, close to Porto Alegre, the capital ofRio Grande do Sul, the southernmost state in Brazil. Its call center in Brazil is similar to theone in Bay, Ireland, and services both Brazil and Argentina. Its Brazilian facility, which consistsof 100,000 square feet of leased property, is the smallest of its facilities outside the USA, butthe potential in Brazil and Argentina is huge, and Dell is planning further expansion. Becauseof the tariff-free provisions of Mercosur and the close proximity of Dell’s manufacturing facil-ities in the south of Brazil, Dell is well positioned to service all of Mercosur with its Brazilianmanufacturing operations. In 2002, it held a 4.5 percent market share in Brazil, behindHP/Compaq, IBM, and a Brazilian company. However, it was rapidly moving up to third placein the market and growing quickly.
Although Dell is divided into products and customers, it is managed generally on a geo-graphical basis. Terry Kahler, the general manager of Dell Mercosur, reports to the head ofthe Americas/International group, who in turn reports to the Rosendo Parra, the Vice Presi-dent of the Americas/International Group in Austin, Texas. Pickett works closely with Kahler,but reports directly to the CFO staff in Austin.
Dell’s revenues in Brazil are denominated in reals, and most of its operating costs are alsodenominated in reals. However, about 97 percent of Dell’s manufacturing costs in Brazil aredenominated in US dollars, since Dell imports parts and components from the USA. It trans-lates its financial statements according to the current-rate method, which means that assetsand liabilities are translated at the average exchange rate for the period. Because of businessdevelopment loans from the Brazilian government, Dell’s net exposed asset position in Brazilis quite small, but it is subject to foreign-exchange gains and losses as the rate changes.
The Hedging Strategy
In its Form 10K for 2002, Dell states its foreign-currency hedging strategy as follows:
The Company’s objective in managing its exposure to foreign currency exchange-rate fluc-tuations is to reduce the impact of adverse fluctuations on earnings and cash flows asso-ciated with foreign currency exchange-rate changes. Accordingly, the Company utilizesforeign currency option contracts and forward contracts to hedge its exposure on fore-casted transactions and firm commitments in most foreign countries in which the Companyoperates. The principal currencies hedged during fiscal 2002 were British pound, Japaneseyen, euro, and Canadian dollar. The Company monitors its foreign currency exchange expo-sures to ensure the overall effectiveness of its foreign currency hedge positions. However,there can be no assurance the Company’s foreign currency activities will substantially offsetthe impact of fluctuations in currency exchange rates on its results of operations and finan-cial position.
The Company uses purchased option contracts and forward contracts designated as cashflow hedges to protect against the foreign currency exchange risk inherent in its forecasted

CASE PROBLEM 10 259
transactions denominated in currencies other than the US dollar. Hedged transactionsinclude international sales by US dollar functional currency entities, foreign currencydenominated purchases of certain components, and intercompany shipments to certaininternational subsidiaries. The risk of loss associated with forward contracts is entered intountil the time it is settled. These contracts generally expire in three months or less.
The Company also uses forward contracts to economically hedge monetary assets andliabilities, primary receivables and payables that are denominated in a foreign currency.These contracts are not designated as hedging instruments under generally acceptedaccounting principals, and therefore, the change in the instrument’s fair value is recognizedcurrently in earnings and is reported as a component of investment and other income (loss),net. The change in the fair value of these instruments represents a natural hedge as theirgains and losses offset the changes in the underlying fair value of the monetary assets andliabilities due to movements in currency exchange rates. These contracts generally expirein three months or less.
Based on these general statements of principle, Dell’s strategy is to hedge all foreign-exchange risk, which is a very aggressive hedging strategy. Since there is no options marketfor Brazilian reals, Pickett uses forward contracts to hedge the foreign-exchange risk in Brazil.Corporate treasury monitors currency movements worldwide and provides support to Pickett’sBrazilian treasury group in terms of currency forecast and hedging strategies. Within the broadstrategy approved by corporate treasury, the Brazilian group establishes a strategy and thenworks with corporate on specific executions of the strategy.
There are two key parts to the strategy. One has to do with forecasting exposure, and theother has to do with designing and executing the strategy to hedge the exposure. Althoughthe balance-sheet exposure is not material, it still must be forecast and is partly a function ofthe cash flows generated by revenues. The revenue side is more difficult to forecast, so Picketthedges about 80 percent of forecasted revenues. However, the Dell team in Brazil has becomevery adept at forecasting revenues and in executing a strategy in order to reach its target fore-cast. The team works hard on identifying the challenges in reaching its target and in devisingpolicies to overcome those challenges. Its execution strategies vary widely quarter by quarter,and the management team has become very good at meeting its targets by working closelytogether and being flexible. Pickett and Kahler work closely together on a daily basis to executetheir strategy.
The second key to this strategy is designing and executing the hedging strategy. Since rev-enues vary on a daily basis, Pickett does not enter into contracts all at once. Instead, he workswith corporate treasury to enter into contracts in different amounts and different maturitiesdepending on when it expects to generate the revenues. Revenues are generally lower at thebeginning of the quarter and are always higher in the last week or two of the quarter, so heenters into contracts accordingly. Timing is a crucial issue. The gain or loss on a forward con-tract is the difference in exchange rates between when the contract is entered into and whenit is settled. The key is to unwind (or settle) the contracts while the rate is still favorable. Pickettnoted that if Dell began to unwind the contracts in the last week or two of the quarter insteadof the last day or two of the quarter, it could get much more favorable foreign-exchangegains. His strategy was so successful that in some quarters, Dell was generating more finan-

260 TRANSLATION EXPOSURE MANAGEMENT
cial income than operating income. Although Pickett and his treasury team have some flexi-bility in designing and implementing strategy, corporate treasury keeps in touch, dependingon their forecast of exchange rate and the strategy that Dell Brazil is following.
Corporate treasury uses a consensus forecast of exchange rates that is provided by a groupof banks, but banks have different scenarios. For example, in the last quarter of 2002, cor-porate treasury was relying on a bank forecast that the real would revalue even more by theend of the year. Pickett’s dilemma was that his gut feeling was that the real would actuallyfall instead of rise. That would indicate a different hedging strategy. He was resisting enter-ing into hedges while corporate treasury was pressuring him to do just that. However, he wasclosely watching the forward market, and when it began to move, he decided it was time toenter into the contracts. But who knows what will happen to Brazil if Lula, Brazil’s new pres-ident, loses fiscal control of the ninth largest economy in the world, resulting in another roundof inflation and a falling currency. Dell has significant market opportunities in Mercosur, butthe financial risk will make for exciting times in the years to come.
Case Questions
1 Given how Dell translates its foreign-currency financial statements into dollars, how woulda falling Brazilian real affect Dell Mercosur’s financial statement?
2 Dell imports about 97 percent of its manufacturing cost. What type of exposure does thiscreate for it? What are its options to reduce that exposure?
3 Describe and evaluate Dell’s exposure management strategy.4 What are the costs and benefits of hedging all foreign-exchange risk?5 The mission of the Financial Accounting Standard Board (FASB) is to establish and improve
standards of financial accounting and reporting for the guidance and education of thepublic, including issuers, auditors, and users of financial information. Visit the FASB’s homepage, www.fasb.org, to see current accounting standards and letters commenting on pro-posed standards.
Source: J. D. Daniels, L. H. Radebaugh, and D. P. Sullivan, International Business: Environments and Opera-tions, 10th edn, Upper Saddle River, NJ: Prentice Hall, 2004, pp. 623–6. This case is reprinted with permis-sion by Prentice Hall.

Part III (chapters 11–14) describes sources of global finance. One major facet of financial man-agement is to raise funds on favorable terms. In the case of global financial management, thisinvolves those sources of funds necessary to finance world trade and foreign investment. Thesefunds can come from either internal or external sources. Internal sources of funds, such as earn-ings and depreciation, are the major sources of funds for most multinational companies (MNCs).But external sources of funds, such as bank loans and Eurodollars, are important as well.
A dramatic expansion in international capital flows has emerged in recent years for severalreasons. First, revolutionary advances in information and communications technology, togetherwith significantly lower transportation and transaction costs, have accelerated the growth of cross-border financial flows. Second, financial innovations in the United States and other industrialcountries, such as mutual funds, hedge funds, and derivatives, have made cross-border invest-ments more accessible to institutional and individual investors. Third, the removal of capital con-trols and broader liberalization of financial markets in most countries around the world havestimulated competition and resulted in a growing integration of domestic and offshore markets.MNCs should take into account these three factors in financing their international transactions.This is because the factors have not only increased the efficiency of global capital markets, buthave also created new systematic risks associated with increased asset-price variability.
PART III
The Global FinancingStrategy


Opening Case 11: Foreign Investors Load Up with Asia’s Shares
Since May 21, 2003, US and other foreign investors have begun to pile funds backinto Asia because they believe that the region will once again prove to be a leveragedbet on US growth (figure 11.1). That newfound taste for Asian shares, however, couldsour as the same factors that make stocks in the region attractive leave them vulner-able should US recovery expectations prove premature.
Investors purchased Asia-focused funds as they switched out of fixed-income secu-rities back into stocks, reasoning that shares in Asia will rise faster and further in frontof a US recovery, as they have in the past. Another reason for a current Asian marketsboom is the return of investor interest in so-called cyclical stocks, whose prices riseand fall with overall economic performance. In Asia, entire markets tend to be cycli-cal as they follow the ups and downs of the US economy.
The flipside of being a leveraged bet on US growth is Asia’s predilection to fallharder when that growth slows. Asian leaders would prefer that the region lessen itsreliance on the hot and cold flows of global trade and rely more on domestic con-sumption and trade within Asia for growth. That, they reason, would make growthmore stable over the long term and make Asia less of a cyclical play for investors.However, Geoffrey Banker, chief Asian economist for HSBC Bank in Hong Kong, saysthose desires have yet to be translated into concrete changes in Asian economies.Most Asian countries have become more reliant on exports in the past few years, hesaid. And that leaves them more vulnerable to disappointment should a US recoverynot materialize soon.
Source : P. Day, “Foreign Investors Load Up with Asia’s Shares,” The Wall Street Journal, July 17,2003, p. C12.
CHAPTER 11
International FinancialMarkets

International financial markets are a major source of funds for international transactions. Mostcountries have recently internationalized their financial markets to attract foreign business.
Recent financial globalization is being driven by advances in data processing and telecom-munications, liberalization of restrictions on cross-border capital flows, deregulation of domes-tic capital markets, and greater competition among these markets for a share of the world’s tradingvolume. This globalization involves both a harmonization of rules and a reduction of barriersthat will allow for the free flow of capital and permit all firms to compete in all markets. In otherwords, financial market imperfections have declined because of this global integration of moneyand capital markets. Yet, there are still excellent opportunities for companies to lower their costof capital and for investors to increase their return through international financial markets. Thischapter examines the three financial markets – Eurocurrency, international bond, and interna-tional equity – that allow companies to serve customers around the world.
11.1 Eurocurrency Markets
The Eurocurrency market consists of banks that accept deposits and make loans in foreign cur-rencies outside the country of issue. These deposits are commonly known as Eurocurrencies.Thus, US dollars deposited in London are called Eurodollars; British pounds deposited in NewYork are called Eurosterling; and Japanese yen deposited in London are called Euroyen.
Because Eurodollars are the major form of Eurocurrency, the term “Eurodollar” frequentlyrefers to the entire Eurocurrency market. Eurodollars could be broadly defined as dollar-
264 INTERNATIONAL FINANCIAL MARKETS
0.4%
4.8%
12.4%
Japan Asia Int'Iex-Japan
32.5%
28.5
22.0
19.4
17.2
14.3
12.8
7.1
Thailand/SET
Taiwan/Weighted average
South Korea/Kospi
Japan/Nikkei Stock Average
USA/NASDAQ
Indonesia/JSX Composite
Hong Kong/Hang Seng
USA/DJ industrials
*Funds that invest in both developing and emerging markets
The recent stock rally has been more significant for tech-heavy Asian stock market indexes and the NASDAQ than for the Dow Jones Industrial Average. At left, index performance since May 20; in US-dollar terms. At right, growth in total assets through new investment in Asian regional funds compared with growth in international fund assets in general* since May 21.
Figure 11.1 Asian markets boom as foreigners pile in
Source: P. Day, “Foreign Investors Load Up with Asia’s Shares,” The Wall Street Journal,July 17, 2003, p. C12.

denominated deposits in banks all over the world except in the United States. These banks maybe foreign banks or foreign branches of US banks. However, many experts narrowly defineEurodollars as dollar-denominated deposits in Western European banks or foreign branches ofUS banks in Western Europe. Hence, they distinguish between Eurodollars and petrodollars inthe Middle East, or between Eurodollars and Asian dollars in Hong Kong or Singapore. Thedominant Eurocurrency remains the US dollar. More recently, however, the euro (€) has becomean important currency for denominating Eurocurrency loans and Eurobonds as the US dollarhas weakened during 2002.
Eurocurrency markets are very large, well organized, and efficient. They serve a number ofvaluable purposes for multinational business operations. Eurocurrencies are a convenient moneymarket device for MNCs to hold their excess liquidity. They also are a major source of short-term loans to finance corporate working capital needs and foreign trade. In recent years, the so-called “Eurobond markets” have developed as a major source of long-term investment capital forMNCs.
11.1.1 The creation of Eurodollars
Many MNCs and governments have learned to use the Eurodollar market as readily as they use the domestic banking system. Major sources of Eurodollars are the dollar reserves of oil-exporting countries, foreign governments or business executives preferring to hold dollars outsidethe US, foreign banks with dollars in excess of current needs, and MNCs with excess cash balances. Once Eurodollars come into existence, they can create themselves through the lendingand investing activities of commercial banks.
Because there are usually no legal reserves against Eurodollar deposits, we may argue thatEurodollar deposits could expand indefinitely. Who creates this infinite expansion of Eurodollars?Three parties do so jointly: (1) public and private depositors, by always keeping their money innon-US banks on deposit; (2) banks, by keeping none of their Eurodollar deposits in the form ofcash; and (3) public and private borrowers, who make it possible for the banks to find Eurodollarloans. However, there are a number of checks to this expansion. First, public and private deposi-tors may hold a portion of their money in the form of nondeposit cash. Second, banks may retaina part of their Eurodollar deposits as a liquid reserve. Third, borrowers may convert the dollarsborrowed into local currency. This conversion will not only stop the further expansion of Eurodol-lar deposits, but it may actually reduce the volume of outstanding Eurodollar deposits.
USES OF EURODOLLARS European banks with Eurodollars may use these funds in a numberof ways. First, they may redeposit their Eurodollars in other European banks or in Europeanbranches of a US bank. Second, they may make loans to nonbank users such as MNCs. TheseMNCs use the dollars to meet their dollar obligations or to buy local currencies. Third, they maytransfer their dollars to Eurodollars in European branches of a US bank, which in turn wouldlend these funds to the US home office.
Heavy borrowers in the Eurodollar market are governments and commercial banks. Manycountries have recently been suffering problems related to foreign loans. Hence, they wantEurodollars to improve their international reserves. Many commercial banks rely on Eurodollarsto grant credit to exporters and importers. Eurobanks frequently swap Eurodollars with local cur-rencies in order to make loans to domestic companies. In addition, international development
EUROCURRENCY MARKETS 265

banks have been regular borrowers in the market. European countries outside the Group of Ten,Latin America, and Asia are the three largest users of Eurodollars.
Many of the private nonbank borrowers continue to be companies engaged in internationaloperations, such as exporters, importers, and investors. They are attracted by the size of themarket and the importance of the US dollar as an international reserve. A second advantage ofEurodollar loans is that there are no restrictions about the deployment of funds raised in theexternal market. In contrast, funds raised in national money markets are subject to restrictionsin almost all cases. Finally, international money markets provide MNCs with flexibility in manyways such as terms, conditions, and covenants.
11.1.2 Eurodollar instruments
The two major types of instrument used in the Eurodollar market are Eurodollar deposits andEurodollar loans.
EURODOLLAR DEPOSITS Eurodollar deposits are either fixed-time deposits or negotiable certificates of deposit. Most Eurodollar deposits are in the form of time deposits.
Time deposits are funds being placed in a bank for a fixed maturity at a specified interest rate.In contrast to the US practice, Eurobanks do not maintain checking accounts (demand deposits)for their customers. While the maturities of these time deposits range from 1 day to a few years,most of them have a maturity of less than 1 year. Time deposits are for fixed periods, butEurobanks are frequently flexible if the depositor desires to withdraw his deposits early.
A certificate of deposit (CD) is a negotiable instrument issued by a bank. In other words,negotiable CDs are formal negotiable receipts for funds left with a bank for a specified period oftime at a fixed or floating rate of interest. The important advantage of a CD over a time depositis its liquidity, because the holder of a CD can sell it on the secondary market at any time beforethe maturity date. Eurobanks issue negotiable CDs to attract idle funds from MNCs, oil-exporting countries, and wealthy individuals.
Negotiable CDs for Eurodollars were first introduced in 1966 by the London branch of FirstNational City Bank of New York (now Citicorp). Currently, most major Eurobanks issue nego-tiable CDs, whose safety and liquidity are assured by an active secondary market. The secondarymarket consists of broker/dealer firms that are members of the International CD Market Asso-ciation. This association was established in London in 1968 to provide customers with the highestquality of services.
EURODOLLAR LOANS Eurodollar loans range from a minimum of $500,000 to $100 million,typically in multiples of $1 million. Their maturities range from 30 days to a few years. Short-term Eurodollar financings represent the major part of the Eurodollar lending business. Short-term Eurodollar loans are usually conducted under prearranged lines of credit. Under such anarrangement, the Eurobank establishes a maximum loan balance (line of credit) after investiga-tion of its client’s credit standing. Although the commitment period is typically 1 year, advancesunder a line of credit are normally made against notes with maturities of 90 or 180 days. Linesof credit are renewable after a thorough review process. These short-term Eurodollar loans areusually made on an unsecured basis and repaid at the maturity date.
Eurobanks also provide international concerns with medium-term loans. Two major forms ofmedium-term Eurodollar loans are revolving Eurodollar credits and Eurodollar term loans. A
266 INTERNATIONAL FINANCIAL MARKETS

revolving credit is a confirmed line of credit beyond 1 year. Maturities of Eurodollar term loansrange from 3 years to 7 years. These term loans are a less popular form of medium-term Eurodol-lar loans than revolving Eurodollar credits.
INTEREST RATES Two sets of interest rates are Eurodollar deposit interest rates and Eurodollarloan interest rates. Eurodollar deposit and loan rates are determined by forces of supply anddemand. More specifically, these rates depend on the rates in a corresponding home currency,spot and forward exchange rates, domestic and Eurocurrency rates in other currencies, and theinflation rate in various countries. Many economists have assumed that Eurodollar deposit ratesdepend on US money market rates. In other words, US CD rates provide an effective floor forEurodollar deposit rates.
Interest rates on Eurodollar deposits are usually higher than those on deposits in the USA.Interest rates on Eurodollar loans are generally lower than similar loan rates in the USA. Withdeposit rates higher and lending rates lower in the Eurodollar market than in the US market,Eurobanks must operate on a narrower margin. A number of factors enable Eurobanks to operateprofitably on narrower margins than domestic markets.
1 Eurobanks, being free of reserve requirements, can lend a larger percentage of their deposits.2 Eurobanks have very little or no regulatory expenses, such as deposit insurance fees.3 Eurodollar loans are characterized by high volumes and well-known borrowers; these two fea-
tures reduce the costs of information gathering and credit analysis.4 Many Eurodollar loans take place out of tax-haven countries.5 Eurobanks are not forced to lend money to borrowers at concessionary rates, which are usually
lower than prevailing market rates.
Eurobanks usually establish their lending rate at some fixed percentage above the 6-monthLondon Interbank Offered Rate. The London Interbank Offered Rate (LIBOR) is the BritishBankers’ Association average of interbank offered rates for dollar deposits in the London market,based on quotations at 16 major banks. The LIBOR is an important reference rate in intentionalfinance. For example, many loans to developing countries have been priced as LIBOR plus somenumber of percentage points. The development of the LIBOR concept has created a number ofimitators: the Euro Interbank Offered Rate (EIBOR), the Kuwait Interbank Offered Rate(KIBOR), the Singapore Interbank Offered Rate (SIBOR), and the Madrid Interbank OfferedRate (MIBOR). The two latest imitators are the Euro LIBOR and the EURIBOR. The EuroLIBOR (London Interbank Offered Rate) is the British Bankers’ Association average of inter-bank offered rates for euro deposits in the London market, based on quotations at 16 majorbanks. The EURIBOR (Euro Interbank Offered Rate) is the European Banking Federationsponsored rate among 57 eurozone banks.
In the absence of tight controls on international financial transactions, arbitrage and risk dif-ferences affect the relationship between rates in the internal market (the US market) and in theexternal market (the Eurodollar market). An absence of government controls on internationalcapital flows results in arbitrage between internal and external segments of the market for dollarcredit. The arbitrage keeps the spread between internal and external rates within a narrow margin.In general, risks on external dollar deposits are somewhat greater than those on internal dollardeposits. Table 11.1 shows several money rates that appeared in The Wall Street Journal on June22, 2004. These money rates include interest rates of short-term loans and money market instru-ments, many of which are discussed in this and other chapters.
EUROCURRENCY MARKETS 267

Table 11.1 Money market instruments
Money rates Monday, June 21, 2004The key US and foreign annual interest ratesbelow are a guide to general levels but don’talways represent actual transactions.
Commercial paperYields paid by corporations for short-termfinancing, typically for daily operation
Prime Rate: 4.00% (effective 06/27/03). Thebase rate on corporate loans posted by at least75% of the nation’s 30 largest banks.Discount Rate (Primary): 2.00% (effective06/25/03).Federal Funds: 1.031% high, 0.969% low,1.000% near closing bid, 1.031% offered.Effective rate: 1.00%. Source: Prebon Yamane(USA) Inc. Federal-funds target rate: 1.000%(effective 06/25/03).Call Money: 2.75% (effective 06/30/03).Commercial Paper: Placed directly by GeneralElectric Capital Corp.: 1.21% 30 to 59 days;1.32% 60 to 87 days; 1.48% 88 to 94 days;0.80% 95 to 113 days; 1.59% 114 to 139 days;1.69% 140 to 174 days; 1.79% 175 to 206 days;1.89% 207 to 231 days; 1.98% 232 to 270 days.Euro Commercial Paper: Placed directly byGeneral Electric Capital Corp.: 2.04% 30 days;2.06% two months; 2.08% three months; 2.11%four months; 2.14% five months; 2.17% sixmonths.Dealer Commercial Paper: High-grade unsecurednotes sold through dealers by major corporations:1.24% 30 days; 1.35% 60 days; 1.43% 90 days.
Certificates of Deposit: 1.25% one month;1.50% three months; 1.81% six months.Bankers’ Acceptances: 1.23% 30 days; 1.36% 60days; 1.49% 90 days; 1.60% 120 days; 1.71%150 days; 1.80% 180 days. Source: PrebonYamane (USA) Inc.Eurodollars: 1.25%–1.22% one month;1.39%–1.36% two months; 1.52%–1.49% threemonths; 1.63%–1.59% four months;1.73%–1.69% five months; 1.82%–1.79% sixmonths. Source: Prebon Yamane (USA) Inc.London Interbank Offered Rates (LIBOR):1.2850% one month; 1.55938% three months;1.86375% six months; 2.40188% one year.Effective rate for contracts entered into two daysfrom date appearing at top of this column.Euro Libor: 2.07725% one month; 2.12300%three months; 2.20700% six months; 2.44725%one year. Effective rate for contracts entered intotwo days from date appearing at top of thiscolumn.Euro Interbank Offered Rates (EURIBOR): 2.078%one month; 2.124% three months; 2.211% sixmonths; 2.448% one year. Source: Reuters.Foreign Prime Rates: Canada 3.75%; EuropeanCentral Bank 2.00%; Japan 1.375%; Switzerland2.14%; Britain 4.50%.Treasury Bills: Results of the Monday, June 21,2004, auction of short-term US government bills,sold at a discount from face value in units of$1,000 to $1 million: 1.315% 13 weeks; 1.675%26 weeks. Tuesday, June 15, 2004 auction:1.070% 4 weeks.Overnight Repurchase Rate: 0.97%. Source:Garban Intercapital.Freddie Mac: Posted yields on 30-year mortgagecommitments. Delivery within 30 days 5.97%, 60days 6.04%, standard conventional fixed-ratemortgages: 2.875%, 2% rate capped one-yearadjustable rate mortgages.Fannie Mae: Posted yields on 30 year mortgagecommitments (priced at par) for delivery within 30days 6.02%, 60 days 6.10%, standardconventional fixed-rate mortgages; 3.45%, 6/2rate capped one-year adjustable rate mortgages.Constant Maturity Debt Index: 1.475% threemonths; 1.797% six months; 2.274% one year.Merrill Lynch Ready Assets Trust: 0.53%.Consumer Price Index: May, 189.1, up 3.1%from a year ago. Bureau of Labor Statistics.
J J J F M MA JSA O N D
0
1%
A1/P1-rated nonfinancial(top-tier)
2003 2004
Source: Federal Reserve
A2/P2-rated nonfinancial(second-tier)
Source: The Wall Street Journal, June 22, 2004, p. C16.

11.1.3 Euronote issue facilities
Euronote issue facilities (EIFs), a recent innovation in nonbank short-term credits, are notesissued outside the country in whose currency they are denominated. EIFs consist of Euronotes,Euro commercial paper, and Euro medium-term notes. These facilities are popular because theyallow borrowers to go directly to the market rather than relying on financial intermediaries suchas banks.
Euronotes are short-term debt instruments underwritten by a group of international bankscalled a “facility.” An MNC makes an agreement with a facility to issue Euronotes in its ownname for a number of years. Euronotes typically have maturities from 1 month to 6 months, butmany MNCs continually roll them over as a source of medium-term financing. Euronotes aresold at a discount from face value and pay back the full value at maturity. Euro commercialpaper (ECP), like domestic commercial paper, consists of unsecured short-term promissory notessold by finance companies and certain industrial companies. These notes are issued only by themost creditworthy companies, because they are not secured. Their maturities range from 1 monthto 6 months. Like Euronotes, Euro commercial paper is sold at a discount from face value. Table11.2 shows the year-end value of the Euronote and Euro commercial paper market in billions ofUS dollars from 1997 to 2001.
Euro medium-term notes (EMTNs) are medium-term funds guaranteed by financial insti-tutions with short-term commitments by investors. The main advantage of the EMTN is thatbanks underwrite or guarantee the funds for a period of 5–7 years. If the borrower cannot sellall or part of their notes, the banks will then buy all or part of them. At the same time, the bor-rower does not have to issue new notes every time their old notes mature. Consequently, theEMTN provides a medium-source of funds, without the obligation to pay the interest on thedebt when the funds are not needed. In this type of arrangement, the borrower raises funds inthe form of short-term notes with maturities of 30 days, 3 months, or even longer. These short-term notes are distributed to investors by financial institutions. At the maturity of these notes,the borrower reissues the notes. At this point, the investors may buy the new notes or take theirfunds back. This process is repeated at every maturity of the notes.
11.2 The Eurocurrency Interbank Market
The Eurocurrency interbank market plays a major role in channeling funds from banks in onecountry to banks in another country. The interbank market has over 1,000 banks from 50 dif-ferent countries, but about 20 major banks dominate the entire interbank market. Although
THE EUROCURRENCY INTERBANK MARKET 269
Table 11.2 Euronote issue facilities (billions of US dollars)
1997 1998 1999 2000 2001
Euronotes 73.5 61.6 84.8 270.5 154.6Euro commercial paper 110.4 132.7 175.2 223.3 243.1
Total 183.8 194.3 260.0 493.8 397.7
Source: The Bank for International Settlement, International Banking andFinancial Market Developments, June 1999 and June 2002, various pages.

transactions in US dollars still dominate the interbank market, there are flourishing interbankmarkets in euros, Swiss francs, Japanese yen, and British pounds.
11.2.1 An overview of the Eurocurrency interbank market
THE FUNCTIONS OF THE INTERBANK MARKET The Eurocurrency interbank market has at leastfour related functions. First, the interbank market is an efficient market system through whichfunds move from banks in one country to banks in other countries. Second, the interbank marketgives banks an efficient mechanism to buy or sell foreign-currency assets and liabilities of differentmaturities in order to hedge their exposure to interest rate and foreign-exchange risks. Third, theinterbank market is a convenient source of additional loans when banks need to adjust their balancesheets either domestically or internationally. Fourth, because of this market, banks sidestep regula-tions on capital adequacy and interest rates prevalent in many domestic banking markets.
RISKS OF PARTICIPATING BANKS Participating banks in the Eurocurrency interbank marketface at least five different risks: (1) credit or default risk, (2) liquidity risk, (3) sovereign risk, (4)foreign-exchange risk, and (5) settlement risk. First, credit risk is the risk that a borrowing bankmay default on its interbank loan. This risk is a concern because interbank loans and depositsare not secured. Second, liquidity risk is the risk that other banks may withdraw their interbankdeposits suddenly. Here, the bank may have to sell off illiquid assets for less than their face valueto meet its deposit drain. Third, sovereign risk is the risk that a foreign country may prevent itsbanks from repaying interbank loans or deposits received from banks in other countries. Fourth,foreign-exchange risk is the risk that a bank participant in this market will gain or lose due tochanges in exchange rates. Fifth, settlement risk is the risk of a breakdown or nonsettlement onthe major wire-transfer systems.
Regulators and analysts have expressed some concern about the stability of this market fortwo major reasons. First, interbank funds have no collateral. Second, central bank regulations areinadequate. These two factors expose the market to potential “contagion”; problems at one bankaffect other banks in the market. This kind of contagion ultimately threatens the market’s stability and its function.
MINIMUM STANDARDS OF INTERNATIONAL BANKS With the global crisis created by the col-lapse of several international banks in the 1980s, bank regulators throughout the world agreedthat something had to be done to protect against future massive failures. The Basel Committee,under the auspices of the Bank for International Settlements and the central-bank governors ofthe “Group of Ten” countries, reached an agreement on minimum standards in 1988 for inter-national banks and their cross-border activities. The Bank for International Settlements is abank in Switzerland that facilitates transactions among central banks. This agreement establishedan international bank capital standard by recommending that globally active banks had to main-tain capital equal to at least 8 percent of their assets by the end of 1992. The accord distinguishesbetween more and less risky assets, so that more capital would be held against investments withgreater risk. As a result, the 8 percent standard called for in the accord applies not to a bank’stotal assets but to its risk-weighted assets. Safe government bonds or cash, for example, receivea zero weight in calculating aggregate risk exposure, whereas long-term lending to banks andindustrial companies in emerging markets receives a 100 percent weight. Such minimum capitalstandards are meant to work in conjunction with direct supervision of banks and basic marketdiscipline to restrain excessive risk-taking by banks that have access to the safety net.
270 INTERNATIONAL FINANCIAL MARKETS

Several important limitations of the current framework have become apparent over time. Forexample, one major drawback of the current capital adequacy standard has to do with the factthat the regulatory measure of bank risk (risk-weighted assets) can differ significantly from actualbank risk. Because the current framework provides only a crude measure of bank risk, it setsminimum capital requirements that do not necessarily reflect a bank’s true economic risks andthus are inappropriate for regulatory purposes. In order to address such shortcomings, the BaselCommittee proposed a new capital adequacy framework in 1998. This proposal consists of threepillars: minimum regulatory capital requirements that expand upon those in the 1988 Accord,direct supervisory review of a bank’s capital adequacy, and the increased use of market disciplinethrough public disclosure to encourage sound risk management practices.
In April 2003, the Basel Committee on Banking Supervision released for public comment thenew Basel Capital Accord, which will replace the 1988 Capital Accord. These international agree-ments among banking regulators attempt to set regulatory capital requirements that are compa-rable across countries. On July 11, 2003, the Federal Reserve of the US issued an interagencyadvance notice of proposed rulemaking to seek public comments on the implementation of thenew Basel Capital Accord in the USA. The new accord, popularly known as Basel II, rests onthe three “pillars” described in the above paragraph. Basel II, to be implemented in 2006, main-tains the 8 percent equity capital as the minimum standard, but it changes the way in which thecapital standard is computed in order to consider certain risks.
THE “THREE CS” OF CENTRAL BANKING The recent movement toward a highly integratedglobal financial system has caused bankers to develop “three Cs” of central banking: consulta-tion, cooperation, and coordination. Central banks are important participants in the consulta-tion, cooperation, and coordination process due to their key role in monetary and exchange ratepolicies (see Global Finance in Action 11.1).
Consultation involves not only an exchange of information, but also an explanation of currenteconomic conditions and policies. By reducing the information uncertainty, this process enhancesthe understanding of what is going on in the world at large and it can successfully contribute tothe policy-making process.
In cooperation, countries retain full national sovereignty, but decide voluntarily to allow theactions of the other countries to influence their own decisions. While the central banks makesovereign decisions, they may agree to certain mutually advantageous courses of action and evenengage in certain joint efforts that are agreeable to all parties.
Finally, central bank coordination requires individual central banks to relinquish some or alldecision-making powers to other countries or international institutions. Some loss of nationalsovereignty is inevitably involved.
THE EUROCURRENCY INTERBANK MARKET 271
Global Finance in Action 11.1International Interest Rate Linkages
A change in the federal fund rate target often prompts observers to comment thatother central banks are likely to follow suit by changing their own targeted interestrates. Federal funds are reserves traded among US commercial banks for overnightuse. Figure 11.2 shows that central banks of different countries often change inter-

272 INTERNATIONAL FINANCIAL MARKETS
est rates in the same direction, at about the same time. This is especially true forcentral banks of countries with close economic ties.
There are at least three reasons why central banks might tend to change theirinterest rate targets in a similar fashion.
1 Countries react similarly to “common shocks.” In making monetary policy, centralbanks consider the state of the economy, including international prices of oil andother key commodities. Changes in such prices tend to affect countries in thesame way, leading to similar changes in monetary policy.
2 Countries may desire to maintain stable exchange rates. By raising and loweringinterest rates in tandem, central banks might minimize swings in the external valueof their currencies.
3 Economic conditions in one country affect those in other countries through trade andcapital flows. A US recession that leads to lower US interest rates might also slow itstrading partners’ growth, prompting their central banks to lower rates as well.
The latter two reasons might explain why the interest rate changes of larger coun-tries generally precede those of their smaller trading partners. Conditions in largercountries, such as the USA, affect conditions in smaller trading partners. Thus, smallercountries are more likely to consider external factors when making monetary policy.
Because the Federal Reserve has conducted monetary policy for the largesteconomy in the world, it has been less concerned with external factors than mostcentral banks. As a result, it has frequently been a “leader” in international rate move-ments. For example, figure 11.2 shows that the Federal Reserve led the way for othercentral banks by starting a series of interest rate reductions in January 2001.
Source: C. J. Neely, “International Interest Rate Linkages,” International Economic Trends, TheFederal Reserve Bank of St. Louis, Aug. 2001, p. 1.
8
6
4
21993 1995 1997 1999 2001
ECB
Canada
USAUK
Interest rate targets (%)
Year
Figure 11.2 International interest rate linkages
Source: Interest rate target data were obtained from the respective central banks.

11.2.2 The role of banks in corporate governance
Market-based and bank-based systems of corporate governance reflect the relative importance ofpublic and private capital markets to a nation’s economy. In the USA, increasing restrictions oncommercial banking has coincided with the growth of public capital markets. However, bankshave been the main source of capital in Japan for several reasons. First, the Bank of Japan pro-vides major industries with long-term loans at favorable rates through commercial banks. Second,Japanese banks have ample funds for loans because of the country’s high savings rates and hugetrade surpluses. Third, there are few restrictions on commercial banking in Japan.
THE USA: A MARKET-BASED SYSTEM OF CORPORATE GOVERNANCE Several pieces of legisla-tion enacted in the wake of the Depression (1929–33) fundamentally altered the role of finan-cial institutions in corporate governance. The legislation caused the fragmentation of financialinstitutions and institutional portfolios, thereby preventing the emergence of powerful large-block shareholders who might exert pressure on management. In contrast, countries such asGermany and Japan, which do not operate under the same constraints, developed systems thatallowed banks to play a larger role in firms’ affairs.
Traditionally, US banks have faced the following prohibitions on equity-related activities. First,banks cannot own stock for their own account. Second, banks cannot actively vote shares heldin trust for their banking clients. Third, banks cannot make a market in equity securities. Fourth,banks cannot engage in investment banking activities (Butler 1997).
However, US Congress and regulatory agencies have recently started to relax some constraints.For example, interstate banking was legalized in 1994; full interstate branch banking has beenpermitted since 1997. In addition, US banks, securities firms, insurance companies, and assetmanagers have been allowed to freely enter each other’s businesses or merge since early 2000.These recent changes generated fierce competition among financial institutions and reduced thenumber of commercial and investment banks. Consequently, the surviving banks are bigger,better capitalized, and better prepared to serve companies in creative ways.
Most financial analysts expect that these recent changes will eventually create universal banksin the USA. A universal bank is one in which the financial corporation not only sells a full scopeof financial services but also owns significant equity stakes in institutional investors. Although itoriginated in Europe, universal banking is similar to the Japanese keiretsu.
JAPAN: A BANK-BASED SYSTEM OF CORPORATE GOVERNANCE The national difference in cor-porate governance results in dissimilar financial structures for corporate control. The bank-basedsystems in Japan and Germany, for example, rely on a concentrated ownership in the hands ofa main bank and/or the business partners for both debt and equity capital. Large Japanese companies use a higher degree of leverage than US companies. The ability to take on such large amounts of debt stems in part from the vast mutual-aid networks – keiretsu – that mostJapanese companies can tap. Keiretsu is a Japanese word that stands for a financially linked groupof companies that play a significant role in the country’s economy.
Keiretsu, usually with the main bank at the center, form the backbone of corporate Japan.Keiretsu ties constitute a complex web of tradition, cross-shareholdings, trading relationships,management, cooperative projects, and information swapping. The keiretsu provides financialsupport, management advice, and favorable contracts to its members. A key mission of thekeiretsu is to provide a safety net when corporate relatives get into trouble. Moreover, Japanese
THE EUROCURRENCY INTERBANK MARKET 273

banks, unlike their US counterparts, can hold the borrowing company’s common stock. Thus,the main bank has access to information about the company and has a say in its management.In most countries, this sort of bank influence on corporate affairs would be unacceptable.
However, recent economic problems and deregulations in Japan have changed the country’sfinancial structures. These changes include reduced bank borrowing, more capital market financ-ing, the erosion of main bank power in corporate affairs, the reduction of cross-shareholdings,and a weaker keiretsu system. These changes are likely to reduce the role of banks in corporategovernance in Japan.
POLITICAL DYNAMICS There is a growing consensus that corporate governance reform shouldbe a matter of global concern. Although some countries face more serious problems than others,existing governance mechanisms have failed to effectively protect investors in many countries.For example, executives and politicians faced public uproar after the US corporate scandals of2001 and 2002. Other countries, such as the United Kingdom, have also experienced a spate ofcorporate scandals in recent years. The Sarbanes–Oxley Act in the USA, passed in 2002, isdesigned to reform three areas: (1) accounting regulation, (2) audit committee, and (3) execu-tive responsibility.
The US government is not the only organization that proposes changes in the corporate gov-ernance system. Indeed, groups such as the Business Roundtable (made up of corporate execu-tives), the US Chamber of Commerce, the Securities Industry Association, and the New YorkStock Exchange (NYSE) have made their own proposals for change. One particularly influentialgroup is the NYSE, which can enact standards for firms that choose to list on the exchange. Asthe NYSE is generally considered the most prestigious exchange in the world in which to belisted, it has the power to influence the corporate system not only in the USA but also aroundthe world. Observers believe that these corporate governance reforms of the USA will acceleratethe governance reform of the banking sector in the USA and Japan (discussed in the abovesection).
11.3 The Asian Currency Market
In 1968, an Asian version of the Eurodollar came into existence with the acceptance of dollar-denominated deposits by commercial banks in Singapore. Singapore was an ideal location forthe birth of the Asian currency market. It had an excellent communication network, importantbanks, and a stable government. Because the US dollar accounts for most of the foreign-currencytransactions in Singapore, the term “Asian dollar market” can be used to represent the Asian cur-rency market.
The Asian currency market developed when the Singapore branch of the Bank of Americaproposed that the monetary authority of Singapore relax taxes and restrictions. The monetaryauthority accepted these proposals and extended a number of important incentives to foreignbanks so that dollar accounts could be held in Singapore. They included: (1) the removal of anexisting 40 percent tax on interest payments on foreign-currency deposits; (2) the reduction ofthe tax rate on interest earned from offshore loans; (3) the abolition of stamp duties on CDs andbills of exchange; and (4) the abolition of the 20 percent reserve requirements for Asian Cur-rency Units. An Asian Currency Unit (ACU) is a section within a bank that has authority andseparate accountability for Asian currency market operations.
274 INTERNATIONAL FINANCIAL MARKETS

On October 1, 1968, the Bank of America was authorized to start its ACU operations. In1969, a number of other banks, such as the Chartered Bank, Citibank, the Hong Kong andShanghai Bank, and the United Chase Merchants Bank, obtained permission to set up ACUs inSingapore. Since 1969, other leading domestic and foreign banks in Singapore have kept up theirown ACUs. There are several guidelines within which ACUs are required to operate:
1 They can accept foreign-currency deposits from foreigners without the prior approval of theauthorities.
2 They can lend to individuals or companies outside the British Commonwealth countrieswithout the prior approval of the authorities.
3 They cannot lend to residents of Singapore or British Commonwealth countries without theprior approval of the authorities.
In theory, several reasons explain the development of the Asian currency market in Singapore.First, Asian dollar deposits would attract other deposits, increase banking activities, and earnincome from these financial services. These earnings would also improve Singapore’s balance ofpayments and develop a service-oriented industry. Second, Singapore might obtain a degree ofadditional political security. The existence of foreign deposits and foreign banks in Singaporemight build support for its neutrality and increase its importance as an Asian financial center.Third, the presence of the Asian currency market in Singapore would enhance its publicity andprestige. Fourth, most Southeast Asian countries need large amounts of capital for their economicdevelopment. Because Singapore is located at the center of this area, it is a logical place for thedevelopment of the Asian currency market.
Currently, approximately 150 banks or other financial institutions have licenses from the Monetary Authority of Singapore to operate ACUs. Most deposits in ACUs are in US dollars,but other foreign currencies such as British pounds, Swiss francs, euros, and Japanese yen are alsoaccepted. Domestic residents are normally prohibited from participating in the offshore market.Similarly, offshore financial institutions are restricted in their dealings with the domestic market.
There are no taxes on interest paid on foreign-currency deposits and no restrictions appliedto capital outflows and inflows. Regular foreign-currency deposits are accepted in amounts as lowas $25,000. Although the minimum deposit maturity is 1 month, the market offers depositorsoptions of varying maturities. Citicorp introduced negotiable CDs in 1970, but the active marketfor negotiable CDs really developed in 1977 with the issuance of US$25 million, 3-year floating-rate CDs by the Dai-Ichi Kangyo Bank. Fixed-rate CDs were introduced in 1978 withmaturities of 6–9 months. Since 1978, numerous issues of both floating-rate and fixed-rate CDshave attracted the attention of investors outside the Asian area.
The Asian currency market is primarily an interbank market. Interest rates for Asian currencyloans are based on either the Singapore Interbank Offered Rate (SIBOR) or the London Inter-bank Offered Rate (LIBOR). The LIBOR was preferred by both banks and customers in theearly years of the market’s development, but in recent years the SIBOR has been used more fre-quently. Asian dollar interest rates closely follow those in the Eurodollar market.
In the 35 years of its existence, the Asian currency market has obtained a major status. It hasexpanded beyond its original base in Singapore, but Singapore remains its leading center in termsof cross-border trading volume, which rivals the International Banking Facilities of the USA andthe Japan Offshore Market. While the funds deposited with banks in the Asian currency marketare primarily lent to Asian borrowers, close links join this market to non-Asian financial centers.
THE ASIAN CURRENCY MARKET 275

With the Asian currency market, the Eurocurrency market, like the foreign-exchange market, hascome to operate on a 24-hour basis.
11.4 The International Bond Market
The international capital market consists of the international bond market and the interna-tional equity market. Table 11.3 shows selected indicators at year-end 2001 on the size of thecapital markets around the world. Several inferences can be drawn from this table. First, theworld’s stock market capitalization was almost as big as the world’s gross domestic product(GDP). Second, the US GDP was only 1.4 times as big as the combined GDP of some 130emerging market countries, but its stock market capitalization was 7.1 times as big as the com-bined stock market capitalization of these emerging market countries. Third, G-5 countries (theUSA, Japan, Germany, the UK, and France) accounted for 61 percent of the world’s GDP, 71percent of the world’s total equity market capitalization, and 75 percent of the world’s total debtsecurities.
These statistics indicate how powerful these G-5 countries are in terms of their wealth andcapital market activities.
11.4.1 Types of international bonds
International bonds are those bonds that are initially sold outside the country of the borrower.International bonds consist of foreign bonds, Eurobonds, and global bonds. An important issuewith bond financing has to do with the currency issue. The currency of issue is not necessarilythe same as the country of issue, although the two may coincide. For example, if a US companysells a yen-denominated bond in Japan, the currency of issue is that of the country of issue.However, if a US company sells a dollar-denominated bond in Japan, the currency of issue is notthat of the country of issue. In the former of these situations, the bond is called a foreign bond;in the latter, the bond is called a Eurobond. A global bond is hybrid in nature, because it can besold inside as well as outside the country in whose currency it is denominated. For example, a
276 INTERNATIONAL FINANCIAL MARKETS
Table 11.3 Selected indicators on the size of the capital markets, 2001 (billions of US dollars)
Country Gross domestic product Stock market capitalization Debt securities
USA 10,082 13,827 18,504Japan 4,165 2,294 6,295Germany 1,855 1,072 3,060UK 1,423 2,165 1,748France 1,312 1,068 1,681Emerging markets 7,212 1,947 2,345All others 4,946 6,502 8,159World total 30,995 28,875 41,792
Source: The International Monetary Fund, Global Financial Stability Report, Washington, DC, Mar. 2003,p. 121.

dollar-denominated bond tradable in New York (domestic market) and Tokyo (Eurobond market)is called a global bond. Let us provide a more general description of these three internationalbonds: foreign bonds, Eurobonds, and global bonds.
FOREIGN BONDS Bonds sold in a particular national market by a foreign borrower, under-written by a syndicate of brokers from that country, and denominated in the currency of thatcountry are called foreign bonds. Of course, foreign bonds fall under the regulatory jurisdictionof national or domestic authorities. Dollar-denominated bonds sold in New York by a Mexicanfirm are foreign bonds; these bonds should be registered with the US Securities and ExchangeCommission (SEC). Foreign bonds are similar in many respects to the public debt sold in domes-tic capital markets, but their issuer is a foreigner.
The first foreign bond was issued in 1958. Most large foreign-bond issues have been floatedin the USA, the UK, and Switzerland. The weakening British pound in the late 1950s reducedthe importance of the domestic British capital market for foreign firms. The Interest Equaliza-tion Tax (1963–74) of the USA effectively stopped New York’s usefulness as a capital market fornew foreign bonds. Thus, international borrowers and investors shifted their activities from theUSA to Europe. This shift caused the Eurobond market to develop.
EUROBONDS Bonds underwritten by an international syndicate of brokers and sold simulta-neously in many countries other than the country of the issuing entity are called Eurobonds. Inother words, since the term “foreign bonds” refers to those bonds that are issued in the externalsectors of financial markets – sectors that fall outside the regulatory environment of nationalauthorities – Eurobonds are, therefore, issued outside the country in whose currency they aredenominated. The Eurobond market is almost entirely free of official regulation, but is self-regulated by the Association of International Bond Dealers. For example, dollar-denominatedbonds sold outside the USA are Eurobonds; these bonds are not registered under the US Securities Act and may not be offered or sold to Americans as part of the distribution.
The first Eurobond issue was launched in 1963. Eurobonds are direct claims on leadingMNCs, governments, or governmental enterprises. They are sold simultaneously in many coun-tries through multinational syndicates of underwriting brokers. The Eurobond market is similarto the Eurodollar market in one respect. Both markets are “external,” because obligations avail-able in these markets are denominated in foreign currencies outside the country of issue.
There are a number of important differences between the Eurodollar market and theEurobond market. First, the Eurodollar market is an international money market, but theEurobond market is an international capital market. Second, the Eurodollar market is a finan-cial intermediation market; major world banks operate as intermediaries between depositors andborrowers of Eurodollars. By contrast, the Eurobond market is a direct market in which investorshold the securities issued by the final borrowers; in other words, Eurobonds are issued directlyby the final borrowers.
The Eurobond market has a number of attractive factors. First, interest income earned onEurobonds is usually not subject to a withholding tax. The absence of this tax makes Eurobondsattractive to those investors who either want to evade taxes or who cannot recover taxes with-held. Second, the Eurobond market is often described as a market free from national regulations.Many countries, including the USA, tend to strictly regulate the access of foreign borrowers totheir domestic capital markets. But these countries are often more flexible about securities denom-inated in foreign currencies and sold to their residents who already possess those foreign cur-
THE INTERNATIONAL BOND MARKET 277

rencies. Moreover, disclosure requirements in the international bond market are less stringentthan those of the USA.
GLOBAL BONDS As noted above, there is some separation between the Eurobond market andthe domestic bond market. An issue normally must choose on which bond market to sell.Demand for the bond is thus constrained by the barriers between the markets. In the past few years, an instrument known as the global bond has been developed to overcome this segmentation.
Global bonds are bonds sold inside as well as outside the country in whose currency they aredenominated. For example, dollar-denominated bonds sold in New York (domestic bond market)and Tokyo (Eurobond market) are called dollar global bonds. Similarly, pound-denominatedbonds sold in London and Los Angeles are pound global bonds. While global bonds follow thedomestic market practice of registration of bonds, they follow the Eurobond market practiceregarding their distribution. Dollar global bonds combine SEC registration and US clearingarrangements with separate clearing on the Eurobond market.
The World Bank issued the first such bonds in September 1989 and still remains the leadingissuer of global bonds. The Bank raised $1.5 billion through a dollar global bond issue that wasoffered in the USA as well as in Eurobond markets. It has issued in US dollars, euros, Japaneseyen, and British pounds. On July 15, 1992, Japan’s Matsushita Electric Industrial issued the firstglobal bond by a corporate borrower. A number of sovereigns have also issued global bonds.Among the “Group of Ten” countries, Italy and Sweden have used this technique. Sweden issued$2 billion in dollar global bonds in February 1993; and Italy issued $5 billion in dollar globalbonds in September 1993. Some developing countries have just begun to issue global bonds. Forexample, in early September 1997 Venezuela sold $4 billion of new 30-year global bonds toinvestors from around the world. This issue was described as the largest global bond deal issuedby a developing country.
By allowing issuers to solicit demand for a variety of markets and to offer greater liquidity toinvestors, global bonds have potential to reduce borrowing costs. Such cost savings might be,however, offset by the fixed costs of borrowing through the global format, such as registrationand clearing arrangements. These costs for global bonds are presumably higher than for com-parable Eurobond issues.
11.4.2 The international bond market size and its currency denomination
Table 11.4 shows that the outstanding amount of international debt securities reached a histor-ical high of $10,266 billion in 2003. Eurobonds account for approximately 70 percent of theinternational bond market, whereas foreign bonds and global bonds account for only 30 percentof the market. Industrial countries account for approximately 85 percent of the internationalbond market, while developing countries accommodate the remaining 15 percent of the market.
International bonds are denominated in various currencies: British pounds, euros, Japaneseyen, Swiss francs, US dollars, and composite units of currencies. These multiple-currency bondsmay be classified as currency option bonds and currency cocktail bonds. Table 11.4 shows thecurrency composition of international bond issues from 1996 to 2003. In 2003, 28 percent wasdenominated in US dollars, 41 percent was denominated in euros, and the remaining 31 percentwas denominated in either other single currencies or composite units of currencies. International
278 INTERNATIONAL FINANCIAL MARKETS

bond issues denominated in ECU/euros expanded sharply from $74 billion in 1996 to $4,250billion in 2003. This was a growth rate well above the average for the international market, andit was reflected in a rise of the euro share from 2.5 percent in 1996 to 41.4 percent in 2003. TheEuropean Currency Unit (ECU) was a weighted value of a basket of 12 European Communitycurrencies and the cornerstone of the European Monetary System; the euro replaced the ECUas a common currency for the European Union in January 1999.
CURRENCY OPTION BONDS The holders of currency option bonds are allowed to receive theirinterest income in the currency of their option from among two or three predetermined cur-rencies at a predetermined exchange rate. The original bond contract contains the currencies ofchoice and the exchange rates. The currency option enhances the exchange guarantee for theinvestor. Thus, the investor will make some gain if all currencies included in the contract do notdepreciate against the desired currency.
CURRENCY COCKTAIL BONDS Bonds denominated in a standard “currency basket” of severaldifferent currencies are called currency cocktail bonds. A number of these bonds have beendeveloped to minimize or hedge foreign-exchange risk associated with single-currency bonds.Some popular forms of such bonds include special drawing rights and euros, both of which aredescribed in chapter 4. The currency diversification provided by these bonds can be replicatedby individual investors. Thus, currency cocktail bonds have never gained wide acceptance withEuromarket borrowers.
11.4.3 Types of international bonds
Five types of international bonds are straight (fixed-rate) bonds, floating-rate notes, convertiblebonds, bonds with warrants, and other bonds.
STRAIGHT BONDS These bonds have fixed maturities and carry a fixed rate of interest. Straightbonds are repaid by amortization or in a lump sum at the maturity date. The amortizationmethod refers to the retirement of a long-term debt by making a set of equal periodic payments.These periodic payments include both interest and principal. Alternatively, a borrower may retirehis or her bonds by redeeming the face value of the bonds at maturity. Under this method, afixed interest on the face value of the bonds is paid at regular intervals.
THE INTERNATIONAL BOND MARKET 279
Table 11.4 Outstanding amounts of international debt securities (billions of US dollars)
1996 1997 1998 1999 2000 2001 2002 2003
Outstanding debts 2,939 3,285 4,055 4,999 5,875 7,113 8,344 10,266
All currencies 100% 100% 100% 100% 100% 100% 100% 100%US dollar 33.9 43.7 45.2 47.2 49.5 50.8 47.6 27.9ECU/euro 2.5 2.0 3.9 29.0 30.1 32.2 35.9 41.4Other currencies 63.6 54.3 50.9 23.8 20.4 17.0 16.5 30.7
Source: The International Monetary Fund, Global Financial Stability Report, Washington, DC, various issues.

Fixed-rate bonds are technically unsecured, debenture bonds, because almost all of them arenot secured by any specific property of the borrower. Because of this, debenture bondholdersbecome general creditors in the event of default; they look to the nature of the borrower’s assets,its earning power, and its general credit strength.
Perhaps the greatest advantage of all types of international bonds for individual investors isthat interest income on them is exempt from withholding taxes at the source. Investors mustreport their interest income to their national authorities, but both tax avoidance and tax evasionare extremely widespread. Official institutions hold a large portion of investment in internationalbonds and are not liable for tax. Another large class of investors in international bonds consistsof private institutions. These private institutions legally avoid tax by being in tax-haven countries.
FLOATING-RATE NOTES These notes are frequently called floating-rate bonds. The rate of returnon these notes is adjusted at regular intervals, usually every 6 months, to reflect changes in short-term market rates. Because one of their main objectives is to provide dollar capital for non-USbanks, most floating-rate notes are issued in dollars.
Like other international bonds, floating-rate notes are issued in denominations of $1,000 each.They usually carry a margin of 1/4 percent above the LIBOR, and this margin is normallyadjusted every 6 months. The link between the rate of return on floating-rate notes and LIBORrates is intended to protect the investor against capital loss.
CONVERTIBLE BONDS Bonds of this type are convertible into parent common stock. The con-version price is usually fixed at a certain premium above the market price of the common stockon the date of the bond issue. Investors are free to convert their fixed-income securities intocommon stock at any time before the conversion privilege expires; the borrowing company isobliged to issue new stock for that purpose.
The convertible provision is designed to increase the marketability of fixed-rate Eurobonds.Convertible bonds provide investors with a steady income and an opportunity to participate inrising stock prices. Thus, their interest rates have been 1.5 to 2 percent below those on fixed-ratebonds. Because international investors are inflation-conscious, they prefer convertible bonds,which maintain the purchasing power of money.
BONDS WITH WARRANTS Some international bonds are issued with warrants. A warrant is anoption to buy a stated number of common shares at a stated price during a prescribed period.Warrants pay no dividends, have no voting rights, and become worthless at expiration unless theprice of the common stock exceeds the exercise price. Convertible Eurobonds do not bring inadditional funds. When they are converted, common stock increases, and the convertible secu-rities are retired. When warrants are exercised, common stock and cash increase simultaneously.
OTHER BONDS A major portion of other bonds consists of zero-coupon bonds, which provideall of the cash payment (interest and principal) when they mature. These bonds do not pay periodic interest, but are sold at a deep discount from their face value. The return to the investoris the excess of the face value over the market price.
Zero-coupon bonds have several advantages over conventional bonds. First, there is immedi-ate cash inflow to the issuing company but no periodic interest to pay. Second, a big tax advantage exists for the issuing company, because any discount from the maturity value may be amortized for tax purposes by the company over the life of the bond.
280 INTERNATIONAL FINANCIAL MARKETS

THE PERCENTAGE BREAKDOWN OF THE TOTAL BOND MARKET BY INSTRUMENT Table 11.5shows the instrument composition of international bond issues and their percentage breakdownduring the period from 1997 to 2003. In 2003, the percentage breakdown of the total bondmarket by instrument was 75 percent for straight bonds, 22 percent for floating-rate bonds, and3 percent for convertible bonds. Straight bonds are most popular because their two major fea-tures, fixed maturities and a fixed rate of interest, eliminate uncertainty in the eyes of investors.It is fair to assume that the percentages for the two types of bonds discussed just above – bondswith warrants and other bonds – are negligible.
11.5 The International Equity Market
Besides debt instruments such as the Eurodollar and bond markets, the equity capital market isanother important source of financing. Evidence indicates that the final decade of the twentiethcentury will go down in history as the period in which much of the world discovered the stockmarket as a major source of funds for their global expansion. Companies will increasingly turnto the stock market to raise money. This section focuses on how ownership in publicly ownedcorporations is traded throughout the world. The stock market consists of the primary marketand the secondary market. The primary market is a market in which the sale of new commonstock by corporations to initial investors occurs. The secondary market is a market in which thepreviously issued common stock is traded between investors.
11.5.1 New trends in the stock markets
In recent years, a number of new trends have begun to emerge in the stock markets around theworld: (1) alliance, (2) crosslisting, and (3) concentration.
STOCK MARKET ALLIANCES There are some 150 stock exchanges in the world. Within the past10 years, these stock exchanges have scrambled to align with each other. Markets in Paris, Amsterdam, and Brussels have agreed to form Euronext, while a group of Scandinavian marketshas agreed to form Norex. Those deals prompted the London Stock Exchange and Frankfurt’sDeutsche Bourse to consider a merger into a new market, but that deal fell through in Septem-
THE INTERNATIONAL EQUITY MARKET 281
Table 11.5 The percentage breakdown of the total bond market by instrument (billions of USdollars)
Instruments 1997 1998 1999 2000 2001 2002 2003
Straight bonds 71.9 72.3 71.2 70.7 70.6 71.5 75.2Floating-rate notes 21.1 22.5 24.2 25.1 25.4 25.0 21.5Convertible bonds 4.6 4.6 4.3 3.9 3.8 3.4 3.2Bonds with warranties 2.4 0.4 0.0 0.1 0.2 0.1 0.1Total 100.0 100.0 100.0 100.0 100.0 100.0 100.0
Source: The Bank for International Settlements, International Banking and Financial Market Developments,various issues.

ber 2000. In 2001, the Lisbon Exchange decided it would join Euronext. NASDAQ has jointventures and alliances in Japan, Hong Kong, Australia, Canada, the UK, and Germany. In Sep-tember 2002, Euronext and the Tokyo Stock Exchange signed an alliance for cooperation andinvestor protection. In November 2002, the New Zealand Stock Exchange and the Hong KongStock Exchange signed an information-sharing agreement. The New York Stock Exchange hasrecently discussed alliances with markets in Canada, Latin America, Europe, and Asia.
There is a variety of reasons for this consolidation of stock exchanges: the growing speed andpower of telecommunication links, big and small investors’ keen interest in stocks from all partsof the world, and the fear of being left behind. Moreover, if national exchanges do not take theinitiative, they could be bypassed by new electronic trading systems. These same forces havecaused the burgeoning of online trading and have pushed national securities firms to expandtheir business overseas.
In addition, these same factors have caused another wave of stock markets becoming publiclytraded on the different stock exchanges. In 2001, the London Stock Exchange and the DeutscheBourse went public and are traded on their markets, while the Toronto Stock Exchange andSpain’s four regional stock exchanges went public in 2002. In December 2002, the Chicago Mercantile Exchange, the world’s second largest futures market, became publicly traded on theNew York Stock Exchange.
CROSSLISTING With the rise of cross-border mergers during the 1990s and the early 2000s,there arises a need for companies to crosslist their stocks on different exchanges around the world.By crosslisting its shares on foreign exchanges, an MNC hopes to:
1 Allow foreign investors to buy their shares in their home market.2 Increase the share price by taking advantage of the home country’s rules and regulations.3 Provide another market to support a new issuance.4 Establish a presence in that country in the instance that it wishes to conduct business there.5 Increase its visibility to its customers, creditors, suppliers, and the host government.6 Compensate local management and employees in the foreign affiliates.
Companies are obligated to adhere to the securities regulations of all countries where theirshares are listed. A decision to crosslist in the USA means that any company, domestic or foreign,must meet the accounting and disclosure requirements of the US Securities and Exchange Com-mission. Rules for listing requirements differ markedly from country to country, but analystsregard US requirements as the most restrictive in the world. Reconciliation of a company’s finan-cial statements to US standards can be a laborious process. Some foreign companies are reluc-tant to disclose hidden reserves and other pieces of company information. It might not appeartoo difficult for US companies to crosslist on certain foreign exchanges because their listingrequirements are not that restrictive, but certain barriers still exist, such as a foreign country’sspecific rules and reporting costs.
STOCK MARKET CONCENTRATION European stock markets have become more integrated sincethe European Union’s decision to switch their monetary union from the European Currency Unitto the euro, which was launched in 1999. Increasing integration, as reflected in converging pricedynamics across markets, results from various structural changes in European stock markets.There is already a large amount of crosslisting and trading among exchanges. Competition among
282 INTERNATIONAL FINANCIAL MARKETS

exchanges for listing and order flow has long characterized European securities markets. In addi-tion, exchanges have become subject to competition for order flow from alternative tradingsystems. Because there are benefits from achieving large size and attracting liquidity, anotherimportant response to competitive pressures has consisted of mergers among exchanges.
The concentration of stock market capitalization is not an “EU phenomenon,” but reflects aworldwide trend toward a single global market for certain instruments. Figure 11.3 shows theshare of the three, five, and 10 largest stock exchanges of total world stock market capitalization.The three largest stock markets accounted for 60 percent of the total market capitalization in1995 and 2001. Furthermore, the share of the five and 10 largest stock markets has increasedfrom 1995 to 2001. These statistics indicate a trend toward concentration of the world stockmarkets.
11.5.2 Privatization
In November 1996, Deutsche Telekom – a government-owned telecommunications company inGermany – raised $13.3 billion through its initial public offering. During the 1990s, the rolling-
THE INTERNATIONAL EQUITY MARKET 283
1995 2001Percent
100
80
60
40
20
0Top-31 Top-52 Top-103
Note: The data used are from the World Federation of Exchanges (market capitalization in US$ millions, end of period) and are subject to price changes between 1995 and 2001.1 1995: NYSE, Tokyo Stock Exchange (TSE), and London Stock Exchange (LSE). 2001: NYSE, NASDAQ, and TSE.2 1995: NYSE, TSE, LSE, NASDAQ, and Deutsche Börse. 2001: NYSE, NASDAQ, TSE, LSE, and Euronext.3 1995: NYSE, TSE, LSE, NASDAQ, Deutsche Börse, Paris Bourse, Swiss Exchange, Toronto Stock Exchange, Hong Kong Stock Exchange and Clearing, and Amsterdam Exchange. 2001: NYSE, NASDAQ, TSE, LSE, Euronext, Deutsche Börse, Toronto Stock Exchange, Borsa Italiana, Swiss Exchange, and Hong Kong Stock Exchange and Clearing.
Figure 11.3 Major stock exchanges as a share of world stock market capitalization
Source: OECD, Financial Market Trends, Mar. 2003, p. 109.

back of state ownership in the economy through privatization gathered considerable pace bothin OECD countries and outside the OECD arena. The OECD – the Organization for EconomicCooperation and Development – is an organization of 29 countries and most of these countriesare industrialized.
Privatization is a situation in which government-owned assets are sold to private individualsor groups. In recent years, even many developing countries have been selling government-ownedenterprises to private investors. For example, the amount of money raised through privatizationby the Indian government increased from $100 million in 1996 to $1,234 million in 1999. InMay 2000, the Indian government announced that it would privatize most of the government-owned enterprises, including Air India, which is the international flag carrier for India. Figure11.4 shows that the global amount of money raised through privatization by developing coun-tries surged from almost nothing in the early 1980s to $67 billion in 1997, before decreasing to$42 billion in 1999. The World Bank estimates that cumulative privatization revenues world-wide have exceeded $1 trillion by 2000. Privatization could play an important role in the ongoingtransformation of emerging capital markets: due to its high profile, privatization may facilitate aswitch from investment in bonds to investment in equities.
Why privatize? First, governments try to assist the development of capital markets by increas-ing market capitalization and liquidity. Second, a closely related motive is to widen share own-ership and to create a “shareholder culture” in the population at large. Third, governments useprivatization to raise money. Fourth, by replacing public-sector decision-making and control withthose of the private sector, privatization is inducing notable changes in the corporate governancestructure in important segments of the economy. Finally, privatization enables governments touse their resources more efficiently. By 1990, state-owned enterprises (SOEs) consumed nearly20 percent of gross domestic investment in developing economies, while producing just morethan 10 percent of gross domestic product: “Overall, privatization has dramatically improved theperformance of former SOEs” (The World Bank 2003b, p. 96).
How is it done? Privatization takes many forms. First, a government sells state-owned com-panies directly to a group of ultimate investors. Second, the government divests itself of acompany it owns through public offerings of equity in the primary market. The primary marketis a market in which the sale of new securities occurs. Third, the government may sell residual
284 INTERNATIONAL FINANCIAL MARKETS
50
40
30
20
10
0
60
70
$ billions
1984
1988
1989
1990
1991
1992
1993
1994
1995
1996
1997
1998
1999
Year
Figure 11.4 Developing countries’ privatization revenues
Source: The World Bank, Global Economic Prospects, 2003, p. 96.

stocks of partly privatized companies in the secondary market. The secondary market is a market for securities that have already been issued and sold. Finally, other privatization methodsinclude leasing, joint ventures, management contracts, and concessions. In 1998, direct sales ofgovernment-owned enterprises by developing countries accounted for almost 75 percent of privatization revenues and public offerings contributed to most of the remaining sales.
What are the essential elements for a successful privatization? Any successful privatizationinvolves at least three elements. First, a government needs a political agreement to sell all or partof a company it owns. Second, the company should have the potential to transform itself into aprofit-making entity rather than a government-subsidized burden. Third, the government has tofind underwriters who will distribute and market the shares domestically and internationally.
11.6 Long-Term Capital Flows to Developing Countries
Figure 11.5(a) shows that long-term capital flows to developing countries have declined since1998, mainly due to the Asian financial crisis of 1997–8 and the recent slowdown of the globaleconomy. New long-term flows totaled $261 billion in 2002, $83 billion below the peak in 1997.Sharp declines in private capital market flows in recent years – bank loans, bonds, and portfolioequity flows – account for nearly all of this decline. As a result, the share of emerging marketsin global capital market financing fell to 3 percent in 2002, compared to 6.4 percent in 1998and 11 percent in 1997. Figure 11.5(b) shows that even foreign direct investment (FDI), whichtends to be more resilient than capital market flows, has slowly but steadily declined since 1999.
11.6.1 Rotation from debt to equity
The weakness in the growth of private-sector debt flows is unprecedented in the post-1965period. In the decade of the 1970s, developing-country debt posted a compound annual growth
LONG-TERM CAPITAL FLOWS TO DEVELOPING COUNTRIES 285
300
250
200
150
100
50
01995 1996 1997 1998 1999 2000 2001 2002
Private sector
Public sector
Year
$ billions
(a) 200
150
100
50
0
–501995 1996 1997 1998 1999 2000 2001 2002
Inward FDI
Debt
Year
$ billions
(b)
Figure 11.5 (a) Net financial flows to developing countries, 1995–2002; (b) net financial flowsto developing countries from the private sector, 1995–2002
Source: The World Bank.

rate of 24 percent. The Latin American debt crisis of the early 1980s slowed this growth but didnot end it. Since the middle of 1998, however, the whole context for development financing hasshifted. As borrowers have chosen, or been required by their creditors, to pay down their debts,the external debt of developing countries has fallen in dollar terms. As debt is being repaid toprivate-sector creditors, net equity flows to developing countries remain significant, mainlythough the route of FDI.
The shifting pattern of private flows – debt down, equity up – has had an important impli-cation for the associated stock of debt (see table 11.6). While the stock of developing countryexternal debt outstanding from all sources has fallen since 1998, the stock of equity capital ownedand controlled by foreigners has risen over the past decade. Table 11.6 shows that the drop inthe external debt-to-equity ratio, from 316 percent in 1997 to 196 percent in 2002, has beenspread across all regions of the developing world. The World Bank highlighted three aspects ofthe shift in its 2004 Global Development Finance. First, the shift is partly driven by investor preferences. Debt investors have become more wary of holding debt claims on developing coun-tries, while MNCs have increasingly come to believe that the developing world offers significantgrowth opportunities. Second, the shift is privately driven by the preferences of developingcountry policy-makers. To protect against debt crises, such as the Asian financial crisis of 1997–8,countries have strengthened their precautionary reserve holdings and shifted their liabilities tomore stable form of investment, especially FDI. Finally, on balance, the shift is a positive devel-opment. This rotation from debt to equity is best seen as a constructive development, because itputs development finance on a stable footing.
286 INTERNATIONAL FINANCIAL MARKETS
Table 11.6 Developing countries’ debt-to-equity ratios, 1997and 2002
External debt
Region 1997 2002 % GDP
East Asia and Pacific 218% 134% 65.0%Europe and Central Asia 505% 293% 66.8%Latin American and the Caribbean 284% 162% 67.7%Middle East and North Africa 394% 371% 42.5%South Asia 968% 613% 30.5%Sub-Saharan Africa 515% 303% 90.6%All developing countries 316% 196% 61.7%
Source: The World Bank, Global Development Finance, Washington,DC, 2003 and 2004.
SUMMARY
The international financial market consists of the Eurodollar market, the international bond market,and the international equity market. Eurodollars are dollar-denominated deposits in banks all overthe world except the USA. The Eurodollar market is the truly international money market, undis-turbed by the rules and restrictions of any national authority. Eurodollars have become a major

QUESTIONS 287
source of short-term loans for MNCs to finance their working capital needs and foreign trade.With the growth in availability of Eurodollars, Eurobanks have begun to extend medium-termEurodollar loans for MNCs to finance their medium-term needs.
Although the international bond and equity markets are of a more recent vintage, they paral-lel the importance of multinational financial management and mainly facilitate expansion involv-ing fixed asset commitment. During the 1990s, the rolling-back of state ownership in the economythrough privatization gathered considerable pace in the world. Privatization may play an impor-tant role in the ongoing transformation of capital markets in the world: due to its high profile,privatization may facilitate a switch from investment in bonds to investment in equities.
Questions
1 Explain the globalization of financial markets.2 How has technology affected the globalization of financial markets?3 Why has the Eurocurrency market grown so rapidly?4 If Germany imposes interest rate ceilings on German bank deposits, what is the likely
effect of this regulation on the euro interest rate?5 Why have bank regulators and market analysts expressed some concern about the
stability of the interbank market?6 What is the difference between Eurobonds and foreign bonds?7 What is the difference between currency option bonds and currency cocktail bonds?8 Describe two new instruments: Euronotes and global bonds.9 Explain the Basel Accord of 1988.
10 What is the major difference in the role of commercial banks in corporate governancebetween the USA and Japan?
11 How can a government privatize state-owned companies?12 In April 2003, the Basel Committee on Banking Supervision released for public comment
the new Basel Capital Accord, which will replace the 1988 Capital Accord. What are thethree pillars of this new proposal?
13 What are some reasons for a company to crosslist its shares?14 The World Bank highlighted three aspects of the recent developing-country shift from
debt to equity in its 2003 Global Development Finance. Briefly describe these threeaspects of the shift.

288 INTERNATIONAL FINANCIAL MARKETS
Problems
1 Fill in the following blank spaces with a reserve ratio of 20 percent:
Acquired Required Excess Amount bankreserves reserves reserves can lend
Bank 1 $100.00 $20.00 $80.00 $80.00Bank 2Bank 3Bank 4Bank 5Bank 6Bank 7Bank 8Bank 9Bank 10Bank 11Bank 12Bank 13Total amount loaned
2 Assume that an international bank has the following simplified balance sheet. The reserveratio is 20 percent:
Assets 1 2 Liabilities and net worth 1 2
Reserves $4,400 – – Demand deposits $20,000 – –Securities 7,600 – –Loans 8,000
(a) Determine the maximum amount that this bank can safely lend. Show in column 1how the bank’s balance sheet will appear after the bank has loaned this amount.
(b) By how much has the supply of money changed?

REFERENCES 289
(c) Show the new balance sheet in column 2 after checks drawn for the entire amountof the new loans have been cleared against this bank.
(d) To what extent will this lending alter the supply of money?(e) Aside from the leakage of required reserves at each stage of the lending process,
there are some other leakages of money from the lending process. List and discussthem.
(f) Assume: (1) an American citizen transfers $2,000 of his deposits from a US bank toa Eurobank, and (2) Eurobanks as a whole keep 5 percent of their Eurodollar depositsin vault cash. Determine the maximum amount of Eurodollar supply that Eurobankscan create on the basis of $2,000.
3 A multinational company holds a $1,000 zero-coupon bond with a maturity of 15 yearsand a yield rate of 16 percent. What is the market value of the zero-coupon bond?
4 A multinational company has issued a 10-year, $1,000 zero-coupon bond to yield 10percent.(a) What is the initial price of the bond?(b) If interest rates dropped to 8 percent immediately upon issue, what would be the
price of the bond?(c) If interest rate rose to 12 percent immediately upon issue, what would be the price
of the bond?5 A multinational company has common stock outstanding. Each share of the common stock
pays $3.60 dividends per year, and the stockholder requires a 12-percent rate of return.What is the price of the common stock?
REFERENCES
Abken, P. A., “Globalization of Stock, Futures, andOptions Markets,” in Federal Reserve Bank ofAtlanta, ed., Financial Derivatives, 1993, pp.3–24.
Bekaert, G., C. R. Harvey, and C. T. Lundblad,“Equity Market Liberalization in EmergingMarkets,” Review, Federal Reserve Bank of St.Louis, July/Aug. 2003, pp. 53–80.
Butler, K. C., Multinational Finance, Cincinnati,OH: South-Western College Publishing, 1977,ch. 17.
International Monetary Fund, Global Financial Sta-bility Report, Washington, DC: IMF, Mar. 2003.
Karmin, C., “Decade Saw Vast Changes in GlobalInvesting as the World’s Market Cap Surpassed itsGDP,” The Wall Street Journal, Dec. 31, 1999, p.C12.
Lopez, J. A., “The Basel Proposal for a New CapitalAdequacy Framework,” The Economic Newsletter,
Federal Reserve Bank of San Francisco, No. 99-23, July 30, 1999.
Lopez, J. A., “Disclosure as a Supervisory Tool: Pillar3 of Basel II,” The Economic Newsletter, FederalReserve Bank of San Francisco, No. 2003-22,Aug. 1, 2003.
“One World, How Many Stock Exchanges,” TheWall Street Journal, May 15, 2000, pp. C1, C20.
Organization for Economic Cooperation andDevelopment, Financial Market Trends, Paris:OECD, Mar. 2003.
Saving, J. S., “Privatization and the Transition to aMarket Economy,” Economic Review, FederalReserve Bank of Dallas, Fourth Quarter 1999, pp.17–24.
The World Bank, Global Development Finance,Washington, DC: The World Bank, 2003a.
The World Bank, Global Economic Prospects, Washington, DC: The World Bank, 2003b.

290 INTERNATIONAL FINANCIAL MARKETS
Case Problem 11: The Rise and Fall of the USStock Market
The USA and Japan have long been like an old married couple. The USA likes to borrow andspend, while Japan likes to save and invest. And for almost 20 years, this odd relationshiphas endured, but not without strain. By the late 1990s, however, a new question came tothe forefront: whether the world’s biggest saver would continue to provide relatively cheapcapital to the world’s biggest spender.
It is no secret that the US economic expansion of the 1990s had been sustained with bor-rowed money abroad. American companies accrued huge debts, often to buy back companyshares. American consumer debt is enormous, and continues to grow with no end in sight.And the spending boom has generated record trade deficits, including $500 billion in 2002.To finance current-account deficits, the USA has been forced to borrow approximately $2billion every working day, most of which comes from foreign investors. For many years, onlya small number of gloomy economists and investors worried aloud about this, but to noavail. By the late 1990s, however, many Japanese investors and policy-makers believed thatUS financial markets were in a bubble (see figure 11.6). US stock prices relative to earningswere high by historical standards. Various studies of stock market valuations concluded thatby past standards the main US stock indices could be overvalued by some 20–40 percent.On the other hand, most Americans thought that US financial markets reflected fundamen-tals, until the US stock market collapsed in March 2000.
StockStock
GDP GDP
USA600
300
450
150
01980 1985 1990 1995 1999
Germany600
300
450
150
01980 1985 1990
Year1995 1999
Japan600
300
450
150
01980 1985 1990 1995 1999
Stock
GDP
Figure 11.6 Stock prices and gross domestic product, inflation-adjusted, logarithmic scale, 1985 = 100
Source: The International Monetary Fund, Washington, DC.

CASE PROBLEM 11 291
Japanese and other foreign investors continue to fund the US economy even today, butthe boom in the US economy and its stock market ended in March 2000. In addition, as warand terrorism fears mount, nobody thinks that this kind of inflow can be sustained indefinitely– a change that may boost the inflation rate and hurt corporate profits, the US dollar, andinvestment returns. The financial reversal would also bring the collapse of the US securitypolicy and of its calculated strategy of world pacification.
In 2003, all US stock indexes recorded their strongest rally since the Internet bubble burstin March 2000. Table 11.7 shows that all three major stock indexes – the Dow Jones, Standard & Poor’s 500, and the NASDAQ Composite – posted their first annual gains since1999. Nevertheless, the NASDAQ Composite Index of 2,000 at the end of 2003 was still 60percent lower than its peak of 5,000 in 1999. Furthermore, some portfolio managers, such asRichard Bernstein of Merrill Lynch, argued that US stocks were so overpriced that they couldfall as much as 14 percent in 2004. No wonder some pros continue to feel uncomfortable asthey return from the beach. The worry is that investors have overdone things again. The stockmarket appears to feel like “the mania-inspired environment of the late 1990s,” a time inwhich investors ignored repeated warning signs. Factors such as rising interest rates, over-aggressive earnings forecasts, and more violence in Iraq could ruin the stock market rally again.
There are new concerns that the current US economy may follow Japan’s trail of the 1990s.Figure 11.7 shows that the patterns of the Nikkei 225 and the NASDAQ indices before andafter their booms and bursts are strikingly similar. Lingering possibilities of deflation and lowinterest rates intensify the worry. Some experts say that the US economy is different fromJapan’s in several ways and thus will not follow Japan’s trail.
Case Questions
1 What is a bubble?2 Japanese investors and policy-makers believed that the US financial markets of the late
1990s were in a bubble. On the other hand, most Americans thought that US financialmarkets reflected market fundamentals. Why were Japanese people so sensitive to assetbubbles?
Table 11.7 The performance of the major US stock indexes
Index 2003 2002 2001 2000 1999
Dow Jones +0.25 -0.17 -0.7 -0.6 +0.25Standard & Poor’s 500 +0.26 -0.23 -0.13 -0.10 +0.20NASDAQ Composite +0.50 -0.31 -0.21 -0.39 +1.02
Source: “Stocks Post First Winning Year Since 1999,” www.cnn.com,Jan. 1, 2004.

292 INTERNATIONAL FINANCIAL MARKETS
3 Why did most Americans think that the US financial markets of the 1990s reflectedmarket fundamentals?
4 List and discuss a number of major differences between the US economy and Japan’seconomy.
5 Describe the Japanese-style capitalism that had worked well up until 1990. How hasJapan tried to revive its sluggish economy?
6 The website of the US State Department, www.state.gov/background_notes, and thewebsite of the US Central Intelligence Agency, www.odci.gov/cia/publications/factbook,provide a variety of economic information about most countries around the world. Usethese two websites to perform a comparative economic analysis of the USA and Japan.
Sources: E. S. Browning, “After Hot Summer for Stocks, Time to Study,” The Wall Street Journal, Sept. 2,2003, pp. C1, C3; “Does the US economy follow the Japanese Path?” Southwest Economy, Federal ReserveBank of Dallas, July/Aug. 2003, p. 10; L. E. Ohanian, “When the Bubble Bursts: Psychology or Funda-mentals?” Business Review, Federal Reserve Bank of Philadelphia, Jan./Feb. 1996, pp. 1–14; J. Sapsford,“Japanese Exodus From Overseas Banking Picks Up Speed and Prestigious Names,” The Wall Street Journal,Nov. 13, 1998, p. A15; M. R. Sesit, “Japan Gets Ready to Flood Bond Markets as Other Global Offers areDrying Up,” The Wall Street Journal, Jan. 24, 2000, pp. C1, C23; B. Spindle, “A Flip of the Coins: YenDances, Euro Won’t,” The Wall Street Journal, May 19, 2000, pp. A21, A23; and B. Wysocki, “InvestmentBears Fret Over Goldiblocks,” The Wall Street Journal, Sept. 27, 1999, p. A1.
NASDAQ
Nikkei 225
Index Index5,000
4,500
3,500
2,500
1,500
500
0–5 –4 –3 –2 –1 0 1 2 3 4 5 6 7 8 9 10 11 12 13
4,000
3,000
2,000
1,000
0
5,000
10,000
15,000
20,000
30,000
40,000
50,000
25,000
35,000
45,000
Years from peak
Figure 11.7 The boom and bust of the US and Japanese stock markets: the shaded arearepresents the peaks of the US and Japanese stock markets, in March 2000 and Decem-ber 1989, respectively
Source: The Tokyo Stock Exchange, NASDAQ.

Opening Case 12: Argentina’s Currency Crisis
From December 2001 to January 2002, Argentina experienced tumultuous currencydevaluation, sovereign debt default, and a freeze on bank accounts that followed a10-year period during which the country pegged its peso one-to-one with the USdollar. During this period, Argentina took steps to privatize state-owned enterprisesand open itself to international trade – especially with Brazil, which became Argentina’slargest trading partner through the Mercosur customs union. In the 1990s, foreigncompanies purchased numerous privatized enterprises and foreign investors acquiredlarge holdings of private and sovereign debt from Argentina. For these foreign ownersto repatriate interest and profits, Argentina would have to generate substantial exportearnings.
However, one big obstacle to Argentine exports was the appreciation of the dollar,which caused the peso to appreciate against other major currencies since 1995. Thatis, prices in Argentina, combined with the one-to-one exchange rate with the dollar,made Argentine goods relatively expensive to the rest of the world. Argentina andBrazil were at least in the same boat during the mid-1990s, when Brazil also pegged itsreal to the US dollar. In contrast to the European Union, however, the Mercosurcustoms union did not impose exchange rate commitments between the membercountries, and Brazil unilaterally devalued the real in January 1999. Depreciation of thenominal exchange rate would have been the most direct way for Argentina also toreduce the high real exchange value of the peso. With the exchange rate straitjacketin place, however, the only way market forces could reduce the real exchange value ofthe peso was for prices in Argentina to fall relative to prices in the USA. However, itwas not easy for prices in Argentina to fall below those in the USA, given the US productivity boom, which held down US inflation and elevated real rates of return.
CHAPTER 12
International Banking Issuesand Country Risk Analysis

World banking has grown with the unprecedented expansion of economic activity since WorldWar II because banks have followed customers abroad. Recent events in developing countrieshave compelled analysts and investors to question international bankers about loans to econom-ically risky countries. Consequently, international banks have recently reduced their loans to somedeveloping countries, while developing countries have begun to use capital markets as their main
294 INTERNATIONAL BANKING ISSUES AND COUNTRY RISK ANALYSIS
With the fixed exchange rate, nominal interest rates in Argentina could not fallbelow those in the USA, although they could be higher due to default risk. This in-terest rate floor meant that any fall in prices relative to the USA implied correspond-ingly higher real borrowing costs in Argentina’s domestic credit markets. BetweenNovember 1994 and September 2001, for example, the price level in Argentina fell16.2 percent relative to the price level in the USA. The resulting real borrowing costshindered any economic recovery that would have reduced Argentina’s unemploymentrate from double-digit levels. Nevertheless, figure 12.1 shows that not even thispainful decrease in relative prices between Argentina and the USA was sufficient toprevent substantial appreciation of the real exchange value of the peso relative to theBrazilian real following Brazil’s devaluation in January 1999. This evolution of theArgentine economy – one step forward and two steps backward – satisfied no con-stituency: neither domestic borrowers, labor unions, and exporters, nor foreign creditors. In such circumstances, domestic politics generally holds the trump card,whereupon default and devaluation became the inevitable outcome.
Source: M. J. Dueker, “Argentina Agonists,” International Economic Trends, Feb. 2002, p. 1.
200
180
160
140
120
100
801994 1995 1996 1997 1998 1999 2000 2001
Year
Index (1995 = 100)
Figure 12.1 The real exchange rate between Argentina and Brazil: higher values indicatethat Argentine exports are more expensive

source of funds since the early 2000s. Bank loans, however, are still the dominant source of fundsfor most developing countries, because their capital markets are underdeveloped. Thus, in-ternational banks must reduce the impact of country risk through systematic assessment andmanagement.
This chapter has three major sections. The first section discusses international banking oper-ations. This section describes the types of foreign banking offices and interbank clearinghousesystems. The second section describes developing-country loans and their problems. This sectionfocuses on causes and policy responses for the two international lending crises: the Latin American debt crisis of the 1980s and the Asian financial crisis of 1997–8. The third sectionlooks at how banks and other investors assess unique risks of their foreign operations and howthese risks can be incorporated into routine operations.
12.1 International Banking Operations
International banks perform many vital tasks to help international transactions of multinationalcompanies. They finance foreign trade and foreign investment, underwrite international bonds,borrow and lend in the Eurodollar market, organize syndicated loans, participate in internationalcash management, solicit local currency deposits and loans, and give information and advice toclients. Commercial banks establish multinational operations for a variety of reasons (Rugman& Kamath 1999). First, managerial and marketing knowledge developed at home can be usedabroad with low marginal costs. Second, foreign bank subsidiaries have a knowledge advantageover local banks, because they can draw on their parent’s knowledge of personal contacts andcredit investigations. Third, large international banks have high-perceived prestige, liquidity, anddeposit safety that can be used to attract clients abroad. Fourth, foreign bank subsidiaries havea regulatory advantage over local banks, because they are often not subject to the same regula-tions as domestic banks. Fifth, growth prospects in a home market may be limited by a marketthat is largely saturated with the services offered by domestic banks. Sixth, international bankingoperations may reduce risk because greater stability of earnings is possible with internationaldiversification. Seventh, banks follow their multinational customers abroad to prevent the erosionof their client base to foreign banks.
12.1.1 The world’s largest financial companies
Table 12.1 lists the world’s 10 largest financial companies and the world’s 10 largest economiesas of December 31, 2002. The United States and Japan each claimed three of the world’s 10largest financial companies in terms of assets. The remaining four companies on the top 10 listwere from Germany (two), the United Kingdom (one), and Switzerland (one). The so-called G-5 group (the USA, Japan, Germany, the UK, and France) took the first top five spots in rank-ings of the world’s 10 largest economies.
China appears to be on its way to becoming the new center of global economic power. Indollar terms, China’s economy is about 10 percent of the US economy and 20 percent of Japan’s.However, after adjusting for differences in the cost of living (purchasing power parity), China’seconomy is more than half as large as the US economy and surpasses Japan to become the world’ssecond-largest economy; in 2002, the gross domestic product was $10.1 trillion for the USA, $6
INTERNATIONAL BANKING OPERATIONS 295

trillion for China, and $3.6 for Japan. It grew 7.3 percent in 2001 and by an average of about9 percent annually between 1980 and 2000. China expects its economy to grow at an annualrate of 6–7 percent over the next 10 years. In 2002, China attracted more foreign direct invest-ment than the USA. China’s membership of the World Trade Organization represents anothergreat step as it continues to move toward a more capitalistic economy. It will increase the oppor-tunities for Chinese growth and will help China play an increasingly large role in the globaleconomy. All of these trends together point to the emergence of China as a dominant, if not thedominant, economic power for the coming century.
Leaders of developing countries understand that international banks perform vital tasks fortheir governments and local companies. Despite this understanding, some critics argue, using afew selected statistics, that host governments are powerless over large international financial insti-tutions. For example, in 2002 only six countries had gross domestic products (GDP) greater thanthe total assets of Mizuho Financial Group of Japan. Table 12.1 indicates that this statementmust be true. In fact, when we compare these two (banks and economies), the grand total assetsof the world’s 10 largest financial companies are greater than the combined GDP of the eightlargest economies, excluding the USA and Japan. However, a nation’s GDP and a company’sassets are not comparable, because GDP is a measure of value added, while a company’s assetsare the total book value of all outstanding assets.
12.1.2 Types of foreign banking offices
There are six major types of foreign banking offices: representative offices, correspondent banks,branch banks, subsidiaries, agencies, and banking consortia. The list of alternatives also shouldinclude Edge Act corporations, international banking facilities, and export trading companies,which are discussed in other chapters.
296 INTERNATIONAL BANKING ISSUES AND COUNTRY RISK ANALYSIS
Table 12.1 The world’s 10 largest financial companies and the world’s 10 largest economies(billions of US dollars as of December 31, 2002)
Financial companies Countries
Ranking Name Assets Ranking Name GDP
1 Mizuho Financial Group $1,128 1 USA $10,0822 Citigroup 1,097 2 Japan 4,1663 Allianz 894 3 Germany 1,8564 Fannie Mae 887 4 UK 1,4545 Sumitomo Mitsui Financial Group 880 5 France 1,3106 UBS 853 6 China 1,1797 Mitsubishi Tokyo Financial Group 834 7 Italy 1,0748 Deutsche Bank 791 8 Canada 6899 HSBC Holdings 759 9 Brazil 595
10 J. P. Morgan Chase 758 10 Mexico 574
Sources: The Wall Street Journal, Sept. 24, 2003, pp. R1–R12 and “Total GDP 2002,” World Bank,www.worldbank.org/GDP.pdf, Sept. 31, 2002.

REPRESENTATIVE OFFICES National banks may establish offices in foreign countries when theirparent bank is doing business in these countries or in neighboring countries. These offices donot have traditional banking functions such as deposits, loans, letters of credit, drafts, andEurodollar markets.
Representative offices obtain information, give advice, and arrange local contacts for theirparent bank’s business customers. They help local business executives initiate inquiries about theparent bank’s services and introduce visiting executives to local banks. They put clients of parentbanks in contact with government officials or local business firms. They also provide their parentbank with credit analyses of local firms and political information about the country.
CORRESPONDENT BANKS Most major national banks maintain correspondent banking rela-tionships with local banks in many major foreign cities of the world. The correspondent bankingsystem is an informal arrangement in which a bank in a country maintains deposit balances withbanks in foreign countries and looks to them for services and assistance.
Local correspondent banks accept drafts and honor letters of credit. They also provide creditinformation. Finally, they collect or pay foreign funds from import or export transactions.
BRANCH BANKS Foreign branch banks do not have a corporate charter, a board of directors,or shares of common stock outstanding. Thus, they are an operational part of the parent bank;their assets and liabilities are, in fact, those of the parent bank.
Foreign branch banks provide a full range of banking services under the name and guaranteeof the parent bank. They attract big local borrowers because legal loan limits depend on the sizeof the parent bank.
FOREIGN SUBSIDIARY BANKS In spite of the fact that foreign subsidiary banks have their owncharter, their own board of directors, their own stockholders, and their own managers, they areowned completely or in major part by a foreign parent bank. They must comply with the lawsof the host country.
Because foreign subsidiary banks maintain their status as local institutions with local owner-ship and management, they are able to attract additional local deposits and have greater access tothe local business community. In addition, they are more likely to appeal to the foreign businesscommunity than a local bank because they have permanent relations with their foreign part owner.
AGENCIES Agencies of foreign banks can offer only a limited range of banking services. Theycannot accept transaction deposits from residents of their own country, and they must deal exclu-sively with commercial customers. Their primary function is to finance both exports and importsthat originate from companies in their own country. Agencies also actively participate in inter-bank credit markets and some other loans to companies in their own country.
CONSORTIUM BANKS A consortium bank is a permanent group of banks that handles largeinternational loans. It has its own charter, but it is a joint venture owned by two or more share-holder–parent banks, usually with different nationalities.
Consortium banks develop their business and take customers that the parent bank suggests.They arrange global syndicates for large international loans. Syndicates in large international loansspread risk and overcome the inability of a single bank to handle a large loan alone. Consortiumbanks also underwrite corporate securities and arrange mergers and acquisitions.
INTERNATIONAL BANKING OPERATIONS 297

Table 12.2 summarizes the organizational structure and characteristics of foreign bankingoffices from the perspective of the USA. This table includes Edge Act corporations and interna-tional banking facilities, which we will discuss in chapter 15.
12.1.3 Interbank clearinghouse systems
This section describes three key clearinghouse systems of interbank fund transfers. These threesystems transfer funds between banks through wire rather than through checks.
The Clearing House Interbank Payments System (CHIPS) is used to move dollars amongNew York offices of about 150 financial institutions that handle 95 percent of all foreign-exchangetrades and almost all Eurodollar transactions.
The Clearing House Payments Assistance System (CHPAS) began its operation in 1983and provides services similar to those of the CHIPS. It is used to move funds among the Londonoffices of most financial institutions.
The Society for Worldwide Interbank Financial Telecommunications (SWIFT) is an inter-bank communication network that carries messages for financial transactions. It was founded in1973 by European and North American banks. Since 1973, its membership has expanded toinclude many Asian and Latin American banks. The SWIFT network represents a commondenominator in the international payment system and uses the latest communication technol-ogy. The network has vastly reduced the multiplicity of formats used by banks in different partsof the world. Banks can execute international payments more cheaply and efficiently than everbefore, because of the common denominator in the international payment system and the speedof electronic transactions. Currently, 6,000 live network users send 10 million messages dailythrough the SWIFT; its usage increases at an annual average growth rate of 15 percent. Messagestransferred through this system include bank transfers, customer transfers, and special messages.
12.2 International Loans
Large international loans to developing countries have become extremely important for European, Japanese, and US banks. For some banks, international loans have become as impor-
298 INTERNATIONAL BANKING ISSUES AND COUNTRY RISK ANALYSIS
Table 12.2 Characteristics of US foreign banking offices
Subject toAccept Make Engage in Federal FDIC Separate
Type of Physical foreign loans to investment Reserve insured legalbank location deposit? foreigners? banking? requirement? deposit? entity?
Domestic bank USA No No No Yes Yes NoRepresentative office Foreign No No No Yes Yes NoCorrespondent bank USA N/A N/A Yes No No N/ABranch bank Foreign Yes Yes No No No NoSubsidiary bank Foreign Yes Yes Yes No No YesAgency Foreign No No No No No NoConsortium bank Foreign Yes Yes Yes No No YesEdge Act Bank USA Yes Yes Yes No No YesInternational banking USA Yes Yes No No No No
facilities

tant as their domestic banking operations. On the other hand, recent global debt problems haveraised serious questions about large loans to developing and former Eastern-bloc countries.
12.2.1 The international debt crisis of the 1980s
Developing countries dramatically increased their borrowing from lenders in the Western indus-trial countries from 1973 to 1982. The total external debt of those developing countries that arenot oil-producing increased from $130 billion in 1973 to $840 billion in 1982, a 6.5-foldincrease. Over this 10-year period, the debt grew at an average compound rate of 20 percent peryear. At the outset, few people worried as the external debts of these countries mounted in the1970s. Several poor countries in Africa experienced difficult servicing problems. Yet, by the early1980s, more developed borrowers such as Poland, Mexico, Brazil, and Argentina had difficultyin servicing their huge external debts.
The first major blow to the international banking system came in August 1982, when Mexicoannounced that it could not meet its regularly scheduled payments to international creditors.Shortly thereafter, Brazil and Argentina were in the same situation. By spring 1983, about 25developing countries could not make regularly scheduled payments and negotiated reschedulingswith creditor banks. These countries accounted for two-thirds of the total debt owed to privatebanks by those developing countries that do not produce oil.
A worldwide recession compounded the lending crisis. It put downward pressure on oil pricesand on OPEC’s revenues. OPEC – the Organization of Petroleum Exporting Countries – is anorganization established by a number of oil-exporting countries to formulate uniform policies,such as selling prices on their oil-export sales. In 1980, OPEC contributed almost $42 billionto the loanable funds of the international banks, but by 1982, OPEC nations had withdrawn$26 billion from these loanable funds.
THE MAJOR CAUSES OF THE DEBT CRISIS Officials of developing countries often argue thatthe international lending crisis arose solely because of global economic dislocations. Still, policy-makers of the creditor countries suggest that mismanagement by the debtor countries caused thecrisis. The truth is, of course, somewhere in the middle of these positions.
Several developments in the 1970s turned banks into the predominant suppliers of funds tothose developing countries that do not produce oil and to Eastern-bloc nations. First, there weregrowth and investment opportunities in these countries, because economies began to open andto rise in the second half of the 1960s. Second, the 1973–4 oil shock, when higher oil prices andthe subsequent world recession skyrocketed the current-account deficit of the borrowing nations,accelerated bank loans to these countries. Third, many developing countries began to incur largebalance-of-payments deficits during the early 1980s, because the worldwide recession of 1979–82compelled industrial countries to reduce their imports from developing countries. Fourth,observers argue that capital flight, prompted by political and economic uncertainty, caused thedebt crisis. The World Bank estimates that capital flight from Latin American debtor countriesto industrial countries exceeded $70 billion between 1979 and 1982.
SOLUTIONS Observers feared that the debt crisis would provoke an international banking crisisand a global depression. Thus, lenders, borrowers, the International Monetary Fund (IMF), andthe World Bank worked together to overcome this crisis through rescheduling, refinancing, addi-
INTERNATIONAL LOANS 299

tional loans, and restrictive economic policies. The management of this debt crisis exemplifiedsuccessful international policy coordination.
The international lending problem faced attacks on many fronts. First, international bankstook steps to reduce their burden of developing-country debts. They increased their equity-capitalbase, raised loan-loss reserves, avoided new loans to developing countries, and sold exposed loansat a big discount to investors.
Second, many debtor countries took steps to alleviate their external debt problems. Theyincreased exports, reduced imports, attracted more foreign investment, adopted restrictive eco-nomic policies, and used debt–equity swaps. In debt–equity swaps, creditors exchange theirloans for equity in local companies.
Third, the policy-makers of the creditor nations, the World Bank, and the IMF have workedtogether to provide partial debt relief for countries in the most extreme difficulties. Under thisplan, a portion of a country’s external debt was forgiven permanently. The country received newconcessionary loans from commercial banks and international financial institutions by promis-ing to pursue sound growth and reform-oriented policies. Between 1982 and 1993, official creditor nations canceled a total of $20 billion.
BRADY BONDS The above three measures were not sufficient to solve the 7-year-old debt crisiscompletely. In 1989, US Treasury Secretary Nicholas Brady put forth a set of principles, knownas the Brady Plan, to resolve the problem. The Brady Plan offered three options to the creditorbanks: (1) convert their loans to marketable bonds with a face value equal to 65 percent of theoriginal loan amount; (2) convert their loans into new guaranteed bonds with a reduced interest rate of 6.5 percent; or (3) keep their old loans, but provide additional funds equal to 25percent of their original loan amount. As you might imagine, most banks chose either the firstor the second option, while only a few banks took the third option.
Those bonds that originated from the second option under the Brady Plan have come to becalled Brady bonds. This option included the following provisions: (1) extend the debt maturi-ties by 25–30 years; (2) compel the debtor countries to purchase zero-coupon US Treasury bondsto guarantee the bonds; and (3) make these bonds marketable. In 1992, 20 debtor nations,including Argentina, Brazil, Bulgaria, Mexico, Nigeria, Poland, and the Philippines, had issuedBrady bonds. These debtor countries had converted approximately $100 billion in bank debtinto Brady bonds. These Brady bonds are largely credited with solving the decade-long globaldebt crisis of the 1980s.
12.2.2 The Asian financial crisis of 1997–8
Despite prompt and concerted action by developing countries, industrialized countries, and inter-national organizations to contain it, the Asian crisis of 1997–8 spread quickly and ferociously tonorth Asian, Latin American, and Eastern European economies to varying degrees. In fact, theAsian crisis pushed one-third of the globe into recession during 1998. The Asian crisis is the thirddeveloping-country financial crisis. The first major blow to the international financial system tookplace in August 1982, when Mexico announced that it could not meet its regularly scheduled payments to international creditors. The second crisis came on December 20, 1994, when theMexican government announced it would devalue the peso against the dollar by 14 percent.
All three crisis episodes occurred under fixed exchange rate regimes. Economic theory sug-gests that a pegged exchange rate regime can become vulnerable when cross-border capital flows
300 INTERNATIONAL BANKING ISSUES AND COUNTRY RISK ANALYSIS

are highly mobile. A central bank that pegs its exchange rate to a hard currency implicitly guar-antees that any investors can exchange their local currency assets for that hard currency at theprevailing exchange rate. If investors suspect that the government will not or cannot maintainthe peg, they may flee the currency; this capital flight, in turn, depletes hard-currency reservesand forces the devaluation that they fear.
A THAI CRISIS SPREAD THROUGHOUT THE WORLD International capital flows have caused“booms and busts” for Thailand’s economy. How could an economic crisis in an emergingeconomy, such as that of Thailand, spread throughout the world? Thailand’s economy surgeduntil early 1997, partly because the Thais found they could borrow dollars at low interest ratesoverseas more cheaply than they could the baht at home. By late 1996, foreign investors beganto move their money out of Thailand, because they were worried about the Thais’ ability to repay.In February 1997, foreign investors and Thai companies rushed to convert their baht to dollars.The Thai central bank responded by buying baht with its dollar reserves and raising interest rates.
The rise in interest rates drove prices for stocks and land downward. This dynamic situationdrew attention to serious problems in the Thai economy: a huge foreign debt, trade deficits, anda banking system weakened by the heavy burden of unpaid loans. The Thai central bank ran outof dollars to support the baht. On July 2, 1997, the central bank stopped the baht’s fixed valueagainst the dollar. And then the currency lost 16 percent of its value in a single day.
Investors and companies in the Philippines, Malaysia, Indonesia, and Korea realized that theseeconomies shared all of Thailand’s problems. So, investors and companies rushed to convert localcurrencies into dollars. And then, the peso, ringgit, rupiah, and won toppled in value likedominos in a row. In the fourth quarter of 1997, the IMF arranged emergency rescue packagesof $18 billion for Thailand, $43 billion for Indonesia, and $58 billion for Korea.
By the end of 1998, the Asian crisis of 1997 had spread to Russia, Brazil, and many othercountries. Again, the IMF arranged bailout packages, of $23 billion for Russia in July 1998 and$42 for Brazil in November 1998. This means that from fall 1997 to fall 1998, IMF-led rescuepackages for Asia, Russia, and Brazil racked up some $184 billion to keep world markets safe.
In theory, capital is a boon, enabling developing countries to reduce poverty and raise livingstandards. But the theory does not always work smoothly. Countries can mismanage their inflows.Banks can be rife with favoritism or incompetence; bad loans are made. Moreover, multinationalcompanies may build too many factories. Speculation may also propel stock prices to unrealis-tic heights. Finally, ample foreign exchange provided by overseas investors may support a spend-ing spree on imports.
If capital inflows slow or reverse, a boom may collapse. This is precisely what happened inThailand, where the Asian crisis started. The construction of unneeded office buildings washalted; bad loans mushroomed at finance companies and banks; and the stock market took adive. Similar problems afflicted other Asian economies, and losses extended to their foreigntrading partners and investors beyond Asia.
A number of plausible answers come to mind when we ask why the dominos toppled in rapid succession, even though in some cases they were nowhere near each other (Phillips 1999).Countries are increasingly connected by trade and investment, so a downturn in one hurts exportsand investment in another. Countries also compete against one another. When one country deval-ues its currency, others may feel pressured to do the same in order to keep their exports andinward investment competitive. Commodity prices provide another link among troubledeconomies. For example, as Asia sank into recession, its businesses and consumers cut their pur-
INTERNATIONAL LOANS 301

302 INTERNATIONAL BANKING ISSUES AND COUNTRY RISK ANALYSIS
chases of oil. That, in turn, accelerated the collapse in the price of crude oil and slashed therevenue for oil-exporting countries such as Russia.
THE CAUSES OF THE CRISIS During the second half of 1997, currencies and stock marketsplunged across East Asia, while hundreds of banks, builders, and manufacturers went bankrupt.More specifically, figures 12.2 and 12.3 show that currency values and stock prices of Thailand,the Philippines, Malaysia, Indonesia, and Korea fell from 40 percent to 80 percent apiece fromJuly 1997 to early 1998. This crisis in Asia caught nearly everyone by surprise, because Asia’sfundamentals looked very good.
Although many explanations have been offered on the causes of the Asian crisis, Neely (1999)argues that most views fall into one of two theories: the “fundamentalist” view and the “panic” view.The fundamentalist view focuses on how borrowing countries’ policies and practices fed the crisis,whereas the panic view focuses on the role that lenders played (see Global Finance in Action 12.1).
THE FUNDAMENTALIST VIEW The fundamentalist view holds that flawed financial systems wereat the root of the crisis and its spread. The seeds of the financial crisis were actually sown severalyears before currency pressures began. Most East Asian countries had tied their currencies to thedollar. This tie served them well until 1995 because it promoted low inflation, supported cur-rency stability, and boosted exports. However, the appreciation of the dollar against the yen andother major currencies after 1995 meant that East Asian countries began to lose their competi-tiveness in export markets.
Meanwhile, the maturity mismatch and the currency mismatch – the use of short-term debtfor fixed assets and unhedged external debt – made banks and firms vulnerable to sudden swingsin international investors’ confidence. Many economists believe that these two types of mismatchwere caused by moral hazard, because most East Asian companies and financial institutions oper-ated with implicit or explicit government guarantees.
An increasing portion of foreign capital inflows to the region consisted of liquid portfolioinvestment (short-term bank loans and security investment) rather than long-term direct invest-ment. Most of these liquid capital flows were directed into long-term, risky investments, such asreal estate. Frequently, these same assets were used for collateral and investment, driving the valueof existing collateral up, which in turn spurred more lending and increased asset prices. Risk wasfurther heightened when local banks – in response to low interest rates abroad and fixed exchangerates at home – began to borrow foreign exchange abroad. These local banks converted the foreignexchange to domestic currency and lent the proceeds to their domestic customers in domesticcurrency, thereby assuming all the exchange rate risk.
The fundamentalist view holds that such a bubble was about to burst in the face of a shock.By late 1996, asset prices fell, causing nonperforming loans to rise and the value of collateral tofall; domestic lending then declined and asset prices fell yet again. When capital started to flowout of the region, monetary authorities raised interest rates to defend their currency pegs.However, these higher interest rates boosted the cost of funds to banks and made it more diffi-cult for borrowers to service their debts. These monetary authorities soon ran out of hard cur-rencies, thereby causing them to abandon the pegs. The currency depreciations led to widespreadbankruptcies and slow economic growth, because practically none of some $275 billion in foreignloans owed by Thailand, the Philippines, Malaysia, Indonesia, and Korea was hedged.
The loss of export competitiveness and the moral hazard in lending combine to explain theseverity of the Asian crisis. Appreciation of the dollar and depreciation of the yen and yuan slowed

Index (June 28, 1997 = 100)
120
100
80
60
40
20
0
ThailandPhilippinesMalaysiaKoreaIndonesia
Crisis
1/4/97 2/22/97 4/12/97 5/31/97 7/19/97 10/25/97 12/13/97 1/31/98 3/2/989/6/97
Figure 12.2 Currency devaluations for five crisis countries
Source: “What Does the Asian Crisis Mean for the US Economy?” Southwest Economy, TheFederal Reserve Bank of Dallas, Mar./Apr. 1998, p. 2.
Index (June 28, 1997 = 100)
180
160
140
120
100
80
60
40
ThailandPhilippinesMalaysiaKoreaIndonesia
Crisis
1/4/97 2/22/97 4/12/97 5/31/97 7/19/97 10/25/97 12/13/97 1/31/98 3/2/989/6/97
Figure 12.3 Stock market drops for five crisis countries
Source: “What Does the Asian Crisis Mean for the US Economy?” Southwest Economy, TheFederal Reserve Bank of Dallas, Mar./Apr. 1998, p. 2.

304 INTERNATIONAL BANKING ISSUES AND COUNTRY RISK ANALYSIS
Global Finance in Action 12.1The Asian Financial Crisis and the International MonetaryFund (IMF)
Between 1990 and 1996, capital inflows to emerging market countries rose from $60billion to $194 billion. No one carefully monitored these capital flows. When prob-lems developed in Asia in 1997, neither the IMF nor the private lenders knew thetrue magnitude of the debts of some of these countries. Firms borrowed directly andthrough their subsidiaries. Often, the total was not shown on any balance sheet. Theprovision of the IMF Articles of Agreement requiring surveillance and the decision tostrengthen surveillance following the 1995 Mexican crisis proved to be of little use.Though important, the IMF’s failure to monitor seems small beside the elementarymistakes of private lenders. The lenders ignored three principles of prudent behaviorthat history has shown repeatedly to be a major reason for financial failure.
First, Asian banks and other Asian borrowers used short-term renewable creditsfrom foreign banks to finance long-term loans (maturity mismatch). All banks do thisto some extent, but the extent matters a great deal. When foreign loans were notrenewed, the Asian banks and corporations faced large defaults. Second, Asian banksand corporations borrowed in foreign currencies and loaned in local currency (cur-rency mismatch). They accepted the exchange risk without hedging. They failed torealize that the difference in interest rates included the risk of currency depreciation.Third, many international bankers did not ask to see consolidated balance sheets.They did not monitor the total assets and liabilities of the borrowers.
The IMF and the principal governments lent a total of $119 billion to Indonesia,Korea, and Thailand so that they could pay the interest on the existing bank loans orrepay the principal. Extending new credit helped the Asian banks to avoid default,but money went to the foreign banks. International bank loans were in dollars, yen,and other hard currencies. Instead of taking large losses like the holders of currency,stocks, and bonds, the international banks collected their loans with relatively smalllosses. And in exchange for extending repayment, the banks collected fees for rene-gotiating the loans. They demanded government guarantees of the loans they madeto banks, financial institutions, and private companies. Allen Metzer believes that thispolicy is the fourth mistake, because it may invite a larger financial crisis in the future.
Source: Allen H. Metzer, “Asian Problems and the IMF,” The Cato Journal, Winter 1998, pp. 267–8.

Asian economic growth and hurt corporate profits. These slow economic growth and low cor-porate profits turned ill-conceived and overleveraged investments in property developments andindustrial complexes into financial disasters. The crisis was then touched off when local investorsbegan to dump their own currencies for dollars and foreign lenders refused to renew their loans.It was aggravated by politicians in these affected countries, who preferred to blame foreigners fortheir problems rather than seek structural reforms of their economies. Both domestic and foreigninvestors, already nervous, lost yet more confidence in these nations and dumped more of theircurrencies and stocks, driving them to record lows.
THE PANIC VIEW Subscribers to the panic view admit that there were vulnerabilities: increas-ing current-account deficits, falling foreign-exchange reserves, fragile financial systems, highlyleveraged corporations, and overvaluation of the real exchange rate. Still, these vulnerabilitieswere not enough to explain the abruptness and depth of the crisis. They argue that economicfundamentals in Asia were essentially sound.
Developing countries that had experienced financial crises in the past, such as the Mexicanpeso devaluation of 1994 and the Latin American debt crisis of the 1980s, typically shared anumber of common macroeconomic imbalances. These imbalances included large budgetdeficits, large public debt, high inflation caused by a rapid growth in money supply, slow eco-nomic growth, low savings rates, and low investment rates. By contrast, most Asian economiesengulfed by the crisis had enjoyed low budget deficits, low public debt, single-digit inflation rates,rapid economic growth, high savings rates, and high investment rates. In other words, the Asiancrisis differed from previous developing country crises in which financial decisions in the publicsector were the main sources of difficulties. Public borrowing played a limited role in the Asiancrisis.
The absence of the macroeconomic imbalances typical of past crises led some to argue thatthe Asian crisis was not caused by problems with economic fundamentals. Rather, a swift changein expectations was the catalyst for the massive capital outflows that triggered the crisis. The panicview holds that problems in Thailand were turned into an Asian crisis because of internationalinvestors’ irrational behavior, and because of overly harsh fiscal and monetary policies prescribedby the IMF once the crisis broke.
Several factors support the premise that the crisis was panic-induced. First, no warning signswere visible, such as an increase in interest rates on the region’s debt, or downgradings of theregion’s debt by debt-rating agencies. Second, prior to the crisis, international banks made sub-stantial loans to private firms and banks even though they did not have government guaranteesor insurance. This fact alone contradicts the idea that moral hazard was so pervasive that investorsknowingly made bad deals, assuming that they would be bailed out. It is consistent, however,with the notion that international investors panicked in unison and withdrew money from allinvestments – good or bad.
Third, once the crisis was under way, the affected countries experienced widespread creditcrunches. For example, even viable domestic exporters with confirmed sales could not obtaincredit, again suggesting irrationality on the part of lenders. Finally, the trigger for the crisis wasnot the deflation of asset values, as fundamentalists argue; instead, the sudden withdrawal offunds from the region triggered the crisis. Radelet and Sachs (1998) state that some of the con-ditions the IMF imposed on these crisis countries for financial assistance added to, rather thanalleviated, the panic. A key feature of the financial crises since the 1980s has been the existenceof contagion. The panic view is consistent with the concept of financial contagion, which occurs
INTERNATIONAL LOANS 305

when: (1) events in one financial market trigger events in other markets; and (2) the magnitudeof the response in the other markets appears unfounded in economic fundamentals. In all threecrisis episodes discussed above, a crisis that began in one country quickly spread beyond itsborders. In some cases, the next victims were neighbors and trade partners; in others, they werecountries that shared similar policies or suffered common economic shocks. At times, as in thesummer of 1998, changes in investor sentiment and increased aversion to risk contributed tocontagion within and across regions.
POLICY RESPONSES Just like the previous developing-country crises, lenders, borrowers, andinternational financial institutions worked together to overcome the crisis. External paymentswere stabilized through IMF-led aid programs, the rescheduling of short-term foreign debts, andreductions in foreign borrowings through painful reversals of current-account deficits. The IMFhas established new financing packages to encourage the adoption of policies that could preventcrises in selected developing countries.
East Asian countries closed many ailing banks, cleaned up nonperforming loans, encouragedsurviving banks to merge with other banks, and compelled these banks to meet the capital ade-quacy ratio set by the Bank for International Settlements. Corporate-sector reforms includedcapital structure improvement through debt reduction, business restructuring to remove excesscapacity, the reorientation of conglomerates on core specialists, and the upgrading of corporategovernance standards. These countries also implemented market-opening measures to facilitateforeign investment.
These and other policy responses strengthened financial systems, enhanced transparency ofpolicies and economic data, restored economic competitiveness, and modernized the legal andregulatory environment for more stringent regulatory oversight and consistent application ofaccounting standards. A modest rebound in exports, stock market prices, and capital investmentbegan to take place in 1999 as a result of these policy responses to the Asian crisis.
12.2.3 Syndicated loans
A syndicated loan is a credit in which a group of banks makes funds available on common termsand conditions to a particular borrower. Perhaps one of the most important developments in thefield of international lending for the past two decades (the 1980s and 1990s) has been the rapidgrowth of syndicated loans. In the Euromarket, syndicated loans compose almost half of banklending to nonbank borrowers. Syndication is the device a group of banks adopt to handle largeloans that one bank is unable or unwilling to supply. In other words, syndication differs from adirect commercial loan in that several banks participate at the outset. For example, Kuwait signeda $5.5 billion loan accord with 81 banks from 21 countries on December 13, 1991. This 5-yearreconstruction deal was described as the largest syndicated loan ever extended to a sovereign borrower.
A syndicated loan must, therefore, be structured and packaged so that it satisfies the demandsof the lenders and the needs of the borrowers. This type of loan has become increasingly popularbecause of: (1) the increasing size of individual loans; (2) the need to spread risks in large loans;(3) the attractiveness of management fees; (4) the publicity for participating banks; and (5) theneed to form profitable working relationships with other banks.
306 INTERNATIONAL BANKING ISSUES AND COUNTRY RISK ANALYSIS

As shown in table 12.3, the total value of syndicated loans increased from $502 billion in1994 to $1,081 billion in 1997, with an annual growth rate of 29 percent. The ample supply offunds in securities markets in 1997 intensified competition and maintained thin margins in inter-national loan markets. Nevertheless, international syndicated credits rose 21 percent in 1997,driven by refinancing operations, mergers and acquisitions, and project financing. However, theAsian financial crisis of 1997–8 caused syndicated loans to fall by 24 percent in 1998 on a grossbasis. Table 12.3 indicates that the total value of syndicated loans since 1999 appeared to recoverfrom its big drop in 1998.
12.2.4 The evaluation of international loans
Traditionally, banks have been the dominant source of funds for developing countries, but bondmarkets have been an increasingly important source of funding in recent years (see Global Financein Action 12.2). Nevertheless, the international banking community still seems fragile and vul-nerable because of the sheer magnitude of the global debt outstanding. As shown in table 12.4,the external debt of 138 developing countries reached a total of $2,433 billion at the end of2003. Loans from the world’s private banks to more than 100 developing countries that do notproduce oil represent half the total external debt of these countries. The number of banks holdingthis debt ranges from 800 to 1,000, and includes most of the major banks in the industrial countries.
INTERNATIONAL LOANS 307
Table 12.3 International syndicated loans (billions of US dollars)
Year Amount Year Amount
1994 502 1998 8201995 703 2000 1,4651996 893 2001 1,3981997 1,081 2002 1,343
Source: Global Financial Stability Report, The International MonetaryFund, Washington, DC, Mar. 2003 and Mar. 2004 issues.
Table 12.4 The total external debt of 138 developing countries(billions of US dollars)
Year Total external debt Year Total external debt
1980 609 1998 2,3951990 1,460 2000 2,3641993 1,812 2002 2,3391996 2,126 2003 2,433
Source: The World Bank, Global Development Finance, Washington,DC, various issues.

On the one hand, international loans have some advantages for banks:
1 International loans have been very profitable for many large banks, and have had a signifi-cant impact on the earnings of these international banks.
2 Many banks have improved risk–return performance because they can diversify internationalloans by country, by type of customer, and by currency.
308 INTERNATIONAL BANKING ISSUES AND COUNTRY RISK ANALYSIS
Global Finance in Action 12.2Asian Companies Turn to Capital Markets for Funds
Traditionally, capital markets have been the main source of funds for US and Britishcompanies, while banks have been the main source of funds for Asian companies.However, Asia appears to be growing less dependent on bank loans for funding ascompanies have increasingly turned to the stock and bond markets to raise money.Primary figures for 1999, for example, suggest a decided shift in the way Asian com-panies and governments obtain financing in the wake of the Asian financial crisis.
As of December 16, 1999, Asia-Pacific companies had raised more than $102.5billion in share offerings in 1999, compared with a meager $68.6 billion in 1998,$94.5 billion in 1997 – the year the crisis broke out in Asia – and $67.8 billion in1996. The bumper crop for 1999 included a $15 billion placing of shares in Japan’sNippon Telegraph & Telephone, a $10.3 billion placement by Australian phonecompany Telstra, and a $4.3 billion share offering by a fund run by the Hong Konggovernment.
The volume of new bonds for Asia-Pacific issuers rose to $98.1 billion in 1999 asof December 16, 1999, from $70.9 billion in 1998. The 1999 total is much less than1997’s $111.5 billion, but surpassed for a second straight year the amount that Asiancompanies raised through syndicated bank loans. The big bond issues in 1999 fromoutside Japan included a $1 billion deal for Korea Development Bank, a $1 billiondeal for Malaysia, and a $1.6 billion deal for Thailand’s Ministry of Finance.
Syndicated loans totaled $88 billion in 1999, well below the 1997 peak. Syndicated lending in the region for 1999 was about the same level as the previousyear, but about half of 1997’s level.
Of course, this shift away from bank lending has been born partly of necessity.For years, companies in Asia borrowed heavily from local and international banks.But a wave of Asian currency depreciations in 1997 and 1998 left many companiesin the region unable to service their debts. Banks in the region were saddled with amountain of nonperforming loans. Foreign lenders have been reluctant to lend moneyto Asian companies since the Asian financial crisis of 1997–8. With bankers stillworking out how to restructure or recoup these loans, plenty of banks are cautiousabout making new commitments.
Source: “More Asian Companies Turn to Markets for Funds and Away from Bank Loans,” The WallStreet Journal, Dec. 30, 1998, p. C14.

3 Several safeguards have reduced the risk of international loans. They include credit insuranceprograms in the lenders’ own countries, guarantees by parent companies on loans to affili-ates, and guarantees by host governments on loans to private companies within their country.
On the other hand, international loans have many disadvantages for banks:
1 Country risk analysis is extremely complex, because it depends on many variables.2 International bankers recently did not anticipate dramatic increases in country risk.3 Critics question the ability of debtor countries to service their external debt, because many
loans are short-term variable loans.4 If borrowing countries are unable to meet their obligations on time, banks will be forced to
roll over their loans indefinitely.5 The ultimate purpose of some loans is to finance balance-of-payments deficits. This type of
loan does not improve the debtor country’s ability to generate foreign-exchange earnings.
12.3 Country Risk Analysis
Sovereign or country risk refers both to the possibility of default on foreign loans and to unan-ticipated restrictions of cash flows to the parent country. There are two major differences betweendomestic loans and foreign loans. First, because repayment of international loans must go throughthe exchange market, international banks must assess prospects for exchange rates and for con-trols on capital flows. Second, a common legal system or an ultimate arbitrator does not exist tosettle disputed claims. Under this condition, some debtor countries are unlikely to accept thedecisions of Western-oriented international legal frameworks. Thus, country risk assessment iscritical for commercial banks to safeguard their international loans against country risk.
12.3.1 The nature of country risk assessment
Many international bankers have undertaken country risk analysis for many years. They are nowworking on a second or third generation of country risk models. These bankers have modifiedthe original models on the basis of experience and their knowledge of other banks’ procedures.These modified models could result in better decisions by more informed businesspersons andless risk in international loans than before.
Country risk is nothing more than an assessment of economic opportunity against politicalodds. Thus, country risk assessment requires that international bankers analyze political and eco-nomic indicators. While political factors reflect a country’s willingness to pay its debt, economicindicators measure the country’s ability to pay its debt. This means that any rating system of acountry’s risk must combine both economic and political risks.
Several country risk assessment models are available in academic journals or from commer-cial sources. Yet factors to be considered in country risk analysis vary from forecaster to fore-caster. The country risk rating system should meet several criteria for use at a bank. First, lendingofficers should be able to understand and use the system easily. Second, the system should rankall developing countries with foreign loans. Third, the system should have both short-term and
COUNTRY RISK ANALYSIS 309

medium-term horizons. Fourth, the system should be effective in forecasting which countries arelikely to reschedule their debts.
Country risk assessment serves a number of useful purposes for international banks. First, itpermits international banks to assess relative conditions of diverse countries on the basis ofcommon criteria. Second, because it is based on a common set of criteria, it often offsets indi-vidual biases. Third, a country’s risk ranking is a useful “straw vote” rating.
12.3.2 How to assess country risk
Country risk is the possibility that borrowers in a country will not honor past obligations. Bankmanagers must develop a systematic approach for evaluating country risk. Approaches nowdepend on the type of borrower, such as the host government, an industrial firm, or a privatebank. The same variables apply to all three types of clients, although the relative weight assignedto each variable may differ considerably. Country risk may be assessed by various debt ratios, thegeneral creditworthiness of a country, and sovereign-government bond ratings.
DEBT RATIOS Debt burdens vary from one developing country to another. For some countries,external debt and debt-service payments are insignificant both in absolute amounts and in rela-tion to gross national product (GNP) or exports of goods and services. In these countries, there-fore, the burden of external debt does not cause hardship in the economy. For other countries,the debt burden is so large that it hampers growth-oriented policies. Developing countries thatfall between these two categories are not seriously burdened by their external debt, but remainvulnerable.
The World Bank classifies the debt burden of developing countries according to a set of tworatios: (1) the ratio of present value of total debt service in 2001 to average GNP in 1999, 2000,and 2001; and (2) the ratio of present value of total debt service in 2001 to average exports in1999, 2000, and 2001.
According to Global Development Finance, issued in 2003 by the World Bank, the ratios ofmany developing countries are extremely high. This report focuses on the policy implications ofheavy burdens for three groups: severely, moderately, and less indebted countries. A country isclassified as severely indebted if either of these two ratios exceeds a critical value: 80 percent forpresent value of debt service to GNP and 220 percent for present value of debt service to exports.A country is classified as moderately indebted if either ratio exceeds a critical value: 48 percentfor present value of debt service to GNP and 132 percent for present value of debt service toexports. A country is classified as less indebted if neither is true. Countries are further classifiedas low-income countries if their GNP per capita was no more than $745 in 2001 and as middle-income countries if their GNP per capita was somewhere between $745 and $9,205 in 2001.Low- and middle-income countries are usually called developing countries.
Using these ratios, the World Bank identified 37 severely indebted low-income countries(SILICs), 13 severely indebted middle-income countries (SIMICs), 15 moderately indebted low-income countries (MILICs), 26 moderately indebted middle-income countries (MIMICs), 14less indebted low-income countries (LILICs), and 33 less indebted middle-income countries(LIMICs). Table 12.5 shows five countries in each of these six classes.
Ratio analysis is sometimes problematic. For example, debt ratios must be used carefully whena country’s debt situation is examined, because debt ratio analysis has its limitations. The two
310 INTERNATIONAL BANKING ISSUES AND COUNTRY RISK ANALYSIS

debt ratios used by the World Bank have at least two drawbacks. First, they present the debt situation of a country in a particular reference year. The economic measures of that referenceyear may not be representative. For example, a temporary rise in commodity prices may increasethe value of exports and therefore lower the debt-service ratio, but it will not significantly improvea country’s long-term creditworthiness. Second, these ratios are static. The debt ratios developedfor a particular country at a given time have little meaning unless they are compared with somestandards.
Historical (future) standards and world standards are two criteria used. To analyze the debtsituation of a country, one should compare its current ratios with its past or future ratios. A ratiomay fluctuate considerably over time, so that sole reliance on a single ratio may at times give amisleading indication of a country’s debt situation. When ratios are calculated over several yearsand compared with one another, analysts may find whether the country’s debt situation is improv-ing or worsening. To alleviate this problem, since 1999 the World Bank has used the average ofGNP and exports for the last 3 years.
The second standard that analysts can use to examine a country’s debt situation is worldaverage ratios. It is important to remember that countries of the same size with the same incomeshould be compared. The increasing diversity of national economies, the accelerated tempo ofchanges in technology and product development, and rapid changes in income level have madeit extremely difficult to identify a particular country with a given country-group of about thesame size. Proper classification by country and size is necessary for ratio analysis because the ratiosvary from country to country and from size to size. To minimize this problem, the World Bankcalculates the average ratios by country groups based on region and income.
OVERALL COUNTRY CREDITWORTHINESS The combined impact of economic, political, andother indicators may be used to rate country risk. For example, Euromoney country risk rankingsare based on the following nine categories: political risk, economic performance, debt indicators,debt in default or rescheduled, credit ratings, access to bank finance, access to short-term finance,access to capital markets, and discount on forfaiting. These views based on historical data aresupplemented by two subjective risk factors: economic and political. The economic risk factor isthe prospective view of economic performance for each country by a panel of economists. Thepolitical risk factor is the prospective view of political stability for each country by a panel ofpolitical risk specialists.
COUNTRY RISK ANALYSIS 311
Table 12.5 Classification of developing countries by debt ratios
Classification Countries
SILICs Angola, Ethiopia, Indonesia, Nigeria, and PakistanSIMICs Argentina, Brazil, Jordan, Peru, and YugoslaviaMILICs Ghana, Haiti, Cambodia, Uganda, and ZimbabweMIMICs Bulgaria, Chili, Hungary, Malaysia, and RussiaLILICs Armenia, Eritrea, Georgia, India, and VietnamLIMICs China, Czech Republic, El Salvador, Mexico, and Poland
Source: The World Bank, Global Development Finance, Washington,DC, 2003, p. 235.

Table 12.6 presents a portion of Euromoney’s country risk ratings in March 2004: the 10 leastrisky countries and the 10 most risky countries. The lowest-ranking countries are those that haveexperienced war (Iraq and Afghanistan) or civil unrest (Congo), current communist countries(Cuba and North Korea), and countries facing economic difficulty (Somalia and Liberia).
SOVEREIGN-GOVERNMENT BOND RATINGS There are several ways to analyze or compare thequality of bonds. Two financial service firms – Standard & Poor’s (S&P) and Moody’s InvestorService – assign letter ratings to indicate the quality of bonds. Table 12.7 shows bond ratings bythese two firms.
Triple A and double A are extremely safe. Single A and triple B bonds are strong enough tobe called “investment grade”: these bonds are the lowest-rated bonds that many banks and otherinstitutional investors are allowed by law to hold. Double B and lower bonds are speculative;they are junk bonds, with a fairly high probability of default. Many financial institutions areprohibited from buying these junk bonds. During the peak of Asian currency crisis in Decem-ber 1997, S&P and Moody’s downgraded the credit ratings on Thailand, Indonesia, and SouthKorea to junk-bond status. This move sparked widespread sales of Asian bonds by portfolio man-
312 INTERNATIONAL BANKING ISSUES AND COUNTRY RISK ANALYSIS
Table 12.6 Country risk rankings
Ranking Least risky country Score Most risky country Score
1 Luxembourg 99.4 Congo 18.42 Norway 97.7 New Caledonia 18.23 Switzerland 97.5 Micronesia 13.94 USA 96.6 Somalia 13.25 Denmark 95.3 Cuba 12.06 UK 93.9 Liberia 11.67 Finland 93.8 Marshall Islands 10.78 Sweden 93.8 Afghanistan 7.89 The Netherlands 93.5 Iraq 4.3
10 Austria 92.4 North Korea 3.2
Source: www.euromoney.com, Mar. 2004.
Table 12.7 Bond ratings by Moody’s and Standard & Poor’s
Moody’s S&P Description
Aaa AAA Highest qualityAa AA High qualityA A Upper medium gradeBaa BBB Medium gradeBa BB Lower medium grade/some speculative
elementsB B SpeculativeCaa CCCCa CC More speculative; higher risk of defaultC C– D In default

agers, because they are restricted to holding only investment-grade debt securities. Bond ratingsare important to both investors and issuers, because they have a direct, measurable influence onthe bond’s interest rate and the borrower’s cost of debt.
Since the early 1900s, US domestic bonds have been assigned quality ratings by S&P andMoody’s that reflect their probability of default. These two rating agencies now provide creditratings on many international bond issues. Sovereign-governments issue a sizable portion of allinternational bonds. In rating a country’s credit risk, their analysis centers on an examination ofeconomic risk and political risk.
Economic risk is assessed on the basis of a country’s external financial position, balance ofpayments, economic structure and growth, economic management, and economic prospects.Political risk is assessed on the basis of the country’s political system, social environment, andinternational relations.
Country credit ratings usually represent the ceiling for ratings that S&P and Moody’s willassign obligations of all entities domiciled within that country. For example, 20 Korean bankslost investment-grade status of their bonds in late December 1997 as S&P and Moody’s cutKorea’s rating to junk-bond status. Table 12.8 shows sovereign ratings by these two rating agen-cies for selected countries: five countries with the highest credit rating and five countries withjunk-bond status.
A SUMMARY OF COUNTRY RISK RATINGS Recent developing-country debt crises – the debtcrisis of the 1980s, the Mexican peso crises of 1994 and 1995, and the Asian crisis of 1997–8 –have dramatized the importance of country risk analysis. Thus, we can understand why interna-tional bankers have searched for more systematic means of evaluating and managing country risk.They have recently increased resource commitments, employed more qualified analysts, andadopted more sophisticated methods to assess country risk. Although country risk will never dis-appear, its systematic assessment and management can significantly decrease its impact. A varietyof ratios, country-credit ratings by some consulting companies, sovereign-government bondratings by Moody’s and S&P, and procedures established by an individual bank may be used toreduce the possibility of defaults on foreign loans and interest.
COUNTRY RISK ANALYSIS 313
Table 12.8 Sovereign ratings by Moody’s and Standard &Poor’s
Moody’s Standard & Poor’s
Canada Aaa Canada AAALiechtenstein Aaa Liechtenstein AAANorway Aaa Norway AAAUK Aaa UK AAAUSA Aaa USA AAAIndonesia B3 Indonesia B-Lebanon B2 Lebanon B-Romania B1 Romania BBPakistan B3 Pakistan BB-Turkey B1 Turkey B
Sources: www.moodys.com and www.standardpoor.com, May 2004.

314 INTERNATIONAL BANKING ISSUES AND COUNTRY RISK ANALYSIS
SUMMARY
This chapter has discussed international banking operations, international loans, and country riskanalysis. The management of international banks is more complex than that of domestic banks.Country risk analysis illustrates this problem. Recent events in many debtor countries have broughtanalysts and investors to question international bankers about loans to economically risky countries.For some banks, international lending can be as important as their domestic operations. Thus, international banks must reduce the impact of country risk through systematic assessment and management.
Questions
1 Discuss the types of functions that international banks perform.2 Discuss the types of foreign banking offices.3 What were the two major causes of the Asian financial crisis of 1997–8?4 What are major differences between domestic and foreign loans?5 What were the major causes of the international debt crisis of the 1980s?6 Explain the various steps taken by debtor countries and international banks to solve the
international debt problems of the 1980s.7 What is syndicated lending? Why do banks sometimes prefer this form of lending?8 What is country risk? How can we assess country risk?9 Describe policy responses to solve the Asian crisis.
Problems
1 In addition to the two debt ratios described in this chapter, the World Bank recommendsthe use of four additional debt ratios in assessing a country’s risk: the ratio of total exter-nal debt to GNP, the ratio of total external debt to exports, the debt-service ratio (accrueddebt service to exports), and the interest-service ratio (accrued interest service to exports).In 1998, Mexico had $380 billion in gross national product (GNP), $160 billion in totalexternal debt, $140 billion in exports, and $29 billion in accrued debt service, and $13billion in accrued interest service. Calculate the above four debt ratios for Mexico.
2 In 1998, Poland had $157 billion in GNP, a debt-to-GNP ratio of 0.32, a debt-to-exportratio of 1.12, a debt-service ratio of 0.11, and an interest-service ratio of 0.06. Calculate

REFERENCES 315
Poland’s total external debt, exports, accrued debt service, and accrued interest service for1998.
3 Assume that the total external debt of 138 developing countries increased from $609 billionin 1980 to $2,332 billion in 2001.(a) Determine the annual compound growth rate of the total external debt for these 138
developing countries from 1980 to 2001.(b) Determine the annual simple growth rate of the total external debt for these 138
developing countries from 1980 to 2001.4 Table 12.3 shows that syndicated loans increased from $502 billion in 1994 to $1,398 billion
in 2001.(a) Determine the annual compound growth rate of the syndicated loans from 1994 to
2001.(b) Determine the annual simple growth rate of the syndicated loans from 1994 to 2001.
REFERENCES
Clark, J., “Debt Reduction and Market Reentryunder the Brady Plan,” Quarterly Review, FederalReserve Bank of New York, Winter 1993–4, pp.38–58.
Garg, R. C., “Debt Forgiveness for Less DevelopedCountries,” Multinational Business Review, Spring1994, pp. 38–44.
Garg, R. C., “Reducing Third-World Debt withTailor-Made Swaps,” The Banker Magazine,Sept./Oct. 1992, pp. 52–7.
Halcomb, D. R., “Asset Price Bubbles: Implicationsfor Monetary, Regulatory, and International Policies,” Chicago Fed Letter, Federal ReserveBank of Chicago, Sept. 2002.
Kim, Y. S. and H. K. Koo, “Asia’s Contagious Finan-cial Crisis and its Impact on Korea,” Journal ofAsian Economics, 1999, pp. 111–21.
Lopez, J. S., “Disclosure as a Supervisory Tool: Pillar3 of Basel II,” Economic Letter, Federal ReserveBank of San Francisco, Aug. 1, 2003.
Moreno, R., Learning from Argentina’s Crisis,” Economic Letter, Federal Reserve Bank of SanFrancisco, Oct. 18, 2002.
Moreno, R., “What Caused East Asia’s Finan-cial Crisis,” Economic Letter, Federal Reserve
Bank of San Francisco, No. 98–24, Aug. 7, 1998.
Rugman, A. M. and S. J. Kamath, “InternationalDiversification and Multinational Banking,” in S.J. Shapiro, ed., Multinational Financial Manage-ment, Upper Saddle River, NJ: Prentice Hall,1999, ch. 1.
Neely, M. C., “Paper Tigers? How the AsianEconomies Lost Their Bite,” The Regional Econ-omist, Federal Reserve Bank of St. Louis, Jan.1999, pp. 5–9.
Organization for Economic Cooperation andDevelopment, Financial Market Trends, July 2000and Mar. 2003.
Phillips, M. M., “Global Investing,” The Wall StreetJournal, Apr. 26, 1999, Section R.
Radelet, S. and J. Sachs, “The East Asian FinancialCrisis: Diagnosis, Remedies, and Prospects,”Brookings Papers on Economic Activity, 1998, Vol.1, pp. 1–74.
Straphang, P. E., “The Real Effects of US BankingDeregulation,” Review, Federal Reserve Bank ofSt. Louis, July/Aug. 2003, pp. 111–28.
The World Bank, Global Development Finance,Washington, DC: The World Bank, 2003.

316 INTERNATIONAL BANKING ISSUES AND COUNTRY RISK ANALYSIS
Case Problem 12: The World Bank
Representatives of 44 governments founded the World Bank on July 1, 1944, during their con-ference at Bretton Woods, New Hampshire. The Bank is a sister institution to the InternationalMonetary Fund (IMF), but has a separate, distinct objective. The Bank was largely the brain-child of the economist John Maynard Keynes, who envisioned an institution that would ini-tially focus on postwar reconstruction in Europe and Asia and then shift to focusing ondevelopment of poor countries. As such, the Bank’s overriding modern purpose is to spur devel-opment worldwide through loans and grants to underdeveloped countries. To help stress thisgoal, the mission statement of the Bank is the elegant and simple sentence: “Our dream is aworld free from poverty.”
The Bank consists of 184 countries that all share this goal. Membership of the Bank is onlyallowed for countries that are first members of the IMF. Typically, countries join both organi-zations. Member countries are shareholders who carry ultimate decision-making power in theWorld Bank. Each member nation appoints a Governor and an Alternate Governor to carry outthese responsibilities. The Board of Governors, who are usually officials such as Ministers ofFinance or Planning, meets annually at the Bank’s Meetings each fall. The chairperson of theBoard of Governors is the President of the World Bank. The governors decide on key Bankpolicy issues, admit or suspend country members, decide on changes in the authorized capitalstock, determine the distribution of income, and endorse financial statements and budgets.
Specifically, their policy discussions during the annual meetings cover a variety of issues,such as poverty reduction, international economic development, and global developmentfinance. This annual gathering provides a forum for international cooperation and enables theBank to better serve its member countries. The meetings are traditionally held in Washingtontwo years out of three and, in order to reflect the international character of the two institu-tions (the World Bank and the IMF), every third year in a different member country.
Because these ministers meet only once a year, the bulk of the Governors’ powers are del-egated throughout the year to the Board of Executive Directors. Every member governmentof the World Bank Group is represented at the Bank’s headquarters in Washington, DC, by anExecutive Director. The five largest shareholders – France, Germany, Japan, the UK, and theUSA – each appoint an Executive Director, while the other member countries are representedby 19 Executive Directors who are elected by groups of countries (constituents). Some coun-tries – China, Russia, and Saudi Arabia – have formed single-country constituencies, whileothers have joined together in multi-country constituencies. The 24 Executive Directors nor-mally meet twice a week to oversee the Bank’s business, such as loan applications and guar-antees, new policies, the administrative budget, country assistance strategies, and borrowingand financial decisions.
The World Bank is part of a larger organization, the World Bank Group. The World BankGroup consists of five closely associated institutions, all owned by member countries that carryultimate decision-making power. As explained below, each institution plays a distinct role inthe mission to fight poverty and improve living standards for people in the developing world.
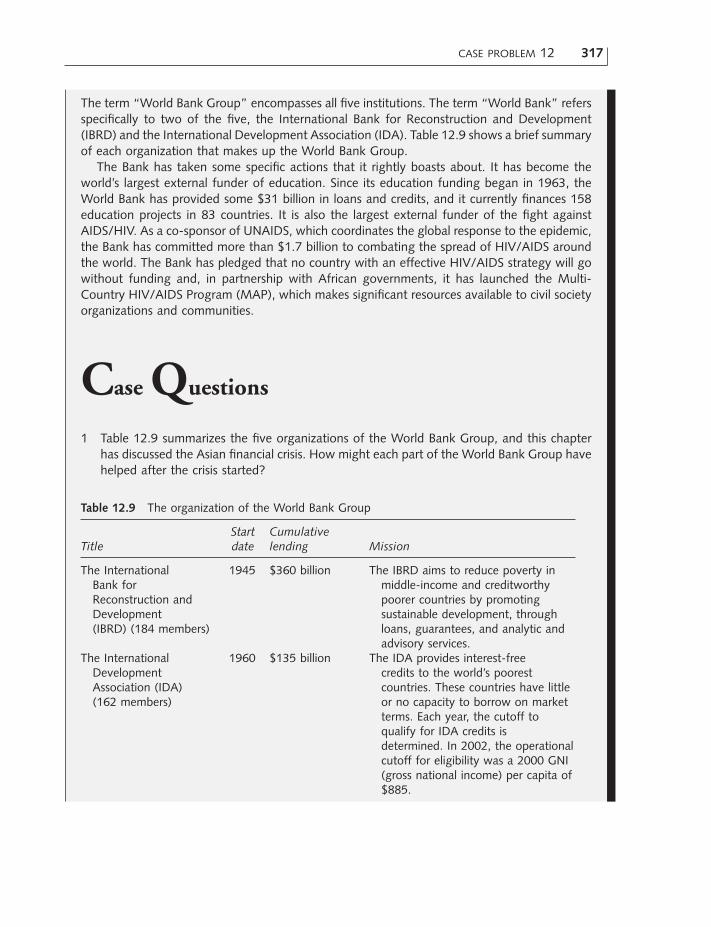
CASE PROBLEM 12 317
The term “World Bank Group” encompasses all five institutions. The term “World Bank” refersspecifically to two of the five, the International Bank for Reconstruction and Development(IBRD) and the International Development Association (IDA). Table 12.9 shows a brief summaryof each organization that makes up the World Bank Group.
The Bank has taken some specific actions that it rightly boasts about. It has become theworld’s largest external funder of education. Since its education funding began in 1963, theWorld Bank has provided some $31 billion in loans and credits, and it currently finances 158education projects in 83 countries. It is also the largest external funder of the fight againstAIDS/HIV. As a co-sponsor of UNAIDS, which coordinates the global response to the epidemic,the Bank has committed more than $1.7 billion to combating the spread of HIV/AIDS aroundthe world. The Bank has pledged that no country with an effective HIV/AIDS strategy will gowithout funding and, in partnership with African governments, it has launched the Multi-Country HIV/AIDS Program (MAP), which makes significant resources available to civil societyorganizations and communities.
Case Questions
1 Table 12.9 summarizes the five organizations of the World Bank Group, and this chapterhas discussed the Asian financial crisis. How might each part of the World Bank Group havehelped after the crisis started?
Table 12.9 The organization of the World Bank Group
Start CumulativeTitle date lending Mission
The International 1945 $360 billion The IBRD aims to reduce poverty inBank for middle-income and creditworthyReconstruction and poorer countries by promotingDevelopment sustainable development, through(IBRD) (184 members) loans, guarantees, and analytic and
advisory services.The International 1960 $135 billion The IDA provides interest-free
Development credits to the world’s poorestAssociation (IDA) countries. These countries have little(162 members) or no capacity to borrow on market
terms. Each year, the cutoff toqualify for IDA credits isdetermined. In 2002, the operationalcutoff for eligibility was a 2000 GNI(gross national income) per capita of$885.

318 INTERNATIONAL BANKING ISSUES AND COUNTRY RISK ANALYSIS
2 Many critics claim that the World Bank Group is too large and attempts to do too much.Additionally, they claim that many of the Bank’s activities overlap with the work of theWorld Trade Organization, the International Monetary Fund, and the United Nations. Howvalid do you find this criticism?
3 Imagine that you are the President of the World Bank. Who are your most powerful con-stituents? How much power do you have? Would you want this job?
4 What are the major differences between the IMF and the World Bank?5 Visit the World Bank’s website, www.worldbank.org, to discover its current projects.
Sources: J. Einhorn, “The World Bank’s Mission Creep,” Foreign Affairs, Vol. 80, No. 5, pp. 22–35; M. M.Phillips, “World Bank Rethinks Strategy for Poor: Political Change is Necessary, Not Economic Growth Alone,a Study Suggests,” The Wall Street Journal, Sept. 13, 2000, p. A2; and www.worldbank.org.
The International 1956 N/A – has a The IFC’s mandate is to promoteFinance Corporation committed economic development through the(IFC) (175 members) portfolio of private sector. Working with
$21.6 billion business partners, it invests insustainable private enterprises indeveloping countries and provideslong-term loans, guarantees, and riskmanagement/advisory services.
The Multilateral 1988 $10.34 billion in The MIGA helps encourage foreignInvestment guarantees investment in developing countriesGuarantee Agency by providing guarantees to foreign(MIGA) (157 members) investors against losses caused by
noncommercial risks, such asexpropriation, currencyinconvertibility and transferrestrictions, and war and civildisturbances.
The International 1966 N/A – 103 cases The ICSID helps to encourageCenter for registered foreign investment by providingSettlement of international facilities forInvestment Disputes conciliation and arbitration of(ICSID) (134 members) investment disputes; in this way, it
helps to foster an atmosphere ofmutual confidence between statesand foreign investors.
Table 12.9 (continued)
Start CumulativeTitle date lending Mission

Opening Case 13: US Export–Import Bank Seeks Private Investors
The official US export finance agency is seeking private investors to help it providebillions of dollars in loan guarantees and risk insurance for American exporters. OnFebruary 16, 2000, the Export–Import Bank (Ex–Im Bank) asked investment banks,commercial banks, insurance companies, and other financial institutions for proposalson how they might share the risks and rewards from future Ex–Im Bank financial deals.The Ex–Im Bank, which supported almost $17 billion in US sales overseas in 1999,hopes to raise $1 billion or more through this new proposal.
In essence, the Ex–Im Bank wants to sell, to one or more partners, stakes in futureexport-financing deals, in the hopes of making its own resources go further at a timewhen the US trade deficit is piling on the records. The agency is leaving it up to theprivate financial institutions – American or foreign – to come up with a creative wayto structure the deal. The idea is for a private partner to put a certain amount ofmoney or credit at Ex–Im Bank’s disposal, and then share in Ex–Im Bank’s fees. Thefinancial institution might limit how that investment can be used – perhaps setting adollar limit for a particular country – but not approve or reject individual Ex–Im Bankdecisions.
In an unusual move, the agency put 1,500 pages of its own financial and institu-tional information on a website to make it easier for potential investors to performdue-diligence research. Hoping for quick action, the Ex–Im Bank held a pre-proposalconference on March 7, 2000. Ex–Im Bank officials first conceived of the idea in 1997.Private institutions showed interest, but pulled back soon after the Asian financial crisissent US banks and investors fleeing the developing markets. Ex–Im Bank revived theconcept after the crisis subsided.
Source: M. M. Philips, “Ex–Im Bank Seeks Investors for Guarantees,” The Wall Street Journal, Feb.16, 2000, p. B10.
CHAPTER 13
Financing Foreign Trade

This book emphasizes financial problems that arise when managing multinational operations.However, the financial manager of a multinational company (MNC) must be familiar withcertain mechanics of financing foreign trade, because most MNCs are frequently engaged inforeign trade activities.
This chapter consists of three major sections. The first section discusses three basic documentsinvolved in foreign trade: the draft, the bill of lading, and the letter of credit. The second sectionanalyzes the various payment terms of foreign trade. The third section describes the major sourcesof financing foreign trade.
13.1 Basic Documents in Foreign Trade
Three important documents involved in foreign trade are:
1 A draft, which is an order to pay.2 A bill of lading, which is a document involved in the physical movement of the merchan-
dise by a common carrier.3 A letter of credit, which is a third-party guarantee of the importer’s creditworthiness.
13.1.1 Basic objectives of documentation
Documentation in foreign trade is supposed to assure that the exporter will receive the paymentand the importer will receive the merchandise. More specifically, a number of documents inforeign trade are used to eliminate noncompletion risk, to reduce foreign-exchange risk, and tofinance trade transactions.
NONCOMPLETION RISK The risk of noncompletion is greater in foreign trade than in domes-tic trade. This is why exporters want to keep title to the goods until they are paid and importersare reluctant to pay until they receive the goods. Foreign trade and domestic trade use differentinstruments and documents. Most domestic sales are on open-account credit. Under this credit,a buyer does not need to sign a formal debt instrument, because credit sales are made on thebasis of a seller’s credit investigation of the buyer. Buyers and sellers are typically farther apart inforeign trade than in domestic trade. Thus, the sellers are seldom able to ascertain the creditstanding of their overseas customers. The buyers may also find it difficult to determine theintegrity and reputation of the foreign sellers from whom they wish to buy. Much of this non-completion risk is reduced through the use of three key documents: the draft, the bill of lading,and the letter of credit.
FOREIGN-EXCHANGE RISK Foreign-exchange risk arises when export sales are denominated ina foreign currency and are paid at a delayed date. In international trade, the basic foreign-exchange risk is a transaction risk. Transaction risk is the potential exchange loss from outstandingobligations as a result of exchange rate fluctuations. Forward contracts, futures contracts, cur-rency options, and currency denomination practices can be used to reduce foreign-exchange riskassociated with foreign trade.
320 FINANCING FOREIGN TRADE

TRADE FINANCING Because all foreign trade involves a time lag, funds are tied up in the ship-ment of goods for some period of time. Most trade transactions are free of noncompletion andforeign-exchange risks due to well-drawn trade documents and forward contracts. Banks are thuswilling to finance goods in transit or even prior to shipment. Financial institutions at both endsof the cycle offer a variety of financing alternatives that reduce or eliminate either party’s (exporteror importer) working capital needs.
13.1.2 Drafts
A draft or a bill of exchange is an order written by an exporter that requires an importer to paya specified amount of money at a specified time. Through the use of drafts, the exporter may useits bank as the collection agent on accounts that the exporter finances. The bank forwards theexporter’s drafts to the importer directly or indirectly (through a branch or a correspondent bank)and then remits the proceeds of the collection back to the exporter.
A draft involves three parties: the drawer or maker, the drawee, and the payee. The drawer isa person or business issuing a draft. This person is ordinarily the exporter who sells and shipsthe merchandise. The drawee is a person or business against whom the draft is drawn. Thisperson is usually an importer who must pay the draft at maturity. The payee is a person or busi-ness to whom the drawee will eventually pay the funds. A draft designates a person or bank towhom payment is to be made if the draft is not a negotiable instrument. Such a person, knownas the payee, may be the drawer himself or a third party such as the drawer’s bank. However, thisis generally not the case, because most drafts are a bearer instrument. Drafts are negotiable ifthey meet a number of conditions:
1 They must be in writing and signed by the drawer–exporter.2 They must contain an unconditional promise or order to pay an exact amount of money.3 They must be payable on sight or at a specified time.4 They must be made out to order or to the bearer.
If a draft is made to order, the funds involved should be paid to the person specified. If it is madeto the bearer, the funds should be paid to the person who presents it for payment.
When a draft is presented to a drawee, the drawee or his bank accepts it. This acceptanceacknowledges in writing the drawee’s obligation to pay a sum indicated on the face of the draft.When drafts are accepted by banks, they become bankers’ acceptances. Because bankers’ accep-tances are highly marketable, the exporter can sell them in the market or discount them at hisbank. Whenever they are sold or discounted, the seller adds his endorsement on the back of thedraft. In the event an importer fails to pay at maturity, the holder of the draft will have recoursefor the full amount of the draft from the last endorser.
Drafts are used in foreign trade for a number of reasons:
1 They provide written evidence of obligations in a comprehensive form.2 They allow both the exporter and the importer to reduce the cost of financing and to divide
the remaining cost equitably.3 They are negotiable and unconditional; that is, drafts are not subject to disputes that may
occur between the parties involved.
BASIC DOCUMENTS IN FOREIGN TRADE 321

TYPES OF DRAFTS Drafts can be either sight (demand) drafts or time (usance) drafts. A sightdraft is payable upon demand to the drawee–importer. Here the drawee must pay the draft imme-diately or dishonor it. A time draft is payable a specified number of days after presentation tothe drawee. When a time draft is presented to the drawee, she may have her bank accept it bywriting or stamping a notice of acceptance on its face. When a draft is drawn on and acceptedby a bank, it becomes a bankers’ acceptance.
Drafts may also be documentary drafts or clean drafts. Documentary drafts require variousshipping documents, such as bills of lading, insurance certificates, and commercial invoices. Mostdrafts are documentary, because all these shipping documents are necessary to obtain the goodsshipped. The documents attached to a documentary draft are passed on to an importer eitherupon payment (for sight drafts) or upon acceptance (for time drafts). If documents are to bedelivered to an importer upon payment of the draft, the draft is known as a D/P (documentsagainst payment) draft. If the documents are passed on to an importer upon acceptance, the draftis called a D/A (documents against acceptance) draft.
When a time draft is accepted by an importer, it becomes a trade acceptance or a clean draft.When clean drafts are used in foreign trade, the exporter usually sends all shipping documentsdirectly to the importer and only the draft to the collecting bank. In this case, the goods shippedare surrendered to the importer regardless of payment or acceptance of the draft. The clean draft,therefore, involves a considerable amount of risk. This is why clean drafts are generally used incases in which there is a considerable amount of faith between the exporter and the importer, orin cases in which multinational firms send goods to their foreign subsidiaries.
13.1.3 Bills of lading
A bill of lading is a shipping document issued to an exporting firm or its bank by a commoncarrier that transports the goods. It is simultaneously a receipt, a contract, and a document oftitle. As a receipt, the bill of lading indicates that the specified goods have been received by thecarrier. As a contract, it is evidence that the carrier is obliged to deliver the goods to the importerin exchange for certain charges. As a document of title, it establishes ownership of the goods.Thus, the bill of lading can be used to insure payment before the goods are delivered. For example,the importer cannot take title to the goods until she obtains the bill of lading from the carrier.
TYPES OF BILLS OF LADING Bills of lading are either straight bills of lading or order bills oflading. A straight bill of lading requires that the carrier deliver the goods to the designated party,usually the importer. It is used when the goods have been paid for in advance; thus, it is not atitle to the goods. An order bill of lading provides that the carrier deliver the goods to the orderof a designated party, usually the exporter. The exporting firm retains title to the goods until itreceives payment. Once payment has been made, the exporting firm endorses the order bill oflading in blank or to its bank. The endorsed document can be used as collateral against loans.It accompanies a documentary draft that requires such other documents as the bill of lading,commercial invoices, and insurance certificates. The procedures to handle these two types of billsof lading are well established. Commercial banks and other financial institutions in almost everycountry handle these documents efficiently.
Bills of lading can also be either on-board bills of lading or received-for-shipment bills oflading. An on-board bill of lading indicates that the goods have actually been placed on board
322 FINANCING FOREIGN TRADE

the vessel. On-board bills of lading are important because some insurance coverage, such as warrisk, is effective only if goods are on board. By contrast, a received-for-shipment bill of ladingmerely acknowledges that the carrier has received the goods for shipment but does not guaran-tee that the goods have been loaded on the vessel. The cargo could sit on the dock for some timebefore it is shipped. This bill of lading is thus unsatisfactory when seasonal or perishable goodsare involved. A received-for-shipment bill of lading can easily be converted into an on-board billof lading by an appropriate stamp that shows the name of the vessel, the date, and the signatureof an official of the vessel.
Finally, bills of lading may be either clean bills of lading or foul bills of lading. A clean billof lading suggests that the carrier has received the goods in apparently good condition. The carrierdoes not have any obligation to check the condition of the cargo beyond external visual appear-ance. On the other hand, a foul bill of lading bears a notation from the carrier that the goodsappeared to have suffered some damage before the carrier received them for shipment. Becausea foul bill of lading is generally not acceptable under a letter of credit, it is important that theexporter obtains a clean bill of lading.
13.1.4 Letters of credit
A letter of credit is a document issued by a bank at the request of an importer. In the docu-ment, the bank agrees to honor a draft drawn on the importer if the draft accompanies specifieddocuments such as the bill of lading. In a typical use, the importer asks that his local bank writea letter of credit. In exchange for the bank’s agreement to honor the demand for payment thatresults from the import transaction, the importer promises to pay the bank the amount of thetransaction and a specified fee.
ADVANTAGES OF LETTERS OF CREDIT The letter of credit is advantageous to both exportersand importers because it facilitates foreign trade. It gives a number of benefits to exporters. First,they sell their goods abroad against the promise of a bank rather than a commercial firm. Becausebanks are usually larger and have better credit risks than most business firms, exporters are almostcompletely assured of payment if they meet specific conditions. Second, they can obtain fundsas soon as they have such necessary documents as the letter of credit and the bill of lading. Whenshipment is made, the exporter prepares a draft on the importer in accordance with the letter ofcredit and presents it to his local bank. If the bank finds that all papers are in order, it advancesthe funds – the face value of the draft less fees and interest.
Although its major beneficiaries are exporters, the letter of credit also gives a number of ben-efits to importers. First, it assures them that the exporter will be paid only if he provides certaindocuments, all of which will be carefully examined by the bank. If the exporter is unable orunwilling to make proper shipment, recovery of the deposit is easier from the bank than fromthe exporter. Second, the letter of credit enables the importer to remove commercial risk to theexporter in exchange for other considerations. Thus, the importer can bargain for better terms,such as a lower price. Moreover, it is less expensive to finance the goods under a letter of creditthan by borrowing.
TYPES OF LETTERS OF CREDIT Letters of credit can be irrevocable or revocable. Most creditsbetween unrelated parties are irrevocable. An irrevocable letter of credit can be neither cancelled
BASIC DOCUMENTS IN FOREIGN TRADE 323

nor modified by the importer’s bank without the consent of all parties. A revocable letter of creditcan be revoked or modified by the importer’s bank at any time before payment. This letter ofcredit is used as a method of arranging payment, but it does not carry a guarantee of payment.Most banks do not favor revocable letters of credit; some banks refuse to issue them because theymay become involved in resulting litigation.
Letters of credit may also be confirmed or unconfirmed. A confirmed letter of credit is a letterof credit confirmed by a bank other than the issuing bank. An exporter might want a foreignbank’s letter of credit confirmed by a domestic bank when the exporter has some doubt aboutthe foreign bank’s ability to pay. In this case, both banks are obligated to honor drafts drawn inaccordance with the letter of credit. An unconfirmed letter of credit is a guarantee of only theopening bank. Thus, the strongest letter of credit is a confirmed, irrevocable letter of credit. Sucha letter of credit cannot be canceled by the opening bank, and it requires both the opening andconfirming banks to guarantee payment on drafts issued in connection with an export transac-tion.
Finally, letters of credit are either revolving or nonrevolving. A revolving letter of credit is aletter of credit whose duration may revolve weekly or monthly. A $50,000 revolving credit, forexample, might authorize an exporter to draw drafts up to $50,000 each week until the creditexpires. The revolving letter of credit is often used when an importer must make frequent andknown purchases. However, most letters of credit are nonrevolving. In other words, letters ofcredit are typically issued and valid for a single transaction – one letter for one transaction.
13.1.5 Additional documents
In addition to the three documents described here – the draft, the bill of lading, and the letterof credit – other documents must generally accompany the draft as specified in the letter of credit.Some additional documents commonly required in international trade are commercial invoices,insurance documents, and consular invoices. These and some other documents are required toobtain the goods shipped; they are also essential to clear the merchandise through customs andports of entry and departure.
THE COMMERCIAL INVOICE Issued by the exporter, a commercial invoice contains a precisedescription of the merchandise, such as unit prices, quality, total value, financial terms of sale,and shipping features. Some shipping features are FOB (free on board), FAS (free alongside),C&F (cost and freight), and CIF (cost, insurance, freight). The commercial invoice may alsoinclude some other information, such as the names and addresses of both the exporter and theimporter, the number of packages, transportation and insurance charges, the name of the vessel,the ports of departure and destination, and any export or import permit numbers.
INSURANCE DOCUMENTS All shipments in international trade are insured. Most insurance con-tracts used today automatically cover all shipments made by the exporter. The risks of trans-portation range from slight damage to total loss of merchandise. In most cases, insurancecoverage, provided by the carrier up to the port of destination, is sufficient. But most ocean car-riers do not have any responsibility for losses during the actual transportation, except for thosedirectly attributed to their negligence. Therefore, some form of marine insurance should bearranged to protect both the exporter and the importer. Additional coverage ranges from suchlimited coverage as collision, fire, and sinking to the broad coverage of all risks.
324 FINANCING FOREIGN TRADE

CONSULAR INVOICES Exports to many countries require a consular invoice issued by the con-sulate of the importing country. The consular invoice provides customs officials with informa-tion and statistics for the importing nation. More specifically, a consular invoice is necessary toobtain customs clearance; it also provides customs officials with information necessary to assessimport duties. The consular invoice does not carry any title to the goods, and it is not nego-tiable.
OTHER DOCUMENTS Other documents might be required by the importer or might be nec-essary in clearing the goods through ports of entry or exit. These documents include certificatesof origin, weight lists, packing lists, and inspection certificates. A certificate of origin certifies thecountry in which the goods are grown or manufactured. A weight list itemizes the weight of eachitem. A packing list identifies the contents of individual packages. An inspection certificate is adocument issued by an independent inspection company to verify the contents or quality of theshipment.
13.1.6 A typical foreign trade transaction
As shown in figure 13.1, there are many steps and documents in the entire process of complet-ing a foreign trade transaction. Each step or document is a subsystem of the entire transactionprocess, which itself is closely connected by a variety of other subsystems. Thus, the successfulcompletion of a trade transaction may be viewed as an integral unit of many parts, which aredirectly or indirectly interrelated. A typical trade transaction might require the following 14 steps:
1 Importer places an order for a $1 million worth of machines, with an inquiry if Exporteris willing to ship under a letter of credit.
2 Exporter agrees to ship under a letter of credit and thus Importer arranges to have its bankopen a letter of credit in favor of Exporter.
3 Importer’s bank issues the letter of credit (L/C) in favor of Exporter and sends it to Exporter’sbank.
4 Once Exporter’s bank receives the L/C, it will notify Exporter.5 Exporter ships the machines to Importer through a common carrier that issues an order bill
of lading.6 Exporter prepares a 60-day draft on Importer in accordance with the L/C and presents it
to Exporter’s bank along with such other documents as the bill of lading. At the same time,Exporter endorses the order bill of lading so that a title to the machines goes with the holderof the documents.
7 Exporter’s bank forwards the draft and other documents to Importer’s bank for acceptance.When the draft is accepted by Importer’s bank, it becomes a bankers’ acceptance (B/A).This means that Importer’s bank has promised to pay the draft in 60 days.
8 Exporter instructs its bank to have the B/A discounted by Importer’s bank. Alternatively,Exporter’s bank receives the B/A from Importer’s bank and then it may sell the B/A to aninvestor at a discount. Another alternative is that Exporter’s bank may hold the B/A for 60days and present it to Importer’s bank for payment.
9 If Exporter’s bank has discounted the B/A with Importer’s bank, it transfers the proceedsless any fees and discount to Exporter.
BASIC DOCUMENTS IN FOREIGN TRADE 325

10 Importer’s bank notifies the arrival of the documents to Importer. Importer signs a promis-sory note to pay its bank for the machines in 60 days.
11 Then Importer’s bank releases the shipping documents so that Importer can claim the ship-ment.
12 Importer’s bank may sell the B/A in the money market to an investor.13 In 60 days, Importer’s bank receives the funds from Importer to cover the maturing B/A.14 On the same day, the holder of the B/A presents it to Importer’s bank for payment. Or, the
holder of the B/A may return it to Exporter’s bank for collection through normal bankingchannels.
13.2 The Payment Terms of Export Transactions
Because trade competition has become increasingly severe, MNCs must know how best to financetheir foreign trade. The terms and conditions under which foreign trade takes place vary signif-icantly. They range from cash before delivery to sales in a foreign currency with credit terms over
326 FINANCING FOREIGN TRADE
Importer
1
5
Purchase order
Shipment of goodsExporter
2 10 11 13
3
7
8
4 6 9
Exporter's bank
Money marketinvestor
B/A
B/A presented at maturity or return B/A for collection14
L/C
Importer's bank
12
14
Shipping documents and time draftaccepted (B/A created)
Payment – discounted value of B/A
Pay
men
t – d
isco
unte
d va
lue
of B
/A
Pay
men
t – fa
ce v
alue
of B
/A
L/C
not
ifica
tion
L/C
(le
tter
of c
redi
t) a
pplic
atio
n
Sig
ned
prom
isso
ry n
ote
for
face
valu
e of
B/A
Shi
ppin
g do
cum
ents
and
tim
e dr
aft
Shi
ppin
g do
cum
ents
Figure 13.1 The process of a typical trade transaction

1 year. Supply and demand conditions at the time of sale determine the actual terms and con-ditions of any particular transaction. But most foreign transactions involve longer credit termsthan domestic transactions.
13.2.1 Countertrade
Countertrade refers to world trade arrangements that are variations on the idea of a barter.Modern countertrade covers various international trade arrangements in which the sale of goodsand services by an exporter is linked to an import purchase of other goods and services. It becamepopular in the 1960s and 1970s as a way for communist countries to finance their internationaltrade without money. In recent years, countertrade has gained new stature in international trade.
World trade continues to grow faster than world production because of increased counter-trade. Unfortunately, no reliable figures on the volume of countertrade are available, because thereis so much secrecy involved. In the 1980s and 1990s, countertrade increased within the nonso-cialist world. In 1972, there were just 14 countries engaged in countertrade. By 1979, the listhad increased to 27 countries, by 1984, 88, by 1989, 94, and by 1995, over 140 countries(Stevens 1995). The countries engaged in countertrade today range from developing nations,such as China and India, to industrialized nations, such as the United Kingdom and Japan. Bythe year 2000, the International Monetary Fund, the World Bank, and the US Department ofCommerce estimated that countertrade would account for half of all world trade transactions(Anyane & Harvey 1995).
There is no way to determine the actual magnitude of countertrade, but some analysts esti-mate that it accounts for a third of world trade. In the past, the United States and internationalorganizations frowned on countertrade as an inefficient form of commerce. However, the USAhas been forced to recognize the cold fact that countertrade is growing in importance. TheOmnibus Trade and Competitiveness Act of 1988 created a Finance and Countertrade Divisionwithin the International Trade Administration of the Department of Commerce, to monitortrends for government. The Countertrade Division also disseminates information to US com-panies concerning countertrade opportunities and assists firms desiring to engage in countertradecommerce.
We discuss several forms of countertrade below: simple barter, the clearing arrangement, theswitch trade, counterpurchase, the compensation agreement, and the offset agreement.
SIMPLE BARTER Foreign trade, like domestic trade, is conducted in terms of money. However,foreign trade without money is possible through a barter system. Simple barter is a directexchange of goods between two parties without the use of any currency as a medium of exchange.Most barter arrangements are one-time transactions carried out under a single contract. Barterterms are usually arranged between two countries on a bilateral trading agreement. For example,in one recent year General Electric traded its turbine generator to Romania in exchange forRomanian products.
Of course, individual transactions are made within the framework of intergovernmental tradeagreements. Such barter deals are popular among nonmarket countries. Barter deals allow coun-tries with a shortage of foreign exchange to obtain their deficit goods in return for their surplusgoods. They also allow companies in countries that are short on foreign currency to obtain goodsthat they would not be able to obtain otherwise.
THE PAYMENT TERMS OF EXPORT TRANSACTIONS 327

THE CLEARING ARRANGEMENT A clearing arrangement is a form of barter in which any twocountries agree to buy a certain amount of goods and services from one another within a givenperiod of time. Both parties set up clearing accounts with each other that are debited wheneverone country imports from the other. At the end of an agreed-upon period of time, any accountimbalances are cleared by a hard-currency payment or by the transfer of additional goods.
Payments for exports to nonmarket countries are often made through clearing arrangementswhereby sales are balanced with purchases from importing countries. This clearing arrangementhas led to many bilateral trading agreements that try to identify the goods each country will tradeand to set overall trade limits. For instance, in 1994, China and Saudi Arabia had a clearingagreement of $1 billion to exchange goods and services. Their agreement contained a provisionthat any account imbalances would be settled for hard currency.
THE SWITCH TRADE A switch trade is a trading arrangement under which a third party pur-chases any account imbalance between the two countries. In other words, the third party willpurchase the imbalance from the surplus country on behalf of the deficit country; the imbalanceis then resold. Thus, switch trading is not really a separate form of countertrade but, rather, theinclusion of a middleman who serves to multilateralize the barter arrangement. The basic purposeof switch trading is to eliminate the imbalance in barter trade between two countries. Unfortu-nately, one of the countries frequently fails to sell sufficient goods to its trading partner. In thiscase, a shortage in clearing funds will be incurred for the deficit country. Hence, one countrybecomes a creditor, and the other becomes a debtor. When this occurs, the bilateral trading agree-ment tends to break down.
A breakdown is harmful to both countries, but there are two practical methods to avoid thisbreakdown. First, the bilateral trading agreement may specify that the debtor country payamounts in excess of the allowable variations in the form of gold or convertible currency to thecreditor country. This type of solution is known as a clearing arrangement. Second, to reconcilethe imbalance in barter transactions between the two countries, they may agree to utilize a switchtrade broker.
328 FINANCING FOREIGN TRADE
Example 13.1
Assume that Russia has agreed to trade its machinery for Cuban sugar. Russian machineryand Cuban sugar are then given arbitrary unit prices in clearing dollars. The agreement spec-ifies that $1 million in commodities will be exchanged during the following year. By the endof the year, Russia finds that it has accumulated $400,000 in unneeded sugar.
To meet its obligations as well as to dispose of the unwanted goods, Russia may seekthe services of a switch trader. Russia calls one of the switch trade brokers and offers her$400,000 worth of sugar in the clearing account at a discount of 30 percent. Once theactual value of the sugar has been ascertained by the broker, she calls sugar dealers whomight pick up the credit. Eventually, she finds a buyer who offers 75 percent of the credit.Russia receives 70 percent of its $400,000 credit in hard currency for the unneeded sugar,the broker takes 5 percent on the deal, and the buyer purchases the sugar for $400,000

COUNTERPURCHASE This form of countertrade typically takes place between a Western indus-trial country and a Third World country. A counterpurchase, also known as an “indirect offset,”involves a standard hard-currency export, but the seller agrees to a return purchase of goods andservices that are not directly related to the goods that the seller sold. For example, General Motors(GM) may agree to sell 500 passenger cars to Poland for $10 million and to buy $2 millionworth of Polish coal within a 2-year period.
The seller is frequently forced to buy some goods that are not easily marketable in its country.Thus, in our example, for GM to cover its potential losses, it could demand marketable goodsor increase its prices. If GM charges 15 percent more for its cars, it can buy back a comparablepercentage of worthless goods. Another alternative available to GM is to assign its obligation toother Western companies or export trading companies that may market these counterpurchasesmore readily.
THE COMPENSATION (BUYBACK) AGREEMENT A compensation agreement is an agreementby an exporter of plant and/or equipment to receive compensation in the form of future outputfrom that plant. Examples of buyback transactions include Japan’s recent agreements with Taiwan,Singapore, and Korea to exchange its computer chip production equipment for computer chipsproduced by the plant as full or partial payment.
A typical buyback transaction involves very large expenditures and a long-term time framefor fulfillment. Thus, such an arrangement has attributes that make it an alternative form ofdirect investment. The value of the buyback agreement normally exceeds the value of the origi-nal sale.
THE OFFSET AGREEMENT Frequently called “direct offset,” an offset agreement is an arrange-ment similar to the counterpurchase, but the seller is required to use goods and services from thebuyer country in the final product. In other words, under an offset agreement, the seller isrequired to offset the purchase price of the buyer in some way.
For decades, foreign buyers of US arms mostly wanted to help the US seller build the planes,missiles, or other weapons being sold to reduce the purchase price. Since the mid-1980s, buyershave increasingly wanted commercial and military technology to broaden the purchaser’seconomy. In fact, such contracts and technology transfers now occur in aerospace, transporta-tion equipment, and electrical equipment. The terms of the offset on individual contracts mayvary substantially. The most common categories of offsets are coproduction, licensed production,subcontractor production, overseas investment, and technology transfer.
AN EVALUATION OF COUNTERTRADE Hennart (1989) studied 1,277 countertrade trade con-tracts between June 1983 and December 31, 1986. These 1,277 transactions consisted of 694for clearing arrangements, 298 for counterpurchases, 171 for batters, 71 for buyback agreements,and 43 for offset agreements. Hennart found that each country grouping had a tendency toengage in certain types of countertrade transaction. Oil-exporting and -developing countries used
THE PAYMENT TERMS OF EXPORT TRANSACTIONS 329
minus a 25 percent discount. Russia, the switch-trade broker, and the buyer benefit fromthe deal, but Cuba may find that it has undersold its sugar in the world sugar markets bythe unexpected dumping of its own goods.

more counterpurchases, centrally planned economies engaged in more buyback agreements, anddeveloped and middle-income countries utilized more offset agreements. Barter was mostcommon between two middle-income countries, between developed and middle-income coun-tries, and between middle-income countries and centrally planned economies. The study byMarin and Schnitzer (1995) is consistent with Hennart’s findings.
In theory, countertrade is a movement away from free trade. This form of trade often forcessome MNCs to set up operations to deal in products very remote from their expertise. Coun-tertrade is also inflexible and involves a limited range of products.
Nevertheless, several reasons have been suggested for the current growth of countertrade. Theyinclude: (1) limited access to hard-currency finances; (2) the opening of new markets; (3) the useof countertrade as an alternative to direct investment; (4) the avoidance of trade restrictions; (5)the fulfillment of state planning goals; and (6) the disposal of surplus and poor quality goods.
13.2.2 Cash terms
Cash terms may be either COD or CBD. COD terms mean cash on delivery of the goods, andCBD terms mean cash before delivery of the goods. Under either COD or CBD terms, anexporter does not extend credit. Although credit risk does not exist under either terms, CODterms are accompanied by a risk that an importer may refuse a shipment, while CBD terms avoidall risk. Under CBD terms, an exporter may insist on cash at the time of order or he may specifythe time of cash payment prior to shipment. Another possible arrangement is that a part of thepayment is made at the time of order, that progress payments are made between the time of orderand the time of shipment, and that the final payment is made just before the release of goods toa common carrier.
Cash terms are the exception in these days of severe international competition. An importerdoes not like cash-type transactions, although such transactions are ideal from the exporter’s pointof view. One reason for this dislike is that an importer is forced to accept all risks in transit, inexchange fluctuations, and in the quality of the goods received. Consequently, the exporter willinsist on cash terms only in instances of the importer’s poor credit standing or extreme politicalrisks in the importing country. If the sale involves products specially manufactured for theimporter, the exporter may demand some kind of advance-payment arrangement.
13.2.3 Consignments
Goods for export may be consigned to a subsidiary, the exporter’s own agent, an independentagent, or an import house. Assume that an exporter in New York ships, to an importer in London,100 cases of quart bottles on a consignment basis. A consignment is the delivery of goods intothe possession of another for the purpose of sale. Because the exporter pays all the expenses con-nected with the shipment, the importer incurs no expenses at the time this shipment is deliv-ered to her warehouse. Actually, the 100 cases of bottles are still on the exporter’s inventory. Thus,if the importer should fail, the exporter can demand that all the unsold bottles be returned tohim.
Let us further assume that this consignment arrangement has a 10 percent commission on allbottles sold. If the importer sold all of the 100 cases at $50 per case, she would deduct her com-
330 FINANCING FOREIGN TRADE

mission of $500 (100 ¥ $50 ¥ 0.10) and remit to the exporter a dollar draft for $4,500 on aNew York bank.
A consignment to an independent agent or an import house has most of the same problemsas an open-account transaction. Hence, this type of operation is usually confined to companiesthat are working together very closely or that completely trust each other.
13.2.4 Credit terms
Most importers are not required to pay for goods before or on delivery, but they are allowed ashort postponement period before payment is made. During this period, the exporter extendsone of three types of credit to the importer: (1) open account, (2) notes payable, and (3) tradeor bankers’ acceptances.
OPEN ACCOUNTS Credit of this sort does not require the importer to sign a formal debt instru-ment as evidence to the amount that she owes the exporter. The importer simply charges herpurchases, much in the same fashion that domestic retail stores extend credit to their customers.Then the importer’s account is carried on the books of the exporter like other receivables. Thisarrangement places the entire financial burden upon the exporter. Because banks usually refuseto advance against accounts receivable, this ties up large amounts of the exporter’s capital. Inaddition, with this arrangement the exporter assumes the risks of foreign-exchange blockage andbuyer default. Therefore, open-account terms are extended only to trusted customers in coun-tries that have no foreign-exchange or political problems.
PROMISSORY NOTES In some export transactions, promissory notes are given instead of open-account credit. In this case, the importer is requested to sign a promissory note that providesevidence of her debt to the exporter. Thus, this arrangement makes the importer recognize herdebt formally. The note calls for the payment of the obligation at some future date.
TRADE ACCEPTANCES A trade acceptance is a form of short-term financing common in almostall foreign trade activities. In fact, it is the largest source of short-term funds for importers. Underthis method of financing, the exporter draws a draft on the importer, ordering her to pay thedraft at some specified future date. The exporter will not release the goods until the importeraccepts the draft. When the importer accepts the draft, it becomes a trade acceptance. When abank accepts the draft, it becomes the bankers’ acceptance.
THE COST OF THE CASH DISCOUNT FORGONE Most credit terms include a net period thatrefers to the period of time allowed for payment. The terms “net 30” mean that the invoice pricemust be paid within 30 days. The terms “2/10, net 30” indicate that a 2 percent discount isoffered if payment is made within 10 days; otherwise, the full amount of the bill must be paidwithin 30 days. The annual interest cost of the cash discount not taken may be computed asfollows:
percent cash discount100 percent cash discount net credit period-
¥360
THE PAYMENT TERMS OF EXPORT TRANSACTIONS 331

Thus, the annual interest cost of forgoing the terms “2/10, net 30” is:
Here we have used 360 days rather than 365 as the number of days in the year, for ease of cal-culation. If 365 days are used, the cost of the cash discount forgone increases to 37.24 percent.It is also important to note that the cost of the cash discount forgone is not an explicit cost asso-ciated with trade credit, but an implied cost.
COLLECTING OVERDUE ACCOUNTS Normally, between 1 percent and 3 percent of a company’sexports go uncollected. Small exporters, however, take more risks than do larger ones, for anumber of reasons. First, they are eager to develop new market opportunities. Second, they oftensell on terms other than a confirmed letter of credit. Third, they are not as well versed with themechanics of foreign sales. Consequently, their percentage of uncollected export sales may behigher than that of large exporters (see Global Finance in Action 13.1).
To establish clear-cut procedures for past-due accounts, the exporter must decide how overdueit should allow an account to become before collection procedures are started. If collection pro-cedures are begun too early, they may be too expensive in terms of both out-of-pocket expendi-tures and lost goodwill to the additional revenues that may be gained. As an account becomesolder, however, it becomes more expensive and more difficult to collect.
Once an account becomes delinquent, exporters have three options. Exporters will attemptto collect overdue accounts themselves by letters, phone calls, telexes, and/or personal visits. Ifall these attempts to collect overdue accounts fail, exporters can turn over the account to a col-lection agency or take direct legal action against the account. However, both alternatives areextremely costly in terms of both out-of-pocket costs and the customer relationship.
2100 2
36020
36 73-
¥ = . %
332 FINANCING FOREIGN TRADE
Global Finance in Action 13.1Pitfalls for Small Exporters
Rotary Corporation is a medium-sized US company that supplies aftermarket outdoorpower equipment parts and accessories. The company now delivers parts to cus-tomers in more than 48 foreign countries, as it explores avenues to maintain a world-wide presence in the outdoor power equipment industry. There are lessons fromRotary’s success that may help other small and medium-sized companies developinternational sales. Rotary avoided nine common pitfalls to global expansion by stress-ing the “three Cs” of international commerce: commitment, customers, and culturalsensitivity.
Four pitfalls in the area of commitment are: (1) insufficient commitment by topmanagement to overcome the initial difficulties and financial requirements of export-ing; (2) failure to obtain qualified export counseling and obtain a master internationalmarketing plan before starting an export business; (3) failure to use an export man-agement company; and (4) failure to consider licensing or joint venture agreements.

13.3 Sources of Financing Foreign Trade
Banks, private nonbank financial institutions, and governments pool their resources to financeforeign trade. Banks finance foreign trade through a variety of methods. Export trading compa-nies, factoring, and forfaiting are also used to finance foreign trade. The Export–Import Bankand the Private Export Funding Corporation are major forces in helping US exporters sell theirgoods and services to foreign buyers.
13.3.1 Bank financing
Banks are important lenders to those engaged in international trade. They provide several formsof credit that are convenient to exporters and importers, including trust receipts, bankers’ accep-tances, loans to exporters, and loans to importers.
TRUST RECEIPTS When goods are shipped under a time draft, the importer generally signs atrust receipt that collateralizes the draft by the goods, and establishes that borrowers hold certaingoods in trust for the lender. The document provides that the importer will be the agent of herbank in the sale of the goods. The bank retains title to the goods until the importer has madefull settlement. The importer is allowed to sell the goods but must turn the proceeds of the saleover to the bank in payment of the loan. The bank assumes any losses that occur under a trustreceipt.
BANKERS’ ACCEPTANCES We can best explain how this method of financing operates with thefollowing illustration. Assume that a Detroit firm desires to import a $10,000 shipment of per-fumes from a French firm. The French firm is willing to grant a 60-day credit. The Detroit firmmay arrange to have its Detroit bank open a letter of credit in favor of the French firm. Theletter of credit states that the Detroit bank will honor drafts drawn on the Detroit firm if theyare drawn in accordance with detailed terms in the letter of credit. When shipment is made, theFrench firm prepares a 60-day draft on the Detroit firm and presents it to its French bank. The
SOURCES OF FINANCING FOREIGN TRADE 333
Two pitfalls in the area of customer relations include: (5) insufficient care in selectingoverseas distributors; and (6) chasing orders around the world, instead of establish-ing a basis for profitable operations and orderly growth. Three pitfalls in the area ofcultural sensitivity are: (7) failure to assist vendors in complying with the North Amer-ican Free Trade Agreement; (8) failure to treat international distributors on an equalbasis with domestic counterparts; and (9) failure to print service, sales, and warrantymessages in local languages, or to modify products to meet cultural preferences inother countries.
Source: L. B. Fletcher, L. S. Hamilton, and L. T. Denton, “Exporting the Right Way,” StrategicFinance, July 1999, pp. 26–30.

French bank will advance the euro equivalent of $10,000, less interest and fees, to the Frenchfirm. Then the French bank will forward the draft, along with such shipping documents as thebill of lading, to its Detroit correspondent bank which, in turn, will present it to the Detroitfirm’s bank for acceptance. If all papers are found to be in order, the Detroit bank accepts thedraft and it becomes a bankers’ acceptance. Thus, bankers’ acceptances are drafts accepted bybanks.
Because bankers’ acceptances are of very high quality, the French bank can easily arrange itssale and thus recover the funds it advanced. If the French firm did not discount the draft at itsFrench bank, it could sell the draft to an investor at a discount. The Detroit firm obtains thecredit it wants, and the risks with the exception of the accepting bank are minimal. The credittransaction is completed when, in 60 days, the Detroit bank, which looks for repayment, paysthe bankers’ acceptance by the Detroit firm.
334 FINANCING FOREIGN TRADE
Example 13.2
An exporter has a $10,000 bankers’ acceptance for 6 months, the acceptance fee is 1percent per year, and the discount rate on this bankers’ acceptance is 12 percent per year.If the exporter chooses to hold the bankers’ acceptance until maturity and then collect, itwill receive the face amount less the acceptance fee:
Face amount of the bankers’ acceptance $10,000Less: 0.5% acceptance fee for 6 months 50Amount received by exporter in 6 months $9,950
Alternatively, the exporter can sell the bankers’ acceptance at a 6 percent discount rate (12percent ∏ 2) and receive $9,350 immediately:
Face amount of the bankers’ acceptance $10,000Less: 0.5% acceptance fee for 6 months 506% discount rate for 6 months 600Amount received by exporter immediately $9,350
LOANS TO EXPORTERS AND IMPORTERS Bankers’ acceptances are a form of bank loanto exporters. Banks can also make loans to exporters by cashing, purchasing, discount-ing, and collecting drafts. Banks cash drafts if the drafts are denominated in local cur-rency and are drawn on time. They purchase drafts if the drafts are denominated inforeign currencies. In this case, drafts are generally exchanged for local currency at anappropriate exchange rate. They discount drafts if the drafts are denominated in localcurrency and if the terms of the sales involve time drafts. When banks collect drafts,

they simply act as agents for exporters. However, they may lend against either the total or a per-centage of the drafts outstanding.
13.3.2 Other private financing
Some popular forms of other private financing consist of export trading companies, factoring,and forfaiting.
EXPORT TRADING COMPANIES In October 1982, President Reagan signed into law the ExportTrading Company Act, to help small and medium-size firms sell their goods overseas. Origi-nally, the Export Trading Company Act was conceived as the US answer to highly successfulJapanese trading companies, which handle most of that country’s exports.
The Export Trading Company Act of 1982 removed two major barriers that had long put USexporters at a disadvantage. First, this Act allows bank holding companies, previously barred byFederal regulations from investing in commercial enterprises, to invest in export trading com-panies. Second, it permits competing companies to join for export purposes without fear ofantitrust ramifications. An export trading company (ETC) must obtain certification from theSecretary of Commerce that it will not restrain domestic or export trade of the USA. When theSecretary of Commerce notifies the Attorney General of certification, the ETC is exempted fromboth criminal antitrust prosecution and the Bank Holding Company Act, so long as its activi-ties conform to those described in the certification.
Export trading companies engage primarily in two forms of activity: trade intermediation andexport outlets for US manufacturing companies. In their role as trade intermediaries, exporttrading companies can provide small and medium-size firms with comprehensive “one-stop” ser-vices, such as market analysis, distribution services, documentation, financing, foreign-exchangetransactions, transportation, and legal assistance. They can buy products from other US compa-nies and export these products either through their own outlets or to outside distributors.
FACTORING Factors buy a company’s accounts receivable largely on a nonrecourse basis andthus accelerate the conversion of the company’s claims against its customers. “Nonrecourse”means that the factor has no right to claim reimbursement from the seller of accounts receivableif the seller’s customers fail to pay their bills. Factors perform a number of additional functionssuch as credit checking, bookkeeping, collecting accounts, and risk bearing. The factor reviewsthe credit of the borrower’s customers and establishes credit limits in advance. The maximumamount of advance against uncollected accounts receivable is established as a percentage of theinvoice value. The factor receives an interest charge on the daily balance of advances plus a com-mission for credit analysis, bookkeeping, collecting accounts, and risk taking.
Exporters may turn to a factor when they have difficulty collecting on open-account sales orwhen their bank is unwilling to collect notes receivable. Factors’ rates on foreign accounts areusually higher than those of banks. Thus, factors are frequently used as a last resort by exporterswho need funds badly and/or have almost no hope of collecting.
The factor’s credit investigation of the exporter’s customers is relatively quick and inexpen-sive. For this reason, even if the exporter does not discount his accounts receivable, he can stilluse the factor’s facilities to estimate his prospective accounts’ creditworthiness. If the exporterdiscounts his accounts receivable on a nonrecourse basis, the factor will assume all commercial
SOURCES OF FINANCING FOREIGN TRADE 335

and political risks of nonpayment. For these services, factors charge a commitment fee of 1–2percent and a rate of interest in excess of the prime lending rate.
In June 1999 the Factors Chain International, the world’s largest network of factoring com-panies, reported that 700 factors from 50 countries had financed $500 billion worth of exportsin 1998. An exporter’s use of factors depends on two considerations. The first consideration iswhether the exporter can perform credit evaluation functions as well as the factor. Because largeinternational factors evaluate the same customer for many companies, they build credit files andexpertise, allowing them to evaluate credit at a lower cost than the exporter. The second consid-eration is whether the availability of funds and the interest charged by alternative sources aremore attractive than those offered by the factor.
336 FINANCING FOREIGN TRADE
Example 13.3
An exporter has recently sold its accounts receivable of $10,000 to a factor. The factoradvances 80 percent of the receivables, charges 1 percent interest per month, and chargesa 2 percent factoring commission (a one-time charge). Both the interest and the commis-sion are paid on a discount basis.
The exporter’s net proceeds are computed as follows:
Face value $10,000Less: 20% reserve due from factor 2,0002% factoring fee 200Funds available for advance $7,800Less: 1% interest on advance 78Net proceeds from advance $7,722
Hence, the exporter receives a cash advance of $7,722 now and expects to recover the$2,000 reserve later. The annualized cost of factoring the accounts receivable is 14.71percent [($200 + $78 ¥ 12)/($7,722)].
FORFAITING Because capital goods such as plants and airplanes are quite expensive, theimporter may not be able to make payment on the goods within a short period of time. Thus,long-term financing may be required on some international trade of capital goods. The exportercould finance such a sale, but may not desire to do so because its credit may extend over severalyears.
A forfaiting transaction involves an importer that issues a promissory note to pay for theimported goods over a period of 3–5 years. The notes are extended to the exporter, who sellsthem at a discount to a forfaiting bank. The importer will make semiannual payments duringthe period to the forfaiting bank. In other words, a forfaiting transaction refers to the purchaseof financial obligations such as promissory notes without recourse to the exporter. The forfait-

ing markets, centered in London and Zurich, are largely free of government support, supervi-sion, or regulation.
A typical forfaiting transaction involves four parties: the importer, the exporter, a bank, andthe forfaiter. The importer pays the exporter with promissory notes that will mature at set inter-vals over a several-year period. A bank in the importer’s country then guarantees these promis-sory notes; those notes guaranteed by a bank are usually irrevocable, unconditional, andtransferable. The exporter in turn sells the guaranteed paper to the forfaiter at a discount fromthe face value; the amount of discount depends on the importer’s credit rating, the guaranteeingbank’s credibility, and interest costs over the paper’s lifetime. As the paper matures, the forfaiteror the holder of the paper presents it to the guaranteeing bank for payment.
The forfaiting arrangement allows the exporter to avoid most risks involved in his export sales.However, this financing method has a number of drawbacks. First, the amount of the discountcan be quite large. Second, the guaranteeing bank normally charges a substantial fee and placesa freeze of equal value on the importer’s account. Third, the exporter still faces some risk if thebank guarantor and/or the importer refuses to pay on the ground that the notes have some hiddenlegal defect.
The value of world exports financed through forfaiting arrangements reached about $30billion in 1998. Conceptually, forfaiting is a form of factoring. Factoring is normally used forshort-term, relatively small deals with repeat customers. Forfaiting, on the other hand, is typi-cally used for medium-term, one-time major deals up to $100 million in size. Table 13.1 showsthe major differences between these two forms of export financing.
13.3.3 Export financing methods in practice
To determine the usage of major export-financing vehicles, Ricci and Morrison (1996) surveyedtreasurers of Fortune 200 companies in 1995. They received a 63 percent response rate fromtheir questionnaire. These two researchers found that Fortune 200 companies exhibit a highdegree of internationalization: more than 98 percent sell overseas.
Table 13.2 shows how frequently large US MNCs used the six export-financing methodsdescribed in this chapter: the open account, letters of credit, drafts, cash in advance, factoring,and consignment. Open accounts and letters of credit were the most frequently used methods.
SOURCES OF FINANCING FOREIGN TRADE 337
Table 13.1 Differences between factoring and forfaiting
Factoring Forfaiting
Occasionally with recourse Always without recourseMaturity of 6 months or less Maturity of 6 months to 10 yearsOngoing, revolving deals One-time dealsWorks with consumer goods Works with capital goodsAvoids developing countries Works well in developing countriesLess expensive More expensive
Source: G. S. Hill and K. Tanju, “Forfaiting: What Finance and Account-ing Managers Should Know,” Financial Practice and Education,Fall/Winter 1998, pp. 53–8.

Because both methods provide significant benefits to importers, US MNCs appear to increasetheir export sales by offering attractive terms to foreign customers. About half of the respondentsreported that they sometimes used drafts and cash in advance.
13.3.4 Government financing
The USA has several government sources of export financing: the Export–Import Bank (Ex–Im Bank), the Private Export Funding Corporation, and the Foreign Credit Insurance Association.
THE EXPORT–IMPORT BANK (EX–IM BANK) The bank was founded in 1934 as an indepen-dent agency of the US government. It is a financially self-sustaining agency, set up to promoteUS exports through a variety of export financing and loan guarantees. The creation of the ForeignCredit Insurance Association (FCIA) in 1963 completed the triad of official loan, guarantee, andinsurance offerings demanded by US exporters. Ex–Im Bank officials have fully managed thesethree basic export-finance programs since the bank took over the FCIA in 1983. Ex–Im Bankoperations must conform to the two general guidelines. First, loans must be used exclusively tofinance the export of goods and services of US origin. Second, loans should have reasonable assur-ance of repayment and related transactions should not adversely affect the US economy.
The Ex–Im Bank was originally created to facilitate trade with the former Soviet Union, butits purpose has been expanded over the years. It now finances US exports to Russia and manyother countries through a variety of loan and guarantee programs, such as direct loans, discountloans, cooperative financing facility, and guarantees.
THE PRIVATE EXPORT FUNDING CORPORATION (PEFCO) The corporation was created in1970 at the initiation of the Bankers’ Association for Foreign Trade, with the support of the USTreasury Department and the US Ex–Im Bank. The basic purpose of the PEFCO was to mobi-lize private capital in order to finance US exports of big ticket items such as aircraft and powerplants. PEFCO’s stockholders consist of 54 commercial banks, seven large manufacturers, andone investment banker. All of PEFCO’s loans are guaranteed by the Ex–Im Bank and are general
338 FINANCING FOREIGN TRADE
Table 13.2 The usage of export-financing methods
Method Often Sometimes Rarely Never
Open account 52.1% 34.5% 10.1% 3.4%Letters of credit 43.5% 46.8% 7.3% 2.4%Drafts 13.2% 52.9% 27.3% 6.6%Cash in advance 12.5% 41.7% 40.0% 5.8%Factoring 2.6% 13.0% 34.8% 49.6%Consignment 1.7% 15.4% 51.3% 31.6%
Source: C. W. Ricci and G. Morrison, “International Working CapitalPractices of the Fortune 200,” Financial Practice and Education,Fall/Winter 1996, pp. 7–20.

obligations to the USA. Thus, the PEFCO itself does not evaluate credit risks of foreign bor-rowers, economic conditions in foreign countries, and other factors that might affect the collec-tion of its loans. Most PEFCO loans have medium-term maturities of 7 years, but some havematurities over 15 years.
THE FOREIGN CREDIT INSURANCE ASSOCIATION (FCIA) Most exporters sell under letters ofcredit, as described in the earlier part of this chapter. In this type of sale, banks assume all risksin export transactions except for transactions under revocable letters of credit. However, importersfrequently do not want to open letters of credit because of the cost or difficulty of securing them.At other times, under severe competition, exporters must sell on open account or on draft termswithout letters of credit. Under these circumstances, an exporter could suffer heavy losses evenafter carefully examining an importer’s creditworthiness. These losses may develop from such sit-uations as expropriation and riots beyond the control of the exporter or the importer.
The governments of most industrial countries have helped their exporters in many ways overthe years. Although the US Ex–Im Bank had helped US exporters reduce their risks since 1934,they still lacked the protective umbrella that many of their competitors were enjoying. In the fallof 1961, the Secretary of the Treasury, the Ex–Im Bank, and 50 leading insurance companiesorganized the Foreign Credit Insurance Association (FCIA).
The FCIA provided credit protection for US exporters. It insured exporters for an agreed per-centage of losses from credit risks, whether they were commercial, political, or both. Commer-cial risks included such risks as the failure of an importer before payment and its protractedpayment default. Political risks included currency inconvertibility, cancellation of import licenses,expropriation, and war or revolution. But in October 1983, 41 of the original FCIA memberswithdrew from the association because of heavy commercial losses, particularly in Mexico. SinceOctober 1983, the Ex–Im Bank itself has insured exporters against both commercial and polit-ical risks, leaving the FCIA to operate as its marketing and service agent. The Ex–Im Bank creditprotection program for exporters covers short-term cases of up to 180 days and medium-termcases of 181 days to 5 years.
SUMMARY 339
SUMMARY
This chapter has discussed various documents and operations essential to finance foreign trade. Theextension of credit on foreign trade is of critical importance to both exporters and importers in atransaction. For exporters, their willingness and ability to extend credit are crucial determinants ofsales volume across national boundaries. For importers, their ability to continue operations relies onthe lag between payments by their customers and remittances to their foreign suppliers.
The three basic documents used in normal export–import transactions are the draft, the bill oflading, and the letter of credit. A draft is an order written by an exporter that requires the importerto pay a specified amount at a specified time. A bill of lading is a shipping document issued to theexporting firm by a common carrier that transports the goods. In the document, the bank agrees tohonor a draft that results from an import transaction by a foreign buyer. The letter of credit assuresthat there will be payments for goods shipped to the importer.
Some forms of countertrade such as barter and switch trading make international transactionspossible without money. However, most transactions across national boundaries are conducted in

340 FINANCING FOREIGN TRADE
terms of money. The payment terms of foreign trade include cash terms, consignments, and creditterms, all of which require money. The actual payment terms of exports depend largely upon com-petitive conditions prevailing at the time of initiating the transaction.
Finally, this chapter has examined a number of private and government sources to financeforeign trade. Banks are important lenders to those engaged in foreign trade. Bank-financing oper-ations include trust receipts, bankers’ acceptances, and several other forms of loans. In addition tobank financing, there are several other sources of private financing. The Export Trading CompanyAct of 1982 allows bank holding companies and other financial institutions to set up trading com-panies for export purposes. International factors buy accounts receivable from exporters and thencollect them as they become due. Finally, forfaiting can be used to finance capital goods such aspower plants and airplanes. Under a typical arrangement, an exporter receives immediate cash bydiscounting its promissory notes or trade receivables to a forfaiting bank.
The Ex–Im Bank is the only US government agency established solely to facilitate the foreigntrade of the USA. It is also a major force for helping US exporters reduce their commercial andpolitical risks. The Private Export Funding Corporation finances US exports of aircrafts and otherbig ticket items.
Questions
1 What are the objectives of documentation in international trade?2 What are bills of lading and how do they facilitate trade financing?3 The basic problem in assessing different forms of export financing is how to distribute
risks between the exporter and the importer. Explain the following export financing doc-uments in this respect:(a) the time draft;(b) the sight draft;(c) the confirmed, revocable letter of credit;(d) the confirmed, irrevocable letter of credit;(e) cash before delivery;(f) cash on delivery;(g) consignment;(h) open-account credit.
4 In addition to the draft, the bill of lading, and the letter of credit necessary in foreigntrade, other documents must generally accompany the draft as specified in the letter ofcredit. Such other documents include commercial invoices, insurance documents, andconsular invoices. Briefly describe each of these three documents.
5 What is countertrade?

PROBLEMS 341
6 What are bankers’ acceptances? What are the advantages of bankers’ acceptances as anexport-financing instrument?
7 What are the major elements of the 1982 Export Trading Company Act? What are themajor objectives of the Act?
8 What is the role of a factor in foreign trade? How can a factor aid an exporter?9 What is forfaiting? List the parties involved in a forfaiting transaction.
10 What is the role of the Export–Import Bank?11 Describe the role of the Private Export Funding Corporation (PEFCO).
Problems
1 For each of the following import purchases, (a) calculate the annual cost of the cash dis-count forgone, and (b) determine the date and amount paid if the discount is taken.Assume that the invoice date is March 10 and that there are 30 days in a month.(i) $500, 2/10, net 30;(ii) $3,500, 4/20, net 60;(iii) $1,500, 3/30, net 40;(iv) $4,400, 2/10, net 70.
2 An exporter has a $20,000 bankers’ acceptance for 6 months, the acceptance fee is 2percent per year, and the discount rate on this bankers’ acceptance is 10 percent per year.(a) How much cash will the exporter receive if it holds the bankers’ acceptance until
maturity?(b) How much cash will the exporter receive if it sells the bankers’ acceptance at a 10
percent discount rate?(c) The exporter’s opportunity cost of funds is 10.2 percent per year. If the exporter
wishes to maximize the present value of her bankers’ acceptance, should she discountthe bankers’ acceptance or hold it until maturity?
3 An exporter has recently factored its accounts receivable at a rate of $10,000 a month.The factor advances 80 percent of the receivables, charges 1 percent interest per monthon advances, and charges a 3 percent factoring fee. The interest and fee are paid on adiscount basis.(a) Determine the net proceeds to the exporter.(b) Determine the effective annual cost of this financing arrangement.

342 FINANCING FOREIGN TRADE
REFERENCES
Anyane, N. K. and S. C. Harvey, “A CountertradePrimer,” Management Accounting, Apr. 1995, pp.47–50.
Choudry, Y. A., M. McGeady, and R. Stiff, “AnAnalysis of Attitudes of US Firms Toward Coun-tertrade,” Columbia Journal of World Business,Summer 1989, pp. 31–8.
Fletcher, L. B., L. S. Hamilton, and L. T. Denton,“Exporting the Right Way,” Strategic Finance, July1999, pp. 26–30.
Hennart, J. F., “Some Empirical Dimensions of Countertrade,” Journal of International
Business Studies, Second Quarter 1989, pp. 243–70.
Marin, D. and M. Schnitzer, “Tying Trade Flows: ATheory of Countertrade with Evidence,” TheAmerican Economic Review, 1995, pp. 1047–64.
Ricci, C. W. and G. Morrison, “InternationalWorking Capital Practices of the Fortune 200,”Financial Practice and Education, Fall/Winter1996, pp. 7–20.
Stevens, J., “Global Purchasing and the Rise ofCountertrade,” Purchasing and Supply Manage-ment, Sept. 1995, pp. 28–31.
Case Problem 13: Arms Dealers Get Creativewith Offsets
In December 2002, Lockheed Martin, with its F-16 Fighting Falcon, beat French and Anglo-Swedish rivals to land a $3.6 billion deal from Poland, which is Eastern Europe’s largest defenseorder. Do you know how Lockheed won the contract? The answer is simple. Lockheed’s offsetoffer was larger than that of their two rivals. Lockheed put together over 100 projects itvalued at $9.8 billion, compared with $7.8 billion from its Anglo-Swedish rival and $3.9 billionfrom its French rival.
In recent years, The General Accounting Office (GAO) of the USA examined offset agree-ments between the US arms producers and 10 buyer countries in the Middle East, Asia, andEurope (which included the world’s most active buyers of US arms, such as Taiwan, SouthKorea, Saudi Arabia, Kuwait, and the UK). The USA controls about one-half of the world’sarms exports and dominates sales in most regions. The GAO study also found that the UnitedArab Emirates (UAE) have broken new ground in recent years by demanding that Boeinginvest in and help with big projects that are not related to the company’s main lines of busi-ness. For example, the UAE requires that Boeing and other sellers return 60 percent of thevalue of its arms purchases through investment in commercially viable ventures. And the sellercompany is deemed to have satisfied its obligation only on the basis of the profits generatedby these ventures. The UAE and other countries increasingly insist that the contracts andtechnologies be delivered into new businesses, rather than existing ones.
“Offsets” are trade demanded by a foreign buyer, which for decades mostly wanted tohelp the US seller build the planes, missiles, or other weapons being sold. Since the mid-1980s, buyers have increasingly wanted commercial and military technology to broaden thepurchaser’s economy. In fact, such contracts and technology transfers now occur in aero-

CASE PROBLEM 13 343
space, transportation equipment, and electrical equipment. This form of countertrade is anarrangement similar to counterpurchase, but the seller is required to produce parts, sourceparts, or assemble the product in the importing country. Many countries demand ever-higherpercentages, often 100 percent or more, of the value of the contract to be returned to thepurchasing nation through offsets. For example, Boeing sold AWACS to the UK Ministry ofDefence and agreed to buy 130 percent of the value of the transaction in British goods. InApril 2000, the US Department of Commerce reported that offset transactions had increasedfrom 35 percent of the value of the contracts in 1993 to 42 percent in 1994. Figure 13.2shows that offset obligations have accounted for approximately 70 percent of the contractvalue from 1995 to 1997.
One recent GAO report cited an instance in which, in return for its sale of AH-64 Apachehelicopters to the UAE, Boeing helped the country to form companies that make productsfor cleaning up oil spills or for recycling used photocopier and laser printer cartridges. TheUS government has expressed concern about this and other offset transactions. A spokesmanfor Boeing, however, said that the big plane-maker has no choice but to offer offsets if thecompany wants to win foreign sales. “The only other alternative is to let the sale and all ofthe related jobs go to another manufacturer that is willing to provide offsets,” he added.Other US defense companies say that without the offset agreement, they would lose thesales to providers in Europe, Russia, or elsewhere. They also say that the deals lower the costto US taxpayers of acquiring weapons for the Pentagon, because these deals lessen US com-panies’ dependence on Pentagon contracts.
In recent years, entrepreneurs in the Middle East and Asia have launched more exoticplans, called offset investment funds. They have pooled money from weapons sellers to be
Exports
Offsets
15
10
5
01993 1994 1995 1996 1997
Year
The USA makes …US defense exports and offset obligations$ billions
… The world takesRecipients of new offset agreements,and their share of total deals by value,1993–7
The Netherlands
Switzerland
Taiwan
SaudiArabia
UK26%
9.5%
9.0%
8.5%
7.5%
Italy7.2%
Other22.3%
Figure 13.2 US arms exports and offset obligations
Source: The Wall Street Journal, Apr. 20, 2000, p. A18 (from the US Department of Commerce);reprinted by kind permission.

344 FINANCING FOREIGN TRADE
invested for offset credit. Lockheed Martin Corp.’s $6.4 billion sale of F-16 jets to the UAEin March 2000 corroborates this inference. Lockheed satisfied its offset by investing $160million in the petroleum-related “investment portfolio” of the Offsets Group, which admin-isters the program in the UAE. Some US government officials have expressed a concern aboutthe possibility that such offset payments could be used to channel favors to foreign officials.That is barred under US law.
Case Questions
1 The terms of the offset on individual contracts may vary substantially. The most commoncategories of offsets are coproduction, licensed production, subcontractor production,overseas investment, and technology transfer. Briefly describe each of these offsets.
2 What are the policy goals of those foreign countries that demand offset concessions toUS arms producers?
3 What is the adverse economic impact of offset agreements in the USA?4 Name and discuss the US law that makes it illegal for US companies to make payments
to foreign officials with hopes of winning their favors in business transactions? (Hint: lookat chapter 20: Multinational Accounting.)
5 Explain why Lockheed’s $160 million investment in the UAE Offset Group might violatethe US law.
6 Use the website of the American Countertrade Association (ACA), www.countertrade.org,to list the types of services provided by the ACA.
Sources: J. K. Cole, “Evaluating Offset Agreements: Achieving a Balance of Advantages,” Law and Policy inInternational Business, Vol. 19, 1987, pp. 766–809; J. Cole and H. Cooper, “Buyers of US Arms ToughenDemands,” The Wall Street Journal, Apr. 16, 1997, pp. A1, A16; H. Cooper, “US Defense Firms Hurt byOffset Deals Abroad,” The Wall Street Journal, May 21, 1997, pp. A2, A4; G. T. Hammond, Countertrade,Offsets, and Barter in International Political Economy, New York: St Martin’s Press, 1990; “Lockheed Wins$3.5 B F-16 Deal With Poland,” http://www.foxnews.com, Dec. 27, 2002; and D. Pearl, “Arms Dealers GetCreative with Offsets,” The Wall Street Journal, Apr. 20, 2000, p. A18.
Opening Case 14: Failed US–Vietnamese Joint Ventures
Since 1994, US companies have established joint ventures with Vietnamese businesseson everything from auto factories and cola bottlers to power plants and steak houses.American partners include Chrysler, Ford, Proctor & Gamble, Citibank, Caterpillar, andNike. Many factors – more capital, less political risk, and local marketing expertiseamong others – favored US–Vietnamese joint ventures. However, many Americaninvestors are forsaking their enterprises because of heavy losses. Consequently, USinvestment in Vietnam dropped from $635 million in 1996 to $117 million in 1999.Investors from several other countries, such as Taiwan, Korea, and Japan, have alsolost heavily in Vietnam.
A key example of a failed joint venture is American Rice. Its multimillion-dollareffort to build a rice business in the Mekong delta – one of the first and most promi-nent US ventures in Vietnam – had collapsed in 1998. American Rice’s local partnershad become enemies, the police threatened to put its employees in prison, and theCommunist Party attacked the situation as the latest example of American imperial-ism. Many US companies in Vietnam today realize that they share all of AmericanRice’s problems – poor legal protection, hostile joint-venture partners, heavy bureau-cracy, and differences in culture. Because of its importance, let us review the case.
In early 1994, American Rice set up a joint venture with an influential local partnerto sell Vietnamese rice overseas. With American Rice hungry for supply and Vietnamdesperate for customers, the venture seemed ideal for both sides and for millions ofstruggling Vietnamese farmers. But what started as a partnership quickly became acontest. The local partner refused to grant American Rice permits for exports andcharged the company new fees that doubled the costs of the joint venture.
A few months into the new venture, American Rice received permits to export only30,000 tons, well below the 120,000 tons agreed upon. In 1995, American Rice wona contract to sell the government of Iran $100 million of rice at the highest-ever price
CHAPTER 14
Financing ForeignInvestment

Multinational companies (MNCs) first decide on the nature of their needs for funds, and thenthey seek the funds from many available sources. In addition to the investment in fixed assets, aforeign investment project may require additional current assets such as accounts receivable andinventories. Consequently, MNCs must consider various sources of funds for their overseas pro-jects and the decision variables that affect the selection of particular sources.
This chapter examines three major sources of funds for foreign investment: (1) internal sourcesof funds, (2) external sources of funds, and (3) sources of funds from development banks. First,MNCs may use internally generated funds such as profits and depreciation charges. If internalsources of funds are insufficient, they may obtain their capital from sources within their homecountry and/or in foreign countries. In addition to these internal and external sources of funds,development banks provide MNCs with a variety of financing sources.
14.1 Internal Sources of Funds
Internal sources of funds are those funds generated within a parent–affiliate network. Theyinclude capital contributions from the parent, loans with parent-company guarantees, funds pro-vided by operations from retained earnings and depreciation, and intersubsidiary funds transfers.
14.1.1 Funds from the parent
Three major types of funds supplied by the parent are equity contributions, direct loans, andindirect loans under parent-company guarantees.
346 FINANCING FOREIGN INVESTMENT
for Vietnamese rice. The Vietnamese government, however, forced American Rice togive about half of the Iran contract to local exporters. American Rice’s radical rice-buying program stirred further controversy. Rather than buying from pricey state-owned brokers or traders, American Rice purchased straight from the growers, therebycutting costs and delivering higher prices for the farmers. Thus, many rice farmerswere delighted, but the government was not pleased and said to American Rice: “Wegave you a license to sell rice, not to start a social revolution.”
In October 1996, the government announced that it was launching a probe of theAmerican Rice venture. Investigators questioned the entire staff and combed throughstacks of company receipts. The government concluded that American Rice had“materially” violated its investment license and the laws of Vietnam, and causedserious damage to its Vietnamese partner. When the report was leaked to the localpress, American Rice became a lightning rod for anti-Americanism. After incurringmore than $3 million in losses, American Rice closed its Vietnamese venture in early1998. No wonder, then, that in March 2000, Moody’s Investor Service “pointed tothe country’s hesitance to allow further foreign participation in the economy” as athreat to progress.
Source: Robert Frank, “Withdrawal Pains: Americans Once Again Land in a Quagmire,” The WallStreet Journal, Apr. 21, 2000, pp. A1, A6.

EQUITY CONTRIBUTIONS Every new foreign subsidiary must receive some funds in the formof equity to satisfy both authorities in the host country and outside creditors about its solvency.Occasionally, MNCs decide on expansion funds in the form of an equity investment for theirown foreign subsidiary. This part of recapitalization gives the foreign subsidiary an increasedcapital base to support additional loans. More specifically, equity contributions of cash are usedto acquire going concerns, to buy out local minority interests, to set up new foreign subsidiaries,or to expand existing subsidiaries. Although they are a normal way of handling direct invest-ments, in some developing countries direct-equity investments take the form of machinery ortechnology instead of cash. Some MNCs have acquired a percentage of common-stock equity offoreign businesses in exchange for supplying machinery, equipment, tools, and intangibles(patents, engineering, etc.) necessary for manufacturing certain products.
Common stockholders have residual claims on earnings and assets in the event of liquidation.Hence, an equity investment is not very flexible for the investor, but it is most acceptable to thehost country and outside creditors. Dividends – the profit remittances derived from equity invest-ments – are heavily taxed when we compare equity contributions with investments derived fromother funding alternatives. Normally, dividends from countries to foreign shareholders are subjectto local income taxes as well as to withholding taxes. Withholding taxes are incurred when localearnings are distributed abroad as dividends. This explains why many MNCs are reluctant tomake large equity investments in their foreign subsidiaries.
DIRECT LOANS MNCs may elect to provide investment funds to their foreign operations inthe form of intracompany loans instead of increasing their equity contributions. However, theparent company lends money as an owner to its subsidiaries. The intracompany loan usually con-tains a specified repayment period for the loan principal and earns interest income that is taxedrelatively lightly. These two features of intracompany loans compare favorably with an open-ended equity investment, which produces profits in the form of heavily taxed dividends.
Parent loans to foreign subsidiaries are usually more popular than equity contributions for anumber of reasons. First, parent loans give a parent company greater flexibility in repatriatingfunds from its foreign subsidiary. In nearly every part of the world, laws make it more difficultto return funds to the parent through dividend payments or equity reductions than through inter-est and principal payments. Moreover, a reduction in equity is often construed as a plan to leavethe country.
Second, tax considerations are another reason for favoring parent loans over equity contribu-tions. In most cases, interest payments on internal loans are tax deductible in the host country,while dividends are not. Moreover, principal payments, unlike dividend payments, do not gen-erally constitute taxable income. Thus, it is possible that both a parent and its subsidiaries willsave taxes by using loans instead of equity contributions.
MNCs can also provide credit to their subsidiaries not only by making loans but also by delay-ing the collection of accounts receivable. The amount of credit available through these intra-company accounts is limited to the amount of goods exchanged. Moreover, governmentsfrequently limit the length of the credit term. However, because intracompany accounts involveno formal documents, they are easier to use. In addition, most governments interfere less withpayments on intracompany accounts than on loans.
PARENT GUARANTEES When foreign subsidiaries have difficulty in borrowing money, a parentmay affix its own guarantees. While MNCs have traditionally been reluctant to guarantee the
INTERNAL SOURCES OF FUNDS 347

debts of their subsidiaries, indications are these guarantees will increase. There are a variety ofparent guarantees:
1 The parent may sign a purchase agreement under which it commits itself to buy its sub-sidiary’s note from the lender in the event of the subsidiary’s default.
2 The lender may be protected on only a part of the specific loan agreement.3 Another type of guarantee is limited to a single loan agreement between a lender and the
subsidiary.4 The strongest type requires that the lender be protected on all loans to the subsidiary without
limits on amount or time.
The types of loans with parent guarantees and the availability of such loans depend largely uponthe parent’s prestige and credit standing.
14.1.2 Funds provided by operations
Once a newly formed subsidiary gets on its feet, internal fund flows – retained earnings anddepreciation – are the major sources of funds. These internal fund flows, coupled with localcredits, leave relatively little need for fresh funds from the parent.
Foreign subsidiaries are not always free to remit their earnings in hard currency elsewhere.Many developing countries have problems with their balance of payments and do not have suf-ficient international reserves. Thus, they restrict repatriation of funds for a specified number ofyears or to a certain percentage of the net income. These factors frequently force foreign sub-sidiaries to reinvest their internally generated funds in the host country. If a company wishes touse these internal fund flows for the expansion of an initial project in later years, an initial projectmay have to be smaller than actual demand requirements. If the anticipated expansion is neces-sary to meet current demand and the normal growth in demand, MNCs would have no diffi-culty in profitably using the internal fund flows in the host country.
14.1.3 Loans from sister subsidiaries
The availability of intersubsidiary credit, in addition to funds from the parent, vastly expandsthe number of possibilities for internal financing. For example, if a subsidiary in Austria has fundswhich it does not need immediately, it may lend these funds to a sister subsidiary in Norway,and vice versa. However, many countries impose exchange restrictions on capital movements tolimit the range of possibilities for intersubsidiary loans. Moreover, the extensive use of intersub-sidiary financial links makes it extremely difficult for a parent company to control its subsidiarieseffectively.
Nevertheless, many subsidiaries borrow cash from their sister subsidiaries. When there are onlya few subsidiaries within a company’s family, it is straightforward to arrange intersubsidiary loans.One subsidiary treasurer may negotiate directly with another sister subsidiary treasurer to obtainor give credit. However, an MNC with many subsidiaries in many countries may prefer to haveits central staff handle all excess funds, or to establish a central pool of these funds on a world-wide basis under two conditions: (1) if the number of financial relationships does not exceed the
348 FINANCING FOREIGN INVESTMENT

capability of the main office to manage them effectively; and (2) if a parent company does notwant to lose control over its subsidiaries.
14.2 External Sources of Funds
If an MNC needs more funds than the amount that can be reasonably generated within a cor-porate family, the parent or its foreign subsidiaries may seek outside sources of funds. Such exter-nal sources of funds include joint business ventures with local owners and/or borrowings fromfinancial institutions in the parent country, the host country, or any third country (see GlobalFinance in Action 14.1).
Although subsidiaries can borrow directly from outside the host country, most of them borrowlocally for a number of reasons:
1 Local debts represent automatic protection against losses from a devaluation of local currency.2 Subsidiary debts frequently do not appear on the consolidated financial statement issued by
a parent as part of its annual report.3 Some host countries limit the amount of funds that foreign companies can import from
outside the host country.4 Foreign subsidiaries often borrow locally to maintain good relations with local banks.
EXTERNAL SOURCES OF FUNDS 349
Global Finance in Action 14.1Guidelines for Adequate Capitalization
MNCs are not only able to raise funds in international and national capital marketsbut also to take advantage of capital market imperfections throughout the world.This comparative advantage should theoretically allow MNCs to enjoy a lower costof capital than competing domestic companies. Companies have a number of outsidefinancial options from which to choose to finance their foreign investment projects.These external financial options include banks, government institutions, other typesof financial intermediaries, and even the public sector in the host country. To avoiddrawbacks inherent in the thin capitalization of foreign investment projects, compa-nies usually seek an optimum capital structure. An optimum capital structure isdefined as the combination of debt and equity that yields the lowest cost of capital.
Several ratios can be used to determine an optimum financing mix of debt andequity for overseas projects. Cassidy (1984) recommends a number of guidelines forcompanies to develop capitalization strategies for their overseas projects:
1 The investor’s own resources should be sufficient to approximately cover theproject investment in fixed assets. Outside financing should support investmentin net working capital of the unit.

14.2.1 Commercial banks
As noted in chapter 13, commercial banks are a major financial intermediary in trade credit.They are also the most important external source for financing nontrade international opera-tions. The types of loans and services provided by banks vary from country to country, but allcountries have some funds available at local banks.
Most of the local loans obtained by subsidiaries are short-term credits from commercial banks.These short-term credits are used largely to finance inventory and accounts receivable. They areself-liquidating loans to the extent that sufficient cash flows are produced to repay the credits asinventories are sold on credit and receivables are collected over the business cycle. The principalinstruments used by banks to service an MNC’s request for a loan are as follows:
• Overdrafts are lines of credit that permit the customer to write checks beyond deposits. Thebank establishes the maximum amount of such credit on the basis of its analysis of the cus-tomer’s request, needs, and potential cash flows. The borrower agrees to pay the amount over-drawn and interest on the credit. Although some banks waive service charges for theircreditworthy customers, others frequently require service charges and other fees.
• Unsecured short-term loans – most short-term bank loans for MNCs to cover seasonalincreases in current assets are made on an unsecured basis. The percentages of such loans varyfrom country to country, and reflect variations in individual bank policy and central gov-ernment regulations. Most MNCs prefer to borrow on an unsecured basis because book-keeping costs of secured loans are high, and because these loans have a number of highlyrestrictive provisions. However, some foreign subsidiaries cannot obtain loans on an unse-cured basis, because they are either financially weak or have not established a satisfactory per-formance record.
• Bridge loans are short-term bank loans used while a borrower obtains long-term fixed-rateloans from capital markets. These bridge loans are repaid when the permanent financingarrangement is completed. During the peak of its currency crisis in early December 1997,Korea obtained a bridge loan of $1.3 billion from the Bank of Japan. This bridge loan wasaimed at tiding Korea over until a $58 billion rescue package arranged by the InternationalMonetary Fund began to kick in.
• Currency swaps are agreements to exchange one currency with another for a specified period,after which the two currencies are re-exchanged. Arbi loans are the best-known example of
350 FINANCING FOREIGN INVESTMENT
2 The ratio of outside financing to total capitalization of the project (the debt ratio)should generally be about 0.50. Thus, approximately equal amounts of outsidedebts and equity investments will be employed in the local project.
3 The projected earnings from the overseas project should provide adequate “inter-est coverage” for its intended outside debt service. To ensure continuing liquidity,these earnings should be a substantial multiple of the project’s annual financial costs.
Source: G. T. Cassidy, “Financing Foreign Investments: The International Capital Markets,” in AllenSweeny and Robert Rachlin, eds., Handbook for International Financial Management, New York:McGraw-Hill, 1984, pp. 1–11.

such swaps. An arbi loan is arranged in a country where money is readily available at rea-sonable rates. It is converted to the desired local currency, but the borrower arranges a forwardexchange contract to insure converting the local currency into the foreign currency of orig-inal denomination at a specified future date. Thus, arbi loans allow MNCs to borrow in onemarket for use in another market and to avoid foreign-exchange risks. The cost of arbi loansincludes the interest on the loans and the charges associated with the forward exchange con-tract.
• Link financing is an arrangement whereby banks in strong-currency countries help sub-sidiaries in weak-currency countries obtain loans by guaranteeing repayment on the loans.These subsidiaries borrow money from local banks or firms with an excess of weak money.Certainly, banks in strong-currency countries require some sort of deposits from a borrower’sparent company and the borrower must pay local interest rates. To protect itself againstforeign-exchange risk, the lender usually hedges its position in the forward exchange market.
14.2.2 Interest rates on bank loans
Interest rates on most business loans are determined through direct negotiations between the bor-rower and the bank. The prevailing prime lending rate and the creditworthiness of the borrowerare the two major factors of the interest rate charged. The prime rate is the rate of interest chargedon short-term business loans to the most creditworthy customers.
Interest rates may be paid on either a collect basis or on a discount basis. On a collect basis,interest is paid at the maturity of the loan, which makes the effective rate of interest equal to thesatiated rate of interest. On a discount basis, interest is paid in advance, which increases the effec-tive rate of interest. Most short-term securities, such as Treasury bills, euro commercial papers,and bankers’ acceptances, are sold on a discount basis.
EXTERNAL SOURCES OF FUNDS 351
Example 14.1
Assume that a company borrows $10,000 at 10 percent. Compute the effective rate ofinterest for the loan on a collect basis as well as on a discount basis.
The effective rate of interest on a collect basis is:
The effective rate of interest on a discount basis is:
$ ,$ , $ ,
. %1 000
10 000 1 00011 11
-=
$ ,$ ,
%1 000
10 00010=
CURRENCY MOVEMENT AND INTEREST RATES In reality, the value of the currency borrowedwill change with respect to the borrower’s local currency over time. The actual cost of a bankcredit by the borrower depends on the interest rate charged by the bank and the movement inthe borrowed currency’s value over the life of the loan. Thus, the effective interest rate may differfrom the interest rate that we computed in examples 14.1 and 14.2. In this case, the effectiveinterest rate is computed as follows:
(14.1)
where r is the effective interest rate in US dollar terms, if is the interest rate of the foreign cur-rency, and ie is the percentage change in the foreign currency against the US dollar.
r i if e= +( ) +( ) -1 1 1
352 FINANCING FOREIGN INVESTMENT
Example 14.2
Assume that a company borrows $20,000 at 10 percent. Calculate the effective interestcost if the loan requires a minimum compensating balance of 20 percent ($4,000) and it ison a discount basis.
The effective interest cost of the loan is:
$ ,$ , $ , $ ,
. %2 000
20 000 4 000 2 00014 29
- -=
COMPENSATING BALANCES Banks typically require their customers to hold from 10 to 20percent of their outstanding loan balance on deposit in a noninterest-bearing account. Thesecompensating balances are used to: (1) cover the cost of accounts; (2) increase the liquidityposition of the borrower that can be used to pay off the loan in case of default; and (3) increasethe effective cost of borrowing.
Example 14.3
A US company borrows Swiss francs for 1 year at 10 percent. The franc appreciates from$0.50 to $0.60, or 20 percent, over the life of the loan. Interest on this loan is paid at matu-rity. The effective interest rate of the loan in US dollar terms is:
r = +( ) +( ) -=
1 0 10 1 0 20 1
32
. .
%

14.2.3 Edge Act and agreement corporations
Edge Act and agreement corporations are subsidiaries of American banks that are physicallylocated in the United States, but they engage in international banking operations. The Edge Actof 1919 allows American banks to perform as holding companies and to own stock of foreignbanks. Thus, these banks can provide loans and other banking services for American-owned com-panies in most countries around the world. Edge Act corporations are domestic subsidiaries ofbanking organizations chartered by the Federal Reserve Board; agreement corporations are EdgeAct equivalents chartered by individual states. Both types of subsidiaries may not only performinternational banking operations, but they may also finance foreign industrial projects throughlong-term loans or equity participation.
TYPES OF ACTIVITIES Edge Act and agreement corporations typically engage in three types ofactivities: international banking, international financing, and holding companies. In their capac-ity as international banking corporations, Edge Act and agreement corporations may holddemand and time deposits of foreign parties. They can make loans, but these loans to any singleborrower cannot exceed 10 percent of their capital and surplus. They can also open or confirmletters of credit, make loans or advances to finance foreign trade, create bankers’ acceptances,receive items for collection, remit funds abroad, buy or sell securities, issue certain guarantees,and engage in foreign-exchange transactions.
In their capacity as international financing corporations, Edge Act and agreement corpora-tions invest in the stock of nonbank financial concerns, development corporations, or commer-cial and industrial companies. Certainly, such investments require the prior specific consent ofthe Federal Reserve Board or state banking authorities under certain circumstances. Edge Actsubsidiaries have financed some foreign finance companies and official development corporations.In most cases, however, they finance commercial and industrial companies directly through loans
EXTERNAL SOURCES OF FUNDS 353
Example 14.4
A US company borrows British pounds for 1 year at 10 percent. The pound depreciatesfrom $1.50 to $1.20, or 20 percent, over the life of the loan. Interest on this loan is paidat maturity. The effective interest rate of the loan in US dollar terms is:
A negative effective interest rate implies that the US borrower actually paid fewer dollarsin total loan repayment than the number of dollars borrowed. Such a result can arise if theBritish pound depreciates substantially over the life of the loan. As shown in example 14.3,however, the effective interest rate in dollar terms can be much higher than the quotedinterest rate if the British pound appreciates substantially over the life of the loan.
r = +( ) -( ) -= -
1 0 10 1 0 20 1
12
. .
%

and equity contributions. The major purpose of such financing activities is to provide promis-ing foreign companies with capital at an early or important stage.
In their capacity as holding companies, Edge Act and agreement corporations can own sharesof foreign banking subsidiaries and affiliates. Member banks of the Federal Reserve System arenot permitted to own shares of foreign banking subsidiaries. A foreign banking subsidiary maybe more advantageous than a branch for two reasons. First, foreign branches are allowed to carryon only the activities allowed to their parent banks in the USA. Second, certain countries do notpermit nondomestic banks to open branches in their territory. In other instances, Edge Act andagreement corporations have been the instrument through which US banks have acquired equityinterests in well-known foreign banks.
14.2.4 International banking facilities
Since December 3, 1981, banks in the USA have been allowed to establish international bankingfacilities at their offices in the USA. International banking facilities (IBFs) are vehicles thatenable bank offices in the USA to accept time deposits in either dollars or foreign currency fromforeign customers, free of reserve requirements and of other limitations. Foreigners can alsoborrow funds from IBFs to finance their foreign investment projects. IBFs have been furtherstrengthened by legislation in New York, California, and other states that exempt them from stateand local income taxes. IBFs are located in the USA, but in many respects they function likeforeign branch offices of US banks. In other words, the creation of IBFs means the establish-ment of offshore banking facilities in the USA similar to other Eurocurrency market centers.
In order to qualify for IBFs, institutions must be depository institutions, Edge Act or agree-ment corporations, or US branch offices of foreign banks that are legally authorized to do busi-ness in the USA. These institutions do not require the approval of the Federal Reserve Board toestablish IBFs; a simple notification is sufficient. In addition, they are not required to establisha separate organizational structure for IBFs, but they must maintain separate books that distin-guish their offshore business from their domestic business.
IBFs have a number of advantages over bank operations through foreign locations. First, smallbanks can enter into the Eurocurrency market easily, because they no longer need to establish aforeign office or a domestic subsidiary exclusively for international banking operations. Second,US banks can reduce operating costs, because they have more direct control and can use exist-ing support services such as personnel and facilities.
IBFs also have several disadvantages when we compare them to offshore banking centers,caused mostly by regulations that IBFs serve only nonresidents. First, IBFs must receive writtenacknowledgment from their customers that deposits do not support activities within the USAand that IBF loans finance only operations outside the USA. Second, IBFs are prohibited fromoffering demand deposits or transaction accounts that could possibly substitute for such accountsnow held by nonresidents in US banks. Third, IBFs are also prevented from issuing negotiablecertificates of deposits or bankers’ acceptances, although they can issue letters of credit and under-take repurchase agreements. Fourth, time deposits offered to nonbank foreign residents requireminimum deposits and the withdrawal of $100,000 to preserve the wholesale nature of the busi-ness; they also require a minimum maturity or two business days’ notification prior to with-drawal.
354 FINANCING FOREIGN INVESTMENT

14.2.5 Strategic alliances
In a trend that accelerated during the 1980s, companies have begun to link up with former com-petitors in a vast array of strategic alliances. A strategic alliance is any collaborative agreementbetween two companies that is designed to attain some strategic goal. International licensingagreements, marketing arrangements or management contracts, and joint ventures are someexamples of strategic alliances. Most strategic alliances, however, are equity alliances or joint ven-tures.
Partners of strategic alliances might gain economies of scale or a variety of other commercialadvantages. However, financial synergy, where a financially strong company helps a financiallyweak company, represents a key advantage of strategic alliances. The strategic alliance betweenKLM and Northwest Airlines represents an excellent example of financial synergy.
An international licensing agreement is an agreement whereby an MNC (the licensor) allowsa local firm (the licensee) to produce the licensor’s products in the firm’s local markets in returnfor royalties, fees, and other forms of compensation. The licensor’s products are intangible assetssuch as patents, trademarks, intellectual property, and technological expertise. The local licenseeassumes the responsibility to produce, market, or distribute the licensor’s products in the localmarket.
When a strategic alliance takes the form of a management contract, one party (an MNC) con-tractually agrees to manage an enterprise owned by another party (local investors). As an example,look at what the government of Zaire did when it expropriated foreign-owned copper mines in1966. Because the government lacked the skills to operate the mines itself, it entered into a con-tract with the former Belgian mine owner, Union Miniere, to manage the production and mar-keting of the mines.
JOINT VENTURES A corporate entity in which two or more parties, for example, an MNC andhost-country companies, have equity interest is known as a joint venture. In the past, the useof a wholly owned subsidiary was the most common approach to overseas investment, becauseworldwide strategy depended on complete control over all foreign operations. However, moreand more host countries require that MNCs have some local participation. In some situations,MNCs will seek local partners even when there are no local requirements to do so.
There are four types of international joint ventures. First, two companies from the samecountry form a joint venture to conduct a business in a third country. For example, Exxon andMobile established an oil company in Russia. Second, an MNC forms a joint venture with host-country companies. For instance, Sears Roebuck (the USA) and Simpsons (Canada) formed ajoint venture in Canada. Third, an MNC and a local government form a joint venture. Forexample, Philips (the Netherlands) and the Indonesian government set up a joint venture inIndonesia. Fourth, companies from two or more countries establish venture in a third country.For instance, Diamond Shamrock (the USA) and Sol Petroleo (Argentina) established a jointventure in Bolivia.
Many factors may induce MNCs to enter into joint ventures with local partners, other MNCs,and local governments. These factors include tax benefits, local marketing expertise, more capital,less political risk, and quick acquisition of new technologies.
On the other hand, MNCs want tight control of their foreign subsidiaries to efficiently allo-cate investments and to maintain a coordinated marketing plan on a global basis. Dividend policy,
EXTERNAL SOURCES OF FUNDS 355

financial disclosure, transfer pricing, establishment of royalty and other fees, and allocation ofproduction and marketing costs among plants are just some areas in which each owner has anincentive to engage in activities that could hurt its partners. This is why most MNCs resist localparticipation. In fact, there are many cases in which MNCs have chosen to pull out of foreigncountries rather than to comply with government regulations that require joint ventures withlocal partners.
MOTIVES FOR STRATEGIC ALLIANCES Motives for strategic alliances may consist of two broadtypes: general and specific to international business. General motives for strategic alliances areto: (1) spread and reduce costs; (2) avoid or counter competition; (3) secure horizontal and ver-tical links; (4) specialize in a number of selected products, assets, or technologies; and (5) learnfrom other companies.
MNCs may collaborate with other companies to: (1) gain location-specific assets; (2) over-come legal constraints; (3) diversify geographically; and (4) minimize exposure in risky environ-ments. First, MNCs may seek to form a strategic alliance with local companies that will helpthem manage location-specific problems, such as cultural, political, and economic differences.Second, strategic alliances may help MNCs overcome governmental constraints. Many countrieslimit foreign ownership. Government procurement, particularly military procurement, is anotherreason that may force MNCs to collaborate. Third, geographical diversification through strate-gic alliances enables MNCs to smooth their sales and earnings, because business cycles occur atdifferent times within different countries. Finally, one way for MNCs to minimize loss fromforeign political occurrences is to minimize the base of assets located abroad or share them withlocal companies.
14.2.6 Project finance
Project finance refers to an arrangement whereby a project sponsor finances a long-term capitalproject on a nonrecourse basis. The term “nonrecourse” is used here to mean that the projectsponsor has legal and financial responsibilities for the project. Three characteristics distinguishproject finance from other forms of financing (Butler 2000):
1 The project is established as an individual legal entity and relies heavily on debt financing.2 The debt repayment is contractually tied to the cash flow generated by the project.3 Government participation comes in the form of infrastructure support, operating or financ-
ing guarantees, or assurances against political risk.
Project finance offers several benefits over conventional debt financing. Project finance normallyrestricts the usage of the project’s cash flows. The lenders, rather than the managers, can decidewhether to reinvest excess cash flows or to use them to reduce the loan balance by more than theminimum required. Second, project finance increases the number and type of investment oppor-tunities, thereby making capital markets more “complete.” Third, project finance permits com-panies whose earnings are below the minimum requirements, specified in their existing bondindentures, to obtain additional debt financing.
In recent years, many large projects, such as the Alaska oil pipeline, the Channel Tunnelbetween England and France, and the EuroDisney theme park outside Paris, have been funded
356 FINANCING FOREIGN INVESTMENT

by project finance. Project finance is either a build–operate–own contract (BOO) or abuild–operate–transfer (BOT) project. In a BOO contract, the sponsor assumes ownership ofthe project at the end of the contract life. In a BOT project, ownership of the project is trans-ferred to the host government. Project finance is widely used today in China, India, Turkey, andmany other emerging markets.
TURKEY’S BOT PROJECTS In early 1996, Turkey’s BOT schemes yielded two large-scale dealsfor a hydroelectric power plant and a drinking water supply system; the total cost of these twoprojects was $2.5 billion (Euromoney 1996). According to Aydin Karzoz, head of the treasury’sforeign relations department, Turkey had a total of 30 BOT projects under consideration by April1996. The government promises to buy BOT services and products at a certain price over a spec-ified period. Under current legislation, this specified period cannot exceed 49 years.
The BOT model has been used to finance many infrastructure projects: airports, bridges, high-ways, oil and gas pipelines, petrochemical refineries, power generation projects, tunnels, andwaterworks. The potential is enormous. A recent report prepared by the World Bank estimatesthat Asia must spend $1.5 trillion on all forms of infrastructure over the next decade or forfeithigh economic growth. The report says that Latin America must spend $800 billion over thesame period.
International capital markets, such as bank loans, bonds, and equity offerings, contribute asubstantial amount to infrastructure project finance – about $30 billion a year. The World Bankpredicts that the fast growth of the market for infrastructure finance in the 1990s is likely to con-tinue for many years to come. First, governments want to give their clients efficient, high-gradeservices without using tax money. Developing countries have the potential for increased accessto international capital markets.
14.3 Development Banks
Development banks provide MNCs with a broad range of financing resources. They are bankingorganizations established to support the economic development of underdeveloped areas throughintermediate and long-term loans. There are three broad groups of development banks: world-wide, regional, and national.
14.3.1 The World Bank Group
The World Bank Group is a group of worldwide financial institutions organized after the dev-astation of World War II to aid economic reconstruction. These institutions include the Inter-national Bank for Reconstruction and Development, the International Finance Corporation, andthe International Development Association.
THE INTERNATIONAL BANK FOR RECONSTRUCTION AND DEVELOPMENT (IBRD) The bank,which is commonly known as the World Bank, was established at the Bretton Woods conferencein 1944 as a companion institution to the International Monetary Fund. Because the major objec-tive of the World Bank was to finance reconstruction and development after World War II, itmade certain loans in Europe for reconstruction. It found its resources completely inadequate
DEVELOPMENT BANKS 357

for this purpose and thus stopped reconstruction loans. However, the World Bank was able toconcentrate on lending for economic development, because the Marshall Plan provided fundsfor reconstruction in Europe. The Marshall Plan was the European economic recovery programestablished by the USA in 1948. The overriding objective of the Plan was to restore the pro-ductive capacity of European industry destroyed during World War II. The Plan existed slightlyless than 4 years and channeled more than $10 billion in American aid to Europe.
In recent decades, the World Bank has placed a major emphasis on loans to underdevelopedcountries for social infrastructure projects such as irrigation, schools, and roads. This kind ofdevelopment is essential for future industrialization. Approximately a third of its developmentloans has gone to electrical power, a third for transportation improvements, and the remainingthird for agricultural projects and education. Loans are made only to member governments, gov-ernment agencies, and private businesses whose loans are guaranteed by their governments.
Because the Bank finances only a portion of project costs, private investors must finance theremaining portion. To encourage the direct participation of private investors in its loans, theBank has adopted high credit standards:
1 The Bank makes loans only for projects whose cost and revenue estimates are reasonablyaccurate.
2 When loans are made to private companies, these loans must be guaranteed by their gov-ernments.
3 An additional 1 percent is added to the regular interest rate. These funds go into reservefunds to meet losses in the event of default.
4 Member countries are required to pay the unpaid portion of their quotas in the event thatfunds are needed to meet losses.
Private funds for international investments have increased because the Bank has applied thesehigh standards.
The capital subscribed by member countries represents the basic equity capital for the Bank.Member countries are assigned subscription quotas on the basis of their size and wealth. Theymust pay 10 percent of their quota when they join the Bank, and the remaining 90 percent ofthe quota is subject to call. However, a substantial portion of the Bank’s capital comes from bondssold on world markets. Because the Bank applies high credit standards, its bonds usually carryhigh credit ratings and low interest rates.
The newly established Multilateral Investment Guarantee Agency of the Bank offers variousforms of political risk insurance. As one of the largest borrowers in the world, the Bank bor-rowed a total of $100 billion from 100 countries. Its loans are well diversified among more than20 countries. The Bank enjoys the highest credit rating, AAA.
THE INTERNATIONAL FINANCE CORPORATION (IFC) Initially, the World Bank had a numberof problems in providing financial assistance to less developed countries. First, all loans had tobe guaranteed by governments. Second, the Bank provided only loans. Third, it financed onlythe foreign-exchange requirements for a project and ignored local expenditures or working capitalrequirements. Fourth, it typically financed only large projects of public importance.
These problems led to the development of the International Finance Corporation (IFC) in1956, primarily to finance private enterprises in less developed countries through loan or equityparticipation.
358 FINANCING FOREIGN INVESTMENT

The IFC regards development finance companies and industrial projects as the proper outletsfor its limited capital. It assists in establishing development finance companies in areas wherethere are gaps in the local capital and money markets. It also helps existing development financecompanies to expand or reorganize operations. The IFC usually invests in those industrial pro-jects that will contribute to improved foreign-exchange positions, increased employment,improved management skills, or the exploration of natural resources. It provides risk capital tocompanies that require funds in order to expand, modernize, or diversify operations. It also helpsto finance new ventures. Ordinarily, it does not invest in such infrastructure projects as hospi-tals, transportation, and agricultural development.
IFC funds are available for either foreign-exchange or local-currency expenditures to meetfixed assets or working capital requirements. It makes nonguaranteed loans to private enterprisesin less developed countries. Most of these loans have maturities from 7 years to 12 years. All ofits investments are made along with private investors, and its financial contribution usuallyaccounts for less than 50 percent of the total project cost.
THE INTERNATIONAL DEVELOPMENT ASSOCIATION (IDA) The association was establishedin 1960 as an affiliate of the World Bank Group to meet the specific needs of less developedcountries. IDA loans are designed to finance projects for companies that cannot adhere to loanrepayment schedules with conventional terms. Credit terms are generally extended for 50 years,with very low or no interest. Repayment begins after a 10-year grace period and can be made inlocal currencies.
All World Bank members are free to join the IDA, and more than 100 countries have doneso. IDA resources are separate from World Bank resources. Nearly 90 percent of the IDA’s capitalcomes from subscriptions of its member countries. The second most important source of itscapital is the World Bank’s contribution. IDA member countries are classified into two broadcategories: part I countries, which consist of relatively developed countries; and part II countries,which consist of less developed countries. Part I countries pay all of their subscriptions in con-vertible currencies, while part II countries pay only 10 percent of their subscriptions in con-vertible currencies and the remainder in their own currencies. Certain nonmember countries suchas Switzerland and New Zealand have made loans to the IDA on the same terms as the IDAlends to its members.
14.3.2 Regional development banks
Regional groups of countries have established regional development banks to promote effectiveeconomic development within the member countries. Leading regional development banks arethe Inter-American Development Bank, the European Investment Bank, the European Bank forReconstruction and Development, the Asian Development Bank, and the African DevelopmentBank.
THE INTER-AMERICAN DEVELOPMENT BANK (IDB) The bank was founded in 1959 by theUSA and 19 Latin American countries, to further the economic development of its member coun-tries. Twenty-six Latin American countries and 15 other countries now own the Bank, which isheadquartered in Washington, DC. IDB loans are available only when private sources are not avail-able on reasonable terms. The IDB usually finances no more than 50 percent of total project cost.
DEVELOPMENT BANKS 359

The IDB has three types of activity:
1 With its Ordinary Capital Resources Fund, the Bank makes development loans to both publicand private institutions. These loans are earmarked for projects that promote Latin America’seconomic development.
2 With its US-created Social Progress Trust Fund, the Bank makes loans to finance projectswith high social value.
3 With its Fund for Special Operations, the Bank makes loans whose terms are much morelenient than those available in the regular money and capital markets. Maturities may beextremely long, repayment may be made in the borrower’s currency, or interest rates may bearbitrarily low.
THE EUROPEAN BANK FOR RECONSTRUCTION AND DEVELOPMENT (EBRD) The bank wasestablished in 1990 by 42 countries, as a development bank for emerging democracies in EasternEurope. These 42 member countries include the USA, Japan, Russia, and European countries.The London-based EBRD encourages reconstruction and development in the Eastern andCentral European countries through loans, guarantees, and equity investments in private andpublic companies. No more than 40 percent of EBRD financing can be used to support gov-ernment enterprises.
The United States, with a 10 percent share, is the largest single shareholder. The UnitedKingdom, France, Italy, Japan, and Germany each have shares of 8.52 percent. Russia, with a 6percent share in the bank, is the largest single shareholder among former Eastern-bloc countries.All together, European countries hold a major stake in the bank. Share contributions may bemade in dollars, euros, or yen. All of the shareholders paid in only 30 percent of their capitalcontributions; the rest of their capital is callable.
THE EUROPEAN INVESTMENT BANK (EIB) The bank was established in 1958 by members ofthe European Community. Its resources are used to support the socioeconomic infrastructure ofthe member nations or their basic industries. Most of these loans have maturities from 12 to 20years. Ordinarily, 3- or 4-year intervals are established before loan repayments begin.
The EIB has three types of responsibility:
1 It assists in financing projects that involve two or more member governments. In this case,it plays an important role in coordinating the activities of different national financial agen-cies.
2 It promotes the potential of economies of scale. It helps specialize or expand the operationsof plants or firms in countries with a comparative advantage in certain lines of business.
3 It helps achieve a more uniform and high level of economic maturity within the EuropeanUnion.
THE ASIAN DEVELOPMENT BANK (ADB) The bank was formed in 1966 by 17 Asian coun-tries, in partnership with the USA, Canada, the UK, Germany, and other European countries.The ADB has its headquarters in Manila and has 47 members; 17 are from outside the region.The Bank’s founders created the ADB to promote the economic growth and development of itsmember countries. The ADB accomplishes its goals by offering loans, grants, and technical assis-tance. The ADB makes long-term loans to private companies without government guarantees.Some ADB loans go to Asian national banks that reloan to private enterprises through their
360 FINANCING FOREIGN INVESTMENT
respective development agencies. Some other ADB loans are used to supply risk capital. Onlymember countries, and occasionally, private enterprises, can borrow from the Bank.
THE AFRICAN DEVELOPMENT BANK (AfDB) The bank was established in 1964 by the Orga-nization of African Unity, with headquarters in Abidjan, Ivory Coast. Unlike other regional devel-opment banks, the AfDB had, until the early 1980s, excluded nonregional partners in an effort toavoid undue outside influence; thus, it suffered from severe capital limitations, hampering itsability to lend. Since the early 1980s, the AfDB has accepted non-African countries as contribut-ing but nonborrowing members. Members include 50 African nations and 26 non-African coun-tries that have joined since 1982. AfDB activities are financed by member subscriptions, one-thirdof which are from non-African countries. In order to attract commercial bank funds and publicdebt offerings, the AfDB maintains conservative lending policies and interest rates. Loans are madeonly to governments or their agencies. Interest rates are similar to commercial rates.
14.3.3 National development banks
Many governments in industrial countries have their own development banks to foster interna-tional loans and investments. The three leading institutions of the USA are the Export–ImportBank, the Agency for International Development, and the Overseas Private Investment Corpo-ration.
THE EXPORT–IMPORT BANK (EX–IM BANK) The Ex–Im Bank provides investment funds toMNCs. These funds include long-term direct financing to facilitate the purchase of US goodsand services used in industrial projects in foreign countries. In this type of long-term directfinancing, the Ex–Im Bank expects substantial equity participation by the borrower. Moreover,it provides US companies with guarantees on their engineering and feasibility studies, as well ason their technical and construction services, performed abroad. In summary, the Ex–Im Bank isa key source of financing overseas projects when private sources are not available. These projectsmust be economically justifiable, contribute to the economic development of the country, andimprove the country’s foreign-exchange position.
THE AGENCY FOR INTERNATIONAL DEVELOPMENT (AID) The agency was established in1961 to carry out nonmilitary US foreign-assistance programs. As an agency of the US StateDepartment, AID emphasizes assistance to friendly governments or to support programs thatwill make foreign friends for the USA. As the primary aid agency of the US government, it per-forms three functions:
1 It administers the government’s programs of technical cooperation with less developed coun-tries.
2 It administers the government’s economic programs for less developed countries.3 It carries out special emergency programs as directed by the US President.
Development loans are made to friendly governments, and private companies may borrow thesefunds from their governments. To prevent a heavy drain of US dollars, loans are usually tied topurchases of US goods and services. Moreover, these funds are generally maintained in the USAand are simply made available for use by recipient countries. All development loans are repayable
DEVELOPMENT BANKS 361

in dollars and can have a maximum maturity of 50 years, with a grace period of 10 years. Inmaking development loans, AID considers the availability of funds at reasonable terms from otherfree-world sources. Interest rates are usually lower than international money rates.
THE OVERSEAS PRIVATE INVESTMENT CORPORATION (OPIC) The corporation was estab-lished in 1969 to take over AID’s responsibility for investment insurance and guarantee pro-grams. The OPIC became operational in 1971 and is wholly owned by the US TreasuryDepartment. It operates two programs: insurance of US private investments in less developedcountries and project financing. More specifically, its insurance programs cover losses from polit-ical risks of currency inconvertibility, expropriation, and land-based war to US companies thatmake investments in friendly developing countries. Its project financing is carried out throughan investment guarantee program. This program provides guarantees against losses from com-mercial and political risks, direct investment funds in dollars or foreign currencies, and a pre-investment survey program.
The OPIC combines private business with the US foreign-policy objective of encouragingAmerican firms to invest in less developed countries. Thus, it grants insurance and guaranteesfor projects which are in the best interest of both the USA’s and the host country’s economy.
362 FINANCING FOREIGN INVESTMENT
SUMMARY
For purposes of expansion, new investment, and day-to-day operations, the international financialmanager must be familiar with various sources of internal or external funds. This chapter has dis-cussed three types of internally generated funds: (1) retained earnings and depreciation providedby operations; (2) equity contributions, loans, and credits from the parent company; and (3) loansfrom sister subsidiaries.
External sources of funds include borrowing from financial institutions in a parent country orabroad, joint ventures with local partners, project finance, and development banks. Commercialbanks are a major financial intermediary in foreign trade and investment. The upsurge of directforeign investment by MNCs since the early 1950s has forced banks to follow their customersoverseas. The principal instruments used by banks to accommodate MNCs’ borrowing requestsare overdrafts, unsecured short-term loans, bridge loans, arbi loans, and link financing.
Development banks provide MNCs with a variety of financing sources. They are banks estab-lished to aid in economic development through equity participation, loans, or some intermediateform of investment. They may be worldwide, regional, or national. The World Bank Group con-sists of the International Bank for Reconstruction and Development, the International Develop-ment Association, and the International Finance Corporation. These worldwide developmentbanks are designed to provide financial support for less developed countries. Regional groups ofcountries have established regional development banks to promote more effective economic devel-opment within the member countries. Five regional lending institutions formed to facilitate devel-opment on four continents are the Inter-American Development Bank, the Asian DevelopmentBank, the European Investment Bank, the European Bank for Reconstruction and Development,and the African Development Bank. National development banks perform the same general func-tions as worldwide and regional development banks.

PROBLEMS 363
Questions
1 What are the major types of funds supplied by the parent company to its subsidiaries?2 Why are parent loans to foreign subsidiaries more popular than equity contributions?3 What are the internal sources of funds provided by operations? What is the role of inter-
nal funds?4 List the types of loans that local banks provide to foreign subsidiaries for nontrade inter-
national operations. Are these local credits used to finance current assets or fixed assets?Why are these loans sometimes called self-liquidating loans?
5 What are the similarities and differences between Edge Act and agreement corporationsand international banking facilities?
6 What are the advantages and disadvantages of joint ventures?7 George Cassidy has suggested several guidelines that can be used to determine an
optimum financing mix of debt and equity for overseas projects. Explain these guidelines.8 What is the role of development banks? How can multinational companies benefit from
these development banks?9 Describe the role of the European Bank for Reconstruction and Development (EBRD).
Problems
1 There are three alternatives to increase a net working capital of $10,000:(a) Forgo cash discounts with the terms of 2/10, net 40.(b) Borrow the money at 7 percent from the bank. This bank loan requires a minimum
compensating balance of 20 percent and interest on the loan is paid at maturity.(c) Sell commercial paper at 8 percent. The underwriting fees of the issue are 2 percent
of the face value.Calculate the effective annual cost of each of the above alternatives.
(d) Which alternative should be chosen and why?2 A $10,000 bank loan has a coupon rate of 10 percent.
(a) Calculate the effective interest cost if the loan is on a discount basis.(b) Calculate the effective interest cost if the loan requires a minimum compensating
balance of 20 percent and it is on a discount basis.(c) Calculate the effective interest cost if the loan requires a 25 percent compensating
balance but it is on a collect basis.

364 FINANCING FOREIGN INVESTMENT
3 A US company borrows Japanese yen for 1 year at 5 percent. During the year, the yenappreciates from $0.010 to $0.012 against the US dollar.(a) Determine the percentage appreciation of the yen.(b) Compute the effective interest rate of the loan in dollar terms.
4 A Mexican subsidiary of a US company needs a peso (local) loan. The Mexican loan rateis 15 percent per year, while a foreign loan rate is 7 percent per year. By how much mustthe foreign currency appreciate to make the cost of the foreign loan equal to that of thelocal loan?
5 A US company is considering three financing plans for 1 year: a dollar loan at 6 percent;a Swiss franc loan at 3 percent; and a euro loan at 4 percent. The company has fore-casted that the franc will appreciate by 2 percent for the next year and that the euro willappreciate by 3 percent for the same period.(a) Compute the expected effective interest rate for each of the three plans.(b) Which plan appears to be most feasible?(c) Why might the company not necessarily choose the plan with the least interest rate?
REFERENCES
Butler, K. C., Multinational Finance, Cincinnati,OH: South-West Publishing, 2000, pp. 428–30.
Cassidy, G. T., “Financing Foreign Investments: TheInternational Capital Markets,” in Allen Sweenyand Robert Rachlin, eds., Handbook for Interna-tional Financial Management, New York:McGraw-Hill, 1984, pp. 1–11.
Chrystal, A. K., “International Banking Facilities,”Bulletin, Federal Reserve Bank of St. Louis, Apr.1984, pp. 5–11.
Geringer, J. M. and L. Hebert, “Control and Per-formance of International Joint Ventures,”
Journal of International Business Studies, Summer1989, pp. 211–34.
O’Reilly, A. J., “Establishing Successful Joint Ven-tures in Developing Nations: A CEO’s Perspec-tive,” Columbia Journal of World Business, Spring1988, pp. 65–72.
Organization for Economic Cooperation andDevelopment, Financial Markets, Mar. 2003.
“The Public and Private Method of ProjectFinance,” Euromoney, Apr. 1996, pp. 173–4.
“World Business,” The Wall Street Journal, Sept. 22,2003, pp. R1–R12.
Case Problem 14: IBM’s Strategic Alliances
IBM is the world’s largest computer company, with 300,000 employees and annual sales of$90 billion. IBM is the company that had almost collapsed in the early 1990s. However, itscomeback has been remarkable because of the strategic alliances and other actions taken bythe company. IBM earned $7.7 billion in 1999, $4 per share. Its stock price increased from$45 per share in 1991 to $200 in 1999 ($100 after a two-for-one split in mid-1997). Morethan 60 percent of worldwide sales come from foreign operations. IBM has two fundamen-

CASE PROBLEM 14 365
tal missions: First, it strives to lead in the creation, development, and manufacture of theindustry’s advanced information technologies, including computer systems, software, net-working systems, storage devices, and electronics. Second, it translates these advanced tech-nologies into value for its customers through professional solutions for businesses worldwide.To achieve these two missions, IBM has relied heavily on a variety of strategic alliances, alongwith mergers and acquisitions of other firms. In addition, IBM has not hesitated to sell somenone-core and/or unprofitable businesses. For example, IBM sold its Global Network busi-ness to AT&T for $5 billion in 1999.
The rush of new technology, the expense of staying on the leading edge, the demands ofcustomers, and worldwide competition have required IBM and other high-tech companies toform a wide range of alliances and partnerships. The costs of developing the 256-million-bitmemory chip (in a three-way pact with Siemens and Toshiba) have exceeded a billion dollars.Take the IBM PC as another example. Only about half of the machine and its componentscome from the company’s plants. The rest – including the monochrome monitor, the key-board, some graphics printers, and a large share of the semiconductor chips – come from itspartners in Japan, Singapore, and Korea. With these stakes, sharing costs, risk, and knowl-edge is essential.
In a decade, IBM has moved from a do-it-all-yourself, inwardly directed company to anenterprise that reaches out for new ideas and approaches that intertwine with its own talentsand strengths. Today, IBM has more than 20,000 business partnerships worldwide and morethan 500 equity alliances with agents, dealers, distributors, software firms, service compa-nies, and manufacturers.
The quest to satisfy customers has blurred traditional competitive boundaries. Apple Com-puter is IBM’s partner in Taligent to develop object-oriented software and in Kaleida to createmultimedia standards. Hewlett-Packard and IBM have developed and manufactured high-speed fiber-optic communications components. Wang and Mitsubishi sell IBM systems undertheir logos, and Digital Equipment is a partner in offering business recovery services. In March1999, IBM agreed to sell Dell Computer Corp. $16 billion in parts over 7 years. This latestdeal underscores IBM’s new strategic focus on selling high-tech components on the openmarket, rather than just using them inside IBM computers.
This strategy has been advanced by IBM’s CEO, Gerstner, who sees it as another way toderive profits from IBM’s technology prowess and to keep the company competitive. Alliancesnot only divide high development and production costs, but also reduce critical time-to-market, pool scarce human skills, provide access to new markets and distribution channels,and fill product gaps.
Case Questions
1 What are the forms of strategic alliances used by IBM?2 Why does a company as big as IBM have to depend on joint ventures so heavily for its
global expansion?

366 FINANCING FOREIGN INVESTMENT
3 How can these international strategic alliances enable IBM to achieve its objective of max-imizing stockholder wealth?
4 What are the motives for strategic alliances in general?5 The home page of IBM, www.ibm.com, covers the company’s news, products, services,
support, annual financial reports, and many other areas of its business operations. Usethis web page to find recent IBM acquisitions and divestitures.
Sources: M. Potts and P. Behr, “Strange Global Bedfellows,” Across The Board, Feb. 1987, pp. 24–30; “IBMWill Sell Dell $16 Billion of Parts,” The Wall Street Journal, Mar. 19, 1999, pp. A3, A10; and IBM AnnualReport, various issues.

Part IV (chapters 15–20) covers the management of assets, or the efficient allocation of fundsamong various assets. This part describes the management of current assets, financial assets,capital budgeting, and political risks associated with foreign investment. The objective of currentasset management is to protect the purchasing power of assets and to maximize the return oninvestment. The management of current assets is extremely important for the multinationalcompany. Thus, the complicating international factors and approaches for resolving them shouldbe analyzed carefully. National capital markets have recently changed to an integrated globalcapital market, oftentimes followed by widespread international multiple listings of securities.Consequently, investors are starting to realize the enormous potential of international portfolioinvestment. As a result, relatively sophisticated techniques exist to analyze how foreign invest-ment decisions are made. Investment decisions affect the value of a company’s stock by influ-encing both the size of the earnings stream and the riskiness of the company. This risk factor inforeign operations takes on a new dimension of importance because it is rarely encountered indomestic business operations.
PART IV
Global Investment Strategy


Opening Case 15: An Efficient Global Treasury Structure
GeoLogistics Corp. was formed in February 1996 as a global provider of logistics andtransportation services for manufacturers and distributors in technology, communica-tions, and aerospace. The company executed five major acquisitions within 30 monthsand its 1999 sales reached $1.5 billion, 50 percent of which came from outside NorthAmerica. The company is now a global organization with operations in 32 countriesaround the world. As the company expands its network through acquisitions, the needfor greater control over international treasury operations becomes obvious. With morethan 80 banks serving 30 countries in Europe and Asia, it is a challenge for thecompany to find workable solutions that meet its needs and budgets.
GeoLogistics decided to establish an efficient global treasury structure that wouldreduce debt, improve settlement practices, and increase the efficiency of cash man-agement. The company selected ABN AMRO Bank of Ireland as its sole treasury-service provider. Ireland was attractive because of favorable tax environments andagency or outsourcing capabilities, which meet GeoLogistics’ needs. The Dublin Inter-national Financial Service Center (IFSC) was established by the Irish government in1987 to provide licenses to financial institutions, which offer treasury agency servicesto foreign companies. ABN had an established IFSC agency capability, an internationalnetwork, and the treasury outsourcing expertise to achieve the company’s objectives.
GeoLogistics’ operational guidelines for ABN outlined policies for investments,lending, funding, foreign exchange, disbursements, and financial reporting. Underthese guidelines, ABN has reduced the company’s idle cash by $20 million per year,with a corresponding reduction in external debt. Specifically, to improve the companytreasury services, ABN centralized all intercompany lending and hedging activity
CHAPTER 15
International WorkingCapital Management

The management of current assets and current liabilities constitutes working capital manage-ment. The efficient allocation of funds among various current assets and the acquisition of short-term funds on favorable terms are conceptually the same for both multinational companies(MNCs) and domestic companies. However, these two types of companies are different becausethey do business in different environments. These differences include the impact of currency fluc-tuations, potential exchange controls, and multiple regulatory and tax jurisdictions on workingcapital decisions. In addition, MNCs enjoy a wide variety of short-term financing and invest-ment opportunities.
Chapters 11–14 discussed various short-term sources of funds in detail. Thus, this chapteremphasizes current asset management, which can be viewed as either a dynamic (flow) processor a static (stock) responsibility. The first part of this chapter – the dynamic approach – focuseson the denomination of liquid funds by currency and the placement of such holdings by country.This flow process places a heavy emphasis on transfers of liquid funds from one geographicallocation or currency to another. The second part – the static approach – focuses on individualprocesses such as the composition of various current assets. The important aspect of this approachis how to determine appropriate levels of cash, accounts receivable, and inventories.
15.1 The Basic Concepts of Working Capital Management
The basic objective of working capital management is to determine the optimal amount of invest-ment in various current asset accounts. This optimal amount of investment in current assets isthe level of current asset holdings that maximizes the overall profitability of a firm. However,there are a variety of economic constraints that make it difficult for MNCs to achieve the objec-tive of working capital management.
15.1.1 The importance of working capital management
Current asset management is important not only because it involves the largest portion of a finan-cial manager’s time, but also because current assets represent more than half the total assets ofmost companies. In addition, there is a close relationship between sales growth and the level ofcurrent assets. For example, increases in credit sales require more accounts receivable and inven-tories. Finally, companies may minimize their investments in fixed assets through leases, but itis practically impossible to avoid an investment in current assets.
Despite the importance of international working capital management, literature on this topicis rather limited for a number of reasons. First, decisions on working capital are relatively routine
370 INTERNATIONAL WORKING CAPITAL MANAGEMENT
through a single IFSC vehicle; established a monthly netting system; designed aneffective euro-based cash pool, and increased control with a simplified structure.
Source : Terry Clark and Tom Maleese, “Achieving an Efficient Global Treasury Structure,”Euromoney, Mar. 2000, pp. 40–2.

and frequent. Second, unlike capital investment decisions, these routine decisions on workingcapital are easily reversible. Third, working capital management requires cash flow projections;however, cash flows cannot be forecasted by the financial manager alone. In other words, thefinancial aspects of a decision are sometimes concealed by marketing (credit policy) and pro-duction (inventory management), which have a major impact on a company’s cash flows.
15.1.2 Net working capital funding
The higher level of sales by an MNC necessitates more accounts receivable and higher inventorylevels. On the liability side, accounts payable are expected to increase with increases in sales.Accounts payable would automatically finance part of sales increases. These three componentsmake up net working capital. It is important to note that we do not include cash and short-termdebt as part of net working capital, because they are not spontaneous.
In principle, MNCs attempt to minimize their net working capital. Aggressive selling tech-niques and more lenient credit terms may immediately lower the time required to convert inven-tories into accounts receivable. Greater cash discounts and tighter collection policies mayconsiderably reduce the time required to convert accounts receivable into cash. All such policychanges require additional costs. Thus, MNCs should reduce the cycle until the marginal revenuegenerated equals the marginal cost; at this point, they maximize their profits.
A common method of benchmarking working capital management practice is to compute thenet working capital of a company on a “days sales” basis. To do this, we must first calculate thefollowing three values: (1) days receivables (accounts receivable divided by the average daily sales);(2) days inventory (inventory divided by the average daily sales); and (3) days payables (accountspayable divided by the average daily sales). By combining these three items, we obtain daysworking capital as follows:
days working capital = days receivables + days inventory – days payables
Table 15.1 shows days working capital for selected US and European technology hardwareand equipment companies. There are a number of clear differences between the two countriesand among individual companies. For example, the days working capital average for the US com-panies is less than half the 75 days for the European sample. Apparently, European companiescarry a considerably higher level of net working capital in their financial structures than US com-panies to support the same level of sales. Among individual companies, Dell is the most aggres-sive working capital manager. For example, Dell’s net working capital level of a negative 2 daysindicates that a level of accounts payable exceeds the sum of accounts receivable and inventory.However, its inventory days of 6 are still three times that of Apple Computer’s 2 days in inventory.
15.1.3 Economic constraints of current asset management
Because MNCs operate across national borders, they face regulatory, tax, foreign exchange, andother economic constraints. To achieve a predetermined objective of current assets, the financialmanager must give special consideration to these constraints.
THE BASIC CONCEPTS OF WORKING CAPITAL MANAGEMENT 371

FOREIGN-EXCHANGE CONSTRAINTS Foreign-exchange constraints are an important limitingfactor on fund flows from one country to another. International fund flows involve foreign-exchange transaction costs and exchange rate fluctuations.
REGULATORY CONSTRAINTS Regulatory constraints can block dividend repatriation or otherforms of fund remittances. This blockage occurs because of restrictions on the international move-ment of funds and other exchange controls.
TAX CONSTRAINTS Tax constraints limit the free flow of affiliate funds to a parent or to sisteraffiliates. These may occur because higher taxes on all corporate earnings or extra taxes on divi-dends may be imposed to curb inflation.
A SUMMARY OF CONSTRAINTS Other economic factors, such as inflation and interest rates,also have an important impact on the international mobility of corporate funds.
There are many elements and issues in international current asset management. Here, weassume that the major tasks of current asset management consist of (1) the ability to transferfunds, (2) the positioning of funds within a multinational firm, (3) arbitrage opportunities, and(4) different channels to move funds.
372 INTERNATIONAL WORKING CAPITAL MANAGEMENT
Table 15.1 Days working capital for selected US and European technology hardware and equip-ment companies
WorkingCompany Country capital Receivables Inventory Payables
Intel Corporation USA 48 47 21 20Cisco Systems USA 54 46 20 12Dell Computer USA -2 41 6 49Texas Instruments USA 34 65 32 63Applied Materials USA 41 82 62 93Apple Computer USA 2 48 2 48Sun MicroSystems USA 68 67 12 21Gateway USA 0 25 8 33
Average USA 29 63 19 42
St Microelectronics Italy 58 65 52 59Nokia Finland 66 72 31 37Phillips Electronics The Netherlands 71 59 51 39GN Store Nord Denmark 100 92 40 32Spirent UK 107 66 63 22Getronics The Netherlands 51 80 20 49Infinecon Tech Germany 75 57 69 51
Average Europe 75 70 47 41
Sources: CFO Magazine, 2001 Working Capital Survey; and CFO Europe Magazine, 2001 Working CapitalSurvey, July/Aug. 2001.

15.1.4 The ability to transfer funds
An MNC has the ability to adjust intracompany fund flows and profits on a global basis. Thisability is one of the most important advantages that MNCs enjoy. Financial transactions withinan MNC stem from the internal transfer of goods, services, technology, and capital. Such intra-company flows range from finished goods to intangible items such as management skills, trade-marks, and patents. Furthermore, capital investments and direct loans give rise to future flowsof dividends, interest, and principal payments. On the other hand, many of the gains achievedthrough intracompany fund flows derive from some questionable business practices. For example,the amount of gains could depend on a company’s ability to take advantage of soft spots in taxlaws and regulatory barriers. Consequently, conflicts between MNCs and their host governmentsare quite likely.
15.1.5 Positioning of funds
Another main task of current asset management is to position working cash balances or excessliquidity within an MNC. The division of funds among various affiliates involves the choice ofcountry and the selection of currency denomination for all liquid funds. In domestic businesses,fund flows among units of a large company confer little or no advantage to the company, becausetax rates and regulations are uniform throughout the country.
The value of intracompany fund flows for MNCs lies precisely in the fact that there are widevariations in national tax systems and regulatory barriers. In other words, many different typesof market imperfections increase the value of internal fund flows among units of an MNC. Thesemarket imperfections include foreign-exchange markets, financial markets, and commoditymarkets.
15.1.6 Arbitrage opportunities
The ability to relocate working cash balances and profits on a global basis provides MNCs withthree different types of arbitrage opportunities: (1) tax arbitrage, (2) financial market arbitrage,and (3) regulatory system arbitrage.
First, MNCs can reduce their overall tax burden by shifting profits from subsidiaries in high-tax countries to subsidiaries in low-tax countries. Second, internal fund transfers may enableMNCs to circumvent exchange controls, earn higher yields on excess funds, and tap domesti-cally unavailable capital sources. Third, if affiliate profits depend on government regulations orunion pressure, MNCs can disguise true profits through transfer pricing and other intracompanyadjustments.
15.1.7 Different channels to move funds
Multinational business operations require a steady flow of funds from parent to subsidiary, fromsubsidiary to parent, and between subsidiaries. Because these fund flows are unique, we will con-sider one at a time.
THE BASIC CONCEPTS OF WORKING CAPITAL MANAGEMENT 373

FUND FLOWS FROM PARENT TO SUBSIDIARY The largest flow of funds from parent to sub-sidiary is the initial investment. The subsidiary may also receive additional funds in the form ofloans or added investments. The purchase of goods from the parent offers another form of fundflows from parent to subsidiary. This form of fund flows involves transfer pricing, the price ongoods sold between related entities.
FUND FLOWS FROM SUBSIDIARY TO PARENT The major components of fund flows from sub-sidiary to parent consist of dividends, interest on loans, principal reduction payments, royaltypayments, license fees, technical service fees, management fees, export commissions, and pay-ments for goods received from the parent. The parent does not have total control over the sizeof the flow of funds because of various external factors, such as foreign-exchange controls andtax constraints. For example, many governments impose a withholding tax when dividends areremitted to foreign owners.
FUND FLOWS FROM SUBSIDIARY TO SUBSIDIARY Funds flow from one subsidiary to anotherwhen they lend funds to each other or buy goods from each other. Funds from one subsidiarymay also be used to establish another subsidiary. When such investments are made, all dividendsand principal payments may go directly to the home office. However, it is possible for these twosubsidiaries to have cash flows similar to parent-company cash flows.
Many factors, such as exchange controls and domestic political pressures, can block dividendrepatriation or other forms of fund remittances. If funds are blocked in perpetuity, the value ofa foreign project to the parent company is zero. However, MNCs have secretive methods toremove blocked funds, including (1) multilateral netting, (2) leading and lagging, (3) transferpricing, (4) reinvoicing centers, (5) intracompany loans, and (6) payment adjustments.
MULTILATERAL NETTING Large MNCs often require a highly coordinated interchange of mate-rial, parts, work-in-process, and finished goods among various units, because they must handlea large volume of intracorporate fund flows. These cross-border fund transfers involve the foreign-exchange spread, the opportunity cost of the float, and other transaction costs such as cablecharges. Netting has been frequently suggested as one method of minimizing the total volumeof interaffiliate fund flows.
Netting is a method designed to reduce the foreign-exchange transaction cost through theconsolidation of accounts payables and accounts receivable. Multilateral netting is an extensionof bilateral netting. For example, if subsidiary A purchases $10 million worth of goods from sub-sidiary B and B in turn buys $11 million worth of parts from A, the combined flows are $21million. On a net basis, however, subsidiary A would pay subsidiary B only $1 million. Bilateralnetting would be useless where internal sales are more complex. Think of a situation in whichsubsidiary A sells $10 million worth of goods to subsidiary B, subsidiary B sells $10 millionworth of goods to subsidiary C, and subsidiary C sells $10 million worth of goods to subsidiaryA. In this case, bilateral netting would be of no use, but multilateral netting would eliminateinteraffiliate fund transfers completely.
374 INTERNATIONAL WORKING CAPITAL MANAGEMENT

An accelerated globalization of production, distribution, and finance during the 1990s hascreated an unusually large volume of intracompany fund flows. By netting intra-affiliate pay-ments, MNCs can realize significant cost savings. It is no wonder that so many MNCs use nettingprocedures to reduce transaction costs. As with all other transfer mechanisms, however, manygovernments impose controls on netting. Certainly, this will limit the degree to which the mul-tilateral netting system can reduce foreign-exchange transfers and transaction costs.
LEADS AND LAGS MNCs can accelerate (lead) or delay (lag) the timing of foreign-currencypayments in order to reduce foreign-exchange exposure or to increase working capital available.
THE BASIC CONCEPTS OF WORKING CAPITAL MANAGEMENT 375
Example 15.1
Table 15.2 shows a more complex multilateral netting system. Without netting, total pay-ments add up to $5,500. If the cost of foreign-exchange transactions and transfer fees were1.5 percent, the total cost of settlement would be $82.50.
Table 15.2 The international payments matrix
Paying subsidiary
Receiving subsidiary USA Japan Germany Canada Total receipts
USA – $ 500 $ 600 $ 700 $1,800Japan $ 200 – 400 500 1,100Germany 600 500 – 300 1,400Canada 600 400 200 – 1,200Total payments $1,400 $1,400 $1,200 $1,500 $5,500
Multilateral netting enables the subsidiaries to transmit information about their obliga-tions to a single center, which combines them in the form shown in table 15.3. Nettingreduces total foreign-exchange transfers from $5,500 to $600 and transaction costs from$82.50 to $9. As a result, this netting reduces both foreign-exchange transfers and trans-action costs by 89 percent.
Table 15.3 The multilateral netting schedule
Subsidiary Total receipts Total payments Net receipts Net payments
USA $1,800 $1,400 $400 –Japan 1,100 1,400 – $300Germany 1,400 1,200 200 –Canada 1,200 1,500 – 300

These leads and lags can be achieved by modifying the credit terms extended by one unit toanother. In order to reduce foreign-exchange exposure, companies should accelerate the paymentof hard-currency payables and delay the payment of soft-currency payables. If subsidiary X buysgoods worth $10 million monthly from subsidiary Y on 60-day credit terms, Y is, in effect, financ-ing $20 million of working capital for X. The extension of the terms to 120 days would enablesubsidiary X to have an additional $20 million of working capital.
Most US and non-US MNCs use leads and lags to minimize foreign-exchange exposure andto shift the burden of financing from one unit to another. This technique has a number of advan-tages over direct loans. First, leading and lagging do not require a note that officially recognizesan obligation to the seller. Moreover, the amount of credit can be adjusted up or down by short-ening or lengthening the credit terms. Second, indications are that governments interfere lesswith payments on intracompany accounts than on intracompany loans. Third, under Section482 of the US tax code, US firms do not have to pay interest on intracompany accounts up to6 months, but they have to pay interest on all intracompany loans.
TRANSFER PRICING Transfer prices are prices of goods and services sold between related partiessuch as a parent and its subsidiary. There are increasing transfers of goods and services betweenrelated units in different countries, as MNCs have become larger and more diversified. Becausetransfer prices are frequently different from arm’s-length prices (fair market prices), there is obvi-ously room for manipulation. Governments usually assume that MNCs use transfer prices toreduce or avoid their taxes. For this reason, most governments have set up policing mechanismsto review the transfer pricing policies of MNCs. MNCs are also concerned with transfer pricesbecause they affect direct cash flows for payments of goods and taxes, for cost structures, and forthe evaluation of management performance.
Transfer prices can avoid financial problems or improve financial conditions. For example,some countries restrict the amount of profits that can leave that country. In this case, a parentcompany can remove funds from this particular foreign country by charging higher prices ongoods sold to its subsidiary in that country. Transfer prices also channel funds into a subsidiaryto bolster its financial condition by charging lower prices on goods sold to that subsidiary.
376 INTERNATIONAL WORKING CAPITAL MANAGEMENT
Example 15.2
To illustrate the effects of a change in transfer prices on the flow of funds, assume the fol-lowing: (1) affiliates A and B have the same tax rate at 50 percent, (2) affiliate A produces100 radios for $5 per unit and sells them to affiliate B, and (3) affiliate B sells these radiosfor $20 per unit to an unrelated customer. Table 15.4 shows the effects of low versus hightransfer price on flow of funds.
A consolidated gross profit of $1,500 is the same under both conditions. If both affili-ates have the same tax rate at 50 percent, a consolidated net income of $450 is also thesame under both conditions. The policy of the low transfer price results in a cash transferof $1,000 from B to A, whereas the policy of the high transfer price causes an additional

A major consideration in setting a transfer price is the income tax effect. For example, thosecountries with high tax rates are likely to induce higher transfer prices on flows from the parentand lower transfer prices on flows to the parent. On the other hand, those countries with lowertax rates would induce lower transfer prices on flows from the parent and higher transfer priceson flows to the parent. These transfer pricing policies shift profits from a country with a highertax rate to a country with a lower tax rate, so that worldwide corporate profits may be maximized.
THE BASIC CONCEPTS OF WORKING CAPITAL MANAGEMENT 377
$500 of cash to move from B to A. If it were desirable to transfer funds out of affiliate B,the high transfer price policy would achieve this purpose. The use of the low transfer price($1,000) allows B to make a net income of $300, whereas the use of the high transfer price($1,500) permits B to earn only $50. Hence, if it were desirable to bolster B’s financial con-dition, the low transfer price policy would achieve this end.
Table 15.4 The effects of low versus high transfer price on the flow of funds
Low tax A High tax B Combined A + B
Low transfer priceSales price $1,000 $2,000 $2,000Cost of goods sold 500 1,000 500Gross profit $ 500 $1,000 $1,500Operating expenses 200 400 600Earnings before taxes $ 300 $ 600 $ 900Taxes (50%) 150 300 450Net income $ 150 $ 300 $ 450
High transfer priceSales price $1,500 $2,000 $2,000Cost of goods sold 500 1,500 500Gross profit $1,000 $ 500 $1,500Operating expense 200 400 600Earnings before taxes $ 800 $ 100 $ 900Taxes (50%) 400 50 450Net income $ 400 $ 50 $ 450
Example 15.3
To illustrate the tax effects of a change in transfer prices on corporate earnings, assume thefollowing: (1) affiliate C is in a low-tax country (20 percent tax rate) and affiliate D is in ahigh-tax country (50 percent tax rate); (2) affiliate C produces 150 calculators for $5 perunit and sells them to affiliate D; and (3) affiliate D sells these calculators for $20 per unit

Multinational business executives are reluctant to discuss policies for transfer pricing. But inmultinational cases, transfer pricing has been used to minimize income taxes and tariffs, to adjustfor currency fluctuations, to avoid economic restrictions, and to present a favorable financialpicture of a foreign affiliate. In the early 1990s, President Clinton made a proposal to extract bil-lions of dollars from foreign companies in the United States. By cracking down on foreign com-panies that manipulate transfer prices, Clinton argued that the US government could collect $45billion over 4 years from foreign companies.
REINVOICING CENTERS Some MNCs circumvent or bypass governments’ restrictions and reg-ulations by setting up reinvoicing centers in tax-haven countries. Tax-haven countries are thosenations that provide foreign companies with permanent tax inducements. It is possible for a rein-voicing center in the Bahamas to issue invoices for all goods sold by a US parent to its sub-
378 INTERNATIONAL WORKING CAPITAL MANAGEMENT
to an unrelated customer. Table 15.5 shows the tax effects of low versus high transfer priceon company earnings.
Under the low transfer price, C pays taxes of $90 and D pays taxes of $450 for a totaltax bill of $540 and a consolidated net income of $810. Under the high transfer price, Cpays taxes of $240 and D pays taxes of $75 for a total tax bill of $315 and a consolidatednet income of $1,035. Earnings before taxes are the same at $1,350 despite the differentprices at which the calculators transfer from C to D. Still, the higher transfer price reducestotal taxes by $225 ($540 - $315) and increases consolidated net income by the sameamount ($1,035 - $810).
Table 15.5 The tax effect of low versus high transfer price
Low tax C High tax D Combined C + D
Low transfer priceSales price $1,500 $3,000 $3,000Cost of goods sold 750 1,500 750Gross profit $ 750 $1,500 $2,250Operating expenses 300 600 900Earnings before taxes $ 450 $ 900 $1,350Taxes (20%/50%) 90 450 540Net income $ 360 $ 450 $ 810
High transfer priceSales price $2,250 $3,000 $3,000Cost of goods sold 750 2,250 750Gross profit $1,500 $ 750 $2,250Operating expense 300 600 900Earnings before taxes $1,200 $ 150 $1,350Taxes (20%/50%) 240 75 315Net income $ 960 $ 75 $1,035
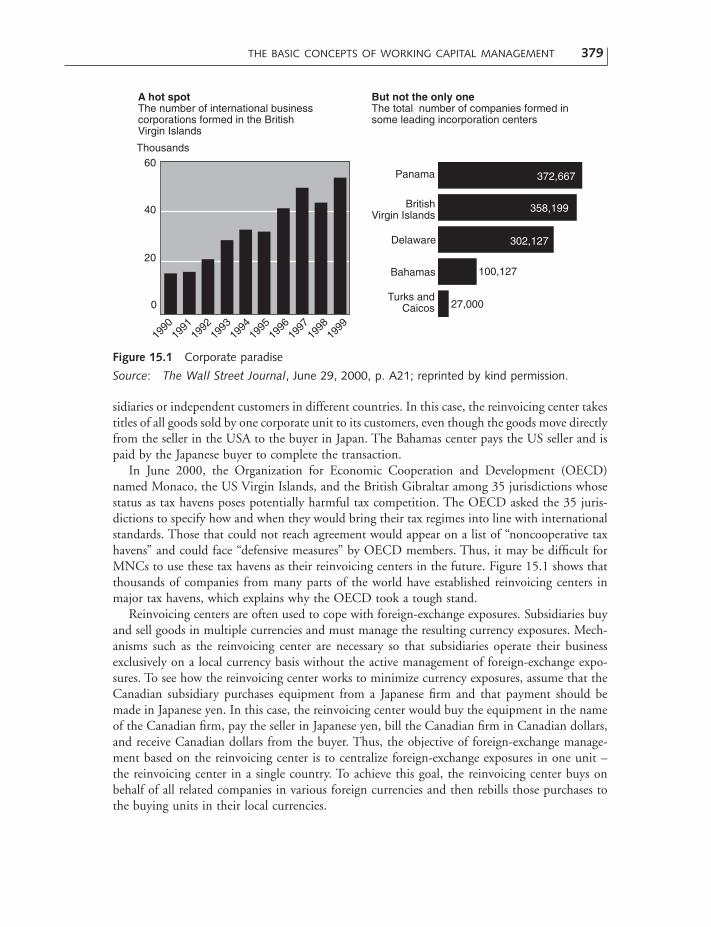
sidiaries or independent customers in different countries. In this case, the reinvoicing center takestitles of all goods sold by one corporate unit to its customers, even though the goods move directlyfrom the seller in the USA to the buyer in Japan. The Bahamas center pays the US seller and ispaid by the Japanese buyer to complete the transaction.
In June 2000, the Organization for Economic Cooperation and Development (OECD)named Monaco, the US Virgin Islands, and the British Gibraltar among 35 jurisdictions whosestatus as tax havens poses potentially harmful tax competition. The OECD asked the 35 juris-dictions to specify how and when they would bring their tax regimes into line with internationalstandards. Those that could not reach agreement would appear on a list of “noncooperative taxhavens” and could face “defensive measures” by OECD members. Thus, it may be difficult forMNCs to use these tax havens as their reinvoicing centers in the future. Figure 15.1 shows thatthousands of companies from many parts of the world have established reinvoicing centers inmajor tax havens, which explains why the OECD took a tough stand.
Reinvoicing centers are often used to cope with foreign-exchange exposures. Subsidiaries buyand sell goods in multiple currencies and must manage the resulting currency exposures. Mech-anisms such as the reinvoicing center are necessary so that subsidiaries operate their businessexclusively on a local currency basis without the active management of foreign-exchange expo-sures. To see how the reinvoicing center works to minimize currency exposures, assume that theCanadian subsidiary purchases equipment from a Japanese firm and that payment should bemade in Japanese yen. In this case, the reinvoicing center would buy the equipment in the nameof the Canadian firm, pay the seller in Japanese yen, bill the Canadian firm in Canadian dollars,and receive Canadian dollars from the buyer. Thus, the objective of foreign-exchange manage-ment based on the reinvoicing center is to centralize foreign-exchange exposures in one unit –the reinvoicing center in a single country. To achieve this goal, the reinvoicing center buys onbehalf of all related companies in various foreign currencies and then rebills those purchases tothe buying units in their local currencies.
THE BASIC CONCEPTS OF WORKING CAPITAL MANAGEMENT 379
1990
1991
1992
1993
1994
1995
1996
1997
1998
1999
60
40
20
0
372,667
358,199
302,127
100,127
27,000
Panama
BritishVirgin Islands
Delaware
Bahamas
Turks andCaicos
A hot spotThe number of international businesscorporations formed in the BritishVirgin Islands
But not the only oneThe total number of companies formed insome leading incorporation centers
Thousands
Figure 15.1 Corporate paradise
Source: The Wall Street Journal, June 29, 2000, p. A21; reprinted by kind permission.

INTRACOMPANY LOANS There are many different types of intracompany loans, but direct loans,credit swaps, and parallel loans are the most important. Direct loans involve straight dealingsbetween the lending unit and the borrowing unit, but credit swaps and parallel loans normallyinvolve an intermediary.
A credit swap is a simultaneous spot-and-forward loan transaction between a private companyand a bank of a foreign country. For example, a US company deposits a given amount of dollarsin the Chicago office of a Mexican bank. In return for this deposit, the bank lends a given amountof pesos to the company’s subsidiary in Mexico. The same contract provides that the bank returnsthe initial amount of dollars to the company at a specified date and that the subsidiary returnsthe original amount of pesos to the bank at a specified date.
Credit swaps are, in fact, intracompany loans hedged and channeled through banks. Theseloans are also risk free from a bank’s point of view, because the parent’s deposit fully collateral-izes them. Credit swaps have several advantages over direct intracompany loans. First, credit swapsare free of foreign-exchange exposures because the parent recovers the amount of its deposit inthe original parent currency from the bank. Second, cost savings may be available with creditswaps, because certain countries apply different tax rates to interest paid to the foreign parentand to interest paid to the local bank.
Parallel loans consist of two related but separate borrowings and typically involve four partiesin two different countries. For example, a US parent lends an agreed amount in dollars to theAmerican subsidiary of a Mexican parent. In return for this loan, the Mexican parent lends thesame amount of money in pesos to the Mexican subsidiary of the US parent. These loan arrange-ments involve the same amount for both loans and the same loan maturity. Certainly, each loanis paid in the subsidiary’s currency.
Parallel loans are frequently used to effectively repatriate blocked funds by circumventingexchange control restrictions. To see how the back-to-back loan can be used to repatriate blockedfunds, suppose that the Mexican subsidiary of IBM is unable to repatriate its peso profits. It maylend the money to the Mexican subsidiary of AT&T; AT&T would, in turn, lend dollars to IBMin the USA. As a result, IBM would have the use of dollars in the USA while AT&T wouldobtain pesos in Mexico.
PAYMENT ADJUSTMENTS There are many different forms of payments by foreign subsidiariesto the parent company. These payments can be adjusted to remove blocked funds. Dividend pay-ments are by far the most important form of fund flows from foreign subsidiaries to the parentcompany, accounting for approximately 50 percent of all remittances to US companies. Moneymarket countries recognize dividend payments as a method by which the earnings of a businessfirm can be distributed to the stockholders of the firm. Not all nations, however, allow dividendsof local companies to be paid in hard currencies to the foreign parent companies. Countries char-acterized by balance-of-payments problems and foreign-exchange shortages frequently placerestrictions on the payment of dividends to foreign companies.
Two methods to adjust dividend payments in the case of these restrictions have becomeincreasingly popular. These two methods artificially inflate the value of the local investment base,because the level of dividend payments depends on the company’s capital. First, the parentcompany can magnify its subsidiary’s registered capital by investing in used equipment, whosevalue has been artificially inflated. Second, the parent company may acquire a bankrupt localfirm at a large discount from book value and then merge it with its subsidiary on the basis ofthe failed firm’s book value. Of course, this action would raise the subsidiary’s equity base.
380 INTERNATIONAL WORKING CAPITAL MANAGEMENT

In addition to dividends, royalties and fees are also important components of fund flows fromforeign subsidiaries to the parent company. Royalties are paid to use certain technologies, patents,and trademarks. Fees are compensations for managerial services and technical assistance. Suchroyalties and fees are unique and thus do not have a reference in market value. Most host gov-ernments look with more favor on payments for royalties and fees than on payments for profitremittances. Hence, it is easier for MNCs to repatriate blocked funds through inflated royaltyand fee payments rather than through any other form of payment.
UNBUNDLING FUND TRANSFERS MNCs frequently unbundle remittances into separate flowsfor such purposes as royalties and management fees, rather than lumping all flows under theheading of profit (dividend). Host countries are then more likely to perceive the so-called “remit-tance of profits” as essential purchases of specific services that would benefit the host country.Unbundling makes it possible for MNCs to recover funds from their affiliates without irritatinghost-country sensitivities with large dividend drains. This form of fund transfers is particularlyuseful for business operations in socialist and Islamic countries, where interest and dividend pay-ments are regarded unfavorably.
MNCs can also unbundle remittances into separate cash flows to reduce their overall incometaxes. Royalties and management fees have certain tax advantages over dividends when the host-country tax rate is higher than the parent-country rate. Obviously, this tax advantage arisesbecause royalties and management fees are usually tax deductible locally. Under the foreign taxcredit system, countries relinquish tax on profits earned abroad up to the amount of the foreigntax. Because local income taxes are paid before the dividend distribution, the parent companycan take a tax credit for the local income taxes paid. If the local income tax rate is higher thanthe parent-country rate, part of the benefit may be lost, but the entire benefit is obtained whenthe payment is for royalties and management fees.
THE BASIC CONCEPTS OF WORKING CAPITAL MANAGEMENT 381
Example 15.4
Assume that the foreign subsidiary of a US parent company earns $1,000 before any taxes.The parent company wants to receive $400 before US taxes. The local tax rate is 50 percentand the US tax rate is 30 percent.
Table 15.6 shows how the US parent company can unbundle remittances into separatecash flows to reduce its worldwide taxes. In the case of a “bundled situation,” the parentcompany receives $400 in cash dividends. In the case of an “unbundled situation,” theparent company receives a royalty of $300 and a dividend of $100 for a total of $400 incash. Under the bundled situation, the subsidiary pays taxes of $500 and the parentcompany pays no taxes for a total tax bill of $500 and a consolidated net income of $500.Under the unbundled situation, the subsidiary pays taxes of $350 and the parent companypays taxes of $90 for a total tax bill of $440 and a consolidated net income of $560. Earn-ings before any taxes are the same at $1,000. Still, the unbundled situation reduces totaltaxes by $60 and increases consolidated net income by $60.

15.2 Cash Management
Cash gives an MNC the ability to pay bills as they come due, but it is not an earning asset. Thus,it is very important to determine an optimal level of investment in cash. The major sources ofcash inflows are dividends, royalties and fees, cash sales and collections on accounts receivable,depreciation, sales of new securities, loans from banks or nonbank financial institutions, andadvance cash payments on contracts. In contrast, cash outflows are necessary for interest and div-idend payments, retirement of debt and other securities, income tax payments, payments onaccounts payable, wages and salaries, and purchases of fixed assets. The term “cash management”is used here to mean optimization of cash flows and investment of excess cash.
Companies prefer to hold cash rather than other forms of assets for three main reasons: thetransaction motive, the precautionary motive, and the speculative motive. The transactionmotive holds that cash balances are held partly in anticipation of day-to-day cash disbursements.The precautionary motive suggests that cash balances are held partly as protection against devi-ations from budgeted cash flows. The speculative motive relates to the holding of cash in orderto take advantage of profit-making opportunities.
15.2.1 Objectives of cash management
The general principles that apply to cash management on an international basis are frequentlysimilar to those utilized by many companies domestically. The overall cash management objec-
382 INTERNATIONAL WORKING CAPITAL MANAGEMENT
Table 15.6 Bundled versus unbundled contribution to consolidated income
Bundled $400 dividend Unbundled $100 dividend
Subsidiary statementEarnings before taxes $1,000 $1,000Less: royalties and fees – 300Taxable income $1,000 $ 700Less: local tax at 50% (A) 500 350Available for dividends $ 500 $ 350Cash dividend to parent 400 100Reinvested locally $ 100 $ 250
Parent statementRoyalty received – $ 300Less: US tax at 30% (B) – 90Net royalty received – $ 210Net cash dividend $ 400 100Total cash received in the USA $ 400 $ 310
Worldwide incomeOriginal earnings before any taxes $1,000 $1,000Less: total taxes paid (A + B) 500 440Contribution to worldwide income $ 500 $ 560

tive of any corporation is to minimize the cash balance within the company, with the goal ofoptimizing corporate fund utilization. However, the parameters within which MNCs operate arebroader and more complex than those of purely domestic companies. Furthermore, the rela-tionships among these parameters are constantly changing. Hence those responsible for cash man-agement on an international basis must consider new variables such as tax concepts, governmentalrestrictions on intracompany fund flows, differences in cultures, and foreign-exchange rates.
More specifically, international cash managers try to attain the traditional objectives of domes-tic cash management on a global basis: (1) to minimize the cost of funds, (2) to improve liqu-idity, (3) to reduce risks, and (4) to improve the return on investment.
First, with interest rates of more than 10 percent in many countries, considerable savings arepossible when the cost of funds is lowered. MNCs should attempt to reduce their overall cost offunds by increasing internal funds and reducing borrowings.
Second, international cash managers must attempt to improve liquidity on a global basis. Cer-tainly, it is difficult to improve liquidity on a worldwide basis, because government regulationsprohibit the free transfer of funds. But MNCs can use centralized cash management and elec-tronic fund transfers to improve their overall liquidity.
Third, international cash management involves a variety of risks, such as political, economic,and exchange risks. Insurance, careful negotiations, forward contracts, and currency options maybe used to reduce these risks.
Fourth, a variety of ratios, such as return on investment and return on net worth, are oftenused to measure performance. The improvement of financial performance is perhaps the mostimportant aspect of treasury management.
15.2.2 Floats
To carry out its operations, an MNC causes a steady flow of funds to take place among its familymembers. These fund flows cannot avoid the problem of float, which refers to the status of fundsin the process of collection. From a domestic point of view, float represents only the temporaryloss of income on funds that are tied up in the process of collection. In international operations,however, the problem of float is twofold: (1) the loss of income on the funds tied up during thelonger transfer process; and (2) their exposure to foreign-exchange risk during the transfer period.Nearly all aspects of both international and domestic cash management are associated with theconcept of float. Thus, we ought to understand float to effectively evaluate the collection anddisbursement procedures of any cash management system. For purposes of measurement andanalysis, we can break down float into five categories:
1 Invoicing float refers to funds tied up in the process of preparing invoices. Because this floatis largely under the direct control of the company, it can be reduced through more efficientclerical procedures.
2 Mail float includes funds tied up from the time customers mail their remittance checks untilthe time the company receives them.
3 Processing float consists of funds tied up in the process of sorting and recording remittancechecks until they can be deposited in the bank. Like invoicing float, this float is under thecompany’s internal control and thus can be reduced through more efficient clerical procedures.
CASH MANAGEMENT 383

4 Transit float involves funds tied up from the time remittance checks are deposited until thesefunds become usable to the company. This float occurs because it takes several days fordeposited checks to clear through the commercial banking system.
5 Disbursing float refers to funds available in a company’s bank account until these funds areactually disbursed by the company.
15.2.3 The collection and disbursement of funds
The overall efficiency of international cash management depends on various collection and dis-bursement policies. To maximize available cash, an MNC must accelerate its collection process and delay its payments. Hence, it must consider these two policies simultaneously toimprove its overall cash management efficiency. Significant benefits exist, because long delays arepossible in collecting accounts receivable and in paying accounts payable. Delays of 7–10 business days are common to allow for transit and other floats across national borders. Effectivecollection and disbursement policies have become even more important in recent years because of high interest rates, wide fluctuations in foreign-exchange rates, and widespread creditrestrictions.
ACCELERATION OF COLLECTIONS International cash managers should use every means in theirpower to gain control over incoming funds as quickly as possible after the collection processstarts. The principal goals of speeding the collection process are to reduce floats, to minimize theinvestment in accounts receivable, and to reduce banking and other transaction fees.
An MNC can use a number of useful techniques to speed the collection process: lock boxes,cable remittances, electronic fund transfers, and the use of wire transfers. There are no signifi-cant differences between domestic and international lock-box operations. In international lock-box arrangements, MNCs simply use banks in foreign countries to speed up the collection processof their international accounts receivable. With respect to payment instructions to customers andbanks, the use of cable remittances is a crucial means for MNCs to minimize delays in receiptof payments and in conversion of payments into cash.
MNCs use electronic fund transfers (EFTs) to move several trillion dollars throughout theworld every day. EFTs move funds faster and more efficiently than checks. Moreover, EFTs arecompleted at a relatively low cost.
In chapter 12, we discussed three computerized systems designed to process international wiretransfers: the Clearing House Interbank Payment System (CHIPS), the Clearing House PaymentAssistance System (CHPAS), and the Society for Worldwide Interbank Financial Telecommuni-cations (SWIFT). These and other computerized systems are widely used today to facilitate thewire transfer process of funds around the globe. The SWIFT is an interbank communicationnetwork founded in 1973 to move messages for financial transactions.
DELAY OF PAYMENTS In addition to accelerating collections, international cash managers canproduce a faster turnover of cash by controlling disbursements efficiently. By delaying disburse-ments, a company keeps cash on hand for longer periods. When the firm purchases goods oncredit, it must delay its payments until the last day in order to have the additional funds for theextra time. An MNC can delay its payments in a number of ways: (1) mail, (2) more frequentrequisitions, and (3) floats.
384 INTERNATIONAL WORKING CAPITAL MANAGEMENT

First, in spite of the widespread availability of electronic fund-transfer networks, a surpris-ingly large number of cross-border payments are still made by mail. It is not unusual for regularairmail to take 7 days or more to reach its ultimate destination.
Second, a parent can use large sums of money on a temporary basis because of frequent req-uisitions of funds by foreign subsidiaries from the parent’s central office and the centralized dis-bursements. For example, if a firm switches its requisition policy from monthly requisitions toweekly requisitions, it can keep cash on hand for as much as 3 weeks longer.
Third, the use of float is yet another method used to maximize the availability of cash. At anygiven time, checks written by a firm have yet to be cleared through the banking system, becausethat process takes a number of days. Thus, it is possible for a firm to have a negative balance onits checkbook but a positive balance on its bankbook for a number of days.
THE COST OF CASH MANAGEMENT An MNC company may use various collection and dis-bursement procedures to improve the efficiency of its cash management. Because these two typesof procedures constitute two sides of the same coin, they have a joint effect on the overall effi-ciency of cash management. Accelerating collections and delaying disbursements involve addi-tional costs. Hence a company must determine how far it should go to make its cash operationsmore efficient. In theory, a company should adopt various collection and disbursement methods,as long as their marginal returns exceed their marginal expenses.
The value of careful cash management depends on the opportunity cost of funds invested incash. The opportunity cost of these funds in turn depends on the company’s required rate ofreturn on short-term investments. For example, assume that the adoption of a lock-box system is expected to reduce the investment in cash by $100,000. If a company earns 11 percenton short-term investments, the opportunity cost of the current system is $11,000. Hence, if the cost of the lock-box system is less than $11,000, it can be adopted to improve earnings performance.
15.2.4 Cash centers
Cash management can be centralized, regionalized, or decentralized on a company level. Decen-tralization permits subsidiaries to use excess cash in any way they see fit. While this is popularamong subsidiary managers, decentralization does not allow an MNC to utilize its most liquidasset on a widespread basis. Effective cash management requires that executives predeterminecash flow centers. For example, an MNC should not choose to hold cash in a country that suffersviolent political upheavals and rampant inflation. Rather, it should transfer idle local cash bal-ances as quickly as possible to a stable environment.
Centralized cash management or cash pooling calls for each local subsidiary to hold, at thelocal level, the minimum cash balance for transaction purposes. All funds not needed for trans-action purposes are channeled to a central cash center. This cash center is responsible for placinga central pool of funds in those currencies and money market instruments that will best servethe needs of the MNC on a worldwide basis.
THE ADVANTAGES OF CASH POOLING Centralized cash management has a number of advan-tages over decentralized cash management:
CASH MANAGEMENT 385

1 The central cash center can collect information more quickly and make better decisions onthe relative strengths and weaknesses of various currencies. Such information and decisionsare necessary if one wishes to invest a central pool of funds most profitably.
2 Funds held in a cash center can quickly be returned to a subsidiary with cash shortages bywire transfer, or by providing a worldwide banking system with full collateral in hard cur-rency. The central pool of funds eliminates the possibility that one subsidiary will borrow athigher rates while another holds surplus funds idle, or invests them at lower rates.
3 By holding all precautionary balances in a central cash center, an MNC can reduce the totalpool without any loss in the level of production. This is due to a synergistic effect that is saidto exist when the whole is worth more than the mere sum of its parts. This effect has fre-quently been defined as “2 + 2 = 5.”
Before any cash is remitted to a central cash center, local cash needs must be properly assessed.The proper assessment of local cash needs in relation to the cash center involves the followingsteps:
1 Cash budgets should be prepared, to show anticipated cash outflows and inflows at key futuredates.
2 Each subsidiary must have effective cash collection procedures that will speed up cash flowsinto the company.
3 Each subsidiary must also have systematic cash disbursement procedures that will delay cashflows out of the company.
4 Each subsidiary should estimate when it will have surplus cash, and how much.5 Each subsidiary should also estimate when it will have shortages, and by how much.6 The MNC must develop necessary steps for cash mobilization, such as a management infor-
mation system and a cash-transfer system; it should have the clear responsibility for makingcash-transfer decisions.
FACTORS AFFECTING THE LOCATION OF CASH CENTERS Many factors affect the location ofcash centers. From an economic point of view, idle funds should move toward those locationsthat provide the highest profitability and safety. These funds are accumulated in cash centers fortemporary investment prior to reassignment elsewhere. Thus, an MNC should choose those loca-tions from which funds can again be readily assigned to other places in the world.
Perhaps the most important factor affecting the location of cash centers is the local government’s political stability and its attitude toward foreign-based companies. Local laws mayrequire partial ownership of alien companies by nationals of the host country or by the government itself. Hostility of the courts toward foreign business claims and disclosure require-ments may all work against a subsidiary operating as a cash center. Aggregate tax levels and penalty rates on excessive dividend remittances also play an important role in the selection ofcash centers.
An MNC must also consider several economic factors when selecting cash centers. These cashcenters should be located in countries whose currencies are stable in value and readily convert-ible into other currencies. It is extremely difficult for financial managers to predict the exacttiming of a change in the exchange rate. Most governments take all possible measures to avoidspeculation against their currencies. It is critical, therefore, to engage in hedging operations toassure that foreign-exchange losses can be minimized. Thus, the existence of an active forward
386 INTERNATIONAL WORKING CAPITAL MANAGEMENT

market and the availability of suitable money market instruments for the deployment of tem-porary excess resources are important.
Cash centers are usually located in the major financial centers of the world, such as New Yorkand London. Brussels has become popular as a cash center for companies operating in Europe.Other popular locations for cash centers are tax-haven countries, such as Luxembourg, theBahamas, Bermuda, and the Netherlands. These countries offer most of the prerequisites for acorporate cash center: political and economic stability, a freely convertible currency, access tointernational communications, and well-defined legal procedures.
15.2.5 Investing excess funds
Along with optimization of cash flows, the other key function of international cash managementis to make certain that excess funds are wisely invested. This section discusses three types of port-folio management and portfolio guidelines.
PORTFOLIO MANAGEMENT There are at least three types of portfolio management available tointernational cash managers. First, MNCs can optimize cash flows worldwide with a zero port-folio. All excess funds of subsidiaries are remitted to the parent and then used to pay the parent’sshort-term debts. Second, they can centralize cash management in third countries, such as tax-haven countries, and invest funds in marketable securities. Third, they can centralize cash man-agement at headquarters, with subsidiaries holding only minimum amounts of cash fortransaction purposes.
PORTFOLIO GUIDELINES Most surplus funds are temporary. If MNCs invest funds in mar-ketable securities such as Treasury bills, they should follow sound portfolio guidelines. First,instruments in the short-term investment portfolio should be diversified to maximize the yieldfor a given amount of risk, or to minimize the risk for a given amount of return. Second, forcompanies that hold marketable securities for near-future needs of liquidity, marketability con-siderations are of major importance. Third, the maturity of the investment should be tailored tothe company’s projected cash needs. Fourth, the securities chosen should be limited to those witha minimum risk of default. Fifth, the portfolio should be reviewed daily to decide what newinvestments will be made and which securities will be liquidated.
15.2.6 International cash management practices
In 1996, Ricci and Morrison conducted a survey of Fortune 200 companies to determine theuse of several of the cash management techniques discussed in this chapter. Wire transfers, elec-tronic fund transfers, and lock boxes are used to expedite the collection of accounts receivable.Cash pooling and netting are used to minimize interaffiliate fund flows.
Table 15.7 indicates the relative frequencies of these five cash management techniques usedby Fortune 200 companies. These companies appear to have a high level of sophistication. Morethan 80 percent of the respondents use wire transfers often, 50 percent pool their cash often, andalmost half net payments and transfer funds electronically often.
CASH MANAGEMENT 387

15.3 Accounts Receivable Management
The level of accounts receivable depends upon the volume of credit sales and the average col-lection period. These two variables, in turn, depend upon credit standards, credit terms, and col-lection policy. As management moves from customers who are more likely to pay their bills tocustomers who are less likely to pay their bills, sales tend to increase. However, a lenient creditpolicy is also likely to increase bad debt losses and investments in accounts receivable. In theory,a company should liberalize its credit policy to the point at which the marginal profit on itsincreased sales equals the marginal cost of credit.
Because money has a time value, accounts receivable have a cost in terms of foregone inter-est. Nevertheless, many MNCs frequently decide to sell for credit in order to expand sales volumeand profits. If sales are made on the basis of drafts on importers, trade acceptances or bankers’acceptances are created, and these may be discounted at banks or sold in the money market. Inaddition, in many countries the accumulation of accounts receivable is even highly desirable,because government agencies extend export credit at preferential interest rates.
15.3.1 Currency value problems
One truly unique problem area of multinational accounts receivable management has to do withthe risk of currency value changes. The accounts receivable manager should understand this riskand take all necessary actions to minimize it. Multinational accounts receivable are created bytwo separate types of transactions, sales to customers outside the corporate group and intra-company sales. We must consider these two types of transactions separately, because their eco-nomic consequences are different.
SALES TO INDEPENDENT CUSTOMERS Management of accounts receivable from independentbuyers involves two types of decision, the denomination of currency to be used for payment andthe terms of payment. Domestic sales are always denominated in the local currency. In contrast,export sales can be denominated in the currency of the exporter, the currency of the importer,or a third-country currency. The exporter would prefer to price and to invoice in the strongestcurrency, while the importer would prefer to pay in the weakest currency. Competition or customwill frequently resolve the problem, but the usual result is a trade-off between the terms ofpayment and the denomination of currency. For example, an exporter may grant a longer creditperiod in exchange for an importer’s promise to pay for its purchase in a hard currency.
388 INTERNATIONAL WORKING CAPITAL MANAGEMENT
Table 15.7 The use of international cash management techniques
Often Sometimes Rarely Never
Wire transfers 82.3% 15.3% 1.6% 0.8%Electronic fund transfers 49.6% 17.9% 17.1% 15.4%Lock boxes 28.7% 27.0% 18.9% 25.4%Cash pooling 50.0% 19.5% 11.0% 19.5%Netting 49.6% 17.9% 17.1% 15.4%
Source: C. W. Ricci and G. Morrison, “International Working Capital Practice of the Fortune 200,” Financial Practice and Education, Fall/Winter 1996, pp. 7–20.

Many factors affect the terms of payment, but perhaps one of the most important is thestrength of the currency denominated in a transaction. If payments are to be made in a soft cur-rency, accounts receivable should be collected as quickly as possible in order to minimize the pos-sibility of exchange losses between the sale date and the collection date. Sales made in a hardcurrency may be permitted to remain outstanding somewhat longer. If the devaluation of itshome currency is imminent, an exporter might want to encourage slow payment of its hard-currency receivables.
There are at least two ways in which the accounts receivable manager can alleviate currencyvalue problems: currency denomination and the use of factors. A seller may require that all pay-ments are to be made in hard currencies. This requirement assures the seller that payments areto be made in currencies likely to face little or no devaluation on the foreign-exchange market.In certain instances, an MNC refuses credit sales denominated in foreign currencies altogether.MNCs may buy currency credit insurance. For example, American exporters can purchase pro-tection from the Foreign Credit Insurance Association or the Export–Import Bank described inchapter 13.
Accounts receivable managers also use factors to minimize accounts receivable risks fromchanges in exchange rates between the sale date and the collection date. Factoring is a processwhereby a company sells its accounts receivable on a nonrecourse basis. Nonrecourse means thatthe factor takes the loss if the customers of its client do not pay their accounts. In addition torisk bearing, the factor performs a number of additional services such as credit checking, book-keeping, and the collection of accounts.
INTRACOMPANY SALES Intracompany sales differ from sales to independent customers in thatlittle concern is given to credit standing and the timing of the payments may depend upon acompany’s desire to allocate resources rather than normal payment schedules. Such sales are nec-essary for many reasons. Subsidiaries produce different products and often sell to each other. Likethe location of cash balances, the location of intracompany receivables and their amounts are apolicy consideration of the MNC when it allocates its resources on a global basis. If a parentcompany desires to transfer funds to its affiliate, it may do so by having the affiliate delay thepayment for intracompany purchases.
Because international credit sales usually cross national boundaries, companies are concernedabout currency values. Changes in exchange rates between the sales date and the collection datecreate accounts receivable risks. Leading and lagging can be used to alleviate currency value prob-lems of intracompany credit sales. If subsidiaries are located in countries whose currencies arelikely to devalue or to float downward, a parent company may instruct its subsidiaries to pay fortheir purchases more quickly (leading). In contrast, if subsidiaries are located in countries whosecurrencies are expected to upvalue or to float upward, the parent company may instruct its sub-sidiaries to delay payments (lagging). It is important to note that early payments and later pay-ments in conjunction with intracompany sales are feasible only when the parent company owns100 percent of its various affiliates.
15.4 Inventory Management
The overall efficiency of inventory management is extremely important for two reasons. First,inventories represent a significant segment of total assets for most MNCs. Second, they are theleast liquid of current assets; thus, errors in inventory management are not quickly remedied.
INVENTORY MANAGEMENT 389

Hence for the past few decades the greatest improvements within the area of current asset man-agement have been made in inventory control and investment. The size of inventories in rela-tion to sales has been greatly reduced with the application of computers and new inventorymanagement systems.
Many US and European MNCs have recently adopted a Japanese inventory managementsystem known as the “just-in-time” inventory system. The just-in-time inventory systemrequires that when orders are placed, specific goods are ordered along with an exact delivery date.The goal on the part of the company is to reduce inventory balances to practically zero. Undersuch an arrangement, it is not uncommon for suppliers to build facilities close to their majorcustomers in order to ensure a ready supply of inventory. For example, many Japanese automo-tive suppliers have established their production facilities close to Japanese car assembly trans-plants in the USA and Canada. In essence, the customer is passing the inventory balance problemback to the supplier.
15.4.1 Determining the amount of inventory
The level of sales, the length of the production cycle, and the durability of the product are majordeterminants of investment in inventory. In domestic or one-country operations, companiesattempt to balance their inventory level in such a way that both carrying costs and stockout costsare minimized. However, differentials in the costs of production and storage in different coun-tries allow the MNC to maintain more flexible inventory policies. For instance, an MNC cantake advantage of lower costs in a particular country by shifting its production or storage func-tion to that country. These advantages are offset by such disadvantages as tariff levels and otherforms of import restrictions used by governments.
Given the fact that many foreign affiliates operate under inflationary conditions, an MNCmust determine whether to buy inventory in advance or to delay purchase until the inventory isactually needed. Advance purchases involve such carrying costs as interest on funds tied up ininventory, insurance premiums, storage costs, and taxes. Later purchases increase the possibilityof higher costs either through inflation or devaluation. Inflation increases the costs of locally pur-chased items, and devaluation increases the costs of imported items.
Despite the desire for optimizing inventory levels, many companies that rely on importedinventories maintain overstocked inventory accounts. The fears of continued inflation, raw mate-rials shortages, and other environmental constraints induce companies to maintain high overseasinventory levels rather than risk curtailment of their overseas operations. Additional environ-mental constraints include anticipated import bans in foreign countries, anticipated deliverydelays caused by dock strikes and slowdowns, the lack of sophisticated production and inven-tory control systems, and increased difficulty in obtaining foreign exchange for inventory purchases.
15.4.2 Protective measures against inflation and devaluation
Many foreign affiliates operate under inflationary economic conditions. Thus it is important forMNCs to determine the effects of an increasing local price level or devaluation on their inven-tory management policies. The type of inventory normally stocked by subsidiaries is of impor-
390 INTERNATIONAL WORKING CAPITAL MANAGEMENT

tance in this decision. Some subsidiaries rely heavily on imported inventories, while other sub-sidiaries depend heavily upon locally acquired inventories. Some other subsidiaries may relyalmost equally on imported and locally acquired inventories.
If a subsidiary relies heavily on imported goods, it should seek to build its inventory of sup-plies, equipment, and components in advance of an expected devaluation, because devaluationat a later date effectively increases the costs of imported goods. For example, if a host countrydeclares a 10 percent devaluation of its currency in relation to the dollar, a subsidiary should pay10 percent more local currency for the same amount of imported goods from the USA.
On the other hand, if a subsidiary depends heavily upon locally purchased goods, it shouldseek to minimize its inventory of supplies, equipment, and components, because devaluation ata later date effectively reduces the dollar value of inventories acquired locally. If inventories aretranslated at current rather than at historical exchange rates, a 10 percent devaluation of the localcurrency against the dollar would reduce the dollar value of its inventory by 10 percent.
Finally, if a subsidiary relies almost equally on imported inventories and locally purchasedinventories, it should seek to reduce its locally acquired inventories and to increase its importedinventories in advance of an expected devaluation. However, if accurate forecasts of devaluationare not possible, a company should maintain the same amount of imported goods and locallypurchased goods to avoid foreign-exchange risks, because a devaluation would affect both typesof inventories equally, and thus the subsidiary would experience neither a gain nor a loss.
15.4.3 Pricing
Up to this point, our discussion has centered on preventive measures that MNCs can take toreduce risks associated with devaluation. Additional action can be taken in pricing to reduce theserisks.
INVENTORY MANAGEMENT 391
Example 15.5
Assume that 10 American-made radios have been imported into Korea, which has subse-quently devalued its currency by 50 percent. The original exchange rate was W500 per $1,the original cost was W1,000 per radio, and the original selling price was W1,500 per radio.
The Korean subsidiary has a choice of two basic policies with respect to price: (1) it canmaintain the original price of its inventory in an effort to undercut competition; or (2) it canincrease the price of its inventory in order to earn all or part of the original dollar profitexpected. Table 15.8 shows the effects of both policies on the Korean subsidiary. Mainte-nance of the old price will result in a dollar loss of $5 on the sale of the 10 radios, even iflocal figures indicate a profit of W5,000. If the subsidiary increases its selling price to thedollar equivalent of the original selling price, it will earn a profit of $10. However, it is impor-tant to note that this assumes that the Korean government does not maintain price con-trols. Although there are no price controls imposed by the Korean government, a priceincrease of the magnitude indicated in policy (2) would perhaps discourage some sales. If

392 INTERNATIONAL WORKING CAPITAL MANAGEMENT
the price elasticity of demand for the merchandise is extremely high, the local market maynot bear the higher price. Nevertheless, a certain level of price increase is required to preventa deterioration of converted earnings.
Table 15.8 The effect of pricing on profits
(1) Maintain old price (2) Adjust price
Korean US Korean USExchange rate currency dollars currency dollars
W1,000 (now) sold for W15,000 $15 W30,000 $30W500 (old) cost 10,000 20 10,000 20Profit W 5,000 -$ 5 W20,000 $10
Another important question is whether a subsidiary should continue to import that typeof merchandise. If local sales prices can be raised to cover the current higher dollar importprices, imports should continue. If not, imports could cease. Although the decision not toimport merchandise does not cause any transaction loss, it may result in idle production andan eventual operating loss due to the surrender of that particular foreign market. If possi-ble, MNCs should price their inventory goods in such a way that sales revenues include thesum of the increase in replacement cost of the inventory sold, the loss in real value of themonetary profit expected, and increased income taxes.
SUMMARY
Techniques of international working capital management are essentially similar to those employeddomestically, but additional variables are involved. In domestic operations, all transactions aresubject to the same rules of movement, accumulation, and reinvestment, but these rules vary whenthese transactions occur across national boundaries. These additional variables include political, tax,foreign exchange, and other economic constraints.
This chapter has discussed cash, accounts receivable, and inventory management. Cash man-agement can be centralized or decentralized on a company level. Although decentralization is popularamong subsidiary managers, it does not permit the MNCs to use its most liquid asset on a wide-spread basis. Multinational accounts receivable are created by two separate types of transactions:sales to independent customers and intracompany sales. Management of accounts receivable fromindependent customers involves the denomination of currency to be used for payments and theterms of payment. Intracompany sales differ from sales to independent customers, in that littleconcern is given to credit standing and the timing of the payments may depend upon a company’sdesire to allocate resources rather than normal payment schedules. The overall efficiency of inven-tory management is extremely important for two reasons. First, inventories represent a significantsegment of total assets for most MNCs. Second, they are the least liquid of current assets and thuserrors in inventory management are not quickly remedied.

PROBLEMS 393
Questions
1 What are the economic constraints of current asset management for multinational com-panies? Why do multinational companies face such constraints?
2 Why are various arbitrage opportunities available to multinational companies in theirworking capital management?
3 What techniques are available to a company with operating subsidiaries in many coun-tries to optimize on cash and marketable securities?
4 What are the advantages of leads and lags over direct loans?5 List the two major functions of international cash management.6 Why is the problem of floats in international operations more serious than in domestic
operations?7 Explain the three types of portfolio management available to international cash
managers.8 Why should a firm invest in a portfolio of foreign currencies instead of just a single foreign
currency?9 Standard advice given to exporters is to invoice in their own currency or a strong cur-
rency. Critically analyze this recommendation.10 Under what conditions should companies maintain overstocked inventory accounts?11 Explain the importance of current asset management.12 Why is the literature on international working capital management rather limited?
Problems
1 Assume that the netting center uses a matrix of payables and receivables to determine thenet payer or creditor position of each subsidiary at the date of clearing. The following tableshows an example of such a matrix:
Paying subsidiary
Receiving subsidiary USA Japan Germany Canada Total receipts
USA – $ 800 $ 700 $400 $1,900Japan $600 – 400 200 1,200Germany 200 0 – 300 500Canada 100 200 500 – 800Total payments $900 $1,000 $1,600 $900 $4,400

394 INTERNATIONAL WORKING CAPITAL MANAGEMENT
(a) Prepare a multilateral netting schedule, such as table 15.3.(b) Determine the amount of total payments to be reduced by netting.(c) Determine the percentage reduction in total payments by netting.
2 A multinational company has a subsidiary in country A that produces auto parts and sellsthem to another subsidiary in country B, where the production process is completed.Country A has a tax rate of 50 percent, while country B has a tax rate of 20 percent. Theincome statements of these two subsidiaries are shown in the following table:
income statements for two subsidiaries
High tax A Low tax B Combined A + B
High transfer priceSales price $4,000 $7,000 $7,000Cost of goods sold 2,200 4,000 2,200Gross profit $1,800 $3,000 $4,800Operating expense 800 1,000 1,800Earnings before taxes $1,000 $2,000 $3,000Taxes (50%/20%) 500 400 900Net income $ 500 $1,600 $2,100
Pro forma
Assume that the multinational company reduces its transfer price from $4,000 to $3,200.Determine the tax effect of this low transfer price on the company’s consolidated netincome.
3 The foreign subsidiary of a US parent company earns $1,000 before any taxes. The parentcompany wants to receive $400 before US taxes. The local tax rate is 50 percent and theUS tax rate is 30 percent. The US company is considering two options: option X: $400 incash dividends and option Y: $160 in cash dividends plus $240 in royalty fees for a totalof $400 in cash. Which option should the company select to maximize its consolidatedincome?
4 A US company has $10,000 in cash available for 45 days. It can earn 1 percent on a 45-day investment in the USA. Alternatively, if it converts the dollars to Swiss francs, it canearn 1.5 percent on a Swiss deposit for 45 days. The spot rate of the Swiss franc is $0.50.The spot rate 45 days from now is expected to be $0.40. Should this company invest itscash in the USA or in Switzerland?

CASE PROBLEM 15 395
REFERENCES
Allen, M., “British Virgin Isles’ Flagship Business isUnder Scrutiny,” The Wall Street Journal, June 29,2000, p. A21.
Anvari, M., “Efficient Scheduling of Cross-BorderCash Transfers,” Financial Management, Summer1986, pp. 40–9.
Bokos, W. J. and A. P. Clinkard, “MultilateralNetting,” Journal of Cash Management, June/July1983, pp. 24–34.
Cotner, J. and N. Seitz, “A Simplified Approach toShort-Term International Diversification,” Finan-cial Review, May 1987, pp. 249–66.
Kim, S. H., M. Rowland, and S. H. Kim, “WorkingCapital Practices by Japanese Manufacturers in
the US,” Financial Practice and Education,Spring/Summer 1992, pp. 89–92.
Melvin, M., International Money and Finance,Boston, MA: Pearson Addison-Wesley, 2004.
Ricci, C. W. and G. Morrison, “InternationalWorking Capital Practice of the Fortune 200,”Financial Practice and Education, Fall/Winter1996, pp. 7–20.
Waszkowski, H., “New Cash Pooling Systems CutTransaction Fees, Optimize Use of Excess Cash,”Corporate Cashflow, Dec. 1995, pp. 12–19.
Case Problem 15: Navistar International’s Netting System
Navistar International Corp. was formed in a reorganization of International Harvester in 1987,the farm and equipment manufacturer. Today, Navistar manufactures and markets medium-and heavy-duty trucks, school buses, and mid-range diesel engines in North America andselected export markets. The company’s products, parts, and services are sold through ninedistribution centers, 16 used truck centers, and a network of 1,000 dealer outlets in the USA,Canada, Brazil, Mexico, and 75 other countries. Navistar also provides financing for its cus-tomers and distributors, principally through its wholly owned subsidiary, Navistar Financial Corporation.
During a dismal stretch from the late 1980s through the early 1990s, Navistar was the indus-try’s underachiever. In 1995, however, new Navistar CEO Horne had created a “culture of enti-tlement” that made the company a sluggish competitor. As part of his effort to energizeNavistar, he has introduced a number of top-level managers from other companies into thetruckmaker’s historically insular executive suite. With the new management team in place anda solid stream of cash from strengthening industry conditions, Navistar has achieved signifi-cant productivity increases at its existing plants, built new facilities, and revitalized the once-stable product line. These actions along with its unique netting system have enabled Navistarto improve its financial performance significantly in recent years (see figure 15.2).
Navistar’s netting system depends on a currency clearing center located in Switzerland. Thenetting system works on a monthly cycle. By the 15th day of each month, all participatingsubsidiaries send information to the currency clearing center on payables and receivables exist-

396 INTERNATIONAL WORKING CAPITAL MANAGEMENT
ing at that time in local currencies. The clearing center converts all amounts into dollar termsat the current spot exchange rate and sends information to those subsidiaries with net payableson how much they owe and to whom. These paying subsidiaries are responsible for inform-ing the net receivers of funds and for obtaining and delivering the foreign exchange. Settle-ment is on the 25th day of the month and the funds are purchased 2 days in advance, so thatthey are received on the designated day. Any difference between the exchange rate used bythe Swiss center on the 15th and the rate prevailing for settlement on the 25th gives rise toforeign-exchange gains or losses, and these are attributed to the subsidiary.
Navistar used this original clearing system for intracompany transactions and did not usethe system for its transactions with independent companies. After a decade with this system,the company introduced a scheme for foreign-exchange settlements for payments to outsidecompanies. There are two different dates, the 10th and 25th, on which all foreign exchangeis purchased by and transferred from the Swiss center. The payment needs are sent electron-ically to the center from the subsidiary more than 2 days before the settlement date. Then thecenter nets the amounts of each currency in order to make the minimum number of foreign-
1996
7.1%
14.7%
38.9%
42.2%
1997 1998 1999
Year
Return on equity
1996
$65
$150
$299
$544
1997 1998 1999
Year
Net income ($ millions)
1996
$5,754
$6,371$7,885
$8,647
1997 1998 1999
Year
Sales and revenues ($ millions)
Figure 15.2 The recent financial performance of Navistar InternationalSource: www.navistar.com; accessed July 7, 2000.

CASE PROBLEM 15 397
exchange transactions. The subsidiary, which owes the foreign exchange, settles with the clear-ing center by the appropriate settlement date. This netting system can cut the total numberof transactions with outsider companies in half.
The use of interdivisional leading and lagging makes the cash management system evenmore flexible. If a subsidiary is a net payer, it may delay or drag payment for up to 2 monthswhile compensating the net receiver at the prevailing interest rate. Net receivers of funds may,at their discretion, make funds available to other subsidiaries at an appropriate interest rate. Inthis way, the Swiss clearing center serves to bring different subsidiaries together so that theycan reduce outside borrowing. The netting with leading and lagging has allowed the companyto eliminate intracompany floats and reduce the number of transactions by 80 percent.
Case Questions
1 Why did Navistar choose Switzerland as its clearing center for the company’s nettingsystem?
2 What are the direct cost savings of Navistar’s netting system?3 What are the benefits derived from Navistar’s netting system in addition to the direct cost
savings discussed in question 2?4 Assume that Navistar hired you as a consultant for its working capital management. How
would you advise the company when it faces the following conditions: absence of forwardmarkets, high transaction costs, high political risk, liquidity needs by subsidiaries, and hightaxes.
5 Major international banks provide a variety of working capital and cash management services for multinational companies. Use the website of the Bank of America,www.bankamerica.com/, and the website of the Bank of Montreal, www.bmo.com/, toassess their multinational cash management services.
Sources: Navistar International Annual Report, various issues; M. D. Levi, International Finance, New York:McGraw-Hill, 1996, pp. 427–8; and J. P. Miller, “Navistar Gains Spotlight Amid Volvo’s Rumored Interest,”The Wall Street Journal, Mar. 10, 1999, p. B4.

Opening Case 16 : LG Group Shows how Korea Inc. Might Restructure
Amid a spate of corporate scandals that questioned the durability of South Korea’sreforms for the post-Asian financial crisis era, the LG Group has completed a trans-formation which could prove to be a test case for one of the country’s biggest chal-lenges – restructuring big business. LG is the country’s second-largest chaebol, orfamily-owned conglomerate, with assets of $49.5 billion and businesses ranging fromelectronics to financial services. The company dismantled its complex web of cross-shareholdings and reorganized most of its affiliates under a holding company, the LGCorp. “The greatest corporate action in Korea so far is LG Group’s restructuring to aholding company,” stated Wonki Lee, the head of equity research at Merrill Lynch inSeoul.
Chaebols prospered by forming intricate financial and business ties among groupcompanies – profiting together and often bailing each other out during economic distress. In the process, they took Korea’s economy from postwar devastation to the world’s 12th-largest. Nevertheless, the Asian financial crisis of 1997–8 exposedchaebol mismanagement and corruption. Since then, they have struggled to solvethese problems and polish a tarnished image so that they could compete more effec-tively on a global stage. The LG Group began its reincarnation by improving its finan-cial profile. LG merged 15 companies into other affiliates, shed five noncorebusinesses, listed 20 more, attracted foreign investors, and placed 34 of its 51 affili-ates under the LG Corp. umbrella.
The restructuring also clarified how much of the group was controlled by the found-ing Koo and Huh families, whose current patriarchs are Koo Bon Moo and Huh Chang
CHAPTER 16
International PortfolioInvestment

OPENING CASE 16 399
Soo. Together, they once controlled the entire conglomerate through small holdingsin various affiliates. Through sales, equity swaps, and other deals, those stakes havebeen consolidated in their 59 percent LG Corp. stake. The holding company – whoseearnings come solely from dividends and LG brand usage fees – sets group strategy,oversees unit management, and promotes the LG brand globally. The holdingcompany aligns its interests with those of affiliate shareholders in terms of businessstrategy, financial status, and cash flows. Previously, the founders exercised unchal-lenged control over the entire conglomerate; now, the holding company has legal legitimacy and must act in a rational, accountable way, thus permitting unit independence.
The major purpose of this new structure is to increase corporate governance andtransparency. The increased transparency is usually rewarded by the markets, with“good disclosure” stocks trading at higher valuation than those of their peers.Although it is difficult to isolate the effect of corporate openness on an overall shareprice, compelling circumstantial evidence shows that the more information a companyreleases, the better. Apparently, investors seem to believe that LG’s transformation hasimproved corporate governance and created transparency at what was once animpenetrable tangle of interlocking companies. As shown in figure 16.1, LG affiliateshares have soared since LG launched its structure in March 2003.
To increase competitiveness and management efficiency by focusing on core busi-nesses, the Board of LG Corp. voted to divide the company into LG Group and GS
33.4%
142%
TOTAL MARKET CAPOF ALL LG COMPANIES
SINCE MARCH 1
+99%
+54%
+49%
+44%
+43%
+30%
Source: LG Corp.
All for One, and One for AllThe shares of LG Corp. affiliates have risen sharply since the March 1, 2003, announcementof the chaebol's holding-company structure.
COMPANY INCREASE IN SHARE PRICE THROUGH SEPT. 5
LG Life Sciences
LG Micron
LG International
LG Electronics
LG Engineering &Construction
LG Cable
LG Chem
Figure 16.1 All for one, and one for all
Source: The Wall Street Journal, Sept. 8, 2003, p. A10.

In 1990, two American finance professors – Harry Markowitz (1959) and William Sharpe (1964)– received the Nobel Prize in economic science because of their contribution to portfolio theory.A highly respectable mean-variance model developed by Markowitz and Sharpe employs twobasic measures: an index of expected return (mean) and an index of risk (variance or standarddeviation). The expected value for a portfolio of securities is simply the sum of the individualreturns for the securities that make up the portfolio. The standard deviation as a measure of riskfor the portfolio is not easily measured. In many business situations, risks of individual securi-ties tend to offset each other. Thus, with successful diversification, the investor may select a port-folio having less risk than the sum of the risks of individual securities.
There was a time when investment opportunities stopped at national borders. However, todaywe assume a unified and integrated world capital market when analyzing international financeand macroeconomics. Indeed, recent national policy discussions rely on this premise stimulatedby global integration of capital markets. Thus, many countries have internationalized their capitalmarkets since 1980. National capital markets have changed to an integrated global capital market,often followed by widespread international multiple listings of securities. An economic revolu-tion is taking place in many parts of the world as countries deregulate financial markets.
Diversification among risky securities in a particular country reduces risk. Yet this potentialis rather limited, because most companies usually earn more during booms and less during reces-sions, which suggests that international portfolio diversification reduces additional risk. In fact,gains from such diversification have become so commonplace in recent years that additionalempirical studies are not needed to confirm the benefits of international diversification. Still, thischapter describes key diversification terminology, the gains from international diversification, andmethods of international diversification.
16.1 Key Terminology
In the real world, no company or individual invests everything in a single asset. Accordingly, itis useful to consider the risk and return of a particular asset in conjunction with its counterpartsin existing assets or new investment opportunities. Portfolio theory deals with selecting invest-ment projects that minimize risk for a given rate of return or that maximize the rate of returnfor a given degree of risk.
400 INTERNATIONAL PORTFOLIO INVESTMENT
Holdings on April 13, 2004. Company shareholders approved the plan at a specialmeeting on May 28, thereby establishing GS Holdings as a new company. LG Grouptook manufacturing units, while GS Holdings took logistics and service units. GS Hold-ings started its business with Huh Chang Soo as its first Chairman on July 1, 2004.
Sources: K. Song, “LG Group Shows how Korea Inc. Might Restructure,” The Wall Street Journal,Sept. 12, 2003, p. A10; and W. H. Lee and S. H. Park, “LG Plans Split to Establish 2 HoldingFirms,” JoongAng Daily, Apr. 14, 2004, p. 3.

16.1.1 Risk analysis: standard deviation
Two conflicts from investment in assets are that: (1) very few financial variables are known withcertainty and (2) investors are basically risk averters. Risk is variability in the return generatedby investment in an asset. For example, investors buy common stock in the hope of receivinggrowing dividends and an appreciating stock price. However, neither the dividend stream norprice appreciation is certain or guaranteed. Thus, investors evaluate risk before they invest incommon stock.
Risk may be measured by the dispersion of alternative returns around the average return. Stan-dard deviation, being a measure of dispersion, fits nicely as a technique for measuring risk. Todetermine the standard deviation of, say, monthly returns for an asset, we may use the followingformula:
where s is the standard deviation; R is the monthly returns; and R– is the average monthly return.To illustrate, assume that the monthly returns of a common stock are 0.40, 0.50, and 0.60 for3 months. The average monthly return is 0.50, and the standard deviation is 0.10.
Standard deviation is an absolute measure of dispersion. If returns are expressed in dollars,the standard deviation shows the amount of risk per dollar of average return. A relative measureof dispersion is the coefficient of variation, which is the standard deviation divided by theaverage return. In general, the coefficient of variation measures risk better than the standard devi-ation for assets whose returns are stated in dollars. Standard deviation should be used to measurerisk only for those assets whose returns are stated as percentages.
16.1.2 The capital asset pricing model
The capital asset pricing model (CAPM) assumes that the total risk of a security consists ofsystematic (undiversifiable) risk and unsystematic (diversifiable) risk. Systematic risk reflectsoverall market risk – risk that is common to all securities. Common causes of systematic riskinclude changes in the overall economy, tax reform by Congress, and change in national energy supply. Because it is common to all stocks, systematic risk cannot be eliminated by diversification.
Unsystematic risk is unique to a particular company. Some causes of unsystematic riskinclude wildcat strikes affecting only that company, new competitors producing essentially thesame product, and technological breakthroughs making an existing product obsolete. Because itis unique to a particular stock, unsystematic risk can be eliminated by diversification.
Within an international context, systematic risk relates to such global events as worldwiderecessions, world wars, and changes in world energy supply. Unsystematic risk relates to suchnational events as expropriation, currency controls, inflation, and exchange rate changes.
If a market is in equilibrium, the expected rate of return on an individual security (j) is statedas follows:
s =-( )
-Â R R
n
2
1
KEY TERMINOLOGY 401

(16.2)
where Rj is the expected rate of return on security j; Rf is the riskless rate of interest; Rm is theexpected rate of return on the market portfolio, which is a group of risky securities, such asStandard & Poor’s 500 Stocks or the London Financial Times Stock Exchange 100; and bj is thesystematic risk of security j. This equation, known as the security market line, consists of theriskless rate of interest (Rf) and a risk premium [(Rm - Rf)bj]. It is important to understand thatbeta - bj = [(Rj - Rf)/(Rm - Rf)] – is an index of volatility in the excess return of one securityrelative to that of a market portfolio.
AGGRESSIVE VERSUS DEFENSIVE STOCKS Because beta reflects the systematic risk of a stockor a mutual fund relative to that of the market as a whole, the market index is assigned a betaof 1. Beta may be used to classify stocks into two broad categories: aggressive and defensive.Aggressive stocks are those stocks that have betas greater than 1. Their returns rise (fall) morethan the market index rises (falls). Defensive stocks are those stocks that have betas less than 1.Their returns fluctuate less than the market index. Those stocks with betas equal to 1 are frequently called neutral stocks.
Table 16.1 shows a sample of betas for 10 stocks: five aggressive stocks (airline companies)and five defensive stocks (food processing companies). Food processing companies have verystable earnings streams because their products are necessities. Swings in the earnings and stockreturns of food processing companies are modest relative to the earnings and returns of mostcompanies in the economy. Thus, food processing companies have a very low level of systematicrisk and low betas.
At the other extreme, airline revenues are closely tied to passenger miles, which are in turnvery sensitive to changes in economic activity. This basic variability in revenues is amplified byhigh operating and financial leverage. These factors cause airline earnings and returns to producewide variations relative to swings in the earnings and returns of most firms in the economy.Hence, airline companies have high betas.
Is beta one of the best ways to predict how your mutual fund or stock might perform in amarket downturn or upturn? Table 16.2 shows average returns for US stock funds during thesharp decline from the peak on July 17, 1998, through August 31, 1998. In this particular down-turn caused by the Asian financial crisis, beta has done a pretty good job of predicting whichfunds would be hit hardest or the least hard. For example, the 25 percent of US stock funds withthe highest beta declined 27.68 percent in the period from July 17 through August 31. On theother hand, the 25 percent of US stock funds with the lowest beta lost only 17.77 percent duringthe same period. In that period, Standard & Poor’s 500 Stocks lost 19.13 percent.
R R R Rj f m f j= + -( )b
402 INTERNATIONAL PORTFOLIO INVESTMENT
Table 16.1 Betas for selected firms in two industries
Airline companies Beta Food processing companies Beta
American Airlines 2.52 Campbell Soups 0.44United Airlines 1.92 H. J. Heinz 0.30Northwest 1.88 Kraft Foods 0.30Delta Airlines 1.70 Nabisco 0.28British Airways 1.70 Kellogg’s 0.03
Source: www.dbc.com, Jan. 29, 2004.

In a portfolio context, the security market line constitutes various portfolios that combine ariskless security and a portfolio of risky securities. The general decision rule for accepting a riskyproject (j), can be stated as follows:
(16.3)
This decision rule implies that to accept security j, its expected return must exceed the investor’shurdle rate, which is the sum of the riskless rate of interest plus a risk premium for the riskinessof the security. Figure 16.2 shows the decision rule in general terms: accept all securities that plotabove the security market line and reject all securities that plot below the security market line.
R R R Rj f m f j> + -( )b
KEY TERMINOLOGY 403
Table 16.2 Average returns for US stock funds from July 17,1998, to August 31, 1998
Average Number of fundsBeta return (%) in group
Greater than 1.09 -27.68 461Between 1.08 and 0.99 -20.93 486Below 0.86 -17.77 434
Source: The Wall Street Journal, Oct. 15, 1998, p. R17.
Security market line
Return
Region of acceptance
Region of rejection
Risk
Rf
0
Figure 16.2 The security market line

16.1.3 Correlation coefficients
The portfolio effect is defined as the extent to which unsystematic risks of individual securitiestend to offset each other. The portfolio effect, or portfolio standard deviation, depends not onlyon the standard deviation of each security but also on the degree of correlation between two ormore securities. The correlation coefficient measures the degree of correlation between two secu-rities and varies from zero (no correlation, or independence) to 1.0 (perfect correlation).
A correlation coefficient of -1.0 means that the two sets of returns for two securities tend tomove in exactly opposite directions. Assume that a boom occurs. Security A is expected to earn$100, while security B is expected to earn nothing. In contrast, if a recession occurs, security Awould earn nothing, whereas security B would earn $100. Consequently, these two securities areperfectly negatively correlated. Diversification can totally eliminate unsystematic risk when twosecurities are perfectly negatively correlated.
A correlation coefficient of +1.0 means that two sets of returns for two securities tend to movein exactly the same direction. Suppose that a boom occurs. Securities X and Y would earn anequal amount of $200. But if a recession occurs, they would yield an equal amount of $50. Thenwe can say that these two securities are perfectly positively correlated. In this case, diversificationwould not reduce unsystematic risk at all.
A correlation coefficient of zero means that the two sets of returns for two securities are uncor-related or independent of each other. In this scenario, diversification would reduce unsystematicrisk considerably.
Because the degree of correlation among securities depends on economic factors, most pairsof domestic securities have a correlation coefficient of between 0 and +1.0. Most stock prices arelikely to be high during a boom, while they are likely to be low during a recession. But differ-ent product lines and different geographical markets tend to have a relatively low degree of cor-relation to each other. Thus, international diversification may eliminate unsystematic risk andreduce domestic systematic risk considerably.
16.1.4 Portfolio return and risk
Portfolio return is the expected rate of return on a portfolio of securities. The expected portfo-lio return is simply a weighted average of the expected returns of the securities that make up theportfolio. One way to measure the benefits of international diversification is to consider theexpected return and standard deviation of return for a portfolio that consists of US and foreignportfolios. Such a portfolio return may be computed as follows:
(16.4)
where Rp is the portfolio return, Xus is the percentage of funds invested in the US portfolio, Rus
is the expected return on the US portfolio, Xfn is the percentage of funds invested in the foreignportfolio, and Rfn is the expected return on the foreign portfolio.
The standard deviation of a portfolio measures the riskiness of the portfolio. The standarddeviation of a two-security portfolio can be calculated as follows:
(16.5)s s s s s sp us us fn fn us fn us fn us fnX X X X= + +2 2 2 2 2 ,
R X R X Rp us us fn fn= +
404 INTERNATIONAL PORTFOLIO INVESTMENT

where sp is the portfolio standard deviation, sus is the standard deviation of the US portfolio,sfn is the standard deviation of the foreign portfolio, and sus,fn is the correlation coefficientbetween the returns on the US and foreign portfolios.
KEY TERMINOLOGY 405
Example 16.1
Assume that an international portfolio consisting of a US portfolio and a foreign portfoliocalls for a total investment of $10 million. The US portfolio requires an investment of $4million and the foreign portfolio requires an investment of $6 million. The expected returnsare 8 percent on the US portfolio and 12 percent on the foreign portfolio. The standarddeviations are 3.17 percent for the US portfolio and 3.17 percent for the foreign portfolio.
Because the percentage of the international portfolio invested in the US portfolio is 40percent and that of the foreign portfolio is 60 percent, we can use equation 16.4 to computethe return on the international portfolio:
It is important to recognize that the return on the international portfolio is the same regard-less of correlation of returns for the US and foreign portfolios. However, the degree of theinternational portfolio risk varies according to interportfolio or intersecurity return behavior.Intersecurity returns can be perfectly negatively correlated, statistically independent, or per-fectly positively correlated.
Case A: perfectly negative correlationIf the US and foreign portfolios are perfectly negatively correlated, their correlation coeffi-cient becomes -1. The return on the international portfolio and its standard deviation (useequation 16.5) are as follows:
Because the standard deviation of US and foreign portfolios are 3.17 percent each, theirweighted average is 3.17 percent (0.0317 ¥ 0.40 + 0.0317 ¥ 0.60). Thus, the standard devi-ation of the international portfolio is only 20 percent of the weighted average of the twoindividual standard deviations (0.0063/0.0317). If a considerable number of perfectly negatively correlated projects are available, risk can be almost entirely diversified away.However, perfect negative correlation is seldom found in the real world.
Rp
p
=
= ( ) ( ) + ( ) ( ) + ( )( ) -( )( )( )[ ]=
10 4
0 4 0 0317 0 6 0 0317 2 0 4 0 6 1 0 0317 0 0317
0 63
2 2 2 2 1 2
. %
. . . . . . . .
. %
s
Rp = ( ) + ( ) =0 4 0 08 0 6 0 12 10 4. . . . . %

16.1.5 The efficient frontier
An efficient portfolio is a portfolio that incurs the smallest risk for a given level of return and/orprovides the highest rate of return for a given level of risk. Suppose that A, B, and C are threeexclusive portfolios that require the same amount of investment, say, $10 million. They have anequal rate of return, but their respective standard deviations are different. Figure 16.3 shows thatA incurs the smallest risk for a given level of return; A is called the efficient portfolio. By thesame token, assume that W, X, and Y are three exclusive portfolios that require the same amountof money, say, $10 million. They have the same amount of risk, but their rates of return are dif-ferent. As shown in figure 16.3, we notice that W provides the highest rate of return for a givenlevel of risk; W is also called the efficient portfolio. If we compute more points such as A andW, we may obtain curve AW by connecting such points. This curve is known as the efficientfrontier. Portfolios B, C, X, and Y are inefficient because some other portfolios could give eithera lower risk for the same rate of return or a higher return for the same degree of risk.
There are numerous efficient portfolios along the efficient frontier. An efficient frontier doesnot tell us which portfolio to select, but shows a collection of portfolios that minimize risk forany expected return or that maximize the expected return for any degree of risk. The objective
406 INTERNATIONAL PORTFOLIO INVESTMENT
Case B: statistical independenceIf these two portfolios are statistically independent, the correlation coefficient between thetwo is 0. The return of the international portfolio and its standard deviation are as follows:
In this case, the standard deviation of the international portfolio is 72 percent of thisweighted average (0.0229/0.0317). This means that international diversification can reducerisk significantly if a considerable number of statistically independent securities are available.
Case C: perfectly positive correlationIf the two portfolios are perfectly positively correlated with each other, their correlation coef-ficient becomes 1. The portfolio return and its standard deviation are as follows:
The standard deviation of the international portfolio equals the weighted average of thetwo individual standard deviations. Thus, if all alternative investments are perfectly posi-tively correlated, diversification would not reduce risk at all.
Rp
p
=
= ( ) ( ) + ( ) ( ) + ( )( )( )( )( )[ ]=
10 4
0 4 0 0317 0 6 0 0317 2 0 4 0 6 1 0 0317 0 0317
3 17
2 2 2 2 1 2
. %
. . . . . . . .
. %
s
Rp
p
=
= ( ) ( ) + ( ) ( ) + ( )( )( )( )( )[ ]=
10 4
0 4 0 0317 0 6 0 0317 2 0 4 0 6 0 0 0317 0 0317
2 29
2 2 2 2 1 2
. %
. . . . . . . .
. %
s

of the investor is to choose the optimal portfolio among those on the efficient frontier. Thus theefficient frontier is necessary but not sufficient for selecting the optimal portfolio. Given an effi-cient frontier, the choice of the optimal portfolio depends on the security market line.
If investors want to select the optimal portfolio from portfolios on a particular efficient fron-tier, they should land on the highest security market line. This optimal portfolio is found at thetangency point between the efficient frontier and the security market line. Tangency point M infigure 16.4 marks the highest security market line that investors can obtain with funds availablefor investment. An optimum portfolio is the portfolio that has, among all possible portfolios,the largest ratio of expected return to risk. Once investors identify the optimal portfolio, theywill allocate funds between risky assets and risk-free assets to achieve a desired combination ofrisk and return.
16.2 The Benefits of International Diversification
A rather convincing body of literature holds that internationally diversified portfolios are betterthan domestically diversified portfolios because they provide higher risk-adjusted returns to theirholders. This section, based on several empirical studies, discusses: (1) arguments for interna-tional diversification, (2) risk–return characteristics of national capital markets, and (3) selectionof optimal international portfolios.
THE BENEFITS OF INTERNATIONAL DIVERSIFICATION 407
A B C
W
X
Y
Return
Risk0
Figure 16.3 An efficient frontier

16.2.1 Risk diversification through international investment
Table 16.3 provides correlations of stock market returns for 10 major countries known as theGroup of Ten, from 1980 to 2001. First, the intracountry correlation is 1 for every country. Onthe other hand, the intercountry correlation is much less than 1 for every pair of any two coun-tries. In other words, stock market returns have lower positive correlations across countries thanwithin a country. Second, member countries of the European Union – France, Italy, Germany,the Netherlands, and the United Kingdom – have relatively high correlations because their cur-rencies and economies are highly interrelated. Third, the intercountry correlation for the UnitedStates ranges from as high as 0.74 with Canada to as low as 0.29 with Japan. The extremely highcorrelation between the USA and Canada comes as no surprise, because these two neighboringcountries have close business linkages in terms of trade, investment, and other financial activi-ties. The USA and Japan have the extremely low correlation because they are situated in differ-ent continents and their economic policies are different.
Of course, a reason for low intercountry correlations is that much of the stock market risk inan individual country is unsystematic and so can be eliminated by international diversification.Low international correlations may reflect different geographical locations, independent eco-nomic policies, different endowments of natural resources, and cultural differences. In summary,these results imply that international diversification into geographically and economically diver-
408 INTERNATIONAL PORTFOLIO INVESTMENT
Return
Risk0
M
Figure 16.4 An optimal portfolio

gent countries may significantly reduce the risk of portfolio returns. According to figure 16.5,drawn by Solnik (1999), that is indeed the case.
Figure 16.5 shows the total risk of domestically and internationally diversified portfolios as afunction of the number of securities held. In this figure, 100 percent of risk as measured by stan-dard deviation represents the typical risk of a single US security. As an investor increases the
THE BENEFITS OF INTERNATIONAL DIVERSIFICATION 409
Table 16.3 Correlations of major stock market returns from 1980 to 2001
AU CA FR GE IT JA NE SW UK US
Australia 1.00Canada 0.60 1.00France 0.37 0.46 1.00Germany 0.34 0.42 0.69 1.00Italy 0.25 0.35 0.50 0.43 1.00Japan 0.33 0.33 0.41 0.33 0.37 1.00The Netherlands 0.44 0.58 0.66 0.71 0.44 0.42 1.00Sweden 0.44 0.49 0.49 0.57 0.44 0.39 0.54 1.00UK 0.54 0.57 0.57 0.50 0.38 0.42 0.70 0.51 1.00USA 0.47 0.74 0.50 0.45 0.31 0.29 0.62 0.49 0.58 1.00
Source: Monthly issues of Morgan Stanley’s Capital International Perspectives.
Risk (%)
100
80
60
40
27
12
1 10 20 30 40 50
Number of stocks
US stocks
International stocks
Figure 16.5 Gains from international diversification
Source: B. Solnik, International Investments, Reading, MA: Addison-Wesley, 1999, p. 126.

number of securities in a portfolio, the portfolio’s risk declines rapidly at first, then slowlyapproaches the systematic risk of the market expressed in the broken line. However, the addi-tion of more securities beyond 15 or 20 reduces risk very little. The remaining risk – the partnot affected by holding more US stocks – is called market risk, which is also known as system-atic risk. Is there a way to lower portfolio risk even further? Only if we can lower the marketrisk. One way to lower the market risk is to hold stocks not traded on US stock exchanges.
Figure 16.5 illustrates a number of striking facts. First, the risk of a well-diversified US port-folio is only 27 percent of the typical risk of a single security. This relationship indicates that 73percent of the risk associated with investing in a single security is diversifiable in a fully diversi-fied portfolio. Second, the addition of foreign stocks to a purely domestic portfolio reduces riskfaster, as shown in the bottom curve. Third, a fully diversified international portfolio is less thanhalf as risky as a fully diversified US portfolio. The addition of foreign stocks to a US portfolioreduces the US market risk even further, because foreign economies generally do not move one-for-one with the US economy. When the US economy is in a recession, foreign economies mightbe in expansion, and vice versa. This and other studies have established that security returns areless highly correlated internationally than domestically. This makes a strong case for internationaldiversification as a means of risk diversification.
It is important to note that a fully diversified portfolio or an efficient portfolio is one that haszero, or very little, unsystematic risk. As illustrated in figure 16.5, an efficient international port-folio cuts the systematic risk of an efficient domestic portfolio in half. Domestic systematic riskdeclines because international diversification offsets US-specific reactions to worldwide events.
16.2.2 Risk–return characteristics of capital markets
In the previous section, we discussed the benefits from diversifying international portfolios interms of risk reduction, but we ignored return, another important aspect of investment. Cer-tainly, investors simultaneously consider both risk and return in making investment decisions.In other words, they want to maximize expected return for a given amount of risk and minimizethe amount of risk for a given level of return. Consequently, we ought to examine the risk–returncharacteristics of stock markets.
To ascertain the gains from international diversification, Morgan Stanley constructed portfo-lios that began with a 100 percent US portfolio and then they made it increasingly more inter-national in increments of 10 percent. Switching from domestic to foreign investments wasimplemented by acquiring equally weighted portfolios of the 20 foreign indexes in Europe, Aus-tralia, and the Far East, using quarterly data for 71 years from 1926 to 1997. Figure 16.6 showsthe performance of these portfolios in terms of risk–return trade-offs. As the proportion of theportfolio invested abroad increased, the return increased; in addition, the risk decreased until theproportion of foreign equities reached 50 percent of the portfolio. In other words, Americaninvestors could have enjoyed higher returns and less risk if they had held a portfolio that con-tained up to 50 percent invested in foreign stocks.
16.2.3 The selection of an optimal portfolio
Before we discuss the selection of an optimal international portfolio, let us review the basicconcept of bonds and stocks. Bonds are less risky than stocks. The standard deviation of bond
410 INTERNATIONAL PORTFOLIO INVESTMENT

returns in any particular market is typically lower than the standard deviation of stock returnsin that market. Certainly, lower risk implies lower mean rates of return for bonds compared withstocks. Table 16.4 shows risk–return statistics for bonds and stocks in various markets from theviewpoint of a US investor. In terms of the mean-variance decision rule, both bonds and stockswere efficient investments in each market. With the exception of Germany, all the bond meansand standard deviations were lower than the corresponding stock statistics in each market.
Levy and Lerman (1988) compared the performance of various investment strategies for the13 industrial countries listed in table 16.4. The right-hand curve of figure 16.7 is the efficientfrontier when investors are restricted to stocks only. The left-hand curve is the efficient frontierwhen investors can buy both stocks and bonds. The middle curve is the efficient frontier wheninvestors are restricted to bonds only. M(bs), M(b), and M(s) represent the optimal internationalportfolios for stocks and bonds, bonds, and stocks, respectively.
Levy and Lerman’s study found several advantages of international bond and stock diversifi-cation. A US investor who diversified across world bond markets could have earned almost twiceas much as the mean rate of return on a US bond portfolio, having the same risk level. More-over, the US stock market dominated the US bond market in terms of risk-adjusted returns.However, internationally diversified bond portfolios outperformed internationally diversifiedstock portfolios. Finally, internationally diversified portfolios of stocks and bonds outperformedinternationally diversified portfolios of stocks only or bonds only.
Investment in US bonds is inefficient because, as shown in figure 16.7, its risk–return com-bination is deep inside the efficient frontier. The international bond portfolio M(b) in figure 16.7outperformed US bonds in terms of mean rate of return at the same risk level. More specifically,
THE BENEFITS OF INTERNATIONAL DIVERSIFICATION 411
12.0
11.5
11.0
10.5
10.0
9.5
9.0
13 14 15 16 17 18 19
Annualized standard deviation of returns (%)
Annualizedreturn (%)
100% foreign
60% foreign, 40% US
30% foreign, 70% US
100% US
Figure 16.6 Risk–return trade-offs of international portfolios, 1926–97
Source: Morgan Stanley Capital Investment.

US bonds had a risk level of 5.53 percent and a mean return level of 4.31 percent. At about thesame level of risk, the optimal international portfolio of bonds earned a mean return of about8.5 percent – about twice the US-only portfolio’s return. This was achieved by investing in aportfolio of German, Swedish, and Japanese bonds with small amounts in US and Spanish bonds.
Investment in US stocks is also inefficient because, according to figure 16.7, its risk–returncombination is to the right of the efficient frontier. The performance of the international stockportfolio, M(s), was better than that of US stocks. Point M(s) had a standard deviation of 14.84percent and a mean return of 15 percent. Compare this to the US stocks, whose standard devi-ation was 18.12 percent and whose mean rate of return was 10.23 percent. Consequently, USinvestors could have earned more from international stock portfolios than from US stock port-folios, and at a lower risk level. This was achieved by investing in a portfolio of German, Spanish,Japanese, and Canadian stocks with small amounts of Belgian and British stocks.
Figure 16.7 shows that the bond portfolios definitely outperformed the stock portfolios. Atevery level of mean return up to 11 percent, the bond portfolios had a lower risk level than cor-responding stock portfolios. However, the efficient bond frontier stops at a mean return level ofabout 11 percent, while the efficient stock frontier extends up to a mean return level of about19 percent. The upper bound represents investment in Japanese stocks, which had the highestrisk and return among all stocks. The higher range of risk–return combinations was not attain-able with bond portfolios. Still, the stock portfolios played an efficient role on their own becauseof their upper bound.
As given in figure 16.7, the efficient frontier of stocks and bonds combined dominated itscounterpart of either stocks by themselves or bonds by themselves. This means that internationalportfolios of stocks and bonds outperformed both stock portfolios and bond portfolios. Theoptimal international portfolio of stocks and bonds is obtained at point M(bs), where the effi-cient frontier of stocks and bonds and the security market line intersect with each other.
412 INTERNATIONAL PORTFOLIO INVESTMENT
Table 16.4 Dollar-adjusted rates of return and standard deviations
Bonds Stocks
Country Mean Standard deviation Mean Standard deviation
Belgium 8.11% 9.66% 10.14% 14.19%Denmark 6.99% 13.14% 11.37% 24.83%France 5.99% 12.62% 8.13% 21.96%Germany 10.64% 9.45% 10.10% 20.34%Italy 3.39% 13.73% 5.60% 27.89%The Netherlands 7.90% 8.28% 10.68% 18.24%Spain 5.17% 11.52% 10.35% 20.33%Sweden 6.41% 6.06% 9.70% 17.09%Switzerland 9.11% 12.68% 12.50% 23.48%UK 6.81% 15.30% 14.67% 34.40%Japan 11.19% 12.21% 19.03% 32.20%Canada 3.52% 6.44% 12.10% 17.89%USA 4.31% 5.53% 10.23% 18.12%
Source: H. Levy and Z. Lerman, “The Benefits of International Diversification in Bonds,” Financial AnalystsJournal, Sept./Oct. 1988, p. 57.

16.3 Methods of International Diversification
US investors try to obtain international diversification through one of the following methods:(1) international mutual funds, (2) purchases of American depository receipts (ADRs), (3) directpurchases of foreign securities, (4) hedge funds, and (5) investment in US multinational companies.
16.3.1 International mutual funds
Investors may purchase shares of an international mutual fund with a small minimum invest-ment, such as $1,000. Several brokerage firms, such as Merrill Lynch, Goldman Sachs, andFidelity, create and manage many families of international mutual funds. Mutual funds areperhaps the most important by-product of the portfolio theory developed by Markowitz andSharpe. Mutual funds are financial institutions that accept money from savers and then use thesefunds to buy a variety of securities. International mutual funds are portfolios of securities fromvarious countries.
METHODS OF INTERNATIONAL DIVERSIFICATION 413
20
15
10
5
00 5 10 15 20 25 30
Mean return(%)
Standard deviation (%)
Stocks and bonds
StocksStocksM(s)
M(b)M(bs) Japan US
Bonds
Bonds
USA
Figure 16.7 Efficient international portfolios
Source: H. Levy and Z. Lerman, “The Benefits of International Diversification in Bonds”, Finan-cial Analysts Journal, Sept./Oct. 1988, p. 62.

International mutual funds have several advantages over individual foreign securities. First,international mutual funds pool funds and thus reduce risk by diversification. Second, investorswould have to pay extra transaction and information costs if they attempted to buy foreign secu-rities directly in foreign markets. Third, international mutual fund investors circumvent manylegal and institutional barriers associated with direct portfolio investments in foreign markets.
There are two classes of international mutual funds: open-end and closed-end. Open-endmutual funds are funds whose total number of shares under management grows and shrinks asinvestors buy and sell the fund. They stand ready to issue and redeem shares at prices that reflectthe net-asset value of underlying foreign shares. Closed-end funds are funds where the amountof money under management is fixed. They issue a fixed number of shares against an initial capitaloffering and these shares then trade in secondary markets at prevailing market prices. These sharesare not redeemable at the underlying net-asset value of the underlying foreign shares. There areapproximately 300 US-based international mutual funds, which can be grouped into several fam-ilies of mutual funds from a US perspective:
1 Global funds invested in US and non-US securities.2 International funds invested in only non-US securities.3 Regional mutual funds invested in particular geographical areas.4 Country funds invested in single countries.
16.3.2 American depository receipts (ADRs)
Investors may purchase ADRs, which are traded on organized exchanges and/or in the over-the-counter markets. ADRs are securities distributed in the USA backed by foreign stock. Exchangesaround the world have listing requirements before they accept a firm’s shares for trading. Rulesfor listing vary markedly from country to country, with US requirements being among the mostrestrictive. Banks have created ADRs so that foreign companies can avoid these restrictions ontrading in the USA. The total number of ADRs listed on major US stock exchanges increasedfrom 176 in 1990 to 550 in 2003. In addition, there are approximately 1,000 private ADRs,which are not listed and are harder for an individual to invest in. Figure 16.8 shows that ADRshave become a convenient investment vehicle on foreign securities in recent years.
American depository receipts represent the ownership of underlying foreign stocks that areheld in custody by the bank that issues them. In other words, the bank holds the foreign sharesand trades ADRs that represent title to those shares held on deposit. In effect, the bank ownsthe shares and trades claims against those shares. ADR investors are entitled to all the privilegesof stock ownership including dividend payments. The bank, the issuer of ADRs, usually collectsthe dividends in local currency and transfers the dollar-equivalent to the ADR investors. Today,ADRs have become so popular that companies have begun to issue global depository receipts.Global depository receipts are similar instruments to ADRs, but can be simultaneously issuedon stock exchanges all over the world.
16.3.3 Direct purchases of foreign securities
Investors may buy foreign securities listed on foreign exchanges through stockbrokers for inclu-sion in their portfolios. This method of international diversification, however, is not recom-
414 INTERNATIONAL PORTFOLIO INVESTMENT
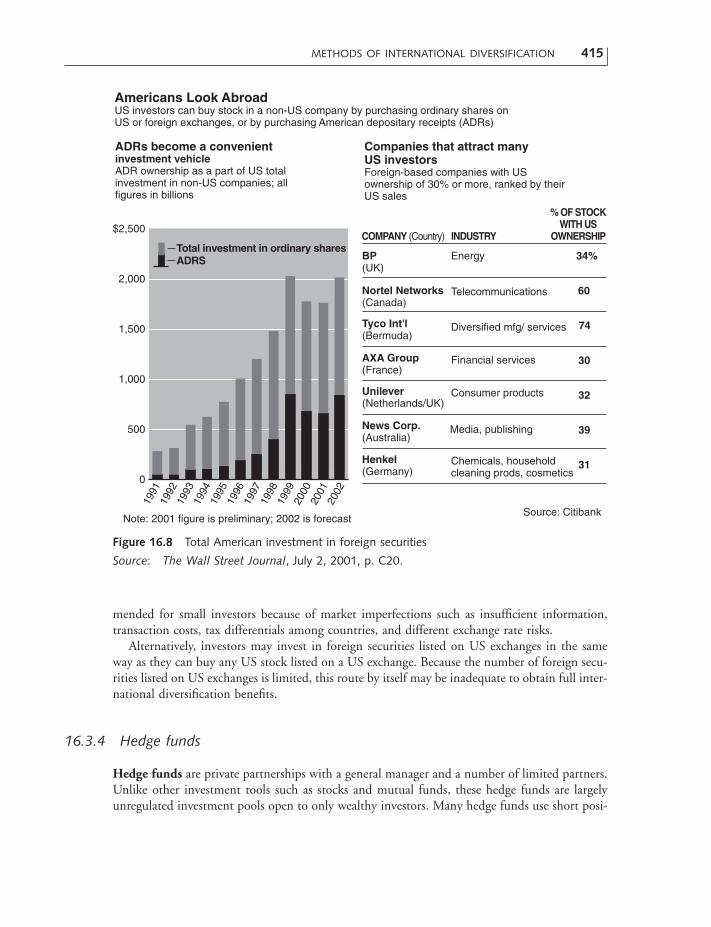
mended for small investors because of market imperfections such as insufficient information,transaction costs, tax differentials among countries, and different exchange rate risks.
Alternatively, investors may invest in foreign securities listed on US exchanges in the sameway as they can buy any US stock listed on a US exchange. Because the number of foreign secu-rities listed on US exchanges is limited, this route by itself may be inadequate to obtain full inter-national diversification benefits.
16.3.4 Hedge funds
Hedge funds are private partnerships with a general manager and a number of limited partners.Unlike other investment tools such as stocks and mutual funds, these hedge funds are largelyunregulated investment pools open to only wealthy investors. Many hedge funds use short posi-
METHODS OF INTERNATIONAL DIVERSIFICATION 415
Americans Look AbroadUS investors can buy stock in a non-US company by purchasing ordinary shares onUS or foreign exchanges, or by purchasing American depositary receipts (ADRs)
ADRs become a convenientinvestment vehicleADR ownership as a part of US total investment in non-US companies; allfigures in billions
Companies that attract manyUS investorsForeign-based companies with USownership of 30% or more, ranked by theirUS sales
$2,500
2,000
Total investment in ordinary shares
1,500
1,000
500
0
1991
1992
1993
1994
1995
1996
1997
1998
1999
2000
2001
2002
ADRS
COMPANY (Country) INDUSTRY
% OF STOCKWITH US
OWNERSHIP
34%
60
74
30
32
39
31
Energy
Telecommunications
Diversified mfg/ services
Financial services
Consumer products
Media, publishing
Chemicals, householdcleaning prods, cosmetics
BP(UK)
Nortel Networks(Canada)
Tyco Int'l(Bermuda)
AXA Group(France)
Unilever(Netherlands/UK)
News Corp.(Australia)
Henkel(Germany)
Source: CitibankNote: 2001 figure is preliminary; 2002 is forecast
Figure 16.8 Total American investment in foreign securities
Source: The Wall Street Journal, July 2, 2001, p. C20.

tions, or bets that prices will fall, to offset their securities holdings. Some bet on cross-bordermergers and acquisitions, convertible securities, or foreign currencies. They frequently use bor-rowed money in an effort to boost returns. Hedge funds have grown in popularity in recent years,both because of their oversized returns and their aura of exclusivity.
Figure 16.9 shows that the number of hedge funds operating worldwide by the end of 2003had reached 6,500, with just under $75 billion in net new assets invested in hedge funds duringthe year. Most hedge funds are small, with less than $100 million in invested capital. A few dozenhedge funds have a capital base larger than $1 billion. Most of these funds were reported as beingbased in the USA.
According to Tremont Capital’s TASS Research hedge-fund tracking division, $72.2 billiongushed into hedge funds in 2003, more than twice that in the next highest year. The trend hascontinued in 2004 and TASS estimated that there were 7,700 funds as of July 2004, with $800billion in assets under management.
Hedge funds have recently become the target of frequent criticism in the financial press,because of the lucrative compensation packages paid to management, the fact that they are unreg-ulated, and the huge speculative positions taken by some hedge funds (see Global Finance inAction 16.1). For these reasons, experts suggest that an investor should ask the following ques-tions before putting money into a hedge fund: First, how does the investment strategy work?Second, what are the risks? Third, what market conditions favor the manager’s strategy – andwhich ones work against it? Fourth, what is the manager’s experience and track record? Fifth,how long do I have to wait before I can withdraw my money? Sixth, how are the manager andthe consultant helping select the hedge fund compensated?
416 INTERNATIONAL PORTFOLIO INVESTMENT
The Money Pours InA look at the growing number of hedge funds and the amount of money invested; all figures are estimates
7,500
4,500
1,500
6,000
3,000
0
$75
60
45
15
30
0
Source: TASS Research19
9419
9519
9619
9719
9819
9920
0020
0120
0220
0319
9419
9519
9619
9719
9819
9920
0020
0120
0220
03
Funds of funds
Number of funds
Single-manager funds
Net new assetsinvested in hedgefunds, in billions
Figure 16.9 Hedge funds: the number of funds and the net new assets
Source: The Wall Street Journal, July 11, 2004, p. C1.

METHODS OF INTERNATIONAL DIVERSIFICATION 417
Global Finance in Action 16.1The Near Collapse of a Prominent Hedge Fund
In late September 1998, a group of large financial institutions urgently invested $3.5billion in Long-Term Capital Management (LTCM), a prominent hedge fund, toprevent its imminent collapse. These firms – Goldman Sachs, Merrill Lynch, MorganStanley Dean Witter, J. P. Morgan, Chase Manhattan, United Bank of Switzerland,and several others – had been encouraged to undertake the rescue by the FederalReserve Bank of New York, which feared that a sudden failure of the fund could sig-nificantly disrupt world financial markets. The label “hedge fund” refers to invest-ment companies that are unregulated because they restrict participation to a relativelysmall number of wealthy investors. The amount invested in hedge funds reachedabout $300 billion by mid-1998.
The LTCM was formed in 1994, by a former Salomon vice chairman John Meir-wellen, two Nobel laureates Robert Merton and Myron Scholes, former students ofProfessors Merton and Scholes, and several other prominent investors. The fundposted profits of 43 percent in 1995 and 41 percent in 1996. However, in August1998 alone, LTCM’s positions dropped 40 percent as a result of financial crises inRussia and several other countries. These bad outcomes were compounded by thehuge amount of debt that LTCM had used to finance its transactions. Like other hedgefunds, LTCM used derivative instruments to structure its investment transactions.Before its final crisis, LTCM had only $4 billion of equity capital, but over $100 billionin futures contracts, forward contracts, options, swaps, and other assets.
How could some of the world’s best-known investors, some of the most famouseconomists, and some of the smartest mathematicians get crushed so quickly? LTCMhad made a variety of investments all over the world, focused primarily on the expec-tation that various financial markets spread and volatility would converge to their his-torical norms. LTCM’s leverage and its trading strategies made it vulnerable to theextraordinary financial market conditions that emerged after Russia’s devaluation ofthe ruble and declaration of a debt moratorium on August 17, 1998.
Russia’s actions sparked “a flight to quality” in which investors avoided risk andsought out quality. As a result, volatility, risk, and liquidity spreads rose sharply inmarkets around the world. For example, LTCM had made heavy bets that interestrates throughout Europe would move closer together as many of its nations movedtoward monetary union. But with investors suddenly more eager to buy deutschemark bonds, the spread between German and other European-government bondswidened rapidly – precisely what LTCM had bet against and thus causing the fund’sbets to lose money. In another instance, the yield spread between US Treasuries andprivate securities also sharply widened – again what the fund had bet against.
Source: The Economic Report of President to Congress, 1999, pp. 63–7.

16.3.5 Investment in US multinational companies
It used to be the case that if you wanted to invest globally, you bought foreign stocks. But therecent wave of cross-border mergers and acquisitions along with accelerated globalization by UScompanies have turned many US shareholders into global investors, whether they like it or not.Thus, investors may choose securities of US-based multinational companies (MNCs) for theirinternational portfolio diversification. An MNC represents a portfolio of international opera-tions, thus its performance is somewhat insulated from US market downturns. An MNC canreduce risk by diversifying sales not only among industries, but also among countries. This meansthat the MNC as a single firm can achieve stability similar to that of an internationally diversi-fied portfolio.
16.3.6 Global investing
Empirical studies conclude that international diversification pushes out the efficient frontier, thusallowing investors simultaneously to reduce risk and increase return. This benefit exists for anumber of reasons. First, more profitable investments are possible in an enlarged universe, becausefaster-growing economies create higher returns or investors may see another advantage from cur-rency gains. Second, the advantages of international diversification may occur because compa-nies in different countries are subject to divergent cyclical economic fluctuations.
The US portion of total world capital markets has dropped from 70 percent in 1980 to 45percent in 2000. During that same period, nondollar stock markets frequently outperformedtheir US counterparts. Yet the average American investor has less than 10 percent of his or herportfolio invested in international securities. Some stockbrokers, such as Launny Steffens, Exec-utive Vice President of Merrill Lynch, think that investors would be better off patterning theirasset allocations much more closely to total world capitalizations. Of course, opportunity variesregion by region, country by country. And some regions and countries come with greater risk –liquidity, political, or currency risk.
The manager of a US stock fund has just one way to beat the competition, by making betterstock picks. But an international stock fund manager has three different ways to add value: bypicking countries, by picking currencies, and by picking stocks.
How can US investors best select a global fund? Some helpful hints may cut down on thepotential for loss (Clements 1992). They are: (1) stick with large players in the global market;(2) combine funds to minimize the effect of the failure of one fund on the total portfolio; (3)select regional rather than totally global funds; (4) consider combining regional funds with stockor bond index funds; and (5) try publicly traded funds. These suggestions will not assure success,but can reduce the likelihood of failure.
418 INTERNATIONAL PORTFOLIO INVESTMENT

QUESTIONS 419
SUMMARY
Political and economic events in the 1980s and the 1990s underscored the growing importance offree flows of finance, trade, and investment among countries. These changes, along with an improvedability to collect and analyze data, give us low-cost information about foreign securities. As a result,investors are realizing substantial benefits from international investment. In this chapter, we saw thatinternational stock and bond diversification can yield higher returns with less risk than investmentin a single market.
In the past 20 years or so, researchers have convincingly argued, in terms of the mean-variancemodel, the case for international portfolio investments, as opposed to purely domestic diversifica-tion. A major reason for such a case is that international investment offers a broader range of oppor-tunities than domestic investment even in a market as large as the USA or Europe. Studies havestressed the following two points: (1) adding foreign securities to a purely domestic portfolio reducesthe total risk of the portfolio because of a low correlation between foreign securities and the domes-tic market; and (2) in the past, international portfolios could have yielded both a higher return anda lower volatility than purely domestic portfolios.
Even though investors are increasingly interested in foreign securities, investment in foreign secu-rities represents a small portion of their total investment in stocks and bonds. Most commonlyexpressed barriers to international investment include: (1) excessive information and transactioncosts; (2) double taxation of foreign investment profits; (3) foreign-exchange regulations and cur-rency risk; (4) greater rate-of-return volatility; (5) unfamiliarity with operating procedures of foreignstock exchanges; (6) unavailability of high-quality financial data for foreign companies; and (7) sig-nificant delays of transactions and settlements associated with foreign securities.
Questions
1 Discuss both unsystematic risk and systematic risk within an international context.2 What is the market portfolio? Why is the market portfolio important?3 Many studies have found that intercountry correlations tend to be substantially lower than
intracountry correlations. Explain some reasons for this fact. What significance does thisfinding have for international investment?
4 Describe the efficient portfolio, the efficient frontier, and the optimum portfolio.5 Is the standard deviation of bond returns in any particular market typically higher or lower
than the standard deviation of stock returns in that market? Does this information makeany difference for investors?
6 Is it possible for an international portfolio to reduce the domestic systematic risk?7 Describe American depository receipts and global depository receipts.8 What are the different methods of international diversification?

420 INTERNATIONAL PORTFOLIO INVESTMENT
Problems
1 The expected rate of return on the market portfolio is 20 percent. The riskless rate of inter-est is 10 percent. The beta of a multinational company is 0.5. What is the cost of thiscompany’s common equity?
2 At present, the riskless rate of return is 10 percent and the expected rate of return on themarket portfolio is 15 percent. The expected returns for five stocks are listed below,together with their expected betas.
Stock Expected return Expected beta
A 0.22 1.5B 0.30 1.3C 0.12 0.8D 0.15 0.7E 0.14 1.1
On the basis of these expectations, which stocks are overvalued? Which stocks are undervalued?3 The prices of a common stock were $40, $50, and $60 for the last 3 days. Compute the
average stock price and the standard deviation.4 A portfolio manager wishes to invest a total of $10 million in US and British portfolios. The
expected returns are 15 percent on the US portfolio and 12 percent on the British portfo-lio. The standard deviations are 10 percent for the US portfolio and 9 percent for the Britishportfolio. Their correlation coefficient is 0.33. What is the expected return and standarddeviation of an international portfolio with 25 percent invested in the US portfolio and 75percent in the British portfolio?
5 An international portfolio with a total investment of $10 million consists of a US portfolioand a foreign portfolio. The US portfolio requires an investment of $5 million and theforeign portfolio requires an investment of $5 million. The standard deviations are 4 percentfor the US portfolio and 4 percent for the foreign portfolio.(a) If these two portfolios are perfectly positively correlated, what is the standard devia-
tion of the international portfolio?(b) If the two portfolios have a correlation coefficient of 0.2, what is the standard devi-
ation of the international portfolio?(c) If the two portfolios are perfectly negatively correlated, what is the standard devia-
tion of the international portfolio?

CASE PROBLEM 16 421
REFERENCES
Eaker, M. R. and D. M. Grant, “Currency HedgingStrategies for Internationally Diversified EquityPortfolios,” The Journal of Portfolio Management,Fall 1990, pp. 30–2.
Clements, J., “Choosing the Best Global Fund forYou: Experts Offer Some Winning Strategies,”The Wall Street Journal, Mar. 4, 1992, pp. C1, 14.
Levy, H. and Z. Lerman, “The Benefits of Interna-tional Diversification in Bonds,” Financial Ana-lysts Journal, Sept./Oct. 1988, pp. 56–64.
Markowitz, H. M., Portfolio Selection, New York:John Wiley, 1959.
Sharpe, W. F., “Capital Asset Prices: A Theory ofMarket Equilibrium Under Conditions of Risk,”Journal of Finance, Sept. 1964, pp. 425–42.
Sill, K., “The Gains from International RiskSharing,” Business Review, Federal Reserve Bankof Philadelphia, Third Quarter 2001, pp. 23–31.
Simmons, K., “Should US Investors Invest Over-seas?” New England Economic Review, FederalReserve Bank of Boston, Nov./Dec. 1999, pp.29–40.
Solnik, B., International Investments, Reading, MA:Addison-Wesley, 1999.
Thomas, L. R., “The Performance of Currency-Hedged Foreign Bonds,” Financial AnalystsJournal, May/June 1989, pp. 25–31.
Taylor, F., “Global Investing: Why International,Why Now?” Trusts & Estates, Sept. 1998, pp.12–16.
Case Problem 16: Investing in DaimlerChryslerin the USA
Thirty-five years ago, when an Indiana accounting professor, Dan Edwards, placed an order tobuy shares of Sony Corp., his broker tried to talk him out of it, saying “nobody has ever heardof that company.” Nevertheless, Professor Edwards persisted, and his broker made the pur-chase. To begin with, it took 2 days for the order to go through; once it did, Professor Edwardscouldn’t find price quotes without calling his broker. When annual reports came, they were inJapanese.
How times have changed. Thanks largely to the rise of American depository receipts (ADRs),these days US investors can trade many foreign shares, such as DaimlerChrysler, with no moredifficulty than it takes to buy domestic shares. Created in 1927 by financier J. P. Morgan as away of facilitating US investment abroad, an ADR is a negotiable certificate issued by a USbank in the USA to represent the underlying shares of foreign stock, which are held in a cus-todian bank. ADRs are sold, registered, and transferred in the USA in the same way as anyshare of domestic stock. Fueled by Americans’ interest in foreign markets, ADRs now accountfor more than 5 percent of all trading volume on the major US exchanges. Three of the 10most active NYSE stocks in 1996 were ADRs – Telefonos de Mexico SA, Hanson PLC, andGlaxo Wellcome PLC. Currently, there are more than 1,400 ADRs in the USA. This figure rep-resents a 50 percent increase from only 7 years ago. “The ADR market has grown like a jerry-

422 INTERNATIONAL PORTFOLIO INVESTMENT
built house for the last few years,” says Eric Fry, President of Holl International, a San Fran-cisco management firm. “It started at 2,500 square feet, and now it’s 14,000 square feet.”
In 1993, Daimler-Benz management decided to adjust its financial reporting in order to listshares of stock as ADRs on the New York Stock Exchange (NYSE). This decision resulted frommonths of negotiations between Daimler-Benz, the NYSE, and the SEC (Securities andExchange Commission). In 1993, Daimler-Benz saw profits fall by 25 percent from the previ-ous year, and prospects for the future were not bright. The company relied historically on strongprofits for cash flow; therefore, its management realized that it would have to look to othersources of cash to fund future growth. One way to raise funds was to issue shares of stock inforeign stock exchanges such as the NYSE.
Daimler-Benz was Europe’s largest industrial company – best known for its vehicle division,Mercedes-Benz – but it consisted of 23 business units housed in five divisions: passenger cars,commercial vehicles, aerospace, services, and directly managed business. In November 1998,Daimler-Benz purchased Chrysler for $40.5 billion in its ADRs, which created the world’ssecond-largest company on the Fortune Global 500. This newly combined company, namedDaimlerChrysler, became the fifth-largest automaker in the world ranked by production. Theworld’s top five automakers based on 1998 production of cars and light trucks are GM (7.8million units), Ford (6.5 million units), Toyota (4 million units), Volkswagen (3.9 million units),and DaimlerChrysler (3.6 million units).
Unlike other mergers, the overall goal of this merger is just growth. DaimlerChrysler saidthat it would generate annual savings and revenue gains of at least $3 billion, with no plantclosures or layoffs planned. The company’s top integration priorities included: (1) combiningefforts to boost Chrysler and Daimler sales in Asia and Latin America; (2) building and sellingan extra 30,000 units of the Mercedes M-class sport-utility vehicle around the world; (3) iden-tifying ways to use Daimler diesel engines in Chrysler cars and trucks; (4) developing a Daimler-Benz minivan, working with Chrysler’s minivan platform team; (5) eliminating overlappingresearch into fuel cells, electric cars, and advanced diesel engines; and (6) consolidating thefunctions of marketing and finance.
Figure 16.10 shows that this combined company posted substantial gains in both sales andprofits in 1998 over 1997. Furthermore, DaimlerChrysler predicted a 4 percent growth in salesand operating profit in 1999. Analysts did not dispute the company’s forecast for even fastergrowth in sales and earnings beyond 1999. In just 4 months after the historic merger, however,the portion of US investors in DaimlerChrysler dropped from 44 percent in November 1998 to25 percent in March 1999. In the meantime, the company’s share price fell 21 percent froma 52-week high of $108.625 on January 6, 1999, to $86 on March 23, 1999, in NYSE com-posite trading. These two pieces of bad news – the drop in US ownership and the decline inthe share price – caused DaimlerChrysler in March 1999 to abruptly end its efforts to purchaseJapan’s Nissan Motor Co.
Apparently, the overall goal of DaimlerChrysler at the time of their merger – just growth –turned out to be an unrealizable dream. Figure 16.11 shows that the company’s revenues andprofits fell sharply after their 1998 merger. Consequently, DaimlerChrysler announced itsrestructured plan for Chrysler Group in February 2001. Under this plan, the company would:(1) cut 26,000 jobs, close six plants, and reduce car and truck output by 15 percent; (2) lowerparts and materials costs by $7.8 billion through 2003; (3) cut manufacturing expenses by $1.8billion and sell noncore assets; (4) lower the break-even point from 113 percent to 83 percent;

US market share is steady …Figure are for passenger and light trucks only
20%
15
10
5
0F M A A S O ONM J J J F Nov. Dec. Jan. Feb. Mar.
19991998 1998 1999
$110
100
90
80
70
DaimlerChrysler's Dilemma
Sales and profits are strong …In billions of euros
1998 1997PERCENTCHANGE
+29%
+12%
4.06
117.57
5.22
131.78
Profit
Sales
NOTE: Excludes merger costs and nonrecurring items
But US investors are fleeingPercentage of DaimlerChrysler shareholdersin the USA
When the mergertook effect in November 1998
Now
44%
25%
Though the stock has declinedSymbol: DCX, daily stock price
Note: Until Nov. 1998, the companies operated independently as Daimter-Benz AG and Chryster Corp.Source: The company, PricewaterhouseCoopers
Figure 16.10 Key financial statistics of DaimlerChrysler
Source: J. Ball, “DaimlerChrysler Frets Over Loss of US Shareholders”, The Wall Street Journal,Mar. 24, 1999; reprinted by kind permission.
Revenues ($ billion) Net profit ($ billion)
155
154
153
152
151
150
Year
19981999 2000
6
5
4
319981999 2000
Figure 16.11 DaimlerChrysler’s revenues and profits
Source: The Detroit News, Feb. 27, 2001, p. A4.

424 INTERNATIONAL PORTFOLIO INVESTMENT
(5) reduce fixed costs by $2.5 billion by cutting workforce, trimming white-collar benefits, andnoncore asset sales; (6) increase annual revenues by $4.8 billion by 2003; and (7) reduce engi-neering costs through a variety of actions. However, critics charge that DaimlerChrysler shouldhave taken these actions when they merged in 1998. Some observers argue that all majormerged companies restructure their business operations at the time of the merger by layingoff thousands of workers, closing factories, firing long-time managers, and spinning off noncorebusinesses.
Case Questions
1 Describe American depository receipts in some detail.2 Why did Daimler-Benz and other foreign companies decide to list their ADRs on the NYSE?3 Briefly describe how to choose ADRs.4 What is the downside of ADR investment?5 Both sales and profits in DaimlerChrysler posted big gains in 1998 and expected to increase
even faster beyond 1999. In the meantime, the company’s US ownership and share pricedeclined sharply in the first 4 months after the merger. Explain this apparent conflictbetween the company’s profits and its share price.
6 To list their stocks in the New York Stock Exchange, foreign companies have to complywith the registration and disclosure requirements established by the US Securities andExchange Commission (SEC). Use the website of the SEC, www.sec.gov/, to review dis-closure requirements in SEC final rules related to foreign investment and trade.
Source: M. Allen, “Foregoing Funds,” The Wall Street Journal, June 27, 1996, Section R; J. Ball, “Daimler-Chrysler Frets Over Loss of US Shareholders,” The Wall Street Journal, Mar. 24, 1999, p. B4; S. Carney andD. Howes, “Retooling Chrysler: Will it Work?” The Detroit News, Feb. 27, 2001, pp. A1, A4; C. Park, “Daimlerto Make New York Debut in October,” The Financial Times, July 28, 1993, p. 23; A. Raghavan and C. Harlan,“Daimler-Benz’s Listing is Likely to Draw More Foreign Firms to the US Market,” The Wall Street Journal,Mar. 3, 1993, p. A4; G. Stern and S. Lipin, “Proposed Merger of Automobile Titans May Spur Global Shake-out of Industry,” The Wall Street Journal, May 7, 1998, p. A10; and G. Yip, “Home Advantage,” The WallStreet Journal, Apr. 26, 1999, p. R12.

Opening Case 17: How Can Companies Get the Most Out of TheirForeign Investment?
We can classify the benefits of foreign direct investment into two broad categories:tangible and intangible. Some benefits, such as reductions in labor, capital, and logis-tics costs, are tangible and easy to measure; others, such as new ideas from foreignresearch centers, customers, and suppliers, are intangible and difficult to measure. Ifforeign manufacturing operations play a negligible strategic role, the tangible bene-fits usually dominate the decision to manufacture abroad. As a company upgradesthe strategic role of its foreign manufacturing operations, however, it stresses theintangible benefits more.
Many multinational companies (MNCs) establish and manage their foreign plantsonly for the benefits of tax concessions, cheap labor, and capital subsidies. However,Ferdows (1997) argues that higher market share and greater profits can only beachieved if both tangible and intangible benefits are realized. When an MNC employsa foreign plant to produce intangible benefits, the plant will have a better chance tobe innovative, to be productive, to achieve low costs, and to provide exemplary serviceto customers throughout the world. To get more out of its foreign factories, there-fore, the MNC should use them to get closer to their customers and suppliers, toattract skilled and talented employees, and to create centers of expertise for the entirecompany.
Some companies indeed invest abroad to seek technology, managerial expertise,and other intangible benefits. For example, German, Japanese, and Korean compa-nies have purchased US-based electronics firms for their technology. Take a look atLG’s acquisition of Zenith as an example. On July 17, 1995, LG Electronics of Korea
CHAPTER 17
Corporate Strategy andForeign Direct Investment

Direct investments are equity investments such as the purchase of common stock, the acquisi-tion of entire firms, or the establishment of new subsidiaries. The US Department of Commercedefines foreign direct investment (FDI) as investment in either real capital assets or financialassets with a minimum of 10 percent equity ownership in a foreign firm. Most MNCs investoverseas directly for a variety of reasons. Chapter 2 discussed key economic motives for overseasdirect investment. This chapter discusses several practical issues of FDI in three sections. Thefirst section describes the overall concept of FDI. The second section covers inflows of FDI todeveloping countries. The third section considers cross-border mergers and acquisitions.
17.1 An Overview of Foreign Direct Investment
Decisions on capital expenditures involve the allocation and commitment of funds to investmentprojects whose returns are expected to extend beyond 1 year. Such investments usually requirevery large sums of money and are made in expectation of benefits over an extended period. Capitalinvestment decisions are not readily reversible once they are made. Used plants and most usedequipment in foreign countries have limited markets. In certain areas, production methods arerapidly outdated by increasingly higher levels of technology. Moreover, foreign investments aremuch riskier than domestic investments. Thus, the rational use of capital resources is critical forthe future well-being of an MNC.
17.1.1 The benefits of foreign investment
COMPANY BENEFITS MNCs invest their capital abroad to utilize their oligopoly-created advan-tages. These advantages include proprietary technology, management know-how, multinationaldistribution networks, access to scarce raw materials, production economies of scale, financialeconomies of scale, and possession of a strong brand or trade name. The use of such oligopolis-tic advantages could enable an MNC to reduce its cost of capital and to increase its profitabil-ity, thereby increasing the value of the firm.
HOST-COUNTRY BENEFITS There are three basic forms of cross-border financial flows: port-folio investment, FDI, and bank lending. FDI forms one of the most important links between
426 CORPORATE STRATEGY AND FOREIGN DIRECT INVESTMENT
acquired Zenith, the last remaining TV manufacturer in the United States, to obtainits HDTV and multimedia technologies. This is because changes in international competitiveness had compelled LG to engage in its own aggressive research anddevelopment.
Source: K. Ferdows, “Making the Most of Foreign Factories,” Harvard Business Review, Mar./Apr.1997, p. 82.

developing and industrial countries because it is stable. For example, FDI flows to Southeast Asiahad proved to be much more stable than other forms of financial flows during the Asian finan-cial crisis of 1997–8.
Host countries, particularly developing countries, can benefit from FDI in many ways:
1 Foreign investment induces the transfer of technology and skills that are frequently in shortsupply.
2 It increases both national employment and domestic wages.3 It provides local workers with an opportunity to learn managerial skills.4 It contributes to tax revenues and helps balance the international balance of payments.
17.1.2 Arguments against foreign investment
Although foreign investment tends to contribute much needed resources to host countries, devel-oping countries in particular many view it with misgivings. There are many arguments againstforeign investment. Most of these arguments have to do with conflicts between company goalsand host-government aspirations:
1 Foreign investment brings about the loss of political and economic sovereignty.2 It controls key industries and export markets.3 It exploits local natural resources and unskilled workers.4 It undermines indigenous cultures and societies by imposing Western values and lifestyles on
developing countries.
It seems that, while FDI has the potential to contribute positively to development, there is noguarantee that it will have no harmful impact on host countries. The question of foreign invest-ment, however, need not be a zero-sum game. A feasible framework for investment must be setup to define the rights and responsibilities of both parties. This framework should allow for areasonable return to the investor and positively contribute to the development of a host country.
17.1.3 How to invest abroad: modes of foreign investment
When a company decides to invest its money abroad, it has seven distinct alternatives available:construction of new plants, mergers and acquisitions, joint ventures, equity alliances, licensingagreements, franchising agreements, and contract manufacturing.
CONSTRUCTION OF NEW PLANTS (INTERNAL GROWTH) Companies can penetrate foreignmarkets by establishing new operations in foreign countries to produce and sell new products.Some companies may prefer this internal growth because they can tailor their foreign operationsto their exact needs. For example, General Motors had spent several years determining the marketsize for its cars in China before the company decided to build a $1 billion auto assembly plantin the country. Such a demand forecast or potential market size depends on many factors, suchas competition, income, population, economic conditions, and the feasibility of serving nearbyforeign markets. However, it would take some time for MNCs to reap any rewards from inter-
AN OVERVIEW OF FOREIGN DIRECT INVESTMENT 427

nal growth, because they have to build a plant and establish a customer base first. We discussthis type of foreign investment in detail in chapter 18.
MERGERS AND ACQUISITIONS (EXTERNAL GROWTH) Although internal growth is usuallynatural and economical, the process of growth may be too slow. These days, many MNCs acquireother firms in foreign countries to penetrate foreign markets rather than building factories thatmay take years to complete. Some companies purchase parts of foreign firms to obtain a stakein foreign operations. In many cases, MNCs acquire foreign firms to obtain the instant access tothe market that they serve and to reduce their competitors. For example, in December 1998,British Petroleum purchased Amoco of the United States to expand their US market share andto reduce one of its major US competitors. We discuss cross-border mergers and acquisitions indetail in the second half of this chapter.
THE JOINT VENTURE A joint venture is owned by two or more firms. Sometimes the ownersof a joint venture are from several different countries. Many MNCs penetrate foreign marketsby forming a joint venture with companies that reside in those markets. Most joint venturespermit two companies to use their respective comparative advantages in a given project. Forexample, General Mills of the USA and Nestlé of Switzerland formed a joint venture so that thecereals produced by General Mills could be sold through the huge global distribution networkestablished by Nestlé.
The basic advantage of a joint venture is that it enables a company to generate incrementalrevenue or cost savings. A joint venture, however, normally faces many complex problems.Because representatives of both companies sit on the board of directors, it is difficult to forge aconsensus, especially when an MNC and host-country firms form a joint venture. Nevertheless,these days international joint ventures crop up everywhere. The rush of new technology, theexpense of staying on the leading edge, the demands of customers, and worldwide competitionhave required many MNCs to form a wide range of joint ventures and partnerships.
EQUITY ALLIANCES An alliance whereby one company takes an equity position in anothercompany is known as an equity alliance. In some cases, each party takes an ownership in theother. The purpose of the equity ownership is to solidify a collaborative contract so that it is dif-ficult to break, particularly if the ownership is large enough to secure a board membership forthe investing company. The airline industry epitomizes the use of equity alliances. IBM main-tains more than 500 equity alliances around the world.
LICENSING AGREEMENTS Under a licensing agreement, an MNC (the licensor) allows aforeign company (the licensee) to produce its products in a foreign country in exchange for roy-alties, fees, and other forms of compensation. MNCs can set up their own production facilitiesabroad or license a local firm to manufacture their products in return for royalties. AT&T has alicensing agreement to build and operate part of India’s telephone system. Sprint Corp. has alicensing agreement to develop telecommunications services in England.
Advantages to a licensor include: (1) a relatively small amount of investment, (2) an oppor-tunity to penetrate foreign markets, (3) lower political and financial risks, and (4) an easy wayto circumvent foreign market entry restrictions. Benefits to a licensee include: (1) a cheap wayto obtain new technology, (2) an easy way to diversify into other product lines, and (3) an oppor-tunity to capitalize on its unique positions, such as the channels of distribution, the financialresources, and the marketing know-how.
428 CORPORATE STRATEGY AND FOREIGN DIRECT INVESTMENT

Like all aspects of good business, successful licensing requires management and planning.Because there is no global clearinghouse for technology, the matching process stretches aroundthe world, with a wide variety of intermediaries. The process is further complicated because ofpolitics, international laws, different cultures, and global secrecy. Consequently, a continuousstream of profitable licensing agreements comes from hard thinking, good planning, and largeoutlays for research and development.
FRANCHISING AGREEMENTS Under a franchising agreement, an MNC (franchiser) allows aforeign company (franchisee) to sell products or services under a highly publicized brand nameand a well-proven set of procedures. Under this arrangement, the franchiser allows the franchiseenot only to sell products or services but also assists on a continuing basis in the operation of thebusiness.
Franchising is most associated with the USA and accounts for about one third of US retailsales. Some 500US franchisers have approximately 50,000 outlets worldwide. Fast-food opera-tions, such as McDonald’s, Kentucky Fried Chicken, and Dunkin Donuts, are the most numer-ous. For example, McDonald’s alone has almost 10,000 restaurants in 100 countries. Other typesof franchisers are hotels (Hilton), soft drinks (Coca Cola), clerical services (Kelly Services), andautomotive products (Midas).
CONTRACT MANUFACTURING In contract manufacturing, an MNC contracts with a foreignmanufacturer to produce products for them according to their specifications. The contract man-ufacturer does not market the products that it produces. Instead, the MNC markets the prod-ucts under its own brand name, just as Wal-Mart sells a variety of products made by contractmanufacturers under its own brand name. Thus, the buying public normally does not realize thatthe selling company has not actually produced the product. Sometimes, MNCs subcontractassembly work or the production of parts to independent companies overseas.
17.2 Foreign Direct Investment in Developing Countries
Table 17.1 shows that in 2003, for the first time, China attracted more foreign investment thanthe USA. A survey by consulting firm A. T. Kearney of more than 150 chief executives predictedthat China would remain the world’s hottest destination for foreign investment in the near future.Because of the rush to China, Asia is for the first time likely to overtake Europe as an invest-ment destination, said Kearney. Worldwide, foreign direct investment fell 21 percent in 2003from 2002 as economies around the world, with the exception of China and a few others, grewslowly or not at all.
FDI into the USA fell from $70 billion in 2002 to $40 billion in 2003, down 87 percentfrom the peak in 2000. Reduced capital flows into the USA can cut the value of the dollar andlead to higher interest rates. It also can slow expenditures on technology and improvements thathelp boost productivity and corporate profits. China’s huge investment inflows come at a sensi-tive time for relations with the biggest trading partners. The USA, Japan, and Europe have criticized China recently for its fixed exchange rate, which some economists believe takes jobsfrom other countries and artificially cuts the costs of its exports by significantly undervaluing itscurrency.
The flow of equity-related finance to developing countries takes two forms: portfolio invest-ment and direct investment. Figure 17.1 shows that combined inflows of both forms totaled a
FOREIGN DIRECT INVESTMENT IN DEVELOPING COUNTRIES 429

net of about $135 billion in 2003, down from $178 billion in 2001 and from their peak of $196billion in 1997.
Figure 17.2 shows that net FDI flows to developing countries have fallen sharply since 2001.The decline in FDI flows to developing countries was associated with a slowdown in privatiza-tion and mergers-and-acquisitions transactions (figure 17.3). Despite the overall decline in FDIflows to developing countries and another rise in the share of FDI accounted for by China, therewas a decline in the overall concentration. The dip in FDI flows in 2003 was almost entirely dueto the decline in flows to Latin America and the Caribbean. Three factors accounted for thatdecline. First, the regional recession undermined incentives to invest in the region. Second, nolarge mergers and acquisitions of the kind that inflated the inflows numbers in recent yearsoccurred in 2003. Finally, the process of privatization has moved toward completion. It alsoappears that the Iraq conflict and severe acute respiratory syndrome (SARS) had a limited impacton FDI in 2003.
The downturn in FDI flows to developing countries occurred against even sharper decline inglobal FDI flows in 2003. As a result, developing countries’ share in global FDI flows actuallyrose. However, when viewed against the plunge in debt outstanding to private-sector creditors,
430 CORPORATE STRATEGY AND FOREIGN DIRECT INVESTMENT
Table 17.1 Foreign direct investment (billions of US dollars)
2000 2001 2002 2003
World $1,393.0 $823.8 $651.2 $512.0USA 314.0 144.0 72.0 40.0China 40.8 46.8 53.7 53.0
Source: USA Today, Sept. 5, 2003, p. 3B; and The Wall Street Journal,June 28, 2004, p. A2.
200
180
160
140
120
100
80
60
40
20
01995 1997 1999 2001 2003
0.0
0.5
1.0
2.0
3.0
3.5
1.5
2.5
Percent($ billion)
FDI as a share of GDP
Year
Figure 17.1 Net inward FDI flows to developing countries, 1995–2003
Source: The World Bank, Global Development Finance, 2004, p. 78.

discussed in chapter 12, the flow of private-sector equity-related capital appears remarkablyrobust.
17.2.1 An improved investment climate
Perhaps the best way of improving a country’s investment climate is to remove obstacles thatimpede foreign investment, although many are unavoidable, inadvertent, or unintended. Bad
FOREIGN DIRECT INVESTMENT IN DEVELOPING COUNTRIES 431
4.5
4.0
3.5
3.0
2.0
1.0
2.5
1.5
0.5
0.01995 1996 1997 1998 1999 2000 2001 2002 2003
Percent
Top 10 recipient countries
Middle-income countries
Low-income countries
Year
Figure 17.2 FDI as the share of GDP in developing countries, 1995–2003
Source: The World Bank, Global Development Finance, 2004, p. 79.
140
120
100
80
60
40
20
01995 1996 1997 1998 1999 2000 2001 2002 2003
($ billion)
Mergers and acquisitions
Year
Privatization
Figure 17.3 Privatization and M&A in developing countries, 1995–2003
Source: The World Bank, Global Development Finance, 2004, p. 79.

roads, primitive port facilities, and the lack of local capital or qualified local technicians consti-tute unavoidable obstacles to investment. In some cases, the government of a country permitssome obstacles to exist, but for reasons other than their effect on private foreign investment. Asexamples, the existence of a communist dictatorship in Cuba and the social orientation of Syriadeter foreign investment. Finally, there are unintended obstacles that the government of the hostcountry is anxious to avoid. These obstacles include a broad range of conditions, from excessivered tape to corruption in the courts.
There are two broad groups of reasons why MNCs will invest heavily in developing coun-tries: various incentive programs and emerging market-based capitalism. The shortage of capitalin many parts of the world and an almost universal desire for economic growth have recentlycompelled many countries to institute incentive programs for private foreign investment. Severalsurveys have found that developing countries have various incentive programs for foreigninvestors. As shown in figure 17.4, these incentives include tariff exemptions, tax incentives,financial assistance, and others. These and other incentive programs undoubtedly motivateMNCs to invest in those countries that offer them.
Many developing countries are embracing market-based capitalism. Privatization, liberaliza-tion of trade, a positive attitude toward foreign investment, a relaxation of the tight state control,stock market development, and sounder macroeconomic policies – these are all enthusiasticallyembraced by foreign investors. More concretely, these are the measures that make investment
432 CORPORATE STRATEGY AND FOREIGN DIRECT INVESTMENT
OECD countries
Developing countries
Subsidized loans
VAT exemption on exported inputs
Reduction in local, municipal taxes/duties
Loss write-off
Duty drawback
Accelerated depreciation
Lower tax rate
Tax exemption/holiday
Capital goods import duties exempted
Investment/reinvestment allowance
VAT exemption for capital goods
Raw material import duties exempted
VAT exemption for raw materials
Export income treated preferentially
0 10 20 30 40 50Number of countries
Note: VAT is value added tax. Data on fiscal and financial incentives were compiled for 71 developing and 20 OECD countries. The most common incentives (used in at least 18% of developing countries) are shown in the chart.
Figure 17.4 Incentives for foreign direct investment
Source: The World Bank, Global Economic Prospects, 2003, p. 80.

possible by putting companies on the block and allowing foreigners into the market. One criti-cal factor of the domestic policy environment in attracting foreign investment is whether thegovernment operates with transparency, credibility, and stability. Corporate governance – an inde-pendent board of directors, mechanisms for citizens to monitor public behavior, and rules thatconstrain corruption – is essential to sustained FDI inflows.
17.3 Cross-Border Mergers and Acquisitions
These days, companies look for and need to explore growth opportunities on a global basis. Inprinciple, the growth of the foreign presence in any national economy could take place in eitherof two ways. Companies could grow primarily through the construction of new production facil-ities in a foreign country, financed either through the establishment of new subsidiaries or throughinvestment by their existing facilities in the foreign country. Alternatively, companies could growthrough the acquisition of existing foreign firms.
Obviously, both kinds of growth have recently taken place in the USA and other countries.For example, ventures such as the establishment of Japanese automobile plants in the USA haveoccurred simultaneously with events such as Daimler’s acquisition of Chrysler. In quantitativeterms, however, acquisitions (external growth) are much larger than the construction of new pro-duction facilities abroad (internal growth). Although internal growth is usually natural and eco-nomical, the process of growth may be very slow. In recent years, a company’s growth througha merger with the existing business activities of a foreign firm has received substantial attentionas an alternative to internal growth.
In chapter 18, we consider the purchase of an individual asset as a capital budgeting decision.When a company is buying another company, it is making an investment. Thus, the basic prin-ciples of capital investment decisions apply. But mergers are often more difficult to evaluate. First,the financial manager must be careful to define benefits. Second, the financial manager needs tounderstand why mergers occur and who gains or loses as a result of them. Third, the acquisitionof a company is more complicated than the purchase of a new machine, because special tax, legal,and accounting issues must often be addressed. Finally, the integration of an entire company ismuch more complex than the installation of a single new machine.
17.3.1 Terminology
A merger is a transaction that combines two companies into one new company. An acquisitionis the purchase of one firm by another firm. Although we have drawn the formal distinctionbetween a merger and an acquisition, the two terms are often used interchangeably. The partiesin a merger can be classified as an acquiring company and an acquired company. The acquiringcompany, also known as a bidder, initiates the offer, while the acquired company, often called atarget company, receives the offer.
Acquisitions are also categorized as being either friendly or hostile. A friendly takeover is anoffer made directly to the firm’s management or its board of directors. In a hostile takeover, theacquiring company often bypasses the target company’s management and approaches its share-holders directly with a tender offer for the purchase of their assets. A tender offer is an offer tobuy a certain number of shares at a specific price and on a specific date for cash, stock, or a com-
CROSS-BORDER MERGERS AND ACQUISITIONS 433

bination of both. A tender offer is usually associated with a hostile takeover, but it is also usedin friendly takeovers when the target company’s management approves the offer before it is pre-sented to shareholders.
17.3.2 Mergers and corporate governance
The market-based system of corporate governance used in the United States and the UnitedKingdom is characterized by a highly diversified equity ownership, a large portion of public debtand equity capital, and a relatively independent management team. The bank-based system ofcorporate governance used in Japan, France, and Germany depends on a concentrated owner-ship in the hands of a main bank and the firm’s business partners for both debt and equity capital.Figure 17.5 shows that corporate ownership is more widely dispersed in the USA and the UKthan in France, Germany, and Japan. The structure of these corporate governance systems influ-ences top executive turnover and the market for corporate control.
In the USA, management is much more likely to be disciplined through either friendlytakeovers or hostile takeovers. Corporate control contests in the USA tend to be large-scale,aggressive, financially motivated, and arm’s-length deals that often involve private investors andother corporations. Hostile acquisitions frequently provoke equally forceful defensive maneuversby the management of target firms.
434 CORPORATE STRATEGY AND FOREIGN DIRECT INVESTMENT
Closely HeldCorporate ownership is more widely dispersed in the USA and the UK, where shareholder activism reigns. On the Continent, ownership remains concentrated. In each country's biggest 25 corporations, the percentage of equityheld by largest and five largest shareholders.
LARGEST
5 LARGEST
USA UK FRANCE GERMANY JAPAN
Figure 17.5 Corporate ownership in five major countries
Source: The Wall Street Journal, Apr. 26, 1999, p. R15; reprinted by kind permission.

In Japan, corporate takeovers are typically managed from inside rather than in the publicmarkets by the company’s main bank, by its business partners, or by both. Hostile acquisitionsare almost nonexistent in Japan, due to the concentration of equity ownership in the hands ofthe main bank and other keiretsu members.
Corporations in most countries around the world have a supervisory board charged with mon-itoring and supervising the management team on behalf of the stakeholders. The compositionof the board, its powers, and its responsibilities vary widely across countries. In the USA thisboard, called the board of directors, represents a dispersed set of shareholders and usually includesoutsider directors who have no other business contact with the corporation.
In Japan, it is rare for a board member to come from a group other than the corporation’smanagement or from a close affiliate of the corporation, such as another keiretsu member or themain bank. The Japanese word keiretsu refers to the large, financially linked groups of compa-nies that play a significant role in the country’s economy. The governance of most large Japan-ese corporations is thus dominated by an inner circle of inside managers, their bankers, and theirbusiness partners. These board differences between the USA and Japan explain why there aremany hostile acquisitions in the USA and why, on the other hand, there are hardly any hostileacquisitions in Japan.
WEAKENING CROSS-HOLDINGS IN JAPAN In Japan, banks and borrowers or manufacturersand suppliers held an intricate network of shares in each other for decades. Those ties have beenweakening as these networks of mutual shareholdings have slowly turned from benefit to burden.Cross-holdings have depressed corporate returns on equity, locking in outdated business alliancesand hampering the formation of more forward-looking ones. Consequently, companies and banksunloaded approximately $50 billion in cross-held shares between January 1999 and February2000. Gary Evans, a corporate strategist in Tokyo, figured that the percentage of all Japanese out-standing shares cross-held by corporations would fall to 25 percent in 2000, as compared to 42percent in 1990 (Spindle 2000).
The industries in which cross-holdings are falling fastest – airlines, railways, steel, and banking– are considered to be among the most outdated in Japan. In addition, industry executives andanalysts say that the selling of shares is a sign that restructuring efforts are bearing some fruit.For example, after handing control over to a management team from Renault SA of France,Nissan Motor Co. announced a restructuring plan in 1999; it called on Nissan to cut the numberof companies in its core group from more than a thousand to four. Industrial Bank of Japan, inthe midst of a three-way merger, stated that it planned to sell about a quarter of its three trillionyen of stakes in borrowers and allied companies over a 4-year period, beginning in 1999.
Analysts say that the selling of cross-held shares could eventually reach a point at which suf-ficient numbers of shares are available to spark a boom in mergers and acquisitions, perhaps evenin hostile takeovers. That could spur a still more dramatic restructuring of old-line corporateJapan.
17.3.3 Some accounting aspects of mergers
A merger can be treated on the books of the acquiring company as either a pooling of interestsor a purchase of assets. If a merger is financed with an exchange of stock, it may qualify for thepooling of interests. Under the pooling-of-interest method, the items on the balance sheets of
CROSS-BORDER MERGERS AND ACQUISITIONS 435

the two companies are added together, so that the merger would not create goodwill. The firmsthat like pooling most are those with a lot of intangible assets – intellectual property, brandnames, copyrights, patents, customer lists, and research and development. The obvious advan-tage of this method is that there are no charges against future earnings and thus it would producehigher reported earnings. As a result, this form of business merger has been popular in practiceand has caused the recent surge in mergers and acquisitions.
It is, then, no wonder that the use of pooling in mergers and acquisitions by dollar volumeincreased from only 5 percent in the early 1990s to 55 percent in the late 1990s (King 2000).However, the Financial Accounting Standards Board (FASB), the US accounting rulemaker, eliminated the pooling-of-interest method effective July 1, 2001. Most financial officers expectthe ban on pooling to slow, but not stop, merger activity.
If a merger is made with cash, the merger must be treated as a purchase of assets. The pur-chase method views a merger as an investment for the acquiring company. Under the purchase-of-assets method, the acquired assets or companies are usually recorded in the accounts of theacquiring company at the market value of assets given in exchange. If the acquiring companypays more than the book value of the acquired company, the excess is treated as goodwill. Goodwill write-offs are not deductible for income tax purposes. This accounting treatment resultsin lower reported earnings for several years; thus, this form of business merger is not popular inpractice.
17.3.4 A new merger movement
It was not exactly merger mania like the merger boom in the 1990s, but companies started tomake acquisitions again in 2003. After a 3-year deal-making downturn, the pace of mergers andacquisitions finally accelerated in the second half of 2003 (figure 17.6). The worldwide volumeof announced transactions edged up 10 percent to $1.33 trillion in 2003 from $1.21 trillion in2002, but this volume is still only 40 percent of the record $3.4 trillion of transactions rackedup in the merger craze of 2000. The renewed interest in pursuing mergers and acquisitions cameamid the signs of an improving economy and a rising stock market. For 2005 and beyond, world-wide merger advisors believe that the cautious enthusiasm for mergers will continue, particularlyin sectors such as financial institutions, health care, and consumer products.
17.3.5 Motives for cross-border mergers and acquisitions
A company’s acquisition of another firm is economically justified only if it increases the totalvalue of a firm. The traditional approach to the valuation of the firm consists of four basic steps:
1 Determine the earnings after taxes that the company expects to produce over the years, orearnings before taxes multiplied by (1 - tax rate).
2 Determine the capitalization rate (discount rate) for these earnings.3 Determine the extent to which the company may be leveraged or the adequate amount of
debt.4 Compute the total value of the firm from the following formula:
436 CORPORATE STRATEGY AND FOREIGN DIRECT INVESTMENT

One can examine the effect of a merger on each of the factors that affect the total value of thefirm.
EARNINGS BEFORE TAXES A merger itself creates a larger physical size and opportunities for asynergistic effect. The synergistic effects of business mergers are certain economies of scale dueto the firm’s lower overhead. The merger allows the firm to acquire necessary management skills and to spread existing management skills over a larger operation. There are also opportu-nities to eliminate duplicate facilities and to consolidate the functions of production, marketing,and purchasing. Finally, the merger enables the firm to enjoy greater access to financial marketsand thus to raise debt and equity at a lower cost of capital. These types of better management,operating economies, and financial economies can increase the profit margin and also reducerisks.
value of firmearnings before taxes 1 tax rate
capitalization rate=
-( )
CROSS-BORDER MERGERS AND ACQUISITIONS 437
As the economy recovered and stock market indexes took off, there was renewedinterest in mergers and acquisitions. But the pace didn't approach the records set inlate 1999 and early 2000. Global volume and number of deals.
$1.0
0.8
0.6
0.4
0.2
01Q 2Q 3Q 4Q 1Q 2Q 3Q 4Q 1Q 2Q 3Q 4Q 1Q 2Q 3Q 4Q 1Q 2Q 3Q 4Q1999 2000 2001 2002 2003
0
2,000
4,000
6,000
8,000
10,000
No. of deals (right axis)
Deal value, in trillions*(left axis)
Figure 17.6 A pickup in merger activity
Source: The Wall Street Journal, Jan. 2, 2004, p. R15.

TAX CONSIDERATIONS The tax benefit for mergers comes from the fact that the tax loss carryforward expires at the end of a certain number of years unless the firm makes sufficientprofits to offset it completely. There are two situations in which mergers could actually avoidcorporate income taxes. First, when a profitable company acquires companies with a large taxloss carryforward, it can reduce its effective tax rate and consequently increase its net operatingincome after taxes. Second, a company with a tax loss carryforward may acquire profitable com-panies in order to use its carryforward.
438 CORPORATE STRATEGY AND FOREIGN DIRECT INVESTMENT
Example 17.1
Assume that Buyco Corporation, with a 10 percent cost of capital, is analyzing the acqui-sition of the Sellco Corporation for $1 million. Sellco has expected net cash flows (earningsafter taxes plus depreciation) of $100,000 per year indefinitely. Furthermore, the synergis-tic effect of the merger (in this case, combining production facilities) will add $20,000 peryear to net cash flow indefinitely.
The present value of net cash flows from this merger is $1.2 million [($100,000 +$20,000)/0.10]. As a result, the acquisition appears to represent a desirable alternative forthe expenditure of cash with a positive value of $200,000 ($1,200,000 - $1,000,000).
A company is often able to improve its risk–return performance through internationalacquisition rather than through domestic acquisition. The key element here is the correla-tion coefficient between acquired firms and an acquiring firm. When firms with low degreesof correlation are combined with each other, the acquiring firm is able to reduce its risk ofexpected return. Companies from different countries tend to be less correlated with eachother than are domestic companies. For example, the economic cycles of different coun-tries do not tend to be totally synchronized. On the other hand, most domestic companiestend to be highly correlated with each other, because they depend on the same state ofeconomy.
Example 17.2
In this example, we assume that all losses can be carried forward. Company A acquirescompany B, which has a $220,000 tax loss carryforward. Company A, with a tax rate of40 percent, expects to earn $100,000 a year for the next 3 years.
As shown in table 17.2, the tax shield value of a carryforward is equal to the loss involvedtimes the tax rate ($220,000 ¥ 0.40 = $88,000). On the basis of the carryforward, companyA can reduce its total taxes from $120,000 to $32,000, and thus it could pay $88,000 forthe carryforward alone (this is on a nondiscount basis). Earnings after taxes also have goneup by $88,000 ($268,000 - $180,000). Obviously, company B’s anticipated operating gainsand losses for future years must also be considered in analyzing the deal.

CROSS-BORDER MERGERS AND ACQUISITIONS 439
Accounting and tax laws may create even more competitive advantages for acquiringfirms in some countries. If the acquiring company pays more than the net worth of theacquired company, the excess is treated as goodwill. Goodwill write-offs are not deductiblefor federal income taxes in some countries. This accounting treatment results in lowerreported earnings for several years. However, in most industrialized countries, goodwill doesnot affect the acquiring company’s earnings. Thus, foreign companies with more favorableaccounting and tax laws may be able to bid higher prices for target companies.
Example 17.3
Suppose that company C and firm D try to acquire Echo Corporation with a $4 million bookvalue (net worth) for $6 million. Company C is located in a country in which goodwill write-offs are not deductible for income taxes, but firm D is located in a country in which com-panies are allowed to deduct goodwill amortization for tax purposes. The tax rate of 40percent is the same for company C and firm D.
Because a company can acquire a firm with $4 million book value for $6 million, $2million of goodwill is created on the books of the acquiring company. If it must be writtenoff over a maximum period of 10 years, this would cause a $200,000-per-year reductionin reported earnings ($2 million/10 years). Because the write-offs of goodwill are not tax-deductible expenses for company C, the company suffers the full amount of the deductionwithout any tax relief. On the other hand, firm D would realize $800,000 in real cash savings($2,000,000 ¥ 0.40) over 10 years, because firm D is allowed to deduct goodwill amorti-zation for tax purposes. Hence, the firm could pay $800,000 more due to this goodwill taxadvantage alone.
Table 17.2 The effects of a tax loss carryforward
Year 1 Year 2 Year 3 Total values
Company A without mergerEarnings before taxes $100,000 $100,000 $100,000 $300,000Taxes (40%) 40,000 40,000 40,000 120,000Earnings after taxes $ 60,000 $ 60,000 $ 60,000 $180,000
Company A with mergerEarnings before taxes $100,000 $100,000 $100,000 $300,000Tax loss carryforward 100,000 100,000 20,000 220,000Earnings before tax $ 0 $ 0 $ 80,000 $ 80,000Taxes (40%) 0 0 32,000 32,000Earnings after taxes $100,000 $100,000 $ 68,000 $268,000

THE CAPITALIZATION RATE An important advantage of mergers is the fact that earnings oflarger companies are capitalized at lower rates. The securities of larger companies have better mar-ketability than those of smaller companies. Larger companies are also better known amonginvestors. An acquiring company can develop these factors, which lead to lower required rates ofreturn and higher price–earnings ratios. Consequently, the value of the acquiring firm exceedsthe values of the companies operating separately.
A potential benefit of international acquisition is the lower required rate of return for theacquiring company. The required rate of return varies among countries because the cost of capitalis different from country to country. As a result, companies in some countries may find acqui-sitions more attractive than companies in other countries.
DEBT CAPACITY The appropriate mix of debt and equity reduces the overall cost of capital andthus raises the market value of the firm. There are two situations in which a merger can raise thedebt capacity for the acquiring company above the sum of the debt capacities for the individualfirms prior to the merger. First, there are companies that fail to make optimum use of debt.Second, it is frequently possible for the acquiring company to borrow more than the companieswere able to borrow individually.
Companies normally finance a portion of international acquisitions with borrowed funds.Companies in some countries have more flexibility to borrow, because investors and creditors inthese countries are more receptive to higher debt ratios. The debt ratio for most companies inDenmark, Finland, Norway, and Sweden, for example, is higher than the comparable debt ratiofor American companies. In other words, companies in Scandinavian countries have more flex-ibility to borrow than US companies. Thus, US companies may be more successful in interna-tional acquisitions because they can borrow in countries where higher degrees of financial leverageare tolerated than in the USA.
440 CORPORATE STRATEGY AND FOREIGN DIRECT INVESTMENT
Example 17.4
Suppose that the cost of debt (6 percent), the cost of equity (10 percent), the tax rate (50percent), and annual earnings after taxes ($10,000) are the same for company X and firmY. Company X’s optimal capital structure is 20 percent debt and 80 percent equity. Firm Yis a multinational company and thus enjoys a higher debt ratio of 60 percent without addi-tional risk. Compare the cost of capital for these two companies and their market value.
The weighted average costs of capital are 8.6 percent [(0.20 ¥ 0.06)(1 - 0.50) + (0.80¥ 0.10)] for company X and 5.8 percent [(0.60 ¥ 0.06)(1 - 0.50) + (0.40 ¥ 0.10)] for firmY. Market values are $116,279 for company X ($10,000/0.086) and $172,414 for firm Y($10,000/0.058). The multinational firm enjoys a lower cost of capital, a higher marketvalue, and a higher share price because it has greater borrowing capacity. As cheaper debtis added to the capital structure, the cost of capital falls. This increases the value of the firm.Because this increase in the firm’s value accrues to the owners of the firm, the price of thefirm’s stock rises.

OTHER CONSIDERATIONS A variety of other factors affect international acquisitions: exchangerate movements, country barriers, and strategic choices, among others.
The ideal time for Japanese investors to buy a US company is when the spot rate of the USdollar is perceived to be very low and is expected to appreciate over time. Several studies haveconfirmed that international acquisitions are, in fact, influenced by exchange rate movements. Astudy by Rohatyn (1989), for example, found that the combination of a relatively weak dollarand a strong Japanese stock market in the late 1980s encouraged Japanese acquisitions of USfirms.
Many national governments impose explicit and implicit barriers to foreign acquisitions oftheir domestic companies. These barriers prevent or discourage international acquisitions ratherthan offering advantages to specific acquiring companies. All countries have one or more agen-cies that monitor mergers and acquisitions, but they vary among countries. International acqui-sitions are tolerated more in the USA than in Japan. Consequently, it is much easier for Japaneseinvestors to purchase a US firm than for US investors to purchase a Japanese firm.
To achieve corporate growth, companies these days view the world as a total business com-munity. They consider international acquisitions as a viable alternative for achieving a corporategrowth strategy. Newman (1990) suggested that a growth-oriented company can globally closefour types of growth gaps between its sales potential and its current actual performance. Aproduct-line gap can be closed by introducing improved or new products. A distribution gapmay be reduced by expanding an existing distribution network. A usage gap is reduced by induc-ing current nonusers. A competitive gap can be closed by making inroads into the market posi-tion of direct competitors. These strategic choices encourage companies to engage in internationalacquisitions.
QUESTIONS 441
SUMMARY
Once companies decide to enter new foreign markets, their next concern is how to enter the foreignmarket. Theory views the construction of new plants, mergers and acquisitions, joint ventures, equityalliances, licensing agreements, franchising agreements, and contract manufacturing as foreign-entryalternatives through investment. This chapter has covered a number of practical issues in foreigndirect investment, such as the benefits and drawbacks of foreign investment, inflows of foreigninvestment to developing countries; and international mergers and acquisitions.
Questions
1 What are foreign market-entry alternatives?2 Are US government restrictions on imports likely to increase or decrease foreign direct
investment in the USA?

442 CORPORATE STRATEGY AND FOREIGN DIRECT INVESTMENT
3 It is fair to assume that Toyota and Ford are automobile manufacturers that desire to benefitfrom economies of scale. Suppose that Toyota decides to establish distribution dealershipsin foreign countries, while Ford decides to establish manufacturing subsidiaries in foreigncountries. Which company is more likely to benefit from economies of scale? Whichcompany has less to lose if the venture fails?
4 What are the distinct alternatives available to companies for their foreign investment?5 What is the major difference in mergers and corporate governance between the USA and
Japan?6 Discuss some reasons for the recent decline of foreign direct investment in developing
markets.7 Explain why mergers are often more difficult to evaluate than the establishment of new
production facilities.8 What are the factors affecting international acquisitions?
Problems
1 GM is analyzing the acquisition of a British company for $1 million. The British companyhas expected cash flows of $90,000 per year. The synergistic benefits of the merger willadd $10,000 per year to cash flow. Finally, the British company has a $50,000 tax loss carryforward that can be used immediately by GM. GM is subject to a 40 percent tax rateand has a 10 percent cost of capital. Should GM acquire this British company?
2 The cost of debt (10 percent), the cost of equity (15 percent), the tax rate (50 percent),and annual earnings after taxes ($10,000) are the same for a domestic firm and a multi-national company. The firm’s target debt ratio (optimum capital structure) is 20 percent,while the company’s target debt ratio is 50 percent.(a) Determine the weighted average costs of capital for these two enterprises.(b) Determine the market values of the two enterprises.
3 Assume that the worldwide profit breakdown for Ford is 85 percent in the USA, 5 percentin Japan, and 10 percent in the rest of the world. On the other hand, the worldwide profitbreakdown for Toyota is 40 percent in Japan, 35 percent in the USA, and 25 percent inthe rest of the world. Earnings per share are $5 in the USA, $8 in Japan, and $10 in therest of the world for both companies.(a) What are the weighted average earnings per share of Ford and Toyota?(b) Which company is likely to have the international competitive advantage?
4 We will assume that IBM is analyzing the acquisition of a privately held French company.The French company is more similar to Low Tech (LT) than any other company whose stockis traded in the public market. To establish a fair market price for the French company, IBMhas compiled the statistics presented in the following table. Estimate the market value of

CASE PROBLEM 17 443
the French company (FM) in the following three ways: (a) the price–earnings ratio, (b)market value/book value, and (c) the dividend growth model.
Variables French company Low Tech
Earnings per share $ 2.00 $ 4.00Dividend per share in year 1 $ 1.50 $ 2.00Annual dividend growth rate 0.04 0.04Price per share ? $40.00Book value per share $16.00 $20.00Cost of equity ? 0.14Number of shares outstanding 1 million 1.2 million
REFERENCES
BenDaniel, D. J. and A. H. Rosenbloom, eds., TheHandbook of International Mergers and Acquisi-tions, Englewood Cliffs, NJ: Prentice Hall, 1990,pp. 1–24.
Ferdows, K., “Making the Most of Foreign Facto-ries,” Harvard Business Review, Mar./Apr. 1997,pp. 74–88.
King, A. M., “Merger Accounting Magic May Dis-appear,” Strategic Finance, Jan. 2000, pp. 39–43.
Lehner, U. C., “Money Hungry,” The Wall StreetJournal, Sept. 18, 1997, pp. R1, R4.
Newman, L. R., “Strategic Choices,” in D. J. BenDaniel and A. H. Rosenbloom, eds., TheHandbook of International Mergers and Acquisi-
tions, Englewood Cliffs, NJ: Prentice Hall, 1990,pp. 1–24.
Rohatyn, F., “America’s Economic Dependence,”Foreign Affairs, Winter 1989, pp. 53–65.
Solnik, B. and D. McLeavey, International Invest-ment, New York: Addison Wesley, 2003, ch. 9:The Case for International Diversification.
Spindle, B., “Japanese Companies Speed Up Sales ofCross-Holdings,” The Wall Street Journal, Mar. 7,2000, p. A18.
The World Bank, Global Development Finance,Washington, DC: The World Bank, 2003.
The World Bank, Global Economic Prospects, Wash-ington, DC: The World Bank, 2003.
Case Problem 17: BP’s Acquisition of Amoco
On December 31, 1998, British Petroleum PLC (BP) bought Amoco Corp., the fourth-largestUS oil company, for $52.41 billion in stock, then the largest industrial merger in history. Thisdeal surpassed the $40.5 billion dollar purchase of Chrysler Corp. by Germany’s Daimler-BenzAG, completed in November 1998. The combined company, named BP Amoco, would remainthe world’s third-largest oil company, but the deal would make it a bigger rival to the numberone, Royal Dutch/Shell, and the number two, Exxon Corp., in size and scope (see figure 17.7):$108 billion in annual revenue, 14.8 billion barrels in oil and gas reserves, 1.9 million barrelsof daily oil production, $6.4 billion in annual profit, $132 billion in market value, and 100,000

444 CORPORATE STRATEGY AND FOREIGN DIRECT INVESTMENT
employees. Amoco shareholders received a 0.66 BP American depository receipt for each shareof Amoco. This price represents a premium of about 15 percent to the value of Amoco beforethe merger. BP used the pooling-of-interest accounting treatment in acquiring Amoco insteadof the purchase-of-asset accounting treatment.
“The potential for cost-cutting and improving efficiencies is enormous,” said analyst FadelGheit at Fahne-Stock & Co. “There will be no weakness in the new company, which will havethe two top international players looking over their shoulders.”
By combining operations, BP Amoco contended that it would cut $2 billion in annual costsfrom its operations by the end of the year 2000, boost its annual pretax profits by a fewhundred million dollars in the next 2 years, and reduce the cost of capital substantially. Thiscombined company failed to increase its earnings in 1999, but the merger boosted shareholdervalue substantially through December 1999.
BP had already demonstrated that it knows how to hold down costs, most notably duringa big reorganization that took place in the early 1990s, when it slashed its payroll deeply. Now,led by Chief Executive John Brown, BP was expected to apply some of the same discipline toAmoco, whose performance on the cost-cutting front had lagged. But, just as important, therewas also the potential for substantial growth. The combined company’s revenues would enableit to finance more development itself, keep costs down, and help win more victories at auc-tions of oil reserves.
Moving Up the Ranks
Reserves1 vs. market capitalization2
The supermajors
Exxon RD Shell Group
BP Amoco
BP3
Chevron Mobil
AmocoTotal
ElfEnronCorp.
Phillips
Texaco
$200
150
100
50
00 5,000 10,000 15,000 20,000
Oil/NGL/Gas reserves, in millions of barrels equivalent
Mar
ket
cap
ital
izat
ion
, in
bill
ion
s
1Excluding affiliates.1997 data3Includes associated undertaking (Abu Dhabi) Note: Worldwide publicly traded companies included
2AS of July 24, 1998; on combined basis for BP Amoco
Source: Annual report for BP and Amoco: Petrompanies for the remainder, Datastream
D
Figure 17.7 Major oil companies: their reserves and market capitalizationSource: BP Amoco.

CASE PROBLEM 17 445
Case Questions
1 Explain how BP Amoco could cut $2 billion in costs and boost annual pretax profits by afew hundred million dollars for the first 2 years.
2 Explain how this merger could reduce its cost of capital substantially.3 Why did BP treat its merger with Amoco as a pooling transaction rather than a purchase
transaction?4 Explain how the BP–Amoco merger could boost its shareholder wealth as reflected by its
stock price. According to the case, the combined company did not earn more money afterthe merger, but its stock price increased. How do you explain this apparent conflict betweenearnings and stock price?
5 Briefly explain American depository receipts. The last closing price per share for Amocostock was about $52. What was the closing price of BP American depository receipts (ADRs)on its last trading day?
Analysts stated that the assets of these two companies complimented each other. BPbrought a huge worldwide exploration and production operation to the company, plus a strongEuropean retail network. As for Amoco, it was the largest natural gas producer in North Americaand had a large US gasoline marketing network. Both companies had petrochemicals opera-tions that would become among the largest in some areas. Both also operated in the nichearea of solar energy and would pose a challenge to that market’s leader, Germany’s SiemensAG.
More specifically, BP Amoco Chairman John Brown said that beyond the projected $2 billionin savings, he expected additional savings and growth opportunities. He pointed to such areasas Azerbaijan, the oil-rich Central Asian nation where both companies are major players. Othersynergies would include deeper-water exploration and production, where BP would bring itsexpertise to Amoco’s fields in the Gulf of Mexico. Similarly, the deal could combine Amoco’slower development costs with BP’s cheaper exploration costs.
Since BP announced its proposed acquisition of Amoco in August 1998, a wave of mergeractivity has hit the oil industry. These more recent acquisitions include Exxon’s agreement tobuy Mobile for $75 billion, BP Amoco’s proposed merger with Arco for $25 billion, the agree-ment by France’s Total SA to buy Belgium’s Petrofina SA for $15 billion, and proposed alliancesamong national oil companies of Brazil, Mexico, Saudi Arabia, and Venezuela. Why have allthese oil mergers and alliances happened in recent years? First, the most successful compa-nies, such as BP and Exxon, had already slashed costs. When costs have been cut to the bone,merger remains a route to higher profits. Second, advances in drilling and other oil technolo-gies have enabled oil companies to discover previously untapped oil fields. In addition, thesenew technologies have allowed hundreds of players to produce ever larger amounts of petro-leum at ever lower costs.

446 CORPORATE STRATEGY AND FOREIGN DIRECT INVESTMENT
6 Some websites, such as www.dbc.com and www.quicken.com, provide many pieces of infor-mation about publicly held companies for investors. Use several websites of your choice tocompare some key financial statistics of BP Amoco with those of its major competitors.
Sources: B. Bahree, “Big Oil Mapped Mergers Before Turmoil,” The Wall Street Journal, Dec. 9, 1998, p. A17;R. Frank and S. Liesman, “While BP Prepares New US Acquisition, Amoco Counts Scars,” The Wall StreetJournal, Mar. 31, 1999, pp. A1, A8; G. Steinmetz, C. Goldsmith, and S. Lipin, “BP to Acquire Amoco inHuge Deal Spurred by Low Energy Prices,” The Wall Street Journal, Aug. 12, 1998, pp. A1, A8; and BP AmocoAnnual Report, 1998 and 1999.

Opening Case 18: External Factors Affecting Foreign Project Analysis
Foreign-exchange rates, interest rates, and inflation are three external factors thataffect multinational companies (MNCs) and their markets. Changes in these threefactors stem from several sources, such as economic conditions, government policies,monetary systems, and political risks. Each factor is a significant external variable thataffects areas such as policy decisions, strategic planning, profit planning, and budgetcontrol. To minimize the possible negative impact of these factors, MNCs must establish and implement policies and practices that recognize and respond to theirinfluences.
These three factors – exchange rates, interest rates, and inflation – affect salesbudgets, expense budgets, capital budgeting, and cash budgets. However, they areparticularly useful when evaluating international capital budgeting alternatives.Foreign-exchange rates have the most significant effect on the capital budgetingprocess. A foreign investment project will be affected by exchange rate fluctuationsduring the life of the project, but these fluctuations are difficult to forecast. There aremethods of hedging against exchange rate risks, but most hedging techniques areused to cover short-term positions.
The cost of capital is used as a cutoff point to accept or reject a proposed project.Because the cost of capital is the weighted average cost of debt and equity, interestrates play a key role in a capital expenditure analysis. Most components of projectcash flows – revenues, variable costs, and fixed costs – are likely to rise in line withinflation, but local price controls may not permit internal price adjustments. A capitalexpenditure analysis requires price projections for the entire life of the project. In some
CHAPTER 18
International CapitalBudgeting Decisions
The basic principles of analysis are the same for foreign and domestic investment projects.However, a foreign investment decision results from a complex process, which differs, in manyaspects, from the domestic investment decision.
Relevant cash flows are the dividends and royalties that would be repatriated by each sub-sidiary to a parent firm. Because these net cash flows must be converted into the currency of aparent company, they are subject to future exchange rate changes. Moreover, foreign investmentprojects are subject to political risks such as exchange controls and discrimination. Normally, thecost of capital for a foreign project is higher than that for a similar domestic project. Certainly,this higher risk comes from two major sources, political risk and exchange risk.
This chapter is composed of four major sections. The first section describes the entire processof planning capital expenditures in foreign countries beyond 1 year. The second section exam-ines how international diversification can reduce the overall riskiness of a company. The thirdsection compares capital budgeting theory with capital budgeting practice. The fourth sectioncovers political risk analysis.
18.1 The Foreign Investment Decision-Making Process
The foreign investment decision-making process involves the entire process of planning capitalexpenditures in foreign countries beyond 1 year. The 1-year time frame is arbitrary, but a 1-yearboundary is rather widely accepted. There are many steps and elements in this process. Eachelement is a subsystem of the capital budgeting system. Thus, the foreign investment decision-making process may be viewed as an integral unit of many elements that are interrelated. Herewe assume that the entire foreign investment decision-making process consists of 11 phases: (1)the decision to search for foreign investment, (2) an assessment of the political climate in thehost country, (3) an examination of the company’s overall strategy, (4) cash flow analysis, (5) therequired rate of return, (6) economic evaluation, (7) selection, (8) risk analysis, (9) implemen-tation, (10) expenditure control, and (11) post-audit.
18.1.1 The search for foreign investment
The availability of good investment opportunities sets the foundation for a successful investmentprogram. Hence, a system should be established to stimulate ideas for capital expenditures abroad and to identify good investment opportunities. Moreover, good investment opportuni-
448 INTERNATIONAL CAPITAL BUDGETING DECISIONS
countries, the inflation rate may exceed 100 percent during a 3-year period, a con-dition known as hyperinflation. These and other factors related to inflation make thecapital budgeting process extremely difficult.
Source: Paul V. Mannino and Ken Milani, “Budgeting for an International Business,” ManagementAccounting, Feb. 1992, pp. 36–41.

ties come from hard thinking, careful planning, and, frequently, large outlays for research anddevelopment.
The first phase in the foreign investment decision-making process is an analysis of the forcesthat lead some company officials to focus on the possibilities of foreign investment. If a companyrecognizes foreign investment as a legitimate program, its search for foreign investment oppor-tunities will start. The economic and political forces in the host countries are largely responsiblefor the expansion of foreign investment. Many companies also desire foreign investment to seeknew markets, raw materials, and production efficiency. Chapter 2 described these and othermotives for foreign investment in detail.
It is not easy to pinpoint one motive for a decision to invest abroad in any particular case orto find out exactly who initiated a foreign project. The decision to search for foreign investmentcomes at the end of a series of events, and it is a combination of several motivating forces andactivities of different persons. Typically, the decision to look abroad depends on the interactionof many forces. Considerations such as profit opportunities, tax policy, and diversification strate-gies are economic variables that may affect a decision to look overseas. In addition, environmentalforces, organizational factors, and a drive by some high-ranking officials inside a company couldbe major forces leading a company to look abroad.
18.1.2 The political climate
Political risks may exist for the domestic investment. Price controls may be established or lifted,some regulated industries may be deregulated, or quotas and tariffs on cheap imported compo-nents may be imposed. Certainly, there are more political risks in foreign investment. For onething, at least two national governments become involved in a foreign investment project – thatof the home country of the parent company and that of the host country of the subsidiary. Thegoals of the two countries may differ; laws may change; rights to repatriate capital may be mod-ified; and, in an extreme situation, assets may be seized by a host government without adequatecompensation.
One major concern of MNCs is the possibility that the political climate of a host countrymay deteriorate. The multinational financial manager must analyze the political environment ofthe proposed host country and determine whether the economic environment would be recep-tive to the proposed project. In general, projects designed to reduce the country’s need for importsand thus save foreign exchange are given the highest priority by the host government.
Political actions, such as exchange controls and discrimination, adversely affect company oper-ations. Thus, the analyst should emphasize such factors as the host government’s attitudes towardforeign investment, the desire of the host country for national rather than foreign control, andits political stability. The analyst should also determine whether adequate and prompt compen-sation is guaranteed if a host country nationalizes alien assets in the public interest.
18.1.3 The company’s overall strategy
If the initial screening of the political climate is favorable, the MNCs can move on to the nextstage of the decision-making process. The analyst then assesses the usefulness of each alternativewithin the company’s overall strategy to determine how foreign operations may perpetuate current
THE FOREIGN INVESTMENT DECISION-MAKING PROCESS 449

strengths or offset weaknesses. This approach allows a company to reduce alternatives to a man-ageable number. At this stage, the company must check whether the project conflicts withcompany goals, policies, and resources. The analyst must also evaluate whether the company hasthe experience to handle the project and how the project could be integrated into existing pro-jects.
The company’s overall strategy consists of objectives, policies, and resources. In capital expen-diture analysis, there are objectives to be attained and policies designed to achieve these objec-tives. If a particular set of policies is not consistent with the stated objectives, either the policiesor the objectives should be revised. The company must also have resources necessary to carry outits policies. If resources are not available, they must be acquired, or the policies and/or the objec-tives must be revised.
THE COMPANY GOAL The primary goal of the MNC is to maximize its stock price. The marketprice of the firm’s stock reflects the market’s evaluation of its prospective earnings stream overtime and the riskiness of this stream. Thus, the company must attempt to accept projects whoseprofits are higher and whose risks are lower.
COMPANY POLICY If the company has carefully established policies to achieve its goal, it canovercome the threat of competitors and use its oligopolistic advantages. The company shouldsystematically evaluate individual entry strategies in foreign markets, continuously audit the effec-tiveness of current entry modes, and use appropriate evaluation criteria.
COMPANY RESOURCES Resources are assets that enable the company to carry out its objectivesand policies; they include marketing skills, management time and expertise, capital resources,technological capabilities, and strong brand names.
18.1.4 Cash flow analysis
The fourth stage of the screening process involves a standard cash flow analysis. The after-taxcash outflows and inflows directly associated with each project must be estimated to evaluatecapital investment alternatives. An MNC must forecast its expected expenditures for the pro-posed project. Ordinarily, it obtains these forecasts from data of similar ventures. A companymay also make forecasts by such techniques as the percent-of-sale method or a linear regressionanalysis. An important difference in the application of cash flow analysis for foreign investmentis that a company must make two sets of cash flow analyses, one for the project itself and onefor the parent company.
THE DEMAND FORECAST The first step in analyzing cash flows for any investment proposal isa forecast of demand. These estimates of usage are highly correlated with historical demand, pop-ulation, income, alternative sources of products, competition, the feasibility of serving nearbymarkets, and general economic conditions.
There are a number of reasons for emphasizing market size in the investment decision-makingprocess. First, the expected market size can be used as an indication of profit possibilities for theproposed investment project. Second, small markets tend to have high uncertainty. If a market
450 INTERNATIONAL CAPITAL BUDGETING DECISIONS

is small, the MNC has little or no leeway in case of an erroneous estimate. Third, small marketsare not worth the effort. Because management is one of scarce resources in a company, the pro-posed project should be large enough to support management time on project analysis.
DUTIES AND TAXES Because foreign investment cuts across national boundaries, a unique setof tax laws and import duties may be applicable. An MNC must review the tax structure of thehost country. In this analysis, the evaluator would include the definition of a taxable entity, statu-tory tax rates, tax treaties, treatment of dual taxation, and tax incentive programs. The MNCshould also know whether the host government imposes customs duties on imported productionequipment and materials not obtainable from local sources.
FOREIGN-EXCHANGE RATES AND RESTRICTIONS Another important feature of foreign invest-ment analysis is that project inflows available to the investor are subject to foreign-exchange ratesand restrictions. When the host country has a stable exchange rate, no problems are presented.However, if the exchange rate is expected to change or allowed to float, cash flow analysis becomesmore complicated, because the analyst must forecast the exchange rate that may be applicable toconvert cash flows into hard currencies.
It is equally important to recognize that many host governments have various exchange controlregulations. Under these regulations, permission may be required to buy foreign exchange with local currency for payment of loan interest, management fees, royalties, and most otherbillings for services provided by foreign suppliers. Processing applications for permission to purchase foreign exchange may take a long time. Moreover, the granting of permission to buyforeign exchange does not guarantee that a related foreign exchange will be available in time,because commercial banks can allocate only such amounts as are made available by a centralbank.
Many factors affect the blockage of funds to nonresidents. They include an expected short-age of foreign exchange, a long-run deficiency of the foreign exchange, and certain types ofdomestic political pressures. If all funds are blocked in perpetuity, the value of a project is zeroto the parent company. However, in actuality funds are likely to be only partially blocked, becauseMNCs have many ways to remove blocked funds. These methods include transfer price adjust-ments, loan repayments, royalty adjustments, and fee adjustments. Furthermore, most host coun-tries limit the amount of fund transfers to nonresidents or block the transfer of funds only on atemporary basis. Nevertheless, MNCs must analyze the effect of blocked funds on project return.It is critical that an analyst determines the amount of blocked funds, their reinvestment return,and ways in which funds can be transferred under the host country’s law.
PROJECT VERSUS PARENT CASH FLOWS To determine after-tax profits from a proposed project,the MNC must develop a demand forecast, forecast its expected expenditures, and review thetax structure of the host country. The estimated sales, less estimated expenses, plus noncashoutlays such as depreciation, gives the cash inflows from operations.
Typically, an MNC desires to maximize the utility of project cash flows on a worldwide basis.The MNC must value only those cash flows that can be repatriated, because only these fundscan be used for investment in new ventures, for payment of dividends and debt obligations, andfor reinvestment in other subsidiaries. Project cash flows would have little value if they could notbe used for these alternatives.
THE FOREIGN INVESTMENT DECISION-MAKING PROCESS 451

Project cash flows and parent cash flows can be substantially different due to tax regulationsand exchange controls. Moreover, some project expenses, such as management fees and royalties,are returns to the parent company. In general, incremental cash flows to the parent company areworldwide parent cash flows after investment minus worldwide parent cash flows before invest-ment. These differences raise the question of which cash flows should be used as the relevantcash flows in project evaluation. Because the value of a project is determined by the net presentvalue of future cash flows to an investor, a foreign investment analyst should use cash flows available for repatriation as the relevant cash flows. Hence, the MNC must analyze the impactof taxation, exchange controls, and other operational restrictions on cash flows to the parentcompany.
CAPITAL BUDGETING AND TRANSFER PRICING Cash flow analysis of a foreign investmentproject involves many unique environmental variables. They include (1) different tax systems,(2) foreign-exchange risk, (3) project versus parent cash flows, (4) restrictions on remittance offunds, and (5) political, financial, and business risks. In these five environmental variables, atransfer pricing policy is an integral part of each of the following three issues: First, MNCs shouldknow the amount of funds they can withdraw from their foreign investment. Transfer priceadjustments, dividends, royalties, and management fees are the only techniques to withdrawfunds where there are restrictions on fund flow movements. Second, transfer pricing policies areregarded as one of the best ways to reduce a variety of taxes, such as income taxes, tariffs, andother taxes. Third, transfer pricing policies are one of the better means of minimizing foreign-exchange losses from currency fluctuations, because they enable MNCs to shift funds from onecountry to another. However, it is important to understand that use of market-based transferprices may lead to the better investment decision, because transfer price adjustments may sig-nificantly distort the profitability of a foreign project.
18.1.5 The cost of capital
The cost of capital is the minimum rate of return that a project must yield in order to be acceptedby a company. This minimum rate of return is sometimes called the discount rate or the requiredrate of return. The cost of capital is an extremely important financial concept. It acts as a majorlink between the firm’s foreign investment decision and the wealth of the owners as determinedby investors in the global marketplace. It is in effect the “magic number” used to decide whethera proposed foreign investment will increase or decrease the firm’s stock price. Clearly, only thoseprojects expected to increase stock price would be accepted. Because it plays a key role in inter-national capital expenditure analysis, chapter 19 discusses the cost of capital for foreign invest-ment projects in detail.
18.1.6 Economic evaluation
Once cash flows and the required rate of return have been determined, the company begins theformal process of evaluating investment projects. Many techniques have been developed for eval-uating projects under conditions of certainty. They range from simple rules of thumb to sophis-ticated mathematical programming methods. The four most commonly used methods for an
452 INTERNATIONAL CAPITAL BUDGETING DECISIONS

economic evaluation of individual projects are payback, average rate of return, internal rate ofreturn, and net present value.
The literature on capital expenditure analysis favors the net-present-value and internal-rate-of-return methods, which are sometimes called the discounted cash flow approaches. The twodiscounted cash flow approaches provide a more sophisticated basis for ranking and selectinginvestment projects, because the payback and average-rate-of return methods have various limi-tations. These two methods clearly recognize that money has a time value and that money in thenear future is more valuable than money in the distant future. They also use the cash flows of aproject over its entire life span. Analysts can avoid difficult problems underlying the measure-ment of income by using cash flows, thus eliminating such irrelevant influences as depreciationmethods and inventory valuation.
The net present value of a project is the present value of its expected cash inflows minus thepresent value of its expected cash outflows. The internal rate of return is the discount rate thatequates the present value of the net cash flows to the present value of the net cash investment,or the rate that provides a zero net present value. The decision rule tells us to (1) accept a projectif its net present value is positive and (2) accept a project if its internal rate of return is greaterthan a firm’s cost of capital.
The net-present-value and internal-rate-of-return methods lead to the same decision in manysituations. These two rules lead to the same decision if the following conditions hold:
1 Investment proposals under consideration are mutually independent and they are free ofcapital rationing constraints.
2 All projects are equally risky, so that the acceptance or rejection of any project does not affectthe cost of capital.
3 A meaningful cost of capital exists to the extent that a company has access to capital at thatcost.
4 A unique internal rate of return exists; every project has just one internal rate of return.
In the absence of these assumptions, the two discounted cash flow approaches may lead to dif-ferent decisions, thus making the capital budgeting decision much more complex.
When the net-present-value and internal-rate-of-return methods produce different answers,net present value is better for a number of reasons:
1 The net present value is easier to compute than the internal rate of return.2 If the primary goal of a firm is to maximize the value of the firm, the net-present-value
method leads to the correct decision, while the internal-rate-of-return method may lead toan incorrect decision.
3 A single project may have more than one internal rate of return under certain conditions,whereas the same project has just one net present value at a particular discount rate.
4 Once computed, the internal rate of return remains constant over the entire life of the project.This assumption about static conditions is hardly realistic during a period of rising interestrates and inflation. Uneven discount rates present no problems when the net-present-valuemethod is used.
5 In the net-present-value method, the implied reinvestment rate approximates the opportu-nity cost for reinvestment. However, with the internal-rate-of-return method, the impliedreinvestment assumption does not approximate the opportunity cost for reinvestment at all.
THE FOREIGN INVESTMENT DECISION-MAKING PROCESS 453

Although the net-present-value method is theoretically superior, the internal-rate-of-returnmethod has certain advantages. First, internal rate of return is easier to visualize and interpret,because it is identical with the yield to the maturity of bonds or other securities. Second, we donot need to specify a required rate of return in the computation. In other words, it does notrequire the prior computation of the cost of capital. Third, business executives are more comfortable with internal rate of return, because it is directly comparable to the firm’s cost ofcapital.
18.1.7 Selection
Each of the capital budgeting techniques described in the previous section measures the rate ofreturn on a uniform basis for all projects under consideration. A project or a set of projects willbe chosen at this stage if the following three assumptions hold: first, the company has a definitecutoff point that all projects must meet; second, all cash outflows and inflows from each projectare known with absolute certainty; and, third, the company’s investment programs are not con-strained by any lack of funds. The final selection of projects depends on three kinds of capitalbudgeting decisions: the accept–reject decision, the mutually exclusive choice decision, and thecapital rationing decision.
The selected project must successfully pass the accept–reject decision. If projects under con-sideration are mutually independent and not subject to capital rationing constraints, the companymust accept all projects whose expected rate of return exceeds its hurdle rate in order to maxi-mize stockholder wealth. The hurdle rate may be based on the cost of capital, the opportunitycost, or some other arbitrary standard. However, it is important to recognize the possibility that(1) certain projects may compete with each other and (2) available projects may exceed availablefunds. Mutual exclusiveness and capital rationing constraints are two cases in which otherwiseprofitable projects are rejected. Investment proposals are said to be mutually exclusive if the accep-tance of one project means the rejection of all the other projects. Capital rationing refers to anupper ceiling on the size of capital expenditures during a given period of time.
18.1.8 Risk analysis
Up to this point, we have assumed that the dollar cash flows will certainly occur. In reality, allforeign investment projects are subject to various risks – business and financial risks, inflationand currency risks, and political risks. A change in some of these risks may have a decisive impacton the financial consequences of a particular project. Furthermore, the risks vary widely fromcountry to country.
Only a few of the financial variables are normally known with a fair degree of accuracy inadvance. Investors are basically risk averters. If investors do not know in advance exactly whichfuture events will occur, they will have to determine the risk–return trade-off in order to chooseattractive projects.
Many MNCs use the risk-adjusted discount rate and the certainty equivalent approach toadjust for project estimates. The risk-adjusted discount rate is a rate that consists of the risk-less rate of return plus a risk premium. Assume that the cost of capital for a firm is 10 percent
454 INTERNATIONAL CAPITAL BUDGETING DECISIONS

when the riskless rate of return is 7 percent. This 3 percent difference between the cost of capitaland the riskless rate of return reflects the degree of risk for the company. The company mayincrease its discount rate by 2 percent to a total of 12 percent for a mildly risky project, by 5percent to a total of 15 percent for a more risky project, and so on. Hence, the risk-adjusted dis-count rate accounts for the time value of money and the relative risk of the project in terms ofa risk premium.
The certainty equivalent approach is a method used to adjust for project risk in the numer-ator of the net-present-value formula. In other words, while the risk-adjusted discount rate adjustsfor risk in the denominator of the net-present-value formula, the certainty equivalent approachadjusts for risk in the numerator of the same equation.
When an analyst uses the certainty equivalent approach, the annual cash flows are multipliedby a certainty equivalent coefficient, which is a certain cash flow divided by an uncertain cashflow. If the analyst is indifferent between a certain $140 and an uncertain $200, its coefficientis 0.70 ($140/$200). The coefficient assumes a value of between 0 and 1. It varies inversely withrisk. If a firm perceives greater risk, it uses a lower coefficient that would deflate the dollar returnvalue. Once all the risky cash flows are adjusted downward to reflect uncertainty through the useof the coefficient, the analyst then discounts these certain cash flows at the risk-free rate of inter-est to determine the certain net present value.
18.1.9 Implementation, control, and post-audits
The last three steps of the capital budgeting system consist of implementation, expenditurecontrol, and post-audits.
IMPLEMENTATION Authorization to expend funds for the accepted projects may be obtainedby submission of individual capital expenditure requests in accordance with formal proce-dures set forth by the budget director. These procedures typically cover the use of standard forms, the channels for submission and review, and the authority requirements and limits forapproval.
CONTROL There is a specific phase of the capital budgeting process during which the practi-cal cost control of a foreign project becomes important. This is the time between the approvalof the project and its completion. The expenditure control of a foreign project in process isdesigned to increase the probability that it is completed within the established guidelines. Thisphase is particularly important for foreign investment projects, because operations are typicallysupervised from a distance.
POST-AUDIT Because multinational capital budgeting decisions are made on the basis ofassumptions in foreign countries, estimates and actual results may differ. Thus, when a foreignproject is completed, the firm should perform a post-audit on the entire project to determine itssuccess or failure. The results of post-audits enable the firm to compare the actual performanceof a foreign project with established standards. If the capital budgeting process used by an MNChas been successful, the system is likely to be reinforced. If the system has been unsatisfactory, itis likely to be revised or replaced for future foreign projects.
THE FOREIGN INVESTMENT DECISION-MAKING PROCESS 455

456 INTERNATIONAL CAPITAL BUDGETING DECISIONS
Example 18.1
In September 2004, the government of Jordan requested that the International TV Corpo-ration establish a plant in Jordan to assemble television sets. The company wishes to invest1,500 Jordanian dinars in the proposed plant in return for an increase in tariffs against othercompanies in the industry. The JD1,500 will be financed with only common stock, all ofwhich will be owned by the parent company. The plant is to be depreciated over a 5-yearperiod on a straight-line basis for tax purposes. It is expected to have a salvage value ofJD750 at the end of 5 years. The company will pay income taxes at 20 percent on netincome earned in Jordan and no withholding taxes on dividends repatriated. In this case,the United States also has a 50 percent tax rate with direct credit for Jordanian taxes. Thismeans that net income earned in Jordan by US companies will be subject to a total of 50percent tax. Expected revenues, operating costs, and applicable exchange rates are givenin tables 18.1–18.3. There is no restriction on dividend repatriation, but depreciation cashflows may not be repatriated until the company is liquidated. These cash flows can be rein-vested in Jordanian government bonds to earn tax-exempt interest at the rate of 8 percent.The company’s cost of capital is 15 percent.
Table 18.1 shows the projected cash flows for the proposed plant. It is important to rec-ognize that for the first year a total tax of 50 percent (JD225) will be levied: 20 percent inJordanian tax (JD90) and 30 percent in US tax (JD135).
Table 18.1 Projected earnings after taxes for the proposed project
Year 1 Year 2 Year 3 Year 4 Year 5
Revenues JD1,500 JD1,650 JD1,800 JD1,950 JD2,100Operating costs 900 900 1,050 1,050 1,200Depreciation 150 150 150 150 150
Taxable income JD 450 JD 600 JD 600 JD 750 JD 750Total tax at 50% 225 300 300 375 375
Earnings after tax JD 225 JD 300 JD 300 JD 375 JD 375
Table 18.2 shows the depreciation cash flows and interest-compounded depreciation cashflows at the termination of the project at the end of 5 years. Thus, a total of JD880 will berepatriated to the USA along with the plant’s fifth-year earnings of JD375 at the end of 5 years.
The last two steps in the analysis are: (1) to convert the cash flows from dinars to dollarsand (2) to determine the net present value of the plant. Table 18.3 shows these two com-putation steps. It should be noted that the fifth-year cash flow of JD2,005 consists of dividends (JD375), the estimated salvage value of the plant (JD750), and the interest-accumulated depreciation cash flows (JD880).
The current exchange rate of five dinars to the dollar is expected to hold during the firstyear. However, the dinar is expected to depreciate at a rate of 5 percent per year after the

18.1.10 Real option analysis
The literature on capital investment analysis pays insufficient attention to the possibility of futureoptions over an investment project. Ordinarily, an investment project is evaluated as though acompany were committed to the project over its entire economic life. However, it may be moreprofitable to expand or retire an investment project before the end of its estimated economic liferather than continue its operation. When investment proposals are originally considered, keyfinancial variables are identified and assumptions are made in order to arrive at a choice. As time
THE FOREIGN INVESTMENT DECISION-MAKING PROCESS 457
Table 18.2 Depreciation cash flows
Year Depreciation Interest factor Terminal value,at 8% year 5
1 JD150 1.360 JD2042 150 1.260 1893 150 1.166 1754 150 1.080 1625 150 1.000 150
JD880
first year. The expected cash flows in dollars are obtained by dividing the cash flows in dinarsby the exchange rates. The dollar cash flows are then discounted at the firm’s cost of capital(15 percent) to arrive at a present value figure for each year. Cumulative net present valuesare the final amounts given in table 18.3. We see that, from the parent’s point of view, theplant would break even on a discounted cash flow basis during the fifth year. Because thenet present value of the project is positive ($19), the International TV Corporation shouldaccept the proposed plant in order to maximize the market value of the company. Theproject’s internal rate of return is approximately 17 percent. Because the internal rate ofreturn (17 percent) is greater than the cost of capital (15 percent), the internal-rate-of-return criterion also indicates acceptance.
Table 18.3 The parent’s net present value
Exchange Present value Cum. netYear Cash flows rate Cash flows at 15% pres. value
0 -JD1,500 5.00 -$300 -$300 -$3001 225 5.00 45 39 -2612 300 5.25 57 43 -2183 300 5.51 54 36 -1824 375 5.79 65 37 -1455 2,005 6.08 330 164 19

passes, some unforeseen problems can occur and they could affect these key variables. Initialassumptions may turn out to be incorrect, or perhaps some additional investment opportunitiesmay arise.
Real option analysis is the application of option pricing models to the evaluation of invest-ment options in real projects. Option pricing models work best for simple options on financialassets, such as stocks, interest rates, currencies or commodities, but they are also useful for foreigninvestment analysis, because a key variable faced by every foreign project is uncertainty. Cur-rency, political, and cultural risks are the most prominent additional risks in foreign investment.Additionally, business risk on foreign projects is higher than that of domestic projects. Whenuncertainty is high, an MNC’s investment opportunities can be viewed as real options (Butler2004). Real options include (1) options to expand or contract, (2) options to accelerate or delay,and (3) options to continue or retire.
18.2 Portfolio Theory
In the real world, practically no company or individual invests everything in a single project.Thus, it is useful to consider the risk and return of a particular project in conjunction with itscounterparts in existing assets or new investment opportunities. Portfolio theory deals with theselection of investment projects that would minimize risk for a given rate of return, or that wouldmaximize the rate of return for a given degree of risk. Such a portfolio is sometimes called theoptimum portfolio.
Markowitz and Sharpe developed a powerful technique for a simultaneous risk–return analy-sis of multiple projects. Although the technique was applied first for the selection of portfoliosof common stocks, it is also applicable to the evaluation of capital investment projects. Thisapproach employs two basic measures: an index of expected value and an index of risk. Theexpected value for a portfolio of investments is simply the sum of the individual present valuesfor the projects that make up the portfolio. The standard deviation as a measure of risk for theportfolio, however, is not so easily measured. There are many business situations in which therisks of individual projects tend to offset each other. Thus, successful diversification makes it pos-sible for the company to have the risk of a portfolio less than the sum of the risks of the indi-vidual projects.
458 INTERNATIONAL CAPITAL BUDGETING DECISIONS
Example 18.2
A company has two proposed projects in an isolated Caribbean island whose major indus-try is tourism: (A) build a suntan lotion factory and (B) build a disposable umbrella factory.Project A’s sales, earnings, and cash flows are highest in sunny years. Contrary to projectA, project B’s sales, earnings, and cash flows are highest in rainy years. Project A has a costof $800, while project B has a cost of $1,000. These two projects are mutually indepen-dent and their possible net cash flows at the end of 1 year are given in table 18.4. Assumethat the cost of capital is 5 percent.

PORTFOLIO THEORY 459
Because the expected net cash flow for each project is $1,000 ($2,000 ¥ 0.5 + $0 ¥ 0.5),their net present values (NPV) are computed as follows:
The standard deviation of a project (s) is computed as follows:
(18.1)
where Ri is the net cash flow associated with the ith event (i.e., a particular weather con-dition such as a sunny summer or a rainy summer), R is the expected net cash flow, and Pi
is the probability of the ith event. Thus, the standard deviations of projects A and B can beobtained as follows:
Project A has a net present value of $152 and project B has a net present value of -$48.Both projects have an equal standard deviation of $1,000. Project B would have no chanceof being accepted, because its expected net present value is negative. Project A has a pos-itive net present value of $152, but most investors are likely to reject the project becauseits risk is too high.
We can completely eliminate unsystematic risk by combining these two projects, becausethe unsystematic risks of individual projects tend to offset each other. Whether you have asunny year or a rainy year, the expected net cash flow of this combination is $2,000 andtheir combined net present value is $104 ($152 - $48). The standard deviation of this two-project portfolio is zero (0) because the portfolio always produces a net present value of$104. When we consider projects A and B separately, both projects are clearly undesirable.However, when we treat them as a portfolio, we find the portfolio acceptable.
s
s
A
B
= -( ) ( ) + -( ) ( ) =
= -( ) ( ) + -( ) ( ) =
$ , $ , . $ $ , . $ ,
$ $ , . $ , $ , . $ ,
2 000 1 000 0 50 0 1 000 0 50 1 000
0 1 000 0 50 2 000 1 000 0 50 1 000
2 2
2 2
s = -( )=Â R R Pi ii
n2
1
NPV
NPV
A
B
=( )
- =
=( )
- = -
$1 000
1 05800 152
1 000
1 051 000 48
1
1
,
.$ $
$ ,
.$ , $
Table 18.4 Net cash flows under different weather conditions
Net cash flows
Weather conditions Probability Project A Project B
Sunny year 0.50 $2,000 $ 0Rainy year 0.50 0 2,000

Total risk elimination is possible in example 18.2 because there is a perfect negative relationbetween the returns on projects A and B. In practice, such a perfect relation is rare. The returnson most domestic projects are highly interrelated with each other, because they depend on thesame state of economy. However, the returns on foreign projects and domestic projects are lessinterrelated with each other, because they depend on different states of economy. As a result,international diversification is more effective than domestic diversification.
18.3 Capital Budgeting Theory and Practice
18.3.1 Project evaluation techniques
Over 35 years have passed since Stonehill and Nathanson (1968) surveyed 110 US and non-USMNCs to determine their foreign capital budgeting practices. Since then, research on the subjecthas not only refined its theoretical base but also expanded the knowledge of actual practices usedby MNCs. The literature on foreign capital investment theory reveals that business firms shoulduse discounted cash flow techniques for ranking and selecting overseas projects, because thesemethods recognize the time value of money and employ cash flows of a project over its life span.
Table 18.6 (see Case Problem 18) illustrates the extent to which discounted cash flow methodswere used by MNCs that participated in various surveys from 1980 to 1994. These empiricalstudies revealed two important points: first, discounted cash flow approaches are more popularthan rules of thumb; and, second, internal rate of return is more popular than net present value.Thus, most MNCs use discounted cash flow approaches for ranking and selecting overseas pro-jects. The five studies cited in table 18.6 show that at least half of the respondents used dis-counted cash flow approaches, ranging from 50 percent according to Kelly’s study to 81 percentin Stanley’s study.
18.3.2 Company goals
Most leading finance textbooks now agree with Anthony (1960) and Donaldson (1963) that afirm should, first of all, maximize the wealth of stockholders. The best measure of stockholderwealth is the market value of a firm’s stock, because the market value reflects the effects of allfinancial decisions. The financial decisions made by the managers of a firm determine the levelof its stock price by affecting the riskiness and size of its earnings. In other words, the maxi-mization of stockholder wealth depends on the trade-off between risk and return. These rela-tionships are diagramed in figure 18.1. Although practically all financial decisions involve suchrisk–return trade-offs, this model is particularly important for capital budgeting decisions becausecapital investments are profitable, but they are subject to a variety of risks.
Investment decisions – usually requiring very large sums of money – are made in expectationof benefits over an extended period. Once capital budgeting decisions have been made, they areextremely costly to reverse. Most used plant and equipment have a limited market. In certainareas, production methods are rapidly outmoded by increasingly higher levels of technology.Moreover, most financial variables used in the analysis of capital expenditures are not accuratelyknown in advance. Because investors and business executives are risk averters, efficient manage-ment of capital expenditures has become essential for healthy company growth.
460 INTERNATIONAL CAPITAL BUDGETING DECISIONS

In other words, more sophisticated capital budgeting techniques may be economically justi-fied only if they increase the total value of a firm. Academic writers favor “sophisticated” capitalbudgeting techniques (e.g., the net-present-value method) over rules of thumb (e.g., the paybackmethod). They argue that use of sophisticated methods will lead to higher earnings and less risk,thereby increasing the market price of the common stock. Thus it seems reasonable to suspectthat a significant relationship exists between stock prices and capital budgeting practices. Thehypothesis may be stated in the following way: firms using a more sophisticated capital budget-ing system enjoy higher stock prices than do firms using a less sophisticated capital budgetingsystem.
Risk and performance measures based on the firm’s common stock market values are betterthan risk and performance measures based on any other criterion. However, most writers oncapital budgeting reject this view on the grounds that shareholders know little about corporatecapital budgeting practices. Therefore, previous research studies have determined firm risk andperformance measures from accounting data. To investigate the changes and effects of capitalbudgeting practices on risk and return, we can examine the results of capital budgeting studiesto test the following two hypotheses:
1 Firms using a more sophisticated capital budgeting system have greater profitability than firmsusing a less sophisticated system.
2 Firm using a more sophisticated capital budgeting system are less risky than firms using aless sophisticated system.
Our literature review indicated that only a handful of empirical studies had tested these twohypotheses. Some tested these two hypotheses for domestic investment projects, but these studiesfound no significant relationship between budgeting practices and risk or return. We found onlyone such study for foreign investment projects. The study of 121 respondents by Stanley andBlock (1984) revealed a strong interest in stockholder wealth maximization as the primary goalof the firm. In explaining why firms in their study might choose one capital budgeting methodover another, the factors of firm size, corporate goals, beta coefficients (systematic risk), andforeign sales as percent of total sales were used to test for significant relationships. However, theirstudy failed to establish any significant relationship between capital budgeting practices and earn-ings performance (stockholder wealth maximization) or risk (beta coefficients). Stanley and
CAPITAL BUDGETING THEORY AND PRACTICE 461
Constrains
Product safety
Hiring
Pollution controlAntitrust
And so on
Policy decisionLines of business
Size of firmType of equipment
Use of debt
Liquidity position
Return
Risk
Value of firm
Figure 18.1 The risk–return trade-off and company goals

Block, like other researchers, narrowly defined capital budgeting practices as the use or nonuseof specific capital budgeting methods, such as payback or internal rate of return.
18.4 Political Risk Management
Foreign investment decisions must be made today on the basis of the likely political climate formany years to come. Political risk is an assessment of economic opportunity against politicalodds. Thus, political risk assessment requires that MNCs evaluate both economic and politicalindicators. Political risk management refers to steps taken by companies to protect against eco-nomic losses from unexpected political events.
When the goals of MNCs and their host countries conflict, MNCs face a variety of politicalrisks. The primary goal of an MNC is to maximize the wealth of its stockholders. On the otherhand, most host countries desire to develop their economies through greater utilization of localfactors of production, in order to maintain more control over key industries through less relianceon foreign capital and know-how, and to strengthen their international position through fewerimports and more exports.
Multinational investors should understand the forces at work when political uncertaintyoccurs, so that they can forecast future business climates, establish appropriate objectives, andtake precautionary measures when necessary. In this section, we discuss the nature of politicalrisks, types of political risks, political risk forecasting, and responses to political risks.
18.4.1 The nature of political risks
Traditionally, conflicts between MNCs and host countries have occurred over such issues as con-version of an economy to the style of a specific political system, joint ventures, control of keyindustries, contribution to balance of payments, national sovereignty, and economic develop-ment. Such conflicts are not limited to developing countries. More subtle, yet very real, conflictsexist between MNCs and developed countries.
It is frequently difficult to separate political and economic risks. While government decisionsare political by definition, underlying forces behind the decisions may be purely economic. Forexample, funds to nonresidents may be blocked because of an unexpected shortage of foreignexchange or a long-run deficiency of the foreign exchange, instead of certain types of domesticpolitical pressures. Some government decisions are partly political and partly economic. TheUnited Nations imposed economic sanctions against Iraq in the fall of 1990 because of Iraq’sinvasion of Kuwait. The Organization of American States imposed economic sanctions againstHaiti in 1994 because of Haiti’s human rights violations. Finally, the USA and several otherWestern countries have imposed a variety of economic sanctions against Afghanistan, Cuba, Iran,Libya, and North Korea for many years.
Countrywide political risks depend on three broad groups of variables: political climate, eco-nomic climate, and foreign relations. The political climate may be measured by tendencies towardsubversion, rebellion, or political turmoil. Multinational investors should consider such factorsas levels of political violence, the existence of extreme tendencies among political parties, andrecurring governmental crises.
462 INTERNATIONAL CAPITAL BUDGETING DECISIONS

Investment analysts should make an overall assessment of the economic climate to protectforeign investment from political risks. Relevant economic factors include the likelihood of gov-ernment intervention in the economy, levels of interest and inflation rates, persistent balance-of-payments deficits, levels of foreign debts, and worsening monetary reserves.
Finally, multinational investors should determine the extent to which host countries manifesthostility toward other countries. Important factors here are incidence of conflict with their neigh-bors, evidence of an arms race, and sizes of defense budgets.
18.4.2 Types of political risk
Empirical studies have revealed some interesting findings about the attitudes of US and BritishMNCs toward political risk. Kelly and Philippatos (1982) surveyed 67 US companies to obtainthe perceived importance of five variables in political risk. Goddard (1991) surveyed 51 Britishcompanies to determine the importance of six variables in political risk. Ranked in descendingorder of importance, their findings appear in table 18.5. Although there are several different typesof political risk, these risks can be divided into two broad categories for all practical purposes:actions that restrict the freedom of a foreign company to operate in a given host environment,and actions that result in the takeover of alien assets.
OPERATIONAL RESTRICTIONS Actions that restrict the freedom of a foreign company includeoperational restrictions such as employment policies; locally shared ownership; loss of transferfreedom; exchange controls; financial, personal, or ownership rights; breaches or unilateral revi-sions in contracts and agreements; discrimination through taxes or compulsory joint ventures;and damage to property or personnel from riots, revolutions, and wars.
Funds are usually blocked in the host country when operational restrictions are imposed.There are a number of ways to remove blocked funds. The most obvious way is to arrange swapsbetween corporations. Here, each corporation lends to the other in the country where its ownfunds are restricted. Other methods include transfer price adjustments and other adjustments
POLITICAL RISK MANAGEMENT 463
Table 18.5 Types of political risk and their importance
USA UK
Rank Variable Rank Variable
1 Restrictions on remittances 1 Expropriation or nationalization2 Operational restrictions on 2 Political stability within the country
ownership, employment, andmarket shares
3 Expropriation or nationalization of 3 Restrictions on remittances and royaltiesdividends
4 Discrimination 4 Currency stability5 Breaches in agreements 5 Tax changes6 Others 6 Exchange controls
Source: Goddard, “Political Risk in International Capital Budgeting,” in R. K. Kolb, ed., The InternationalFinancial Reader, Miami, FL: Kolb Publishing, 1991, p. 360.

such as fees, royalties, and loan repayments. Of course, most of these methods raise some seriousethical and legal questions. Moreover, black market operations may not be available for relativelylarge transfers of money and highly visible transactions, such as an attempt to terminate companyoperations in a small, developing country.
EXPROPRIATION Sales of business assets to local shareholders, compulsory sales of businessassets to local and federal government units, and confiscation of business assets with or withoutcompensation all come under the heading of expropriation.
Ball and McCulloch (1999) say that many governments nationalize both foreign and domes-tic companies, and may do so for a number of reasons:
1 The government believes that it could run the business more efficiently.2 The government believes that the company is concealing its profits.3 Left-wing governments, oftentimes after being elected, nationalize business firms.4 Politicians wish to win popular support as they save jobs by putting dying industries on a
life support system.5 The government can control a company or industry by pumping money into the company
or industry.
Business operations in foreign countries are subject to the power of host countries. It is customaryto seize foreign assets for a public purpose without discrimination and with adequate compen-sation. Although these three rules are in accordance with traditional principles of internationallaw, they have often been ignored by some developing countries.
Kennedy (1993) analyzed 79 countries in terms of political regimes and their expropriationpolicies. This study revealed that during the 1960–87 period, these 79 developing countriesnationalized l,118 foreign companies in 599 separate actions. The overwhelming majority ofexpropriations were politically motivated acts that had been undertaken by only a few govern-ments. In fact, only 28 governments out of more than the 300 total accounted for two-thirds ofall acts of expropriation.
Figure 18.2 shows expropriation trends from 1960 to 1987. We could divide relations betweenMNCs and host governments into three eras: MNC domination (1945 to early 1960s),MNC–host government confrontation (mid-1960s to 1980), and MNC–host governmentrealignment (1980s). The history of expropriation activity by less developed countries tracks thesethree periods quite well. By the mid-1960s, the number of expropriation acts had risen signifi-cantly, but the forced divestment of foreign direct investment was most pronounced in the1970–9 period. In the 1980s, the number of expropriation acts dropped dramatically.
According to Kennedy (1993), there were six primary reasons why a significant upsurge inexpropriation would not return in the 1990s and beyond. First, the international demonstrationeffect today discourages expropriation, because market-oriented systems and privatization arebeing adopted even in the most socialist of countries. Second, unlike the expectations of tradi-tional dependency theorists, the history of mass expropriation has demonstrated that the eco-nomic consequences of such a policy are generally negative. Third, adverse economicconsequences would be further aggravated today by the lack of foreign aid from socialist coun-tries, which helped cushion this negative impact in the past. Fourth, if the move toward a market-oriented system and privatization creates significant real growth and prosperity for most people,
464 INTERNATIONAL CAPITAL BUDGETING DECISIONS

then the loss of sovereignty over key sectors may be politically accepted. Fifth, the enhanced capa-bilities of developing countries have reduced their sense of dependency on external factors andhave increased their policy options in managing multinational companies. Sixth, the currentpolitical impact of colonial or neocolonial experiences on foreign direct investment policy hasreceded.
18.4.3 Forecasting political risks
Once a manager has examined political risks and their implications, the manager shifts her atten-tion to forecasting these risks in foreign countries where her company has business interests. AsMNCs have become more experienced and more diversified, they have maintained political fore-casting staffs on the same level as economic forecasting staffs.
In political risk analysis, a manager gives special attention to the “nationalism” of a hostcountry. Nationalism represents loyalty to one’s country and pride in it, based on shared commonfeatures such as race, language, religion, or ideology. In other words, it is an emotion that canhinder or prevent rational dealings with foreigners. Some effects of nationalism on MNCs are:(1) requirements for minimum local ownership; (2) reservation of certain industries for local
POLITICAL RISK MANAGEMENT 465
100
80
60
40
20
0
Frequency of expropriations
1960 1962 1964 1966 1968 1970 1972 1974 1976 1978 1980 1982 1984 1986 1988 1990
Number of acts
Number of countriesexpropriating
Figure 18.2 Expropriation acts, by year
Source: C. R. Kennedy, “Multinational Corporations and Expropriation Risk”, MultinationalBusiness Review, Spring 1993, p. 45.

companies; (3) preference of local suppliers for government contracts; (4) limitations on numberand type of foreign employees; (5) protectionism based on quotas and tariffs; and (6) expropri-ation or confiscation of assets.
A number of political-risk assessment techniques are available to MNCs. Some popular tech-niques include the following:
• The delphi technique combines the views of independent experts in order to obtain thedegree of political risk on a given foreign project or a particular foreign country. The opin-ions of these experts about political risk are collected and averaged. One advantage of thismethod is that political-risk assessment is made easily and quickly. However, its major dis-advantage is that it is completely based on opinions rather than facts and analyses.
• The grand tour relies on the opinions of company executives visiting the country whereinvestment is being considered. Their visit usually involves a series of meetings with govern-ment officials, local businesspeople, and potential customers. This method places responsi-bility for political-risk assessment in the hands of those who must carry out the proposedinvestment project. But the results of such a visit can be very superficial and may produceonly selected pieces of information.
• The old hand depends upon the advice of an outside consultant. Typically, such consultantsare college professors, diplomats, local politicians, or businesspeople. The knowledge andexperience of the advisor determine the quality of the political-risk assessment.
• Some companies use quantitative analysis – statistical techniques – to assess political risk.The basic purpose of these statistical methods is to supplement personal judgment andincrease forecasting accuracy. The list of factors to be considered in quantitative methodsvaries from forecaster to forecaster. But all of these methods combine three major factors:external economic indicators, internal economic indicators, and political indicators.
MULTIPLE METHODS Any of the techniques described here may be used to assess political risk.Some companies may utilize a number of methods in an attempt to obtain a good picture of thesituation. If these methods should all produce about the same results, more confidence may beplaced in the findings. If they give widely divergent results, a more careful investigation is needed.Because political-risk assessment is extremely important for success or failure of a project, themultiple-method approach appears to be a sound policy.
18.4.4 Responses to political risks
Forecasting political risk is critical to an MNC in deciding on a particular project. The MNCcan protect itself against political risks with government insurance policies and guarantee pro-grams. Chapters 13 and 14 have described these in some detail.
DEFENSIVE MEASURES BEFORE INVESTMENT There are three types of defensive measuresbefore investment: concession agreements, planned divestment, and adaptation to host-countrygoals.
Many host countries have recently increased their surveillance of foreign operations withintheir borders. An MNC ought to negotiate concession agreements to minimize subsequent polit-
466 INTERNATIONAL CAPITAL BUDGETING DECISIONS

ical risks. The concession agreement spells out contractual obligations of the foreign investor andthe host government. Careful negotiations may result in contracts that address such critical issuesas provision for arbitration of disputes, funds remittances, transfer prices, local equity participa-tion, method of taxation, price controls, the right to exports, and limitations on nationality ofpersonnel.
Planned divestment has been frequently suggested as one of the most important preinvest-ment strategies in order to avoid subsequent operational restrictions and expropriations. Planneddivestment provides for the sale of majority ownership in foreign affiliates to local nationalsduring a previously agreed-upon period of time. Planned divestment is often a necessary condi-tion for entry into foreign markets, or it may be imposed on already existing companies.
The concession agreement specifies the rights and responsibilities of both the foreign companyand the host country, but it is often revised to adapt to changing host-country priorities. Whenthe foreign company sticks to the legal interpretation of its concession agreement, the host-country government uses pressures in areas not covered by the agreement. If these pressures donot work, the host-country government reinterprets the agreement to obtain changes from theforeign company. Thus, it is advisable for MNCs to voluntarily adapt to changing host-countrypriorities whenever possible.
DEFENSIVE MEASURES AFTER INVESTMENT Once managers have decided to invest and takepreinvestment defensive measures, they can use several operating strategies to cope with politi-cal risks. We have grouped them for convenience into two categories: strategies that are neces-sary to be a good citizen of the host country and strategies to alleviate political risks. In addition,joint ventures can be used to diffuse political risks.
Many foreign affiliates attempt to harmonize their policies with their host-country prioritiesand goals. They may hire an increasing number of local persons for positions initially held byrepresentatives of the parent-company management. They may share ownership with host-country private or public companies. They may develop and use local sources of supply for theirraw materials and component requirements. They may try to export their products to bolsterhost-country reserves of foreign exchange.
Many operational policies and organizational approaches can be used to alleviate political risks.MNCs may maintain technological superiority over local companies and other competing foreignfirms. The challenge here is to introduce technological improvements into the host country ona continuing basis. An MNC may integrate individual subsidiaries into a worldwide productionand logistical system through highly interrelated international operations. Under such an inte-gration, a subsidiary alone cannot operate or compete successfully, as is the case in the petroleumindustry. Control of key patents and processes, joint-venture arrangements, capitalization with athin equity base and a large local debt proportion, and control of key export markets for a sub-sidiary’s products are examples of policy actions that can alleviate political risks.
Joint ventures with local partners have been frequently suggested as one answer to nationaldemands for an ownership share in certain industries. A joint venture can improve the publicimage of a subsidiary, provide more capital, and deter operational restrictions. Joint ventures withinvestors from a number of different countries, such as the USA, Italy, and the UK, can makeoperational restrictions extremely costly, because they could distress private investors in all three countries and thus impair good economic relations with these national groups of businessexecutives.
POLITICAL RISK MANAGEMENT 467

468 INTERNATIONAL CAPITAL BUDGETING DECISIONS
SUMMARY
This chapter has focused on the capital investment decision-making process. Although we havebroken down the entire decision-making process for foreign investment projects into componentsand relationships for a detailed inspection, these stages should not be used mechanically. Some stepsmay be combined, some may be subdivided, and others may be skipped altogether without jeopar-dizing the quality of the capital budgeting system. It is likely, however, that several of these stepswill be in progress simultaneously for any project under consideration. For example, if expenditurecontrols and post-audits are not planned until the economic evaluation of a project is completed,the capital budgeting process will hardly be realistic. Decisions for expenditure controls and post-audits affect plans, just as planning decisions affect controlling decisions. Thus, the capital budget-ing process consists of several related activities that overlap continuously rather than following anideally prescribed order. Because all steps in the capital investment decision-making process are inter-woven, their relationships should not permanently place any one stage first or last in a sequence.
Foreign investment projects involve many complex variables, which do not exist in domestic pro-jects. Two major risks for foreign investment projects are political risk and foreign-exchange risk. Inchapters 9 and 10, we considered the nature of foreign-exchange risk and some methods to reduceit. In the last part of this chapter, we described the nature of political risk and some techniques tominimize it. A company may incur losses from political risks because of governmental action, whichinterferes with the completion of contractual obligations between the foreign company and its hostgovernment. Political risks cannot be predicted in the same way as credit losses and thus cannot beoffset precisely in measurable ways. Thus, MNCs must understand the types of political risks thatthey can expect to encounter, assess the likelihood of the encounter, and take various protective mea-sures to minimize the risks.
Project cash inflows and outflows are analyzed after first identifying foreign investment alterna-tives. Parent cash flows are then obtained by dividing the project cash flows by the exchange rates.Within this context, the net present value of parent cash flows must be positive for a foreign projectto be acceptably profitable. In conjunction with the earlier stages of analysis, some adjustmentsshould be made to facilitate risk.
Questions
1 List the 11 phases of the entire decision-making process for a foreign investment project.Should the decision-maker consider these stages one at a time or analyze several of themsimultaneously?
2 Given the added political and economic risks that exist overseas, are multinational com-panies more or less risky than purely domestic companies in the same industry? Are purelydomestic companies insulated from effects of international events?
3 Why should subsidiary projects be analyzed from the parent’s perspective?

PROBLEMS 469
4 List additional factors that deserve consideration in a foreign project analysis but are notrelevant for a purely domestic project.
5 Why are transfer pricing policies important in cash flow analysis of a foreign investmentproject?
6 Most academicians argue that net present value is better than internal rate of return.However, most practitioners say that internal rate of return is better than net presentvalue. Present the arguments for each side.
7 List popular risk-assessment and risk-adjustment techniques. What is the major differencebetween these two types of risk analysis?
8 Have researchers established a significant relationship between capital budgeting practicesand the market price of the common stock? What is the major reason for their findingon this topic?
9 Discuss the nature of political risk.10 List two major forms of political risk.11 List some forms of defensive measures against political risks before investment.12 Why did the number of expropriations decline in the 1980s?
Problems
1 Assume that the American Electrical Corporation (AEC) is considering the establishment ofa freezer manufacturing plant in Spain. AEC wants to invest a total of 10,000 Spanishpesetas in the proposed plant. The Pts10,000 will be financed with only common stock, allof which will be owned by the parent company. The plant is to be depreciated over a 5-year period on a straight-line basis for tax purposes. It is expected to have a salvagevalue of Pts5,000 at the end of 5 years. Spain has 35 percent corporate income tax andno withholding taxes on dividends paid. The USA has 50 percent corporate income taxwith direct credit for Spanish taxes. Spain does not impose any restrictions on dividendrepatriation, but it does not allow the parent company to repatriate depreciation cash flowsuntil the plant is liquidated. These depreciation cash flows may be reinvested in Spanishgovernment bonds to earn 8 percent tax-exempt interest. The cost of capital used toanalyze the project is 15 percent. The current exchange rate of Pts5.00 per US dollar isexpected to hold during year 1, but the Spanish peseta is expected to depreciate there-after at a rate of 5 percent a year. Assume the following revenues and operating costs interms of Spanish pesetas:
Year 1 Year 2 Year 3 Year 4 Year 5
Revenues 10,000 11,000 12,000 13,000 14,000Operating 6,000 6,000 7,000 7,000 8,000costs

470 INTERNATIONAL CAPITAL BUDGETING DECISIONS
(a) Determine the projected earnings after taxes for the proposed plant.(b) Determine the interest-compounded depreciation cash flows at the end of 5 years.(c) Determine the net present value of the plant, the profitability index, and the internal
rate of return for the plant in terms of the US dollar.2 The Wayne Company currently exports 500 calculators per month to Jordan at a price of
$60 and the variable cost per calculator is $40. In May 1990, the company is approachedby the government of Jordan with a request that it establish a small manufacturing plantin Jordan. After a careful analysis, the company decides to make an equity investment of$1 million, half of which will represent working capital and the other half-fixed assets. Thecompany will sell the plant to a local investor for the sum of $1 at the end of 5 years andthe central bank of Jordan will repay the company for the working capital of $500,000. Inreturn for an increase in tariffs against other companies, the Wayne Company is willing tosell its calculators in Jordan for $50 per unit. In addition, the company will have to buycertain raw materials from local suppliers and will have to use local managers. The totalcosts of the local managers and materials will be $15 per calculator. Other materials willbe purchased from the parent at $10 per unit and the parent will receive a direct con-tribution to overhead after variable costs of $5 per unit sold. Under this arrangement, thecompany expects that it will sell 1,000 calculators per month. The fixed assets are to bedepreciated on a straight-line basis over a 5-year period. The company will have to payincome taxes at 50 percent on profits earned in Jordan. The USA also has a 50 percent taxrate with direct credit for Jordanian taxes. The current exchange rate is 10 Jordanian dinarsper dollar and it is expected to stay the same for the next 5 years. There is no restrictionon cash flow repatriation.(a) Determine the net present value of the project at 10 percent.(b) The Wayne Company has been informed that, if it decides to reject the project, it
would lose its entire export sales. How does this affect the decision by the WayneCompany?
3 Problems 1 and 2 highlight the complexities involved in foreign investment decisions. Iden-tify these problems.
4 A project with an initial cost of $15,000 is expected to produce net cash flows of $8,000,$9,000, $10,000, and $11,000 for each of the next 4 years. The firm’s cost of capital is12 percent, but the financial manager perceives the risk of this particular project to be muchhigher than 12 percent. The financial manager feels that a 20 percent discount rate wouldbe appropriate for the project.(a) Compute the net present value of the project at the firm’s cost of capital.(b) Compute the risk-adjusted net present value of the project.
5 A project has a cost of $1,400. Its net cash flows are expected to be $900, $1,000, and$1,400 for each of the next 3 years. The respective certainty equivalent coefficients areestimated to be 0.75, 0.55, and 0.35. With a 6 percent risk-free discount rate, determinethe certain net present value.
6 Project F has a cost of $3,000 and project G has a cost of $4,000. These two projects aremutually independent and their possible net cash flows are given below. Assume that thecost of capital is 10 percent.

REFERENCES 471
(a) Determine the net present value of projects F and G.(b) Determine the standard deviation of projects F and G.(c) Determine the portfolio net present value and the portfolio standard deviation.(d) Discuss the significance of the portfolio effect in terms of international context.
Net cash flows
Economic condition Probability Project F Project G
Boom 0.50 $8,000 $ 0Recession 0.50 0 8,000
REFERENCES
Anthony, R. N., “The Trouble with Profit Maxi-mization,” Harvard Business Review, Nov./Dec.1960, pp. 126–34.
Ball, D. A. and W. H. McCulloch, InternationalBusiness, Homewood, IL: McGraw-Hill, 1999,pp. 306–7.
Butler, K. C., Multinational Finance, 3rd edn,Mason, OH: Thomson/South-Western, 2004,ch. 18.
Donaldson, G., “Financial Goals: Management vs.Stockholders,” Harvard Business Review,May–June, 1963, 116–29.
Goddard, S., “Political Risk in International CapitalBudgeting,” in R. W. Kolb, ed., The InternationalFinancial Reader, Boulder, CO: Kolb Publishing,1991, pp. 357–62.
Kelly, M. E. and G. Philippatos, “ComparativeAnalysis of the Foreign Investment EvaluationPractices by US-Based Manufacturing Multina-tional Companies,” Journal of International Busi-ness Studies, Winter 1982, pp. 19–42.
Kennedy, C. R., “Multinational Corporations andExpropriation Risk,” Multinational BusinessReview, Spring 1993, pp. 44–55.
Kim, S. H. and T. Crick, “Foreign Capital Budget-ing Practices Used by the US and Non-US Multi-national Companies,” Engineering Economist,Spring 1984, pp. 207–15.
Kim, S. H. and G. Ulferts, “A Summary of Multi-national Capital Budgeting Practices,” Manager-ial Finance, Spring 1996, pp. 75–85.
Kobrin, S. J., “Expropriation as an Attempt toControl Foreign Firms in LDCs: Trends from1969 to 1979,” International Studies Quarterly,Fall 1984, pp. 329–48.
Markowitz, H., Portfolio Selection: Efficient Diversi-fication of Investment, New York: John Wiley,1959.
Oblak, D. J. and R. J. Helm, Jr., “Survey and Analy-sis of Capital Budgeting Methods Used by Multi-nationals,” Financial Management, Winter 1980,pp. 37–41.
Shao, L. P., “Capital Investment Evaluation Proce-dures: North and Latin American Affiliates,”Multinational Business Review, Spring 1994, pp.11–18.
Sharpe, W. F., “Capital Asset Prices: A Theory ofMarket Equilibrium Under Conditions of Risk,”Journal of Finance, Sept. 1964, pp. 425–42.
Stanley, M. T. and S. B. Block, “A Survey of Multi-national Capital Budgeting,” Journal of BusinessFinance, Spring 1984, pp. 38–43.
Stonehill, A. I. and L. Nathanson, “Capital Budget-ing and the Multinational Corporation,” Califor-nia Management Review, Summer 1968, pp.39–54.

472 INTERNATIONAL CAPITAL BUDGETING DECISIONS
Case Problem 18: Multinational CapitalBudgeting Practices
The literature on foreign capital investment theory reveals that business firms should use dis-counted cash flow techniques for ranking and selecting overseas projects because thesemethods recognize the time value of money and employ cash flows of a project over its lifespan. Table 18.6 illustrates the extent to which discounted cash flow methods were used bycompanies that were surveyed from 1980 to 1994. These empirical studies revealed two impor-tant points: first, discounted cash flow approaches are more popular than rules of thumb;second, internal rate of return is more popular than net present value.
Table 18.6 The use of primary project evaluation techniques
Evaluation method Oblak (1980) Kelly (1982) Stanley (1984) Kim (1984) Shao (1994)
Payback 10% 18% 5% 12% 25%ARR 14% 27% 11% 14% 14%IRR 60% 36% 65% 62% 40%NPV 10% 14% 16% 9% 17%Others 6% 5% 3% 3% 4%Total 100% 100% 100% 100% 100%
Thus, most MNCs use discounted cash flow approaches for ranking and selecting overseasprojects. The five studies cited in table 18.6 show that at least half of the respondents useddiscounted cash flow approaches, ranging from 50 percent according to Kelly’s study to 81percent in Stanley’s study. Although the findings vary in these surveys, their overriding impli-cation suggests that discounted cash flow approaches are unmistakably more popular thanrules of thumb. In fact, the use of those techniques favored by academicians has become socommonplace in recent years that we do not need more empirical studies to confirm the adop-tion of discounted cash flow techniques by most MNCs.
The results are not strictly comparable, because terms such as “exclusive,” “most impor-tant,” and “primary” used by these surveys are not synonymous. On the other hand, the keycharacteristics for most of these surveys are so similar that our inferences are valid. The firmssurveyed were drawn mostly from large industrial categories; sample sizes were relatively large;respondents and sample groups were surveyed by mail; and research methods were carefullyadhered to. The respondents revealed that most companies use discounted cash flowapproaches for foreign investment projects. With this fact established, it is reasonable to expectthat firms using such sophisticated techniques as internal rate of return should make betterinvestment decisions and thus perform better than firms using such unsophisticated techniquesas payback.

CASE PROBLEM 18 473
Case Questions
1 What are the disadvantages of the payback method and the average-rate-of-returnmethod?
2 What are the conditions under which the net-present-value and internal-rate-of-returnmethods will lead to the same capital-budgeting decision?
3 Why is the net-present-value method theoretically better than the internal-rate-of-returnmethod?
4 Why is internal rate of return more popular than net present value in practice?5 The website of the Bank for International Settlements, www.bis.org/cbanks.htm, and the
website of the US State Department, www.state.gov, give economic information on mostcountries around the world. Access these websites to obtain economic information that canbe used to assess the feasibility of projects in a developing country.
Source: Kim, S. H. and G. Ulferts, “A Summary of Multinational Capital Budgeting Practices,” ManagerialFinance, Spring 1996, pp. 75–85.

Opening Case 19 : GM’s Target Debt Ratio in its Overseas Expansion
Analysts say that global vehicle production will double in the next 20 years. “Pro-jected growth in the global auto industry is going to occur in places other than NorthAmerica and Europe, and most of that growth is going to occur in Asia,” said JimBright, a Ford spokesman in Detroit. Thus, it should come as no surprise that European, Japanese, and US automakers have been expanding their operations in Asia aggressively.
General Motors (GM) sold 443,000 vehicles in the Asia-Pacific market in 1998,which accounted for 4 percent of the market. And GM wished to expand its Asianmarket to 10 percent by 2005. To accomplish its sales goal, GM has recently begunto establish a strong presence in Asia through construction of new plants, acquisitionsand alliances, and strategic partnerships (see figure 19.1). As part of its aggressiveexpansion in Asia, GM made an offer to buy Daewoo Motor of Korea for $5.5 billionin December 1999. Daewoo Motors, the debt-laden number two Korean automaker,is an affiliate of the Daewoo Group, which is being dismantled by its creditors afteramassing almost $80 billion in liabilities.
GM’s plan for Daewoo Motors includes a $5.5 billion cash payment, its offer of aone-third equity stake to creditors, and its demand for creditors to write off a sub-stantial portion of their Daewoo Motors’ debt. All these financial arrangements aredesigned to insure that the new Daewoo Motors’s balance sheet will reflect a debtratio of 40 percent. Analysts think that this 40 percent debt ratio is GM’s target debtratio, the combination of equity and debt that minimizes its cost of capital and max-imizes its market value. How did GM arrive at a 40 percent debt ratio? In fact, GM’s
CHAPTER 19
The Cost of Capital forForeign Projects

OPENING CASE 19 475
overall debt ratio of 1999 turned out to be approximately 40 percent. Apparently, GM has been using this 40 percent debt ratio as its successful formula in its foreignexpansion.
GM’s turnaround strategy for Daewoo Motors includes the following objectives:(1) reduce Daewoo Motors’s debt ratio from 70 percent to 40 percent; (2) integrateits Korean supplier network into GM’s global network; (3) dispatch an internationalmanagement team to show up new management; (4) make it GM’s global center ofexpertise for inexpensive cars and sport-utility vehicles; (5) expand its design and engi-neering capabilities; (6) acquire nearly all of its Korean vehicle-making operations; and(7) absorb most of its foreign units in Europe and Asia. GM, Daewoo Motors, andthe Korean Development Bank signed final documents for acquisition by GM ofDaewoo Motors in 2002. Under the agreement, a new company called GM DaewooAuto and Technology was created. With the new management team in place, a solidstream of cash from GM, and improved operations, GM Daewoo has achieved sig-nificant productivity increases at its existing facilities, built new facilities, and revital-ized the once-unstable product line. These factors and the turnaround strategy forthis new company, along with the use of its target debt ratio, have enabled GMDaewoo to improve its financial performance significantly in the past few years.
In June 2003, however, GM backed away from its goal of achieving 10 percentmarket share in its Asia-Pacific business by 2005 and revised its strategy there – withmuch more focus on China and less on Japan. GM’s market share fell from 5.7 percentin 2001 to 4.6 percent in 2002. During the first quarter of 2003, GM held about 4percent of the market. GM still believes that most of the projected growth in theglobal automobile industry will be in Asian countries, such as China, South Korea, and
GM OPERATIONS
ACQUISITIONS ANDALLIANCES
STRATEGICPARTNERSHIP
A joint venture in China called ShanghaiGM, which startedvehicle productionin 1999
A joint venture in China called JinbeiGM, which startedproduction in 2000
Plans to open anOpel plant in Thailandin May 2000
Plants already exist in
Australia, Indonesia,and India
Owns 49% equitystake in Isuzu, a keysource of trucks anddiesel engines
Owns 9.9% of Suzuki,a mini-car specialist
Negotiating forsignificant equity stakein Fuji, a profitableniche-maker
Negotiating to acquireauto unit of Daewoo,a debt-ridden Koreanconglomerate
In talks with Hondaover engine technology
Cooperation onadvanced environmentaltechnology withToyota, which wasannounced in 1999
Figure 19.1 GM’s Asia-Pacific forays
Source: GM.

In chapter 18, we discussed two discounted cash flow approaches: the net-present-value methodand the internal-rate-of-return method. These methods evaluate the net cash flows of a projectin terms of the required rate of return to determine its acceptability. The actual required rate ofreturn applied by a multinational company (MNC) may be the cost of capital adjusted for polit-ical and exchange risks.
In this chapter, we consider four major topics. First, we discuss the weighted average cost ofcapital and its component costs of capital (the cost of debt and the cost of equity). In addition,this first section explains how corporate and country characteristics influence the cost of capitalfor multinational cases. Second, we analyze a firm’s capital structure, which consists of long-termdebt and common equity. In doing so, we explain how an MNC considers corporate and countrycharacteristics when it establishes its capital structure. Third, we describe the relationship betweenthe marginal cost of capital and foreign investment analysis. The marginal cost of capital refersto the cost of additional funds that the firm wishes to raise. Fourth, we compare the cost ofcapital and the capital structure across countries.
19.1 The Weighted Average Cost of Capital
The weighted average cost of capital (WACC) is a weighted average of the component costs:the cost of debt, the cost of preferred stock, and the cost of equity. The WACC is normally usedas the firm’s cost of capital for a number of reasons. First, if a single component cost is used asa criterion for acceptance, projects with a low rate of return may be accepted while projects witha high rate of return may be rejected. Some low-return projects would be accepted because theycould be financed with a cheaper source of capital, such as debt. Some high-return projects wouldbe rejected because they have to be financed with an expensive source of capital, such as equity.Second, if a firm accepts projects that yield more than its WACC, it can increase the marketvalue of its common stock. In this situation, the market value of the common stock increasesbecause these projects are expected to earn more on their equity-financed portion than the costof equity.
The WACC is the cost for each type of capital multiplied by its proportion of the total amountof all capital issued by the firm:
(19.1)kS
B Sk
BB S
ke t=+
( ) ++
( )
476 THE COST OF CAPITAL FOR FOREIGN PROJECTS
Thailand. GM’s presence in Asia is formidable and will continue to grow, because otherwise it could risk losing its global leadership position. GM has automotive facil-ities and sales offices in 15 Asian countries. Main manufacturing and assembly oper-ations are located in Australia, China, Indonesia, Korea, Vietnam, and Thailand.
Sources: “GM Offers Daewoo Creditors a Stake in Korean Firm in Exchange for Debt,” The WallStreet Journal, Dec. 21, 1999, p. A3; “GM Pursues New Links with Japanese,” The Wall Street Journal,Dec. 3, 1999, p. A3; “GM Alters Strategy in Asia Pacific,” The Detroit News, June 12, 2003, pp. 1B,4B; and www.gm.com.

where k is the weighted average cost of capital, ke is the cost of equity, kt is the after-tax cost ofdebt, B is the market value of the firm’s debt, and S is the market value of the firm’s equity.
19.1.1 The cost of equity
Interest and preferred dividends are directly measurable components of debt and preferred stocks,but we do not have such a measurable element for the cost of common equity. The reason isapparent once we realize that dividend declarations on common stock are made at the discretionof a firm’s board of directors. Consequently, the cost of common equity is the most difficultconcept to measure.
The cost of equity for a firm is the minimum rate of return necessary to attract investors tobuy or hold a firm’s common stock. This required rate of return is the discount rate that equatesthe present value of all expected future dividends per share with the current price per share. Ifdividends per share are expected to grow at a constant growth rate indefinitely, we can measurethe cost of equity by the following formula:
(19.2)
where D1 is the expected dividends per share to be paid at the end of 1 year, P is the currentmarket price per share, and g is the annual dividend growth rate.
An alternative approach to the above dividend valuation model for the cost of capital is thecapital asset pricing model (CAPM) described in chapter 16. If a market is in equilibrium, theexpected rate of return on an individual security ( j ) is stated as follows:
(19.3)
where Rj is the expected rate of return on security j; Rf is the riskless rate of interest; Rm is theexpected rate of return on the market portfolio, which is a group of risky securities such as Standard & Poor’s 500 Stocks; and bj is the systematic risk of security j. This equation is knownas the security market line, which consists of the riskless rate of interest (Rf ) and a risk premium [(Rm - Rf )bj] for a particular firm j; the term (Rm - Rf ) is known as the market riskpremium.
The CAPM is based on the assumption that intelligent risk-averse investors seek to diversifytheir risks. As a result, the only risk that is rewarded with a risk premium is systematic or undi-versifiable risk. This theory suggests that the cost of capital for MNCs is generally lower thanthe cost of capital for domestic companies. In chapter 16, we saw that a well-diversified MNCcompany can significantly cut the systematic risk of a well-diversified domestic company. Withinthe international context, systematic risk relates to such global events as worldwide recessions,world wars, and changes in the world energy supply. Unsystematic risk relates to such nationalevents as expropriation, currency controls, inflation, and exchange rate changes.
One potential problem with using the CAPM is how to compute beta (b ). Beta may be esti-mated solely on the basis of subjective probability distributions. But it is a common practice touse past data to estimate future betas. If the beta computed from historical data is a reliable sur-rogate for a future beta, financial managers have an important tool in formulating profitableinvestment decisions. Some empirical surveys indicate that past betas are useful in predicting
R R R Rj f m f j= + -( )b
kDP
ge = +1
THE WEIGHTED AVERAGE COST OF CAPITAL 477

future betas. Betas tend to have greater stability when the number of securities in a portfolio islarger and when the time intervals being studied are longer.
Another approach to measuring the cost of equity is the price–earnings ratio, which is theprice per share divided by the earnings per share. More accurately, the price–earnings ratio canbe used to determine the rate of return demanded by shareholders. If we denote the price–earn-ings ratio by “P–E ratio,” we can calculate the cost of equity using the following formula:
(19.4)
As shown in equation 19.4, the cost of equity is one (1) divided by the P–E ratio. Thus a highP–E ratio suggests a low cost of capital. This model assumes a zero growth rate in profits and a100 percent dividend payout ratio, so that equation 19.4 is identical with equation 19.2.
The main difference between the three approaches to the cost of equity is that the dividendvaluation model and the P–E ratio emphasize the total risk of expected returns, while the CAPMemphasizes only the systematic risk of expected returns. In any case, the cost of equity is somefunction of the market’s preference for return and risk.
19.1.2 Cost of debt
The explicit cost of debt for a firm may be defined as the discount rate that equates the netproceeds of the debt issue with the present value of interest and principal payments. If we wantto express all cost-of-capital rates on an after-tax basis, we must adjust this explicit cost of debtfor taxes, because interest charges are usually tax deductible. We denote the after-tax cost of debtby kt and determine it using the following equation:
(19.5)
where ki is the before-tax cost of debt and t is the tax rate.MNCs must account for a number of complicated factors to measure the cost of debt. First,
MNCs can borrow in Eurocurrency markets, international bond markets, or national capitalmarkets. Hence, they must – in order to measure the before-tax cost of debt – estimate interestrates and the proportion of debt to be raised in each market. Second, MNCs must – in order tomeasure the after-tax cost of debt – estimate tax rates in each market in which they intend toborrow and determine the deductibility of interest by each national tax authority. Third, thenominal cost of principal and interest in foreign currency must be adjusted for foreign-exchangegains or losses when MNCs issue debt denominated in a foreign currency.
For example, the before-tax cost of foreign currency denominated debt equals the before-taxcost of repaying the principal and interest in terms of the parent’s own currency. This before-taxcost of capital includes the nominal cost of principal and interest in foreign-currency terms,adjusted for any foreign-exchange gains or losses:
(19.6)
where kf is the before-tax interest in foreign-currency terms, ka is the additional interest due toexchange rate change, and kp is the additional principal due to exchange rate change.
k k k ki f a p= ¥( ) +
k k tt i= -( )1
ke =1
P E ratio–
478 THE COST OF CAPITAL FOR FOREIGN PROJECTS

19.1.3 The appropriate cost of capital
If MNCs make separate allowance for different levels of risk in foreign projects, they must usethe WACC as an appropriate cost of capital. They have three choices in deciding their subsidiarycost of capital: (1) the cost of capital to the parent company, (2) the cost of capital to the sub-sidiary, or (3) some weighted average of the two.
If a parent company finances the entire cost of its foreign project by itself, the cost of capitalto the parent company may be used as the appropriate cost of capital. If its foreign subsidiaryobtains all of the capital for the project overseas, the foreign cost of capital may be used as theappropriate cost of capital. In most cases, however, the MNC uses the whole world as a com-bined source of funds. Thus, the appropriate cost of capital is usually an overall weighted averageof the two.
If the analyst wishes to reflect local inflation for local projects, the inflation-adjusted discountrate may have to be used as an appropriate cost of capital. However, inflation tends to be builtinto the cost of debt and equity for a company, because the WACC reflects such anticipated pricechanges. When lenders and equity holders anticipate price increases, they will demand a rate ofreturn higher than in ordinary cases, so that the WACC reflects inflation. Thus, the MNC shouldnot add an increase to the discount rate derived from the cost of capital in order to adjust forinflation.
THE WEIGHTED AVERAGE COST OF CAPITAL 479
Example 19.1
A US company borrows euros for 1 year at 7 percent. During the year, the euro appreci-ates 9 percent relative to the dollar. The US tax rate is 35 percent. What is the after-taxcost of this debt in US dollar terms?
The before-tax cost of this debt is computed as follows:
The added 9.63 percent cost of this debt in terms of US dollars is reported as a foreign-exchange transaction loss. The nominal interest rate of 7 percent and the added cost of9.63 percent are deductible for tax purposes. Thus, the after-tax cost of this debt wouldbe:
k k tt i= -( )= -( )=
1
0 1663 1 0 35
10 81
. .
. %
k k k ki f a p= ¥( ) += ¥( ) +=
. . .
. %
0 07 1 09 0 09
16 63

19.2 The Optimum Capital Structure
The optimum capital structure is defined as the combination of debt and equity that yields thelowest cost of capital. In this situation, the amount of capital to be obtained is fixed, but thedebt ratio is changed to determine the optimum capital structure. For example, the capital struc-ture of companies in the same industry varies widely from country to country because of differ-ent environmental variables.
19.2.1 Book-value versus market-value weights
To measure the WACC, we first calculate the cost of each component of the capital structure.Once we have computed the costs of individual components of the capital structure, we need toweigh them according to some standard. Two alternative ways to specify the proportions of thecapital structure are practiced, as follows:
• Book-value weights are derived from the stated values of individual components of thecapital structure on the firm’s current balance sheet. There are two major advantages to book-value weights. First, the proportions of the capital structure are stable over time, becausebook-value weights do not depend on market prices. Second, book-value weights are easy todetermine, because they are derived from stated values on the firm’s balance sheet. However,book-value weights may misstate the WACC, because the market values of bonds and stockschange over time and thus do not reflect the desired capital structure.
• Market-value weights are based on the current market prices of bonds and stocks. Becausethe primary goal of a firm is to maximize its market value, market-value weights are consis-tent with the company’s objective. The market values of a business’s existing securities dependon the expected earnings of the company and the risk of the securities as perceived byinvestors. In other words, market values reflect assessments of current buyers and sellers offuture earnings and risk. Thus, the WACC with market-value weights should be the validaverage rate of return required by investors in the firm’s securities.
19.2.2 Implications
The traditional approach to valuation and leverage assumes that an optimum capital structureexists. This model implies that the varying effects on the market capitalization rates for debt andequity allow the firm to lower its cost of capital by the intelligent use of leverage (debt). Debthas two types of cost: explicit cost and implicit or bankruptcy cost. The explicit cost is the inter-est rate, whereas the implicit cost refers to added debt that increases the cost of equity and debt.
If we start with an all-equity capital structure, the introduction of debt enables a firm to lowerits cost of capital. The WACC falls with increases in leverage because the increase in the cost ofequity does not completely offset the use of low-cost debt. Therefore, the traditional approachimplies that beyond some point both the cost of equity and the cost of debt increase at an increas-ing rate. With the heavy use of leverage, the increase in the cost of equity more than offsets theuse of low-cost debt. Thus, at a critical point, such as a 40 percent debt ratio in figure 19.2, thesubsequent introduction of additional leverage increases the overall cost of capital. The optimumcapital structure is the point at which the WACC bottoms out.
480 THE COST OF CAPITAL FOR FOREIGN PROJECTS

THE OPTIMUM CAPITAL STRUCTURE 481
Example 19.2
A company is planning to raise $200 million for foreign investments. It wishes to hold theamount of capital constant and to change only the combination of financing sources. Asgiven in table 19.1, there are three different financial structures under consideration by thecompany: A, B, and C.
Table 19.1 Three different financial plans
Financial plan After-tax cost Weight Weightedaverage cost
Plan A:Debt 6.5% 20% 1.3%Equity 12.0% 80% 9.6%
WACC 10.9%
Plan B:Debt 7.0% 40% 2.8%Equity 12.5% 60% 7.5%
WACC 10.3%
Plan C:Debt 9.0% 60% 5.4%Equity 15.0% 40% 6.0%
WACC 11.4%
The company initially reduces the cost of capital with leverage, but beyond plan B thecontinued use of debt increases the cost of capital. Most theorists believe that there is a U-shaped capital-cost curve in relation to debt–equity mixes for the company. Figure 19.2shows that the optimum capital structure occurs at a 40 percent debt ratio.
Most companies use 30–50 percent debt in their capital structure without exceedingnorms acceptable to creditors and investors. This rather broad, flat area with a wide rangeof debt ratios, 30–50 percent in figure 19.2, is usually called an optimal or target debt range,where little difference exists in the cost of capital. The optimal range of the flat area andthe location of a particular company’s debt ratio within that range are determined by avariety of noncost variables, such as availability of capital and financial risk. The interna-tional availability of capital to an MNC and its lower financial risk permit it to maintain itsdesired debt ratio, even if significant amounts of new funds must be raised. In other words,the marginal cost of capital for an MNC is constant for a broad range of its capital budget.
In summary, the company’s optimum capital structure simultaneously (a) minimizes thecompany’s WACC, (b) maximizes the value of the company, and (c) maximizes thecompany’s share price. As debt is added to the capital structure, the WACC falls. Thisincreases the value of the firm. Because this increase in the company’s value accrues to theowners of the company, the price of the company’s stock rises.

19.3 The Marginal Cost of Capital and Investment Decisions
When companies raise funds for new investment projects, they are concerned with the marginalcost of new funds. Companies should always expand their capital budget by raising funds in thesame proportion as their optimum capital structure. However, as their capital budget expands inabsolute terms, their marginal cost of capital (MCC) will eventually increase. This means thatcompanies can tap only the capital market for some limited amount in the short run before theirMCC rises, even though the same optimum capital structure is maintained. The marginal costof capital is the cost of an additional dollar of new funds.
THE OPTIMUM CAPITAL BUDGET In one analysis, we hold the total amount of capital con-stant and change only the combination of financing sources. We seek the optimum or targetcapital structure that yields the lowest cost of capital. In a second analysis, we attempt to deter-mine the size of the capital budget in relation to the levels of the MCC, so that the optimumcapital budget can be determined. The optimum capital budget is defined as the amount ofinvestment that maximizes the value of the company. It is obtained at the intersection betweenthe internal rate of return (IRR) and the MCC; at this point total profit is maximized.
A variety of factors affect a company’s cost of capital: its size, access to capital markets, diver-sification, tax concessions, exchange rate risk, and political risk. The first four factors favor theMNC, whereas the last two factors appear to favor the purely domestic company. For a number
482 THE COST OF CAPITAL FOR FOREIGN PROJECTS
WACC (%)
Weighted average cost of capital
Optimal or targetdebt range
Debt ratio (%)300 40 50
Figure 19.2 Debt ratio and the cost of capital

of reasons, as shown in figure 19.3, MNCs usually enjoy a lower cost of capital than purelydomestic companies. First, MNCs may borrow money at lower rates of interest because they arebigger. Second, they may raise funds in a number of capital markets such as the Euromarkets,local capital markets, and foreign capital markets. Third, their overall cost of capital may be lowerthan that of purely domestic companies, because they are more diversified. Fourth, they maylower their overall taxes, because they can use tax-haven countries, tax-saving holding compa-nies, and transfer pricing.
It seems reasonable to assume that investments outside the United States are, for a UScompany, riskier than investment in US assets. However, this is not necessarily true, becausereturns on foreign investments are not perfectly positively correlated with returns on US invest-ments. In other words, MNCs may be less risky than companies that operate strictly within theboundaries of any one country. Consequently, to minimize risk, companies should diversify notonly across domestic investment projects but also across countries. The lower overall risk ofMNCs tends to reduce their overall cost of capital.
Figure 19.3 shows that the optimum capital budget (M) of a typical MNC is higher than theoptimum capital budget (D) of a purely domestic company. MNCs can tap foreign capitalmarkets when domestic capital markets are saturated, and their risk is lower than that of domes-tic companies. International capital availability and lower risk permit MNCs to lower their costof capital and to maintain a constant MCC for a broad range of their capital budget. They havemore investment opportunities than purely domestic companies. These two factors – the lower
THE MARGINAL COST OF CAPITAL AND INVESTMENT DECISIONS 483
Percent
IRR
MCC
Purelydomestic
firm
Purelydomestic
firm
MNC
MNC
Optimum capitalbudget for purely
domestic firmOptimum capitalbudget for MNC
Amount of capital ($)
D M
Figure 19.3 Optimum capital budget: domestic firm versus multinational

cost of capital and better investment opportunities – give MNCs higher optimum capital budgetsthan the optimum capital budgets of domestic companies.
Many analysts believe that some countries, such as Germany and Japan, enjoy capital costadvantage mainly due to their high leverage. As the debt ratio increases, the weighted averagecost of capital decreases because of the heavier weight of low-cost debt compared to high-costequity. The low cost of debt is, of course, due to the tax deductibility of interest.
484 THE COST OF CAPITAL FOR FOREIGN PROJECTS
Example 19.3
Assume that there are two countries: X and Y. The cost of debt (10 percent), the cost ofequity (15 percent), and the tax rate (50 percent) are the same for these two countries.However, X’s capital structure is 20 percent debt and 80 percent equity, while Y’s capitalstructure is 50 percent debt and 50 percent equity. Compare the cost of capital in the twocountries. The WACC for country X is 13 percent [(0.20 ¥ 0.10)(1 - 0.50) + (0.80 ¥ 0.15)].If we apply the same costs of debt and equity to the more leveraged country, it would havea WACC of 10 percent [(0.50 ¥ 0.10)(1 - 0.50) + (0.50 ¥ 0.15)]. Hence, the more lever-aged country (Y) has a lower cost of capital than the less leveraged country (X).
Companies in Germany and Japan have greater borrowing capacity because their cred-itors tolerate a high degree of financial leverage. Traditionally, banks in both countries haveplayed a much more important role in corporate financing than capital markets. Companiesin both countries could carry a high degree of financial leverage because banks frequentlyhold bonds and stocks of these companies. Finally, German and Japanese companies haveclose working relationships with their governments. Hence, it may be in the best interest ofthe governments to rescue failing companies through direct subsidies and long-term loans,which have enabled these companies to carry a high degree of financial leverage.
19.4 Cultural Values and Capital Structure
Can cultural values be used to predict capital structure across countries? Differences ininstitutional backgrounds provide only a partial answer to the question of why coun-tries have differences in capital structure (Chui et al. 2002). Researchers from differentdisciplines have investigated the effects of culture on various business practices, such asthe study of management functions, organization design, business performance, com-pensation practices, cross-border acquisition performance, and managerial attitudes, theperceived importance of job outcomes and job satisfaction, and investor stock-tradingdecisions. Alternatively, Sekely and Collins (1988) analyzed the relationship betweeneconomic variables and international differences in capital structure, but their test resultsindicated no significant relationship between the two. These two groups of researchers

found the role of culture to be active in differences in the capital structure (debt ratio) acrosscountries.
Empirical studies have found that capital structure norms for companies vary widely fromone country to another, but they cluster together for companies domiciled in the same industry.For example, Sekely and Collins (1988) compared debt ratios for 677 companies in nine indus-tries from 23 countries. The researchers concluded that cultural factors, such as political, legal,social, institutional, and tax environments, cause debt ratios to cluster by country rather than byindustry or size. They classified these 23 countries into several cultural “realms” with similaritiesin capital structure norms:
Anglo-American region Australia, Canada, South Africa, the United States,and the United Kingdom
Latin American region Argentina, Brazil, Chile, and MexicoWest Central Europe Benelux, Switzerland, and GermanyMediterranean Europe France, Italy, and SpainScandinavian region Denmark, Finland, Norway, and SwedenIndian Peninsula India and PakistanSoutheast Asia Malaysia and Singapore
Table 19.2 shows mean debt ratios for these seven regions. They found low debt ratios in theSoutheast Asian, Latin American, and Anglo-American groups of countries. They found highdebt ratios in the Scandinavian, Mediterranean Europe, and Indian Peninsula groups. The WestCentral European counties had debt ratios in the middle of the seven groups.
Have these debt ratio norms of different regions changed since 1988? Yes, but not much,according to a study by Chui, Lloyd, and Kwok. Like the 1988 study, this 2002 study found lowdebt ratios in the Southeast Asian, Anglo-American, and Latin American groups of countries; itfound high ratios in the Mediterranean Europe and Scandinavian groups. One major exceptionis West Central Europe, whose mean debt ratio has changed from the middle group to the highgroup. The increase in the high debt ratio of the West Central Europe has almost exclusively todo with the increased debt ratios of German companies. The high cost of German unificationmay be partly blamed for this increase in its overall debt ratio. Chui, Lloyd, and Kwok compareddebt ratios for 5,591 companies in four different industries across 22 countries, to determine theimpact of cultural factors on national corporate debt ratios. To achieve this objective, they testedtwo hypotheses: (1) the corporate debt ratio of a country is negatively related to the country’s
CULTURAL VALUES AND CAPITAL STRUCTURE 485
Table 19.2 Debt ratios for seven regions
Sekely and Chui et al.Collins (1988) (2002)
Anglo-American region 0.53 0.46Latin American region 0.46 0.51West Central Europe 0.59 0.65Mediterranean Europe 0.70 0.60Scandinavian region 0.69 0.56Indian Peninsula 0.67 –Southeast Asia 0.35 0.48

level of conservatism; and (2) the corporate debt ratio of a country is negatively related to thecountry’s level of mastery. Conservatism includes values that are important in close-knit harmo-nious relationships, in which the interests of the individual are not viewed as distinct from thoseof the group. These values are primarily concerned with security, conformity, and tradition.Mastery accentuates active mastery of the social environment through self-assertion, by placingmore emphasis on control and individual success. Such values promote their surroundings andpropel them ahead of others.
Their empirical findings support these two hypotheses at both the national and firm levels,which mean that countries with high scores on the cultural dimensions of “conservatism” and“mastery” tend to have low corporate debt ratios. The results are robust even after controllingfor the industry effect, the differences in economic performance, legal systems, financial institu-tion development, and other well-known determinants of debt ratios in each country (such asassets tangibility, agency cost, firm size, and profitability).
486 THE COST OF CAPITAL FOR FOREIGN PROJECTS
SUMMARY
The cost of capital, the optimum capital structure, and the optimum capital budget have a majorimpact on an MNC’s value. The cost of capital is used to evaluate foreign investment projects. Theoptimum capital structure is a particular debt ratio that simultaneously (a) minimizes the company’sWACC, (b) maximizes the value of the company, and (c) maximizes its share price. The optimumcapital budget is the amount of investment that will maximize an MNC’s total profits.
Although the main issues used to analyze the cost of capital in the domestic case provide thefoundation for the multinational case, it is necessary to analyze the unique impact of foreign-exchange risks, institutional variables, and cultural values. International capital availability, lowerrisks, and more investment opportunities permit MNCs to lower their cost of capital and to earnmore profits.
Questions
1 Explain both systematic risk and unsystematic risk within the international context.2 What are the complicated factors in measuring the cost of debt for multinational
companies?3 List three choices in deciding a foreign subsidiary’s cost of capital. Which of these three
choices is usually used by most multinational companies?4 What factors affect a company’s cost of capital? Why do multinational companies usually
enjoy a lower cost of capital than purely domestic companies?5 Some observers believe that American companies can borrow in Japan at relatively low
rates of interest. Comment on this argument.

PROBLEMS 487
6 In 2002, Chui, Lloyd, and Kwok attempted to find answers to the question of how culturalvalues can be used to predict capital structure across countries, and why knowing theculture of the country is important for the determination of capital structure. Discuss theirfindings in some detail.
7 Explain why foreign investments for a US company may be less risky than its investmentin US assets.
8 Why is the optimum capital budget of a multinational company typically higher than thatof a purely domestic company?
9 Explain why the capital–cost gap across major industrial countries may fall in the future.
Problems
1 A foreign project has a beta of 0.50, a risk-free interest rate of 8 percent, and the expectedrate of return on the market portfolio is 15 percent. What is the cost of capital for theproject?
2 A US company borrows Japanese yen for 1 year at 8 percent. During the year, the yenappreciates 10 percent relative to the dollar. The US tax rate is 50 percent. What is theafter-tax cost of this debt in US dollar terms?
3 The cost of debt (10 percent), the cost of equity (15 percent), and the tax rate (50 percent)are the same for countries A and B. However, A’s capital structure is zero percent debt and100 percent equity, while B’s capital structure is 50 percent debt and 50 percent equity.Compare the cost of capital in the two countries.
4 A company earns $300 per year after taxes and is expected to earn the same amount ofprofits per year in the future. The company considers three financial plans: A with a debtratio of 20 percent and a WACC of 15 percent; B with a debt ratio of 40 percent and aWACC of 10 percent; and C with a debt ratio of 80 percent and a WACC of 20 percent.Which debt ratio will maximize the value of the company?
5 Assume that a company wishes to sell $6 million worth of bonds and $14 million worth ofcommon stock. The bonds have 13 percent before-tax interest and the stock is expectedto pay $1.4 million in dividends. The growth rate of dividends has been 8 percent and isexpected to continue at the same rate. Determine the weighted average cost of capital ifthe tax rate on income is 50 percent.

488 THE COST OF CAPITAL FOR FOREIGN PROJECTS
REFERENCES
Chui, A., A. E. Lloyd, and C. Kwok, “The Deter-mination of Capital Structure: Is NationalCulture a Missing Piece to the Puzzle?” TheJournal of International Business Studies, FirstQuarter 2002, pp. 99–126.
Johnson, J. P. and T. Lenartowicz, “Culture,Freedom, and Economic Growth: Do CulturalValues Explain Economic Growth?” Journal ofWorld Business, 1998, pp. 332–56.
Kester, W. C. and T. A. Luehrman, “The Myth ofJapan’s Low-Cost Capital,” Harvard BusinessReview, May–June 1992, pp. 131–8.
McCauley, R. N. and S. A. Zimmer, “ExchangeRates and International Differences in the Costof Capital,” in Y. Amihud and R. Levich, eds.,
Exchange Rates and Corporate Performance, BurrRidge, IL: Irwin, 1994, pp. 119–48.
McCauley, R. N. and S. A. Zimmer, “ExplainingInternational Differences in the Cost of Capital,”Quarterly Review, Federal Reserve Bank of NewYork, Summer 1989, pp. 7–26.
Proterba, J. A., “Comparing the Cost of Capital inthe United States and Japan: A Survey ofMethods,” Quarterly Review, Federal ReserveBank of New York, Winter 1991, pp. 20–32.
Sekely, W. S. and J. M. Collins, “Cultural Influenceson International Capital Structure,” Journal ofInternational Business Studies, Spring 1988, pp.87–100.
Case Problem 19: Do Multinational FirmsHave Lower Debt Ratios than Domestic Firms?
Authors of international finance textbooks have suggested a number of practical concepts.First, MNCs should support more debt in their capital structure than purely domestic compa-nies. They point out that an MNC should have a higher target debt ratio than its domesticcounterpart because of its size, access to capital markets, diversification, and tax concessions.The target debt ratio is the optimum capital structure, which is defined as the combination ofdebt and common equity that yields the lowest cost of capital. Second, MNCs should havelower business risk than purely domestic companies. Business risk, such as the cost of finan-cial distress and expected bankruptcy cost, refers to the variability of operating profits or thepossibility that the firm will not be able to cover its fixed costs. An MNC operates in many dif-ferent countries and thus this diversification should translate into lower earnings volatility.
Some financial analysts argue that there is an inverse relationship between business risk andthe optimum debt level. Companies with less business risk are supposed to assume more debtwithout added risk. Debt has two types of cost: explicit cost and implicit or bankruptcy cost.The explicit cost is the interest rate, whereas the implicit cost refers to added debt, whichincreases the possibility of liquidating a business. Thus, given the traditional paradigm of atrade-off between the tax shelter of debt and the expected bankruptcy cost, MNCs shouldhave lower expected bankruptcy costs and hence higher leverage ratios. In other words, MNCsshould be able to carry higher debt loads because they are able to diversify their business riskacross national economies.
Third, an MNC is more sensitive to exchange rate fluctuations than a purely domesticcompany. A purely domestic company may not face economic exchange rate risk because it

CASE PROBLEM 19 489
operates in just one country. Finally, an MNC should have higher agency costs than a purelydomestic company because the MNC faces higher auditing costs, language differences, sov-ereign uncertainty, divergent political and economic systems, and varying accounting systems.
To ascertain these four concepts, Burgman (1996) has conducted an extensive empiricalstudy of 251 domestic firms and 236 MNCs. His findings are as follows. First, the mean lever-age ratio for the multinational sample is significantly less than that for the domestic sample atthe 1 percent level. Second, the operating profits of the multinational sample are more volatilethan the domestic sample, although the statistical significance of the difference is weak. Third,domestic companies are significantly more sensitive to exchange rate risk than MNCs at the 5percent level. Finally, MNCs have significantly higher agency costs than their domestic coun-terparts at the 1 percent level. Thus, Burgman’s study confirmed only the fourth concept andrejected the other three concepts.
Case Questions
1 What is the agency problem? What are agency costs? Why do multinational companiesincur higher agency costs than domestic companies?
2 Contrary to common expectations, the 1996 study by Burgman has found that multi-national companies have lower debt ratios and higher business risks than purely domesticcompanies. What are possible explanations for this finding?
3 What is economic exchange rate risk? Is it easy to hedge this risk? Contrary to commonexpectations, the 1996 study by Burgman has concluded that multinational companies havelower economic exchange rate risk than domestic companies. What are the possible expla-nations for this finding?
4 Use the website of Bloomberg, www.bloomberg.com/markets, to compare yield rates ofgovernment securities for several countries.
Sources : T. A. Burgman, “An Empirical Examination of Multinational Corporate Capital Structure,” Journalof International Business Studies, Third Quarter 1996, pp. 553–70; and J. K. Wald, “How Firm CharacteristicsAffect Capital Structure: An International Comparison,” The Journal of Financial Research, Summer 1999, pp.161–87.

Opening Case 20: Offshore Workers Increase IBM’s Profits
Until a few years ago, multinational companies (MNCs) used to export only lowlywaged jobs, but relentless pressure to cut costs is now compelling many MNCs toexport highly paid positions. In one of the largest moves to “offshore” highly paidsoftware jobs, The Wall Street Journal reported on December 14, 2003, that IBMwould move 4,730 programmers from the United States to India, China, and else-where. Unlike the salaries for low-wage manufacturing jobs, IBM typically paid$75,000 to $100,000 or more a year for the US computer-services work. In contrast,hiring a software engineer with a bachelor’s or even a master’s degree from a toptechnology university in India may cost $10,000 to $20,000 annually.
Offshore workers account for more than half of IBM’s 315,000 employees. IBMhas been a multinational company since the 1920s, with operations in India for 50years. Until recently, however, most of the software has been designed in the USAand exported to other countries. Apparently, IBM’s effort to export highly paid jobshas recently enabled IBM to be profitable and to gain market share, despite the tech-nology slump in the past few years. No wonder IBM intends to increase the numberof its employees in India from 9,000 at the present time to 20,000 by the end of2005.
The trend looms as one of the most serious long-term threats to US employmentand labor. Countries with lower-salaried occupations are no longer siphoning onlyunskilled or blue-collar jobs from US workers; they now are scooping up skilled workfrom US companies on a large scale. By the end of 2004, one out of every 10 jobswithin US-based computer companies will move to emerging markets, as will one ofevery 20 technology jobs in other corporations, according to tech-industry researcher
CHAPTER 20
Corporate Performance ofForeign Operations

THE GLOBAL CONTROL SYSTEM AND PERFORMANCE EVALUATION 491
Gartner Inc. The International Data Corporation recently estimated that by 2007, 23percent of all information technology jobs would be offshore, up from 5 percent in2003.
Source: “IBM to Export Highly Paid Jobs to India, China,” The Wall Street Journal, Dec. 15, 2003,pp. B1, B3.
Chapter 1 presented hard evidence that companies earn more money as they boost their pres-ence in foreign markets. Furthermore, the first chapter discussed eight principles of global financethat help MNCs perform better than domestic companies. In fact, the entire text of this sixthedition has attempted to cover those financial concepts and techniques that would boost the cor-porate performance of foreign operations. We conclude this book by discussing how MNCs canuse international accounting, taxation, and transfer pricing to improve their overall performanceeven further.
This chapter consists of three major sections. The first section examines global control systemsand performance evaluation of foreign operations. Accurate financial data and an effective controlsystem are especially important in international business, where operations are typically super-vised from a distance. The second section considers the significance of national tax systems oninternational business operations. Perhaps multinational taxation has the most pervasive effecton all aspects of multinational operations. Where to invest, how to finance, and where to remitliquid funds are just a few examples of management actions affected by multinational taxation.The third section covers international transfer pricing. Because transfers between business enti-ties account for approximately one-third of total world trade, the multinational company musttry to satisfy a number of objectives. This chapter examines some of these objectives, such astaxes, tariffs, competition, inflation rates, exchange rates, and restrictions on fund transfers.
20.1 The Global Control System and Performance Evaluation
In order to achieve the firm’s primary goal of maximizing stockholder wealth, the financialmanager performs three major functions: (1) financial planning and control, (2) investment deci-sion-making, and (3) financing decision-making. These financial functions cannot be performedeffectively without adequate, timely accounting information. The two fundamental financialstatements of any company are the balance sheet and the income statement. The balance sheetmeasures the assets, liabilities, and owners’ equity of a business at a particular time. The incomestatement matches expenses to revenues in order to determine the net income or net loss for aperiod of time. In addition to these two financial statements, a control system is used to relateactual performance to some predetermined goal.
The actual and potential flows of assets across national boundaries complicate the account-ing functions of an MNC. The MNC must learn to deal with environmental differences, suchas different rates of inflation and changes in exchange rates. If an MNC is to function in a coor-dinated manner, it must also measure the performance of its foreign affiliates. Equally impor-tant, managers of the affiliates must run operations with clearly defined objectives in mind.

An MNC consists of the parent and its subsidiaries in foreign countries. To operate the MNCas a system, the parent and its subsidiaries need continuing flows of data. Hence, the key elementin the control system is the company’s system for collection and dissemination of data on a world-wide basis. The company’s information system between the parent and its subsidiaries generallyconsists of: (1) impersonal communications such as budgets, plans, programs, electronic mes-sages, and regular reports; and (2) personal communications such as meetings, visits, and tele-phone conversations.
Communications essential to evaluating the performance of an enterprise usually follow estab-lished organizational channels. An effective communication system requires an efficient report-ing system for collecting information on the results of actual operations and for disclosingdeviations from predetermined standards. The more efficient the system, the more quickly man-agers may take corrective action.
Financial results of profitability have traditionally provided a standard to evaluate the perfor-mance of business operations. However, as MNCs expand their operations across national bound-aries, the standard itself is affected by the environment in which they operate. Inflation andforeign-exchange fluctuations affect all the financial measures of performance for MNCs. Tocompare the results of various affiliates of an MNC, multinational financial managers mustunderstand the various ways in which inflation and exchange fluctuations affect operations asmeasured by traditional financial statements.
20.1.1 Inflation and exchange rate fluctuations
Every control system establishes a standard of performance and compares actual performancewith the standard. The most widely used standards are budgeted financial statements. The prepa-ration of the statements is a planning function, but their administration is a controlling func-tion. We will compare budgeted financial statements with actual financial statements to determinethe impact of inflation and exchange rate fluctuations on financial statements. Budgeted state-ments are prepared without anticipated inflation or exchange rate fluctuations, but the actualstatements are prepared after these phenomena have occurred.
THE IMPACT OF INFLATION ON FINANCIAL STATEMENTS Table 20.1 presents the effects of a10 percent and a 20 percent rate of inflation on the major accounts of the balance sheet and theincome statement. If we assume that one unit is sold every month and that prices increase at aneven rate throughout the year, the annual inflation rates reflected on sales would be 5 percentand 10 percent instead of 10 percent and 20 percent.
If we follow the results of a case having a total annual inflation rate of 10 percent, or 0.83percent per month, annual sales increase to 2,100 – a 5 percent increase over the budgeted price.The cost of goods sold increases by only 4 percent from the budgeted cost of 1,500 to the actualcost of 1,560, because the cost of goods sold is based on historical costs. We assumed that inter-est expenses remain constant. The budgeted depreciation charges are based on historical costs.The combination of higher prices in sales and the use of historical costs in the two major accountswill increase the profits after taxes by 20 percent from 100 to 120.
The effects of inflation on the balance-sheet accounts depend on the date when assets wereacquired or liabilities incurred. Fixed assets and inventory are carried at cost, but accounts receiv-
492 CORPORATE PERFORMANCE OF FOREIGN OPERATIONS

able and accounts payable are carried at the prices prevailing at the time of the transactions. Thebudgeted cash of 400 consists of profits after taxes (100), taxes payable (100), and depreciation(200).
THE IMPACT OF EXCHANGE RATE FLUCTUATION ON FINANCIAL STATEMENTS Let us assumethat a subsidiary purchases its raw materials from country A and sells its finished products tocountry B. Thus, both exports and imports are denominated in foreign currencies. In this case,exchange rate fluctuations affect the level of both revenues and costs measured in terms of thedomestic currency. Table 20.2 shows that an appreciation in the revenue currency (country B’s
THE GLOBAL CONTROL SYSTEM AND PERFORMANCE EVALUATION 493
Table 20.1 The impact of inflation on financial statements
Actual, with annual inflation rate of:
Budget 10% 20%
Income statement (in foreign currency)Sales 2,000 2,100 2,200Cost of goods sold 1,500 1,560 1,620
Gross margin 500 540 580Depreciation 200 200 200
Operating income 300 340 380Interest expense 100 100 100
Profit before taxes 200 240 280Taxes (50%) 100 120 140
Profit after taxes 100 120 140
Actual, with annualinflation rate of:
Initial Budget 10% 20%
Balance sheet (in foreign currency)Cash 0 400 440 480Accounts receivable 200 200 220 240Inventory 100 100 110 120
Total current assets 300 700 770 840Plant and equipment 350 350 350 350Less: Depreciation – (200) (200) (200)
Total assets 650 850 920 990Accounts payable 300 300 330 360Notes payable 300 300 300 300Taxes payable – 100 120 140
Total current liabilities 600 700 750 800Equity 50 50 50 50Retained earnings – 100 120 140
Total liabilities & equity 650 850 920 990

currency) raises profits, assuming that costs remain constant. In contrast, an appreciation in thecost currency (country A’s currency) reduces profits after taxes unless selling prices are adjustedto reflect the increase in costs.
There are similarities between the effect of inflation and the effect of exchange rate fluctua-tions on reported profits. If prices in the local currencies are increased by the same percentage asthe increase in the cost of imports, the effect of exchange rate fluctuations on profits is identicalwith the effect of a comparable local inflation rate. A 10 percent increase in export prices, accom-panied by a proportional increase in import prices, produces profits of 120; this is identical tothe profit obtained when the local inflation rate was 10 percent in the example from table 20.1.
We cannot determine the true impact of exchange rate fluctuations on foreign operationsunless a parent’s accounts and those of its subsidiaries are expressed in terms of a homogeneouscurrency unit. Any changes in the value of the local currency relative to the parent currency willaffect the reported profits when financial statements expressed in the local currency are trans-lated into the currency of the parent company. The translation procedure, already discussed inchapter 10, is regulated by the accounting profession.
20.1.2 Performance evaluation
Performance evaluation is a central feature of an effective management information system. Amanagement information system is a comprehensive system to provide all levels of managementin a firm with information so that production, marketing, and financial functions can be effec-tively performed to achieve the objectives of the firm. Management must plan its economic activ-ities in advance, carry out its plans, and make sure that deviations are properly evaluated andhandled. Thus, performance evaluation based on the concept of the management informationsystem relates to the fundamentals of the management process: planning, execution, and control.
Because every subsidiary is unique in many respects, each subsidiary should be evaluated onthe basis of specific targets and individual objectives set for each. A survey of 125 MNCs byPerson and Lessig (1979) identified four purposes of an internal evaluation system: (1) to ensureadequate profitability; (2) to have an early warning system if something goes wrong; (3) to havea basis for the allocation of resources; and (4) to evaluate individual managers. The study also
494 CORPORATE PERFORMANCE OF FOREIGN OPERATIONS
Table 20.2 The impact of currency fluctuations on profits
B’s currency A’s currency Both currenciesBudget appreciates 10% appreciates 10% appreciate 10%
Sales 2,000 2,100 2,000 2,100Cost of goods sold 1,500 1,500 1,560 1,560
Gross margin 500 600 440 540Depreciation 200 200 200 200
Operating income 300 400 240 340Interest expense 100 100 100 100
Profit before tax 200 300 140 240Taxes (50%) 100 150 70 120
Profit after tax 100 150 70 120

revealed that MNCs always use more than one criterion to evaluate the results of their foreignsubsidiaries. Of course, the performance evaluation system is designed to measure actual perfor-mance against budgeted objectives as well as the prior year’s results. In the best of situations, theevaluation system should monitor and control performance on a year-to-date and regular basis.
PERFORMANCE CRITERIA MNCs use multiple performance evaluation criteria because nosingle criterion can capture all facets of performance that interest management at the main head-quarters. Moreover, no single basis of measurement is equally appropriate for all units of anMNC. For example, companies can appropriately evaluate their production unit on the basis ofsuch measures as cost reduction, quality control, and meeting shipment targets. For a sales unit,however, cost reduction and quality control may be less appropriate than such measures as marketshare and number of new customers. Thus, it is highly desirable for companies to use multiplebases for performance measurement; that is, different ones for different kinds of operations indifferent countries.
Two broad groups of performance evaluation criteria – financial criteria and nonfinancial criteria – are used most widely by companies for evaluating their overseas operations. The returnon investment relates enterprise income to some specified investment base such as total assets.Many companies compare their actual operating performance with their budgeted performance;budgets are pre-established standards against which operations are evaluated, compared, andadjusted by the exercise of control. Abdallah and Keller (1985) surveyed 64 MNCs to identifythe financial criteria that they used to evaluate the performance of foreign subsidiaries. Accord-ing to Abdallah and Keller, the four most important criteria were: (1) return on investment (ROI),(2) profits, (3) budgeted ROI compared to actual ROI, and (4) budgeted profit compared toactual profit.
Many MNCs do not confine their performance criteria to mere financial considerations. Non-financial criteria complement financial measures because they account for actions that may notcontribute directly to profits in the short run but may contribute significantly to profits in thelong run. The market share is measured by sales or orders received as a percentage of total salesin a market. The sales growth is measured by unit volume gains, selling price increases, andexchange variations. Other important nonfinancial criteria include quality control, productivityimprovement, the relationship with the host-country government, cooperation with the parentcompany, employment development, employee safety, and community service.
Once questions of performance criteria have been resolved, companies should ascertainwhether their criteria could be useful in comparing a foreign unit’s performance against its com-petitors’ performance, either in the same country or across different borders. However, there aremany pitfalls in such comparisons. For example, it is almost impossible to determine the trans-fer pricing of competitors as well as their accounting principles. Certainly, cross-border compar-isons would compound the problem even further. Companies with many affiliates – at home orabroad – must also take caution whenever questions of comparability arise. Differences in sub-sidiaries would automatically distort performance comparisons unless they are directly accountedfor. Even if subsidiary objectives are the same, differences in country risk profiles, such as exchangecontrols and export subsidies, could distort performance comparisons.
PERFORMANCE MEASUREMENT ISSUES There are many crucial, yet perplexing, elements in theperformance evaluation process. As described earlier, two measurement problems unique toMNCs are exchange rates and inflation.
THE GLOBAL CONTROL SYSTEM AND PERFORMANCE EVALUATION 495

Perhaps the most critical element in the evaluation process is how to deal with results that aredenominated in currencies other than that of the parent company. The financial performance ofoverseas operations can be measured in terms of local currency, home-country currency, or both. Ifmajor changes occur in the exchange rates, the choice of currency can have a significant effect onthe assessment of a foreign subsidiary’s performance. For example, a subsidiary could make a profitin local currency but could incur a loss in the parent company’s currency. Most US companiesanalyze the operating results of their foreign operations in dollar terms. However, several of thesecompanies also use different rates for budgeting and performance tracking, because they recognizevariations between actual and expected results, which arise purely from exchange rate changes.
Fluctuating exchange rates may pose the most significant obstacle to proper evaluation, butthis is certainly not the only environmental factor. Wide variations and rapid changes in infla-tion rates from country to country also complicate the evaluation process. Generally, acceptedaccounting principles in the United States are based on the assumption of price stability. However,other countries have runaway inflation, thus making it essential to adjust local asset values forchanging prices. Such restatements directly affect the measurement of various ROI componentsand performance statistics for budgeting purposes. Because failure to account for inflation mayresult in an overstatement of return on investment, company resources may not be channeled totheir most promising use. Unfortunately, solutions to these problems are not readily formulated.Furthermore, MNCs must consider two sets of laws, two competitive markets, and two govern-ments. As a result, pricing considerations in international business are more numerous, morecomplex, and more risky than those in purely domestic business.
20.1.3 Organizational structure
As strictly domestic companies evolve into MNCs, many internal and external pressures strain afirm’s existing organizational structure. Some responsibilities are changed, new ones are created,and some existing ones are eliminated. Furthermore, control and finance functions change overtime as changes occur in countries’ socioeconomic environments. Companies must constantlyadjust their organizational structure to deal with new opportunities and challenges as they grow,diversify, and internationalize.
How should the financial staff of a company with foreign operations organize itself to carryout tasks that require the specialized expertise of multinational finance? There are three basicforms of organizational structure: centralization, decentralization, and hybrid structure.
A centralized financial function has a strong staff at the parent company level, which controlsvirtually all treasury decisions. The subsidiary financial staff only implements the decisions of its parent company. In a decentralized financial function, parent-company executives issue a fewguidelines, but most financial decisions are made at the subsidiary level. Many companies splitresponsibilities for international financial management between the corporate level and theregional level. The corporate level typically determines policy and grants ultimate approval onmajor financial decisions. However, day-to-day decisions to implement policy are made atregional headquarters.
Both centralization and decentralization carry advantages. The advantages of a centralizedfinancial function include close control of financial issues at headquarters, attention of top man-agement to key issues, and an emphasis on parent-company goals. A decentralized company mayargue that these advantages could be disadvantages. Data collection costs may be enormous,
496 CORPORATE PERFORMANCE OF FOREIGN OPERATIONS

centralized decision-making may stifle flexibility, and many opportunities may be lost because ofslow actions.
DECISION VARIABLES The ultimate choice of a particular organizational structure dependslargely upon the types of decisions one must make: (1) transfer pricing and performance evalu-ation, (2) tax planning, (3) exchange exposure management, (4) acquisition of funds, and (5)positioning of funds.
First, transfer pricing decisions made to minimize taxes may ruin the performance evaluationsystem for foreign subsidiaries. This problem sometimes forces a company to keep a second setof books for evaluation purposes. Many MNCs may, in fact, keep three or more sets of books:one for taxes, one for financial reporting, and one for evaluation purposes. There may be a needfor two transfer prices: one for tax purposes made at headquarters and one for evaluation pur-poses decided by direct negotiations between affiliates.
Second, the centralized organization usually works well to minimize worldwide taxes. Whentax planning is centralized, it is easier to use tax-haven countries, tax-saving holding companies,and transfer pricing. Thus, it is more efficient for MNCs to centralize their tax planning func-tion rather than allow each region to create its own layer of tax havens and holding companies.
Third, most companies centralize their foreign-exchange exposure management, because it isdifficult for regional or country managers to know how their foreign-exchange exposure relatesto other affiliates.
Fourth, many MNCs borrow money from local sources for their working capital. On theother hand, cheap sources of funds depend upon alternatives in all capital markets and the costof exchange gains or losses. Regional managers can hardly know all alternative sources of fundsoutside a local market.
Fifth, positioning funds involves paying dividends and making intracompany loans, therebyreducing consideration of total corporate tax liabilities, foreign-exchange exposure, and the avail-ability of capital. Consequently, most companies tend to control positioning of funds from a cen-tralized vantage point rather than from a regional viewpoint.
20.1.4 The Foreign Corrupt Practices Act
The US Securities and Exchange Commission (SEC) first investigated illegal foreign paymentsin 1974, with its probe of questionable contributions by US companies to the reelection cam-paign of former President Nixon. Subsequent inquiries by the SEC, the Department of Justice,and the Senate Foreign Relations Committee disclosed questionable payments of $300 millionby 450 companies. Revelations of such dubious payments by US firms to foreign officials rockedgovernments in Japan and the Netherlands.
Congress felt that the US corporate bribery (1) tarnished the credibility of American businessoperations, (2) caused embarrassment with allies and foes alike, (3) created foreign-policy diffi-culties, and (4) generally tarnished the world’s image of the USA. Consequently, they passed andsigned the Foreign Corrupt Practices Act (FCPA) on December 19, 1977, as an amendmentto the Securities Exchange Act of 1934. In 1988, the FCPA was modified in an effort to addressits perceived deficiencies. In December 1997, members of the Organization for Economic Devel-opment and Cooperation (OECD) with five other nations signed a binding convention to outlawbribery in international business dealings.
THE GLOBAL CONTROL SYSTEM AND PERFORMANCE EVALUATION 497

THE CONTENT OF THE FCPA The FCPA consists of two separate sections, antibribery andaccounting. The antibribery section was the first piece of legislation in US history to make it acriminal offense for US companies to corruptly influence foreign officials or to make paymentsto any person when they have “reason to know” that part of these payments will go to a foreignofficial. In other words, the FCPA applies only to US companies and not to their agents or sub-sidiaries. US companies or citizens could, however, be held in violation of the law if they had“reason to know” that their subsidiaries or agents would pay bribes on their behalf.
The accounting section establishes two interrelated accounting requirements. First, publiccompanies must “keep books, records and accounts, which, in reasonable detail, accurately andfairly reflect the transactions and dispositions” of their assets. Second, corporations are alsorequired to “devise and maintain a system of internal accounting controls sufficient to providereasonable assurance” that transactions have been executed in accordance with management’sauthorized procedures or policies.
Congress concluded that the antibribery and accounting sections would effectively preventpayments of foreign bribes and off-the-book slush funds. Penalties for violations include finesand jail time. Thus, both the antibribery section and the accounting section are enforced throughcivil and criminal liabilities.
MODIFYING THE FCPA President Reagan signed the FCPA amendment of 1988 into law aspart of an omnibus trade bill. Most proponents of its changes affirmed the original purposes ofthe FCPA. They found that the FCPA had been effective in curtailing bribes, kickbacks, andother unethical activities by US companies. Still, the 1988 amendment removed one of thestatute’s strongest export disincentives: the threat of statutory criminal liability based on acci-dental or unknowing negligence in the retention of certain accounting records. So, only corpo-rate employees who “knowingly” circumvent corporate accounting controls or falsify records ofcorporate payments are now subject to criminal liability. In fact, the old law and the new lawdiffer in notable ways:
1 The old law assessed both civil and criminal sanctions against both deliberate and negligentviolators of the accounting section. The new law assesses only civil (no criminal) penaltiesagainst negligent or unintentional violators of the accounting section. Violators convicted ofan intent to deceive still face criminal penalties.
2 The old law did not define “reasonable detail” in the accounting section and “reason to know”in the antibribery section. The new law defines them as those that would satisfy a “prudentindividual” under similar circumstances.
3 The old law did not define “grease payments” and virtually precluded all forms of grease pay-ments to foreign officials. In fact, grease payments were enforced via both civil and criminalsanctions. The new law specifically permits such grease payments if: (1) they help expediteroutine governmental action; (2) they are legal in that foreign country; or (3) they demon-strate gratitude or reimbursement for expenses incurred in connection with a contract.
4 The old law had been severely criticized from its inception on the ground that it was vagueand difficult to interpret. Still, no government agency issued interpretive guidelines. The newlaw specifies that the government will issue a set of clear guidelines if the business commu-nity wants further clarification.
5 The old law did not require any government agency to give its opinion on the legality of acontemplated transaction. The new law requires the Department of Justice to give its
498 CORPORATE PERFORMANCE OF FOREIGN OPERATIONS

opinion on the legality of a planned transaction within 30 days after receiving the necessaryinformation.
6 Penalties for violations increased from $1 million to $2 million for corporations and from$10,000 to $100,000 and/or 5 years in jail for individuals. The Internal Revenue Service willnot allow a firm to treat a foreign bribe as a business expense for tax purposes: such bribesare treated as profits currently subject to US taxation. A company is not allowed to reim-burse individuals for fines paid as a consequence of violating the FCPA.
7 Enforcement of the antibribery provisions for all jurisdictions has been consolidated withinthe Justice Department. The SEC retains the responsibility to enforce the provisions of theaccounting section.
20.2 International Taxation
Usually, one of the most important variables in multinational operations is taxation. Perhaps noenvironmental variable, with the possible exception of foreign exchange, has such a pervasiveinfluence on all aspects of multinational operations as taxation: (1) the choice of location in theinvestment decision, (2) the form of the new enterprise, (3) the method of finance, and (4) themethod of transfer pricing.
International taxation is complicated because tax laws differ among countries and are con-stantly changing. Hence, it is not accidental that international taxation still remains somewhatof a mystery for many international executives. For example, multinational financial managersneed to understand the following:
1 Shareholders of foreign and domestic corporations are subject to different rules.2 Accounting for foreign taxes on foreign operations is not identical to that on domestic
operations.3 Bilateral tax treaties and foreign tax credits exist to avoid double taxation of income.4 Many countries offer a number of tax incentives to attract foreign capital and know-how.5 Tax savings realized in low-tax countries may be offset by taxes on undistributed earnings.
There are many such added complexities because governments have failed to come to any generalagreement on tax policies. Each country has its own tax philosophies, tax incentives, transferpricing policies, and the like. Multinational financial managers must sort them out in order tomaximize profitability and cash flow. To attain this end, they must acquaint themselves with theoverall tax environment.
20.2.1 Types of taxes
MNCs face a variety of direct and indirect taxes. Direct taxes include corporate income taxesand capital gains taxes. Indirect taxes include value-added taxes, tariffs, and withholding taxes.In addition to these direct and indirect taxes, MNCs may have to pay property taxes, payrolltaxes, stamp and registration taxes, taxes on registrations of agreements of various types, sales andexcise taxes (excluding value-added taxes), and taxes on undistributed earnings.
INTERNATIONAL TAXATION 499

INCOME AND CAPITAL GAINS As with individual income taxes, corporate income taxes are animportant source of revenue for many countries. Because most developing countries have lowper capita income, individual income taxes or sales taxes are not very appropriate. Thus, devel-oping countries obtain a larger share of government revenues from corporate income taxes thanindustrial countries.
Gains and losses on sales of capital assets are called capital gains and losses. Capital assetsare those assets that are not primarily for resale and not acquired in the ordinary course of busi-ness. These assets include stocks and bonds. If capital assets are held longer than a specified periodof time, gains on sales of these assets may be subject to preferential tax treatment:
• Value-added taxes are a special type of sales tax. Sales taxes are those taxes assessed at one ormore stages in the production process. In Canada, sales taxes are levied when production iscomplete; in England, when products are wholesaled; in the USA, when products are retailed;and in some European countries, at all stages in the production cycle. Many European coun-tries have adopted the value-added tax as the major source of revenue to avoid the com-pounding effect of sales taxes. For example, if a car dealer purchased a car for $10,000 froma car manufacturing company and then sold it for $15,000, the value added would be $5,000and the tax would be levied on this $5,000 increment.
• Tariffs are simply taxes assessed on imported goods, which parallel excise and other indirecttaxes paid by domestic producers of similar goods. They may be imposed for purposes ofrevenue or protection. When tariffs are employed to increase revenues, they are usuallymodest. However, when tariffs are used to protect domestic companies from foreign com-petition, they are typically high. Although protective tariffs do not eliminate the importationof foreign products completely, they clearly put foreign sellers at a comparative disadvantage.In this instance, consumers must pay more for foreign goods, which in turn would reducetheir consumption of imported commodities.
• Withholding taxes are those taxes imposed by host governments on dividend and interestpayments to foreign investors and debt holders. These taxes are collected before receipt ofthe income. In other words, they are usually withheld at the source by the paying corpora-tion. For example, a 20 percent withholding tax on $10,000 interest payments to foreignersmeans that the tax proceeds of $2,000 are deducted from the interest payment made to thelender and collected by the borrower on behalf of the government. Hence, the purchaser ofthe bonds would receive only $8,000, or 80 percent of the $10,000 interest payment. With-holding taxes are generally modified by bilateral tax treaties, because they frequently restrictthe international movement of long-term investment capital.
20.2.2 Tax morality
The issue at stake is the conflict between economics (profits) and ethics (corporate morality).Some business executives think that profits are one thing and corporate morality is another; thus,they conclude that they have to make a choice. It is well known that in many countries bothcorporate and individual taxpayers are not completely honest with their tax authorities. MNCsmust decide whether to comply with the tax laws voluntarily. Although most MNCs complyfully with the tax laws, some companies feel that they should evade taxes to the same extent astheir competitors in order to protect their competitive position. Ethical standards vary greatly
500 CORPORATE PERFORMANCE OF FOREIGN OPERATIONS

among people, companies, and societies because business ethics are partly a function of culturalpatterns and historical development. Therefore, there is obviously no universally accepted answerto the problem.
Host governments also have a similar moral problem. Two basic tax principles are that taxesshould be equitable and neutral. In other words, taxes should be fair to everyone, and they shouldnot affect decisions in the economic system. Nevertheless, many countries have imposed somearbitrary tax penalties on MNCs for presumed violations of local tax laws. Many developingcountries have various tax incentive programs for private foreign investments. These tax incen-tive programs abandon the principle of an economically neutral system. Under a neutral taxsystem, if we want the most efficient economic system, supply and demand should be left aloneto determine prices and economic activity.
20.2.3 Tax burdens
Because different countries have varying statutory rates of income tax, differences in overall taxburdens are another natural feature of international business operations. The corporate tax rateranges from zero in such tax-haven countries as the Bahamas to 60 percent in such countries asLibya.
Differences in definitions of taxable corporate income create greater disparities than dif-ferences in nominal corporate tax rates. Thus, differential tax rates tell us only part of the story. In one country, taxable income may be computed on a cash basis, while in another country it may be determined on an accrual basis. Investment allowances and credits, reserves,the timing of depreciation deductions, and asset valuations vary greatly from country to country.Some countries provide companies with full credit for taxes on the income paid in other countries.
Tax systems also affect relative tax burdens internationally. In general, there are three classesof systems: single tax, double tax, and partial double tax. Under the single tax system, income istaxed only once. If corporations pay no taxes, their stockholders pay taxes on dividends. Underthe double tax system, corporations pay taxes on profits at a given rate and dividends are thentaxed as income to stockholders at their personal income tax rates. Under the partial double taxsystem, taxes are levied on corporate income, but dividends are taxed at a lower rate than otherforms of personal income, or distributed corporate earnings are taxed at a lower rate than undis-tributed earnings (retained earnings).
CARRYBACKS AND CARRYFORWARDS An operating loss is the excess of deductible expenses overgross income. Operating losses can often be carried back or forward to offset earnings in otheryears. Tax provisions for carrybacks and carryforwards vary among countries. Most countries donot permit operating losses to be carried back. However, virtually all countries allow companiesto carry their losses forward for a limited number of years.
US companies may carry their excess foreign tax credit back 3 years and carry it forward 15years to offset US tax on foreign-source income. The choice depends largely upon whether acompany has had foreign-source income in the 2 years immediately prior to the excess foreigntax credit. If this is the case, the company must carry the excess foreign tax credit back in orderto expedite the refund of tax payment.
INTERNATIONAL TAXATION 501

The purpose of this provision is to allow corporations to average their operating results, whichfluctuate widely from year to year. However, some profitable MNCs have used the carryback andcarryforward feature as a means of reducing their taxable income by merging with other firmsthat have considerable operating losses or excess foreign tax credits.
20.2.4 Parent-country taxation of multinational operations
Countries differ with respect to their tax treatment of foreign-source income earned by theirMNCs. Major differences include varying interpretations of tax neutrality, the method of grant-ing credit for foreign-income taxes already paid, and concessions gained in bilateral tax treaties.
TAX NEUTRALITY A neutral tax is one that would not affect the location of the investment orthe nationality of the investor. Tax neutrality is justified on the ground that world welfare wouldbe increased if capital were free to move from countries whose rate of return is low to those whoserate of return is high.
Tax neutrality consists of domestic neutrality and foreign neutrality. Domestic neutralitymeans the equal treatment of Americans who invest at home and Americans who invest abroad.This neutrality involves equalization of all taxes on profits.
Foreign neutrality indicates that the tax burden imposed on each foreign subsidiary of a UScompany should equal the tax burden placed on its competitors in the same country. The firmowned by residents of the host country and the foreign subsidiary of a non-US company are thetwo basic types of competitors faced by the foreign subsidiary of a US firm.
Tax neutrality is designed to achieve a status of equality within the tax system. In practice,however, it is difficult to define and measure tax neutrality. The issue of tax equality is also dif-ficult to define and measure. Many governments claim that they tax foreign income at the samerate as domestic income. However, most countries in the world have many important departuresfrom the theoretical norm of tax neutrality.
TAX TREATIES Countries enter into bilateral tax treaties to avoid double taxation and thus toencourage the free flow of investments internationally. Treaty countries agree on how taxes willbe imposed, shared, or otherwise eliminated on business income earned in one taxing jurisdic-tion by nationals of another.
Tax treaties are designed to serve the following four purposes:
1 To prevent double taxation on the same income.2 To prevent national tax discrimination against foreign nationals of the other treaty country.3 To increase predictability for the nationals of the treaty nations by specifying taxable oblig-
ations. Predictability also tends to reduce opportunities for tax evasion or tax fraud.4 To specify the type of tax subsidies that will be mutually acceptable to both treaty nations.
The provisions of most tax treaties override the provisions of national income tax laws. Forexample, Section 8894 of the US Internal Revenue Code states that “income of any kind, to theextent required by any treaty obligation of the United States, shall not be included in gross incomeand shall be exempt from taxation under this subtitle.” Thus, US tax treaties provide that profitsearned by US companies in a foreign country are exempt from taxation unless they have
502 CORPORATE PERFORMANCE OF FOREIGN OPERATIONS

permanent establishment in the foreign country. Tax treaties also reduce withholding taxes ondividends, interest, and royalties.
FOREIGN TAX CREDITS The purpose of the foreign tax credit is to avoid international doubletaxation when profits earned abroad become subject to the full tax levies of two or more coun-tries. Under the foreign tax credit system, the USA relinquishes tax on profits earned abroad upto the amount of the foreign tax. Thus, the foreign government takes the first bite of profitsearned in its jurisdiction. In addition, taxes subject to these credit provisions include withhold-ing taxes on dividends, interest, and other income.
INTERNATIONAL TAXATION 503
Example 20.1
Assume that a US corporation has $1,000 of foreign income earned in the United Kingdom.The US tax rate is 35 percent and the UK tax rate is 30 percent. The net US tax of $50 iscomputed as follows:
Foreign income $1,000Foreign tax (30%) 300Net income after tax $ 700US taxable income $1,000US tax (35%) $ 350Foreign tax credit 300US tax payable $ 50Total foreign and US taxes $ 350Effective tax rate 35%
As this example illustrates, the purpose of the foreign tax credit is to limit the total tax on foreignincome to the higher tax rate of the two countries. If the foreign tax on income earned abroadand remitted to the USA is less than or equal to the US tax rate, that income will be subject toa total tax of 35 percent. Thus, if the foreign tax rate is lower than the US rate, the US govern-ment receives some tax revenues on the foreign income. If the foreign tax rate is higher than theUS rate, the US government receives no tax revenues on the foreign income.
As an alternative to the foreign tax credit, US companies can treat any foreign tax paid directlyas a deductible expense. Because both a credit and deduction cannot be claimed in the same year,the US company must decide whether to claim the credit or deduction for foreign income taxes. In general, it is advantageous to claim a credit against federal income tax rather than adeduction.

20.2.5 Tax incentives for foreign investment
The location of foreign investment is influenced by three major tax factors: tax incentives, taxrates, and tax treaties. The existence of tax incentives can significantly reduce the cash outflowrequired for an investment project, which will increase the net present value of the project. It isimportant to be familiar with local tax laws, because the determination of revenues and expensesfor tax purposes is a function of tax laws in most countries. Tax treaties are essential in terms ofhow they affect the cash flows related to withholding taxes on dividends, interest, and royalties.Paying close attention to tax treaties can help investors to wisely choose the location of their legaloperations.
Many countries, especially developing countries, offer tax incentives to attract foreign capitaland know-how to their countries. The four basic forms of tax incentive programs are govern-ment concessions, tax havens, foreign trade zones, and other tax incentives.
GOVERNMENT CONCESSIONS Developing countries offer many concessions to attract MNCs.Most concessions are in the form of a complete tax exemption for the first few years, known as“tax holidays.” Some other forms of temporary tax concessions include reduced income tax rates,tax credits on new investments, tax deferrals, and reduction or elimination of various indirecttaxes. These concessions, along with lower labor costs in relation to developed countries, havemade many developing countries attractive for assembly and manufacturing operations.
504 CORPORATE PERFORMANCE OF FOREIGN OPERATIONS
Foreign tax credit Foreign tax deduction
Foreign income $1,000 $1,000Foreign tax (35%) 350 350Net income after tax 650 650US taxable income $1,000 $ 650US tax (35%) $ 350 $ 227Foreign tax credit 350 0US tax payable $ 0 $ 227Total foreign and US taxes $ 350 $ 577Effective tax rate 35% 57.7%
Example 20.2
Assume that a US corporation has $1,000 of foreign income earned in Spain. Spain and theUSA have an identical tax rate of 35 percent. The following computation shows that thecredit is better than the deduction:

TAX HAVENS Those countries that offer strict bank-secrecy laws and zero or low taxation inorder to attract foreign investors and depositors are known as tax havens. These nations havefew natural resources. In addition to low tax rates, tax havens must have (1) a stable government,(2) good communication facilities, (3) freedom of currency movements, and (4) the availabilityof financial services. Tax havens may be classified into four broad categories:
1 Countries with no income taxes, such as the Bahamas, Bermuda, and the Cayman Islands.2 Countries with very low taxes, such as Switzerland, Liechtenstein, and the Channel Islands.3 Countries that tax income from domestic sources but exempt income from foreign sources,
such as Liberia and Panama.4 Countries that allow special privileges to make them suitable as tax havens for very limited
purposes.
A large number of MNCs have foreign affiliates that act as tax havens for corporate funds. Thesecorporate funds are held in the tax havens until they are reinvested or repatriated elsewhere. Tax-haven affiliates are the outgrowth of tax-deferral features on foreign earnings allowed by someparent countries to their MNCs. Normally, parent companies could defer taxes on their foreignearnings until these earnings are received as dividends.
Increasing capital flows across countries have many benefits, but they pose policy challenges,such as tax avoidance and tax evasion. The vast increase in global capital flows has made it tougherfor countries to monitor their taxpayers for compliance: “Nobody really knows how much taxrevenue is lost to offshore schemes, but everybody agrees it is huge – by one estimate about $70billion a year in the US alone” (Allen 2000). Thus, industrialized countries have recently pres-sured tax havens to adopt international standards for banking regulation and safeguards againstmoney laundering activities.
THE FOREIGN TRADE ZONE (FTZ) A foreign trade zone is an enclosed area where domesticand imported merchandise can be stored, inspected, and manufactured without being subject toformal customs procedures until the goods leave the zone. There are thousands of these areas inmost countries around the world.
FTZs have operated in the USA since the passage of the Foreign Trade Zone Act of 1934.This law also created the Foreign Trade Zone Board, which authorizes and regulates activitieswithin the FTZs. Over the years, the law and administration have been liberalized to permitmore activities within the FTZs and more flexibility in the location of FTZs. The number ofFTZs has increased from less than a dozen before 1970 to well over 600 today.
Goods in FTZs have not entered the country so far as import documentation, collection ofcustoms duties, and the allocation of quotas or other import restrictions are concerned. Federaland local excise taxes are not levied on goods while they are located in FTZs. Except for customsand excise taxes, products and firms in FTZs are subject to the same local and federal laws andregulations, such as immigration laws, safety laws, and regulation of carriers.
FTZs must be located adjacent to US customs “ports of entry,” but these are no longer locatedadjacent to “inland ports of entry.” Within FTZs, companies may store and assemble importedgoods. They may also use imported parts and raw materials to conduct manufacturing opera-tions in FTZs.
Although the advantages of the FTZ to importers are well known, its benefits to exportersappear to have been overlooked. FTZs can provide accelerated export status for purposes of excise
INTERNATIONAL TAXATION 505

tax rebates and customs drawbacks. Manufacturers of such items as tires, trucks, and tobaccoproducts are required to pay federal excise taxes when these items are produced, but the taxes arerebated if the items are exported. Companies must pay duty on the imports, but this duty isreturned when the product is exported (custom drawback). Because the recovery of this moneytakes time, the exporter can have considerable capital tied up in excise taxes and import duties.The use of FTZs resolves this problem. A product is considered exported as soon as it enters anFTZ and thus the exporter can immediately apply for a rebate or a drawback while waiting tomake an export sale.
20.3 Transfer Pricing and Tax Planning
Transfer prices are prices of goods and services bought and sold between parent companies andsubsidiaries. Internal transfers include raw materials, semifinished goods, finished goods, alloca-tion of fixed costs, loans, fees, royalties for use of trademarks, and copyrights. International trans-fer pricing policies become increasingly complex as companies increase their involvement ininternational transactions through foreign subsidiaries, joint ventures, and parent-owned distri-bution systems. Discrepancies between transfer pricing methods used by companies and thoseallowed by taxing agencies take place because taxing agencies and companies have different objec-tives. For example, MNCs try to maximize profits and improve performance evaluation bymanipulating internal transfer prices. Taxing authorities, on the other hand, try – through fairmarket prices – to allocate the profit of a sale between their country and other countries. Thus,multinational financial managers must understand transfer pricing objectives and their impacton transfer prices.
20.3.1 Transfer pricing objectives
Transfer pricing strategies are sensitive internal corporate issues, because successful pricing is akey element in achieving profits. Transfer pricing also helps MNCs determine how companyprofits are allocated across divisions. Governments show interest in transfer pricing because theseprices will decide tax revenues and other benefits. So, many host governments have policingmechanisms to review the transfer pricing policies of MNCs.
Transfer pricing has the following objectives:
1 Income tax minimization.2 Import duty minimization.3 Avoidance of financial problems.4 Adjustment for currency fluctuations.
INCOME TAX MINIMIZATION Many researchers have singled out tax minimization as an impor-tant variable influencing international transfer pricing decisions. Their finding is not surprising,because transfers between related business entities account for approximately 35 percent of totalworld trade. Economic benefits are immediate if transfer prices can shift profits from a countrywith a higher tax rate to a country with a lower tax rate. Yet a company using transfer pricingfor maximizing profits must balance this approach by having prices that are consistent with theregulations of taxing authorities.
506 CORPORATE PERFORMANCE OF FOREIGN OPERATIONS

TRANSFER PRICING AND TAX PLANNING 507
Example 20.3
To illustrate the tax effects of a change in transfer prices on corporate earnings, assume thefollowing. (1) Affiliate A is in a low-tax country (20 percent tax rate) and affiliate B is in ahigh-tax country (50 percent tax rate). (2) Affiliate A produces 100 radios for $5 per unitand sells them to affiliate B. (3) Affiliate B sells these radios for $20 per unit to an unrelatedcustomer. Table 20.3 shows the tax effects of low ($10 per unit) versus high ($15 per unit)transfer price on company earnings.
Under the low transfer price, A pays taxes of $60 and B pays taxes of $300 for a totaltax bill of $360 and a consolidated net income of $540. Under the high transfer price, Apays taxes of $160 and B pays taxes of $50 for a total tax bill of $210 and a consolidatednet income of $690. Earnings before taxes are the same at $900, despite the different pricesat which the radios transfer from A to B. Still, the higher transfer price reduces total taxesby $150 ($360 – $210) and increases consolidated net income by the same amount ($690 – $540).
Table 20.3 The tax effects of low versus high transfer prices
Low tax, A High tax, B Combined, A + B
Low transfer priceSales price $1,000 $2,000 $2,000Cost of goods sold 500 1,000 500Gross profit $ 500 $1,000 $1,500Operating expenses 200 400 600Earnings before taxes $ 300 $ 600 $ 900Taxes (20%/50%) 60 300 360Net income $ 240 $ 300 $ 540
High transfer priceSales price $1,500 $2,000 $2,000Cost of goods sold 500 1,500 500Gross profit $1,000 $ 500 $1,500Operating expense 200 400 600Earnings before taxes $ 800 $ 100 $ 900Taxes (20%/50%) 160 50 210Net income $ 640 $ 50 $ 690

IMPORT DUTY MINIMIZATION Affiliate A sells goods to affiliate B. The rule of thumb forincome tax minimization is: (1) set the transfer price as high as possible if A’s tax rate is lowerthan B’s tax rate; and (2) set the transfer price as low as possible if A’s tax rate is higher than B’stax rate. The introduction of import duties complicates this rule, because multiple objectivescould conflict. For example, a lower transfer price reduces import duties, but it increases incometaxes. A higher transfer price reduces income taxes, but it increases import duties. Suppose thatB must pay import duties at the rate of 10 percent. Import duties are normally levied on theinvoice (transfer) price. The higher transfer price raises tariffs by $50 ($1,500 ¥ 0.10 - $1,000¥ 0.10), thus offsetting tax effects of $50 in terms of increased tariffs.
Import duty minimization is easy, but tax reductions, which have offsetting effects, may com-plicate it. Also, a country with low import duties may have high income taxes, while a countrywith high import duties may have low income taxes. If MNCs use low or high transfer prices incertain countries, they have to balance import duties and income taxes to maximize a combinedbenefit from tariff and income tax reductions.
AVOIDANCE OF FINANCIAL PROBLEMS Transfer prices can be used to avoid financial problemsor to improve financial conditions. Transfer pricing often avoids economic restrictions andexchange controls that host countries place on MNCs. For example, some developing countriesrestrict the amount of profits that can leave the country. An obvious way around this restrictionis to charge high prices for imports. Therefore, countries with such restrictions watch import andexport prices closely.
Some countries do not allow MNCs to charge certain expenses against taxable income. Forinstance, they do not permit expenses for research and development done elsewhere. Royalty feesa parent company charges against its subsidiary income are often not allowed. Because the hostcountry does not allow them, they can be recaptured by increasing the transfer price of goodsshipped into the country.
Transfer prices can also channel profits into an affiliate to bolster its financial condition, thuspresenting a favorable profit picture to satisfy earnings criteria set by foreign lenders. Therefore,the parent company does not need to commit much capital to its foreign subsidiary, even thoughthe subsidiary may be required to secure the loan. Besides, low transfer prices give the subsidiarya competitive edge that it might need when starting a new venture or when reacting to an eco-nomic downturn.
ADJUSTMENT FOR CURRENCY FLUCTUATIONS A wide range of currency fluctuations mayinfluence the performance reports of foreign subsidiaries. Many US MNCs evaluate the perfor-mance of foreign subsidiaries with reports stated in US dollars. If currency exchange rates fluc-tuate, it may be difficult to evaluate the performance of the subsidiary. The management of thesubsidiary often prefers to evaluate its performance with reports stated in local currency ratherthan in US dollars. Adjusting transfer prices for currency fluctuations can solve this performanceevaluation problem. Performance evaluation, however, is difficult when the objective is tax min-imization or when currency fluctuates. One subsidiary’s profit in one country may be greaterthan another subsidiary’s profit in another country, not because of better management but becauseof the transfer price. One way to solve this problem is to maintain two sets of books: one forforeign authorities and another set for performance evaluation purposes.
508 CORPORATE PERFORMANCE OF FOREIGN OPERATIONS

SUMMARY 509
SUMMARY
Multinational accounting has become increasingly important in recent years because of a greatincrease in foreign investment, capital flows, and trade. Accurate financial reports on operationsmust be prepared for stockholders and creditors to make decisions about the value of existing oper-ations. They are especially important in international business where operations are typically super-vised from a distance. This chapter has discussed major issues in multinational accounting, controlsystem and performance evaluation, and the Foreign Corrupt Practices Act of 1977. Financialcontrol systems must fit international circumstances to check performance against standards on aworldwide basis. The Foreign Corrupt Practices Act of 1977 intended to stop the erosion of inter-national confidence in US business and institutions. The FCPA made it unlawful for US compa-nies to influence foreign officials through payments and required these firms to maintain strictaccounting controls over their assets. For many years, a large number of US business executives hadregarded the FCPA as one of the statute’s strongest export disincentives. Thus, Congress amendedthe FCPA in 1988 to make US companies more competitive in the world market. In addition, bythe end of 1998, countries around the world had adopted tough laws of their own to crack downon companies that bribe to win foreign contracts.
For multinational operations, taxation has a significant impact on the choice of location in theinitial investment decision, the form of the new enterprise, the method of finance, and many otherinternational financial decisions. Tax planning for multinational operations involves complex prob-lems such as national tax environments, double taxation, and various tax incentive programs. Thus,it is highly desirable that MNCs seek the inputs of experienced tax and legal counsel in both parentand host countries. Nevertheless, to preserve profit opportunities abroad and to receive special taxincentives, it is important for the financial manager of an MNC to be acquainted with the nationaltax environments and other tax problems in the host countries in which the company operates.
Transfer prices are prices of goods and services bought and sold between parent companies andsubsidiaries. Internal transfers include raw materials, semifinished goods, finished goods, allocationof fixed costs, loans, fees, royalties for use of trademarks, and copyrights. International transferpricing policies become increasingly complex as companies increase their involvement in interna-tional transactions through foreign subsidiaries, joint ventures, and parent-owned distributionsystems. Discrepancies between transfer pricing methods used by companies and those allowed bytaxing agencies take place because taxing agencies and companies have different objectives. Forexample, multinational companies try to maximize profits and improve performance evaluation bymanipulating internal transfer prices. Taxing authorities, on the other hand, try – through fairmarket prices – to allocate the profit of a sale between their country and other countries. Thus,multinational financial managers must understand transfer pricing objectives and their impact ontransfer prices.

510 CORPORATE PERFORMANCE OF FOREIGN OPERATIONS
Questions
1 Explain two major problems that make multinational accounting complicated.2 Why are budgets and the return on investment in performance evaluation systems more
frequently used than any other indicators?3 Discuss centralization versus decentralization as it impinges on decisions relating to trans-
fer pricing and performance evaluation, exchange exposure management, acquisitions offunds, positioning of funds, and tax planning.
4 What is the Foreign Corrupt Practices Act? What are the two sections of this law?5 Why is taxation one of the most important variables in multinational operations?6 In what general ways do countries differ with regard to their tax systems?7 Explain tax morality from the viewpoints of both multinational companies and host
governments.8 What is double taxation? How can its effect be lessened?9 List some key objectives of transfer pricing policies.
10 Is it possible for a multinational company to minimize both income taxes and import dutiessimultaneously?
11 How do multinational companies use transfer prices to avoid financial problems faced bytheir subsidiary?
Problems
1 AT&T purchases its raw materials from Germany and sells its finished products to Japan.Both exports and imports with terms “net 60 days” are denominated in foreign curren-cies (the yen and the euro), but the levels of both revenues and costs are measured inthe US dollar. AT&T has: sales = $4,000; cost of goods sold = $3,000; depreciation = $400;interest expenses = $200, and tax rate = 50 percent. Assume that the euro and the Japan-ese yen appreciate by 10 percent before these credit transactions are settled.
(a) Use the above information to prepare an income statement such as table 20.2.(b) Under what condition will a 10 percent appreciation in the yen raise AT&T’s profits?(c) Under what condition will a 10 percent appreciation in the euro reduce AT&T’s profits?(d) What will happen to AT&T’s profits if selling prices and costs are adjusted to reflect
the 10 percent appreciation in both the yen and the euro?2 The following selected amounts are from the separate financial statements of a US parent
company and its foreign subsidiary:

PROBLEMS 511
Additional assumptions are as follows: (1) the parent owes the subsidiary $70; (2) theparent owns 100 percent of the subsidiary; (3) during the year, the subsidiary paid theparent a dividend of $250; (4) the subsidiary owns the building that the parent rents for$200; and (5) during the year, the parent sold some inventory to the subsidiary for $2,200,whose cost was $1,500 to the parent, and in turn, the subsidiary sold the inventory toan unrelated party for $3,200.(a) What is the parent’s unconsolidated net income?(b) What is the subsidiary’s net income?(c) What is the consolidated profit on the inventory that the parent originally sold to
the subsidiary?(d) What are the amounts of the following items, on a consolidated basis?
• cash• accounts receivables• accounts payable• revenues• expenses• dividend income• rent income• retained earnings.
3 Assume that: (a) a multinational corporation has $1,000 of foreign income; (b) the foreigncountry’s tax rate is 40 percent; and (c) the domestic tax rate is 50 percent. What is thedomestic tax liability?
4 Assume that: (a) a multinational corporation has $1,000 of foreign income; (b) the foreigncountry’s tax rate is 50 percent; and (c) the domestic tax rate is 50 percent. The multi-national company can treat any foreign tax paid directly as a deductible expense or as atax credit. What are the effective tax rates of the multinational corporation under thecredit and the deduction?
5 A US company has $100 of foreign income earned in Belgium. Assume that the US tax rate is 35 percent and the Belgium tax rate is 33 percent. Demonstrate the dif-ference in US tax liability that arises from double taxation, a tax deduction, and a taxcredit.
Parent Subsidiary
Cash $ 180 $ 80Accounts receivable 380 200Accounts payable 245 110Retained earnings 790 680Revenues 4,980 3,520Rent income 0 200Dividend income 250 0Expenses 4,160 2,960

512 CORPORATE PERFORMANCE OF FOREIGN OPERATIONS
7 Eurowide Corporation has two foreign affiliates: A is in a low-tax country (30 percent taxrate) and B is in a high-tax country (50 percent tax rate). Affiliate A produces partiallyfinished products and sells them to affiliate B, where the production process is completed.The pro forma income statements of these two affiliates are shown in the following table.Assume that the company increases its transfer price from $3,000 to $3,600. Determinethe tax effect of this high transfer price on the company’s consolidated net income.
Pro forma income statements for two affiliates
Seller Value added by seller
Extractor $300Processor 500Wholesaler 75Retailer 75
Low tax A High tax B Combined A + B
Low transfer pricesSales price $3,000 $4,400 $4,400Cost of goods sold 2,000 3,000 2,000Gross profit $1,000 $1,400 $2,400Operating expenses 200 200 400Earnings before taxes $ 800 $1,200 $2,000Taxes (30%/50%) 240 600 840Net income $ 560 $ 600 $1,160
8 Eurowide Corporation has two foreign affiliates: A is in a low-tax country (30 percent taxrate) and B is in a high-tax country (50 percent tax rate). Affiliate A produces partiallyfinished products and sells them to affiliate B, where the production process is completed.Affiliate B must pay import duties at the rate of 10 percent – 10 percent of the value ofthe imported goods. These tariffs are tax deductible. The pro forma income statementsof these two affiliates are shown in the following table. Assume that the companyincreases its transfer price from $3,000 to $3,600. Determine the tax-plus-tariff effect ofthis high transfer price on the company’s consolidated net income.
6 Assume a value-added tax of 10 percent. What would be the selling price and taxes ateach stage if the following were the values added?

REFERENCES 513
9 Assume that IBM’s Canadian subsidiary sells 1,500 personal computers per month to theGerman affiliate at a transfer price of $2,700 per unit. The tax rates are 45 percent forCanada and 50 percent for Germany. The transfer price can be set at any level between$2,500 and $3,000.
(a) At what transfer price will IBM taxes be minimized? Explain.(b) If the German government imposes an import duty of 15 percent on imported per-
sonal computers, at what transfer price will IBM tariffs be minimized? Explain.10 Suppose that Ford Motor sells 100 trucks per month to its Mexican subsidiary at a trans-
fer price of $27,000 per unit. Ford Motor is allowed to set its transfer price at any levelbetween $25,000 and $30,000.
(a) At what transfer price will Ford Motor move the maximum amount of funds fromMexico? Explain.
(b) At what transfer price will Ford Motor bolster the subsidiary’s financial condition most?Explain.
Low tax A High tax B Combined A + B
Low transfer pricesSales price $3,000 $4,400 $4,400Cost of goods sold 2,000 3,000 2,000Import duty (10%) – 300 300Gross profit $1,000 $1,100 $2,100Operating expenses 200 200 400Earnings before taxes $ 800 $ 900 $1,700Taxes (30%/50%) 240 450 690Net income $ 560 $ 450 $1,010
REFERENCES
Abdallah, W. M., International Transfer Pricing Poli-cies: Decision Making Guidelines for MultinationalCompanies, New York: Quorum Books, 1989.
Abdallah, W. M. and D. E. Keller, “Measuring the Multinationals’ Performance,” ManagementAccounting, Oct. 1985, pp. 25–30.
Agami, A. M., “Global Accounting Standards andCompetitiveness of US Corporations,” Multi-national Business Review, Spring 1993, pp. 38–43.
Allen, M., “Secret Offshore Bank Accounts Are NotAlways So Secret,” The Wall Street Journal, Apr. 6,2000, pp. A14, A19.
Doernberg, R. L., International Taxation in a Nutshell, St Paul, MN: West/Wordsworth, 1999.
Ernst & Young, Worldwide Corporate Tax Guide andDirectory, New York: Ernst & Young, 2004.
Feinschreiber, R., Transfer Pricing Handbook, NewYork: John Wiley, 1999.
Kim, S. H., “On Repealing the Foreign CorruptPractices Act,” Columbia Journal of World Busi-ness, Fall 1981, pp. 75–80.
Kim, S. H., U. Swinnerton, and G. Ulferts, “1994Transfer Pricing Regulations of the United
Pro forma income statements for two affiliates

514 CORPORATE PERFORMANCE OF FOREIGN OPERATIONS
States,” Multinational Business Review, Spring1997, pp. 17–25.
Person, W. and V. Lessig, Evaluating the Performanceof Overseas Operations, New York: Financial Exec-utive Institute, 1979.
Spitz, B., 2000 International Tax Havens Guide, SanDiego, CA: Harcourt Brace Professional Publish-ing, 1999.
Tyrall, D. and M. Atkinson, International TransferPricing: A Practical Guide to Finance Directors,London: Financial Times Management, 1999.
United Nations Center on Transnational Corpora-tions, International Accounting and ReportingIssues, New York: United Nations, 1990.
Wrappe, S. C., K. Milani, and J. Joy, “The TransferPrice Is Right,” Strategic Finance, July 1999, pp. 39–43.
Case Problem 20: Advanced Technology’sEthical Dilemma
The Executive Committee of Advanced Technology (AT) – Robert Smith, President; LindaHumphrey, Vice President of Finance; Sam Miller, Vice President of Marketing; and SusanCrum, Vice President of Production – scheduled a luncheon meeting on September 1, 1996,to discuss two major problems for the welfare of the company: (1) how to finance the rapidexpansion of its production facilities and (2) how to cope with a growing competition in itsmajor overseas markets. In addition, the Department of Justice requested AT to answer severalquestions about bribes, gifts, slush funds, and grease payments in relation to its foreign sales.This inquiry began in response to a 100-page complaint by its overseas competitor, whichalleged that AT had violated the Foreign Corrupt Practices Act of 1977.
AT has recently enjoyed a rapid growth in business. The company is anticipating substan-tial increases in sales for the next few years. However, it must solve two major problems –capacity and strong competition in foreign operations – if it is to maintain fast sales growthfor years to come.
AT produces office automation systems and equipment. In addition to introducing a newlydesigned mainframe computer, the company has aggressively increased research in mini-computers and word processors. These products are in high growth markets, and the firm’sexpenditures for these projects have more than proved their worth. In fact, the company’smajor problem has been to increase production fast enough to meet demand of its Asian customers. The company’s capacity has expanded steadily since 1980, but it has often lostsales because of insufficient production.
The industry recognizes AT as one of the fastest growing companies in the market. Expertsin the high-tech industry have projected for the next 10 years a potential bonanza for mini-computers and word processors. Thus, the company plans to invest heavily in research anddevelopment for the next 5 years. It also plans to increase production quickly by acquiringexisting computer manufacturing firms and by establishing new production facilities.

CASE PROBLEM 20 515
AT is a multinational company with headquarters in Los Angeles, California. The companyhas five manufacturing locations in the USA and three abroad, with offices in 13 countries. In1995, approximately 40 percent of its sales came from foreign operations – primarily SouthAmerica and Asia, where the company has recently faced stiff competition from its larger rivals,such as IBM, Digital Equipment, and Olivetti. The company has depended on distributors formost of its overseas sales.
Conflict of Interest in Financial Affairs
Thomas Nickerson is a Special Assistant to the Vice President of Finance, Linda Humphrey. Hegraduated from a major university in St. Louis, Missouri, with an MBA in Finance. After 2 yearsof experience with Ernst & Young, a major CPA firm in St. Louis, he joined the accounting staffand served in a variety of accounting and finance positions for 5 years. Two years ago, he wasappointed Special Assistant to Ms Humphrey at an unusually high salary, mainly because ofhis outstanding financial and communication talents. Thomas Nickerson has a large family anda home with a $450,000 mortgage. His deep debt and huge financial needs hardly matter tohim, because he has a promising future at the company.
Ms Humphrey approached Thomas with a special task on August 1, 1996. She informedhim that she had met with other vice presidents and decided to purchase Computer Engi-neering to alleviate the capacity problem. She further stated that the acquisition would behighly advantageous for AT, but she needed to convince two members of the board of direc-tors. Then she instructed him to prepare a report justifying the acquisition of the company.Under the terms, AT would offer Computer Engineering two million shares of its stock. Themarket price of the stock was $20 per share.
Normally, Thomas would have welcomed the assignment, but this one made him uneasy.Computer Engineering’s financial statements indicated poor performance as compared withcomparable companies in the field. He knew that Ms Humphrey and other vice presidents hadhelped the current top executives of Computer Engineering set up their company. He sus-pected that vice presidents of AT owned sizable blocks of Computer Engineering stock, whichwas not publicly traded. To establish a fair market price for Computer Engineering, he com-piled the statistics presented in table 20.4. High Tech is more similar to Computer Engineeringthan any other company whose stock is traded in the public market.
Ethics Versus Profits in Global Business
The Foreign Corrupt Practices Act of 1977 (FCPA) has encouraged US companies to introducepolicies against corrupt foreign payments and to improve internal controls. The FCPA bansillegal payments to foreign officials, monitors accounting procedures, and levies heavy penal-ties for violations. The FCPA forced AT to think about its way of doing business overseas. Thecompany had expanded its foreign operations very quickly. In the 1960s, less than 2 percentof its sales came from foreign operations, but by the late 1970s its foreign operations accountedfor 30 percent of total sales.
Just like many other companies, AT had undertaken positive steps to prevent illegal pay-ments to foreign officials and to improve internal control. In 1980, the company published its

516 CORPORATE PERFORMANCE OF FOREIGN OPERATIONS
first corporate code, along with two separate area codes: one for the USA and another onefor the foreign area. The code of business conduct for overseas employees reflected most pro-visions of the FCPA, so that the company would not have any trouble with the law.
Marketing Vice President Miller had been under heavy pressure from President Smith toincrease the company’s foreign sales by 30 percent per year for the next 5 years. Mr Millerthought that when in Rome, some do as the Romans do. In other words, he did not hesitateto call the FCPA “bad business” and “unnecessary.” Miller felt that the FCPA should berepealed for several reasons. First, it forced US companies to increase audit costs substantially.Second, the Department of Justice and the SEC failed to establish clear guidelines. Third, it putUS companies at a competitive disadvantage. Fourth, in many countries, foreign payments arenot outlawed, but they are encouraged. Fifth, the FCPA was unnecessary because US lawenforcement agencies already had many statutes to prevent illegal foreign payments by UScompanies.
Mr Miller reflected on the report he would present to the Executive Committee. The purposeof this report was to make certain that AT was complying with its corporate code of conduct.There was, however, one situation that required a tough decision. This particular situation wasconsidered an acceptable practice in the countries where they occurred, but he did not knowhow he would handle specific questions if they should come up.
Kevin Hart was the exclusive distributor for Advanced Technology products in South Amer-ican countries. He had a reputation for reliability and efficiency. However, the most recent auditsuggested that he had corruptly influenced customs officials to obtain lower duty rates for AT’sproducts. In doing so, he had violated both the FCPA and the company’s code of conduct.
AT had asked Kevin to agree in writing to abide by the code, but he had refused to do so.He had argued that these “grease payments” were customary in these countries. He hadinsisted that he could not compete effectively without them. Kevin had represented AT formany years and generated approximately $10 million worth of business per year for thecompany. His exclusive dealership contract would be up for renewal in a few months. AT hadsuggested that it might refuse to renew its contract unless he agreed to abide by the code. MrMiller knew that it would be difficult to resolve this problem while he was under heavy pres-sure to increase the company’s overseas sales by 30 percent per year.
Table 20.4 Key statistics for Computer Engineering and HighTech
ComputerVariables Engineering High Tech
Earnings per share $1.00 $ 2.00Dividend per share in year 1 $0.75 $ 1.00Annual dividend growth rate 0.04 0.09Price per share ? $20.00Book value per share $8.00 $10.00Cost of equity ? 0.14Number of shares outstanding 1 million 1.2 million

CASE PROBLEM 20 517
Case Questions
1 Use the data in table 20.4 to estimate the market value of Computer Engineering in thefollowing three ways: (1) price–earnings ratio, (2) market value/book value, and (3) thedividend growth model.
2 List and discuss the options available to Thomas Nickerson.3 Discuss the two major sections of the FCPA – antibribery and accounting.4 List and discuss the pros and cons concerning corporate codes of conduct.5 If you were Sam Miller, what would you do about the situation in these South American
countries?6 The Internet Center for Corruption Research provides the transparency international per-
ceptions index and a comprehensive assessment of countries’ integrity performance. Usethe website of this organization, www.gwdg.de/~uwvw/icr.htm, to identify the five mostcorrupt countries and the five least corrupt countries.
Sources: Arthur Aronoff, “Complying with the Foreign Corrupt Practices Act,” Business America, Feb. 11, 1991,pp. 10–11; Suk H. Kim, “On Repealing the Foreign Corrupt Practices Act: Survey and Assessment,” Colum-bia Journal of World Business, Fall 1981, pp. 16–21; Catherine C. Langlois and Bodo B. Schlegelmilch, “DoCorporate Codes of Ethics Reflect National Character?” Journal of International Business Studies, Fourth Quarter1990, pp. 519–40; Manuel Velasquez, “Unicomp, Inc.,” St Charles, IL: Center for Professional Education,Arthur Anderson & Co., 1990; and David Whiteside and Kenneth E. Goodpaster, “Dow Corning Corpora-tion: Business Conduct and Global Values,” in Kenneth E. Goodpaster and Thomas R. Piper, eds., Manager-ial Decision Making and Ethical Values, Boston, MA: Publishing Division/Marketing Department, HarvardBusiness School, 1991.

Web Resources and Internet Exercises
Chapter 1: Introduction
Internet resources
www.wto.orgThe website of the World Trade Organization (WTO) provides news and statistics on interna-
tional trade as well as links to international organizations.
www.corpgov.netThe website of Corporate Governance Net contains news, research findings, recommendations,
and other information related to the relationship between a business and its stakeholders.
www.ecgi.orgThe website of the European Corporate Governance Institute (ECGI) contains news and research
on corporate governance in Europe, comparative studies on international issues and codes, andprinciples of corporate governance by country and/or region.
www.bea.doc.govThe website of the Bureau of Economic Analysis (BEA) contains economic data and articles on
US international trade and capital flows as well as international surveys.
www.worldbank.orgThe website of the World Bank contains data on the economic prospects of 208 countries and
links to other sources of international data.
www.wsj.comThe website of The Wall Street Journal, the leading business newspaper in the USA.
www.ft.comThe website of The Financial Times, the leading international business newspaper.

www.economist.comThe website of The Economist contains news items and financial data on international economic
and political situations.
www.intracen.orgThe website of the International Trade Center (ITC) contains trade information, news items,
and references on trade in developing countries.
Internet exercises
1 Visit the website of Corporate Governance, www.corpgov.net, to view recent developmentson the relationship between a corporation’s management and its stakeholders. In the light ofrecent accounting scandals in corporate America, list three proposed solutions to fix corpo-rate governance practices. Visit the website of the European Corporate Governance Institute,www.ecgi.org, to view codes and principles of corporate governance for European countries.Choose a country or region and list five principles and/or recommendations on corporategovernance. Explain how these European practices are similar to or different from existingpractices in the USA.
2 Select one country of your choice from the “County-at-a-Glance” table of the World Bank(www.worldbank.org) to answer the following questions: What is the population? What isthe currency? What is the GNI per capita? How has the GDP changed in the past 3 years?Is this country a net importer or exporter? How much is the trade in goods as a share ofGDP? What is the amount of foreign direct investment?
Chapter 2: Motives for World Trade and Foreign Investment
Internet resources
www.nafta-sec-alena.orgThis is the official site of the NAFTA Secretariat and contains documents (including the full text
of NAFTA), notes on past rulings, rules, and other background information.
www.citizen.org/pctrade/nafta/naftapg.htmlThis website contains a critical review of NAFTA.
www.dismal.comThis website covers over 65 economic findings from over 15 countries and contains news items
dealing with international finance and economics.
www.census.gov/ipc/wwwThis website contains the International Data Base (IDB), a computerized data bank with
statistical tables of demographics and socioeconomic data for 227 countries.
www.oecd.orgThe website of the Organization for Economic Cooperation and Development (OECD), which
provides access to news, data, and analysis on international finance and economics.
WEB RESOURCES AND INTERNET EXERCISES 519

www.inc.comInc. Online’s website for International business professionals, a useful resource for beginners in
international business.
www.cnnfn.comCNN’s financial section, containing extensive coverage of global business and financial informa-
tion news.
Internet exercises
1 Government subsidies in lumber production have created an unfair economic advantage inthe trade of lumber between Canada and the United States. Access the websites of the BEA,www.bea.doc.gov, the OECD, www.oecd.org, and the NAFTA text, www.nafta-sec-alena.org,to answer the following questions: How do these subsidies affect the lumber trade betweenCanada and the USA? How big an industry is this? Which country had the comparativeadvantage before government intervention? Which one held the comparative advantage afterthe government intervention? Is the lumber trade part of the NAFTA agreement? There arenumerous news articles on this subject. What is the position of US consumers on lumberduties? Refer to the following website for your answer: www.newswire.ca/releases/January2003/08/c827.html.
2 The intent of the NAFTA is to eliminate all tariffs on goods and services produced in onemember country and exported to another. However, that does not mean that all cars madein one member country can cross the border to another member country tariff free. Whatare the “Rules of Origin” as outlined in chapter 4 of NAFTA? You may view the full text ofNAFTA at www.nafta-sec-alena.org. Volkswagen, Hyundai, and Honda are some of theforeign-owned multinational automakers operating in NAFTA countries. How can thesecompanies maintain tariff-free status when exporting within NAFTA countries? Whathappens when “nonoriginating” materials are used in the product exported, and how doesthis affect the “Regional Value Content” of the product?
Chapter 3: The Balance of Payments
Internet resources
www.bea.doc.govThe website of the Bureau of Economic Analysis (BEA) contains economic data and articles on
US international trade and capital flow.
www.stls.frb.org/fred/The website of the Federal Reserve Bank of St Louis takes you directly to US trade and balance-
of-payments data that you can download into a spreadsheet.
www.imf.org/external/about.htmThe website of the International Monetary Fund (IMF) discusses the IMF and its role and covers
news topics, the balance of payments, and a variety of other information.
520 WEB RESOURCES AND INTERNET EXERCISES

www.jin.jcic.or.jp/access/trade/balance.htmlThe website of Japan Information Network explains the balance-of-payments performance in
terms of balance on goods, which is the difference between a nation’s exports and its imports.
www.bangladesh-bank.org/econdata/bop.htmlThis website puts forward the payment strategies used by Bangladesh Bank.
Internet exercises
1 The website of the US Census Bureau, www.census.gov, provides statistics on foreign tradeand other economic data. Utilize this site to identify the trade balance trends of the USAand Japan over the past 3 years. You may find the most recent balance-of-payments statisticsfor both countries by consulting the US Bureau of Economic Analysis at www.bea.doc.govand Japan’s Ministry of Finance at www.mof.go.jp. Historical data are also available at thesesites for trend analysis.
2 Construct the balance-of-payments table for any two countries, such as Germany andCanada, for any particular year and interpret the numerical data. You can access this infor-mation by visiting the IMF website at www.imf.org/external/about.htm.
Chapter 4: The International Monetary System
Internet resources
www.imf.org/external.htmThe website of the International Monetary Fund (IMF) provides information on the IMF, SDRs,
exchange rates, and miscellaneous information such as debt relief programs for poor countriesand strategies for dealing with financial crisis.
www.ecb.intThe website of the European Central Bank (ECB) contains ECB publications, exchange rates,
and other euro-related economic and financial data.
www.europa.eu.intThe website of the European Union (EU) contains news, information, and statistics on the EU
and its member nations.
www.wallstreet.com/bankfrm.htmThis website provides links to the central banks of more than 100 countries.
www.ex.ac.uk/~Rdavis/arian/llyfr.htmlThis website provides a comprehensive history of money.
www.cnnfn.com/market/currenciesThis CNN financial subsite provides a currency converter for converting one currency into
another at current exchange rates.
WEB RESOURCES AND INTERNET EXERCISES 521

www.ny.frb.orgThe website of the Federal Reserve Bank of New York. The online book of this website, entitled
All About Foreign Exchange Market in the United States, can be downloaded for study. It pro-vides a summary of many statistics from the BIS triennial report.
Internet exercises
1 The IMF (www.imf.org), the World Bank (www.worldbank.org), and the United Nations(www.unsystem.org) are only a few of the major world organizations that track, report, andaid international economic and financial development. Use these websites and other siteslinked to them to summarize the economic outlook for Cuba, Afghanistan, the UnitedKingdom, and Canada. For example, the full text of chapter 1 of the World Economic Outlook,published by the World Bank, is available through the IMF website. The Europa (EU) homepage, www.europa.eu.int, and the website for the Bank for International Settlements,www.bis.org, are other useful resources for finding this information.
2 The website of Pacific Policy Analysis, an extremely valuable exchange rate service(www.pacific.commerce.ubc.ca/xr), can be used to determine the value of the euro before itsintroduction on January 1, 1999. The calculation of the euro’s value before its introduction,assuming the fixed parities established by the European Union on December 31, 1998, givessome insight as to how its value had theoretically fluctuated even prior to its official launch.Plot the value of the euro since its inception and comment on its movement in the past year.
Chapter 5: The Foreign-Exchange Market and Parity Conditions
Internet resources
www.imf.org/external/fin.htmThe website of the International Monetary Fund (IMF) takes you directly to information on the
IMF, SDRs, exchange rates, the position of each country in the IMF, and lending arrange-ments with member nations.
www.ny.frb.org/pihome/statistics/forex12.shtmlThe website of the Federal Reserve Bank of New York takes you directly to daily noon foreign-
exchange rates. You may also try other menu options on this site to obtain detailed informa-tion about the foreign exchange market in the USA.
www.onanda.comThis website contains a wide variety of current and historical exchange rate data, along with
stories relating to foreign exchange and links to the world’s central banks.
www.bis.org/publ/index.htmThis website contains the BIS annual report, together with statistics on derivatives, external debt,
foreign-exchange market activity, and so on.
www.bloomberg.comThe Bloomberg website contains a wide variety of data on financial markets worldwide, includ-
ing foreign-exchange and interest rate data.
522 WEB RESOURCES AND INTERNET EXERCISES

www.ft.com/cgi-bin/pft/monrates.pl/reportThis web page of The Financial Times contains data on short-term Eurocurrency interest rates
for the US dollar, the euro, the Swiss franc, the Japanese yen, the British pound, and severalother currencies. This web page also links to worldwide exchange rate data.
www.ex.ac.uk/~Rdavies/arain/llyfr.htmlThis web page contains a detailed history of money from ancient times to the present.
www.ecb.intThe website of the European Central Bank (ECB) contains press releases and publications put
out by the ECB, along with exchange rate data and other economic and financial statisticsrelated to the eurozone.
www.europa.eu.intThe webste of the European Union (EU) contains news, information, and statistics on the EU
and its member nations, and on the euro.
www.sysmod.com/eurofaq.htmThis website contains answers to frequently asked questions about the euro and EMU, as well
as links to related websites
www.bis.orgThis is the home page of the Bank for International Settlements. Many interesting reports and
statistics can be obtained here. The triennial report entitled Central Bank Survey of ForeignExchange and Derivatives Market Activity can be downloaded for study.
www.wto.orgThe website of the World Trade Organization (WTO) contains news, information, and statistics
on international trade.
www.worldbank.orgThe website of the World Bank contains economic and demographic date on 206 countries (orga-
nized into “Country-at-a-Glance” tables) and various economic forecasts, and links to anumber of other data sources.
Internet exercises
1 Use one of the above-listed Internet resources to find the latest quotes for the US dollar, theeuro, the British pound, and the Japanese yen. By how much did these currencies rise or fallagainst the dollar in the last day?
2 Find the currency cross rates provided by Bloomberg (www.bloomberg.com) for theeuro/dollar and euro/yen. Use the above cross rates to calculate the dollar/yen rate and thencompare your calculated dollar/yen cross rate to the one reported by Bloomberg. Are the twocross rates the same?
3 What is the euro worth? The European Union (www.europa.eu.int) provides a daily track-ing of the euro’s value in terms of its constituent currencies. Use their website to find outhow many Spanish pesetas the euro is worth today. What explanations have been given forthe decline of the euro in the first 2 years of its existence?
WEB RESOURCES AND INTERNET EXERCISES 523

4 Using the websites of The Wall Street Journal, www.wsj.com, The Financial Times,www.ft.com, and The Economist, www.economist.com, identify two countries that are havingcurrency problems. Can you explain the causes of these currency problems?
Chapter 6: Currency Futures and Options
Internet resources
www.ny.frb.org/pihome/statistics/vrate.shtmlThis web page of the Federal Reserve Bank of New York takes you directly to data on implied
volatilities for foreign-exchange options.
www.bis.org/public/index.htmThis web page contains the BIS annual report, together with statistics on derivatives, external
debt, and foreign-exchange market activity.
www.cme.comThe website of the Chicago Mercantile Exchange (CME) contains information and quotes on
currency futures and options contracts.
www.phlx.comThe website of the Philadelphia Stock Exchange (PHLX) contains information and quotes on
currency options contracts.
www.numa.com/ref/exchange.htmThis web page of the Numa Directory contains the web addresses of most of the stock and deriv-
ative exchanges in the world.
www.belfox.beThe website of the Belgian Futures and Options Exchange contains detailed information about
the derivative products traded on it.
www.liffe.comThe website of the London International Financial Futures Exchange contains detailed infor-
mation about the derivative products traded on it.
www.simex.comThe website of the Singapore International Monetary Exchange contains detailed information
about the derivative products traded on it.
Internet exercises
1 What currency futures contracts are currently being traded on the CME (www.cme.com)?Have currency future prices generally risen or fallen in the past day? Is there any news todaythat might explain the change in the futures prices?
2 Use the New York Federal Reserve website, www.ny.frb.org/pihome/statistics/vrate.shtml, toobtain the currency volatilities over the past week and month for the Canadian dollar and
524 WEB RESOURCES AND INTERNET EXERCISES

WEB RESOURCES AND INTERNET EXERCISES 525
the yen. Keep in mind that currency volatilities are the expected standard deviation of thedaily spot rate for the coming period of the option’s maturity. Are these implied volatilitiesgenerally higher or lower for longer maturity contracts?
Chapter 7: Financial Swaps
Internet resources
www.isda.orgThe website of the International Swaps and Derivatives Association, Inc., contains details of the
activities of the ISDA and provides educational information about interest rates and currencyswaps, as well as market survey data about the size of the swaps market.
www.bis.orgThe website of the Bank for International Settlements contains many publications about foreign
exchange and over-the-counter (OTC) derivatives.
www.finpipe.com/derivatives.htmThe Financial Pipelines website contains detailed reviews of options, futures, swaps, swaptions,
structured notes, and other derivatives.
www.pgsenergy.com/c1.htmlThis web page of PGS Energy gives explanations on financial swaps, OTC markets, and com-
modity options.
www.moodys.comThe website of Moody’s contains country risk ratings and analyses.
www.standardpoors.comThe website of Standard & Poor’s contains country risk ratings and analyses.
www.siliconvalley.com/mld/siliconvalley/business/companies/A web page for the study of various monetary swaps with major IT companies.
Internet exercises
1 The ISDA, www.isda.org, is the primary global organization that attempts to both standardizethe use of interest rate and cross-currency swaps and track the market’s size. Use ISDA’swebsite to find out which type of interest rate derivative is growing the fastest, the plainvanilla interest rate swap, the cross currency swap, or the various types of interest rate options.
2 What country risk factors do Moody’s (www.moodys.com) and Standard & Poor’s (www.standardpoors.com) emphasize? How can one company use risk factors when it decideswhether to engage in a swap agreement with a foreign company?

526 WEB RESOURCES AND INTERNET EXERCISES
Chapter 8: Exchange Rate Forecasting
Internet resources
www.oecd.org/std/nadata.htmThis web page contains data on PPP exchange rates for the OECD countries, going back to
1970. The PPP exchange rate data is in a spreadsheet format that can be downloaded.
www.oanda.comThis website contains current exchange rates along with currency forecasts and news.
www.pei-intl.com/Quotes/watch.htmThis web page contains daily, weekly, and monthly outlooks of foreign-exchange markets, world
stocks, and bond markets.
www.anglefire.com/me/ozanpage/index.htmlThis web page contains data and explanation on foreign-exchange arbitrage.
Internet exercises
1 Using OECD data from www.oecd.org/std/nadata.htm, plot the PPP exchange rates for theAustralian dollar, the Mexican peso, and the Saudi rial. Have these PPP exchange rates goneup or down over time? What accounts for the changes in these PPP exchange rates over time?
2 Examine forecasts from www.onada.com for the British pound, the Japanese yen, and the euro.(a) Which of these currencies are forecast to appreciate and which to depreciate?(b) Compare these forecasts to the forward rates for the same maturity. Are the predicted
exchange rates greater or less than the corresponding forward rates?(c) Compare these forecasts to the actual exchange rates. How accurate were these forecasts?(d) If you had followed these forecasts (by buying forward when the forecasted exchange
rate exceeded the forward rate and selling forward when it was below the forward rate),would you have made or lost money?
Chapter 9: Managing Transaction Exposure and Economic Exposure
Internet resources
www.sec.gov/edgar.shtmlThe website of the Securities and Exchange Commission. The primary purpose of EDGAR –
the Electronic Data Gathering, Analysis, and Retrieval system – is to increase the efficiencyand fairness of the securities market for the benefit of investors, corporations, and the economyby accelerating the receipt, acceptance, dissemination, and analysis of time-sensitive corporateinformation filed with the agency.

www.florin.com/v4/valore4d.htmlThe website of Valore International discusses issues related to currency risk management.
www.kshitij.com/risk/fxmgmain.shtmlThe website of Kshitij consultancy services. Kshitij manages currency risk for corporate cus-
tomers.
www.lehman.com/equities/pb/risk_management.htmThe website of Lehman Brothers. The firm’s risk management system extends comprehensive risk
analysis and portfolio revaluation tools to portfolio managers, risk managers, and traders withina flexible reporting platform.
www.reportgallery.comThe website of the Report Gallery is the most complete and up-to-date listing of annual reports
and related financial reports of 2,200 companies and covers the majority of the Fortune 500companies.
www.pages.stern.nyu.edu/~igiddy/fxrisk.htmThis web page provides an overview of exchange risk management
Internet exercises
1 Obtain an annual report of a major company, such as Sony Corp., from www.report-gallery.com, to answer the following questions. Are there any comments that relate to thecompany’s transaction exposure? Does it seem that the company hedges its transaction expo-sure? If so, what are the methods that it has used to hedge its exposure?
2 Visit the websites of General Electric (GE), www.ge.com, and Disney, www.disney.com, toobtain their annual reports. Do these annual reports feature the goals and objectives of theircurrency risk management activities?
Chapter 10: Translation Exposure Management
Internet resources
www.accounting.rutgers.edu/raw/fasb/The website of the Financial Accounting Standards Board provides information on FASB 8, FASB
52, and other FASB pronouncements on currency translation and hedge accounting.
www.iasc.org.ukThe home page of the International Accounting Standards Board. The IASB is an independent,
privately funded accounting standards-setter, based in London, developing a single set of high-quality, understandable, and enforceable global accounting standards.
www.reportgallery.comA website that contains links to annual reports of over 2,200 companies, many of which are
multinationals.
WEB RESOURCES AND INTERNET EXERCISES 527

www.futuresmag.comThe website of Futures magazine. This magazine helps readers to understand the factors that
affect futures prices, provides them with a perspective on trends affecting the global market-place, and gives them information on how to maximize trading profits while minimizing risk.
www.ozforex.com.au/thebasics.htmThe aim of foreign-exchange risk management is to stabilize the cash flows and reduce uncer-
tainty from financial forecasts, which is the focus of this website.
Internet exercises
1 Visit www.nokia.com to find the latest Nokia annual report. What is Nokia’s accumulatedtranslation adjustment? What functional currencies does Nokia use? What was Nokia’sreported currency translation gain or loss during the year?
2 Use www.futuresmag.com to answer the following question. Based on the translation expo-sure of the MNC that you assessed in the previous exercise, determine whether the exchangerate(s) of whatever currency (or currencies) it is exposed to moved in a favorable or unfa-vorable direction over the past few months.
Chapter 11: International Financial Markets
Internet resources
www.bis.orgThis is the website of the Bank for International Settlements. Many interesting reports and sta-
tistics can be obtained here. The triennial report entitled Central Bank Survey of ForeignExchange and Derivatives Market Activity can be downloaded for study.
cnnfn.com/market/currenciesThis CNN financial subsite provides a currency converter for converting one currency into
another at current exchange rates.
www.ny.frb.orgThis is the site of the Federal Reserve Bank of New York. The online book titled All About the
Foreign Exchange Market in the United States can be downloaded for study. It provides asummary of many of the statistics from the BIS triennial report from the perspective of theUSA.
www.fitchibca.comThis is the website of Fitch IBCA, an international bond rating service. Information about Fitch
and its philosophy can be found here.
www.moodys.comThis is the site of Moody’s Investor Service. Information about the investment services that
Moody’s provide and their bond ratings can be found here.
528 WEB RESOURCES AND INTERNET EXERCISES

www.standardandpoors.comThis is the home site of Standard & Poor’s, a provider of investment information such as bond
ratings. Information about Standard & Poor’s can be found here.
www.jpmorgan.comThis is the site of J. P. Morgan and Company, an international investment banking firm. Detailed
information about J. P. Morgan’s bond indexes can be found here.
Internet exercises
1 Plot the US dollar value of the euro since its inception in January 1, 2002. How has the eurofared in the past year? You can use the website of the European Central Bank, at www.ecb.int.
2 What explanations have been given for the decline of the euro in the first two years of its existence? Search The Wall Street Journal (www.wsj.com) and The Economist(www.economist.com) to formulate your answer.
Chapter 12: International Banking Issues and Country Risk Analysis
Internet resources
www.ny.frb.org/pihome/statistics/vrate.shtmlThe web page of the Federal Reserve Bank of New York that takes you directly to data on implied
volatilities for foreign-exchange options.
www.bis.org/public/index.htmThis website contains the BIS annual report, together with statistics on derivatives, external debt,
and foreign-exchange market activity.
www.cme.comThe website of the Chicago Mercantile Exchange (CME) contains information and quotes on
currency futures and options contracts.
www.phlx.comThe website of the Philadelphia Stock Exchange (PHLX) contains information and quotes on
currency options contracts.
www.bis.org/cbanks.htmThis is the home page of the Bank for International Settlement. It provides links to central banks
around the world.
Internet exercises
1 Using Moody’s Investor services, www.moodys.com, and Standard & Poor’s ratings,www.standardpoors.com, obtain the sovereign debt ratings for two countries of your choice.
WEB RESOURCES AND INTERNET EXERCISES 529

2 Visit the website of the Heritage Foundation (www.heritage.org) or that of the InternetCenter for Corruption Research (www.icgg.org) to answer the following questions:(a) Use the link to the Heritage Foundation to name the five most economically free coun-
tries and the five least economically free countries.(b) Use the Internet Research for Corruption Research to name the five most corrupt coun-
tries and the five least corrupt countries.(c) International capital flows: public and private major multinational organizations (some
of which are listed below) attempt to track the relative movements and magnitudes ofglobal capital investment. Using these websites and others that you may find, prepare atwo-page executive briefing on the question of whether capital generated in the indus-trialized countries is finding its way to the less developed and emerging markets. Is theresome critical distinction between “less developed” and “emerging” countries?The World Bank www.worldbank.org/OECD www.oecd.org/European Bank for Reconstruction www.ebrd.org/
Chapter 13: Financing Foreign Trade
Internet resources
www.exim.govThe website of the Export–Import Bank of the United States (Ex–Im Bank) contains informa-
tion about trade financing and the Ex–Im Bank’s programs.
www.pefco.comThe website of the Private Export Funding Corporation (PEFCO) offers background informa-
tion about PEFCO, describes their programs, and gives access to their annual report.
www.fcia.comThe website of the Foreign Credit Insurance Association contains the FCIA Country Update,
which gives economic, political, and intelligence information on trade-related developmentand offers access to trade-related links.
Internet exercises
1 Visit the website of the Private Export Funding Corporation (PEFCO), at www.pefco.com,to answer the following questions:(a) What types of programs does PEFCO offer to US exporters?(b) What are the three short-term facilities that PEFCO offers to lenders?(c) What are the terms of the Short-Term Insured Loan Facility?(d) What are under-serviced markets and how can under-serviced market programs benefit
from the Lender-Of-Last-Resort Program?2 Visit the website of the Foreign Credit Insurance Association (FCIA), at www.fcia.com, to
answer the following questions:(a) What is FCIA’s special risk insurance?(b) What are two conditions that affect and benefit trade?
530 WEB RESOURCES AND INTERNET EXERCISES

WEB RESOURCES AND INTERNET EXERCISES 531
(c) Read the latest FCIA newsletter and Country Update. What country or region presentsa high risk for exporters and would benefit from the special risk insurance?
Chapter 14: Financing Foreign Investment
Internet resources
www.worldbank.orgThe website of the World Bank Group gives access to the International Bank for Reconstruction
and Development (IBRD), the International Development Association (IDA), the Interna-tional Finance Corporation (IFC), the Multilateral Investment Guarantee Agency (MIGA),and the International Center for Settlement of Investment Dispute (ICSID). You may accessnews items, agency reports, budgets, and annual reports for all the agencies listed.
www.bloomberg.comThe Bloomberg website contains a wide variety of data on financial markets worldwide, includ-
ing foreign-exchange and interest rate data.
www.iadb.orgThe website of the Inter-American Development Bank (IDB). The IDB is the largest regional
multilateral development institution, and includes the USA and 19 Latin American coun-tries. This site contains economic profiles by country and historical IDB lending data, plusnews items, links to other organizations, and previews of private-sector projects.
www.ebrd.comThe website of the European Bank for Reconstruction and Development (EBRD) contains appli-
cation information for project funding.
www.exim.govThe website of the Export–Import Bank of the United States (Ex–Im Bank) contains informa-
tion about trade financing and the Ex–Im Bank’s programs.
Internet exercises
1 Visit the website of the World Bank Group at www.worldbank.org and read about the Inter-national Bank for Reconstruction and Development (IBRD).(a) What was the amount of total lending in the last fiscal year? How many new opera-
tions were approved globally with this total amount?(b) Describe the share of total lending per region as a percentage of the total fiscal lending.
Which region received the highest share of total lending?(c) What percentage of the total lending was allocated to the theme of Financial and Private
Sector Development globally?(d) What percentage of the total lending was allocated to the sector of Industry and Trade?
2 Visit the website of the European Bank for Reconstruction and Development (EBRD), atwww.ebrd.com. How does EBRD define large, medium, small, and microprojects in euros?Would an oil development in Azerbaijan qualify for a loan? What other services does EBRDprovide?

532 WEB RESOURCES AND INTERNET EXERCISES
Chapter 15: International Working Capital Management
Internet resources
www.bloomberg.comThe Bloomberg website contains a wide variety of data on financial markets worldwide, includ-
ing foreign-exchange and interest rate data.
www.office.com/global/toolsThis website gives information on the cash budget, such as its purpose, preparation, and the
analysis.
Internet exercises
Visit the Bloomberg website at www.bloomberg.com to carry out the following tasks:
1 Review the 3-month interest rates of the countries listed, to determine the country with thelowest rate and the country with the highest interest rate.
2 What is the best country to borrow short-term funds from?3 Search this site for news items and country analysis on the countries you have chosen in your
answer to questions 1 and 2, and explain the possible reasons for the high and low rates.
Chapter 16: International Portfolio Investment
Internet resources
www.adr.comThe website of the American Depository of Receipts (ADR), the central source for information
on ADR services and international equities.
www.ishares.comThe website of the world’s most extensive family of Exchange Traded Funds (ETFs).
www.jpmorgan.comThe website of J. P. Morgan, whose research consists of three groups: equity, economics, and
global markets. The global market group covers fixed income, credit, derivatives, emergingmarkets, foreign exchange, structured finance, and technical and bond index research.
www.adrbny.comThe website of the Bank of New York, a key source on global investing and personal finance.
www.msci.comThe website of Morgan Stanley Capital International Inc. MSCI is a leading provider of equity
(international and US), fixed income, and hedge fund indices.
www.cnnfn.comThe website of CNN Financial contains extensive coverage of global business and financial infor-
mation news.

www.euronext.comThe website of Euronext NV, which is the world’s first cross-border exchange business. It pro-
vides services for cash markets in Belgium, France, the Netherlands, and Portugal, and forderivatives in the UK.
www.biz.yahoo.com/ifcThe website of Yahoo Finance gives country economic profiles, news, and exchange rates from
all over the world.
Internet exercises
1 Visit www.adr.com and then click on “market overview” to review the stock performance ofADRs of different countries. The website provides a table that shows information about coun-tries that have issued ADRs and returns every 6 months or per year. Click on any particularcountry of interest to review the performance of individual ADRs from that country.
2 Visit biz.yahoo.com/funds/, click on “top performers” to review the performance of topmutual funds, and then conduct a comparative analysis of performance for internationalmutual funds and purely domestic portfolios.
Chapter 17: Corporate Strategy and Foreign Direct Investment
Internet resources
www.unctad.org/statisticsThe website of the United Nations Conference on Trade and Development (UNCTAD).
UNCTAD compiles statistics that are relevant for the analysis of international trade, foreigndirect investment, commodities, and development.
www.euromoney.com/index.htmlThe Euromoney website is the most authoritative source of detailed, yet concise, information on
the trends and developments in international banking and the capital markets.
www.globaledge.msu.edu/ibrd/ibrd.aspThe website of Michigan State University’s Global Edge is a knowledge web portal that connects
international business professionals worldwide to a wealth of information, insights, and learn-ing resources on global business activities.
www.bea.doc.gov/bea/di/home/directinv.htmThe website of the Bureau of Economic Analysis (BEA), an agency of the US Department of
Commerce, provides details of US direct investment abroad and foreign direct investment inthe USA.
www.worldbank.orgThe website of the World Bank. The International Bank for Reconstruction and Development
(IBRD) and the International Development Association (IDA) provide low-interest loans,interest-free credit, and grants to developing countries.
WEB RESOURCES AND INTERNET EXERCISES 533

www.oecd.orgThe website of the Organization for Economic Cooperation and Development provides details
on foreign direct investment flows (inwards and outwards) for most OECD member coun-tries and the eurozone.
www.ebrd.orgThe website of the European Bank for Reconstruction and Development (EBRD). EBRD pro-
motes co-financing and foreign direct investment.
www.opic.govThe website of the Overseas Private Investment Corporation (OPIC), whose support makes it
possible for US businesses – particularly small businesses – to grow through investment in theworld’s emerging markets.
Internet exercises
1 Visit www.export.gov/comm_svc, click on “market of the month”, and then check the invest-ment climate in this particular country. List the factors that make the country so favorablefor foreign direct investment.
2 Visit www.unctad.org/statistics. Check the top 10 developing countries whose economies theFDI hosts. What factors do you think account for these countries being large recipients ofUS FDI?
Chapter 18: International Capital Budgeting Decisions
Internet resources
www.biz.yahoo.com/ifcThe Yahoo Finance website gives country economic profiles, news, and exchange rates from all
over the world.
www.tax.kpmg.netThe website of KPMG Consulting, global provider of assurance, tax and legal, and financial advi-
sory services.
www.export.gov/csThe website of the US Commercial Service offers valuable assistance to help businesses export
goods and services to markets worldwide.
www.odci.gov/cia/publications/factbook/index.htmlThe web page of the Central Intelligence Agency and the Director of Central Intelligence.
www.globaledge.msu.edu/ibrd/ibrd.aspThe website of Michigan State University’s Global Edge is a knowledge web portal that connects
international business professionals worldwide to a wealth of information, insights, and learn-ing resources on global business activities.
534 WEB RESOURCES AND INTERNET EXERCISES

www.bloomberg.comThe website of Bloomberg, provider of breaking financial, business, and economic news world-
wide.
www.economist.com/countriesThis web page of The Economist provides articles, background profiles, forecasts and statistics,
market and currency updates, newswires, and links on 60 countries.
www.ebrd.orgThe home page of the European Bank for Reconstruction and Development (EBRD), which is
the largest single investor in central and eastern Europe and the CIS, and mobilizes signifi-cant foreign direct investment beyond its own financing.
www.worldbank.org/guaranteesThe home page of the World Bank. The Bank’s fundamental objective in offering guarantees is
to mobilize private capital for financial investment in infrastructure sectors of developing coun-tries.
www.cofacerating.comThis website provides the first worldwide company rating system.
www.political-risk.netThis site contains information on political risk assessment by both country and industry sector.
Internet exercises
1 Go to www.cofacerating.com and choose one country from each of the following areas: Africa,South America, Asia, Europe, and the Middle East. Study the risk assessments of these fivecountries and list the types of operating strategies you will adopt to cope with these politi-cal risks.
2 Visit www.globaledge.msu.edu/ibrd/ibrd.asp, click on “country insights,” and then select fivecountries and compare five statistical indicators. What do the comparisons indicate?
Chapter 19: The Cost of Capital for Foreign Projects
Internet resources
www.moodys.comThe website of Moody’s Investor Service is among the world’s most respected, widely utilized
sources for credit ratings, research, and risk analysis.
www.bradynet.comThe website of Brady Network is the pioneer and leading provider of emerging markets’ fixed
income information through the Internet.
www.emgmkts.comThe website of Emerging Markets is the financial source for global investors.
WEB RESOURCES AND INTERNET EXERCISES 535

www.standardandpoors.comThe website of Standard & Poor’s is the global provider of independent highly valued investment
data, valuation, independent analysis, and information on stocks, bonds, mutual funds, andmany other complex investment vehicles.
www.londonstockexchange.comThe website of the London Stock Exchange is at the heart of global financial markets and is
home to some of the best companies in the world.
www.newyorkstockexchange.comThe website of the New York Stock Exchange (NYSE), the largest equities marketplace in the
world.
www.bloomberg.comThe Bloomberg website is a major provider of breaking financial, business, and economic news
worldwide.
www.biz.yahoo.com/ifcThe Yahoo Business website provides information about stock market conditions of many coun-
tries.
Internet exercises
1 The two major stock exchanges in the world are the London Stock Exchange, www.london-stockexchange.com, and the New York Stock Exchange, www.newyorkstockexchange.com.Use these websites to find the current stock price of a major multinational company, such asSiemens. In addition, find out and compare the exchanges’ listing and disclosure agreementsfor foreign companies.
2 Visit Standard & Poor’s site, www.standardpoors.com, and Moody’s, www.moodys.com, toanswer the following questions: What factors do Standard & Poor’s and Moody’s take intoaccount in rating a country’s debt? What are Standard & Poor’s latest sovereign risk ratingsfor Belgium, Mexico, Canada, Indonesia, and South Korea?
Chapter 20: Corporate Performance of Foreign Operations
Internet resources
www.ey.comThe website of Ernst & Young. Ernst & Young helps businesses worldwide with a broad array
of solutions in audit, tax, corporate finance, transactions, online security, and enterprise riskmanagement.
www.kpmg.comThe website of KPMG, a provider of assurance, tax, legal, consulting, and financial advisory ser-
vices to clients around the world.
536 WEB RESOURCES AND INTERNET EXERCISES

WEB RESOURCES AND INTERNET EXERCISES 537
www.pwcglobal.comThe website of Pricewaterhouse Coopers Global. Pricewaterhouse Coopers provides industry-
focused assurance, tax, and advisory services for public and private clients.
www.sec.gov/rules/concept/34-42430.htmThis website provides details of international accounting standards released by the US Securities
and Exchange Commission.
www.iasc.org.ukThe website of the International Accounting Standards Board (IASC). The IASC is an inde-
pendent, privately funded accounting standards-setter, based in London.
www.tpmba.comThe website of the Transfer Pricing Management Benchmarking Association (TPMBA). TPMBA
is an association that conducts benchmarking studies to identify the best transfer pricingprocesses that will improve the overall operations of the members.
www.taxup.comThe Taxup website provides a global web directory of tax and accounting information.
www.taxsites.comThe website of Tax and Accounting Sites. Taxsites is a comprehensive index of web-based tax and
accounting resources.
www.ifac.orgThe website of the International Federation of Accountants (IFAC). IFAC is the global organi-
zation for the accounting profession.
Internet exercises
1 Use www.prctaxman.com.cn/asian.htm to study and compare the tax systems of two Asiancountries of your choice.
2 Visit www.tpmba.com to list the objectives of the Transfer Pricing Management Bench-marking Association (TPMBA).

Chapter 2
1 1 food = 3 clothing.2 1 food = 4 clothing.3 The USA in food, and Taiwan in clothing.
Chapter 3
1b A balance-of-payments deficit of $10,000.2a A balance-of-payments surplus of $2,000.3 Service trade balance = -$19,000.4 Reserve account balance = $500.
Chapter 5
1 Swiss franc–yen cross rate = 0.0137 yen per franc.Yen–Swiss franc cross rate = 72.9610 francs per yen.
2a Percentage change (peso) = -9%.2b Percentage change (peso) = 11%.3 3.03%.4 Canadian dollar: -1.0%. Swiss franc: 5.7%.6 Pound future spot rate = $2.095.7a ¥129.63 per dollar.7b Undervalued.8a Premium = 16%.
Answers to Selected End-of-Chapter Problems

8b A profit of $400; requires $4,000 of capital.8c A profit of $231; requires no investment.9a A premium of 40%; interest differential of 5% in favor of the USA; yes, there is an incen-
tive for arbitrage transaction.9b Profit on this interest arbitrage = $360.9c Yes, because the net profit of $360 is greater than the transaction cost of $100.9e The forward market approach: $4,400.
The money market approach: $4,048.74.10a Investment in the USA: $102,000.
Investment in the UK: $101,360.10b Equilibrium forward rate = $1.7910.10c Equilibrium interest rate = 12.44%.11b ¥0.001.
Chapter 6
1a $15,000.1c $6,000.2a 151.51%.2b -$5,156.25.2c 98.48%.3c A windfall gain of $2,625.4a Net profit = $5,000.4b Net loss = $5,000.5 $2,500.6 No hedge: $103,750.
Hedge: $102,500.8 $5,000.9 $1,250.10a Out of the money.10b Intrinsic value = 0.10c Return on investment = 50%.11a In the money.11b $0.05.11c Return on investment = 100%.
Chapter 7
1 $10,000.2 $100,000.3 An annual net cash flow of 2%.
ANSWERS TO SELECTED END-OF-CHAPTER PROBLEMS 539

540 ANSWERS TO SELECTED END-OF-CHAPTER PROBLEMS
Chapter 8
1a 0.10.1b -0.09.2a -0.10.2b 0.11.3a 11.89%.3b $0.67134.4 BP = 5.4%.5 $0.6000.6 $0.0728.7 0.4472.
Chapter 9
1 The cost of forward market hedging = $140,000.The cost of unhedging = $144,000.The real cost of hedging = -$4,000.
2a Potential exchange gain = $200,000.2b Potential exchange loss = $360,000.3a Potential exchange gain = $5 million.3b Total gain = $15 million.5 Potential exchange loss = -$800,000.6 No hedging position: maximum expected cost = $520.
Lowest expected cost = $460.Forward market hedge = $510.Money market hedge = $509.66.
8a Exchange rate = 2.20.8b Either direct loan or credit swap.8c Credit swap.8d Exchange rate = 2.095238.
Chapter 10
1a Net exposure = ¥300 million.1b Potential exchange loss = +$1 million.1c Potential exchange gain = $0.5 million.2a Net exposed assets = £2 million.2b Potential exchange loss = -$0.4 million.3b Dollar net income = $100.3c Translation gain under FASB 8 = $75.
Translation gain under FASB 52 = $175.4b $878 million.

4c $615 million.5a Exchange rate = 2.20.5b Either direct loan or credit swap.5c Credit swap.5d Exchange rate = 2.095238.
Chapter 11
2a $400.2b $400.2d $2,000.2f $38,000.3 $108.4a $386.4b $463.4c $322.5 $30.
Chapter 12
1 Total external debt to GNP = 0.42.Total external debt to exports = 1.14.Debt service ratio = 0.21.Interest service ratio = 0.09.
2 Total external debt = $50 billion; exports = $45 billion; debt service = $5 billion; interestservice = $2.73 billion.
3a A compound growth rate of 7.5% per year.3b A simple growth rate of 16.8% per year.4a A compound growth rate of 25.5% per year.4b A simple growth rate of 55.6% per year.
Chapter 13
1a (i) 36.73%; (ii) 37.50%; (iii) 111.34%; (iv) 12.24%.1b (i) March 20, $490; (ii) March 30, $3,360; (iii) April 10, $1,455; (iv) March 20, $4,312.2a $19,600.2b $18,600.2c Hold the bankers’ acceptance until maturity.3a $7,623.3b 16.06%.
ANSWERS TO SELECTED END-OF-CHAPTER PROBLEMS 541

542 ANSWERS TO SELECTED END-OF-CHAPTER PROBLEMS
Chapter 14
1a 24.5%.1b 8.8%.1c 8.9%.2a 11.1%.2b 14.3%.2c 13.3%.3a 20%.3b 26%.4 7.5%.5a Dollar loan: 6.00%.
Euro loan: 5.06%.Mark loan: 7.12%.
Chapter 15
1b $3,200.1c 73%.2 The total tax payment falls from $900 to $660.3 The unbundled situation reduces taxes by $48 and increases net income by $48.4 US investment: $10,100.
Swiss investment: $8,120.
Chapter 16
1 15%.2 A, undervalued; B, undervalued; C, overvalued; D, undervalued; E, overvalued.3 Average stock price = $50.
Standard deviation = $10.4 Portfolio return = 12.75%.
Portfolio standard deviation = 7.93%.5a 4.0%.5b 3.1%.5c 0.0%.
Chapter 17
2a The cost of capital for the domestic firm: 13%.The cost of capital for the multinational company: 10%.
2b Market value, domestic firm: $76,923.Market value, multinational company: $100,000.

3a EPS of GM = $5.65.EPS of Toyota = $7.45.
4a $20.4b $32.4c $15.
Chapter 18
1a Year 1 = 1,500; year 2 = 2,000; year 3 = 2,000; year 4 = 2,500; year 5 = 2,500.1b 5,866.1c Net present value = $127.
Profitability index = 1.0635.Internal rate of return = 17%.
2a Net present value = -$45,200.2b Net present value = $182,200.4a $13,433.4b $9,002.5 $138.6a F = $636; G = -$364.6b F = $4,000; G = $4,000.6c Portfolio return = $272.
Portfolio standard deviation = $0.
Chapter 19
1 11.5%.2 9.4%.3 Cost of capital for A: 15%.
Cost of capital for B: 10%.4 40%.5 14.55%.
Chapter 20
2a $760.2b $1,070.2c $1,700.2d Cash = $260; accounts receivable = $510; accounts payable = $285; retained earnings
$1,720; revenues = $6,300; rent income = $0; dividend income = $0; expenses = $4,720.3 $100.4 Tax rate under the credit: 50%.
Tax rate under the deduction = 75%.
ANSWERS TO SELECTED END-OF-CHAPTER PROBLEMS 543

544 ANSWERS TO SELECTED END-OF-CHAPTER PROBLEMS
5 Total taxes under the double taxation = $75.Total taxes under the deduction = $61.Total taxes under the credit = $40.
6
Selling price Seller tax
Extractor $ 330 $30Processor 880 50Wholesaler 962.5 7.5Retailer 1,045 7.5
7 Higher transfer price reduces total taxes by $120 and increases net income by $120.9a $3,000.9b $2,500.10a $35,000.10b $25,000.

Glossary
accommodating (compensating) transactions Those transactions necessary to account or com-pensate for differences between international payments and receipts. These transactions areused to eliminate international disequilibrium.
accounting (translation) exposure This measures the impact of exchange rate changes on afirm’s published financial statement items.
acquisition The purchase of one company by another company.advising bank A bank that notifies the beneficiary of a letter of credit without adding its own
commitment to that of the issuing bank.affiliate A foreign operation formed as either a branch or a subsidiary.African Development Bank (AfDB) A regional development bank for Africa, established in
1964 and located in Abidjan, Ivory Coast.agency An office established by a foreign bank to offer a limited range of banking services, such
as loans in that area.Agency for International Development (AID) An office within the US State Department,
established in 1961 to carry out nonmilitary US foreign assistance programs.agency theory A theory that deals with a conflict of interest between managers and
stockholders.agreement corporation A bank chartered by a state to operate in international banking under
an agreement with the Board of Governors of the Federal Reserve System.American Depository Receipt (ADR) A negotiable certificate that represents underlying shares
of a foreign company from a country other than the United States.American option An option that can be exercised at any time before its maturity date.American terms Foreign-exchange quotations for the US dollar, expressed as the number of US
dollars per unit of non-US currency.antidumping duty A customs duty imposed on an imported product whose price is lower than
that of the same product in the home market.Arab League A political organization of 22 North African and Middle Eastern Arab countries.

arm’s-length price The price that would take place between unrelated parties.appreciation A rise in the value of a currency against other currencies.arbitrage The purchase of something in one market and its sale in another market to take advan-
tage of price differential.Asian Development Bank (ADB) A regional development bank for Asia, formed in 1966
by several Asian countries in partnership with the USA, Canada, and a number of Europeancountries.
Asian dollar market The market in Asia in which banks accept deposits and make loans denom-inated in US dollars.
ask price The price at which a trader of foreign exchange is willing to sell a particular currency.Association of South East Asian Nations (ASEAN) An economic integration agreement among
a group of Asian countries.at the money A descriptive term implying that the strike price of any currency call or put option
equals the current spot rate.autonomous transaction A transaction that occurs due to self-interest. This includes exports,
imports, unilateral transfers, and investments.average rate of return The ratio of the average annual profit after taxes to the average net
investment.back-to-back loan A loan that involves an exchange of currencies between two parties, with a
promise to reexchange the currencies at a specified exchange rate on a specified future date.balance of payments A financial statement that records all transactions between a given country
and the rest of the world during a specified period of time.balance-sheet hedge A method designed to protect the value of a company’s exposed assets. It
involves the selection of the currency in which monetary assets and liabilities are denominated,so that an exchange rate change would make exposed assets equal to exposed liabilities.
Bank for International Settlements (BIS) A bank in Switzerland that facilitates transactionsamong central banks.
bankers’ acceptance A draft accepted by a bank. When a bank accepts a draft, it promises tohonor the draft at maturity.
barter An exchange of goods and services between two countries without the involvement offinance.
basis point One-hundredth of 1 percent, or 0.0001 percent.bearer The person who holds an instrument.Benelux countries The countries of Belgium, the Netherlands, and Luxembourg.best method rule The method that provides the most accurate measure of an arm’s-length result
under the facts and circumstances of the transaction under review.beta The second letter of Greek alphabet, used as a statistical measure of systematic risk in the
capital asset pricing model.bid price The price at which a trader is willing to buy a given item such as foreign exchange.big bang A package of major reforms designed to free a country’s financial markets from regu-
lations, such as the 1986 liberalization of British capital markets and the 2001 liberalizationof Japanese capital markets.
bilateral netting A netting method used for transactions between two related units.bill of exchange (draft) An order written by an exporter that requires an importer to pay a
specified amount of money at a specified time.bill of lading A shipping document issued to the exporting firm or its bank by a common carrier
that transports the goods.
546 GLOSSARY

black market An illegal foreign-exchange market.bloc A group of countries tied by treaty or agreement for mutual support or interest.blocked funds Financial assets that cannot be repatriated because the local monetary
authorities forbid their conversion into foreign exchange.book value The asset value recorded at historical cost.Brady bond A loan converted into collateralized bonds with a reduced interest rate, devised
to resolve the international debt crisis in the late 1980s. It is named after the US Treasury Secretary Charles Brady.
branch A foreign bank that provides a full range of banking services under the name and guarantee of the parent bank.
Bretton Woods Agreement An agreement signed by the representatives of 44 countries atBretton Woods, New Hampshire, in 1944 to establish a system of fixed exchange rates.
broker An intermediary in the foreign-exchange market.buy-American policy A policy that requires the recipients of American aid to buy goods and
services from American companies.call An option to buy a foreign currency or other financial assets.call swaption The right to receive fixed-interest payments.capital account In the balance of payments, the section that records the net changes in capital
transfers and the acquisition or disposal of nonproduced, nonfinancial assets.capital asset pricing model (CAPM) A theoretical model implying that the total risk of a
security consists of systematic (undiversifiable) risk and unsystematic (diversifiable) risk.capital budgeting The entire process of planning expenditures whose benefits are expected to
extend beyond 1 year.capital gains and losses Gains and losses on sales of capital assets such as stocks and property.capital market The market for long-term funds such as bonds, common stock, and preferred stock.capital structure The combination of long-term debt, preferred stock, common stock, paid-in
surplus, and retained earnings.cartel A formal written or oral agreement among firms or countries to set the price of the product
and the outputs of individual cartel members, or to divide the market for the product geographically.
cash center A geographical location where all idle funds from the subsidiaries of a multinationalcompany are maintained until they are needed.
cashier’s check A bill of exchange (draft) issued by the cashier of a bank, for the bank, uponthe bank.
CBD Cash before delivery.central bank The official bank of a government, such as the Federal Reserve Bank in the USA
or the Bank of Japan.CEO The chief executive officer of a company.certainty equivalent approach A method used to adjust for project risk. It adjusts for risk in
the numerator of the net-present-value formula.certificate of deposits (CDs) A time deposit with a specific future maturity date.CHIPS The Clearing House Interbank Payments System. A computerized clearing system used
by banks in New York to settle interbank foreign-exchange obligations.CHPAS The Clearing House Payments Assistance System. It is used to move funds between
London offices of most financial institutions.clearinghouse An institution through which financial obligations are cleared by the process of
netting obligations of various members.
GLOSSARY 547

COD Cash on delivery.coefficient of variation The standard deviation divided by the average return.collecting bank Any bank that handles an item for collection.common market A form of regional economic integration in which countries abolish internal
tariffs among themselves, levy common external tariffs, and eliminate restrictions on the flowof factors of production.
comparable profits method The method allowed by the US Internal Revenue Service to deter-mine the arm’s-length price of intracompany transactions. Under this method, comparablecompanies’ performance results are used to compute pro forma or benchmark operating incomeresults for the taxpayer.
comparable uncontrolled price method The method allowed by the US Internal RevenueService to determine the arm’s-length price of intracompany transactions. Under this method, uncontrolled sales are comparable to controlled sales if their physical property and circumstances are identical with the physical property and circumstances of controlledsales.
comparative advantage The relative advantage of a country in producing goods or services.compensation (buy-back) agreement A form of countertrade under which the initial seller
receives compensation in products that arise out of the original sale.competitive trade A practice whereby two countries buy from each other similar goods that
both can produce.confirmed letter of credit The letter of credit confirmed by a bank other than the opening
bank. Thus, the confirmed letter of credit is a firm obligation between two banks.confirming bank A bank that confirms a letter of credit issued by another bank.consignment The delivery of goods into the possession of another for the purpose of sale.consolidation An accounting process in which financial statements of related entities are added
together to produce a unified set of financial statements.consortium bank A bank formed by a group of banks from different countries to handle larger
international loans.contract manufacturing This occurs when multinational companies contract with a foreign
manufacturer to produce products for them according to their specifications.controlled corporation A foreign corporation in which more than 50 percent of the voting
shares are owned by US shareholders.convertibility The ability to exchange one currency for another currency.convertible currency The currency which may be converted into other currencies without
government restrictions.corporate governance The way in which major stakeholders exert control over operations
of a company. However, it is often narrowly defined as the prudent exercise of ownership rights.
correlation coefficient This measures the degree of correlation between two securities.correspondent bank A bank located in any other city, state, or country that provides a service
for another bank.cost and freight (C&F) The FOB (free on board) value and the cost of transportation to the
named point of destination.cost, insurance, and freight (CIF) The FOB (free on board) value, the cost of transportation,
insurance premium, and other costs incurred in connection with the shipment from the timeof loading in the export country to its arrival at the named port of destination.
548 GLOSSARY

cost method The method used in consolidating the financial statements of affiliates into thoseof a US parent when the parent owns less than 20 percent of the affiliate. Under this method,the parent carries its affiliates at the initial investment plus its dividends received.
cost of capital The required rate of return that the company must earn on its projects for themarket value of its common stock to remain unchanged.
cost plus method The method allowed by the Internal Revenue Service to determine the arm’s-length price of intracompany transactions. Under this method, an arm’s-length price isobtained by adding an appropriate markup to the seller’s cost.
counterpurchase A form of countertrade that involves a standard hard-currency export, but theseller agrees to a return purchase with a minimum quantity of specified goods from the buyer.
countertrade International trade arrangements that are variations on the idea of barter.countervailing duty An import charge used to offset an export subsidy by another country.covered-interest arbitrage Portfolio investment in a foreign country that is “covered” by forward
sale of the foreign currency to eliminate foreign-exchange risk.covering The purchase or sale of foreign exchange forward to protect a foreign-exchange loss in
the conversion from one currency to another.crawling band A combination of a crawling peg and a trading band.crawling peg A proposal for regular change in the par value according to an agreed-upon
formula.credit swap A hedging device that involves a simultaneous spot and forward loan transaction
between a private company and a bank of a foreign country.credit tranche The amount that a member country of the International Monetary Fund can
borrow from the IMF above the gold tranche.cross hedging A technique designed to hedge exposure in one currency by the use of futures or
other contracts on another currency that is correlated with the first currency.cross rate The exchange rate between two currencies when it is obtained from the rates of these
two currencies in terms of a third currency.crosslisting The listing of shares of common stock on two or more stock exchanges.culture shock A generalized trauma that one experiences in a new or different culture.currency board A monetary institution that only issues currency to the extent that it is fully
backed by foreign reserves.currency cocktail bond A bond denominated in a basket of currencies.currency futures An obligation to buy and sell a specified amount of a foreign currency for
delivery at a specified date.currency futures option The right, but not the obligation, to buy or sell a futures contract of
a foreign currency at any time through a specified period.currency option The right, but not the obligation, to buy or sell a specified amount of a foreign
currency at a specified price through a specified date.currency swap An agreement made between parties to exchange one currency with another for
a specified period of time and then exchange the latter currency with the former currency.current account In the balance of payments, the section that includes merchandise exports and
imports, earnings and expenditures for invisible trade items (services), income on investments,and current transfers.
current/noncurrent method A method that translates the financial statements of a foreign affiliate into the parent reporting currency. All current items are translated at the current ex-change rate, and all noncurrent items are translated at their historical exchange rates.
GLOSSARY 549

current-rate method A method that translates the financial statements of a foreign affiliate intothe parent reporting currency. All assets and liabilities are translated at the currency exchangerate.
customs union A form of regional economic integration that eliminates tariffs among membercountries and establishes common external tariffs.
customs valuation The value on which customs authorities charge tariffs. If values are set arbitrarily high, tariffs will also be higher.
debit In the balance of payments, the part of an international transaction that increases assetsof a country and reduces liabilities or net worth of the country.
debt–equity swap An exchange of foreign debt for equity in local companies.delphi technique A technique that combines the views of independent experts in order to obtain
the degree of political risk on a given foreign project or a particular foreign country.depreciation A decrease in the foreign exchange market value of a currency.devaluation An official reduction in the par value of a currency by the government of that
currency.development bank A bank established to support the economic development of underdevel-
oped areas through long-term loans.direct investment Equity investment such as the purchase of stock, the acquisition of an entire
firm, or the establishment of a new subsidiary. The US Department of Commerce definesdirect investment as investment in either real capital assets or financial assets with a minimumof 10 percent equity ownership in a foreign firm.
direct quote A home-currency price per unit of a foreign currency, such as $1.65 per Britishpound for a US resident.
dirty (managed) floating system A system in which exchange rates are allowed to changeaccording to market forces but governments intervene to prevent undesired fluctuations. Themonetary system since 1973 is sometimes called a dirty floating system, because most indus-trial countries have permitted their currencies to fluctuate with frequent government inter-vention in the foreign-exchange market.
discounted cash flow approaches Net-present-value and internal-rate-of-return methods thattake into account the time value of money.
diversification strategy A term used in international business to mean that a company producesor sells in many countries.
divestment Reduction in the amount of investment.division of labor An economic theory that allows each person or nation to utilize any peculiar
differences in skills and resources in the most economic manner. Division of labor is frequentlycalled specialization of function.
documentary draft A draft that accompanies such documents as bills of lading, commercialinvoices, and other documents.
double-entry accounting An accounting principle that requires each transaction to be recordedas debits and credits of an equal amount.
draft (bill of exchange) An order written by a seller that requires a buyer to pay a specifiedamount of money at a specified time.
drawee bank A bank upon which a draft is drawn and which thus must pay. Such a bank isoften called a paying bank.
drawer bank A bank that draws (writes) a draft offering payment.dumping A practice of selling a product in a foreign market at a price lower than that of the
same product in the home market.
550 GLOSSARY

duty A government tax (tariff ) levied on goods shipped internationally.eclectic theory A theory that tries to combine both trade and investment theories.economic exposure Expected future cash flows whose real values may be changed because of
exchange rate changes.economic integration Cooperation among different countries: the elimination of trade barriers
among member countries and bringing separate economies together to form one large market.economic union A form of regional economic integration that combines common market
characteristics with harmonization of economic policy.economies of scale A reduction in average cost per unit as sales volume or output increases.Edge Act corporation A subsidiary of a US commercial bank created under the Edge Act of
1916.efficient exchange market The exchange market in which exchange rates reflect available infor-
mation and market prices adjust quickly to new information. In the efficient exchange market,market participants buy and sell foreign currencies in a way that eliminates all profits in excessof the minimum required to sustain their continued participation.
efficient frontier The locus of all efficient portfolios.efficient portfolio A portfolio that provides the highest return for a given level of risk or the
smallest amount of risk for a given level of return.elasticity The degree of responsiveness in one variable to changes in another. For example, in
international trade the price elasticity measures the degree of responsiveness in exports orimports to changes in prices.
embargo A practice that prohibits all trade.equilibrium exchange rate The exchange rate at the intersection of the demand curve for and
the supply curve of foreign exchange.equity alliance An alliance whereby one company takes an equity position in another
company.equity method The method used in consolidating the financial statements of affiliates into those
of a US parent when the parent owns between 20 and 50 percent of the affiliate. Under thismethod, the parent carries its affiliates at the initial cost of the investment plus its propor-tionate share of profits or losses.
euro A new currency unit designed to replace the individual currencies of European Union countries.
Eurobond A bond that is sold in a currency other than that of the country of issue.Eurocommercial paper Unsecured short-term promissory notes sold in the Eurocurrency
market by multinational companies.Eurocurrency A currency deposited in a bank located in a country other than the country issuing
the currency.Eurodollar Dollar-denominated deposits in banks outside the USA. These banks may be foreign
banks or foreign branches of a US bank.Euro-medium-term note A medium-term note guaranteed by financial institutions with the
short-term commitment by investors. These notes are issued outside the country in whose cur-rency they are denominated.
Euronote A short- to medium-term debt instrument sold in the Eurocurrency market.European Bank for Reconstruction and Development (EBRD) A regional development bank
established in 1990 by 42 countries for emerging democracies in Eastern Europe.European Community (EC), or European Economic Community (EEC) An organization
formed in 1957 by France, Germany, Italy, Belgium, the Netherlands, and Luxembourg to
GLOSSARY 551

remove trade barriers among the member countries. The United Kingdom, Ireland, Denmark,Greece, and Portugal, and Spain joined later.
European Currency Unit (ECU) A weighted average value of a basket of 12 EC currencies.European Free Trade Association (EFTA) A form of regional economic integration involving
a group of central European countries which are not members of the EC.European Investment Bank (EIB) A regional development bank established in 1958 by
members of the EC.European Monetary System (EMS) A complex exchange rate and intervention system adopted
in 1978 by EC countries to replace the snake.European option An option that can be exercised only on the day on which it expires.European terms Foreign-exchange quotations for the US dollar, expressed at the number of
non-US currency units per US dollar.European Union (EU) The official name of the former European Economic Community (EEC)
as of January 1, 1994.excise tax A tax on various commodities within a country, such as tobacco and alcoholic
beverages.exchange rate The price of one currency expressed in terms of another currency.exchange rate risk The variability in a company’s earnings that may occur due to uncertain
exchange rate changes.exercise (strike) price The price at which the owner of a currency call option is allowed to buy
a foreign currency or the price at which the owner of a currency put option is allowed to sella foreign currency.
expatriates Noncitizens of the country in which they are working.Export–Import Bank (Ex–Im Bank) A US government agency established to promote US
exports.export trading company A trading company sanctioned by law to become involved in inter-
national trade as an agent or a direct outlet. The US Trading Company Act of 1982 relaxedthe antitrust law and the bank holding company act.
external debt Public debt owed to foreign citizens, firms, and institutions.factor A financial institution that buys a company’s accounts receivable on a nonrecourse basis.factors of production Those things necessary for producing finished goods. Factors of produc-
tion consist of land, capital, labor, and technology.FASB 133 Under this rule, issued in 1998, companies are required to report the fair market
value of their derivatives in their balance sheets and to include derivative gains and losses intheir income statements.
FASB 52 Under this rule, the current exchange rate is used in translating foreign-currency finan-cial statements into US dollars.
FASB 8 Under this rule, monetary items of a foreign affiliate are translated at the currentexchange rate, and nonmonetary items are translated at the historical exchange rate.
filter rule One form of technical analysis suggesting that investors buy a currency when it risesmore than a given percentage above its recent lowest value and sell the currency when it fallsmore than a given percentage below its highest recent value.
financial account In the balance of payments, the section that records the net change in foreigndirect investments, foreign portfolio investments, and other investments.
Financial Accounting Standards Board (FASB) The private-sector organization in the USAthat sets financial accounting standards.
552 GLOSSARY

financial assets Claims on such wealth as stocks, bonds, and other securities.financial market The market that deals in financial assets.financial risks In international finance, those risks which may occur because of varying exchange
rates, divergent tax laws, different interest and inflation rates, and balance-of-payments problems.
Fisher effect This theory assumes that the nominal interest rate consists of a real interest rateand an expected rate of inflation.
fixed exchange rate An exchange rate that does not fluctuate or that changes within a prede-termined band.
flexible (floating or fluctuating) exchange rate An exchange rate that fluctuates according tomarket forces.
foreign base company A corporation whose base or registration is in a country in which it doesnot conduct active operations.
foreign bond A bond sold outside the borrowing country but in the country of the currency inwhich the bond is denominated.
Foreign Corrupt Practices Act The US law that makes it illegal for American companies andmanagers to make payments to foreign government officials for the purpose of obtaining business.
Foreign Credit Insurance Association (FCIA) An association of insurance companies in theUSA which provide credit insurance to export sales.
foreign-currency swap An agreement between two parties to exchange local currency for hardcurrency at a specified future date.
foreign-currency translation The expression of balance-sheet items denominated in a foreigncurrency into a local currency.
foreign direct investment (FDI) The acquisition of physical assets in a foreign country to bemanaged by the parent company.
foreign exchange Any currency other than the currency used internally in a given country.foreign-exchange exposure The possibility that a firm will gain or lose due to changes in
exchange rates.foreign tax credit The amount by which a domestic company may reduce domestic income
taxes for income tax payments to a foreign government. This credit is used to avoid interna-tional double taxation.
forfaiting The purchase of financial obligations such as promissory notes with no recourse tothe exporters. This technique is used to finance medium-term export financing.
forward discount or premium An annualized percentage by which the forward exchange rateis less or more than the spot rate.
forward exchange rate An exchange rate for a currency to be delivered at a future date.franchising agreement An agreement whereby a multinational company (franchiser) allows a
foreign company (franchisee) to sell products or services under a highly published brand nameand a well-proven set of procedures.
free alongside (FAS) A price that includes the delivery of the goods alongside overseas vesselwithin reach of its loading tackle.
free float An exchange rate system characterized by the absence of government intervention.free on board (FOB) The price of the goods to the foreign buyer, which includes all costs,
charges, profits, and expenses accruing up to the point at which the goods are deposited onboard the exporting vessel or aircraft.
GLOSSARY 553

free trade The absence of artificial barriers to trade among individuals and firms in differentcountries.
free trade area A form of regional economic integration that eliminates tariffs among membercountries and establishes common external tariffs.
free trade zone An area within a country into which foreign goods may be brought duty freefor purposes of additional manufacture, inventory storage, or packaging.
freely floating exchange rate system A system that allows exchange rates to move on the basisof market forces, without government intervention.
functional currency The currency of the primary economic environment in which the entityoperates.
fundamental analysis A forecast based on fundamental relationships between economic vari-ables and exchange rates.
futures contract A contract that specifies an exchange rate in advance of the future exchange ofthe currency.
futures option The right to buy or sell the futures contract of a specified currency at a specified price by a specified expiration date.
gap analysis A tool used to estimate why a market potential for a given product is less than acompany’s sales in a country.
General Agreement on Tariffs and Trade (GATT) An agreement signed in 1947 by 23 coun-tries, to liberalize world trade.
generalized system of preferences Arrangements through which industrialized countries grantpreferential import duty rates to products from developing countries.
geographical arbitrage A practice in which a currency is bought in a market where its price islower and then sold in another market where its price is higher.
global bond A bond sold inside as well as outside the country in whose currency it is denominated.
global company A generic term used to describe an organization that attempts to standardizeand integrate operations worldwide in all functional areas.
global fund A mutual fund that can invest anywhere in the world, including the country ofissue.
gold standard A system whereby a country uses gold as a medium of exchange and a store ofvalue.
gold tranche The amount that each IMF member country contributes in gold or dollars as apart of its membership quota in the IMF. The gold tranche is usually 25 percent of a country’squota.
grand tour A political risk-forecasting technique that relies on the opinions of company executives visiting the country where investment is considered.
grandchild subsidiary A so-called second-tier subsidiary, which is under a tax-haven subsidiary.gross national product (GNP) The total market value of all final goods and services produced
in the economy during a year.Group of Five (G-5) Five industrial countries: France, Germany, Japan, the UK, and the USA.Group of Seven The G-5 countries plus Canada and Italy.Group of Ten Ten major industrial countries that pledged in 1962 to lend their currencies to
the IMF under the so-called General Agreement to Borrow. These ten countries are the Groupof Seven countries plus Belgium, the Netherlands, and Sweden.
hard currency A currency that may be used in international trade.
554 GLOSSARY

hedge funds Private partnerships with a general manager and a number of limited partners.Unlike other investment pools, such as stocks and mutual funds, these hedge funds are largelyunregulated investment pools, open only to wealthy investors.
hedging device An approach designed to reduce or offset a possible loss. For example, a multi-national company may sell forward exchange or use other means such as a credit swap to offsetor reduce possible losses from exchange rate fluctuations that affect values of assets and liabilities.
horizontal expansion A combination of firms engaged in the same line of business.host country The nonheadquartered country in which an international firm operates.import quota The maximum amount of a given product to be imported during a specified
period of time.import substitution An industrialization policy whereby new industrial developments empha-
size products that would otherwise be imported.in the money A descriptive term implying that the current spot rate exceeds (is less than) the
strike price on a currency call (put) option.indexing The practice of adjusting assets, liabilities, or payments by some measure of inflation
to preserve the purchasing power of the original amounts.indirect quote A foreign-currency price per unit of a home currency, such as SFr1.35 per US
dollar for a US resident.inflation The overall rate of increase in prices for a group of goods and services in a given
country.initial margin The amount that futures market participants must deposit at the time they enter
into a futures contract.Inter-American Development Bank (IDB) A regional development bank founded in 1959 by
the USA and 19 Latin American countries, to further the economic development of its membercountries.
interbank market The foreign-exchange market among banks.interbank transactions Foreign-exchange transactions that take place between banks, as
opposed to those between banks and nonbank clients.interest arbitrage A practice of lending or investing in another currency to take advantage of
higher interest rates.interest parity line A line that describes the equilibrium position for the relationship between
interest differentials and forward premium or discount. Every point on the line represents asituation in which the interest differential equals the forward premium or discount.
interest parity theory A theory stating that the difference between the spot rate and the forwardrate equals the difference between the domestic interest rate and the foreign interest rate.
interest rate cap A maximum rate on floating rate interest payments.interest rate collar A combination of an interest rate cap and an interest rate floor.interest rate floor A minimum rate on floating rate interest payments.interest rate swap Under this swap, companies exchange cash flows of a floating rate for
cash flows of a fixed rate, or exchange cash flows of a fixed rate for cash flows of a flexible rate.
internal rate of return The discount rate that equates the present value of expected net cashflows to the present value of the net investment.
International Accounting Standards Committee The international private-sector organizationestablished to set financial accounting standards that can be used worldwide.
GLOSSARY 555

International Bank for Reconstruction and Development (IBRD) The World Bank, whichis a companion institution to the IMF.
international banking facilities (IBFs) Vehicles that enable bank offices in the USA to accepttime deposits in either dollars or foreign currency from foreign customers, free of reserverequirements and of other limitations.
international bonds Those bonds that are initially sold outside the country of the borrower.International Development Association (IDA) An affiliate of the IBRD, established to make
long-term “soft” loans for development.International Finance Corporation (IFC) An affiliate of the IBRD, established to make devel-
opment loans in forms that could be sold to other investors and converted into equity.international Fisher effect A theory that the spot exchange rate should change by an amount
equal to the difference in interest rates between two countries.International Monetary Fund (IMF) An international monetary organization created at the
Bretton Woods Conference in 1947, to make the new monetary system feasible and workable.international monetary reserves Assets held by central banks or governments, which can be
used to settle international payments.international monetary system A system of such elements as laws, rules, institutions, instru-
ments, and procedures that include international money.international mutual fund A mutual fund that contains securities of foreign companies.intervention The buying and selling of currencies by central banks to influence the exchange
rate.intrinsic value The difference between the exchange rate of the underlying currency and the
strike price of a currency option.irrevocable letter of credit A letter of credit that cannot be changed without the consent of all
parties involved in the letter.issuing bank The bank that issues a letter of credit, usually the importer’s bank.J-curve Following a currency devaluation, an initial decrease in the trade balance followed by
an increase.joint venture A business venture in which two or more parties – for example, a foreign firm
and a local firm – have equity interest.just-in-time (JIT) inventory system A manufacturing system that reduces inventories by having
components and parts delivered as they need to be used in production.keiretsu A Japanese word that stands for the large, financially linked groups of companies that
play a significant role in the country’s economy.Kennedy Round The trade negotiations concluded in 1967, as part of the GATT, to reduce
trade barriers between the USA and the EEC countries.law of one price A law stating that all goods sell for the same price worldwide when converted
to a common currency.leads and lags Payment of financial obligations earlier (leads) or later (lags) than is expected or
required.less developed country (LDC) A country characterized by relatively low levels of economic
output and income per capita, limited industrial activity, and a lack of adequate health, educational, and other social services.
letter of credit A document issued by a bank at the request of the importer. In the document,the bank agrees to honor a draft drawn on the importer if the draft accompanies specified documents.
556 GLOSSARY

leveraged buy-out (LBO) A large amount of loan to buy a controlling interest in a company.licensing agreement An agreement whereby one firm gives rights to another for the use of such
assets as trademarks, patents, or copyrights.lifetime employment A customary Japanese situation in which workers are effectively guaran-
teed employment with the company for their working lifetime.link financing An arrangement that commercial banks in strong-currency countries help
subsidiaries in weak-currency countries to obtain loans by guaranteeing repayment of the loans.
local currency The currency of the country to which reference is made.London Interbank Offered Rate (LIBOR) The arithmetic average of the interest rates offered
by 16 major banks in London on 6-month Eurodollar time deposits at a certain time duringthe morning. This is the reference rate in London for interbank Eurocurrency deposits.
long position An agreement to buy a futures contract.mail float The mailing time involved in payments sent by mail.maintenance margin A set minimum margin that futures market participants must always
maintain in their accounts.managed float Also known as a dirty float, a system that floats exchange rates with central bank
intervention to reduce currency fluctuations.margin Money deposited with a broker to finance futures trading.margin call A broker’s request for an additional deposit when the funds in his client’s account
fall below the minimum amount.marginal cost of capital The cost of the last dollar of funds raised. It is assumed that each dollar
is financed in proportion to the firm’s optimum capital structure.market-based forecast A forecast based on market indicators, such as forward rates or spot rates.market economy An economic philosophy in which resources are allocated and controlled by
consumers who “vote” by buying goods.market portfolio A well-diversified group of risky securities with little or no unsystematic risk.Marshall Plan The European Economic Recovery Program established by the USA in 1948, to
restore the productive capacity of European industry and agriculture destroyed during WorldWar II.
merchandise trade balance The net of merchandise imports and exports within a country’sbalance of payments.
merger A situation whereby two companies combine their operations to form a new company.monetary/nonmonetary method Under this method of translation, all monetary accounts are
translated at the current exchange rate, and all nonmonetary accounts are translated at the historical exchange rate.
money market The financial market where short-term securities such as commercial paper andbankers’ acceptances are sold and bought.
money market hedge A hedging device that involves a contract and a source of funds to carryout that contract. If an American firm has a British pound import payable in 60 days, it mayborrow in dollars, convert the proceeds into pounds, buy a 60-day British Treasury bill, andpay the import bill with the funds derived from the sale of the Treasury bill.
most-favored nation (MFN) A nation that receives the most favored treatment in applicationof duties from another country. The MFN clause requires that if a member country of theWorld Trade Organization grants a tariff reduction to one country, it must grant the sameconcession to all other WTO member countries.
GLOSSARY 557

multicurrency clause A clause that gives a Eurocurrency borrower the right to switch from onecurrency to another when the loan is rolled over.
multinational (transnational) corporation A company that conducts business operations inseveral countries. It usually consists of a parent firm and a number of affiliates.
multiple exchange rate system Under this system, a government sets different exchange ratesfor different transactions.
mutual funds Corporations that accept money from savers and then use these funds to buy avariety of securities issued by businesses or government units
negotiating bank A bank that negotiates such things as discounts or purchases of drafts drawnby exporters.
net exposure The difference between exposed assets and liabilities.net present value The present value of future net cash flows minus the present value of the net
investment for a project.netting A method designed to reduce the foreign-exchange transaction cost through the con-
solidation of accounts payable and accounts receivable. For example, if subsidiary A buys $1million worth of goods from subsidiary B and B in turns buys $3 million worth of parts fromA, the combined flows are $4 million. But on a net basis, subsidiary A would pay subsidiaryB only $2 million.
newly industrialized country (NIC) A Third World country in which the cultural and eco-nomic climate has led to a rapid rate of industrialization and growth since the 1960s.
Nikkei Index A measure of the level of stock prices on the Tokyo Stock Exchange, based on theprices of a group of Japanese securities.
nominal interest rate The rate of interest that consists of a real interest rate and an expectedrate of inflation.
nonmarket, or centrally planned, economy An economy in which resources are allocated andcontrolled by government decision.
nontariff barriers Restrictive practices in trade other than custom duties used by governmentsor by private firms. Nontariff barriers used by governments include import quotas, voluntaryrestrictions, exceptional customs valuation procedures, and health regulations. Nontariff bar-riers used by private firms include price control, division of markets, restriction of supplies,patent agreements, or control of technology.
North American Free Trade Agreement (NAFTA) A trade agreement that allows free trade andinvestment between Canada, Mexico, and the USA.
notifying (advising) bank A bank that notifies the beneficiary of the opening of a letter of credit.offer price The price at which a trader is willing to sell a given item.official reserves Government-owned assets that consist of gold, SDRs, and convertible foreign
exchange.offset agreement Trade demanded by a foreign buyer to produce parts, source parts, or assem-
ble the product in the importing country.offshore banking Banking activities that accept deposits and make loans in foreign currency –
the Eurocurrency market.offshore funds Funds that use the currency of a country but are located outside that country
for tax and other purposes.oligopoly model This model assumes that business firms make foreign investments to exploit
their quasi-monopoly advantages.opening bank A bank that opens a letter of credit.
558 GLOSSARY

opportunity cost The rate of return that funds could earn if they were invested in the best avail-able alternative project.
optimal portfolio A portfolio found at the tangency point between the efficient frontier andthe security market line. This is the portfolio that has, among all possible portfolios, the largestratio of expected return to risk.
optimum capital budget The amount of investment that will maximize a company’s totalprofits.
optimum capital structure The combination of debt and equity that yields the lowest cost ofcapital or maximizes the overall value of the company.
option The right to buy or sell a given amount of foreign exchange or other financial asset at afixed price for a specified time period.
option premium (price) The price that the option buyer must pay the option seller.Organization for Economic Cooperation and Development (OECD) An organization of 29
countries, most of which are industrialized countries.Organization of Petroleum Exporting Countries (OPEC) An organization established by
a number of oil-exporting countries to formulate uniform policies such as selling prices ontheir oil-export sales. Full members with vote and veto include Algeria, Ecuador, Indonesia,Iran, Iraq, Kuwait, Libya, Nigeria, Qatar, Saudi Arabia, the United Arab Emirates, andVenezuela.
out of the money A descriptive term implying that the current exchange rate is less than(exceeds) the strike price on a currency call (put) option.
outright forward rate A forward-exchange rate expressed in terms of the amount of one cur-rency required to buy a unit of another currency.
outsourcing A situation in which a domestic company uses foreign suppliers for componentsor finished products.
over-the-counter (OTC) market A market in which participants privately trade securities,options, foreign exchange, or other financial contracts with each other, often using a bank asan intermediary. The OTC market has no physical location and thus is differentiated fromorganized exchanges with a physical location where trading takes place.
overdraft A line of credit that permits the customer to write checks beyond deposits.Overseas Private Investment Corporation (OPIC) A US government agency established in
1969 to insure American overseas investors against political risks.par (mint) value The value of a currency specified by the government of the currency.parallel loan A loan that involves an exchange of currencies between four parties, with a promise
to reexchange the currencies at a specified exchange rate and future date.parent A company that controls another (its subsidiary).payback period The number of years required for the net cash flows of a project to return its
cost.payee The party to whom payment is made. The drawer may also be a payee of a draft.paying bank The drawee bank on which a draft is drawn.peg To fix the value of a currency to some benchmark such as the US dollar.petrodollars OPEC deposits of dollars in the Eurocurrency market.piracy The unauthorized use of property rights protected by patents, trademarks, or copyrights.plain vanilla swap The basic form of a swap – the simplest kind.political risk Potential changes in political conditions that may cause company operating posi-
tions to deteriorate.
GLOSSARY 559

pooling-of-interest method A method in the case of a merger under which the items on thebalance sheets of the two companies are added together so that the merger will not creategoodwill.
portfolio effect The extent to which the variations or risks of individual assets tend to offseteach other.
portfolio investment Investment in foreign financial assets without significant managementcontrol of the real assets.
portfolio theory A theory that indicates that a company is often able to improve its risk–returnperformance by holding an internationally diversified portfolio of assets as opposed to a domes-tically diversified portfolio.
possessions corporation A US firm engaged in business within US possessions such as Guamand American Samoa. The possessions corporation obtains tax advantages if it meets certainrequirements.
premium The excess of the forward exchange rate over the spot exchange rate.Private Export Funding Corporation (PEFCO) A corporation established in 1970 at the ini-
tiation of the Bankers’ Association for Foreign Trade, to mobilize private capital in order tofinance US exports of big-ticket items.
privatization A situation in which government-owned assets are sold to private individuals orgroups.
product differentiation The development of a product that is different from those producedby competitors to maintain or improve market share.
product life cycle theory A theory that attempts to explain both world trade and foreign invest-ment patterns on the basis of stages in a product’s life. The product life cycle is the time thatit takes to bring new and improved products to markets.
production efficiency The production of goods in the least costly way.profit split method A new transfer pricing method adopted by the US Internal Revenue Service
in 1994. This method consists of two steps in estimating an arm’s-length return: (1) by com-paring the relative economic contributions that the parties make to the success of a venture;and (2) by dividing the returns from that venture between them on the basis of the relativevalue of such contributions.
project finance A way for a project sponsor to raise nonrecourse financing for a specific project.Most often, a separate legal entity is formed to operate the project.
protectionism A political attitude or policy intended to prohibit the import of foreign goodsand services.
proxy The assignment of the voting right to management or a group of outsiders.Public Law 480 The US law that permits less developed countries to purchase surplus
American agricultural products and to pay for them with their own currencies rather than with dollars.
purchase-of-assets method A method in the case of a merger under which the acquired assetsor companies are usually recorded in the accounts of the acquiring company at the marketvalue of assets given in exchange.
purchasing power parity theory An economic theory that, in the long run, exchange ratesreflect the relative purchasing power of currencies.
put An option to sell foreign exchange or financial contracts.put swaption The right to make fixed interest payments.quality control circle A production system in which small groups of workers meet regularly to
detect and solve problems in their area.
560 GLOSSARY

quota A limit set on the import of a product.real interest rate The nominal (quoted) interest rate minus the inflation rate.recourse The right of an intermediary to claim reimbursement from a drawer of a draft if the
drawee fails to pay.regional development bank A development bank that makes loans only to countries in
particular regions.reinvoicing center A subsidiary that takes title to all goods sold by one corporate unit to other
affiliates or independent customers. The center pays the seller and in turn is paid by the buyer.reporting currency The currency in which the parent firm prepares its own financial statements.required rate of return The minimum rate of return required by the investors.resale price method The method allowed by the US Internal Revenue Service to determine the
arm’s-length price of intracompany transactions. Under this method, an arm’s-length price isobtained by subtracting an appropriate markup from the applicable sale price.
reserve, or official reserve, account In the balance of payments, the section that represents thechanges in official reserves such as SDRs and convertible foreign exchange.
reserve country A country whose currency is held as a reserve asset by central banks or governments of other countries.
reserve currency A currency held as a reserve asset by central banks or governments of coun-tries other than the country of the currency.
return on investment (ROI) Profits divided by the amount of investment, usually total assets.revaluation Either an upvaluation or a devaluation.revocable letter of credit A letter of credit that can be canceled at any time without prior
notification to the beneficiary.risk The variability of return associated with a project.risk-adjusted discount rate A rate that consists of the riskless rate of return plus a risk premium.risk analysis An analysis of the different outcomes under different assumptions that each of
these outcomes will occur.royalties The payment for use of assets abroad.safe harbor A rule set in legislation that guarantees favorable treatment to the party.safeguard clause A clause for conditions under which tariffs and nontariff barriers may be
reintroduced.Section 482 A provision of the US Internal Revenue Code regulating transfer pricing practices.Securities and Exchange Commission (SEC) A US government agency that regulates
securities brokers, dealers, and markets.semistrong-form efficiency When related to foreign-exchange markets, this theory implies that
current exchange rates reflect all publicly available information, thereby making such infor-mation useless for forecasting exchange rate movements.
short position An agreement to sell a futures contract.sight draft A draft payable on demand (at sight).Smithsonian Agreement An agreement reached in December 1971, to widen the band up to
2.25 percent on either side of the par value.snake within a tunnel A system that EEC countries agreed to allow their currencies to
fluctuate a maximum of 2.25 percent against one another and that permitted a 4.5 percentband against other countries. The tunnel disappeared in 1973 and the snake ended in 1978.
Society for Worldwide Interbank Financial Telecommunications (SWIFT) An interbankcommunication network that carries messages for financial transactions.
GLOSSARY 561

sovereign risk The risk of a country that will impose foreign-exchange regulations or the riskof government default on a loan made to it or guaranteed by it.
sovereignty The power of a country to act as it wishes within its own borders.special drawing rights (SDRs) A reserve asset created in 1967 by the IMF. SDRs are rights to
draw on the IMF.specific duty A duty imposed as a fixed charge per unit, such as $2 per ton.spot rate A foreign-exchange rate paid for delivery of a currency within 2 days from the date of
the trade.spread The difference between the bid and ask prices in a price quote, or the difference between
the spot rate and the forward rate.strategic alliance A formal relationship between two companies to obtain economies of
scale.strike price The price at which a currency can be sold or bought in an option contract.strong-form efficiency When related to foreign-exchange markets, this theory suggests that
current exchange rates reflect all pertinent information, whether publicly available or privatelyheld.
Subpart F Foreign-source “unearned income” taxed by the Internal Revenue Service whether ornot it is remitted to the USA.
subsidiary A foreign-based affiliate that is separately incorporated under the host country’s law.subsidy Direct or indirect governmental assistance to companies, thereby making them more
competitive with imports.swap An agreement between two parties who exchange sets of cash flows over a period of time
in the future.swap loan A loan made by a local bank based on deposit of funds in offices of that bank in
another country.swaption An option to enter into a plain vanilla interest rate swap.switch trading A practice whereby payments for exports to the Eastern bloc and nonmarket
countries are made through clearing units, in which sales are balanced with purchases fromother countries.
syndicated loan A credit in which a group of banks makes funds available on common termsand conditions to a particular borrower.
synergistic effect A situation in which the combined company is worth more than the sum ofits parts.
systematic risk The risk common to all assets or all countries, which cannot be diversified away.tariff A duty or tax imposed on imported commodities.tariff harmonization The process of making tariffs more homogeneous by eliminating dis-
parities in tariff rates on the same commodity.tax haven A country that promises permanent tax inducements to attract multinational
companies.tax holiday The form of a complete tax exemption for the first few years given by a country
when multinational firms invest their money in that country.technical analysis A currency forecasting technique that uses historical prices or trends.temporal method A method that translates the financial statements of a foreign affiliate into
the parent reporting currency. Monetary assets and liabilities are translated at current exchangerates; nonmonetary assets, nonmonetary liabilities, and owners’ equity are translated at his-torical exchange rates.
562 GLOSSARY

tender offer An offer to buy a certain number of shares at a specific price and on a specific datefor cash, stock, or a combination of both.
Third World A term used to mean those countries other than the industrial countries and thenonmarket (centrally planned) economies.
time draft A draft payable a specified number of days after presentation to the drawee.trade acceptance A draft accepted by an importer or a business enterprise.trademark A name or logo that distinguishes a company or product.transaction exposure The possibility that gains or losses may result from the settlement of trans-
actions whose terms are stated in foreign currency.transfer price The price of goods and services sold between related parties such as parent and
subsidiary.translation exposure Exchange gains or losses that will occur when a company translates its
foreign-currency operations into its home currency.triangular arbitrage The process of buying and selling foreign exchange at a profit due to price
discrepancies where three different currencies are involved.unilateral transfer In the balance of payments, the account that covers gifts by domestic resi-
dents to foreign residents, or gifts by the domestic government to foreign governments.unit of account A benchmark on which to base the value of payments.unitary tax A method of taxing a company on its worldwide profits rather than on its profits
in the area where the taxing authorities are located.unsystematic risk The risk unique to a particular company or country, which can be diversi-
fied away.upvaluation An official increase in the par value of a currency by the government.US–Canada Free Trade Agreement A 1988 agreement between the USA and Canada to remove
their trade barriers.value-added tax (VAT) A sales tax assessed at one or more stages in the production process, but
only on the value added during that production stage.vertical integration The integration of different stages in which the special drawing rights of a
product move from the earliest production to the final distribution.weak-form efficiency This theory implies that all information contained in past exchange rate
movements is fully reflected in current exchange rates.withholding tax A tax collected from income to employees, stockholders, and others; it is col-
lected before receipt of the income.World Bank A multinational financial institution established in 1944, to enhance economic
development.World Trade Organization (WTO) The new organization that has replaced the General Agree-
ment on Tariffs and Trade (GATT) since the Uruguay Round accord became effective onJanuary 1, 1995.
Yankee bonds Dollar-denominated bonds issued within the USA by a foreign borrower.yield The actual rate of return on a financial asset. It depends on the price paid for the security
and the stated rate of interest or dividend.zero-coupon bond A bond that pays no coupon interest and simply returns the face value at
maturity.
GLOSSARY 563

Accounting aspects of mergers,435–6
Accounting exposure, 244–60Accounts receivable management,
388–9Acquisition, 433Acquisition of funds, 10Actual balance of payments, 63–7African Development Bank (AfDB),
361Agency, 297Agency cost, 19Agency for International
Development (AID), 361–2Agency theory, 18–19Aggressive stocks, 402Agreement corporation, 353Allocation efficiency, 33–4Allocation of funds, 9American decline, 67–8American depository receipt (ADR),
414, 421–3Amortization, 279Antidumping duty, 36Appreciation, 82, 196Appropriate cost of capital, 479Arbitrage, 136–40Arbitrage opportunities, 373
Argentina’s currency crisis, 293–4Arguments against foreign
investment, 427Asian currency market, 274–6Asian Currency Unit (ACU), 274–5Asian Development Bank (ADB),
360–1Asian financial crisis, 93–4, 300–6Asian Monetary Fund (AMF), 96Asian Pacific Economic
Cooperation (APEC), 42Ask price, 124Association of South East Asian
Nations (ASEAN), 42At the money, 161Autonomous transaction, 56Avon Products, Inc., 221
Back-to-back loan, 180, 233Balance of payments, 55–76Balance of payments, actual, 63–7Balance-of-payments accounts,
57–63Balance-of-payments identity, 63Balance-of-payments outlook,
210–11Balance on goods, 58Balance sheet, 491
Balance-sheet hedge, 221, 251Bank for International Settlements
(BIS), 270Bank-based system of corporate
governance, 273Bankers’ acceptance, 333–4Benefits of foreign investment,
426–47Benefits of international
diversification, 407–13Benefits of open trade, 33–4Bid price, 124Bid–ask spread, 124Big Mac Hamburger Standard,
146–7Bill of exchange, 321Bill of lading, 322–3Bond with warrant, 280Book-value weight, 480BP Amoco, 443–5Brady bond, 300Branch bank, 297Bretton Woods Agreement, 88Bridge loan, 350Build–operate–own (BOO)
contract, 357Build–operate–transfer (BOT)
project, 357
Index

INDEX 565
Cable remittance, 384Call money, 268Call option price, 165–6Call swaption, 186Cap, 111, 186Capital account, 59Capital asset pricing model
(CAPM), 401Capital budgeting and transfer
pricing, 452–3Capital budgeting theory and
practice, 460–1Capital gains and losses, 500Capital rationing, 454Capitalization rate, 440Carryback, 501–2Carryforward, 501–2Cash before delivery (CBD), 330Cash center, 385Cash flow analysis, 450Cash management, 382–8Cash on delivery (COD), 330Cash pooling, 385–6Cash terms, 330Central bank, 118Certainty equivalent approach, 455Certificate of deposit (CD), 266Certificate of origin, 325Charting, 203Clean draft, 322Clearing arrangements, 328Clearing House Interbank Payments
System (CHIPS), 298Clearing House Payments
Assistance System (CHPAS), 298Closed-end mutual funds, 414Coca Cola, 224Collar, 111, 186Collecting overdue accounts, 332–3Commercial bank, 115–16, 350Commercial invoice, 324Commercial paper, 268Common market, 39Company goal, 450, 460–1Comparative advantage, 17, 54–5,
188–9Compensating balance, 352Compensating transaction, 57Compensation agreement, 329Concession agreement, 467
Confirmed letter of credit, 324Conflict of interest, 22Consignment, 330Consortium bank, 297Consular invoice, 325Consultation, 271Contagion, 270Contract manufacturing, 429Convertible bond, 280Cooperation, 271Coordination, 271Corporate governance, 3, 19–21Corporate wealth, 8Correspondent bank, 297Cost of capital, 452Cost of debt, 478Cost of equity, 477Counterparty, 178Counterpurchase, 329Countertrade, 327Countervailing duty, 36Country risk analysis, 309–13Country risk, assessment of,
310–11Covered-interest arbitrage, 138Crawling band, 103Crawling peg, 103Creation of Eurodollars, 265–6Credit or default risk, 270Credit swap, 231, 380Credit terms, 331–2Cross-border mergers and
acquisitions, 433–41Cross-hedge, 231Cross-hedging in Japan, 435Cross rate, 122–3Crosslisting, 282Cultural values and capital
structure, 484–5Currency board, 82–3Currency call option, 159, 162–5Currency cocktail bond, 279Currency exposure management
practices, 235–6Currency forecasting, 201Currency futures calls, 169Currency futures market, 150–7Currency futures option, 169Currency futures put, 169Currency option bond, 279
Currency option premium, 161–2Currency options market, 157–69Currency put option, 159, 165–7Currency risk management, 187Currency swap, 185, 231, 350–1Current account, 58–9Current rate method, 246Current transfers, 58–9Current/noncurrent method, 245Customs union, 39
DaimlerChrysler, 421–4Dealer commercial paper, 268Dealer, 111Debt ratio, 310–11Debt–equity swap, 300Defensive measures after
investment, 467–8Defensive measures before
investment, 466–7Defensive stocks, 402Dell Mercosur, 256–60Delphi technique, 466Depreciation, 82, 196Derivatives, 111–12Derivative risks, 148–9Devaluation, 82, 213Developing countries, 310Development banks, 357–8Direct loan, 347Direct quote, 120Direct taxes, 499Dirty floating system, 90–1Disbursing float, 383Discount rate, 268Discounted cash flow approach,
453Diversified financing, 234Diversified marketing, 234Diversified production, 234Documentary draft, 322Draft, 321–2Drawee, 321Drawer, 321
Eastern European countries, 6Eclectic theory, 46–7Economic constraints of current
asset management, 371–2Economic evaluation, 452–3

566 INDEX
Economic exposure, 224Economic exposure management,
233–5Economic freedom and
consumption, 34–5Economic integration, 38Economic union, 39Economies of scale, 18, 33Edge Act and agreement
corporations, 353Edge Act corporations, 353Efficient exchange markets, 129Efficient frontier, 406Efficient market hypothesis, 201,
209Efficient portfolio, 406Electronic fund transfer (EFT), 384Environmental differences, 21–2Equity alliance, 428Equity contribution, 347Ethical dilemma, 514–17Euro, 78–81, 100–2Euro commercial paper, 268, 269Euro Interbank Offered Rate
(EURIBOR), 267Euro medium-term note, 269Eurobond, 277Eurocurrency interbank market,
269–74Eurocurrency market, 264–9Eurocurrency Unit (ECU), 279Eurodollar deposit, 266Eurodollar instruments, 266–9Eurodollar loan, 266–7Eurodollars, 264–5Eurodollars, use of, 256–66Euromoney country risk rankings,
312Euronote facilities, 269Euronotes, 269European Bank for Reconstruction
and Development (EBRD), 360European Currency Unit (ECU),
98–9European economic area, 40–1European Economic Community
(EEC), 40–1European Investment Bank (EIB),
360European Monetary Union (EMU),
98–102
Exchange forecast performance, 208Exchange intervention, 118Exercise price, 112Explicit cost of debt, 478Export trading companies, 335Export Trading Company Act, 335Export–Import Bank, 319, 338,
361Exposure management strategy, 223Exposure netting, 252Expropriation, 464External growth, 428
Factoring, 335–6, 389Fannie Mae, 268FASB 52, 247–51FASB 8, 247–51Federal funds, 268Financial account, 59–60Financial Accounting Standards
Board (FASB), 133, 177Financial instruments, 224Financial market arbitrage, 373Financial planning and control, 9Financial risks, 22Fisher effect, 131–2Fixed exchange rate, 81, 87–8Flexible exchange rate, 81Flexible exchange system, 88Floating-rate note, 280Float, 383–5Floor, 186Forecasting fixed exchange rates,
210–16Forecasting floating exchange rates,
201–10Forecasting political risks, 465–6Foreign affiliate, 11Foreign banking offices, types of,
296–8Foreign bond, 277Foreign Corrupt Practices Act
(FCPA), 497–9Foreign Credit Insurance
Association (FCIA), 339Foreign direct investment (FDI),
59, 426Foreign-exchange exposure, 222Foreign-exchange rate, 81Foreign-exchange risk, 270, 320Foreign portfolio investment, 61
Foreign prime rate, 268Foreign subsidiary bank, 297Foreign tax credit, 503Foreign trade zone, 505–6Forfaiting, 336Forward discount, 125–6Forward exchange rate, 125–8Forward market hedge, 227Forward premium or discount,
125–6, 212Forward rate, 134, 203Franchising agreement, 429Free market rate, 212Free trade area, 39Functional currency, 248–9Fundamental analysis, 202Fundamentalist view, 302–3Funds, acquisition of, 10Funds from parents, 346–7Funds provided by operations, 348Future spot rate, 134Futures market operations, 153–4Futures market and forward market,
151–2Futures option, 169–70
General Agreement on Tariffs andTrade (GATT), 38
General Electric, 177General Motors (GM), 218–20,
474–6GeoLogistics Corp., 369–70Gillette, 177Global bond, 277Global company, 11–12Global competitors, 11Global control system, 491–9Global depository receipts, 414Global economy, 5Global investing, 418–19Globalization, 4GM’s target debt ratio, 474–6Gold standard, 87–8Government concessions, 504–5Grand tour, 466GS Holdings, 398–400
Hedge fund, 415–16Hedge, 251Hedgers, 150Hedging decision, 200

INDEX 567
Hedging in the call options market,162–3
Hedging in the futures market, 154Hedging techniques, use of, 236Hedging translation exposure,
251–2Hostile takeover, 20Huh Chang Soo, 399–400Hurdle rate, 454
IBM, 364–5Import duty minimization, 508Import quota, 36In the money, 161Income and capital gains, 500Income statement, 491Income tax minimization, 506–7Increased globalization, 6Indirect fund-adjustment methods,
252Indirect quote, 120Indirect taxes, 499Inflation, 211Initial margin, 154Insurance documents, 324Inter-American Development Bank
(IDB), 359–60Interbank clearinghouse systems,
298Interest rate, 207Interest rate cap, 186Interest rate collar, 186Interest rate floor, 186Interest rate swap, 183, 233Internal fund flow, 348Internal growth, 427Internal rate of return, 453Internal sources of funds, 346–9International banking facilities
(IBFs), 354International bond market, 276–7International bonds, types of,
279–80International financial manger,
8–10International Bank for
Reconstruction and Development(IBRD), 357–8
International bond, 276International Corporate Governance
Network, 4
International debt crisis of the1980s, 299–300
International DevelopmentAssociation (IDA), 359
International equity market, 281–5International Finance Corporation
(IFC), 358–9International Fisher effect, 132–3International loans, 298–309International Monetary Fund
(IMF), 94–7International monetary system,
80–1International mutual fund, 413–14International opportunists, 11International parity conditions,
128–36International reserves, 211International taxation, 499–506Internationalization advantage, 17International investment position,
65Intracompany sales, 389Intrinsic value, 161Inventory management, 389–92Investment climate, 432–3Invoice float, 383Irrevocable letter of credit, 323
J-curve, 71Jamaica Agreement, 91Joint venture, 354, 428Junk bond, 312
Keiretsu, 273, 435Keynes, John, 103Koo Bon Moo, 398
Leads, 221, 252, 375–6Lags, 221, 252, 375–6Lessard, Donald, 11Letter of credit, 116, 323–4LG Group, 398–400Licensing agreement, 354, 428Link financing, 351Liquidity risk, 270Loans from sister subsidiaries,
348–9Lock box, 384London Interbank Offered Rate
(LIBOR), 267
Long position, 153Long-term capital flows, 285–6Long-Term Capital Management
(LTCM), 417–18Long-term financing decision, 200Long-term investment decision, 200Louvre Accord, 91
Mail float, 383Maintenance margin, 154Majority-owned affiliate, 11Margin call, 154Margin requirements, 154Marginal cost of capital, 482Market-based forecast, 206Market-based system of corporate
governance, 273Market efficiency, 201Market equilibrium, 84–7Market imperfections, 15Market portfolio, 402Market risk premium, 477Market-value weight, 480Maturity mismatch, 236Mechanical rules, 203Merck’s use of currency options,
174–6Mercosur, 39Merger, 433Mergers and acquisitions, 428Mergers and corporate governance,
434Mergers, some accounting aspects
of, 435–6Merton, Robert, 111Method of international
diversification, 413–16Mexican peso crisis of December
1994, 93, 106–9Modes of foreign investment,
427–9Monetary/nonmonetary method,
245Money market hedge, 227Money rates, 268Money supply, 211Moody’s Investor Service, 312More frequent requisitions, 384Motivations for swaps, 187–9Motives for cross-border mergers
and acquisitions, 436–7

568 INDEX
Motives for foreign investment,43–5
Motives for foreign trade, 29Multi-domestic competitors, 11Multilateral netting, 374Multinational capital budgeting
practices, 472–3Multinational company goals, 8Multinational corporation, 10–11Multiple environments, 23Multiple regression analysis, 202Multiple regression forecasting
model, 203Mundell, Robert A., 196Mutual fund, 413
National company, 25National development bank, 361–2National differences in corporate
governance, 21Nature of country risk analysis, 309Navistar International, 395–7Nestlé SA, 7Net errors and omissions, 61Net present value, 453Net working capital funding, 370Netting, 374Neutral tax, 502Nobel Prize in economics, 196Nominal interest rate, 131Noncompletion risk, 320Nonrevolving letter of credit, 324North American Free Trade
Agreement (NAFTA), 41Notional principal, 183
Objectives of documentation,320–1
OECD principles of corporategovernance, 21
Off-balance-sheet operations, 181Official versus market rates, 211Offset agreement, 329Offset, 342–3Old hand, 466Oligopoly model, 44On-board bill of lading, 322Open account, 331Open-end mutual funds, 414Operational restrictions, 463
Operational techniques, 224Opportunity cost, 54–5Opportunity set, 14–15Optimal portfolio, 407–8Optimum capital budget, 482Optimum capital structure, 480Options market hedge, 228Options versus forward contracts,
230–1Order bill of lading, 322Organization for Economic
Cooperation and Development(OECD), 4
Organizational structure, 496Out of the money, 161Overall country creditworthiness,
311Overdraft, 350Overnight repurchase rate, 268Overseas Private Investment
Corporation (OPIC), 362
Panic view, 305Parallel loan, 179–80, 380Parent currency, 248–9Parent guarantee, 347Parent-country taxation, 502Payee, 321Payment adjustment, 380Performance of multinational
companies, 13Perfect competition, 15Performance bond margin, 154Performance criteria, 495Performance evaluation, 494–9Performance measurement issues,
495–6Peso crisis, 218–20Plain vanilla swap, 183Planned divestment, 467Plaza Agreement, 91Political climate, 449Political dynamics, 274Political risk management, 462–7Political risks, 22, 462Political union, 39Pooling-of-interest method, 435–6Portfolio effect, 15–16Portfolio guidelines, 387Portfolio management, 387
Portfolio return, 404Portfolio theory, 44, 458–60Positioning of funds, 373Post-audit, 455Prevailing exchange rate
arrangements, 87Price–earnings ratio, 477Prime rate, 268Private Export Funding
Corporation (PEFCO), 338–9Privatization, 283–5Processing float, 383Product life cycle theory, 43, 32–3Production efficiency, 34Profit–loss profiles of options,
167–8Project finance, 356Project versus parent cash flows,
451–2Promissory note, 331Protectionism, 35–6Proxy, 20Public Company Accounting
Oversight Board, 20–1Public control, 70Purchasing-of-assets method, 436Put option price, 167Put swaption, 186
Quantitative analysis, 46
Real interest rate, 131Real option analysis, 457–8Received-for-shipment bill of
lading, 322Regional development bank,
359–60Regional economic agreement,
40–2Regulations of derivative markets,
193–5Regulatory risks, 22Regulatory system arbitrage, 373Reinvoicing center, 378–9Representative office, 297Reserves, 62Return on investment, 495Revaluation, 82Revocable letter of credit, 323Revolving credit, 267

INDEX 569
Revolving letter of credit, 324Risk-adjusted discount rate, 454Risk–return trade-off, 14Risk, types of, 22Role of banks in corporate
governance, 273–4Rotation from debt to equity,
285–6Rugman, Alan R., 12
Sarbanes–Oxley Act, 20Scholes, Myron, 111Security market line, 477Selection of optimal portfolio,
410–11Semistrong-form efficiency, 202September 11, 2001 attacks, 7Services, 58Settlement risk, 270Shareholder activism, 20Short position, 153Siam Cement PCL, 9Sight draft, 322Simple barter, 327Smithsonian Agreement, 89Snake within a tunnel, 98Society for Worldwide Interbank
Financial Telecommunication(SWIFT), 298
Sources and uses of funds, 55–6Sovereign risk, 270Sovereign-government bond rating,
312–13Soviet Union, 6Special drawing rights (SDRs), 62,
97Specialization and trade, 31Speculating in the call options
market, 163–4Speculation in the foreign-exchange
market, 127Speculation in the futures market,
154Speculator, 150Spot exchange rate, 120–5Spot rate, 203Spread trading, 157Standard & Poor’s (S&P), 312Standard deviation, 401Stock market alliances, 281–2
Stock market concentration, 282–3Straight bill of lading, 322Straight bond, 279Strategic alliance, 354Strike price, 112, 159Strong-form efficiency, 202Swap, 178Swap bank, 183Swap broker, 183Swap dealer, 183Swap market, 179–80Swap market, growth of, 182Swap market hedge, 228Swaption, 186Switch trade, 328Syndicated loan, 306–7Synergistic effects, 34, 437Systematic risk, 401
Tariff, 36, 500Tax arbitrage, 373Tax burden, 501–2Tax haven, 505Tax incentives for foreign
investment, 504–5Tax morality, 500–1Tax neutrality, 502Tax treaty, 502Taxes, types of, 499–500Technical analysis, 202Temporal method, 245Tender offer, 433Thai crisis, 301Theory of comparative advantage,
30–2Theory of factor endowments, 32Theory of interest rate parity,
133–4Theory of purchasing power parity
(PPP), 129–30, 202Three Cs of central banking, 271Three-point arbitrage, 137–8TIAA-CREF, 3Time draft, 322Time value, 161Trade acceptance, 331Trade barrier, 36Trade deficit, 70–1Trade financing, 321Trading bloc, 39
Transaction exposure, 224Transaction exposure management,
226–33Transfer pricing, 252Transfer pricing objectives, 506–7Transit float, 383Translation exposure, 244–60Translation of foreign-currency
financial statements, 249–50Translation rules, 244–7Transfer price, 376Treasury bill, 268Triffin, Robert, 103Trust receipts, 333Two-point arbitrage, 137
Unbundling fund adjustments, 381
Unconfirmed letter of credit, 324Universal bank, 273Unsecured short-term loan, 350Unsystematic risk, 401Uruguay, 50US–China trade relations, 74–6US Export–Import Bank, 319, 338,
361Usance draft, 322
Valuation, 18Value-added tax, 500Volatility, 162
Weak-form efficiency, 201Wealth maximization, 8–9Weighted average cost of capital,
476–80Western Mining, 241Wider band, 103Withholding tax, 500Working capital management, 200,
370World balance of payments, 64–5World Bank Group, 357–8World Bank, 310, 316–17World Trade Organization, 38,
49–52World’s largest finance companies,
295–6
Zero-coupon bond, 280
