global crisis and india - icrier | indian council for …icrier.org/pdf/mathew joseph_new.pdf5...
TRANSCRIPT

1
Global Crisis and IndiaMathew Joseph
Debosree BanerjeePankaj Vashisht
International Conference
Global Economic Downturn: Lessons and Way Forward
New Delhi
9-10 February 2009

2
Roots of Global Crisis• Global macroeconomic imbalances
– Results in huge cross-border capital flows from surplus to deficit countries
– International financial system failed to intermediate these flows properly
• Lending to sub-prime borrowers/ imprudent credit expansion
– Debt crisis of 1980s, East Asian crisis of late 1990s and the present global crisis
– Current one the severest and the impact so vast and widespread
3
-1.425.15.915.44.87.611.3-10.1-3.8-5.3-6.22007
-1.127.99.517.33.96.19.4-8.9-3.4-6.0-5.32006
-1.328.71116.33.65.27.2-7.4-2.6-5.9-5.82005
0.120.810.112.73.74.73.6-5.3-2.1-5.3-6.12004
1.513.18.212.33.22.02.8-3.5-1.6-4.8-5.32003
1.46.38.412.62.92.02.4-3.3-1.7-4.4-3.72002
0.35.111.116.12.101.3-3.9-2.1-3.8-2.02001
-1.07.618152.6-1.71.7-4.0-2.6-4.3-3.82000
-1.6-3.72.23.62.1-1.20.2-0.3-1.2-1.5-5.21995
IndiaSaudi ArabiaRussiaNorwayJapanGermanyChinaSpainUKUSAustralia
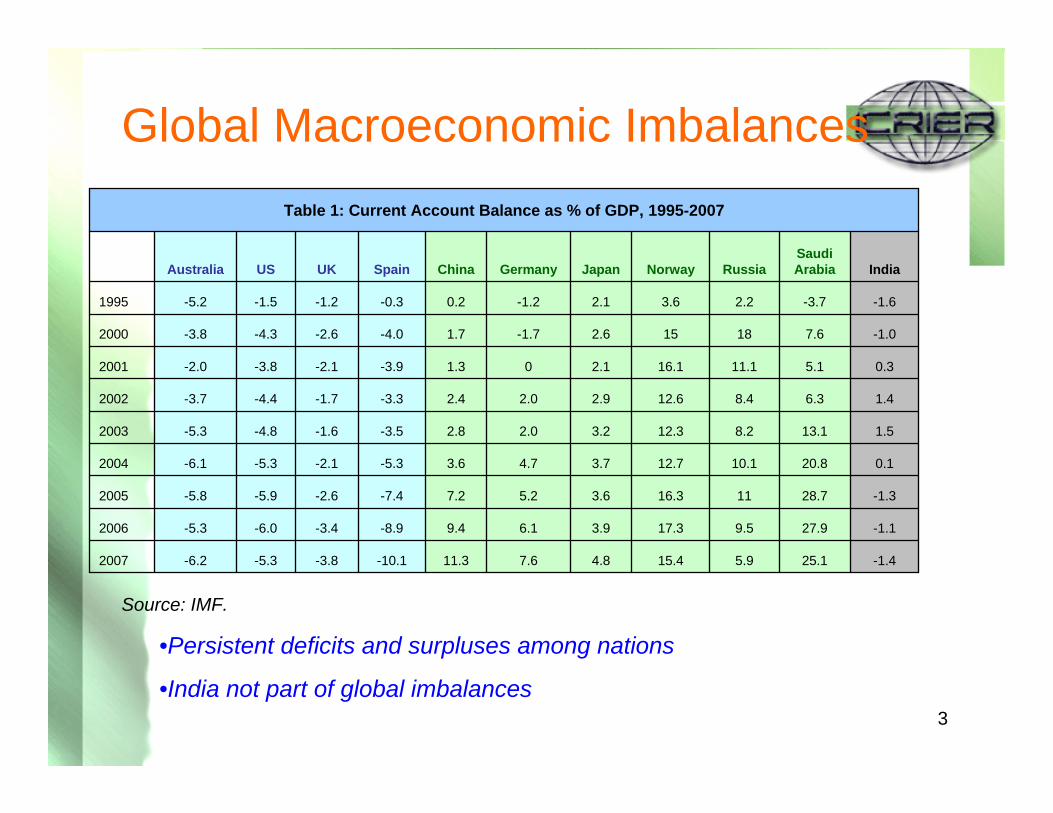
Table 1: Current Account Balance as % of GDP, 1995-2007
•Persistent deficits and surpluses among nations
•India not part of global imbalances
Global Macroeconomic Imbalances
Source: IMF.
4
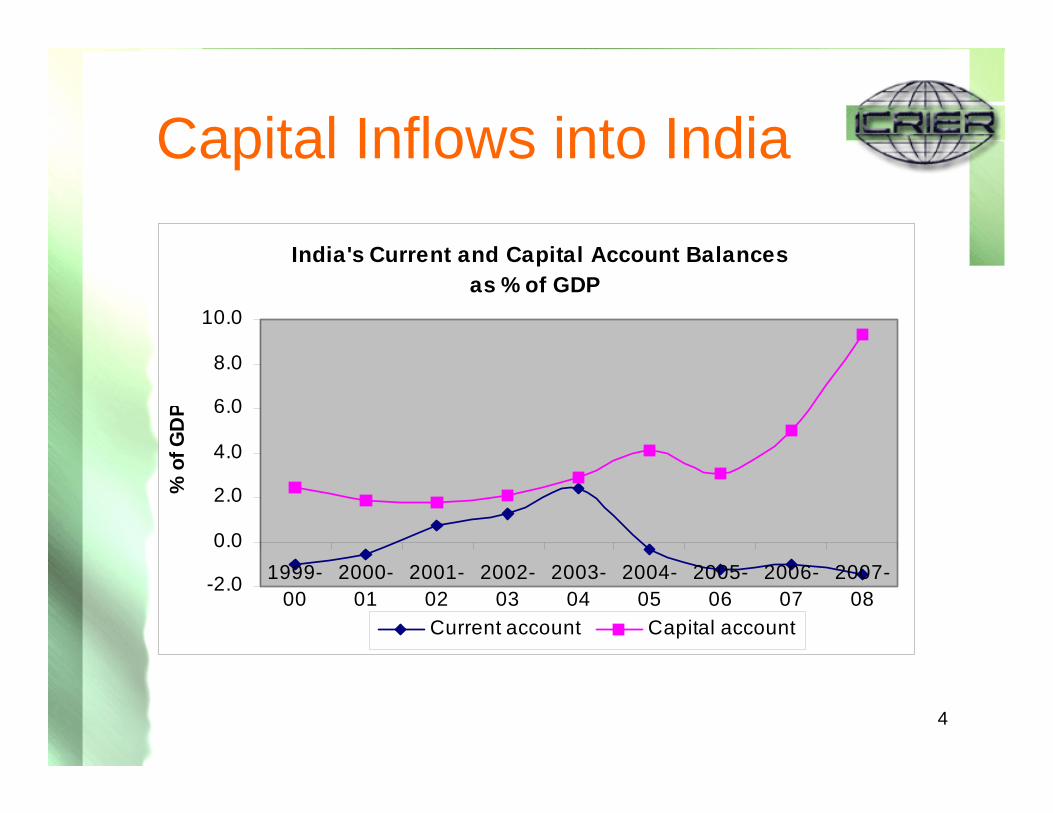
Capital Inflows into India
India's Current and Capital Account Balances as % of GDP
-2.0
0.0
2.0
4.0
6.0
8.0
10.0
1999-00
2000-01
2001-02
2002-03
2003-04
2004-05
2005-06
2006-07
2007-08
% o
f GD
P
Current account Capital account

5
India’s Reserve Build-upInd ia 's Fore ign Ex cha nge Re se rve s (US $ Bill ion )
38.0 42.354.1
76.1
113.0
141.5 151.6
199.2
309.7
0.0
50.0
100.0
150.0
200.0
250.0
300.0
350.0
1999-00 2000-01 2001-02 2002-03 2003-04 2004-05 2005-06 2006-07 2007-08
Turned out to be building up a war chest!

6
Huge Stock Market RallyB S E S e n s e x (1 9 7 8 -7 9 = 1 0 0 )
0
5 0 0 0
10 0 0 0
15 0 0 0
2 0 0 0 0
2 5 0 0 0
Stock index rising from an average 5500 during 2004 to over 20,000 in January 2008

7
Remarkable Growth PerformanceGDP Growth Rates, 1997-98 to 2007-08 (Per cent)
2.0
3.0
4.0
5.0
6.0
7.0
8.0
9.0
10.0
11.0
1997-98
1998-99
1999-00
2000-01
2001-02
2002-03
2003-04
2004-05
2005-06
2006-07
2007-08
Lifted to a new high growth trajectory

8
Overheating of Indian Economy
Note: HP filter technique as proposed by Hodrick and Prescott (1997)
GDP growth above potential rate in recent years
Inflation above 5 per cent from 2003-04
9
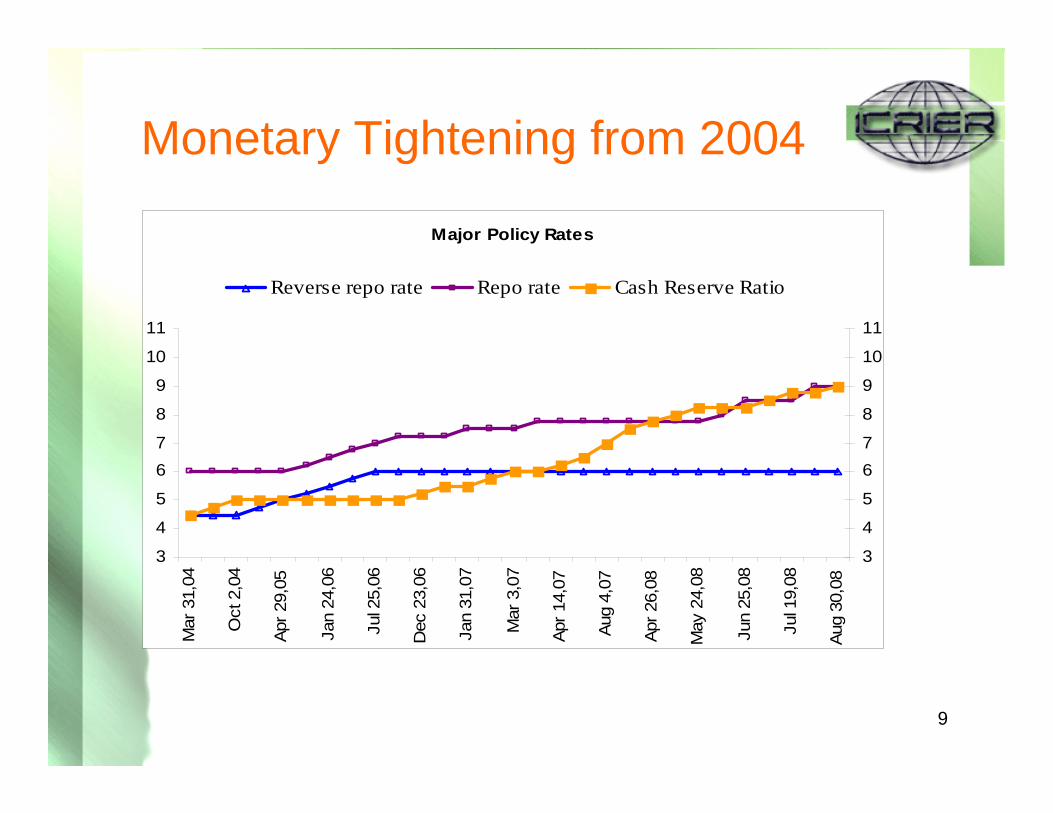
Monetary Tightening from 2004
Major Policy Rates
3
4
5
67
8
9
10
11
Mar
31,
04
Oct
2,0
4
Apr 2
9,05
Jan
24,0
6
Jul 2
5,06
Dec
23,
06
Jan
31,0
7
Mar
3,0
7
Apr 1
4,07
Aug
4,07
Apr 2
6,08
May
24,
08
Jun
25,0
8
Jul 1
9,08
Aug
30,0
8
3
4
5
67
8
9
10
11
Reverse repo rate Repo rate Cash Reserve Ratio

10
Soft-landing of Indian Economy
Cyclical Slowdown of GDP Growth from Q3 2007-08
0.0
2.0
4.0
6.0
8.0
10.0
12.0
Q1 Q2 Q3 Q4 Q1 Q2 Q3 Q4 Q1 Q2 Q3 Q4 Q1 Q2 Q3 Q4 Q1 Q2 Q3 Q4 Q1 Q2 Q3 Q4 Q1 Q2
2002-03 2003-04 2004-05 2005-06 2006-07 2007-08 2008-09

11
Global Crisis
12
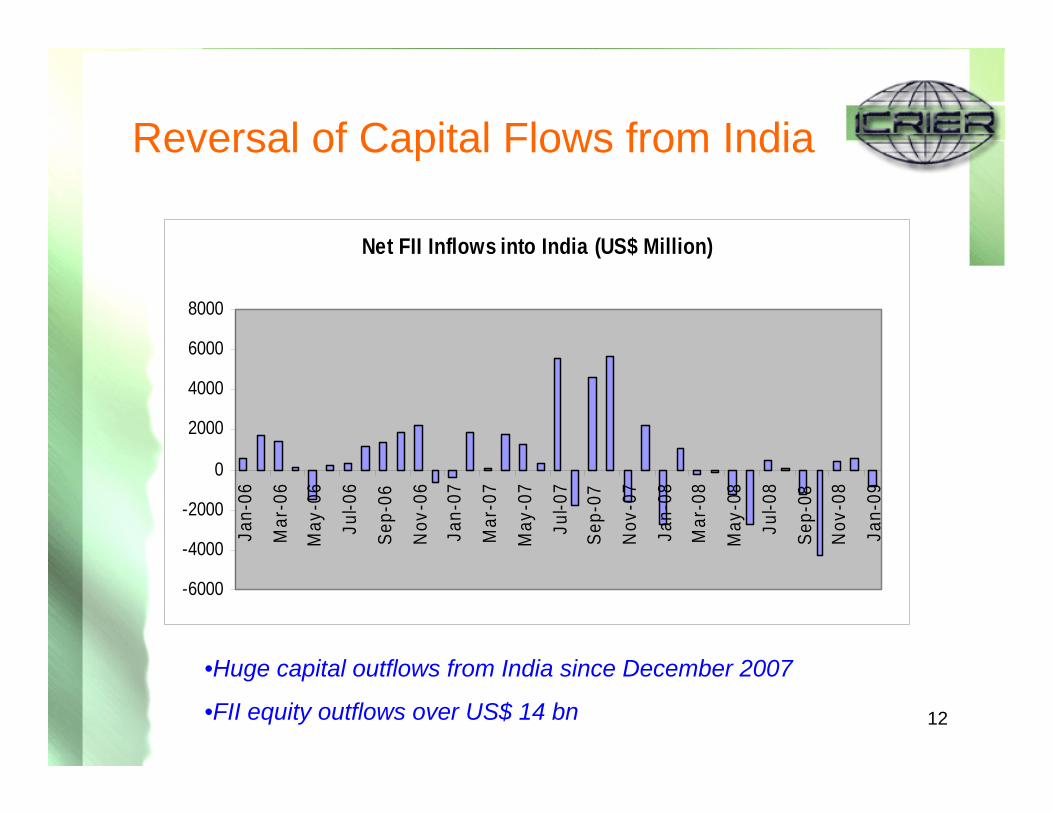
Reversal of Capital Flows from India
•Huge capital outflows from India since December 2007
•FII equity outflows over US$ 14 bn
Net FII Inflows into India (US$ Million)
-6000
-4000
-2000
0
2000
4000
6000
8000
Jan-
06
Mar
-06
May
-06
Jul-0
6
Sep-
06
Nov
-06
Jan-
07
Mar
-07
May
-07
Jul-0
7
Sep-
07
Nov
-07
Jan-
08
Mar
-08
May
-08
Jul-0
8
Sep-
08
Nov
-08
Jan-
09
13
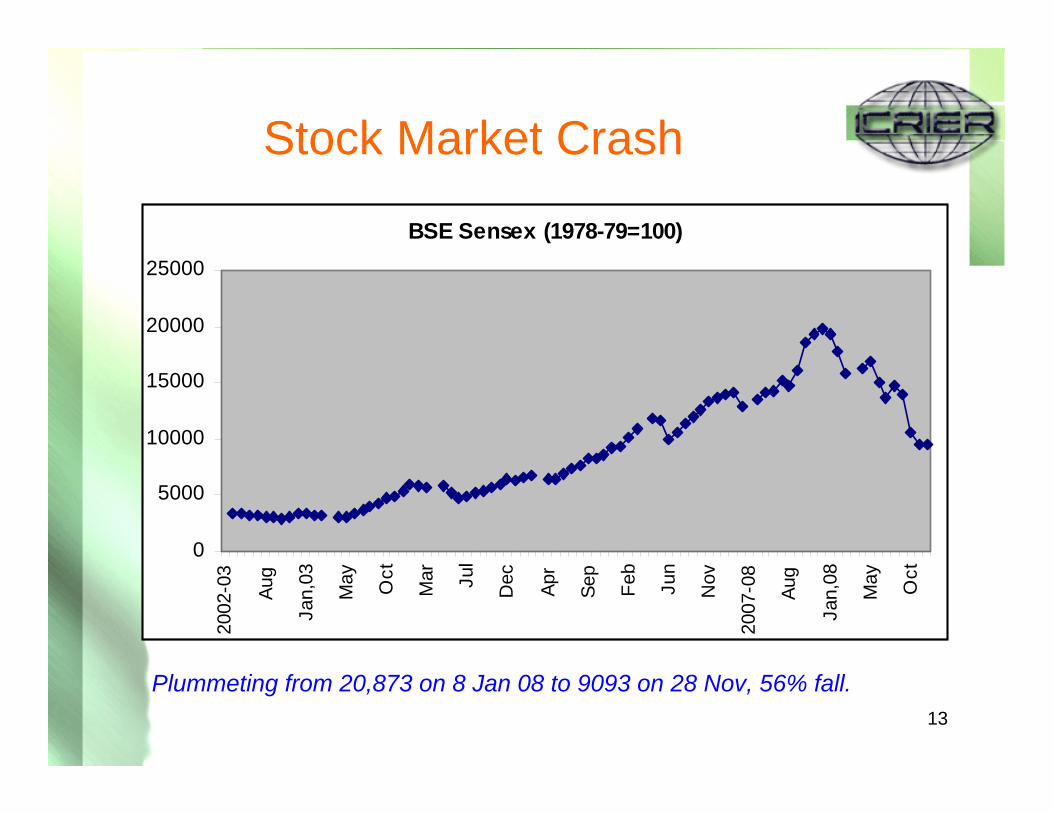
Stock Market Crash
BSE Sensex (1978-79=100)
0
5000
10000
15000
20000
25000
2002
-03
Aug
Jan,
03
May Oct
Mar Ju
l
Dec Apr
Sep
Feb
Jun
Nov
2007
-08
Aug
Jan,
08
May Oct
Plummeting from 20,873 on 8 Jan 08 to 9093 on 28 Nov, 56% fall.
14
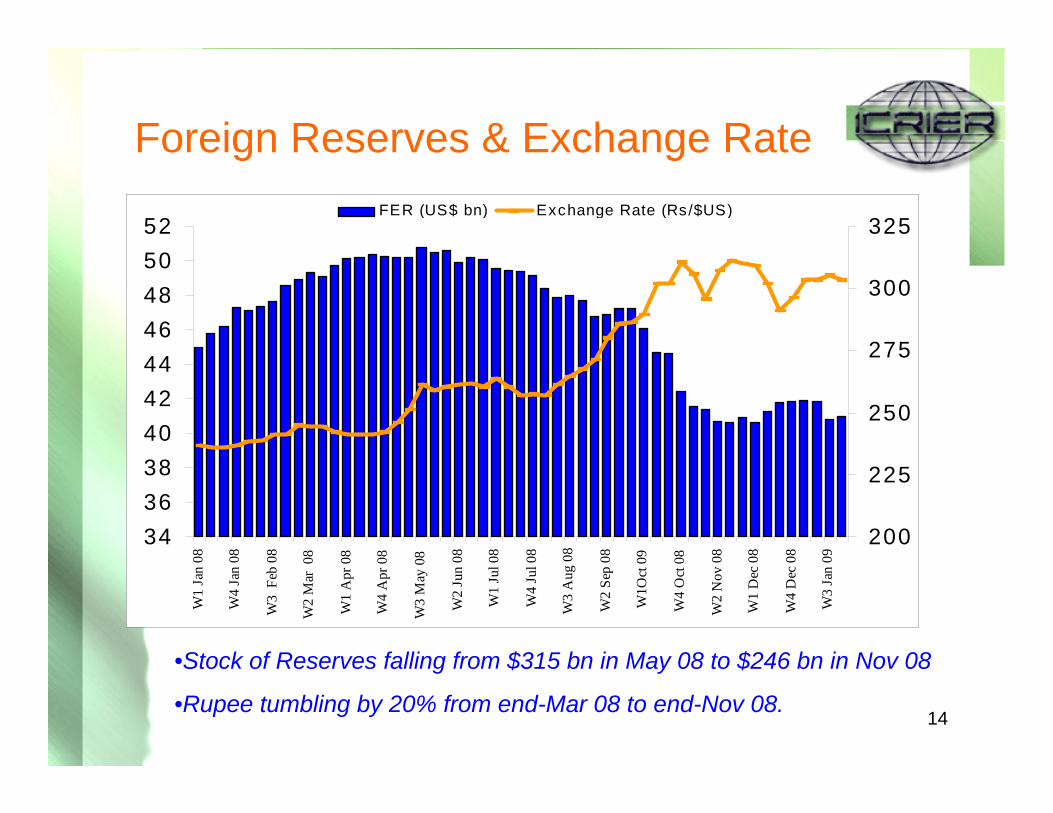
Foreign Reserves & Exchange Rate
•Stock of Reserves falling from $315 bn in May 08 to $246 bn in Nov 08
•Rupee tumbling by 20% from end-Mar 08 to end-Nov 08.
34363840424446485052
W1
Jan
08
W4
Jan
08
W3
Feb
08
W2
Mar
08
W1
Apr
08
W4
Apr
08
W3
May
08
W2
Jun
08
W1
Jul 0
8
W4
Jul 0
8
W3
Aug
08
W2
Sep
08
W1O
ct 0
9
W4
Oct
08
W2
Nov
08
W1
Dec
08
W4
Dec
08
W3
Jan
09
200
225
250
275
300
325FER (US$ bn) Exchange Rate (Rs/$US)

15
Liquidity Crisis
Inter-bank call money rate spiking to 20% in October 08

16
Credit Crunch to Low Credit Demand
•In September and October 08, bank finance (loans & investments) rose to compensate for drying up funds from domestic and foreign capital markets
•In November 08 onwards, bank finance expansion sharply lower as demand has fallen; and bank finance turned negative in Jan 09.
Expansion of Bank Finance to Commercial Sector (Rs crore)
-50000
0
50000
100000
Apr May Jun Jul Aug Sep Oct Nov Dec Mid-Jan
2007-08 2008-09
17
Aggressive Policy Response
• RBI loosening cost and availability of liquidity in a series of steps from mid-September 08

18
RBI Policy Rate ChangesMajor Policy Rates
3
4
5
6
7
8
9
10
11
Apr
14,
07
Aug
4,0
7
Apr
26,
08
May
24,
08
Jun
25,0
8
Jul 1
9,08
Aug
30,
08
Oct
20,
08
Nov
3,0
8
Dec
8,0
8
Jan
17,0
9
3
4
5
6
7
8
9
10
11
Reverse repo rate Repo rate Cash Reserve Ratio
•Cash reserve ratio (CRR) brought down from 9% to 5%•Statutory liquidity ratio (SLR) from 25% to 24%•Repo rate reduced from 9% to 5.5% & reverse repo rate from 6% to 4%•Special window for banks in their lending to mutual funds, NBFCs and housing finance companies•Refinance facility for banks from the central bank & dollar swap arrangements, etc.
19
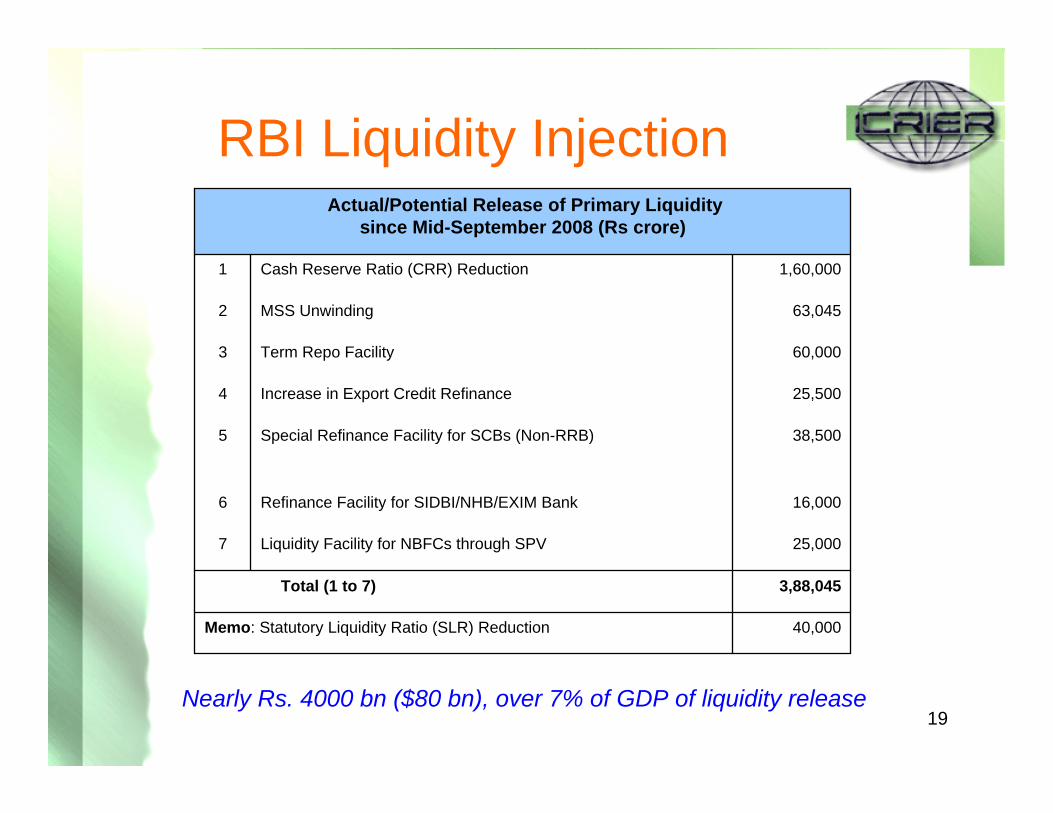
RBI Liquidity Injection
40,000Memo: Statutory Liquidity Ratio (SLR) Reduction
3,88,045Total (1 to 7)
25,000Liquidity Facility for NBFCs through SPV7
16,000Refinance Facility for SIDBI/NHB/EXIM Bank6
38,500Special Refinance Facility for SCBs (Non-RRB)5
25,500Increase in Export Credit Refinance4
60,000Term Repo Facility3
63,045MSS Unwinding2
1,60,000Cash Reserve Ratio (CRR) Reduction1
Actual/Potential Release of Primary Liquidity since Mid-September 2008 (Rs crore)
Nearly Rs. 4000 bn ($80 bn), over 7% of GDP of liquidity release
20
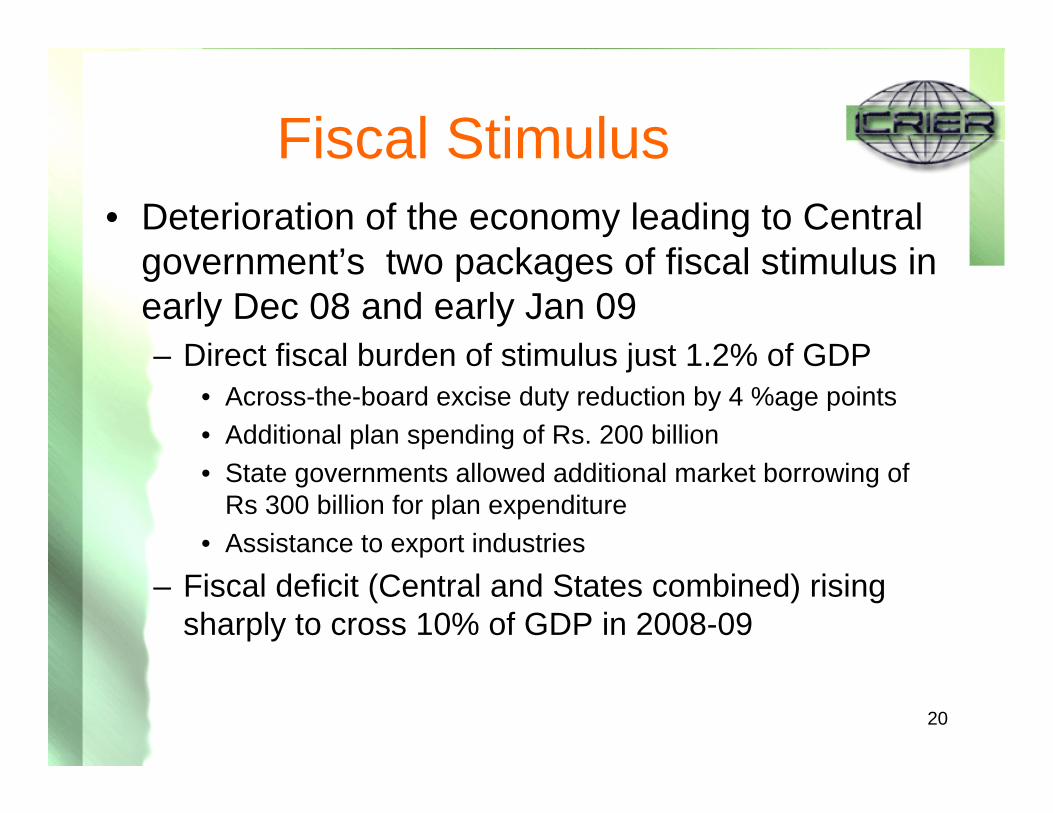
Fiscal Stimulus• Deterioration of the economy leading to Central
government’s two packages of fiscal stimulus in early Dec 08 and early Jan 09– Direct fiscal burden of stimulus just 1.2% of GDP
• Across-the-board excise duty reduction by 4 %age points• Additional plan spending of Rs. 200 billion• State governments allowed additional market borrowing of
Rs 300 billion for plan expenditure• Assistance to export industries
– Fiscal deficit (Central and States combined) rising sharply to cross 10% of GDP in 2008-09

21
Sharp Real Sector deterioration from September 2008
Source: CSO, Ministry of Commerce, CMIE and Economic Times.
(2520 companies)
-25.6-25.44.77.121.2Corporate profit
13.334.631.424.018.5Corporate sales
7.67.98.88.8Real GDP
Q3 08-09Q2 08-09Q1 08-09Q4 07-08Q3 07-08
-18.6-3.5-4.626.025.0Central government tax revenue
-7.7-14.0-0.8Airport passenger traffic
-58.2-48.0-34.9-0.63.9Commercial vehicle sales
-4.6-5.71.18.7Major ports traffic
3.11.3-0.18.28.6Railway freight traffic
-16.18.86.110.643.337.7Imports
-22.3-1.1-9.9-12.110.435.1Exports
2.4-0.35.54.8Industry
Jan-09Dec-08Nov-08Oct-08Sep-08Apr-Aug 08
Growth in Selected Economic Indicators (% Change, Y-O-Y)

22
Growth Prospects: 2008-09 and 2009-10

23
GDP Forecasts
• Methodology:– Use of an index of leading economic
indicators (LEI)– Also a external shock in the form of a dummy
variable

24
GDP Forecasts…• LEI Consists of:
– (i) production of machinery and equipment– (ii) non-food credit– (iii) railway freight traffic– (iv) cement sales – (v) net sales of the corporate sector – (vi) fuel and metal prices – (vii) real rate of interest – (viii) BSE sensex and – (ix) exports
25
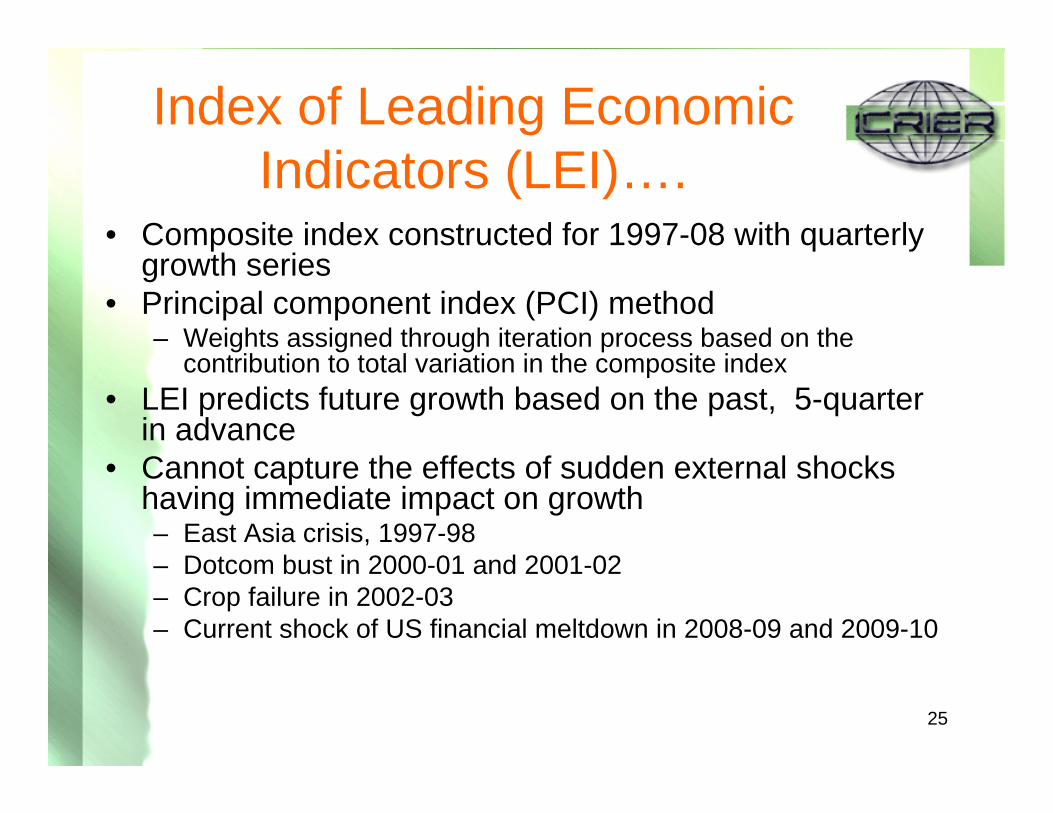
Index of Leading Economic Indicators (LEI)….
• Composite index constructed for 1997-08 with quarterly growth series
• Principal component index (PCI) method– Weights assigned through iteration process based on the
contribution to total variation in the composite index• LEI predicts future growth based on the past, 5-quarter
in advance• Cannot capture the effects of sudden external shocks
having immediate impact on growth– East Asia crisis, 1997-98– Dotcom bust in 2000-01 and 2001-02– Crop failure in 2002-03 – Current shock of US financial meltdown in 2008-09 and 2009-10

26
External Shocks & India’s GDP Growth
GDP Growth Rates, 1992-93 to 2007-08 (Per cent)
0.0
2.0
4.0
6.0
8.0
10.0
12.0
GDP 5.4 5.7 6.4 7.3 8.0 4.3 6.7 6.4 4.4 5.8 3.8 8.5 7.5 9.5 9.7 9.0
1992-93
1993-94
1994-95
1995-96
1996-97
1997-98
1998-99
1999-00
2000-01
2001-02
2002-03
2003-04
2004-05
2005-06
2006-07
2007-08
East Asia crisis
Dotcom bust Crop
failure
27
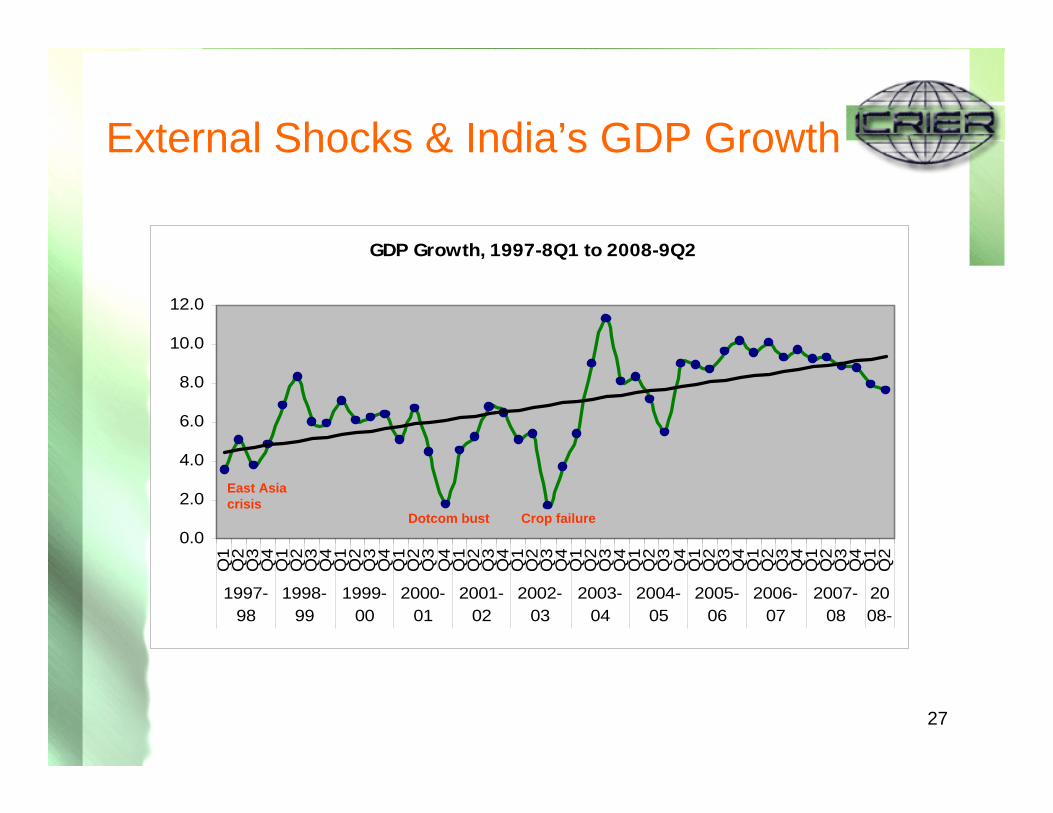
External Shocks & India’s GDP Growth
GDP Growth, 1997-8Q1 to 2008-9Q2
0.0
2.0
4.0
6.0
8.0
10.0
12.0
Q1
Q2
Q3
Q4
Q1
Q2
Q3
Q4
Q1
Q2
Q3
Q4
Q1
Q2
Q3
Q4
Q1
Q2
Q3
Q4
Q1
Q2
Q3
Q4
Q1
Q2
Q3
Q4
Q1
Q2
Q3
Q4
Q1
Q2
Q3
Q4
Q1
Q2
Q3
Q4
Q1
Q2
Q3
Q4
Q1
Q2
1997-98
1998-99
1999-00
2000-01
2001-02
2002-03
2003-04
2004-05
2005-06
2006-07
2007-08
2008-
East Asia crisis
Dotcom bust Crop failure

28
Projection of Growth Rate through Index of Leading Indicators & a Shock Variable
The estimated equation for GDP growth forecast, given below, is satisfactory with adjusted R-square value of 0.58 and all the co-efficients significant at 99% level.
GrGDP = 7.98 + 1.11 LEI (-5) - 4.15 Dummy(3.36) (-7.26)
Dotcom bust Crop
failure
29
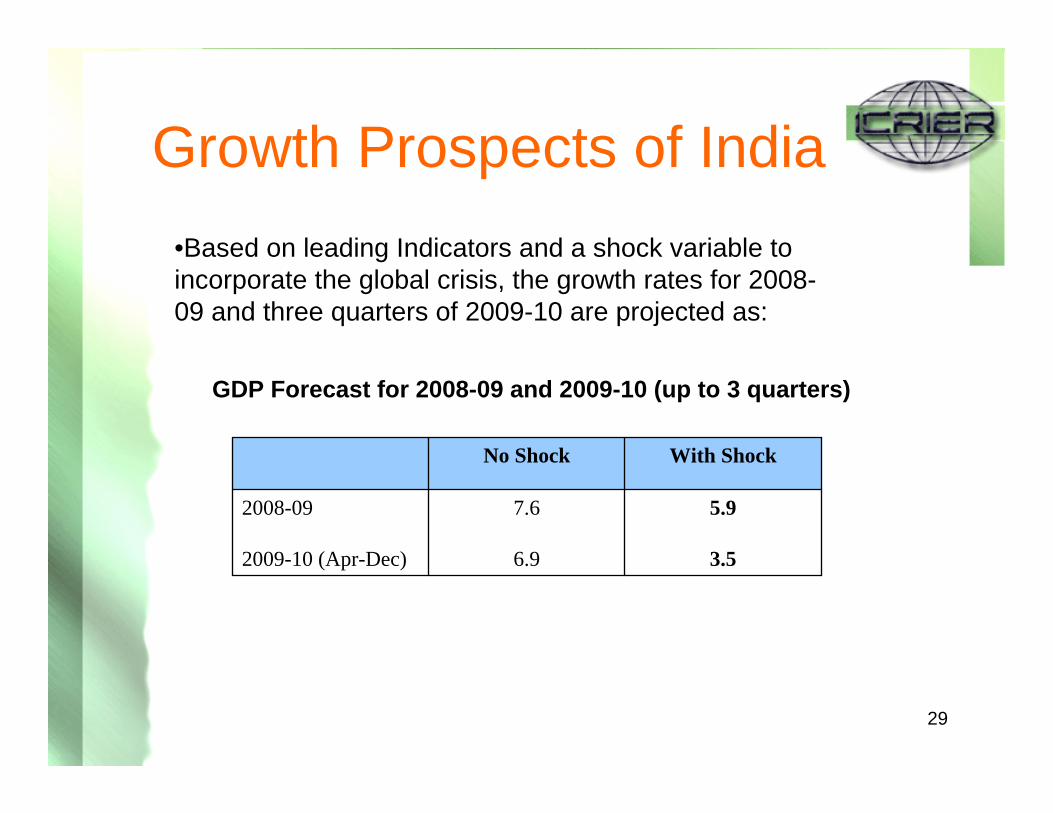
Growth Prospects of India
GDP Forecast for 2008-09 and 2009-10 (up to 3 quarters)
•Based on leading Indicators and a shock variable to incorporate the global crisis, the growth rates for 2008-09 and three quarters of 2009-10 are projected as:
5.9
3.5
7.6
6.9
2008-09
2009-10 (Apr-Dec)
With ShockNo Shock

30
Concluding Remarks• India is seriously affected by the global crisis• Growth to be brought down sharply but not to
the extent of making it below zero• Soundness of banking and cautious capital
account opening has saved the country• Recovery possible in late 2009-10 or early 2010-
11 provided the government is able to push through massive investment in social and physical infrastructure through public-private participation

31
Thank You.

32
Deepening Global Integration(Current Account & Capital Account as % GDP)
•Current account transactions rising from less than 20% of GDP to 50% •Both current and capital account transactions from less than a third of GDP to over 115%