global economy: its impact on turkey and mediterranean region
TRANSCRIPT

Republic of Turkey Prime Ministry
Investment Support & Promotion Agency of Turkey (ISPAT)
Global Economy: Its Impact on
and Mediterranean
Necmettin KAYMAZ
Chief Project Director
Turkey 2nd Polyolefins Conference, 28 April 2015, Gaziantep

AGENDA
Overview of Global Economy
Recent Developments’ Impact on Global Economy
Impact on the Mediterranean Economies
Impact on Turkish Economy

Investment Support & Promotion Agency of Turkey
Established in 2006 to increase & attract direct investment
Attached to the Prime Ministry & directly report to the PM
Private sector approach with public sector capabilities
ONE STOP SHOP approach
Providing extensive services:
Coordination with relevant governmental institutions
Market information and analyses
Site selection
Matchmaking potential partners
Facilitating legal procedures, such as:
-Company set-up; incentive applications; work permits

Investment Support & Promotion Agency of Turkey
The International Network

Overview of Global Economy

Source: IMF
Global economy has been on constant growth since 1980 despite volatile growth rates and the global financial crisis which almost brought it to a halt in 2009..
Global economy expanded 3,4% in
2014 and is expected to grow
3,5% in 2015
100
150
200
250
300
350
400
19
80
19
85
19
90
19
95
20
00
20
05
20
10
20
15
20
20
World Economy, Real GDP Index (1980=100)
forecast
0%
1%
2%
3%
4%
5%
6%
1980 1985 1990 1995 2000 2005 2010 2015 2020
World Economy, Real GDP Growth Rates (%)
2016-2020:
3.9% CAGR

Source: IMF
World economy is expected to reach almost $150 trillion by 2020, up from $108 trillion in 2014..
13
14
15
17
18
19
20
21
23
25
27
28
32
34
35
38
40
42
44
46
49
51
54
57
62
67
72
78
82
83
88
94
98
10
3 10
8 11
3 1
18
12
5 1
33
14
1
14
9
0
10
20
30
40
50
60
70
80
90
100
110
120
130
140
150World GDP
(PPP, $Trillion)
f o r e c a s t

Source: IMF
Emerging and developing markets have been and will continue to be the main source of growth in the world economy despite slowdown…
61,7
107,9
149,4
33,0
29,3
13,2
12,2
-10
10
30
50
70
90
110
130
150
2004 2005-2014 2014 2015-2020 2020
Emerging & Developing Economies Advanced Economies
World Economy, GDP at PPP ($ Trillion)
Over the next 6 years, world output will
increase $41,5 trillion, more than 70% of
growth will come from emerging & developing
economies

Source: IMF
f o r e c a s t
25%
50%
75%
19
80
19
81
19
82
19
83
19
84
19
85
19
86
19
87
19
88
19
89
19
90
19
91
19
92
19
93
19
94
19
95
19
96
19
97
19
98
19
99
20
00
20
01
20
02
20
03
20
04
20
05
20
06
20
07
20
08
20
09
20
10
20
11
20
12
20
13
20
14
20
15
20
16
20
17
20
18
20
19
20
20
Emerging & Developing economies
Advanced economies
57%
43%
61%
39%
The gravity of global economy has been shifting towards emerging & developing economies whose share in the world economy has been gradually increasing….
Breakdown of World Economy, GDP at PPP, %

Source: BBVA Research, IMF and Quah D., 2011, “The Global Economy’s Shifting Centre of Gravity”.
Shifting the economic center of gravity from the Atlantic to the Pacific area
Global growth will be concentrated in the Asia-Pacific region, which will account for 76.5% of the increase in GDP between 2014 and 2024..

Recent Developments’ Impact
on
Global Economy

World economy will be affected by various developments…
Source: IMF

Source: IMF
The sharp fall in oil prices will spur global growth, but not enough to offset other
negative factors..
Source: IMF

Oil prices have drastically decreased in recent months and are expected to rebound over the next couple of years..
58
74
0
10
20
30
40
50
60
70
80
90
100
110
1980
1981
1982
1983
1984
1985
1986
1987
1988
1989
1990
1991
1992
1993
1994
1995
1996
1997
1998
1999
2000
2001
2002
2003
2004
2005
2006
2007
2008
2009
2010
2011
2012
2013
2014
2015
2016
2017
2018
2019
2020
Annual Oil Price* (US$ per barrel) F o r e c a s t
Source: IMF, *Crude Oil (petroleum), simple average of three spot prices; Dated Brent, West Texas Intermediate, and the Dubai Fateh
CAVEAT: Oil prices may rebound sooner than expected…
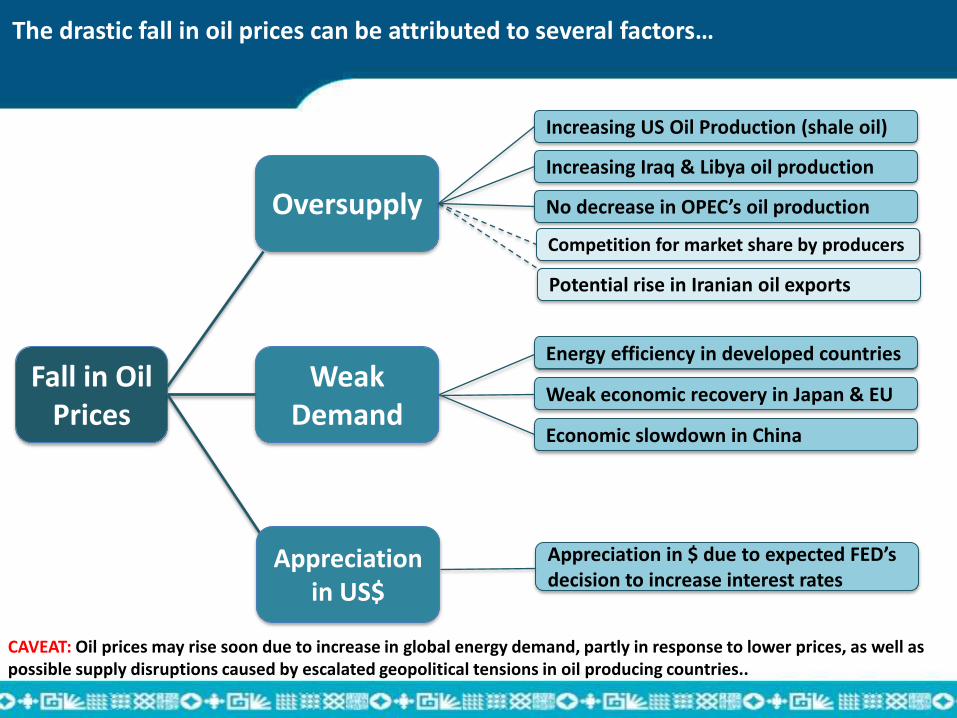
The drastic fall in oil prices can be attributed to several factors…
CAVEAT: Oil prices may rise soon due to increase in global energy demand, partly in response to lower prices, as well as possible supply disruptions caused by escalated geopolitical tensions in oil producing countries..
Fall in Oil Prices
Oversupply
Weak Demand
Increasing US Oil Production (shale oil)
Increasing Iraq & Libya oil production
No decrease in OPEC’s oil production
Energy efficiency in developed countries
Weak economic recovery in Japan & EU
Economic slowdown in China
Appreciation in $ due to expected FED’s decision to increase interest rates
Competition for market share by producers
Potential rise in Iranian oil exports
Appreciation in US$
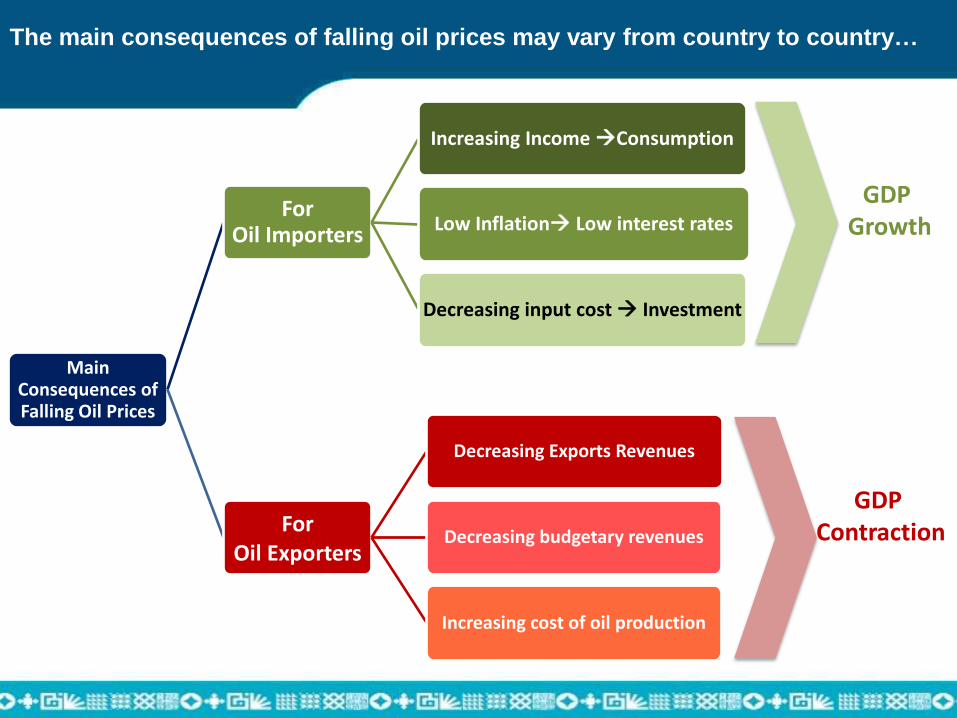
The main consequences of falling oil prices may vary from country to country…
Main Consequences of Falling Oil Prices
For Oil Importers
Increasing Income Consumption
Low Inflation Low interest rates
Decreasing input cost Investment
For Oil Exporters
Decreasing Exports Revenues
Decreasing budgetary revenues
Increasing cost of oil production
GDP Growth
GDP Contraction

The falling oil prices will have both negative and positive impact on economies across the world with varying degrees according to the level of their dependency on oil…
Energy dependency, Oil imports/exports* as % of GDP 2010-13 average
Source: UNCTAD, The Economist *Including petroleum products such as refined oil or kerosene, †Net imports/exports of less than 0.1% of GDP

Source: Oxford Economics / Haver Analytics
The impact of falling oil prices on GDP growth could be somewhere between 0.4% and 0.7%...

The low oil prices will have positive and negative impacts on various sectors across the world..
STRONG
NEGATIVE
MILD
NEGATIVE
NO
EFFECT
MILD
PORSITIVE
MODERATE
POSITIVE
STRONG
POSITIVE
Building Materials
(Proppant) Aerospace
Refining &
marketing
Paper/Forest
products Autos Airlines
Exploration &
Production
Regulated
utilities & power
producers (Europe)
Regulated
utilities & power
producers (Asia)
Regulated
utilities & power
producers (US)
Building Materials
(ex proppant) Protein / Food
Oilfield Services Gaming (Asia) Gaming (US) Chemicals Shipping
Steel
(oil country
tubular goods)
Steel
(ex oil country
tubular goods)
Mining
(Base Metals &
Coal)
Consumer
Durables
Lodging Cruise
Manufacturing Restaurants
Surface
Transportation
Homebuilding
(US)
Theme Parks
(US) Retail
Overall impact of low oil prices on global corporate sectors
Source: Moody’s Investors Service

Impact on the Mediterranean Economies

Developing countries in the Mediterranean region will have robust economic growth, while the developed economies in the region will struggle to sustain growth..
5,1
4,6 4,3
4,2
3,6 3,5 3,4
3,2 3,1 3,1 3,0
2,7
1,9 1,9 1,6 1,6 1,5
1,0
Mo
rocc
o
Egyp
t
Tun
isia
Alb
ania
Alg
eria
Turk
ey
Bo
snia
Leb
ano
n
Isra
el
Mo
nte
neg
ro
Gre
ece
Mal
ta
Spai
n
Slo
ven
ia
Fran
ce
Sou
th C
ypru
s
Cro
atia
Ital
y
Source: IMF
11,9 Li
bya
Average Real GDP Growth (%) in Mediterranean Projection for 2015-2020

Source: International Trade Center
Almost all of Mediterranean economies are net energy importers, hence falling oil prices will have a positive impact for the net importers..
-85.000
-65.000
-45.000
-25.000
-5.000
15.000
35.000
55.000
Fran
ce
Ital
y
Spai
n
Turk
ey
Gib
ralt
ar
Isra
el
Mo
rocc
o
Gre
ece
Leb
ano
n
Cro
atia
Slo
ven
ia
Sou
th C
ypru
s
Pal
esti
ne
Bo
snia
Egyp
t
Tun
isia
Mal
ta
Alb
ania
Syri
a
Lib
ya
Alg
eria
2010-2013 Annual Average Trade Balance in Energy Products ($ Million)

While countries on the north of Mediterranean rim are net oil importers, the ones on the south are mainly net exporters with a few exceptions..
Energy dependency Oil imports/exports* as % of GDP 2010-13 average
Source: UNCTAD, The Economist *Including petroleum products such as refined oil or kerosene, †Net imports/exports of less than 0.1% of GDP

Despite positive impact of falling oil prices, the implications for Med countries are mixed..
Oil producing countries are also significant export markets for the Med countries…
The EU, another major export market for the Med countries, will benefit from low oil prices, despite slow recovery…

While the impact of recent global financial crisis on the Middle East & North African (MENA) countries was limited, MENA is still underperforming pre-crisis level…
7,0
3,7 3,8 3,8
0
1
2
3
4
5
6
7
Pre-Crisis 2003-2007 Crisis 2008-2009 Post-Crisis 2010-2014 Forecast 2015-2020
Growth Outlook for MENA, Average Anuual Real GDP Growth Rates (%)
Pre-crisis level: 7%
Source: IMF

EU is still struggling to recover from the financial and debt crises, growth hasn’t reached pre-crisis levels but outlook seems relatively favorable as the growth is expected to double over the next 6 years.
2,7
-1,8
1,0
1,9
-2,0
-1,5
-1,0
-0,5
0,0
0,5
1,0
1,5
2,0
2,5
3,0
Pre-Crisis 2003-2007 Crisis 2008-2009 Post-Crisis 2010-2014 Forecast 2015-2020
Growth Outlook for the EU, Average Anuual Real GDP Growth Rates (%)
Pre-crisis level: 2,7%
Source: IMF

Despite cautious optimistic growth outlook, Med countries may benefit from increasing trade volume in the region..
129
145
100
105
110
115
120
125
130
135
140
145
150
2014 2015 2016 2017 2018 2019 2020
Estimated Volume of Imports of Goods (Index: 2014 = 100)
MENA
Euro Area
Source: IMF

Impact on the Turkish Economy
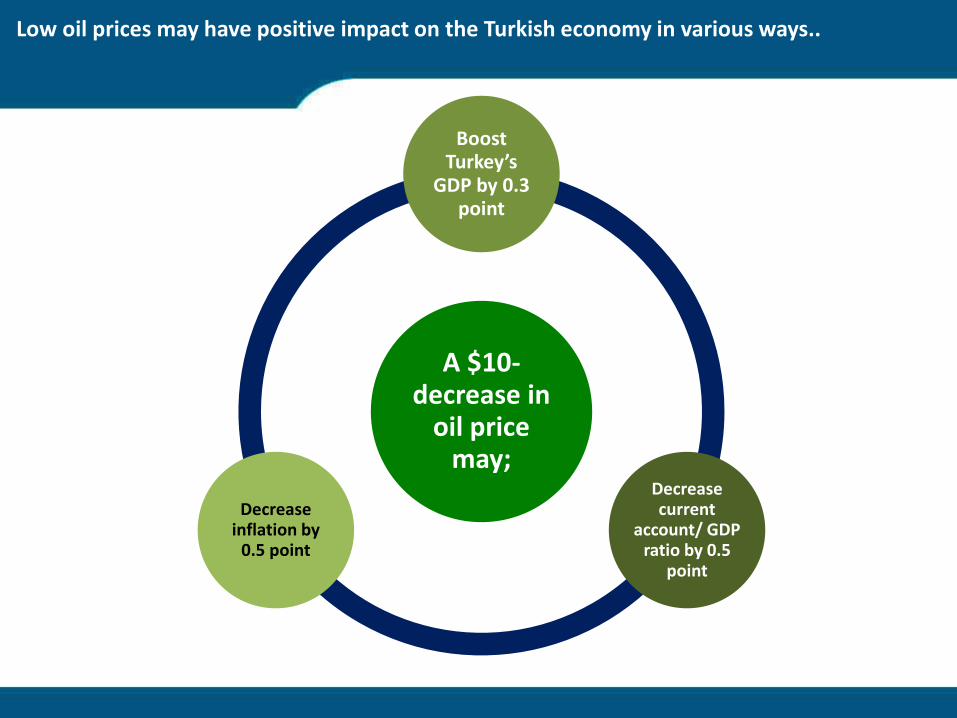
Low oil prices may have positive impact on the Turkish economy in various ways..
A $10-decrease in
oil price may;
Boost Turkey’s
GDP by 0.3 point
Decrease current
account/ GDP ratio by 0.5
point
Decrease inflation by
0.5 point

Source: TurkStat, Treasury
Considering Turkey’s dependence on oil import, it will surely benefit from falling oil prices …
Impact of Energy Prices to Imports of Energy Products ($Billion)
41,7 44,5 43,8
46,2
12,5
15,6 12,1 8,7
38,5
54,2
60,1
55,9 54,9
0
15
30
45
60
2010 2011 2012 2013 2014
Price Effect
Energy Importsfixed to 2010 prices
Actual EnergyImport

Source: TURKSTAT *Coach ticket, airline ticket, intracity transportation, courier services
Considering the oil-related components of the CPI in Turkey, low oil prices may lower inflation as well, but may be offset by pass-through as a result of $$$ appreciation..
Gasoline, Diesel, LPG; 6%
Natural Gas, Electricity; 5% Other
Transportation*; 10%
Others; 79%
Breakdown of CPI (Inflation) Basket in Turkey

Source: TURKSTAT
Export Diversification
Over the past 12 years, Turkey has successfully managed to diversify its exports market and products, hence been able to adjust and make up for the loss during crises in a one of the export markets..
2002 2014
Number of export products with over $1 billion 9 37
Number of export markets with over $1 billion 8 34
Share of top 5 countries (%) 47 31
Share of MENA (%) 13 28,6
Share of North America (%) 10 4,6
Share of EU (%) 57 43

Source: IMF World Economic Outlook April 2014, Eurostat, OECD, TurkStat, OECD Economic Outlook No.95, May 2014
0,8 1,0 1,1 1,1
1,4 1,6 1,6 1,7 1,9
2,5 2,5
3,1 3,2
3,7 3,9 4,0 4,0
4,7
0
1
2
3
4
5
Japan
Fra
nce
Germ
any
EU
28
Hungary UK
Slo
venia
Irela
nd
US
Czech R
ep.
Mexic
o
South
Afr
ica
Bra
zil
Kore
a
Pola
nd
Russia
Slo
vakia
Turk
ey
Average Annual Real GDP Growth (%) 2002-2014 Strong record, bright future
Regardless of the price of oil, Turkey continues to sustain its economic growth trajectory over the next 15 years with robust economic performance..
1,1 1,1
1,4 1,5 1,5
1,6 1,7 1,7 1,9
2,0 2,0 2,1 2,2 2,2 2,2 2,2 2,3 2,4
2,6 2,6 2,6 2,6 2,7 2,9 2,9 2,9
4,2
0
1
2
3
4
Ge
rman
y
Jap
an
Po
rtu
gal
Spai
n
Ital
y
Den
mar
k
Euro
Are
a
Hu
nga
ry
Au
stri
a
Bel
giu
m
Fin
lan
d
Can
ada
Fran
ce
Po
lan
d
OEC
D
Gre
ece
Irel
and
US
Swed
en UK
Slo
vaki
a
Bra
zil
Ru
ssia
Cze
ch R
ep.
Mex
ico
Ko
rea
Turk
ey
Potential Real GDP Growth 2014-2030 (Average Annual, %)

D i s c o v e r t h e P o t e n t i a l
Togetherness
Both East & West
World
Meeting
Harmony
Innovation
Synergy
Growth