global economy quarterly report
TRANSCRIPT

GLOBAL ECONOMY QUARTERLY REPORT
June 2016
Author: Chaerul Ichsan VP Economic Research
Editor: Eduardus Christmas Chairman & CEO Ivana Arinahapsari Chief Operating Officer
Copyright: Christmas Corporation, 2016
Contact: [email protected]
U.S. ECONOMY 1. The Bottom Line
2. The Fed is Dovish
3. Employment
4. Inflation
5. Economic Activity
6. Forward-Looking Indicators
CHINA AND EURO 1. China’s Leverage
2. The ECB Forecast
ALERT NOTE: BREXIT 1. The Result
2. Article 50 of Lisbon Treaty
3. Outlook


Condition and Outlook
Fed policy -‐ Fed is dovish now. Median for the path of interest rate is lower compare to previous forecast.
-‐ Many uncertainties ahead (i.e Brexit and US election) that make Fed will keep their dovish stance for a while.
Inflation -‐ Inflation is still below Fed’s target. Wages pressure is still moderate. -‐ Inflation will pick up in near term, thanks to supply side factors (i.e rebound in
oil price and USD depreciation).
Labor Market -‐ Slower momentum in labor market. NFP is posting lowest single month reading since 2010.
-‐ The ISM business employment index is return to contraction level.
Economic Activity -‐ Leading indicators is showing moderate growth. No sign for contraction yet. -‐ Housing is still good shape (but not a great one).
Risk Events -‐ Many uncertainties ahead (Brexit and US election).
External Economy -‐ Stabilization in China’s economy continue. Deleveraging will continue, holding down the economy growth.
-‐ ECB is dovish due to weak inflation outlook. Imbalances re-‐occur.
THE BOTTOM LINE-‐ Fed is Dovish by revising down its interest rate forecast. -‐ Many uncertainties ahead, Fed will keep its dovish stance for a while.
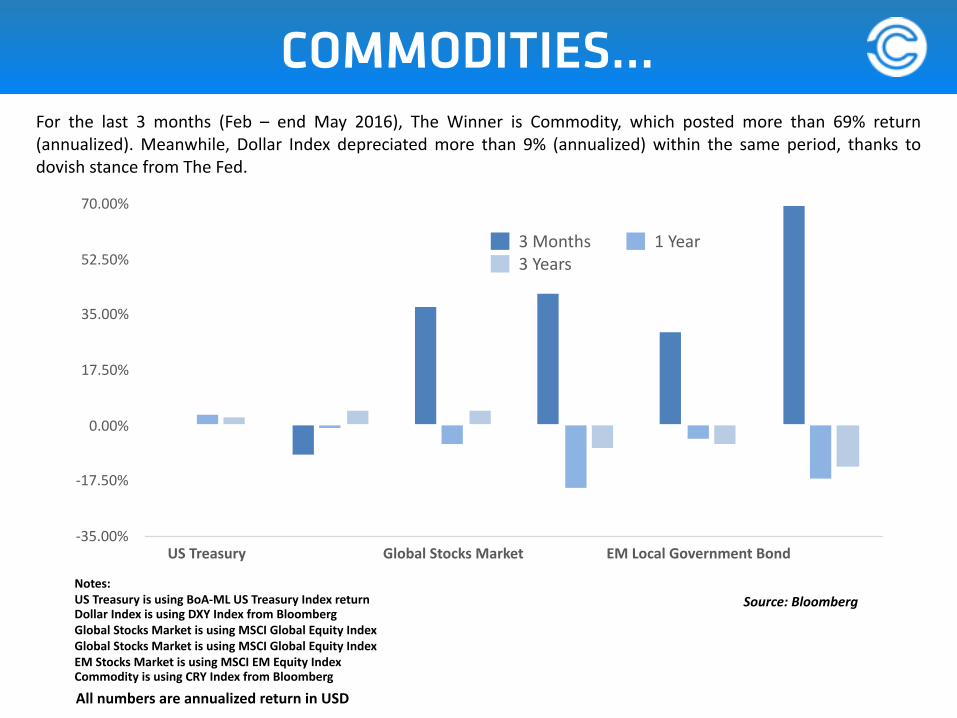
All numbers are annualized return in USD
Notes: US Treasury is using BoA-‐ML US Treasury Index return Dollar Index is using DXY Index from Bloomberg Global Stocks Market is using MSCI Global Equity Index Global Stocks Market is using MSCI Global Equity Index EM Stocks Market is using MSCI EM Equity Index Commodity is using CRY Index from Bloomberg
Source: Bloomberg
-‐35.00%
-‐17.50%
0.00%
17.50%
35.00%
52.50%
70.00%
US Treasury Global Stocks Market EM Local Government Bond
3 Months 1 Year3 Years
For the last 3 months (Feb – end May 2016), The Winner is Commodity, which posted more than 69% return (annualized). Meanwhile, Dollar Index depreciated more than 9% (annualized) within the same period, thanks to dovish stance from The Fed.
COMMODITIES…
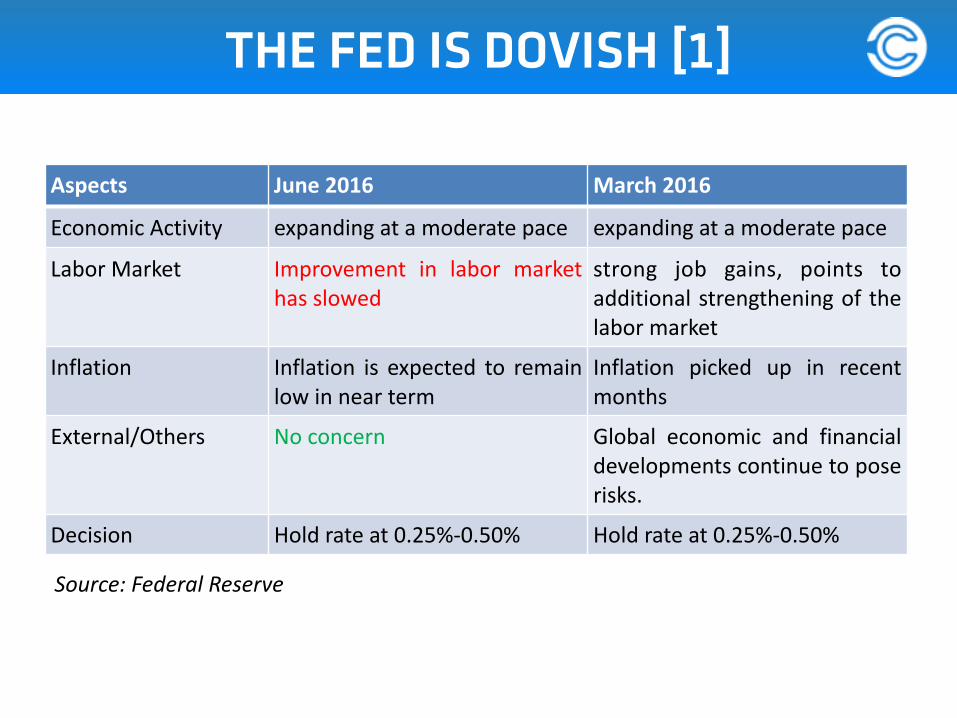
Aspects June 2016 March 2016
Economic Activity expanding at a moderate pace expanding at a moderate pace
Labor Market Improvement in labor market has slowed
strong job gains, points to additional strengthening of the labor market
Inflation Inflation is expected to remain low in near term
Inflation picked up in recent months
External/Others No concern Global economic and financial developments continue to pose risks.
Decision Hold rate at 0.25%-‐0.50% Hold rate at 0.25%-‐0.50%
Source: Federal Reserve
THE FED IS DOVISH [1]
0.00%
1.00%
2.00%
3.00%
4.00%
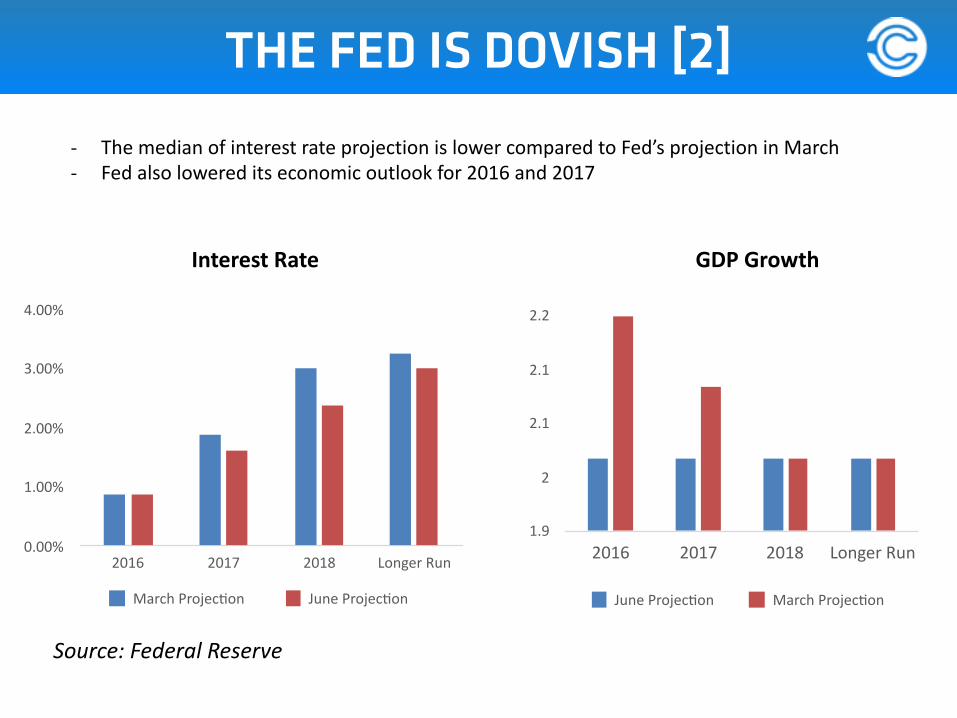
2016 2017 2018 Longer Run
March Projecdon June Projecdon
1.9
2
2.1
2.1
2.2
2016 2017 2018 Longer Run
June Projecdon March Projecdon
Interest Rate GDP Growth
Source: Federal Reserve
THE FED IS DOVISH [2]
-‐ The median of interest rate projection is lower compared to Fed’s projection in March -‐ Fed also lowered its economic outlook for 2016 and 2017

4.4
4.5
4.6
4.7
4.8
2016 2017 2018 Longer Run
June Projecdon March Projecdon
0
0.5
1
1.5
2
2016 2017 2018 Longer Run
June Projecdon March Projecdon
Unemployment Rate Inflation
THE FED IS DOVISH [3]
-‐ No drastic changes on inflation and unemployment rate -‐ Fed still sees that inflation will fall below 2% this year, and gradually increase
approaching 2% target.
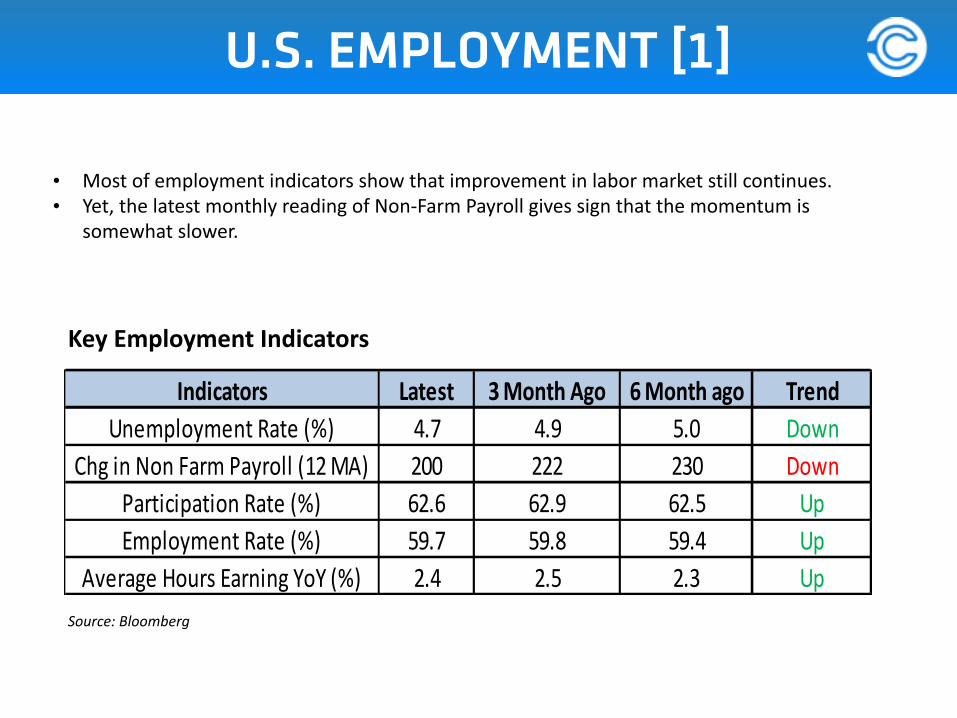
Key Employment Indicators
Indicators Latest 3.Month.Ago 6.Month.ago TrendUnemployment*Rate*(%) 4.7 4.9 5.0 Down
Chg*in*Non*Farm*Payroll*(12*MA) 200 222 230 DownParticipation*Rate*(%) 62.6 62.9 62.5 UpEmployment*Rate*(%) 59.7 59.8 59.4 Up
Average*Hours*Earning*YoY*(%) 2.4 2.5 2.3 UpSource: Bloomberg
U.S. EMPLOYMENT [1]
• Most of employment indicators show that improvement in labor market still continues. • Yet, the latest monthly reading of Non-‐Farm Payroll gives sign that the momentum is
somewhat slower.

3.00
4.75
6.50
8.25
10.00
1.50 2.13 2.75 3.38 4.00
March 2016
The Beveridge curve shift to the right, meaning higher job opening rate is needed in order to achieve the same
level of unemployment rate
Une
mployment R
ate (%
)
Job Opening Rate (%)
March 2001
Source: US Bureau of Labor Survey
For technical note on job opening, please see http://www.bls.gov/news.release/jolts.tn.htm
U.S. EMPLOYMENT [2]• The Beveridge Curve shows a shift in US employment condition. • Theoretically, the relationship between unemployment rate vs job opening rate is negative,
meaning that when job opening rate is increasing, unemployment rate is decreasing.

Source: Bloomberg.
Wages Growth
• Wages growth is still below long term average. • No threat for wages inflation so far, even though unemployment rate is lower.
U.S. EMPLOYMENT [3]

Source: Bloomberg.
• ISM employment index is decreasing especially in manufacturing sector and already contracted (below 50).
• Slower expansion in labor market will keep wages pressure benign. No inflation threat in short term.
U.S. EMPLOYMENT [4]

Key Inflation Indicators
*breakeven rate is the difference between the nominal yield on a fixed-‐rate investment and the real yield (fixed spread) on an inflation-‐linked investment of similar maturity and credit quality.
Indicators Latest 3.Months.Ago 6.Months.Ago TrendPCE$Core$(%) 1.60 1.74 1.38 Up
PCE$(%) 3.00 2.90 2.60 Unchanged
CPI$(%) 1.10 1.00 0.50 Up
Oil$(WTI) 49.10 33.75 41.65 Up
DXY$(Dollar$Index) 95.89 98.21 100.17 Down
ISM$Business$Price 63.50 38.50 35.50 Up
Inflation$Expectation* 1.58 1.43 1.62 Down
U.S. INFLATION [1]
• Most of inflation indicators are showing sign that inflation will pick up in near term. • However, the source of pick up is coming from technical rebound from supply side (i.e USD
depreciation and rebound in commodity price) not from genuine side (demand side). • So, there is no inflation threat yet.

Inflation
Demand Pull
Supply/Cost Push
Outlook : Moderate/No Threat -‐ Wages inflation is still low -‐ Economic activity is moderate
and Mixed
Outlook : Rising -‐ Dollar Depreciation -‐ Rebound in oil price
U.S. INFLATION [2]
Inflation Tree Chart

Indicators Latest 3.Months.Ago 6.Months.Ago TrendIndustrial+Production+YoY+(%) 31.07 31.4 32.06 UpISM+Manufacturing 52.9 53.4 56.6 DownISM+Non3Manufacturing 51.3 49.5 48.4 UpTrade+Balance+(12+Months+MA,+bio+USD) 340.79 342.36 341.89 UpNew+Home+Sales+(12+Months+MA,+mio+USD) 524.08 501.42 498.33 Up
Key Economic Activity Indicators
Source: Bloomberg
-‐ Most of activity indicators are giving better momentum compared to 3 and 6 months ago. -‐ However, industrial production (year-‐on-‐year) is still in contraction level, even in nominal term. -‐ Latest slowdown in non-‐farm payroll will translate to lower momentum in the activity.
U.S. ECONOMIC ACTIVITY [1]
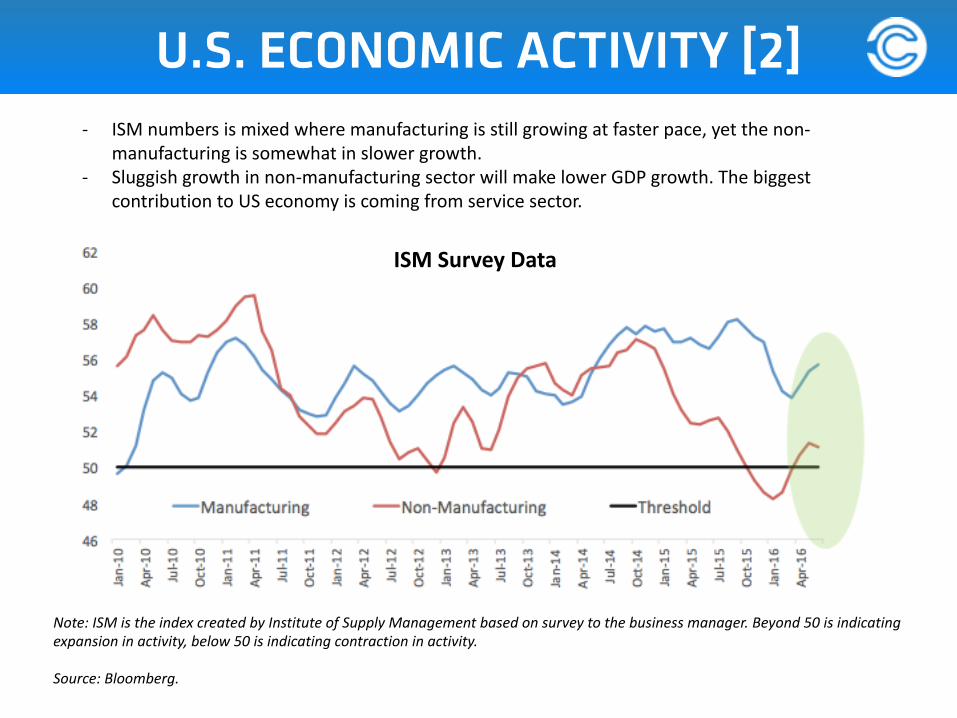
Note: ISM is the index created by Institute of Supply Management based on survey to the business manager. Beyond 50 is indicating expansion in activity, below 50 is indicating contraction in activity.
Source: Bloomberg.
ISM Survey Data
-‐ ISM numbers is mixed where manufacturing is still growing at faster pace, yet the non-‐ manufacturing is somewhat in slower growth.
-‐ Sluggish growth in non-‐manufacturing sector will make lower GDP growth. The biggest contribution to US economy is coming from service sector.
U.S. ECONOMIC ACTIVITY [2]

Inventory Growth (YoY)
Source: Fed St.Louis
-‐ Inventory is slowing down: business managers are not that confidence with the economy. It also indicates less order ahead.
-‐ The latest reading number is at the lowest level since the recovery after global financial crisis 2008.
U.S. ECONOMIC ACTIVITY [3]

0
175
350
525
700
Latest Reading 1 Year Ago 3 Years Ago 5 Years Ago 10 years Ago
Monthly New Home Sales (thousands USD, 12-‐month Average)
Source: Bloomberg
-‐ Improvement in housing market continues, as shown by higher monthly new home sales. -‐ Yet, still below pre-‐crisis level. Slowdown in job hiring, will lead to slower increase of housing sales.
U.S. ECONOMIC ACTIVITY [4]

0.00%
25.00%
50.00%
75.00%
100.00%
1880 1940 1960 2014
Living in Parents Home Married or Cohabidng in Own Household Living AloneOthers Arrangement
Housing Arrangement For Young People
Source: PEW Research
Changing trend in housing arrangement. Most of young and productive people are tend to live in his/her parent’s house. If this trend continues, housing sales will be restrained.
U.S. ECONOMIC ACTIVITY [5]

U.S. FORWARD-‐LOOKING INDICATORS

*
*Surprise index is the deviation between actual data and market consensus, using standardized method.
Source: Bloomberg
Forward Looking Indicators
FORWARD LOOKING [1]
-‐ Forward looking indicators are mixed with negative bias. -‐ The growth of leading index is still relatively low, with slower growth compared to previous period. -‐ Durable goods orders also grows in slower pace.

Source: Bloomberg
-‐ Consumer sentiment has improved to the level pre-‐2008 crisis, alongside improvement in labor market. -‐ However, there is a sign that recent uptrend has reached its turning point.
FORWARD LOOKING [2]

The TED spread is the difference between the interest rates on interbank loans and on short-‐term U.S. government debt ("T-‐bills").
-‐ There is no sign of financial tightening in U.S., according to TED Spread. Yet, current level is still near 50 bps. -‐ The rule of thumb is, when TED spread is beyond 50 bps, there is a financial tightening in U.S. -‐ Drastic tightening is a scenario that Fed doesn’t like, since it hurts U.S. strategy to deleverage.
FORWARD LOOKING [3]

The Fed will maintain dovish stance for while
1. There is no persistent inflation pressure yet. 2. Slower momentum in labor market. 3. Uncertainties ahead (Brexit and U.S. election)
Upcoming FOMC meeting schedule (U.S. Time): -‐ 26 -‐ 27 July -‐ 20 -‐ 21 September (with update on economy and inflation outlook)
FORWARD LOOKING [4]

CHINA & EURO

-‐ The side effect of rapid growth, too much leverage in China’s economy, more than 200% of its GDP.
-‐ There is some different methodology to breakdown China’s total debt. Yet the conclusion is same, China needs to deleverage.
CHINA [1]

Over Capacity
Too Much Leverage
Pursuing Internal Growth
Lower Growth Accommodative Policy
Tighter Policy
Accommodative Policy
Tighter Policy
China’s Policy Dilemma
CHINA [2]

ECB’s Inflation Forecast
-‐ Similar with The Fed, ECB is also dovish due to lower inflation outlook. -‐ ECB predicts that inflation will grow 1.2% and 1.5% for 2017 and 2018, lower than
previous forecast. -‐ Inflation will not breach the target (2%), at least until 2018.
EURO AREA [1]
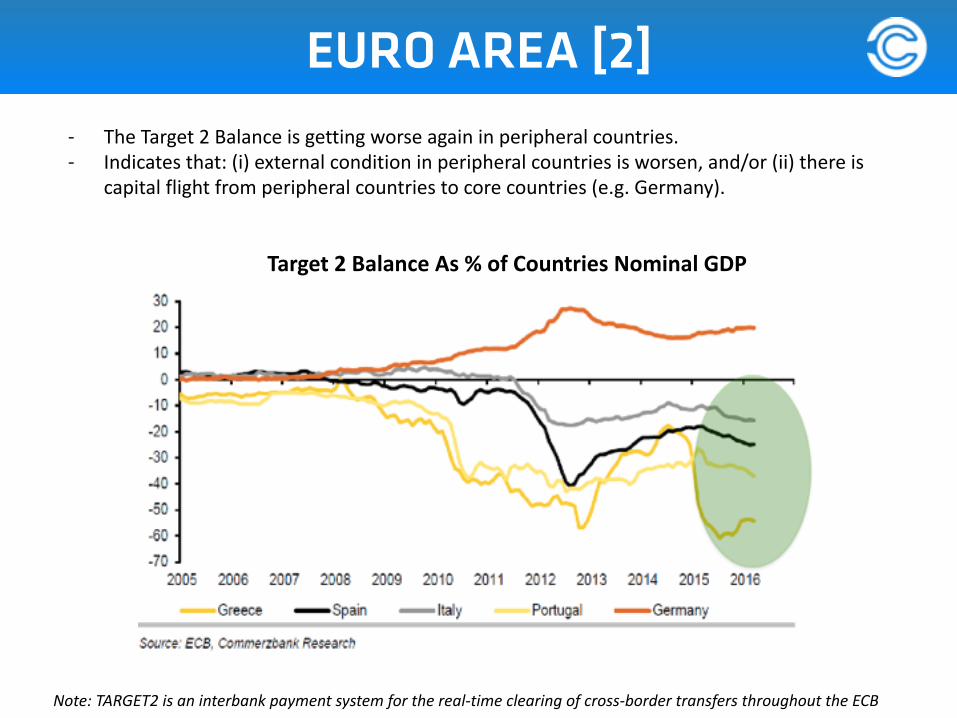
Target 2 Balance As % of Countries Nominal GDP
Note: TARGET2 is an interbank payment system for the real-‐time clearing of cross-‐border transfers throughout the ECB
-‐ The Target 2 Balance is getting worse again in peripheral countries. -‐ Indicates that: (i) external condition in peripheral countries is worsen, and/or (ii) there is
capital flight from peripheral countries to core countries (e.g. Germany).
EURO AREA [2]

THE ALERT NOTE: BREXIT, June 2016

BREXIT [1]
• UK#decides#to#leave#EU#• The#breakdown#of#the#voters#is#giving#sign#that#UK#is#divided#by#region#and#country.##• Scotland#and#Northern#Island#is#vo>ng#to#remain.#England#and#Wales#is#vo>ng#to#exit.##• London#decides#to#remain.##
The Result: UK decides to Leave EU

BREXIT [2]
1. UK holds referendum on 23 June 2016. The result is: 48% says remain and 52% says exit from EU. David Cameron resigns as UK’s Prime Minister.
2. Aier the referendum to leave EU, UK has two years for transidon or compledon dme to trigger Ardcle 50 Lisbon Treaty, the formal way to leave EU.
3. When UK signs the Ardcle 50, it is formally leaving EU.
However, the path for leaving EU is not that clear: Given the muld-‐faceted structure of this market -‐ with the free movement of goods, services, labour and capital –
negodadons are likely to prove complex and difficult. The polidcal situadon isn’t that clear, most of parliament members (MP) are personally in favour to remain with EU.

BREXIT [3]