global ensemble projections reveal trophic amplification ... · the authors declare no conflict of...
TRANSCRIPT
Global ensemble projections reveal trophicamplification of ocean biomass declineswith climate changeHeike K. Lotzea,1, Derek P. Tittensora,b, Andrea Bryndum-Buchholza, Tyler D. Eddya,c, William W. L. Cheungc,Eric D. Galbraithd,e, Manuel Barangef, Nicolas Barrierg, Daniele Bianchih, Julia L. Blanchardi,j, Laurent Boppk,Matthias Büchnerl, Catherine M. Bulmanm, David A. Carozzan, Villy Christenseno, Marta Collg,p, John P. Dunneq,Elizabeth A. Fultonj,m, Simon Jenningsr,s,t, Miranda C. Jonesc, Steve Mackinsonu, Olivier Mauryg,v, Susa Niiranenw,Ricardo Oliveros-Ramosx, Tilla Royi,y, José A. Fernandesz,aa, Jacob Schewel, Yunne-Jai Shing,bb, Tiago A. M. Silvar,Jeroen Steenbeekp, Charles A. Stockq, Philippe Verleycc, Jan Volkholzl, Nicola D. Walkerr, and Boris Worma
aDepartment of Biology, Dalhousie University, Halifax, NS B3H 4R2, Canada; bScience, UN Environment World Conservation Monitoring Centre, CB3 0DL Cambridge,United Kingdom; cNippon Foundation-Nereus Program, Institute for the Oceans and Fisheries, University of British Columbia, Vancouver, BC V6T 1Z4, Canada;dInstitució Catalana de Recerca i Estudis Avançats, 08010 Barcelona, Spain; eInstitut de Ciència i Tecnologia Ambientals, Universitat Autònoma de Barcelona, 08193Barcelona, Spain; fFisheries and Aquaculture Department, Food and Agriculture Organization of the United Nations, 00153 Rome, Italy; gMarine Biodiversity,Exploitation and Conservation (MARBEC) Research Unit, Institut de Recherche pour le Développement, University of Montpellier, Institut Français de Recherche pourl’Exploitation de la Mer, Centre National de la Recherche Scientifique, 34203 Sète cedex, France; hDepartment of Atmospheric and Oceanic Sciences, University ofCalifornia, Los Angeles, CA 90095-1565; iInstitute for Marine and Antarctic Studies, University of Tasmania, Hobart, TAS 7001, Australia; jCentre for MarineSocioecology, University of Tasmania, Hobart, TAS 7004, Australia; kInstitut Pierre-Simon Laplace, Laboratoire de Météorologie Dynamique, Centre National de laRecherche Scientifique, Ecole Normale Supérieure, Paris Sciences and Lettres Research University, Sorbonne University, Ecole Polytechnique, 75231 Paris, France;lPotsdam Institute for Climate Impact Research, 14473 Potsdam, Germany; mCommonwealth Scientific and Industrial Research Organization, Marine and AtmosphericResearch, Hobart, TAS 7001, Australia; nDepartment of Earth and Planetary Sciences, McGill University, Montreal, QE H3A 0E8, Canada; oInstitute for the Oceans andFisheries, University of British Columbia, Vancouver, BC V6T 1Z4, Canada; pInstitute of Marine Science, Ecopath International Initiative, 08003 Barcelona, Spain;qGeophysical Fluid Dynamics Laboratory, National Oceanic and Atmospheric Administration, Princeton University, Princeton, NJ 08540; rLowestoft Laboratory, Centrefor Environment, Fisheries and Aquaculture Science, NR33 0HT Lowestoft, United Kingdom; sSchool of Environmental Sciences, University of East Anglia, NR4 7TJNorwich, United Kingdom; tScience Committee, International Council for the Exploration of the Sea, 1553 København V, Denmark; uHeritage House, Scottish PelagicFishermen’s Association, AB43 9BP Fraserburgh, United Kingdom; vDepartment of Oceanography, Marine Research Institute, University of Cape Town, 7701Rondebosch, South Africa; wStockholm Resilience Centre, Stockholm University, 11419 Stockholm, Sweden; xInstituto del Mar del Perú, 07021 Callao, Perú; yEcosystem,Climate and Ocean Analysis, 75019 Paris, France; zMarine Research Division, AZTI Tecnalia, 20110 Pasaia, Spain; aaPlymouth Marine Laboratory, PL13 DH Plymouth,United Kingdom; bbDepartment of Biological Sciences, Marine Research Institute, University of Cape Town, 7701 Rondebosch, South Africa; and ccAMAP Research Unit,Institut de Recherche pour le Développement, 34398 Montpellier, France
Edited by James A. Estes, University of California, Santa Cruz, CA, and approved May 22, 2019 (received for review January 5, 2019)
While the physical dimensions of climate change are now routinelyassessed through multimodel intercomparisons, projected impacts onthe global ocean ecosystem generally rely on individual models with aspecific set of assumptions. To address these single-model limitations,we present standardized ensemble projections from six global marineecosystemmodels forcedwith two Earth systemmodels and four emis-sion scenarios with and without fishing. We derive average biomasstrends and associated uncertainties across the marine food web.Without fishing, mean global animal biomass decreased by 5% (±4%SD) under low emissions and 17% (±11% SD) under high emissions by2100, with an average 5% decline for every 1 °C of warming. Projectedbiomass declines were primarily driven by increasing temperature anddecreasing primary production, and were more pronounced at highertrophic levels, a process known as trophic amplification. Fishing did notsubstantially alter the effects of climate change. Considerable regionalvariation featured strong biomass increases at high latitudes and de-creases at middle to low latitudes, with good model agreement on thedirection of change but variable magnitude. Uncertainties due to vari-ations in marine ecosystem and Earth system models were similar.Ensemble projections performed well compared with empirical data,emphasizing the benefits of multimodel inference to project futureoutcomes. Our results indicate that global ocean animal biomass con-sistently declines with climate change, and that these impacts are am-plified at higher trophic levels. Next steps for model developmentinclude dynamic scenarios of fishing, cumulative human impacts, andthe effects of management measures on future ocean biomass trends.
climate change impacts | marine food webs | global ecosystem modeling |model intercomparison | uncertainty
Climate change is altering the abundance and distribution ofmarine species (1–5), with consequences for ocean ecosystem
structure and functioning, seafood supply, and marine management
Significance
Climate change can affect the distribution and abundance of marinelife, with consequences for goods and services provided to people.Because different models can lead to divergent conclusions aboutmarine futures, we present an integrated global ocean assessmentof climate change impacts using an ensemble ofmultiple climate andecosystem models. It reveals that global marine animal biomass willdecline under all emission scenarios, driven by increasing tempera-ture and decreasing primary production. Notably, climate changeimpacts are amplified at higher food web levels compared withphytoplankton. Our ensemble projections provide the most com-prehensive outlook on potential climate-driven ecological changes inthe global ocean to date and can inform adaptive management andconservation of marine resources under climate change.
Author contributions: H.K.L., D.P.T., T.D.E., W.W.L.C., E.D.G., M. Barange, J.L.B., L.B., V.C.,E.A.F., S.J., O.M., and J. Schewe designed research; H.K.L., D.P.T., A.B.-B., T.D.E., W.W.L.C.,E.D.G., M. Barange, N.B., D.B., J.L.B., M. Büchner, C.M.B., D.A.C., V.C., M.C., E.A.F., S.J., M.C.J.,S.M., O.M., S.N., R.O.-R., J.A.F., Y.-J.S., T.A.M.S., J. Steenbeek, P.V., N.D.W., and B.W. performedresearch; L.B., J.P.D., T.R., J. Schewe, C.A.S., and J.V. contributed new reagents/analytic tools;H.K.L., D.P.T., A.B.-B., T.D.E., T.R., J.V., and B.W. analyzed data; and H.K.L., D.P.T., A.B.-B.,T.D.E., W.W.L.C., E.D.G., M. Barange, N.B., D.B., J.L.B., L.B., M. Büchner, C.M.B., D.A.C., V.C.,M.C., J.P.D., E.A.F., S.J., M.C.J., S.M., O.M., S.N., R.O.-R., T.R., J.A.F., J. Schewe, Y.-J.S., T.A.M.S.,J. Steenbeek, C.A.S., P.V., J.V., N.D.W., and B.W. wrote the paper.
The authors declare no conflict of interest.
This article is a PNAS Direct Submission.
This open access article is distributed under Creative Commons Attribution-NonCommercial-NoDerivatives License 4.0 (CC BY-NC-ND).
Data deposition: All data reported in this paper are archived and publicly available athttp://dataservices.gfz-potsdam.de/pik/showshort.php?id=escidoc:2956913.1To whom correspondence may be addressed. Email: [email protected].
This article contains supporting information online at www.pnas.org/lookup/suppl/doi:10.1073/pnas.1900194116/-/DCSupplemental.
www.pnas.org/cgi/doi/10.1073/pnas.1900194116 PNAS Latest Articles | 1 of 6
ECOLO
GY

and conservation (6–8). Quantifying future trends and uncertainties iscritical to inform ongoing global assessments (1), including theIntergovernmental Panel for Climate Change (IPCC) and Inter-governmental Science-Policy Platform on Biodiversity and Eco-system Services, and guide viable pathways toward achieving keypolicy objectives, such as the United Nations Sustainable Devel-opment Goals (SDGs). Various modeling approaches exist toassess current and future impacts on marine ecosystems (8–12),yet each individual model is necessarily an incomplete simplifi-cation of the natural world, with different assumptions, structures,and processes (13). One approach to overcoming any single-model limitations is to force a suite of models with standardizedclimate change scenarios and combine them into ensemble pro-jections to estimate mean future trends and associated intermodelspread (13). Such model intercomparison projects (MIPs) havebecome a “gold standard” in climate science and have provencritical for enhancing credibility and understanding of the physicaland biochemical climate change projections (14) and associatedimpacts on Earth’s terrestrial biosphere (15–17), yet can only nowbe attempted for the global ocean ecosystem (13).Over the past decade, a number of global fisheries and marine
ecosystem models (MEMs) have been developed (13). Some ofthese have been used individually to project future changes inspecies distribution, biomass, or potential fisheries catch (8–12),but it remains unclear how consistent and comparable these resultsare, and thus how applicable for providing robust insight and ad-vice. The Fisheries and Marine EcosystemModel IntercomparisonProject (Fish-MIP; ref. 13) was created to bring these variousmodels and modeling groups together to produce ensemble pro-jections under standardized climate change scenarios.Here we assess projected changes in global marine animal
biomass over the 21st century through ensemble projections with sixpublished global MEMs from Fish-MIP, forced with standardizedoutputs from two contrasting Earth system models (ESMs) andfour emission scenarios [Representative Concentration Pathways(RCPs)]. The MEMs range from size-structured [BioeconomicMarine Trophic Size-spectrum (BOATS), Macroecological] andtrait-based [Dynamic Pelagic Benthic Model (DPBM), ApexPredators EcoSystem Model (APECOSM)] to species distribution[Dynamic Bioclimate Envelope Model (DBEM)] and troph-odynamic models (EcoOcean) (SI Appendix, Tables S1 and S2).The ESMs span the range of available Coupled Model Intercom-parison Project Phase 5 (CMIP5) projections, from low [GeophysicalFluid Dynamics Laboratory Climate Model (GFDL-ESM2M)] tohigh Institute Pierre Simon Laplace Climate Model (IPSL-CM5A-LR) increases in sea surface temperature (SST) and associatedchanges in net primary production (NPP), while other drivers weremore similar (ref. 14 and SI Appendix, Figs. S1 and S2). The RCPsrange from a low-emission strong mitigation scenario (RCP2.6) to ahigh-emission business-as-usual scenario (RCP8.5), with two inter-mediate scenarios (RCP4.5 and RCP6.0). All climate change sce-narios were run for historical (1970–2005) and future (2006–2100)periods without fishing to isolate the climate signal, and with fishingto evaluate how climate responses differ in an ocean fished atcurrent levels of intensity (13). The six MEMs generated stan-dardized outputs of total animal biomass (except zooplankton)and biomass of animals of >10 cm and >30 cm. Since not allMEMs could run the full set of scenarios, due to MEM or ESMlimitations, we analyzed all available runs for each scenario, andperformed sensitivity analyses on subsets, which revealed similarresults (SI Appendix, Table S3).The goals of this study were to examine the consistency of
projections across MEMs over a range of climate change sce-narios globally and regionally from 1970 to 2100. We also eval-uated how ocean animal biomass changes correspond with thosein the physical environment and the extent to which projectedclimate impacts on primary producers and zooplankton (18) aretransmitted to higher food web levels.
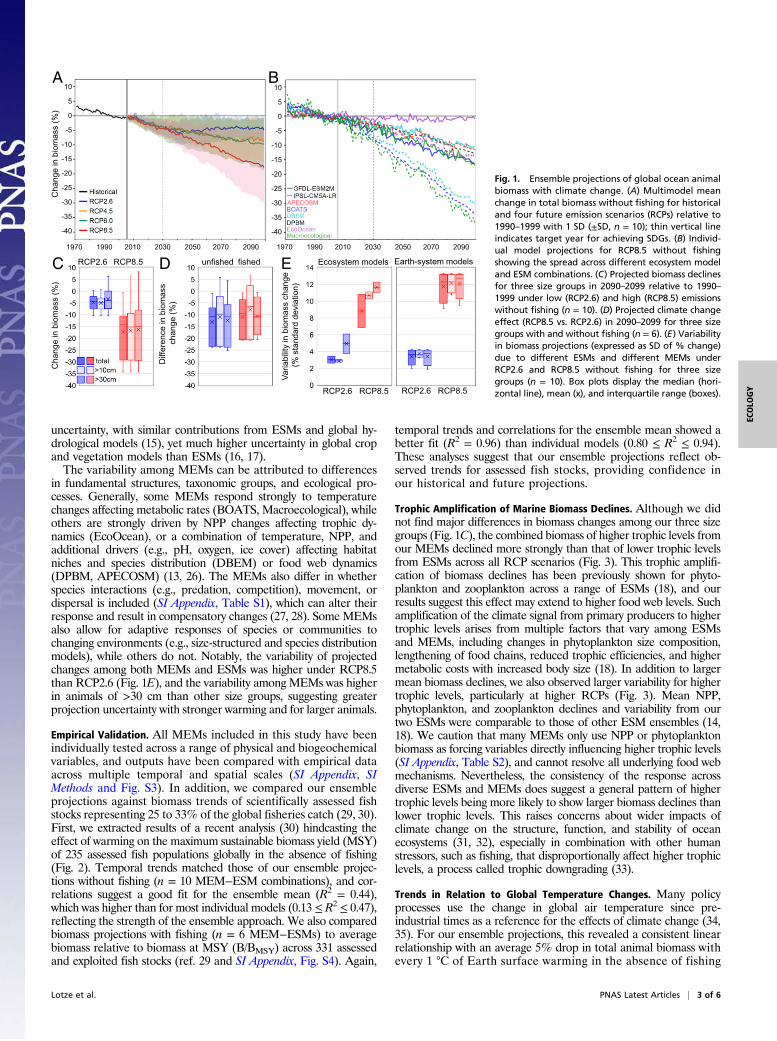
Results and DiscussionEnsemble Projections of Global Ocean Animal Biomass.Our ensembleprojections revealed consistent declines in global marine animalbiomass from 1970 to 2100 across all emission scenarios (RCPs, Fig.1A). Almost all scenarios and MEM−ESM combinations predicteddecreasing animal biomass (SI Appendix, Table S3), although themagnitude of decline varied among models. This general trend canbe explained by warming causing increased ocean stratification,which reduces nutrient availability in the upper ocean, leading todecreased primary production and lower energy supply for highertrophic levels (14, 18), and changes in metabolic rates, among others(19). Without fishing, mean total biomass declines ranged from4.8% (±3.5% SD) under low emissions (RCP2.6) to 17.2% (±10.7%SD) under high emissions (RCP8.5) by 2090–2099 relative to 1990–1999 (Fig. 1A). All four emission scenarios projected similar de-clines by 2030, the target year of many SDGs, and through tomidcentury, after which they began to diverge. Projected meanbiomass declines were similar for animals of >10 cm and >30 cm(Fig. 1C), albeit slightly lower and more variable for those of >30 cm(SI Appendix, Fig. S5 and Table S3). Thus, the consequences ofdifferent emission scenarios may not be distinguishable over the nexttwo to three decades but differ markedly in the long term.
Climate Change Effects in a Fished and Unfished Ocean.Three MEMswere also able to run simulations with fishing, including time-varyinghistorical and constant future fishing pressure (SI Appendix, SIMethods), which we used to compare projected climate change ef-fects (RCP8.5 vs. RCP2.6) with and without fishing. The magnitudeand variability of the climate change effect were similar (Fig. 1D),suggesting that fishing, at least under current levels of intensity, maynot substantially alter the relative effect of climate change. Theslightly weaker climate change effects with fishing (mean difference 2to 3%; Fig. 1D and SI Appendix, Fig. S6A) may be due to an indirecteffect: Warming enhances both growth and predation rates, yetpredation rates are reduced due to selective fishing of larger animalsand lower predator abundance (20, 21) which may indirectly en-hance prey biomass and weaken the relative climate change effect(19). This is a relatively small effect, however, compared with thelarge direct effect of fishing itself, which resulted in 16 to 80% lowerbiomass for animals of >10 cm and 48 to 92% for animals of >30 cmcompared with unfished conditions in 2100 under RCP2.6, andslightly lower values under RCP8.5. We note that the absolutemagnitude of the fishing effect is not directly comparable acrossMEMs, due to inherent differences in how fishing pressure andcommercial versus noncommercial taxa are incorporated (SI Ap-pendix, SI Methods). We also caution that our future constant fishingscenario is simplistic and does not incorporate potential changes ineffort, technology, management, and conservation (11, 21–23), whichare likely to strongly affect future biomass trends. Nevertheless, apossible consistent climate change effect is an important consider-ation in the context of marine management and conservation.
Variability among Model Projections. Although ensemble meansrevealed global biomass declines across all emission scenarios (Fig.1A), there was considerable variation among MEMs and ESMs(Fig. 1B). The latter largely reflects differences in SST increasesand NPP reductions among ESMs (SI Appendix, Fig. S1), in addi-tion to other physical and biochemical drivers (14), and reinforcesprevious work highlighting the importance of ESM and scenariouncertainty in future projections of fish biomass or fisheries pro-duction (24, 25). Interestingly, the variability in projected biomasschanges among ESMs was of similar magnitude to that amongMEMs (Fig. 1E), suggesting similar levels of uncertainty associatedwith physical and biological models. Since the field of global eco-system modeling is relatively new compared with Earth systemmodeling (13, 14), one might have expected higher variabilityacross MEMs. Other MIPs also found that uncertainties in bothESMs and climate impact models contribute to overall projection
2 of 6 | www.pnas.org/cgi/doi/10.1073/pnas.1900194116 Lotze et al.
uncertainty, with similar contributions from ESMs and global hy-drological models (15), yet much higher uncertainty in global cropand vegetation models than ESMs (16, 17).The variability among MEMs can be attributed to differences
in fundamental structures, taxonomic groups, and ecological pro-cesses. Generally, some MEMs respond strongly to temperaturechanges affecting metabolic rates (BOATS, Macroecological), whileothers are strongly driven by NPP changes affecting trophic dy-namics (EcoOcean), or a combination of temperature, NPP, andadditional drivers (e.g., pH, oxygen, ice cover) affecting habitatniches and species distribution (DBEM) or food web dynamics(DPBM, APECOSM) (13, 26). The MEMs also differ in whetherspecies interactions (e.g., predation, competition), movement, ordispersal is included (SI Appendix, Table S1), which can alter theirresponse and result in compensatory changes (27, 28). SomeMEMsalso allow for adaptive responses of species or communities tochanging environments (e.g., size-structured and species distributionmodels), while others do not. Notably, the variability of projectedchanges among both MEMs and ESMs was higher under RCP8.5than RCP2.6 (Fig. 1E), and the variability among MEMs was higherin animals of >30 cm than other size groups, suggesting greaterprojection uncertainty with stronger warming and for larger animals.
Empirical Validation. All MEMs included in this study have beenindividually tested across a range of physical and biogeochemicalvariables, and outputs have been compared with empirical dataacross multiple temporal and spatial scales (SI Appendix, SIMethods and Fig. S3). In addition, we compared our ensembleprojections against biomass trends of scientifically assessed fishstocks representing 25 to 33% of the global fisheries catch (29, 30).First, we extracted results of a recent analysis (30) hindcasting theeffect of warming on the maximum sustainable biomass yield (MSY)of 235 assessed fish populations globally in the absence of fishing(Fig. 2). Temporal trends matched those of our ensemble projec-tions without fishing (n = 10 MEM−ESM combinations), and cor-relations suggest a good fit for the ensemble mean (R2 = 0.44),which was higher than for most individual models (0.13 ≤ R2 ≤ 0.47),reflecting the strength of the ensemble approach. We also comparedbiomass projections with fishing (n = 6 MEM−ESMs) to averagebiomass relative to biomass at MSY (B/BMSY) across 331 assessedand exploited fish stocks (ref. 29 and SI Appendix, Fig. S4). Again,
temporal trends and correlations for the ensemble mean showed abetter fit (R2 = 0.96) than individual models (0.80 ≤ R2 ≤ 0.94).These analyses suggest that our ensemble projections reflect ob-served trends for assessed fish stocks, providing confidence inour historical and future projections.
Trophic Amplification of Marine Biomass Declines. Although we didnot find major differences in biomass changes among our three sizegroups (Fig. 1C), the combined biomass of higher trophic levels fromour MEMs declined more strongly than that of lower trophic levelsfrom ESMs across all RCP scenarios (Fig. 3). This trophic amplifi-cation of biomass declines has been previously shown for phyto-plankton and zooplankton across a range of ESMs (18), and ourresults suggest this effect may extend to higher food web levels. Suchamplification of the climate signal from primary producers to highertrophic levels arises from multiple factors that vary among ESMsand MEMs, including changes in phytoplankton size composition,lengthening of food chains, reduced trophic efficiencies, and highermetabolic costs with increased body size (18). In addition to largermean biomass declines, we also observed larger variability for highertrophic levels, particularly at higher RCPs (Fig. 3). Mean NPP,phytoplankton, and zooplankton declines and variability from ourtwo ESMs were comparable to those of other ESM ensembles (14,18). We caution that many MEMs only use NPP or phytoplanktonbiomass as forcing variables directly influencing higher trophic levels(SI Appendix, Table S2), and cannot resolve all underlying food webmechanisms. Nevertheless, the consistency of the response acrossdiverse ESMs and MEMs does suggest a general pattern of highertrophic levels being more likely to show larger biomass declines thanlower trophic levels. This raises concerns about wider impacts ofclimate change on the structure, function, and stability of oceanecosystems (31, 32), especially in combination with other humanstressors, such as fishing, that disproportionally affect higher trophiclevels, a process called trophic downgrading (33).
Trends in Relation to Global Temperature Changes. Many policyprocesses use the change in global air temperature since pre-industrial times as a reference for the effects of climate change (34,35). For our ensemble projections, this revealed a consistent linearrelationship with an average 5% drop in total animal biomass withevery 1 °C of Earth surface warming in the absence of fishing
A
RCP2.6 RCP8.5 fishedunfishedC D Ecosystem models
RCP2.6 RCP8.5
Earth-system models
RCP2.6 RCP8.5
E
B
)%(
ssamoib
niegnah
C Diff
eren
ce in
bio
mas
s ch
ange
(%)
Varia
bilit
y in
bio
mas
s ch
ange
(%
sta
ndar
d de
viat
ion)
)%(
ssamoib
niegnah
C
1970 1990 2010 2030 2050 2070 2090
10
5
0
-5
-10
-15
-20
-25
-30
-35
-40
10
5
0
-5
-10
-15
-20
-25
-30
-35
-40
1970 1990 2010 2030 2050 2070 2090
Fig. 1. Ensemble projections of global ocean animalbiomass with climate change. (A) Multimodel meanchange in total biomass without fishing for historicaland four future emission scenarios (RCPs) relative to1990–1999 with 1 SD (±SD, n = 10); thin vertical lineindicates target year for achieving SDGs. (B) Individ-ual model projections for RCP8.5 without fishingshowing the spread across different ecosystem modeland ESM combinations. (C) Projected biomass declinesfor three size groups in 2090–2099 relative to 1990–1999 under low (RCP2.6) and high (RCP8.5) emissionswithout fishing (n = 10). (D) Projected climate changeeffect (RCP8.5 vs. RCP2.6) in 2090–2099 for three sizegroups with and without fishing (n = 6). (E) Variabilityin biomass projections (expressed as SD of % change)due to different ESMs and different MEMs underRCP2.6 and RCP8.5 without fishing for three sizegroups (n = 10). Box plots display the median (hori-zontal line), mean (x), and interquartile range (boxes).
Lotze et al. PNAS Latest Articles | 3 of 6
ECOLO
GY

(Fig. 4). Similar declines were found for animals of >10 cmand >30 cm (SI Appendix, Fig. S7). These relationships may beslightly less negative in a fished ocean, given the dampening effectdescribed above, yet overall biomass reductions remain substantial(i.e., 15% instead of 17% decline under highest warming; SI Ap-pendix, Fig. S6B). Individual ecosystems may well show more-complex responses to warming (3, 36), but these simple relation-ships represent well-founded approximations for a global averageresponse. Recent results hindcasting temperature effects on bio-mass of 235 assessed fish stocks found a 4.1% drop in MSY from1930 to 2010, a period that saw an average 0.6 °C of warming (30).This reconstructed rate of change is consistent with our 5% dropin biomass per 1 °C of warming throughout the 21st century.According to these results, limiting future warming to 1.5 °C to2.0 °C above preindustrial levels would limit biomass declines to 4to 6% by 2100, underscoring the potential impact of climatechange mitigation according with the Paris Agreement (34, 35).
Spatial Patterns of Biomass Change. Not all ocean regions respondsimilarly to climate warming (Fig. 5 and SI Appendix, Fig. S8). Ourensemble projections revealed strong increases in total animalbiomass in polar regions and widespread declines in temperate totropical regions under RCP8.5 (Fig. 5B), with qualitatively similarbut less pronounced patterns under RCP2.6 (Fig. 5A). The climatechange effects were spatially similar with and without fishing (SIAppendix, Fig. S9). However, our ensemble projections differedspatially from previous single-model results highlighted in theIPCC’s Fifth Assessment Report (1): We found strong biomassdeclines (not increases) in many temperate to subtropical regionsand increases (not declines) around Antarctica. The magnitude ofregional changes also varied from other single-model results (8–11).Generally, warming waters and enhanced primary production areexpected to facilitate species expansions and biomass increases inpolar regions, while tropical areas may experience pronouncedspecies losses as thermal thresholds are exceeded. In temperateregions, warming is expected to change species composition, andreduced primary production due to enhanced stratification willresult in biomass declines (3, 4, 30). Our ensemble projectionsshowed high model agreement on the direction of change in manyocean regions (75 to 100%; Fig. 5 E and F), providing confidence inour multimodel results that combine different ecosystem structuresand processes. Many models also agreed relatively well on themagnitude of projected changes in temperate to tropical regionsbut showed considerable intermodel variability in many polar andcoastal regions (Fig. 5 C and D), reflecting differences amongESMs and MEMs (SI Appendix, Figs. S10 and S11). These resultsagain underscore the importance of model intercomparison inidentifying uncertainties and constraining expected outcomes ofecosystem changes in the ocean.
ConclusionsOur ensemble projections demonstrate that global ocean animalbiomass consistently declines with climate change, and that impactsare amplified at higher trophic levels. Our hindcasts support recentempirical work that shows ongoing climate impacts on fish biomass(30, 37), and project elevated climate-driven declines in oceanecosystems, with magnitudes dependent on emission pathways.Amplification of biomass declines for higher trophic levels repre-sents a particular challenge for human society, including meetingthe SDGs for food security (SDG2), livelihoods (SDG1), and well-being (SDG3) for a growing human population while also sustaininglife below water (SDG14). Our ensemble projections indicate thelargest decreases in animal biomass at middle to low latitudes,where many nations depend on seafood and fisheries, and wheremarine biodiversity is already threatened by multiple human activ-ities (6, 38). In turn, the largest increases are projected at highlatitudes, highlighting new opportunities for—and potential conflictover—resource use, but also an urgent need for protectingsensitive species and rapidly changing ecosystems. Overall, ourresults clearly highlight the benefits to be gained from climatechange mitigation, as all impacts were substantially reduced under
A
-15
-10
-5
0
5
10
15
20
1970 1975 1980 1985 1990 1995 2000 2005Year
Assessed stocks Ensemble model
-2
-1
0
1
2
3
4
33343536
BR2 = 0.44
Biomass of assessed stocks (MSY million tons)
Pro
ject
ed b
iom
ass
(% re
lativ
e to
199
0s)
Bio
mas
s (%
rela
tive
to 1
990s
)
Fig. 2. Empirical validation of ensemble projections.Shown is the relative biomass change (animals of >10cm) for our multimodel mean without fishing (orangeline, ±95% CI, n = 10) compared with temperature-dependent hindcasts of MSY for 235 assessed fishstocks that are independent of fishing effects (graylines, ±95% CI; ref. 30). Both projected and empiricalbiomass trends are displayed as (A) time series and (B)yearly scatter plot with a linear regression fit. A similaranalysis of biomass trends with fishing is shown in SIAppendix, Fig. S4.
Rel
ativ
e ch
ange
(%)
5
0
-5
-10
-15
-20
-25
-30RCP2.6 RCP4.5 RCP6.0 RCP8.5
Fig. 3. Trophic amplification of marine biomass declines. Shown is themagnitude of projected mean changes in 2090–2099 relative to 1990–1999(percent, ±SD) for NPP, phytoplankton, and zooplankton biomass derivedfrom ESMs (n = 2) and higher trophic levels from MEMs across four RCPs (n =10 for RCP2.6 and RCP8.5; n = 8 for RCP4.5 and RCP6.0). All ecosystemmodelsuse either NPP or phytoplankton biomass as forcing variables, and some alsouse zooplankton biomass.
4 of 6 | www.pnas.org/cgi/doi/10.1073/pnas.1900194116 Lotze et al.

a strong mitigation (RCP2.6) compared with the business-as-usual(RCP8.5) scenario.By providing estimates of global biomass changes and associ-
ated uncertainties, our ensemble projections represent the mostcomprehensive outlook on the future of marine animal biomass todate. Our results are robust in terms of the direction of change, yetthe substantial spread in the magnitude of projections illustratesconsiderable uncertainty in both ESMs and MEMs. The challenge
is to address these uncertainties and improve our ability to predictmarine ecosystem responses to climate change at different tem-poral and spatial scales. Projections based on global models areoften less certain for coastal and polar regions but may be im-proved through regional downscaling to incorporate higher-resolution climate and ecosystem features (7, 39). The next roundof CMIP6 projections with improved representation of biochemicalparameters may also advance future ensemble projections (13, 40).The expansion of global observational datasets provides furtheropportunities to better constrain and validate models. The in-corporation of additional MEMs based on novel paradigms orreflecting alternative structures and processes may also be in-formative (13), along with regional ecosystem or fish stock modelsthat more accurately capture processes at management-relevantscales (21, 41, 42). Future MEMs could also further explore howspecies interactions and potential acclimatization or adaptation ofmarine organisms modify projected distribution and abundance.Finally, a large component of future change will depend on the
trajectories of fisheries, aquaculture, and other human impacts onthe ocean (6, 11, 29, 38). Incorporating standardized temporallyand spatially resolved scenarios of human activities and alternativemanagement approaches will improve our understanding of thefuture of marine animals and ocean ecosystems (13, 23), andidentify the points of greatest leverage for mitigating impacts.Improved dynamic and adaptive ecosystem-based managementmay mitigate some future climate change impacts and maintainecosystem health and service provision (6, 21, 22, 43). However,this can only happen if the international community, includingnational and regional bodies, strengthens the required institu-tions and management approaches (6, 44).
MethodsModel Selection. The six global MEMs varied in their model structure, pro-cesses, representation of functional groups, size classes or commercial taxa, andhow they incorporated ESM-derived climate forcings and fishing (SI Appendix,SI Methods and Tables S1 and S2). Our ensemble thus includes a greater varietyof ecosystems components and processes than any single model.
BA
DC
FE
RCP2.6 RCP8.5Biomasschange
(%)
Variability(SD)
Modelagreement
(%)
5025
-25-50
0
5038
120
25
10088
6250
75
Fig. 5. Spatial patterns of projected biomass changes.Shown are global ensemble projections at a 1 × 1 de-gree resolution for (A, C, and E) RCP2.6 and (B, D, andF) RCP8.5. (A and B) Multimodel mean change (per-cent, n = 10) in total marine animal biomass in 2090–2099 relative to 1990–1999 without fishing. (C and D)Variability among different ecosystem model and ESMcombinations expressed as 1 SD. (E and F) Modelagreement (percent) on the direction of change.
Cha
nge
in to
tal b
iom
ass
(%)
5
0
-5
-10
-15
-20
Change in surface air temperature (ºC)0 +0.5 +1 +1.5 +2 +2.5 +3 +3.5 +4 +4.5 +5
Fig. 4. Projected biomass trends in relation to global air temperaturechanges. Shown is the relationship of the change in marine animal biomassto increasing global surface air temperature since preindustrial times(1860s). Each dot represents an annual ensemble mean (n = 10) relative to1990–1999 across historical and future emission scenarios (RCPs) in the ab-sence of fishing. Vertical lines frame expected changes between 1.5 °C and2 °C of warming.
Lotze et al. PNAS Latest Articles | 5 of 6
ECOLO
GY

Climate Change Scenarios. The two ESMs from CMIP5 (https://pcmdi.llnl.gov/?cmip5/) provided the necessary physical and biochemical outputs to force ourMEMs, particularly monthly depth-resolved fields of phytoplankton andzooplankton size groups (SI Appendix, SI Methods and Table S2). Average trendsof GFDL-ESM2M and IPSL-CM5A-LR reflect the multimodel mean and range of abroad set of CMIP5 models (14). The four RCPs represent standard IPCC in-formed emission scenarios (SI Appendix, SI Methods).
Simulations. All MEMs ran simulations without fishing, and three MEMs ransimulations with fishing for historical (1970–2005) and future (2006–2100)periods. Historical fishing reflected time-varying effort or mortality ratesdepending on MEM requirements, and future fishing was kept constant at2005 levels (SI Appendix, SI Methods). Not all MEMs performed all simulations,and sensitivity analyses cross-checked subsets of results (SI Appendix, Table S3).
Analyses and Validation. Annual outputs of total animal biomass density(grams carbon per square meter) and animal biomass of >10 cm and >30 cmwere derived on a 1 × 1 degree grid. We calculated time series of % biomasschange from 1970 to 2100 relative to 1990–1999 (reference period), and %biomass change in 2090–2099 vs. 1990–1999 for each simulation, as absolutebiomass densities were not strictly comparable across MEMs. Relativechanges were combined into ensemble means and SD. The climate changeeffect [(RCP8.5 − RCP2.6)/RCP2.6] was calculated in a fished and unfishedocean within and across MEMs. Empirical validation was achieved by com-paring historical projections with biomass trends of assessed fish stocks in afished ocean (B/BMSY; ref. 29) and temperature-dependent biomass hindcasts(MSY) of assessed stocks without fishing (30), in addition to published indi-vidual MEM validations with empirical data (SI Appendix, Fig. S3). Trophicamplification was evaluated by comparing mean (±SD) changes (2090s vs.1990s) in NPP and total phytoplankton and zooplankton biomass from ESMs
with higher trophic level biomass from MEMs across RCPs. Mean biomasschanges were also compared with global air temperature changes sincepreindustrial times (1861–1870) from ESMs. Spatial patterns were mapped asmean% biomass changes in 2090–2099 vs. 1990–1999, the SD of the mean toassess intermodel variability in the magnitude of change, and the % modelagreement on the direction of change (14). We also mapped the climatechange effect with and without fishing and the variability of results acrossESMs and MEMs. For further details, see SI Appendix, SI Methods.
Data Accessibility. All data reported in this paper are archived (45) andpublicly available at http://dataservices.gfz-potsdam.de/pik/showshort.php?id=escidoc:2956913.
ACKNOWLEDGMENTS. We thank the Inter-Sectoral Impact Model Intercom-parison Project (ISI-MIP) and CMIP5 for providing data and logistical support,and we thank C. Free for sharing data. Financial support was provided by theGerman Federal Ministry of Education and Research through ISI-MIP (Grant01LS1201A1), the European Union’s Horizon 2020 Research and InnovationProgram (Grant 678193), and the Ocean Frontier Institute (Module G). Weacknowledge additional financial support as follows: to H.K.L., W.W.L.C.,and B.W. from the Natural Sciences and Engineering Research Council(NSERC) of Canada; to D.P.T. from the Kanne Rasmussen Foundation Den-mark; to A.B.-B. from the NSERC Transatlantic Ocean Science and TechnologyProgram; to W.W.L.C. and T.D.E. from the Nippon Foundation-Nereus Program;to E.D.G., M.C. and J. Steenbeek from the European Union’s Horizon 2020 Re-search and Innovation Program (Grants 682602 and 689518); to E.A.F., J.L.B., andT.R. from Commonwealth Scientific and Industrial Research Organization andthe Australian Research Council; to N.B., L.B., and O.M. from the French AgenceNationale de la Recherche and Pôle de Calcul et de Données pour la Mer; and toS.J. from the UK Department of Environment, Food and Rural Affairs.
1. H.-O. Pörtner et al., Ocean Systems. Climate Change 2014: Impacts, Adaptation, andVulnerability Part A: Global and Sectoral Aspects. Contribution of Working Group II tothe Fifth Assessment Report of the Intergovernmental Panel on Climate Change,C. B. Field et al., Eds. (Cambridge University Press, Cambridge, UK, 2014), pp. 411–484.
2. S. C. Doney et al., Climate change impacts on marine ecosystems. Annu. Rev. Mar. Sci.4, 11–37 (2012).
3. B. Worm, H. K. Lotze, “Marine biodiversity and climate change” in Climate Change: Ob-served Impacts on Planet Earth, T. M. Letcher, Ed. (Elsevier, Amsterdam, 2016), pp. 195–212.
4. M. L. Pinsky, B. Worm, M. J. Fogarty, J. L. Sarmiento, S. A. Levin, Marine taxa tracklocal climate velocities. Science 341, 1239–1242 (2013).
5. J. García Molinos et al., Climate velocity and the future global redistribution of ma-rine biodiversity. Nat. Clim. Chang. 6, 83–88 (2016).
6. J. L. Blanchard et al., Linked sustainability challenges and trade-offs among fisheries,aquaculture and agriculture. Nat. Ecol. Evol. 1, 1240–1249 (2017).
7. C. A. Stock et al., Reconciling fisheries catch and ocean productivity. Proc. Natl. Acad.Sci. U.S.A. 114, E1441–E1449 (2017).
8. W. W. L. Cheung et al., Large-scale redistribution of maximum fisheries catch po-tential in the global ocean under climate change. Glob. Change Biol. 16, 24–35 (2010).
9. J. L. Blanchard et al., Potential consequences of climate change for primary pro-duction and fish production in large marine ecosystems. Philos. Trans. R. Soc. Lond. BBiol. Sci. 367, 2979–2989 (2012).
10. M. Barange et al., Impacts of climate change on marine ecosystem production insocieties dependent on fisheries. Nat. Clim. Chang. 4, 211–216 (2014).
11. E. D. Galbraith, D. A. Carozza, D. Bianchi, A coupled human-Earth model perspectiveon long-term trends in the global marine fishery. Nat. Commun. 8, 14884 (2017).
12. S. Lefort et al., Spatial and body-size dependent response of marine pelagic com-munities to projected global climate change. Glob. Change Biol. 21, 154–164 (2015).
13. D. P. Tittensor et al., A protocol for the intercomparison of marine fishery and eco-system models: Fish-MIP v1.0. Geosci. Model Dev. 11, 1421–1442 (2018).
14. L. Bopp et al., Multiple stressors of ocean ecosystems in the 21st century: Projectionswith CMIP5 models. Biogeosciences 10, 6225–6245 (2013).
15. J. Schewe et al., Multimodel assessment of water scarcity under climate change. Proc.Natl. Acad. Sci. U.S.A. 111, 3245–3250 (2014).
16. F. Piontek et al., Multisectoral climate impact hotspots in a warming world. Proc. Natl.Acad. Sci. U.S.A. 111, 3233–3238 (2014).
17. K. Nishina et al., Decomposing uncertainties in the future terrestrial carbon budgetassociated with emission scenarios, climate projections, and ecosystem simulationsusing the ISI-MIP results. Earth Syst. Dynam. 6, 435–445 (2015).
18. L. Kwiatkowski, O. Aumont, L. Bopp, Consistent trophic amplification of marinebiomass declines under climate change. Glob. Change Biol. 25, 218–229 (2019).
19. D. A. Carozza, D. Bianchi, E. D. Galbraith, Metabolic impacts of climate change onmarine ecosystems: Implications for fish communities and fisheries. Glob. Ecol. Bio-geogr. 28, 158–169 (2018).
20. V. Christensen et al., A century of fish biomass decline in the ocean. Mar. Ecol. Prog.Ser. 512, 155–166 (2014).
21. C. Costello et al., Global fishery prospects under contrasting management regimes.Proc. Natl. Acad. Sci. U.S.A. 113, 5125–5129 (2016).
22. C. M. Roberts et al., Marine reserves can mitigate and promote adaptation to climatechange. Proc. Natl. Acad. Sci. U.S.A. 114, 6167–6175 (2017).
23. O. Maury et al., From shared socio-economic pathways (SSPs) to oceanic systempathways (OSPs): Building policy-relevant scenarios for global oceanic ecosystems andfisheries. Glob. Environ. Change 45, 203–216 (2017).
24. M. R. Payne et al., Uncertainties in projecting climate change impacts in marineecosystems. ICES J. Mar. Sci. 73, 1272–1282 (2016).
25. W. W. L. Cheung et al., Building confidence in projections of the responses of livingmarine resources to climate change. ICES J. Mar. Sci. 73, 1283–1296 (2016).
26. A. Bryndum-Buchholz et al., Twenty-first-century climate change impacts on marine animalbiomass and ecosystem structure across ocean basins.Glob. Change Biol. 25, 459–472 (2019).
27. C. J. Brown et al., Effects of climate-driven primary production change on marine foodwebs: Implications for fisheries and conservation. Glob. Change Biol. 16, 1194–1212 (2010).
28. J. A. Fernandes et al., Modelling the effects of climate change on the distribution andproduction of marine fishes: Accounting for trophic interactions in a dynamic bio-climate envelope model. Glob. Change Biol. 19, 2596–2607 (2013).
29. B. Worm, T. A. Branch, The future of fish. Trends Ecol. Evol. 27, 594–599 (2012).30. C. M. Free et al., Impacts of historical warming on marine fisheries production. Science
363, 979–983 (2019).31. J. A. Estes, M. Heithaus, D. J. McCauley, D. B. Rasher, B. Worm, Megafaunal impacts on
structure and function of ocean ecosystems.Annu. Rev. Environ. Resour. 41, 83–116 (2016).32. G. L. Britten et al., Predator decline leads to decreased stability in a coastal fish
community. Ecol. Lett. 17, 1518–1525 (2014).33. J. A. Estes et al., Trophic downgrading of planet Earth. Science 333, 301–306 (2011).34. Food and Agriculture Organization, The State of World Fisheries and Aquaculture
2016 (Food and Agriculture Organization, Rome, Italy, 2016).35. W. W. L. Cheung, G. Reygondeau, T. L. Frölicher, Large benefits to marine fisheries of
meeting the 1.5°C global warming target. Science 354, 1591–1594 (2016).36. B. Planque et al., How does fishing alter marine populations and ecosystems sensi-
tivity to climate? J. Mar. Syst. 79, 403–417 (2010).37. G. L. Britten, M. Dowd, B. Worm, Changing recruitment capacity in global fish stocks.
Proc. Natl. Acad. Sci. U.S.A. 113, 134–139 (2016).38. B. S. Halpern et al., Spatial and temporal changes in cumulative human impacts on the
world’s ocean. Nat. Commun. 6, 7615 (2015).39. J. Holt et al., Prospects for improving the representation of coastal and shelf seas in
global ocean models. Geosci. Model Dev. 10, 499–523 (2017).40. A. C. Ruane et al., The Vulnerability, Impacts, Adaptation and Climate Services Advisory
Board (VIACS AB v1.0) contribution to CMIP6. Geosci. Model Dev. 9, 3493–3515 (2016).41. E. A. Fulton et al., “Decadal scale projection of changes in Australian fisheries stocks
under climate change” (CSIRO Rep. to FRDC Project No. 2016/139, Fisheries Researchand Development Corporation, Hobart, TAS, Australia, 2018).
42. S. C. Anderson et al., Improving estimates of population status and trend with su-perensemble models. Fish Fish. 18, 732–741 (2017).
43. W. W. L. Cheung, M. C. Jones, G. Reygondeau, T. L. Frölicher, Opportunities forclimate-risk reduction through effective fisheries management. Glob. Change Biol.24, 5149–5163 (2018).
44. Y. Ye, N. L. Gutierrez, Ending fishery overexploitation by expanding from local suc-cesses to globalized solutions. Nat. Ecol. Evol. 1, 0179 (2017).
45. D. P. Tittensor et al., ISIMIP2a Simulation Data from Fisheries & Marine Ecosystems(Fish-MIP; Global) Sector. Potsdam Institute for Climate Impact Research. GFZ DataServices. http://doi.org/10.5880/PIK.2018.005. Deposited 31 January 2018.
6 of 6 | www.pnas.org/cgi/doi/10.1073/pnas.1900194116 Lotze et al.