global equity capital markets...
TRANSCRIPT

GLOBAL EQUITY CAPITAL MARKETS REVIEW MANAGING UNDERWRITERS First Quarter 2017
REUTERS/Eddie Keogh

US Year-on-Year % Change in ECM Volume 7
US Block Trades 6
Top US Equity and Equity-Related Deals 7
US Convertibles (C9a) 6
11 Regional Contacts
Thomson Reuters Solutions for the Deal Making Community
Asia Convertibles, inc Chinese A-shares (C9b)
US Common Stock (C3) 6
US Secondary Offerings (C8a) 6 12
US Deals Intelligence 5 Equity Capital Markets Criteria Summary 16
16
US IPOs (C6) 5 11
US Equity & Equity-Related (C1a) 5
10 Japan Convertible Offerings (C9e) 15
US Equity Criteria Summary
EMEA Rights Offerings (C8fr)Global Equity Rankings - Last Ten Years 4
Global IPOs (C5) 3 EMEA IPOs (C7c) 10 Japan Secondary Offerings (C8d) 15
Global Convertibles (C9) 3 EMEA Common Stock (C4c) 10 Japan IPOs (C7d) 15
EMEA Deals Intelligence 9 Japan Equity & Equity-Related (C1e) 14
9 Japan Common Stock (C4d) 14EMEA Equity & Equity-related (C1d)
Australian ECM Proceeds by Industry 13
Global Debt, Equity & Equity Related (A1) 2 Japan Equity
Global Scorecard 2
EMEA Equity
Latin America Equity & Equity Related (C1f) 8 Australian Equity & Equity-related (AK1) 13
Leading Underwriters for First Quarter 2017 2 Latin America Proceeds by Domicile Nation & Sector 8 Australian Common Stock (AK2) 13
First Quarter 2017 | Equity Capital Markets | Managing Underwriters
Equity Capital Markets Review
Global Equity
Global Common Stock (C2) 3
Australia & New Zealand Equity
Global Deals Intelligence
Table of Contents
Latin America Equity
1
Banking Composite of Top US Equity Bookrunners 7
Latin America Year-on-Year % Change in ECM Volume 8
10EMEA Convertibles (C9d)
Asia Equity
Asia Equity & Equity-Related, inc Chinese A-shares (C1b)
Global Equity & Equity-Related (C1) 2
17
12
Asia Secondary Offerings, inc Chinese A-shares (C8c)
Asia IPOs, inc Chinese A-shares (C7a)
Asia Common Stock, inc Chinese A-shares (C4a)
Asia Equity & Equity-Related, ex Chinese A-shares (C1ba)
12
12

nc
Global Equity & Equity-Related Volume
GLOBAL ECM ACTIVITY HITS TWO-YEAR HIGH, UP 61% - Equity capital markets activity totaled US$192.8billion during the first quarter of 2017, a 61% increase compared to a year ago and the strongest first quarter forglobal equity capital markets issuance in two years. By number of issues, 1,332 ECM offerings were brought tomarket during the first quarter, a 57% increase compared to a year ago and the strongest annual period for newofferings since the first quarter of 1996, when 1,333 deals priced.
FOLLOW-ON OFFERINGS UP 44%, ACCOUNT FOR 68% OF ECM - Global follow-on offerings totaled US$130.8billion during first quarter 2017, an increase of 44% compared to a year ago and the strongest first quarter forfollow-on offerings since 2015. Follow-on offerings from companies in the Financial sector accounted for 27% ofcapital raising during the first quarter of 2017, up significantly from 7% of overall follow-on offerings a year ago.
TRIPLE-DIGIT PERCENTAGE INCREASE FOR GLOBAL IPOs - Global initial public offering activity during thefirst quarter of 2017 totaled US$32.8 billion, a triple-digit percentage increase compared to last year and thestrongest opening period for global IPOs since 2015. Proceeds from US IPO listings surpassed US$11 billion forthe first time since the first quarter of 2014, while IPO activity in EMEA increased 29%. Asia Pacific (ex. Australia)IPO activity increased 74% from 2016. Global IPO proceeds during the first quarter declined 34% compared to thefourth quarter of last year and 6% by number of deals.
CHINA ISSUERS ACCOUNT FOR 16% OF GLOBAL ECM - Issuers from China raised US$30.8 billion in theglobal equity capital markets during first quarter 2017, an increase of 27% compared with levels seen a year ago.As a percentage of global ECM, China accounts for 16% of overall issuance, a downtick from the 20% recorded
First Quarter 2017
EQUITY CAPITAL MARKETS REVIEW Global Equity Capital Markets Up 61% from 2016 | China ECM Up 27%; US ECM Up 63% | IPO Activity Up Triple-Digit Percentages, Hits 2-Year High | ECM Fees Up 97%
Global Initial Public OfferingsGlobal Deals Intelligence
1,600$400Proceeds (US$b) # of Issues
0
10
20
30
40
50
60
70
$0
$20
$40
$60
$80
$100
$120
$140
1 2 3 4 1 2 3 4 1 2 3 4 1 2 3 4 1 2 3 4 1 2 3 4 1 2 3 4 1 2 3 4 1 2 3 4 1
2008 2009 2010 2011 2012 2013 2014 2015 2016 17
% o
f Pro
ceed
s fro
m A
sia
Pac
ific
Pro
ceed
s (U
S$b
)
Global IPOs (US$bil) US Listed IPOs as % of Global IPOs
Global Equity & Equity-Related Volume by Domicile Region
s a pe ce tage o g oba C , C a accou ts o 6% o o e a ssua ce, a do t c o t e 0% eco dedduring first quarter 2016, which was the highest first quarter percentage since records began in 1980. Offerings byUS issuers, which accounted for 31% of first quarter 2017 ECM activity, increased 63% compared to a year ago.
FOUR SECTORS ACCOUNT FOR OVER 61% OF ACTIVITY - Led by Financial issuance (24%), the overallvolume of equity capital markets activity remained highly concentrated among four main sectors including Energy& Power (15%), Industrials (12%), and Technology (10%).
GOLDMAN SACHS TOPS GLOBAL ECM RANKINGS - Goldman Sachs led all equity capital marketsunderwriters during the first quarter of 2017, with US$16.6 billion in proceeds from 87 issues and an increase of 0.3 market share points compared to a year ago. JP Morgan fell to second place with a market share decrease of 0.5points, while Bank of America Merrill Lynch maintained third place with a market share of 6.2%, unchanged from ayear ago.
ECM FEES INCREASE 97% - According to estimates, fees from equity capital markets transactions during the firstquarter of 2017 totaled US$5.1 billion, up 97% compared to levels seen during first quarter 2016.
0
200
400
600
800
1,000
1,200
1,400
$0
$100
$200
$300
1 2 3 4 1 2 3 4 1 2 3 4 1 2 3 4 1 2 3 4 1 2 3 4 1 2 3 4 1 2 3 4 1 2 3 4 1
2008 2009 2010 2011 2012 2013 2014 2015 2016 17
# of
Issu
es
Pro
ceed
s (U
S$b
)
oceeds (US$b) # o ssues
0%
10%
20%
30%
40%
50%
60%
70%
80%
90%
100%
2000 2001 2002 2003 2004 2005 2006 2007 2008 2009 2010 2011 2012 2013 2014 2015 2016 2017
Africa/Middle East/Central Asia Japan Asia Pacific E rope Americas
Visit http://dmi.thomsonreuters.com to view archives and order custom League Tables https://www.thomsonone.com
Africa/Middle East/Central Asia Japan Asia-Pacific Europe Americas1

▲
164 10.2% ▲Australia (C8b) 2,228.0 113 1,635.7 104 36.2% ▲
130,831.5 908 90,725.8 597 44.2% ▲1,543.0 4 100.5 1 1435.3% ▲1,961.2 31 1,297.3 26 51.2% ▲5,392.0 33 4,193.7 30 28.6% ▲
135.4 15 53.6 5 152.6% ▲12,923.9 231 7,439.0 117 73.7% ▲10,319.3 22 487.7 7 2015.9% ▲32,797.8 348 13,572.0 187 141.7% ▲
3,510.2 7 253.2 3 1286.3% ▲9,540.5 67 3,624.5 47 163.2% ▲
50,988.8 269 24,282.8 195 110.0% ▲2,363.4 128 1,689.3 109 39.9% ▲
37,509.9 436 29,756.2 281 26.1% ▲50,389.6 212 34,131.5 108 47.6% ▲
163,629.3 1,256 104,297.8 784 56.9% ▲3,510.2 7 253.2 3 1286.3% ▲
12,606.4 74 6,562.5 56 92.1% ▲58,890.5 284 30,950.5 210 90.3% ▲
2,373.3 129 1,689.3 109 40.5% ▲42,889.7 452 33,155.0 314 29.4% ▲
▲United States (C1a) 62,925.0 245 36,550.5 116 72.2% ▲
Deals US$m Deals in ProceedsGlobal Equity & Equity-Related (C1) 192,772.9 1,332 119,788.5 851 60.9%
Global Scorecard1/1/2017 - 3/31/2017 1/1/2016 - 3/31/2016
Proceeds No. Proceeds No. % Change
EMEA Europe Middle East & Africa (C8f) 45 596 8 236 165 127 0%
Asia Pacific ex Australia (C8c) 24,586.1 205 22,317.1United States (C8a) 40,070.4 190 33,643.8
US$m
▲ 1
8.3 6.8 ▲ 1UBS 16.5 13.8 ▲ 1
3
Goldman Sachs & Co 7.8 0.0 - 211.5 0.4 ▲ 2
11.0 0.8 ▲ 1
114.2 6.0 ▲ 1
Bank of America Merrill Lynch 13.1 -10.8 ▼ 2
11.1 -0.1 ▼ 1
JP Morgan 17.7 2.3 ▲ 2
8.6 1.3 ▲ 1Goldman Sachs & Co 8.2 1.1 ▲ 1
1JP Morgan 7.9 1.1 ▲ 1
Mkt. Share Chg. from Last Qtr (%)
Consecutive Quarters No. 1No. 1 Manager
Sumitomo Mitsui Finl Grp Inc 19 7 2 0
101 19.1% ▲Global Secondary Offerings (C8)Goldman Sachs & Co
20 089 1
Latin America (C7e)Japan (C7d)EMEA - Europe, Middle East & Africa (C7c)Australia (C7b)Goldman Sachs & Co
JP Morgan 40.4 20.4 ▲
Asia Pacific ex Australia (C7a)United States (C6)JP MorganGlobal IPOs (C5)Latin America (C4e)Japan (C4d)EMEA - Europe, Middle East & Africa (C4c)JP MorganAustralia (C4b)Asia Pacific ex Australia (C4a)JP Morgan
JP Morgan 10.8 0.1 ▲
United States (C3)Global Common Stock (C2)Latin America (C1f)Japan (C1e)JP Morgan 7.0 0.1 ▲ 2EMEA - Europe, Middle East & Africa (C1d)Australia (C1c)Goldman Sachs & CoAsia Pacific ex Australia (C1b)
First Quarter 2017 | Equity Capital Markets | Managing Underwriters
Global Equity Capital Markets
Market Sector
JP Morgan
Current Qtr Market Sh. (%)
7.5 2.1 ▲
US Convertibles (C9a)
EMEA Equity & Equity-Related (C1d)
US
Global Equity & Equity-related (C1)Global Common Stock (C2)Global IPOs (C5)
Europe, Middle East & Africa (EMEA)
GlobalGlobal Debt, Equity & Equity-Related (A1)Global Disclosed Fees (A2)
Japan Equity & Equity Related (C1e)
Asia-Pacific ex. Japan ex. Australia
Japan
Global Convertibles (C9)
US Equity & Equity-Related (C1a)US Common Stock (C3)US IPOs (C6)
Leading Underwriters for the First Quarter of 2017
EMEA Common Stock (C4c)EMEA IPOs (C7c)EMEA Convertibles (C9d)
Asia-Pacific Common Stock (C4a)Asia-Pacific Convertibles (C9b)
▼▲
3,066.0 7 2,938.0 9 4.4% ▲
-EMEA - Europe, Middle East & Africa (C9d) 7,901.7 15 6,667.7 15 18.5% ▲Australia (C9c) 9.9
▲Asia Pacific ex Australia (C9b) 5,379.7 16 3,398.9 33 58.3% ▲
▲Global Convertible Offerings (C9) 29,143.7 76 15,490.7 67 88.1% ▲Latin America (C8e) 1,967.3
▲Japan (C8d) 7,579.3 36 2,327.2 21 225.7% ▲
1 - - -
United States (C9a) 12,535.4 33 2,419.0 8 418.2%
3 152.7 2 1188.3%
EMEA - Europe, Middle East & Africa (C8f) 45,596.8 236 165 127.0%
Nomura 30.1 3.9 ▲ 3
▲ 1Sumitomo Mitsui Finl Grp Inc 25.8 7.7 ▲ 1
Industry % Change from Last QuarterIndustry % Change from Same Period Last Year
China International Capital Co 17 21
Sumitomo Mitsui Finl Grp Inc 19.7 2.0
Japan (C9e)
▼17.1% ▲ -3.8% 34.8% ▲60.9% ▲ 56.5% 97.0% ▲
Industry Total 192,772.9 100.0 1,332 +481 5,071.03,108.2 61.3
100.0
1.2 +1.1 ▲Top Twenty Total 129,039.8 66.9
▲ 15 1.1 +13 ▲ 63.0China Securities Co Ltd 20 64 2,125.5 1.1 +0.92.1 +4 ▲ 1.7 -1.7 ▼
0.6 +0.1 ▲Nomura 19 10 2,271.9 1.2 -1.5 ▼
0.7 +0.3 ▲Societe Generale 18 26 2,350.8 1.2 +0.3 ▲
▲ 11 0.8 +4 ▲ 37.12,395.8 1.2 +0.1
13 ▼ ▲17 1.32,483.3 1.3
▼16 42 ▲ ▲ ▲1.9 +13 131.1 2.6
Industry % Change from Last Quarter 28.2% ▲ -4.6% 38.7% ▲▼
100.0
Industry % Change from Same Period Last Year -2.7% ▼ -3.2% 43.6% ▲
7,668.2 62.8Industry Total 1,927,811.2 100.0 -194
19 24 ▼ ▲ ▼20 40 ▲ ▲ ▲153.1 1.3 +0.2
5,814 12,214.2Top Twenty Total 1,333,672.4 69.2
0.5 -0.1BMO Capital Markets 18,784.9 1.0 +0.5 106 1.8 +37
1.0 -0.1 1.8 +43.2 +36 ▲▲ 2.1 -0.1 ▼
1.2 -0.3 ▼UBS 18 22 29,656.7 1.5 +0.1
▼ 200 3.4 +57 ▲ 148.3TD Securities Inc 17 13 32,604.4 1.7 -0.2
▲ ▲ ▼16 12 ▼ ▲ ▲
263 4.5
28 86.3UniCredit 19,823.4 103 57.014 31.81.1 +4 ▲
+1.7
187 251.6
+2 54.5 1.1 -0.32,632.2 1.4 -0.4+0.9 25
1.7 -0.4 Guotai Junan Securities1.2 +0.1 Sumitomo Mitsui Finl Grp Inc
15+75 204.9145 2.5 +27 143.4
Mizuho Financial Group 37,734.0 2.0 +0.5Societe Generale 35,309.1 1.8 -0.1
15 21+14 ▲ 53.4 1.1 +0.1 ▲2,654.7 1.4 +0.3 ▲ 24 1.81.4 -0.4 ▼ BNP Paribas SA 14 22▲ 207 3.6 +38 ▲ 166.7Nomura 14 17 40,865.9 2.1 +0.5+26 ▲ 81.6 1.6 -0.7 ▼2,676.7 1.4 0.0 - 40 3.01.1 +0.1 ▲ BMO Capital Markets 13 15▲ 167 2.9 +25 ▲ 136.5Credit Agricole CIB 13 16 41,116.9 2.1 +0.5+3 ▲ 58.4 1.2 -0.3 ▼3,338.8 1.7 0.0 - 15 1.12.3 +0.1 ▲ CITIC 12 14▲ 253 4.4 +74 ▲ 285.8RBC Capital Markets 12 19 44,314.5 2.3 +0.8+31 ▲ 106.8 2.1 +0.6 ▲3,742.5 1.9 +0.9 ▲ 43 3.22.5 -0.4 ▼ Wells Fargo & Co 11 25▲ 295 5.1 +55 ▲ 308.9Wells Fargo & Co 11 10 55,576.1 2.9 +0.3+12 ▲ 109.7 2.2 -1.0 ▼4,448.8 2.3 -1.2 ▼ 40 3.03.4 +0.7 ▲ RBC Capital Markets 10 8▲ 289 5.0 +110 ▲ 411.5Credit Suisse 10 11 55,704.3 2.9 +1.0+30 ▲ 160.7 3.2 -0.2 ▼6,253.4 3.2 -0.4 ▼ 58 4.42.0 0.0 - Credit Suisse 9 7▲ 254 4.4 +50 ▲ 243.5BNP Paribas SA 9 9 62,346.4 3.2 +0.2+42 ▲ 134.0 2.6 +0.5 ▲6,498.0 3.4 +0.9 ▲ 60 4.52.8 +0.6 ▲ Barclays 8 11▲ 359 6.2 +30 ▲ 336.9HSBC Holdings PLC 8 6 84,108.4 4.4 +0.4+26 ▲ 202.6 4.0 +2.0 ▲8,848.9 4.6 +1.3 ▲ 53 4.04.3 +1.1 ▲ Deutsche Bank 7 9▲ 370 6.4 +51 ▲ 523.7Deutsche Bank 7 7 85,214.0 4.4 +0.4+31 ▲ 145.6 2.9 -0.3 ▼9,113.1 4.7 +0.3 ▲ 59 4.46.2 +0.9 ▲ UBS 6 5▲ 358 6.2 +89 ▲ 758.9Goldman Sachs & Co 6 5 95,672.4 5.0 +0.5+53 ▲ 305.5 6.0 -0.6 ▼11,257.7 5.8 -0.3 ▼ 95 7.15.3 +0.2 ▲ Morgan Stanley 5 4▲ 426 7.3 +115 ▲ 643.5Morgan Stanley 5 8 96,897.9 5.0 +1.4+56 ▲ 257.4 5.1 +1.7 ▲11,300.5 5.9 +1.5 ▲ 91 6.84.1 +0.7 ▲ Citi 4 6▲ 415 7.1 +104 ▲ 503.1Barclays 4 4 109,247.5 5.7 +0.6+46 ▲ 280.1 5.5 -1.3 ▼11,906.0 6.2 0.0 - 91 6.85.9 -0.6 ▼ Bank of America Merrill Lynch 3 3▲ 498 8.6 +110 ▲ 718.1Bank of America Merrill Lynch 3 3 115,910.1 6.0 +0.7+43 ▲ 397.8 7.9 -0.5 ▼16,172.0 8.4 -0.5 ▼ 101 7.65.8 +1.2 ▲ JP Morgan 2 1▲ 560 9.6 +144 ▲ 708.1Citi 2 2 128,495.0 6.7 +1.3+38 ▲ 410.8 8.1 +2.4 ▲16,569.2 8.6 +0.3 ▲ 87 6.57.9 +1.1 ▲ Goldman Sachs & Co 1 2▲ 555 9.5 +101 ▲ 964.7JP Morgan 1 1 144,290.5 7.5 +1.1
Fees Sh. (%)# of Deals Share Ch.Proceeds Sh. (%) Deals Sh. (%)Share Ch.BookrunnerShare Ch.2017 Rank
2016 RankDeals Sh. (%) Fees
Market MarketBookrunner Proceeds Sh. (%)
2017 Rank
2016 Rank
Market Market # of MarketMarketShare Ch. # of Deals
# of MarketSh. (%)
Proceeds per Bookrunner (US$m)Imputed Fees (US$m)Proceeds per Bookrunner (US$m) # of Deals per BookrunnerManager MarketChange in
# of Deals per Bookrunner Imputed Fees (US$m)Market
Japan Common Stock (C4d)Japan IPOs (C7d)
ManagerChange in Market
Global Equity & Equity-Related (C1) Jan 1 - Mar 31Jan 1 - Mar 31Global Debt, Equity & Equity-Related (A1)
20,089.1Japan Equity & Equity-Related (C1e)
Visit http://dmi.thomsonreuters.com to view archives and order custom League Tables https://www.thomsonone.com2

▲ ▲▲ Industry % Change from Same Period Last Year 88 1% ▲ ▲13 4% 106 3%
+9 605.0 100.0
Industry % Change from Same Period Last Year 56 9% ▲ 60 2% 95 8%
534.8 88.426,609.1 91.329,143.7 100.0 76
58.3 Top Twenty Total100.0 Industry Total
2,603.31,256 +472 4,466.0
Top Twenty Total 105,425.9 64.4Industry Total 163,629.3 100.0
+15.30.8 +0.4 ▲ ▲ 9.2 1.5 -0.5 ▼499.6 1.7 -0.7 ▼ 4Credit Agricole CIB 20 12▲ 10 0.8 +6 ▲ 35.3China International Capital Co 20 27 1,672.5 1.0 +0.1+8 ▲ 15.1 2.5 0.0 -512.3 1.8 +1.8 ▲ 8 10.51.5 +0.5 ▲ Barclays 19 -- 22 1.8 +9 ▲ 67.7Haitong Securities Co Ltd 19 22 1,758.9 1.1 0.0+2 ▲ 10.0 1.7 +1.2 ▲521.2 1.8 +0.9 ▲ 4 5.30.5 0.0 - Societe Generale 18 21▲ 10 0.8 +2 ▲ 21.8Societe Generale 18 26 1,829.6 1.1 +0.1-1 ▼ 8.7 1.4 -4.0 ▼611.8 2.1 -3.7 ▼ 5 6.61.6 -0.9 ▼ BNP Paribas SA 17 5▼ 34 2.7 +21 ▲ 69.1BMO Capital Markets 17 14 1,997.1 1.2 -0.4
+2 ▲ 10.2 1.7 +0.5 ▲617.0 2.1 +0.6 ▲ 4 5.31.0 +0.6 ▲ HSBC Holdings PLC 16 14▲ 19 1.5 +15 ▲ 44.6BNP Paribas SA 16 43 2,042.9 1.3 +0.9+5 ▲ 12.5 2.1 +1.9 ▲679.6 2.3 +2.1 ▲ 6 7.91.4 +1.2 ▲ BMO Capital Markets 15 35*▲ 15 1.2 +13 ▲ 62.8China Securities Co Ltd 15 60 2,125.5 1.3 +1.00 - 1.8 0.3 -0.6 ▼723.3 2.5 +1.7 ▲ 1 1.32.9 +2.2 ▲ CITIC 12* 22*▲ 24 1.9 +13 ▲ 128.7Sumitomo Mitsui Finl Grp Inc 14 53 2,456.5 1.5 +1.2-2 ▼ 1.8 0.3 -0.7 ▼723.3 2.5 +0.1 ▲ 1 1.31.3 -0.3 ▼ China International Capital Co 12* 11▼ 14 1.1 +3 ▲ 56.6CITIC 13 13 2,615.5 1.6 -0.3
+1 ▲ 1.8 0.3 0.0 -723.3 2.5 +2.5 ▲ 1 1.31.2 -0.4 ▼ Everbright Securities Co Ltd 12* -▼ 17 1.4 +2 ▲ 54.5Guotai Junan Securities 12 12 2,632.2 1.6 -0.5+5 ▲ 14.9 2.5 +2.1 ▲813.4 2.8 +2.0 ▲ 6 7.92.0 +0.4 ▲ Credit Suisse 11 22*▲ 35 2.8 +23 ▲ 88.7Wells Fargo & Co 11 21 2,791.1 1.7 +0.50 - 15.1 2.5 -4.4 ▼851.4 2.9 -0.9 ▼ 4 5.32.3 -1.1 ▼ Mizuho Financial Group 10 8▼ 37 2.9 +11 ▲ 102.5RBC Capital Markets 10 8 4,236.1 2.6 -1.3
+8 ▲ 18.2 3.0 +2.5 ▲951.4 3.3 +3.3 ▲ 8 10.53.3 -0.4 ▼ Wells Fargo & Co 9 -▼ 52 4.1 +25 ▲ 145.9Credit Suisse 9 7 5,440.0 3.3 -0.7+7 ▲ 34.7 5.7 +0.9 ▲969.1 3.3 -1.1 ▼ 11 14.52.7 +0.4 ▲ Citi 8 7▲ 52 4.1 +34 ▲ 118.9Barclays 8 10 5,985.7 3.7 +0.80 - 21.8 3.6 -11.8 ▼1,056.3 3.6 -10.5 ▼ 4 5.33.2 +1.1 ▲ Nomura 7 2▲ 44 3.5 +20 ▲ 143.8Deutsche Bank 7 9 6,338.5 3.9 +0.4
+3 ▲ 10.8 1.8 0.0 -1,410.2 4.8 +2.1 ▲ 6 7.93.0 -0.4 ▼ UBS 6 10- 53 4.2 +28 ▲ 134.8UBS 6 5 7,703.0 4.7 0.0+11 ▲ 25.7 4.3 -1.1 ▼1,643.3 5.6 +0.4 ▲ 15 19.75.5 -0.5 ▼ Bank of America Merrill Lynch 5 6▲ 78 6.2 +40 ▲ 245.0Morgan Stanley 5 4 8,743.4 5.3 +0.1+6 ▲ 58.8 9.7 +8.3 ▲2,510.4 8.6 +6.4 ▲ 9 11.85.7 -1.2 ▼ Deutsche Bank 4 13- 76 6.1 +35 ▲ 254.5Bank of America Merrill Lynch 4 3 10,262.7 6.3 0.0+13 ▲ 60.5 10.0 -1.1 ▼2,514.3 8.6 -3.9 ▼ 17 22.45.0 +1.8 ▲ Morgan Stanley 3 3▲ 80 6.4 +49 ▲ 222.7Citi 3 6 10,331.4 6.3 +2.0+6 ▲ 97.0 16.0 +7.2 ▲3,109.0 10.7 +2.2 ▲ 13 17.16.5 -1.3 ▼ Goldman Sachs & Co 2 4▼ 80 6.4 +31 ▲ 291.6
106.2 17.6 +4.5 ▲JP Morgan 2 2 11,003.1 6.7 -1.3
+2.6 ▲ 21 27.6 +12 ▲▲ JP Morgan 1 1 5,168.9 17.75.9 +32 ▲ 313.8 7.0 +1.7Sh. (%) Share Ch.
Goldman Sachs & Co 1 1 13,460.2 8.2 -0.1 ▼ 74Sh. (%) Share Ch. Deals Sh. (%) # of Deals Fees
Market MarketBookrunner Proceeds Sh. (%) Share Ch. Deals Sh. (%) # of Deals Fees
Market Market # of Market Change in ManagerManager Market Market 2017 Rank
2016 RankSh. (%) Share Ch. Bookrunner Proceeds
Market Market # of Market Change in
Jan 1 - Mar 31 Global Convertibles (C9) Jan 1 - Mar 31
Proceeds per Bookrunner (US$m) # of Deals per Bookrunner Imputed Fees (US$m) Proceeds per Bookrunner (US$m) # of Deals per Bookrunner
Global Equity Capital Markets
Imputed Fees (US$m)2017 Rank
2016 Rank
Global Common Stock (C2)
First Quarter 2017 | Equity Capital Markets | Managing Underwriters
*tie
▼▲ ▲
▼▲ Industry % Change from Same Period Last Year 88.1% ▲
Global Equity & Equity-Related Quarterly Imputed Fees (US$Bil)
Industry % Change from Last Quarter -33.6% ▼ -5.9% 3.2% ▲▲141.7% ▲ 86.1% 256.3%
57.8348 +161 1,527.2 100.0
882.7Top Twenty Total 19,913.1 60.7Industry Total 32,797.8 100.0
1.7 +1.6 ▲▲ 5 1.4 +4 ▲ 25.6Wells Fargo & Co 20 86* 432.3 1.3 +1.10.7 +0.7 ▲▲ 5 1.4 +4 ▲ 11.3Santander 19 90* 505.6 1.5 +1.42.4 +1.4 ▲▲ 9 2.6 +8 ▲ 36.3Sinolink Securities Co Ltd 18 45* 556.6 1.7 +1.21.6 -2.8 ▼▼ 8 2.3 +2 ▲ 23.9Guotai Junan Securities 17 5 585.5 1.8 -1.70.5 +0.5 ▲▲ 2 0.6 +2 ▲ 8.3Allen & Co Inc 16 - 600.9 1.8 +1.82.3 -3.0 ▼▼ 13 3.7 +7 ▲ 34.4Nomura 15 9 612.6 1.9 -1.01.8 +1.5 ▲▲ 10 2.9 +9 ▲ 27.6RBC Capital Markets 14 81* 653.0 2.0 +1.82.7 +2.7 ▲▲ 9 2.6 +9 ▲ 41.1China Securities Co Ltd 13 - 703.8 2.2 +2.22.2 +1.0 ▲▼ 10 2.9 +4 ▲ 33.9Bank of America Merrill Lynch 12 11 722.8 2.2 -0.52.0 -2.6 ▼▼ 8 2.3 +4 ▲ 30.0CITIC 11 7 725.0 2.2 -1.21.7 +0.8 ▲▲ 7 2.0 +5 ▲ 26.3China International Capital Co 10 18 780.6 2.4 +0.73.3 +0.9 ▲▼ 17 4.9 +9 ▲ 50.9Haitong Securities Co Ltd 9 2 851.6 2.6 -2.14.1 +1.1 ▲▲ 13 3.7 +9 ▲ 62.5GF Securities 8 17 931.3 2.8 +1.01.9 +1.0 ▲▲ 8 2.3 +6 ▲ 29.3Barclays 7 28 1,113.1 3.4 +2.13.8 +2.3 ▲▲ 18 5.2 +15 ▲ 58.6Citi 6 31 1,225.0 3.7 +2.83.5 +2.5 ▲▲ 12 3.4 +9 ▲ 54.0Deutsche Bank 5 15 1,343.8 4.1 +1.83.2 +2.4 ▲▲ 15 4.3 +11 ▲ 49.3Credit Suisse 4 37 1,451.1 4.4 +3.65.6 -0.4 ▼▼ 14 4.0 +5 ▲ 85.0Morgan Stanley 3 1 1,792.6 5.5 -0.26.0 +2.1 ▲▲ 14 4.0 +8 ▲ 91.5Goldman Sachs & Co 2 4 2,024.2 6.2 +2.26.7 +3.8 ▲▲ 17 4.9 +11 ▲ 102.9JP Morgan 1 3 2,301.7 7.0 +2.8
Bookrunner Proceeds Sh. (%) Share Ch. Deals Sh. (%)2017 Rank
2016 Rank
Market Market Change in Manager Market Market# of Deals Fees Sh. (%) Share Ch.
Market # ofProceeds per Bookrunner (US$m) # of Deals per Bookrunner Imputed Fees (US$m)
-1.3%▲ Industry % Change from Last Quarter 86.0% ▲ 106.5% ▲
Global IPOs (C5) Jan 1 - Mar 31
▲Industry % Change from Last Quarter 9.8% ▲ -4.0% 28.7%
13.4% 106.3%Industry % Change from Same Period Last Year 56.9% ▲ 60.2% 95.8%
▲▼
Industry % Change from Same Period Last Year0
200
400
600
800
1,000
1,200
1,400
1,600
$0
$1
$2
$3
$4
$5
$6
$7
$8
$9
1 2 3 4 1 2 3 4 1 2 3 4 1 2 3 4 1 2 3 4 1 2 3 4 1 2 3 4 1 2 3 4 1 2 3 4 1
2008 2009 2010 2011 2012 2013 2014 2015 2016 17
# of
Issu
es
US
$Bil
Fees (US$bn) # of Issues
Visit http://dmi.thomsonreuters.com to view archives and order custom League Tables https://www.thomsonone.com3

Global Equity Capital Markets: Ten Years of RankingsFirst Quarter 2017 | Equity Capital Markets | Managing Underwriters
1
2
3
4
Goldman Sachs & Co
JP Morgan
Bank of America Merrill Lynch
Citi
Note: League Table positions reflect consolidation within the banking sector.Rankings shown are as of the current quarter-end in each calendar year.
5
6
7
8
9
10
2008 2009 2010 2011 2012 2013 2014 2015 2016 2017
Ran
k
Morgan Stanley
UBS
Deutsche Bank
Barclays
Credit Suisse
RBC Capital Markets
Visit http://dmi.thomsonreuters.com to view archives and order custom League Tables https://www.thomsonone.com
g q y
4

nc
JP MorganBookrunner
CitiBank of America Merrill LynchGoldman Sachs & Co
Deutsche Bank
Credit SuisseBarclaysMorgan Stanley
BMO Capital MarketsJefferies LLCUBSRBC Capital Markets
Wells Fargo & Co
Stifel/KBW
▲▲▼▼▼
-▲▼▲▲▲
-2.3-7.5-7.4
▲
+3.9+2.5-1.0+1.5+3.7+2.2
+0 20.0
+0.1-1.9
10.510.911.1
5.25.96.57.39.09.4
1 12.02.12.2
6,613.86,825.16,957.1
3,275.53,733.54,080.44,582.45,676.95,900.3
660 41,243.01,306.71,353.12,134.6
1494675
171211810
7654
14131211
2016 Rank
1098
+33+41
+37+21
Proceeds per Bookrunner (US$m)
Share Ch.Market
Sh. (%)Market
Proceeds
+9+11+12+14+30+25
+10+9
6 96.1
4043
7.37.8
10.27.8
5547
1942 17.1
16.317.622.4
17151819
▲▲+3526.966
6447
26.119.2
▲▲▲▲▲▲
▲▲▲▲▲▲
Deals# of
# of Deals per BookrunnerChange in Market
-0.7
+1.3
+0 10.0
7.48.4
-3.2+0.8+3.2+1.8-0.7
+1.6+2.1-6.1
3.04.65.25.65.19.5
103.8192.9150.3170.6
39.826.060.294.3
105.0114.4
▼▲+2.513.0263.6
▲▼▲
▲
1 41.62.01.3
▲▲
▲-▼▼▲
ECM Volume Up 72% | IPO Issuance Up Significantly | Technology Sector Dominates Issuance
▼-5.610.5213.6Sh. (%)
US Deals Intelligence
The Technology sector dominated issuance in the first quarter 2017, with three ofthe top ten largest deals. The sector took a 20% share of the market, with US$12.8billion in proceeds. The largest Technology issue of the quarter was the US$3.9billion offering by Snap Inc.
US equity & equity-related proceeds for the first quarter of 2017 totaled US$62.9billion from 245 deals, a 72.2% increase from the same period last year. Accordingto estimates, fees increased 120.6%, to US$2 billion, with the top 20 banks taking82.9% of the wallet.
The number of US IPOs more than tripled in the first quarter, compared to thesame period last year, totaling $10.3 billion - the fourth highest opening volumesince 2008.
US Equity and Equity-related Volume (US$Bil) by Sector and Issue Type First Quarter 2017Jan 1 - Mar 31US Equity & Equity-Related (C1a)
# of Deals
US Equity Capital MarketsFirst Quarter 2017 | Equity Capital Markets | Managing Underwriters
Imputed Fees (US$m)
Share Ch.Market
Sh. (%)Market
FeesManager
28 631.8
253.4 +0.4
▼▲
19.2 +31
2017 Rank
321
321
$12.8 20%
$11.1 18%
$9.2 15%
$5.9 10%
$4.5 7%
$3.7 6%
$8.4 13% $10.3
16%
$40.1 64%
$12.5 20%
Industry % Change from Last Quarter 96.9% ▲ -12.0% ▲▼ 55.5%Industry % Change from Same Period Last Year 2015.9% ▲ 214.3% ▲▲ 1569.0%
Industry Total 10,319.3 100.0 22 +15 469.0425.5 90.7
100.0
0.3 +0.3 ▲Top Twenty Total 10,279.6 99.62
▲ 1 4.5 +1 ▲ 1.5Canaccord Genuity 20 - 25.6 0.3 +0.3+1 ▲ 5.3 1.1 -0.4 ▼
▲Robert W Baird & Co Inc 19 - 35.1 0.3 +0.3 ▲ 1 4.5
4.5 +1 ▲ 4.3 0.9 +0.9-8.7 ▼
FBR Capital Markets Corp 18 - 43.5 0.4 +0.4 ▲ 11 4.5 0 - 3.4 0.7Cowen & Co 17 5* 50.9 0.5 -6.7
+1 ▲ 2.7 0.6 +0.6 ▲▲
Macquarie Group 16 - 61.3 0.6 +0.6 ▲ 1 4.59.1 +2 ▲ 6.9 1.5 +1.5Raymond James Financial Inc 15 - 73.5 0.7 +0.7
+3 ▲ 8.7 1.9 +1.7 ▲-3.1 ▼
Stifel/KBW 14 - 108.3 1.1 +1.1 ▲ 33 13.6 +3 ▲ 6.6 1.4
1.5 -7.2 ▼BMO Capital Markets 13 - 123.4 1.2 +1.2 ▲
▼ 4 18.2 +3 ▲ 7.3Jefferies LLC 12 3* 127.8 1.2 -9.6+4 ▲ 24.3 5.2 +4.4 ▲
▼Wells Fargo & Co 11 10* 432.3 4.2 0.0 - 5 22.7
27.3 +5 ▲ 22.2 4.7 -1.0+4.7 ▲
Citi 10 7 477.1 4.6 -1.3 ▼ 65 22.7 +4 ▲ 25.3 5.4
4.8 +0.5 ▲Bank of America Merrill Lynch 9 10* 506.7 4.9 +0.7 ▲
▲ 7 31.8 +6 ▲ 22.3RBC Capital Markets 8 8* 544.3 5.3 +0.2+2 ▲ 8.3 1.8 +1.8 ▲
+7.1 ▲Allen & Co Inc 7 - 600.9 5.8 +5.8 ▲ 2
6 27.3 +6 ▲ 33.5 7.15.4 +5.4 ▲
Deutsche Bank 6 - 963.4 9.3 +9.3 ▲▲ 7 31.8 +7 ▲ 25.5
33.8 7.2 +0.2 ▲Barclays 5 - 1,054.1 10.2 +10.2
▼Credit Suisse 4 5* 1,098.9 10.7 +3.5 ▲ 8 36.4
31.8 +4 ▲ 56.5 12.1 -4.2+1.2 ▲
Morgan Stanley 3 1 1,155.0 11.2 -10.0 ▼ 79 40.9 +8 ▲ 61.0 13.0
14.1 +5.3 ▲Goldman Sachs & Co 2 3* 1,330.9 12.9 +2.1 ▲
▲ 11 50.0 +10 ▲ 66.1Sh. (%) # of Deals Fees Sh. (%) Share Ch.
JP Morgan 1 2 1,466.6 14.2
Market Change in Manager Market MarketBookrunner Proceeds Sh. (%) Share Ch. Deals
Jan 1 - Mar 31US IPOs (US$Bil)US IPOs (C6) Jan 1 - Mar 31
Proceeds per Bookrunner (US$m) # of Deals per Bookrunner Imputed Fees (US$m)
HSBC Holdings PLCRaymond James Financial IncAllen & Co IncRobert W Baird & Co IncScotiabankStifel/KBW
Industry % Change from Last QuarterIndustry % Change from Same Period Last Year
Industry TotalTop Twenty TotalUS Bancorp ▲
▲▲▲▲▲▲
+0.9+0.4+0.2
+0.6+0.8+0.6+1.0
1.01.01.1
100.091.6
0.60.80.91.0
▲▲
58.2%72.2%
648.1660.4
62,925.057,646.6
395.8510.8537.5600.9
1817
--
22-
281514
2019181716 +9
+3+10
6.10.84.11.66.9
+129
+2+3
0.81.2
16.1%111.2%
▲▲
104
17
245
23
152
▲
▲▲▲▲▲▲
+0.4
▲▲
87.5%120.6%
+0.2+0.4+0.9
+0.70.0
+0.1
100.082.9
0.30.61.40.4
2,030.21,682.1
6.311.928.4
8.322.3
1.4
▲-▲
▲▲▲▲
+3.1
610.7
+11+2
10.028.6
1.10.5
2016 Rank
2017 Rank
Market Market # of
▲ 2
+7 ▲
9.1
▼
13.6
15%$7.2 11%
High Technology Energy and PowerReal Estate FinancialsIndustrials HealthcareMedia and Entertainment Others
IPO Follow-On Convertible
$20.8
$0.8 $3.3 $14.1 $5.7 $8.6 $10.8 $5.4 $0.5 $10.3
11
1
22
27
3734
62
28
7
22
0
10
20
30
40
50
60
70
$‐
$4.0
$8.0
$12.0
$16.0
$20.0
$24.0
2008 2009 2010 2011 2012 2013 2014 2015 2016 2017Proceeds # of Issues
Pro
ceed
sU
S$
Billi
ons
# of
Issu
es
Visit http://dmi.thomsonreuters.com to view archives and order custom League Tables https://www.thomsonone.com
*tieProceeds # of Issues
5

▲
US Secondary Offerings (C8a)
Proceeds per Bookrunner (US$m) # of Deals per Bookrunner Imputed Fees (US$m)
Jan 1 - Mar 31
2017 Rank
2016 Rank
Market MarketProceeds Sh. (%) Share Ch.
# of Market Change in Manager Market
▲ 118.810.0 -5.0
Sh. (%)
9.9 -6.2
5.4 +1.2
Citi 1 5 4,883.3 12.2DealsBookrunner
+5.3 ▲ 35 18.4
▼ 43 22.6 +17
8.5 +3.7-1.8 ▼Bank of America Merrill Lynch 2 3 4,463.8 11.1
+22 ▲ 102.244 23.2 +19 ▲ 119.6
Sh. (%) # of Deals
2 3,909.5 9.8 -8.0 15.8JP Morgan 3 1 3,958.8 9.9 -8.0
Morgan Stanley 5 7 3,321.1+8▼ 30Goldman Sachs & Co 4 ▲ 113.2 9.4 0.0
8.3 +3.4 ▲ 36 18.9 +26 ▲ 93.1 7.8 -0.1Barclays 6 6 3,053.5 7.6 +1.3 ▲ 29 15.3 +19 ▲ 64.7Wells Fargo & Co 7 9 2,349.8 5.9 +2.3 ▲ 29 15.3 +18 ▲ 62.6 5.2 +1.7
▲ 69.1Credit Suisse 8 4 2,347.5 5.9 -2.1▲ 16▼ 27 14.2 +13
2.8 +0.85.8 -0.9
RBC Capital Markets 9 10 1,434.4 3.6 +0.83.3 -1.2 ▼ 17 8.9
8.4 +5 ▲ 33.1-3.1
Deutsche Bank 11 14 1,016.6 2.5UBS 10 8 1,309.9
+1.1 ▲ 9 4.7 +4 ▲Jefferies LLC 12 12 793.0 2.0 0.0 ▲ 23.2
22.0 1.8 +0.2+9 ▲ 23.2 1.9
1.9 -0.8Scotiabank 13 18 648.1 1.6 +1.0 ▲ 8.4▲ 4 2.1 +3
11 5.8 +3-0.7 +0.1
Robert W Baird & Co Inc 14 28 575.5 1.4 +1.2 ▲ 9 4.7 +8 ▲ 17.0 1.4 +1.0Stifel/KBW 15 17 552.1 1.4 +0.7 ▲ 14 7.4 +8 ▲ 19.8BMO Capital Markets 16 11 490.0 1.2 -0.9 ▲ 14.7 1.2 -0.4
1.7 +0.6
Raymond James Financial Inc 17 22 463.9 1.2 +0.8 ▲ 13 6.8 +93.7 +1▼ 7
Piper Jaffray Cos 18 20 371.7 0.9 +0.5 ▲ 17.7▲ 21.4 1.8 +1.2
1.5 +0.5Sandler O'Neill Partners 19 34 345.8 0.9 +0.8 ▲ 12.0▲ 7 3.7 +6
▲ 11 5.8 +61.0 +0.9
Cowen & Co 20 21 335.0 0.8 +0.4 ▲ 10 5.3 +7 ▲ 19.0 1.6 +0.2Top Twenty Total 36,623.3 91.4Industry Total 40,070.4 100.0
974.8190
▲ 88 1% 44 1% ▲
81.2+89 1,200.0 100.0
-
Industry % Change from Same Period Last Year 19 1%
▲▲
MarketShare Ch.
▲▼▼
▼▲▼
▼
▲▼▲▲▲▼▲▲▲▲
Jan 1 - Mar 31
Proceeds per Bookrunner (US$m) # of Deals per Bookrunner Imputed Fees (US$m)2017 Rank
2016 Rank
Market Market # of Market Change in ManagerBookrunner Proceeds Sh. (%) Share Ch.
Market MarketDeals Sh. (%) # of Deals Fees Sh. (%) Share Ch.
JP Morgan 1 1
US Common Stock (C3)
Fees5,425.4 10.8 -7.0 ▼ 54 25.5 +27 ▲ 184.8 11.1 -4.8 ▼
41 19.3 +27Citi 2 5 5,360.4 10.6 7.5 +2.6 ▲Goldman Sachs & Co 3 2 5,240.4 10.4
▲+3.7-7.3 ▼ 39 18.4 +16
US Equity Capital MarketsFirst Quarter 2017 | Equity Capital Markets | Managing Underwriters
▲ 124.4▲ 174.2 10.4 +1.0 ▲
Bank of America Merrill Lynch 4 3 4,970.5 9.9 -2.9 ▼ 49 23.1 +23 ▲ 144.9 8.7 -5.8 ▼Morgan Stanley 5 7 4,476.2 8.9 +3.8 ▲ 43 20.3 +30 ▲ 149.6 9.0 +0.8 ▲Barclays 6 6 4,107.6 8.2 +2.0 ▲ 36 17.0 +26 ▲ 90.2 5.4 +1.3 ▲Credit Suisse 7 4 3,446.5 6.8 -1.2 ▼ 35 16.5 +20 ▲ 102.9 6.2 -0.5 ▼Wells Fargo & Co 8 9 2,782.1 5.5 +1.9 ▲ 34 16.0 +22 ▲ 86.9 5.2 +1.8 ▲Deutsche BankRBC Capital MarketsUBSJefferies LLCStifel/KBW
9 14 1,980.010 10 1,978.711
3.9 +2.5 ▲ 15 7.1 +10+11
12 11
▲ 55.4 3.3 +1.8 ▲3.9 +1.1 ▲ 23 10.8 ▲ 55.4 3.3 +1.3 ▲
8 18 8.5 +10 ▲
13 17
1,333.1 2.7 -1.7 ▼920.8 1.8 -0.3 ▼
25.3 1.5 -3.3 ▼15 7.1 +6 ▲ 30.4 1.8 -1.1 ▼
660.4 1.3 +0.7 ▲ 17 8.0 +11 ▲ 28.5 1.7 +0.6 ▲Scotiabank 14 18 648.1 1.3 +0.7 ▲ 4 1.9 +3 ▲ 9.9 0.6 +0.1 ▲BMO Capital Markets 15 12 613.4 1.2 -0.9 ▼ 10 4.7 +4 ▲ 21.3 1.3 -0.4 ▼Robert W Baird & Co Inc 16 28 610.7 1.2 +1.0 ▲ 10 4.7 +9 ▲ 22.3 1.3 +0.9 ▲Allen & Co Inc 17 - 600.9 1.2 +1.2 ▲ 2 0.9 +2 ▲ 8.3 0.5 +0.5 ▲Raymond James Financial Inc 18 22 537.5 1.1 +0.7 ▲ 15 7.1 +11 ▲ 28.3 1.7 +1.1 ▲Cowen & Co 19 20 385.9 0.8 +0.3 ▲ 11 5.2 +7 ▲ 22.4 1.3 -0.3 ▼Piper Jaffray Cos 20 21 371.7 0.7 +0.3 ▲ 11 5.2 +6 ▲ 22.7 1.4 +0.5 ▲Top Twenty Total 46,450.3 92.2 1,388.1 83.2
+104 1,669.1 100.0Industry Total 50,389.6 100.0 212
Industry % Change from Same Period Last Year 47 6% ▲ 96 3% 93 9% ▲▲
*tie** Rankings exclude self-funded proceeds, per Standard Criteria
▲▲
▲ Industry % Change from Last Quarter 247.0%▲ ▲Industry % Change from Same Period Last Year 418.2% ▲ 312.5% 503.8% ▲
106.3% 300.8% ▲▲
349.6
▲
96.8361.1 100.0
0.3 0.0 -.9Top Nineteen Total 12,512.3 99.8Industry Total 12,535.4 100.0
▲Credit Agricole CIB 19* - 40.9 +1 ▲
+2533
0.3 +0.3+1 ▲ 1.5 0.41 3.0
1 3.0-0.2 ▼
▲BNP Paribas SA 19* - 40.9 0.3 +0.3 ▲
6.1 +2 ▲ 4.0 1.1 +1.1+0.7 ▲
SunTrust Banks 18 - 91.3 0.7 +0.7 ▲ 21 3.0 +1 ▲ 2.4 0.7
1.2 +1.2 ▲ABG Sundal Collier 17 - 100.6 0.8 +0.8 ▲
▲ 1 3.0 +1 ▲ 4.3Nomura 16 - 120.0 1.0 +1.0+1 ▲ 4.8 1.3 -3.5 ▼
-RBC Capital Markets 15 6* 155.9 1.2 -3.6 ▼ 2 6.1
6.1 +2 ▲ 2.2 0.6 0.0+2.6 ▲
Mizuho Financial Group 14 - 184.7 1.5 +1.5 ▲ 23 9.1 +3 ▲ 9.4 2.6
1.6 +1.3 ▲Jefferies LLC 13 - 385.9 3.1 +3.1 ▲
▲ 2 6.1 +2 ▲ 5.9US Bancorp 12 - 395.8 3.2 +3.2+7 ▲ 13.7 3.8 +3.8 ▲
▲Barclays 11 - 474.8 3.8 +3.8 ▲ 7 21.2
9.1 +3 ▲ 8.3 2.3 +1.7-4.8 ▼
HSBC Holdings PLC 10 - 510.8 4.1 +4.1 ▲ 3
▲Citi 9 4 539.9 4.3 -8.4 ▲ 25.9 7.2
-
57.2%
Stifel/KBW 18 15
10.5 2.9 +2.9
+0.7 ▲ 1 ▲ .8
182.3 0.9 +0.6 ▲1.0
4.1 +31.4 +1
10 567.1 2.7 +1.4
Credit Suisse 813 1,513.7 7.1 +6.7
▲ 9
▲ 7
1 3 2,806.4 13.2 +0.7
▲ 88.1% 44.1% ▲Industry % Change from Last Quarter 30.2% ▲ 13.8% 73.7% ▲Industry % Change from Same Period Last Year 19.1%
Market Change in
50.1 10.1
US Block Trades Jan 1 - Mar 31
Proceeds per Bookrunner (US$m) # of Deals per Bookrunner
4 5.5 +3
2017 Rank
2016 Rank Fees
Imputed Fees (US$m)Manager Market Market
Industry % Change from Same Period Last Year 47.6% ▲ 96.3% 93.9% ▲▲Industry % Change from Last Quarter 39.3% ▲ 8.7% 68.1% ▲▲
Sh. (%) Share Ch.Market Market # of
Proceeds Sh. (%) Share Ch.▲ 15 20.5 +7 ▲
Bookrunner Sh. (%) # of DealsDealsCiti
9.9 -1.1+2.8 ▲
Bank of America Merrill Lynch 2 5 2,327.6 11.0 +0.5▲ 20 27.4
28.8 +15 ▲▲ 2110.7 -5.8 ▼
▼Morgan Stanley 3 7 2,269.4 10.7 +7.8Goldman Sachs & Co 4 1 2,176.6 10.3 -26.0 ▼ 12 16.4 0 - 47.3 9.5 -10.4 ▼JP Morgan 5 4 1,675.8 7.9 -4.1 ▼ 15 20.5 +7 ▲ 31.5
+18 ▲ 53.449.3
6.3 -3.7 ▼Barclays 6 6 1,607.7 7.6 +2.7 ▲ 14 19.2 +10 ▲ 29.1 5.8 -1.0 ▼Wells Fargo & Co 7 ▲ 16 21.9 +15 ▲ 29.6 5.9 +4.6 ▲
2 1,090.6 5.1 -8.1 ▼ 11 15.1 +2 ▲ 26.1 5.2 -8.5 ▼UBS 9 8 708.8 3.3 +0.9 12.3 +7 ▲ 11.0 2.2 +0.9 ▲Scotiabank 10 9 648.1 3.1 +1.6 ▲ 4 5.5 +3 ▲ 6.6 1.3 0.0 -RBC Capital Markets 11 11 595.3 2.8 +1.8 9.6 +6 ▲ 11.9 2.4 +2.1 ▲Deutsche Bank 12 ▲ 3 4.1 +2 ▲ 8.0 1.6 -0.3 ▼Jefferies LLC 13 14 520.6 2.5 +2.2 ▲ ▲ 11.9 2.4 +1.6 ▲Robert W Baird & Co Inc 14 - 418.9 2.0 +2.0 ▲ 4 5.5 +4 ▲ 10.5 2.1 +2.1 ▲BMO Capital Markets 15 - 331.9 1.6 +1.6 ▲ 3 4.1 +3 ▲ 8.8 1.8 +1.2 ▲Credit Agricole CIB 16 - 240.9 1.1 +1.1 ▲ 1 1.4 +1 ▲ 2.8 0.6 +0.6 ▲Cantor Fitzgerald LP 17 - 206.3 +1.0 ▲ 2 2.7 +2 ▲ 10.1 2.0 +1.9 ▲
5 6.8 +4 ▲ 8.0 1.6 +0.9 ▲Cowen & Co 19 141.8 0.7 +0.7 ▲ 3 ▲ 9.3 1.9 +1.9 ▲Tudor Pickering & Co LLC 20 - 139.5 0.7 0.2 +0.1 ▲Top Twenty Total 20,169.3 95.1 416.1
73 +34 498.283.5
Industry Total 21,217.0 100.0 100.0
Industry % Change from Same Period Last Year 44.9% ▲ 87.2% 105.2% ▲▲Industry % Change from Last Quarter 1.1% ▲ 10.6%
US Convertibles (C9a) Jan 1 - Mar 31
Proceeds per Bookrunner (US$m) # of Deals per Bookrunner Imputed Fees (US$m)2017 Rank
2016 Rank
Market Market # of MarketProceeds Sh. (%) Share Ch. Deals
Change in Manager Market MarketBookrunner Sh. (%) # of Deals Fees Sh. (%) Share Ch.Bank of America Merrill Lynch 1 3 1,643.3 13.1 -0.3 ▼ 15 45.5 +14 ▲ 25.7 7.1 -6.9 ▼Goldman Sachs & Co 2 2 1,584.6 12.6 -14.7 ▼ 8 24.2 +5 ▲ 89.4 24.8 -0.2 ▼JP Morgan 3 1 1,531.7 12.2 -16.6 ▼ 12 36.4 +8 ▲ 28.8 8.0 -12.2 ▼Deutsche Bank 4 - 1,295.6 10.3 +10.3 ▲ 4 12.1 +4 ▲ 38.9 10.8 +10.8 ▲Morgan Stanley 5 5 1,200.7 9.6 +1.7 ▲ 12 36.4 +11 ▲ 43.3 12.0 +7.7 ▲Wells Fargo & Co 6 - 951.4 7.6 +7.6 ▲ 8 24.2 +8Credit Suisse 7
▲15.2 +5 ▲
18.2 5.0 +2.4 ▲- 633.9 5.1 +5.1 ▲ 5 11.5 3.2 +3.2 ▲
BMO Capital Markets 8 - 629.6 5.0 +5.0 ▲ 5 15.2 +5 ▲▼ 6 18.2 +4
Visit http://dmi.thomsonreuters.com to view archives and order custom League Tables https://www.thomsonone.com6

US Equity Capital MarketsFirst Quarter 2017 | Equity Capital Markets | Managing Underwriters
Top 10 US Equity & Equity-Related Deals (US$Bil) First Quarter 2017US Equity & Equity-Related Industry Composition for Top Bookrunners First Quarter 2017
$3.9
$2.2
$2.2
$1.8
$1.8
$1.5
$1.1
$1.1
$1.0
03/01/17
03/09/17
01/09/17
02/10/17
01/31/17
02/23/17
02/07/17
01/25/17
03/10/17
Snap Inc
Equinix Inc
The Williams Cos Inc
Microchip Technology Inc
Invitation Homes Inc
Plains GP Holdings LP
Parsley Energy Inc
US Foods Holding Corp
DISH Network Corp
13.5%
16 2%13.3%
14.2%38.0%
16.2%13.0%
4.9%12.2% 12.8%
11.6%
12.2%10.7%
8.4%11.2%
4.0%
4.5%4.7%
5.3%4.7% 1.5%
5.8%
2.0%
2.4%
3.0%
3.0%
4.0%
6.2% 6.6%
6.6%
1.8%9.6%
9.8%
4.2%2.4%
3.1%
1.4%2.0% 2.8%
6.8%8.1%
3.1%
6.2%6.6%
9.6%3.3%
4.4%5.3%
60%
70%
80%
90%
100%
US Year-on-Year % Change in ECM Volume (US$Bil) Jan 1 - Mar 31
$0.801/31/17BancWest Corp,Honolulu,HI
-66.2%
164.5%
93.0%
-26.6%
25.9%
-12.7%
51.4%
-58.3%
72.2%
$0.0
$0.2
$0.4
$0.6
$0.8
$1.0
-80%
-30%
20%
70%
120%
170%
220%2009 2010 2011 2012 2013 2014 2015 2016 2017
Proceeds (US$B)
% C
hang
eYO
Y in
Pro
ceed
s
Pro
ceed
s U
S$
Billi
ons
15.2% 15.0%
22.4%
11.9%15.8%
10.2%
21.3%11.2%
17.1%
24.6%
32.1%
26.9%
21.7%
11.1%
19.3%29.4%
20.8%
35.0%
19.7%
16.2%
13.7%
11.4%
11.7%
0%
10%
20%
30%
40%
50%
JP Morgan Goldman Sachs & Co
Bank of America
Merrill Lynch
Citi Credit Suisse
Barclays Morgan Stanley
Wells Fargo Deutsche Bank
RBC Capital Markets
% T
otal
Pro
ceed
s
Real Estate High Technology Financials Industrials Retail Media and Entertainment Healthcare Consumer Products and Services Consumer Staples
Visit http://dmi.thomsonreuters.com to view archives and order custom League Tables https://www.thomsonone.com7

Bank of America Merrill Lynch
+1 ▲ .5
49.012 - 26.913*
XP InvestimentosRaymond James Financial IncPuente Inversiones y Servicios
11 4*
Latin America Equity Capital MarketsFirst Quarter 2017 | Equity Capital Markets | Managing Underwriters
Latin America ECM Volume Up 42%
Latin America Equity and Equity-related Volume (US$Bil) Jan 1 - Mar 31Jan 1 - Mar 31Latin America Equity & Equity Related (C1f)
Proceeds per Bookrunner (US$m) # of Deals per Bookrunner Imputed Fees (US$m)2017 Rank
2016 Rank
Market Market # of Market Change in Manager Market MarketBookrunner Proceeds Sh. (%) Share Ch. Deals Sh. (%) # of Deals Fees Sh. (%) Share Ch.JP Morgan 1 - 582.1 16.6 +16.6 ▲ 4 57.1 +4 ▲ 10.7 21.6 +21.6 ▲Santander 2 1* 575.1 16.4 -10.0 ▼ 5 71.4 +3 ▲ 6.0 12.3 -6.2 ▼Itau Unibanco 3 - 421.0 12.0 +12.0 ▲
6.5 +6.5 ▲Morgan Stanley 7
9.5Banco do Brasil SA 6 - 332.410.9Banco Bradesco SA 5 - 381.511.4Banco BTG Pactual SA 4 1* 398.9
4 57.1 +4 ▲ 3.5 7.1 +7.1 ▲-15.0 ▼ 4 57.1 +2 ▲ 2.9 5.8 -25.4 ▼+10.9 ▲ 4 57.1 +4 ▲ 2.7 5.6 +5.6 ▲
+9.5 ▲ 3 42.9 +3 ▲ .7 1.3 +1.3 ▲- 303.5 8.7 +8.7 ▲ 3 42.9 +3 ▲ 11.3 22.9 +22.9 ▲
GBM Grupo Bursatil Mexicano 8 - 227.6 1 14.3 +1 ▲ 4.9 9.8 +9.8 ▲Credit Suisse 9 4* 115.7 3.3 -3.3 ▼ 2 28.6 +1 ▲ .7 1.3 +1.3 ▲LarrainVial SA 10 - 66.5 1.9 +1.9 ▲ 1 14.3 +1 ▲ 2.2 4.5 +4.5 ▲
1.4 -5.2 ▼ 1 14.3 0 - 1.5 3.1 +3.1 ▲0.8 +0.8 ▲ 1 14.3 +1 ▲ .7 1.3 +1.3 ▲
- 15.1 0.4 +0.4 ▲ 1 14.3 1.1 +1.1 ▲13* - 15.1 0.4 +0.4 ▲ 1 14.3 +1 ▲ .5 1.1 +1.1 ▲
Top Nineteen Total 3,510.2 100.0 48.8 99.0+4 49 3 100 0Industry Total 3 510 2 100 0 7
$1.1 $1.0 $7.0 $8.8 $3.7 $9.7 $1.3 $0.6
$3.5 3
1
1011
10
15
3 4
23
10
56
4
8
2
0 1
4
0
2
4
6
8
10
12
14
16
$0
$1
$2
$3
$4
$5
$6
$7
$8
$9
$10
2008 2009 2010 2011 2012 2013 2014 2015 2016 2017
Pro
ceed
sU
S$
Billi
ons
# of
Issu
es
*tie
▲-
First Quarter 2017Latin America ECM Volume (US$Bil) by Domicile Nation and SectorJan 1 - Mar 31Latin America Year-on-Year % Change in ECM Volume (US$Bil)
Industry % Change from Same Period Last Year 1286.3% ▲ 133.3%
+4 49.3 100.0Industry Total 3,510.2 100.0 7
708.2% ▲Industry % Change from Last Quarter 2.6% ▲ 0.0% -25.1% ▼ $0.3
2008 2009 2010 2011 2012 2013 2014 2015 2016 2017
Proceeds Non-IPOs IPOs
$2.4 72%
$0.9 28%
Brazil Mexico
$1.7 50%
$1.3 38%
$0.2 7%
$0.2 5%
RetailIndustrialsHealthcareConsumer Products and Services
-37.8%
613.3%
25.9%
-57.4%
65.3%
-78.2%-55.4% 19.4%
1286.3%
-$1
$0
$1
$2
$3
$4
$5
$6
$7
$8
$9
$10
-200%
0%
200%
400%
600%
800%
1000%
1200%
1400%2009 2010 2011 2012 2013 2014 2015 2016 2017
Proceeds (US$bil)
% C
hang
e YO
Y in
Pro
ceed
s
Pro
ceed
s U
S$
Billi
ons
Visit http://dmi.thomsonreuters.com to view archives and order custom League Tables https://www.thomsonone.com8

nc
EMEA IPOs by Nation of Primary Listing (US$Bil) First Quarter 2017 Top 10 EMEA Equity & Equity-Related Deals (US$Bil) First Quarter 2017
Visit http://dmi.thomsonreuters.com to view archives and order custom League Tables https://www.thomsonone.com
Industry % Change from Last Quarter 38.1% ▲ -2.1% 69.7% ▲▼Industry % Change from Same Period Last Year 90.3% ▲ 35.2% 135.6% ▲▲
73.9+74 1,142.7 100.0
844.3284
Top Twenty Total 48,052.2 81.6Industry Total 58,890.5 100.0
+1 ▲ 11.0 1.0 +0.8 ▲▼
BBVA 20 39* 803.1 1.4 +1.1 ▲ 2 0.74.2 +5 ▲ 13.1 1.1 -0.4
+1.1 ▲Nordea 19 11 913.7 1.6 -0.7 ▼ 12
4 1.4 +4 ▲ 14.9 1.31.1 +0.1 ▲
Santander 18 - 939.2 1.6 +1.6 ▲▲ 5 1.8 +3 ▲ 12.4Natixis 17 27* 976.6 1.7 +1.0
+10 ▲ 19.7 1.7 +0.8 ▲▲
Berenberg Bank 16 25 1,053.7 1.8 +1.0 ▲ 13 4.62.1 +4 ▲ 22.6 2.0 +0.9
+1.5 ▲HSBC Holdings PLC 15 27* 1,193.6 2.0 +1.3 ▲ 6
7 2.5 +5 ▲ 23.7 2.11.5 +1.3 ▲
Mediobanca 14 19 1,198.9 2.0 +0.8 ▲▲ 6 2.1 +5 ▲ 16.6Commerzbank AG 13 39* 1,233.5 2.1 +1.8
+3 ▲ 21.2 1.9 -0.9 ▼▼
Credit Agricole CIB 12 13 1,442.6 2.5 +0.3 ▲ 8 2.85.3 +8 ▲ 24.9 2.2 -0.4
+2.2 ▲Barclays 11 10 1,746.9 3.0 +0.3 ▲ 15
14 4.9 +10 ▲ 39.5 3.53.0 -1.9 ▼
Credit Suisse 10 15 1,783.1 3.0 +1.4 ▲▼ 17 6.0 +7 ▲ 34.3BNP Paribas SA 9 8 2,180.5 3.7 -0.5
+5 ▲ 31.8 2.8 +0.4 ▲▼
Societe Generale 8 9 2,350.8 4.0 +0.8 ▲ 14 4.96.7 +8 ▲ 38.4 3.4 -6.5
+2.0 ▲Morgan Stanley 7 1 2,531.6 4.3 -6.3 ▼ 19
29 10.2 +19 ▲ 70.2 6.16.5 +1.2 ▲
Citi 6 7 3,919.1 6.7 +1.5 ▲▼ 15 5.3 +3 ▲ 73.8Bank of America Merrill Lynch 5 6 3,929.8 6.7 -0.4
+8 ▲ 91.3 8.0 +0.3 ▲▲
Goldman Sachs & Co 4 4 4,314.8 7.3 -0.2 ▼ 23 8.16.7 +9 ▲ 75.2 6.6 +1.4
+2.2 ▲UBS 3 3 4,367.5 7.4 -1.7 ▼ 19
25 8.8 +11 ▲ 80.2 7.011.3 +0.6 ▲
Deutsche Bank 2 5 4,722.8 8.0 +0.7 ▲▲ 26 9.2 +8 ▲ 129.5
# of Deals Fees Sh. (%) Share Ch.JP Morgan 1 2 6,450.4 11.0 +1.0Bookrunner Proceeds Sh. (%) Share Ch. Deals Sh. (%)
# of Market Change in Manager Market Market
First Quarter 2017
Proceeds per Bookrunner (US$m) # of Deals per Bookrunner Imputed Fees (US$m)
EMEA Equity & Equity-Related (C1d)
2017 Rank
2016 Rank
Market Market
First Quarter 2017 | Equity Capital Markets | Managing Underwriters
EMEA Equity Capital MarketsEMEA ECM Up 90% | IPO Volumes Up 29% | UniCredit SpA Issue Largest EMEA Deal YTD
EMEA Deals Intelligence
EMEA Equity & Equity-Related volumes totaled US$59 billion from 284 deals inthe first quarter of 2017, representing a 90.3% increase compared to the sameperiod last year. According to estimates, ECM fees were up 135.6% year-on-year,reaching US$1.1 billion.
EMEA IPO volumes for Q1 2017 reached US$5.4 billion from 33 deals, anincrease of 28.6% year-on-year. According to estimates, fees earned from IPOissues were up 87.2%. The UK continued to be the top IPO Nation of Listingrankings in the opening quarter.
EMEA Rights issuance increased 275.2% compared to the first quarter of 2016,raising proceeds of US$18.6 billion. This was largely driven by UniCredit SpA'sUS$13.8 billion offering - the largest 2017 EMEA deal to date and the largest RightsOffering in the EMEA region since 2009.
Jan 1 - Mar 31 EMEA ECM Proceeds Raised by Industry (US$Bil)
$25.2 43%
$7.1 12%
$5.7 10%
$5.1 9%
$4.4 8% $4.3
7% $2.7 5%
$0.9 1%
$0.0 0%
Financials
Energy and Power
Industrials
Real Estate
Materials
Healthcare
Consumer Products and Services
High Technology
Media and Entertainment
Consumer Staples
Retail
$1.6 $1.6
$0.5 $0.4 $0.3
$0.3 $0.1 $0.1 $0.1
0
2
4
6
8
10
12
0.0
0.2
0.4
0.6
0.8
1.0
1.2
1.4
1.6
1.8
U.K. Spain U.S.A. Sweden Russia Germany South Africa Qatar Poland
# of
Issu
es
Pro
ceed
s (U
S$B
il)
Proceeds (US$b) # of Issues
$13.8
$4.3
$2.5
$1.5
$1.5
$1.5
$1.4
$1.2
$1.2
$1.1
02/23/17
03/21/17
03/15/17
03/01/17
03/31/17
03/16/17
02/02/17
03/29/17
01/10/17
02/06/17
UniCredit SpA
EDF SA
Volcan Holdings PLC
Covestro AG
Amundi SA
E ON SE
Banco Comercial Portugues SA
ConvaTec Group PLC
Engie SA
CaixaBank SA
9

*tie** Rankings exclude self-funded proceeds, per Standard Criteria
Visit http://dmi.thomsonreuters.com to view archives and order custom League Tables https://www.thomsonone.com
0.0% 8.4% ▲▲
Industry % Change from Last Quarter 264.9% ▲ -22.2% 325.0% ▲ Industry % Change from Last Quarter 7.4% ▲▲ Industry % Change from Same Period Last Year 18.5% ▲ 0.0% 12.3%
0 133.5 100.0
-Industry % Change from Same Period Last Year 275.2% ▲ 33.3% 367.2%
131.4 98.47,901.7 100.0 157,901.6 100.0
2.480.9
100.0 Industry TotalTop Twenty Total
+1.0 ▲
404.6327.2
▲ 1 3.6
Industry Total 18,560.6 100.0Top Twenty Total 95.817,780.0
+1
+728
▲ 9.8Jefferies LLC 20 - 329.5 1.8 +1.81.9 +1.7 ▲▲ 1 3.6 +1 ▲ 7.7Commerzbank AG 16* - 686.3 3.7 +3.72.2 +2.0 ▲▲ 1 3.6 +1 ▲ 9.1Santander 16* - 686.3 3.7 +3.7
+1 ▲ .0 0.0 +2.1 ▲2.1 0.0 0.0 - 1 6.72.1 -0.7 ▼ VEM Aktienbank AG 17 -▼ 1 3.6 -1 ▼ 8.4Banca IMI (Intesa Sanpaolo) 16* 9* 686.3 3.7 -1.8+1 ▲ .3 0.2 +1.9 ▲29.9 0.4 +0.4 ▲ 1 6.71.9 +1.7 ▲ Kepler Cheuvreux SA 15* -▲ 1 3.6 +1 ▲ 7.7BBVA 16* - 686.3 3.7 +3.7+1 ▲ .3 0.2 +4.0 ▲29.9 0.4 +0.4 ▲ 1 6.74.0 -1.3 ▼ Bank am Bellevue 15* -▼ 2 7.1 0 - 16.0Citi 15 2* 774.9 4.2 -5.9+1 ▲ .8 0.6 +2.2 ▲45.7 0.6 +0.6 ▲ 1 6.72.2 +0.2 ▲ Rand Merchant Bank 14 -▲ 2 7.1 +1 ▲ 8.8Natixis 13* 15* 806.9 4.4 +3.20 - 1.9 1.4 -0.8 ▼106.2 1.3 -1.0 ▼ 1 6.72.7 -3.4 ▼ HSBC Holdings PLC 12* 11*▼ 2 7.1 0 - 10.9Barclays 13* 5 806.9 4.4 -2.7
+1 ▲ 1.9 1.4 +2.5 ▲106.2 1.3 +1.3 ▲ 1 6.72.5 -6.6 ▼ Mediobanca 12* -▼ 3 10.7 +1 ▲ 10.0Credit Agricole CIB 11* 7* 858.2 4.6 -1.50 - 2.1 1.5 -0.9 ▼112.5 1.4 -0.9 ▼ 1 6.74.4 +1.7 ▲ Natixis 11 11*▲ 3 10.7 +2 ▲ 17.8HSBC Holdings PLC 11* 15* 858.2 4.6 +3.40 - 3.1 2.3 -21.2 ▼141.5 1.8 -22.7 ▼ 2 13.34.4 +1.8 ▲ Morgan Stanley 10 1▲ 2 7.1 +1 ▲ 17.8Credit Suisse 10 15* 884.5 4.8 +3.6
+1 ▲ 3.3 2.5 +4.2 ▲179.5 2.3 +2.3 ▲ 1 6.74.2 +3.0 ▲ Credit Suisse 9 -▲ 3 10.7 +3 ▲ 17.1Morgan Stanley 9 - 895.6 4.8 +4.8+1 ▲ 5.4 4.0 -1.7 ▼341.7 4.3 -1.4 ▼ 3 20.03.1 -3.1 ▼ Citi 8 6▼ 4 14.3 +1 ▲ 12.4Societe Generale 8 6 946.9 5.1 -1.3-1 ▼ 4.2 3.1 -5.0 ▼352.2 4.5 -3.4 ▼ 2 13.35.8 -8.6 ▼ Goldman Sachs & Co 7 4▼ 3 10.7 +1 ▲ 23.5Goldman Sachs & Co 6* 2* 973.1 5.2 -4.90 - 8.3 6.2 +1.4 ▲458.7 5.8 +0.3 ▲ 3 20.04.9 +2.8 ▲ Credit Agricole CIB 6 7▲ 3 10.7 +2 ▲ 20.0Mediobanca 6* 11 973.1 5.2 +0.1
+2 ▲ 5.2 3.9 +0.8 ▲500.3 6.3 +3.8 ▲ 3 20.04.0 -3.1 ▼ UBS 5 9*▼ 7 25.0 +5 ▲ 16.2BNP Paribas SA 5 7* 1,020.3 5.5 -0.6+2 ▲ 10.0 7.5 +6.4 ▲521.2 6.6 +4.6 ▲ 4 26.76.2 +5.2 ▲ Societe Generale 4 13▲ 2 7.1 +1 ▲ 25.1UBS 4 20* 1,038.0 5.6 +4.7-2 ▼ 7.3 5.5 -7.4 ▼570.9 7.2 -6.2 ▼ 4 26.76.0 -1.8 ▼ BNP Paribas SA 3 3▼ 4 14.3 +1 ▲ 24.3JP Morgan 3 1 1,093.8 5.9 -5.3
+3 ▲ 20.0 15.0 +11.9 ▲1,214.8 15.4 +11.5 ▲ 5 33.38.4 +1.1 ▲ Deutsche Bank 2 8▲ 4 14.3 +3 ▲ 33.8Bank of America Merrill Lynch 2 12 1,356.8 7.3 +2.3+5 ▲ 57.3 42.9 +23.1 ▲3,188.3 40.4 +20.8 ▲ 7 46.77.6 +0.7 ▲ JP Morgan 1 2▼ 5 17.9 +2 ▲ 30.8
# of Deals Fees Sh. (%) Share Ch.Deutsche Bank 1 4 1,418.1 7.6 -1.5
Bookrunner Proceeds Sh. (%) Share Ch. Deals Sh. (%)2016 Rank
Market Market Change in Manager Market MarketBookrunner Proceeds Sh. (%) Share Ch. Deals Sh. (%)
# of MarketMarket Change in Manager Market Market 2017 Rank# of Deals Fees Sh. (%) Share Ch.
2017 Rank
2016 Rank
Market Market # of
EMEA Rights Offerings (C8fr) Jan 1 - Mar 31 EMEA Convertibles (C9d) Jan 1 - Mar 31
Proceeds per Bookrunner (US$m) # of Deals per Bookrunner Imputed Fees (US$m) Proceeds per Bookrunner (US$m) # of Deals per Bookrunner Imputed Fees (US$m)
Industry % Change from Same Period Last Year 28.6% ▲ 10.0% 87.2% ▲▲Industry % Change from Last Quarter 44.5% ▲ -2.2% 83.5% ▲Industry % Change from Same Period Last Year 110.0% ▲ 37.9% 175.6% ▲
136.1 73.14,003.3 74.270.7100.0
713.9269 +74 1,009.3
Top Twenty Total 40,258.3 79.0Industry Total 50,988.8 100.0
+1 ▲ 2.5 1.4 +1.1 ▲77.1 1.4 +1.4 ▲ 1 3.01.1 +0.8 ▲ Bankinter SA 20* -▲ 2 0.7 +1 ▲ 11.0BBVA 20 36* 803.1 1.6 +1.2+1 ▲ 2.2 1.2 +1.0 ▲90.3 1.7 +1.7 ▲ 1 3.01.0 +0.5 ▲ Mid-Capital 19 -▲ 4 1.5 +3 ▲ 10.3Natixis 19 46* 864.1 1.7 +1.5-2 ▼ 4.0 2.2 -4.9 ▼98.4 1.8 -4.1 ▼ 2 6.11.3 -0.7 ▼ Carnegie 18 6▼ 12 4.5 +5 ▲ 13.1Nordea 18 10 913.7 1.8 -1.1
+1 ▲ .0 0.0 +1.5 ▲104.6 1.9 +1.9 ▲ 1 3.01.5 +1.4 ▲ Standard Bank Group Ltd 17 -▲ 4 1.5 +4 ▲ 14.9Santander 17 - 939.2 1.8 +1.8+2 ▲ 2.7 1.5 +1.3 ▲106.8 2.0 +2.0 ▲ 2 6.11.3 -0.9 ▼ Danske Bank 16 -▲ 5 1.9 +3 ▲ 12.9Credit Agricole CIB 16 21 983.9 1.9 +0.6+1 ▲ 1.7 0.9 +2.0 ▲115.0 2.1 +2.1 ▲ 1 3.02.0 +1.6 ▲ HSBC Holdings PLC 13* -▲ 13 4.8 +11 ▲ 19.7Berenberg Bank 15 38 1,053.7 2.1 +1.8+1 ▲ 1.7 0.9 +2.1 ▲115.0 2.1 +2.1 ▲ 1 3.02.1 +1.4 ▲ JB Capital Markets SV SA 13* -▲ 5 1.9 +4 ▲ 20.7HSBC Holdings PLC 14 46* 1,087.4 2.1 +1.9+1 ▲ 3.2 1.7 +2.2 ▲115.0 2.1 +2.1 ▲ 1 3.02.2 +1.4 ▲ BBVA 13* -▲ 6 2.2 +4 ▲ 21.8Mediobanca 13 18 1,092.7 2.1 +0.6+1 ▲ 3.6 2.0 +1.7 ▲138.2 2.6 +2.6 ▲ 1 3.01.7 +1.4 ▲ PKF International Limited 12 -▲ 6 2.2 +5 ▲ 16.6Commerzbank AG 12 36* 1,233.5 2.4 +2.0+1 ▲ 5.3 2.9 +1.9 ▲149.3 2.8 +1.8 ▲ 2 6.13.6 +1.9 ▲ Berenberg Bank 11 20*▲ 13 4.8 +9 ▲ 36.1Credit Suisse 11 13 1,603.6 3.1 +1.00 - 4.4 2.4 +1.2 ▲150.1 2.8 +2.1 ▲ 1 3.02.7 +0.4 ▲ Investec 10 24▲ 13 4.8 +9 ▲ 27.0BNP Paribas SA 10 15 1,609.6 3.2 +1.5
+2 ▲ 5.3 2.8 +2.4 ▲172.1 3.2 +3.2 ▲ 2 6.12.4 -1.0 ▼ Jefferies LLC 9 -- 15 5.6 +8 ▲ 24.4Barclays 9 9 1,746.9 3.4 0.0-2 ▼ 5.0 2.7 -1.9 ▼173.4 3.2 -2.1 ▼ 1 3.02.2 -0.6 ▼ Peel Hunt LLP 8 7- 10 3.7 +3 ▲ 21.8Societe Generale 8 8 1,829.6 3.6 0.0-1 ▼ 5.0 2.7 -1.5 ▼174.0 3.2 -4.2 ▼ 2 6.13.5 -1.9 ▼ Deutsche Bank 7 3▼ 17 6.3 +8 ▲ 35.3Morgan Stanley 7 6 2,390.1 4.7 -2.10 - 6.2 3.3 -0.5 ▼224.3 4.2 +2.0 ▲ 1 3.07.2 -0.5 ▼ Global M&A 6 15▼ 19 7.1 +3 ▲ 72.2JP Morgan 6 3 3,262.2 6.4 -1.0
+3 ▲ 5.8 3.1 +3.0 ▲251.1 4.7 +4.7 ▲ 3 9.16.0 +0.7 ▲ Santander 5 -▼ 20 7.4 +8 ▲ 60.3Deutsche Bank 5 2 3,507.9 6.9 -1.4+5 ▲ 11.1 6.0 +6.4 ▲251.8 4.7 +4.7 ▲ 5 15.26.4 +2.8 ▲ Credit Suisse 4 -▲ 26 9.7 +18 ▲ 64.8Citi 4 7 3,577.5 7.0 +1.9+4 ▲ 14.6 7.9 +6.3 ▲360.1 6.7 +5.7 ▲ 5 15.26.9 +1.1 ▲ Citi 3 20*▼ 16 5.9 +7 ▲ 70.0UBS 3 1 3,867.2 7.6 -3.3-1 ▼ 25.0 13.5 +4.1 ▲517.0 9.6 -2.2 ▼ 3 9.17.3 +2.2 ▲ JP Morgan 2 1▲ 15 5.6 +5 ▲ 73.8Bank of America Merrill Lynch 2 4 3,929.8 7.7 +0.3
+2 ▲ 26.8 14.4 +8.8 ▲619.7 11.5 +6.9 ▲ 4 12.18.6 +1.0 ▲ Goldman Sachs & Co 1 9▲ 21 7.8 +9 ▲ 87.2# of Deals Fees Sh. (%) Share Ch.
Goldman Sachs & Co 1 5 3,962.6 7.8 +0.5Bookrunner Proceeds Sh. (%) Share Ch. Deals Sh. (%)
2016 Rank
Market Market Change in Manager Market MarketBookrunner Proceeds Sh. (%) Share Ch. Deals Sh. (%)
# of MarketMarket Change in Manager Market Market 2017 Rank# of Deals Fees Sh. (%) Share Ch.
2017 Rank
2016 Rank
Market Market # of
EMEA Common Stock (C4c) Jan 1 - Mar 31 EMEA IPOs (C7c) Jan 1 - Mar 31
Proceeds per Bookrunner (US$m) # of Deals per Bookrunner Imputed Fees (US$m) Proceeds per Bookrunner (US$m) # of Deals per Bookrunner Imputed Fees (US$m)
First Quarter 2017 | Equity Capital Markets | Managing Underwriters
EMEA Equity Capital Markets
▼ -
▲▼
▲
5,392.0 100.0
Industry % Change from Last Quarter -56.3% ▼
Industry TotalTop Twenty Total
+333
-3.9% ▼▼-36.5%
186.1 100.0
10
nc
First Quarter 2017 | Equity Capital Markets | Managing Underwriters
Asia (ex-Japan, ex-Australia) Equity Capital MarketsAsian ECM Activity Up 29% | Shanghai Tops Asia IPO Exchange | Financials Top Sector
Asia Deals Intelligence
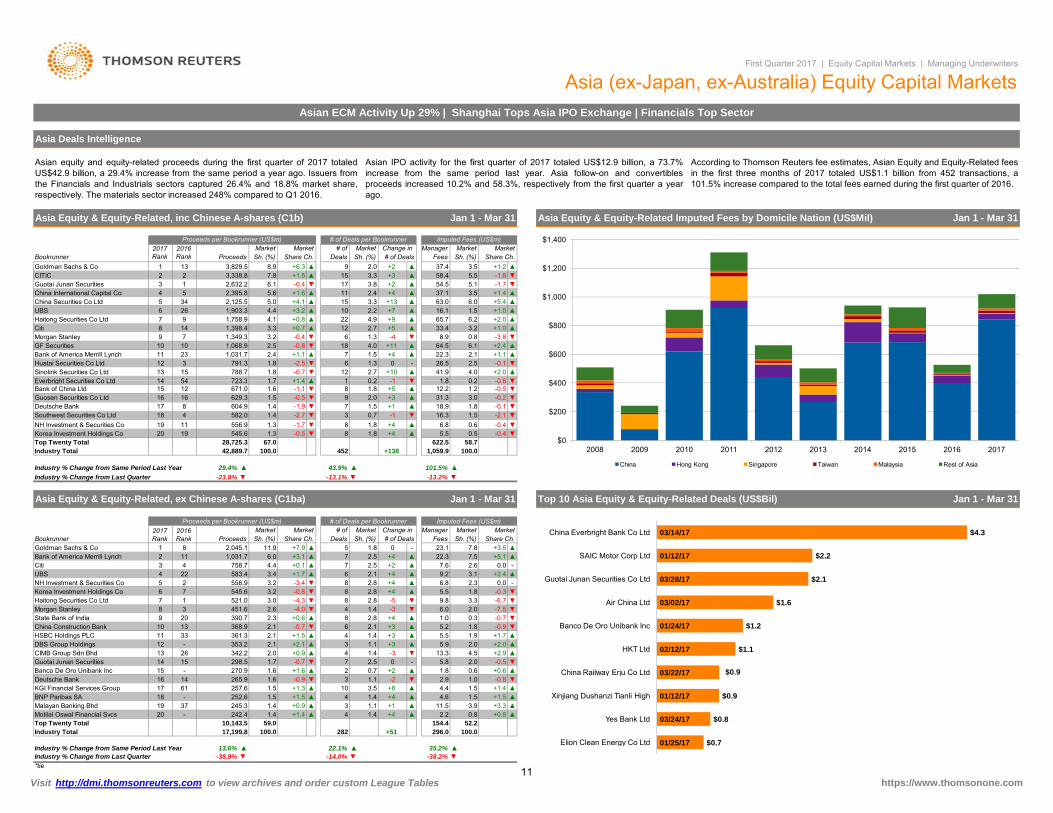
Asian equity and equity-related proceeds during the first quarter of 2017 totaledUS$42.9 billion, a 29.4% increase from the same period a year ago. Issuers fromthe Financials and Industrials sectors captured 26.4% and 18.8% market share,respectively. The materials sector increased 248% compared to Q1 2016.
Asian IPO activity for the first quarter of 2017 totaled US$12.9 billion, a 73.7%increase from the same period last year. Asia follow-on and convertiblesproceeds increased 10.2% and 58.3%, respectively from the first quarter a yearago.
According to Thomson Reuters fee estimates, Asian Equity and Equity-Related feesin the first three months of 2017 totaled US$1.1 billion from 452 transactions, a101.5% increase compared to the total fees earned during the first quarter of 2016.
Asia Equity & Equity-Related, inc Chinese A-shares (C1b) Jan 1 - Mar 31 Asia Equity & Equity-Related Imputed Fees by Domicile Nation (US$Mil) Jan 1 - Mar 31
Proceeds per Bookrunner (US$m) # of Deals per Bookrunner Imputed Fees (US$m)2017 Rank
2016 Rank
Market Market # of Market Change in Manager Market MarketBookrunner Proceeds Sh. (%) Share Ch. Deals Sh. (%) # of Deals Fees Sh. (%) Share Ch.Goldman Sachs & Co 1 13 3,829.5 8.9 +6.3 ▲ 9 2.0 +2 ▲ 37.4 3.5 +1.2 ▲CITIC 2 2 3,338.8 7.8 +1.5 ▲ 15 3.3 +3 ▲ 58.4 5.5 -1.8 ▼Guotai Junan Securities 3 1 2,632.2 6.1 -0.4 ▼ 17 3.8 +2 ▲ 54.5 5.1 -1.7 ▼China International Capital Co 4 5 2,395.8 5.6 +1.6 ▲ 11 2.4 +4 ▲ 37.1 3.5 +1.4 ▲China Securities Co Ltd 5 34 2,125.5 5.0 +4.1 ▲ 15 3.3 +13 ▲ 63.0 6.0 +5.4 ▲UBS 6 26 1,903.3 4.4 +3.2 ▲ 10 2.2 +7 ▲ 16.1 1.5 +1.0 ▲Haitong Securities Co Ltd 7 9 1,758.9 4.1 +0.8 ▲ 22 4.9 +9 ▲ 65.7 6.2 +2.0 ▲Citi 8 14 1,398.4 3.3 +0.7 ▲ 12 2.7 +5 ▲ 33.4 3.2 +1.0 ▲Morgan Stanley 9 7 1,349.3 3.2 -0.4 ▼ 6 1.3 -4 ▼ 8.9 0.8 -3.8 ▼GF Securities 10 10 1,068.9 2.5 -0.8 ▼ 18 4.0 +11 ▲ 64.5 6.1 +2.4 ▲Bank of America Merrill Lynch 11 23 1,031.7 2.4 +1.1 ▲ 7 1.5 +4 ▲ 22.3 2.1 +1.1 ▲Huatai Securities Co Ltd 12 3 791.3 1.8 -2.5 ▼ 6 1.3 0 - 26.5 2.5 -0.1 ▼Sinolink Securities Co Ltd 13 15 788.7 1.8 -0.7 ▼ 12 2.7 +10 ▲ 41.9 4.0 +2.0 ▲Everbright Securities Co Ltd 14 54 723 3 1 7 +1 4 ▲ 1 0 2 1 ▼ 1 8 0 2 0 6 ▼ $400
$600
$800
$1,000
$1,200
$1,400
Everbright Securities Co Ltd 14 54 723.3 1.7 +1.4 ▲ 1 0.2 -1 ▼ 1.8 0.2 -0.6 ▼Bank of China Ltd 15 12 671.0 1.6 -1.1 ▼ 8 1.8 +5 ▲ 12.2 1.2 -0.5 ▼Guosen Securities Co Ltd 16 16 629.3 1.5 -0.5 ▼ 9 2.0 +3 ▲ 31.3 3.0 -0.2 ▼Deutsche Bank 17 8 604.9 1.4 -1.9 ▼ 7 1.5 +1 ▲ 18.9 1.8 -0.1 ▼Southwest Securities Co Ltd 18 4 582.0 1.4 -2.7 ▼ 3 0.7 -1 ▼ 16.3 1.5 -2.1 ▼NH Investment & Securities Co 19 11 556.9 1.3 -1.7 ▼ 8 1.8 +4 ▲ 6.8 0.6 -0.4 ▼Korea Investment Holdings Co 20 19 545.6 1.3 -0.5 ▼ 8 1.8 +4 ▲ 5.5 0.5 -0.4 ▼Top Twenty Total 28,725.3 67.0 622.5 58.7
+138 1,059.9 100.0Industry Total 42,889.7 100.0 452
Industry % Change from Same Period Last Year 29.4% ▲ 43.9% 101.5% ▲▲Industry % Change from Last Quarter -23.8% ▼ -13.1% -13.2% ▼▼
Asia Equity & Equity-Related, ex Chinese A-shares (C1ba) Jan 1 - Mar 31 Top 10 Asia Equity & Equity-Related Deals (US$Bil) Jan 1 - Mar 31
Proceeds per Bookrunner (US$m) # of Deals per Bookrunner Imputed Fees (US$m)2017 Rank
2016 Rank
Market Market # of Market Change in Manager Market MarketBookrunner Proceeds Sh. (%) Share Ch. Deals Sh. (%) # of Deals Fees Sh. (%) Share Ch.Goldman Sachs & Co 1 8 2,045.1 11.9 +7.9 ▲ 5 1.8 0 - 23.1 7.8 +3.5 ▲Bank of America Merrill Lynch 2 11 1,031.7 6.0 +3.1 ▲ 7 2.5 +4 ▲ 22.3 7.5 +5.1 ▲Citi 3 4 758.7 4.4 +0.1 ▲ 7 2.5 +2 ▲ 7.6 2.6 0.0 -UBS 4 22 583.4 3.4 +1.7 ▲ 6 2.1 +4 ▲ 9.2 3.1 +2.4 ▲NH Investment & Securities Co 5 2 556.9 3.2 -3.4 ▼ 8 2.8 +4 ▲ 6.8 2.3 0.0 -Korea Investment Holdings Co 6 7 545.6 3.2 -0.8 ▼ 8 2.8 +4 ▲ 5.5 1.8 -0.3 ▼Haitong Securities Co Ltd 7 1 521.0 3.0 -4.3 ▼ 8 2.8 -5 ▼ 9.8 3.3 -6.7 ▼Morgan Stanley 8 3 451.6 2.6 -4.0 ▼ 4 1.4 -3 ▼ 6.0 2.0 -7.5 ▼State Bank of India 9 20 390.7 2.3 +0.6 ▲ 8 2.8 +4 ▲ 1.0 0.3 -0.7 ▼China Construction Bank 10 13 368.9 2.1 -0.7 ▼ 6 2.1 +3 ▲ 5.2 1.8 -0.9 ▼HSBC Holdings PLC 11 33 361.3 2.1 +1.5 ▲ 4 1.4 +3 ▲ 5.5 1.9 +1.7 ▲DBS Group Holdings 12 - 353.2 2.1 +2.1 ▲ 3 1.1 +3 ▲ 5.9 2.0 +2.0 ▲CIMB Group Sdn Bhd 13 26 342.2 2.0 +0.9 ▲ 4 1.4 -3 ▼ 13.3 4.5 +2.9 ▲Guotai Junan Securities 14 15 298.5 1.7 -0.7 ▼ 7 2.5 0 - 5.8 2.0 -0.5 ▼Banco De Oro Unibank Inc 15 - 270.9 1.6 +1.6 ▲ 2 0.7 +2 ▲ 1.8 0.6 +0.6 ▲Deutsche Bank 16 14 265.9 1.6 -0.9 ▼ 3 1.1 -2 ▼ 2.9 1.0 -0.8 ▼KGI Financial Services Group 17 61 257.6 1.5 +1.3 ▲ 10 3.5 +8 ▲ 4.4 1.5 +1.4 ▲BNP Paribas SA 18 - 252.6 1.5 +1.5 ▲ 4 1.4 +4 ▲ 4.6 1.5 +1.5 ▲Malayan Banking Bhd 19 37 245.3 1.4 +0.9 ▲ 3 1.1 +1 ▲ 11.5 3.9 +3.3 ▲Motilal Oswal Financial Svcs 20 - 242.4 1.4 +1.4 ▲ 4 1.4 +4 ▲ 2.2 0.8 +0.8 ▲Top Twenty Total 10,143.5 59.0 154.4 52.2
+51 296.0 100.0Industry Total 17,199.8 100.0 282
Industry % Change from Same Period Last Year 13.6% ▲ 22.1% 35.2% ▲▲Industry % Change from Last Quarter -38.9% ▼ -14.0% -38.2% ▼▼
$0
$200
$400
2008 2009 2010 2011 2012 2013 2014 2015 2016 2017
China Hong Kong Singapore Taiwan Malaysia Rest of Asia
$4.3
$2.2
$2.1
$1.6
$1.2
$1.1
$0.9
$0.9
$0.8
$0.7
03/14/17
01/12/17
03/28/17
03/02/17
01/24/17
02/12/17
03/22/17
01/12/17
03/24/17
01/25/17
China Everbright Bank Co Ltd
SAIC Motor Corp Ltd
Guotai Junan Securities Co Ltd
Air China Ltd
Banco De Oro Unibank Inc
HKT Ltd
China Railway Erju Co Ltd
Xinjiang Dushanzi Tianli High
Yes Bank Ltd
Elion Clean Energy Co Ltd
*tie
Visit http://dmi.thomsonreuters.com to view archives and order custom League Tables https://www.thomsonone.com11
▲ ▲▲ Industry % Change from Same Period Last Year 73 7%
First Quarter 2017 | Equity Capital Markets | Managing Underwriters
Asia (ex-Japan, ex-Australia) Equity Capital Markets
Asia Common stock, inc Chinese A-shares (C4a) Jan 1 - Mar 31 Asia IPOs, inc Chinese A-shares (C7a) Jan 1 - Mar 31
Proceeds per Bookrunner (US$m) # of Deals per Bookrunner Imputed Fees (US$m) Proceeds per Bookrunner (US$m) # of Deals per Bookrunner Imputed Fees (US$m)
Sh. (%) Share Ch.2017 Rank
2016 Rank
Market Market # of # of MarketMarket Change in Manager Market Market 2017 Rank# of Deals Fees
Change in Manager Market MarketBookrunner Proceeds Sh. (%) Share Ch. Deals Sh. (%) Bookrunner Proceeds Sh. (%) Share Ch. Deals Sh. (%)
2016 Rank
Market Market# of Deals Fees Sh. (%) Share Ch.
Goldman Sachs & Co 1 15 3,106.2 8.3 +5.8 ▲ 8 1.8 +2 ▲ 35.6 3.5 +1.3 ▲ GF Securities 1 9 931.3 7.2 +3.9 ▲ 13 5.6 +9 ▲ 62.5 9.1 +3.7 ▲Guotai Junan Securities 2 1 2,632.2 7.0 -0.2 ▼ 17 3.9 +2 ▲ 54.5 5.3 -2.1 ▼ Haitong Securities Co Ltd 2 1 851.6 6.6 -2.0 ▼ 17 7.4 +9 ▲ 50.9 7.4 +3.1 ▲CITIC 3 2 2,615.5 7.0 +0.4 ▲ 14 3.2 +3 ▲ 56.6 5.5 -1.9 ▼ China International Capital Co 3 10 780.6 6.0 +2.9 ▲ 7 3.0 +5 ▲ 26.3 3.8 +2.3 ▲China Securities Co Ltd 4 29 2,125.5 5.7 +4.7 ▲ 15 3.4 +13 ▲ 62.8 6.1 +5.4 ▲ CITIC 4 3 725.0 5.6 -0.6 ▼ 8 3.5 +4 ▲ 30.0 4.4 -4.0 ▼Haitong Securities Co Ltd 5 6 1,758.9 4.7 +1.0 ▲ 22 5.0 +9 ▲ 65.7 6.4 +1.9 ▲ China Securities Co Ltd 5 - 703.8 5.5 +5.5 ▲ 9 3.9 +9 ▲ 41.1 6.0 +6.0 ▲China International Capital Co 6 11 1,672.5 4.5 +1.3 ▲ 10 2.3 +6 ▲ 35.3 3.4 +1.7 ▲ Guotai Junan Securities 6 2 585.5 4.5 -1.9 ▼ 8 3.5 +2 ▲ 23.9 3.5 -4.4 ▼Citi 7 13 1,360.9 3.6 +0.7 ▲ 11 2.5 +4 ▲ 32.5 3.2 +0.8 ▲ Sinolink Securities Co Ltd 7 25* 556.6 4.3 +3.4 ▲ 9 3.9 +8 ▲ 36.3 5.3 +3.5 ▲Bank of America Merrill Lynch 8 25 1,031.7 2.8 +1.6 ▲ 7 1.6 +5 ▲ 22.3 2.2 +1.2 ▲ Citi 8 31 380.3 2.9 +2.1 ▲ 6 2.6 +5 ▲ 21.4 3.1 +1.7 ▲GF Securities 9 7 1,023.8 2.7 -1.0 ▼ 17 3.9 +10 ▲ 64.0 6.2 +2.2 ▲ Guosen Securities Co Ltd 9 12 363.0 2.8 -0.1 ▼ 7 3.0 +5 ▲ 26.2 3.8 -0.9 ▼UBS 10 41* 1,013.4 2.7 +2.2 ▲ 8 1.8 +7 ▲ 11.1 1.1 +0.8 ▲ China Merchants Securities Co 10 14 324.8 2.5 -0.2 ▼ 4 1.7 +1 ▲ 20.2 2.9 -1.2 ▼Huatai Securities Co Ltd 11 3 791.3 2.1 -2.6 ▼ 6 1.4 0 - 26.5 2.6 -0.2 ▼ CIMB Group Sdn Bhd 11 20 279.1 2.2 +0.6 ▲ 3 1.3 -1 ▼ 12.4 1.8 +0.6 ▲Sinolink Securities Co Ltd 12 14 788.7 2.1 -0.6 ▼ 12 2.8 +10 ▲ 41.9 4.1 +1.9 ▲ Zheshang Securities Co Ltd 12 - 275.2 2.1 +2.1 ▲ 3 1.3 +3 ▲ 17.2 2.5 +2.5 ▲Bank of China Ltd 13 12 671.0 1.8 -1.2 ▼ 8 1.8 +5 ▲ 11.8 1.2 -0.7 ▼ Zhongtai Securities Co Ltd 13 41* 251.4 2.0 +1.5 ▲ 4 1.7 +3 ▲ 16.5 2.4 +1.0 ▲Guosen Securities Co Ltd 14 19 629.3 1.7 -0.1 ▼ 9 2.1 +4 ▲ 31.3 3.0 -0.2 ▼ Minsheng Securities Co Ltd 14 - 227.8 1.8 +1.8 ▲ 5 2.2 +5 ▲ 18.5 2.7 +2.7 ▲Morgan Stanley 15 8 626.0 1.7 -1.9 ▼ 5 1.1 -4 ▼ 7.1 0.7 -4.0 ▼ Malayan Banking Bhd 15 37 226.6 1.8 +1.2 ▲ 2 0.9 +1 ▲ 11.3 1.6 +1.3 ▲Deutsche Bank 16 9 604.9 1.6 -1.8 ▼ 7 1.6 +2 ▲ 18.9 1.8 -0.2 ▼ Bank of China Ltd 16 5* 216.3 1.7 -2.9 ▼ 5 2.2 +3 ▲ 7.6 1.1 -0.7 ▼Southwest Securities Co Ltd 17 4 582.0 1.6 -2.9 ▼ 3 0.7 -1 ▼ 16.3 1.6 -2.3 ▼ Essence Securities Co Ltd 17 15 212.3 1.6 -0.8 ▼ 5 2.2 +4 ▲ 15.0 2.2 -0.9 ▼NH Investment & Securities Co 18 10 556.9 1.5 -1.9 ▼ 8 1.8 +4 ▲ 6.8 0.7 -0.4 ▼ NH Investment & Securities Co 18 53 206.5 1.6 +1.3 ▲ 6 2.6 +5 ▲ 5.6 0.8 +0.7 ▲Korea Investment Holdings Co 19 17 545.6 1.5 -0.5 ▼ 8 1.8 +4 ▲ 5.5 0.5 -0.5 ▼ Deutsche Bank 19 - 206.4 1.6 +1.6 ▲ 4 1.7 +4 ▲ 15.5 2.3 +2.3 ▲China Merchants Securities Co 20 23 472.0 1.3 0.0 - 7 1.6 +2 ▲ 22.9 2.2 -0.5 ▼ China Construction Bank 20 4 188.7 1.5 -4.2 ▼ 4 1.7 +1 ▲ 2.9 0.4 -2.1 ▼Top Twenty Total 24,608.3 65.6Industry Total 37,509.9 100.0
629.4436 +155 1,029.7
61.1 Top Twenty Total100.0 Industry Total
8,492.8 65.712,923.9 100.0 231
461.3 67.0+114 688.2 100.0
Industry % Change from Same Period Last Year 26 1% ▲ 55 2% 111 4% ▲ 97 4% 191 2% ▲
*tie
▲
▲▼
▲▼
▼▼
▲ Industry % Change from Same Period Last Year 73.7%Industry % Change from Same Period Last Year 26.1% ▲ 55.2% 111.4% ▲ 97.4% 191.2% ▲Industry % Change from Last Quarter -28.2% ▼ -10.7% -11.6% ▼ Industry % Change from Last Quarter -47.6% ▼ -1.3% -12.2% ▼
Asia Secondary Offerings, inc Chinese A-shares (C8c) Jan 1 - Mar 31 Asia Convertibles, inc Chinese A-shares (C9b) Jan 1 - Mar 31
▼
Proceeds per Bookrunner (US$m) # of Deals per Bookrunner Imputed Fees (US$m) Proceeds per Bookrunner (US$m) # of Deals per Bookrunner Imputed Fees (US$m)
Sh. (%) Share Ch.2017 Rank
2016 Rank
Market Market # of # ofMarket Change in Manager Market Market 2017 Rank# of Deals Fees Bookrunner
Change in Manager Market MarketBookrunner Proceeds Sh. (%) Share Ch. Deals Sh. (%) Proceeds Sh. (%) Share Ch. Deals Sh. (%)
2016 Rank
Market Market Market# of Deals Fees Sh. (%) Share Ch.
Goldman Sachs & Co 1 18 3,106.2 12.6 +10.5 ▲ 8 3.9 +5 ▲ 35.6 10.4 +9.3 ▲ UBS 1 4 889.9 16.5 +9.1 ▲ 2 12.5 0 ▲ 5.0 16.6 +12.5 ▲Guotai Junan Securities 2 1 2,046.7 8.3 +0.8 ▲ 9 4.4 0 - 30.6 9.0 +2.1 ▲ Everbright Securities Co Ltd 2* - 723.3 13.4 +13.4 ▲ 1 6.3 +1 ▲ 1.8 6.0 +6.0 ▲CITIC 3 2 1,890.5 7.7 +1.0 ▲ 6 2.9 -1 ▼ 26.6 7.8 +1.4 ▲ Morgan Stanley 2* 11* 723.3 13.4 +10.0 ▲ 1 6.3 0 - 1.8 6.0 +2.1 ▲China Securities Co Ltd 4 24 1,421.7 5.8 +4.5 ▲ 6 2.9 +4 ▲ 21.7 6.3 +5.0 ▲ China International Capital Co 2* 2 723.3 13.4 +2.3 ▲ 1 6.3 -2 ▼ 1.8 6.0 -1.3 ▼UBS 5 35* 1,013.4 4.1 +3.4 ▲ 8 3.9 +7 ▲ 11.1 3.2 +2.7 ▲ Goldman Sachs & Co 2* 7* 723.3 13.4 +9.7 ▲ 1 6.3 0 - 1.8 6.0 +2.8 ▲Citi 6 10 980.7 4.0 +0.4 ▲ 5 2.4 -1 ▼ 11.0 3.2 0.0 - CITIC 2* 7* 723.3 13.4 +9.7 ▲ 1 6.3 0 - 1.8 6.0 -0.8 ▼Bank of America Merrill Lynch 7 21 952.3 3.9 +2.3 ▲ 5 2.4 +3 ▲ 20.1 5.9 +4.0 ▲ KGI Financial Services Group 7 25 204.9 3.8 +3.2 ▲ 2 12.5 +1 ▲ 3.7 12.3 +11.9 ▲Haitong Securities Co Ltd 8 17 907.3 3.7 +1.6 ▲ 5 2.4 0 - 14.8 4.3 -0.3 ▼ Yuanta Financial Hldg Co Ltd 8 21 176.4 3.3 +1.7 ▲ 2 12.5 0 - 3.1 10.2 +9.5 ▲China International Capital Co 9 12 891.9 3.6 +0.3 ▲ 3 1.5 +1 ▲ 9.0 2.6 +0.7 ▲ DBS Group Holdings 9 - 166.7 3.1 +3.1 ▲ 1 6.3 +1 ▲ 2.9 9.6 +9.6 ▲Huatai Securities Co Ltd 10 3 636.3 2.6 -3.7 ▼ 2 1.0 -3 ▼ 14.0 4.1 -1.3 ▼ Pacific Securities 10 - 104.2 1.9 +1.9 ▲ 1 6.3 +1 ▲ 1.9 6.2 +6.2 ▲Morgan Stanley 11 8 610.5 2.5 -1.9 ▼ 4 2.0 -3 ▼ 6.4 1.9 -5.0 ▼ GF Securities 11 - 45.1 0.8 +0.8 ▲ 1 6.3 +1 ▲ .5 1.5 +1.5 ▲Southwest Securities Co Ltd 12 4 487.2 2.0 -4.0 ▼ 2 1.0 -2 ▼ 10.7 3.1 -4.4 ▼ Barclays 12* - 37.5 0.7 +0.7 ▲ 1 6.3 +1 ▲ .9 3.1 +3.1 ▲Bank of China Ltd 13 15 454.7 1.9 -0.6 ▼ 3 1.5 +2 ▲ 4.2 1.2 -0.7 ▼ Citi 12* - 37.5 0.7 +0.7 ▲ 1 6.3 +1 ▲ .9 3.1 +3.1 ▲Korea Investment Holdings Co 14 16 453.6 1.9 -0.6 ▼ 3 1.5 +1 ▲ 2.5 0.7 -0.3 ▼ Mega Financial Holding Co 14 - 25.5 0.5 +0.5 ▲ 2 12.5 +2 ▲ .3 1.0 +1.0 ▲Deutsche Bank 15 6 398.5 1.6 -3.0 ▼ 3 1.5 -2 ▼ 3.3 1.0 -2.9 ▼ Grand Fortune Sec Co Ltd 15 - 24.8 0.5 +0.5 ▲ 1 6.3 +1 ▲ .2 0.5 +0.5 ▲HSBC Holdings PLC 16 - 361.3 1.5 +1.5 ▲ 4 2.0 +4 ▲ 5.5 1.6 +1.6 ▲ Taishin Finl Hldg Co Ltd 16 26 23.5 0.4 0.0 - 2 12.5 0 - .3 1.0 +0.4 ▲NH Investment & Securities Co 17 7 350.4 1.4 -3.0 ▼ 2 1.0 -1 ▼ 1.3 0.4 -1.5 ▼ Success Securities Ltd 17 - 11.1 0.2 +0.2 ▲ 1 6.3 +1 ▲ .2 0.7 +0.7 ▲State Bank of India 18 30* 345.6 1.4 +0.5 ▲ 6 2.9 +4 ▲ .2 0.1 0.0 - Cathay Financial Hldg Co Ltd 18 27 9.8 0.2 -0.1 ▼ 1 6.3 0 - .2 0.5 +0.1 ▲Tianfeng Securities Co Ltd 19 - 335.9 1.4 +1.4 ▲ 2 1.0 +2 ▲ 3.6 1.1 +1.1 ▲ Capital Securities Corp 19 - 6.5 0.1 +0.1 ▲ 1 6.3 +1 ▲ .2 0.5 +0.5 ▲Huaxi Securities Co Ltd 20* - 294.3 1.2 +1.2 ▲ 1 0.5 +1 ▲ 3.8 1.1 +1.1 ▲Top Twenty Total 17,939.0 73.0Industry Total 24,586.1 100.0
236.0205 +41 341.5
69.1 Top Twenty Total100.0 Industry Total
5,379.7 100.05,379.7 100.0 16
29.3 97.0-17 30.2 100.0
Industry % Change from Same Period Last Year 10.2% ▲ 25.0% 36.1% ▲ Industry % Change from Same Period Last Year 58.3% ▲ -51.5% -22.2% ▼Industry % Change from Last Quarter -10.8% ▼ -19.3% -10.3% ▼ Industry % Change from Last Quarter 32.2% ▲ -50.0% -46.8% ▼
https://www.thomsonone.comVisit http://dmi.thomsonreuters.com to view archives and order custom League Tables12

First Quarter 2017 | Equity Capital Markets | Managing Underwriters
MarketProceeds per Bookrunner (AU$m) # of Deals per Bookrunner
Australia Equity Capital Markets
Market Market # of Market Change in Manager MarketBookrunner Proceeds Sh. (%) Sh. (%) Share Ch.Deals Sh. (%) FeesUBS 1 1 884.6 28.5 +0.2 ▲ 4 3.1 -1 ▼ 19.5 20.9 -2.8 ▼Goldman Sachs & Co 2 - 429.7 13.8 +13.8 ▲ 3 2.3 +3 ▲ 6.7 7.1 +7.1 ▲Macquarie Group 3 2 407.2 13.1 -7.3 ▼ 4 3.1 -2 ▼ 10.9 11.7 -7.1 ▼Canaccord Genuity 4 4 177.5 5.7 -2.3 ▼ 7 5.4 +4 ▲ 7.6 8.2 -3.6 ▼Morgans Financial Ltd 5 14 175.9 5.7 +4.9 ▲ 9 7.0 +5 ▲ 6.5 6.9 +4.7 ▲Euroz Securities Ltd 6 30 127.2 4.1 +3.8 ▲ 6 4.7 +5 ▲ 4.6 4.9 +4.4 ▲Hartleys Ltd 7 7 126.9 4.1 +1.2 ▲ 8 6.2 0 - 4.5 4.9 +0.2 ▲Bell Financial Group Ltd 8 5 95.5 3.1 -3.2 ▼ 8 6.2 +1 ▲ 3.2 3.4 -4.1 ▼Wilson HTM 9 23 80.7 2.6 +2.2 ▲ 4 3.1 +2 ▲ 2.6 2.8 +2.3 ▲Investorlink Securities 10 - 63.8 2.1 +2.1 ▲ 1 0.8 +1 ▲ 1.7 1.8 +1.8 ▲Argonaut Ltd 11 27 56.8 1.8 +1.5 ▲ 3 2.3 0 - 4.0 4.2 +3.6 ▲Petra Capital Pty Ltd 12 17 56.3 1.8 +1.2 ▲ 3 2.3 +1 ▲ 2.2 2.4 +1.4 ▲Taylor Collison Ltd 13 10 41.5 1.3 -0.3 ▼ 9 7.0 0 - 1.5 1.6 -0.4 ▼Insight Capital Advisors Pty 14 - 32 5 1 1 +1 1 ▲ 1 0 8 +1 ▲ 1 0 1 1 +1 1 ▲
Australian ECM Proceeds Rise 38% | Industrials Top Sector | IPO Volume Up 150%
Australia Deal Intelligence
Australian Equity and Equity-Related proceeds to date reached AU$3.1 billion from129 deals, a 37.6% increase from the first quarter of 2016. Issuance from theIndustrials, Materials, and Technology sectors captured 33%, 18% and 13% of themarket, respectively.
Total fees totaled AU$93.3 million in Australia during the first three months of2017, a 31.6% increase from the same period last year, according to estimates.UBS AG, the top fee earner for Australian offerings, captured 20.9% of the totalwallet share.
Australian IPO and follow-on proceeds during the first quarter of 2017 registered increases of 150.1% and 32.1%, respectively, compared to the same period a year ago. The largest IPO of the quarter was the AU$75 million offered by URB Investments Ltd.
Australian Equity & Equity-Related (AK1) Jan 1 - Mar 31 Australian ECM Proceeds by Industry (AU$Mil) Jan 1 - Mar 31
Imputed Fees (AU$m)2017 Rank
2016 Rank Share Ch. # of Deals
$1,004.1 33%
$570.4 18%
$411.5 13%
$239.1 8%
$208.1 7%
$200.6 7%
$153.4 5%
$104.1 3%
$95.2 3%
$65.0 2%
$30.7 1%
▼
▼▲
Insight Capital Advisors Pty 14 - 32.5 1.1 +1.1 ▲ 1 0.8 +1 ▲ 1.0 1.1 +1.1 ▲Patersons Securities Ltd 15 8 27.7 0.9 -0.9 ▼ 10 7.8 0 - 1.5 1.6 -1.0 ▼Commonwealth Bank of Australia 16 - 25.0 0.8 +0.8 ▲ 1 0.8 +1 ▲ .6 0.6 +0.6 ▲CPS Capital Group 17 25* 20.6 0.7 +0.4 ▲ 7 5.4 +1 ▲ 1.1 1.2 +0.6 ▲
0.8 +1 ▲ .8 ▲Intersuisse Corporate Pty Ltd 18 - 19.6 0.6 +0.6Sanlam Ltd 19 16 19.0 0.6 -0.1 ▼
▲ 1-2 ▼ 1.1 1.1
0.9 +0.9▼
Asia Mark Development Ltd 18.0 0.6 +0.620 - ▲▲3 2.3
Top Twenty Total 2,886.0 93.02 1.6
-0.1
Industry % Change from Same Period Last Year 37.6% ▲ 18.3% 31.6% ▲
+2 .9
# of MarketFees
Change in Manager
▲0.9 +0.982.5
Market MarketBookrunner Proceeds Sh. (%)
MarketSh. (%) Share Ch.
Market
UBS 1 1 884.6 28.6 +0.3 ▲Deals Sh. (%)
4 3.1 -1 ▼ 19.5 21.0 -2.7 ▼Goldman Sachs & Co 2 - 429.7 13.9 +13.9 ▲ 3 2.3 +3 ▲ 6.7 7.2 +7.2 ▲Macquarie Group 3 2 407.2 13.2 -7.2 ▼ 4 3.1 -2 ▼ 10.9 11.7 -7.1 ▼Canaccord Genuity 4 4 177.5 5.7 -2.3 ▼ 7 5.5 +4 ▲ 7.6 8.2 -3.6 ▼Morgans Financial Ltd 5 14 175.9 5.7 +4.9 ▲ 9 7.0 +5 ▲ 6.5 7.0 +4.8 ▲Euroz Securities Ltd 6 30 127.2 4.1 +3.8 ▲ 6 4.7 +5 ▲ 4.6 4.9 +4.4 ▲Hartleys Ltd 7 7 126.9 4.1 +1.2 ▲ 8 6.3 0 - 4.5 4.9 +0.2 ▲Bell Financial Group Ltd 8 5 95.5 3.1 -3.2 ▼ 8 6.3 +1 ▲ 3.2 3.4 -4.1 ▼Wilson HTM 9 23 80.7 2.6 +2.2 ▲ 4 3.1 +2 ▲ 2.6 2.8 +2.3 ▲Investorlink Securities 10 - 63.8 2.1 +2.1 ▲ 1 0.8 +1 ▲ 1.7 1.8 +1.8 ▲
4.0Argonaut Ltd 11 27 56.8 1.8 +1.5 +3.7 ▲Petra Capital Pty Ltd 12 17 56.3 1.8 +1.2 ▲
▲
Taylor Collison Ltd 13 10 41.5 1.3
4.33 2.3 0 -
1.5 1.62.4 +1.43 2.3 +1 ▲ 2.2 ▲
+1.1 ▲ 19 7.0 0▼
1.0 1.1 +1.1-0.4 ▼
Insight Capital Advisors Pty 14 - 32.5 1.1-0.3 -
▼ 10 7.80.8 +1 ▲
0 -Patersons Securities Ltd 15 8 27.7 0.9 -0.9 1.5 1.6 -1.0 ▼Commonwealth Bank of Australia 16 - 25.0 0.8 +0.8 ▲ 1 0.8 +1 ▲ .6CPS Capital Group 17 25* 20.6 0.7 +0.4 ▲ 1.1 1.2
0.6 +0.6 ▲7 5.5 +1▲
0.8 +1 0.9 +0.9+0.6 ▲
Intersuisse Corporate Pty Ltd 18 - 19.6 0.6 +0.6Sanlam Ltd 19 16 19.0 0.6 -0.1 ▼ 3 2.3
.9
▲-2 ▼
.8▲ 11.1 1.1 -0.1 ▼
▲
31.2% ▲▲
82.5Asia Mark Development Ltd 18.0 0.6 +0.620 -Top Twenty Total 2,886.0 93.3
2 1.6▲
Industry Total 3,104.8 100.0 129 +2088.4
Australian Common Stock (AK2) Jan 1 - Mar 31
93.3 100.0
Industry Total
Top 10 Australian Equity & Equity-Related Deals (AU$Mil) Jan 1 - Mar 31
Industry % Change from Last Quarter -62.6% ▼ -29.9% -60.7% ▼
37.0%
▲
▲
100.0 128
▲0.9+2
3,091.8
Proceeds per Bookrunner (AU$m) # of Deals per Bookrunner
+0.9
-29.7% -60.8% ▼
88.7
Industry % Change from Same Period Last Year
Imputed Fees (AU$m)2017 Rank
2016 Rank Share Ch. # of Deals
▲ 17.4%
+19 93.0 100.0
Industry % Change from Last Quarter -62.7% ▼
$757.0
$355.0
$207.2
$163.2
$109.8
$80.0
$75.0
$71.1
$65.0
$63.8
03/22/17
02/24/17
02/24/17
03/31/17
03/20/17
03/03/17
03/30/17
01/17/17
02/16/17
03/01/17
Downer EDI Ltd
MYOB Group Ltd
Macquarie Atlas Roads Group
Cooper Energy Ltd
Dacian Gold Ltd
Tassal Group Ltd
URB Investments Ltd
Corporate Travel Mgmt Ltd
Ruralco Holdings Ltd
G8 Education Ltd
Industrials Materials High Technology Energy and Power
Financials Healthcare Consumer Products and Services Consumer Staples
Retail Media and Entertainment Real Estate
Visit http://dmi.thomsonreuters.com to view archives and order custom League Tables https://www.thomsonone.com
*tie13

nc
0 1 1 0 ▼0 4Ichiyoshi Securities Co Ltd 14 12 4 6 0 0 0 6 ▼ 1 1 4-2 ▼ 1.3 0.3 -0.9 ▼
▼Tokai Tokyo Financial Holdings 13 13 18.1 0.1 -0.4 ▼ 2 2.7
1.4 0 - 1.0 0.2 -0.2-1.3 ▼
Citi 12 8 25.1 0.2 -0.9 ▼ 13 4.1 -1 ▼ 3.5 0.9
2.1 +2.1 ▲SBI Holdings Inc 11 9 30.3 0.2 -0.7 ▼
▲ 1 1.4 +1 ▲ 8.4Deutsche Bank 10 - 189.3 1.5 +1.5+1 ▲ 8.8 2.2 +1.9 ▲
▲Bank of America Merrill Lynch 9 7 193.3 1.5 +0.3 ▲ 3 4.1
2.7 0 - 20.2 5.0 +4.6+3.0 ▲
JP Morgan 8 10 448.9 3.6 +2.9 ▲ 213 17.6 +1 ▲ 36.1 8.9
2.7 +2.2 ▲Daiwa Securities Group Inc 7 5 658.9 5.2 +0.6 ▲
▲ 5 6.8 +3 ▲ 11.1UBS 6 6 738.7 5.9 +4.6+3 ▲ 9.7 2.4 +2.1 ▲
▲Goldman Sachs & Co 5 11 1,197.5 9.5 +8.8 ▲ 4 5.4
16.2 +7 ▲ 53.3 13.1 +3.2-13.3 ▼
Mitsubishi UFJ Morgan Stanley 4 3 1,396.5 11.1 -2.5 ▼ 1217 23.0 +1 ▲ 46.5 11.4
19.5 -21.8 ▼Mizuho Financial Group 3 2 1,609.2 12.8 -6.9 ▼
▼ 24 32.4 +3 ▲ 79.4124.3 30.6 +20.2 ▲
Nomura 2 1 2,031.5 16.1 -31.2+11.7 ▲ 25 33.8 +13 ▲
Sh. (%) # of Deals Fees Sh. (%) Share Ch.Sumitomo Mitsui Finl Grp Inc 1 4 2,483.3 19.7
Market Change in Manager Market MarketBookrunner Proceeds Sh. (%) Share Ch. Deals
2017 Rank
2016 Rank
Market Market # of
Jan 1 - Mar 31 Japan Equity & Equity-Related Volume (US$Bil) by Issue Type Jan 1 - Mar 31
Proceeds per Bookrunner (US$m) # of Deals per Bookrunner Imputed Fees (US$m)
First Quarter 2017 | Equity Capital Markets | Managing Underwriters
Japan Equity Capital MarketsJapanese ECM UP 92% | Follow-on Volume Up 226% | IPO Activity Up 51%
Japan Deals Intelligence
Japanese Equity and Equity related activity totaled US$12.6 billion from 74 dealsduring the first quarter of 2017, a 92.1% increase in volume compared to the firstquarter of 2016 and the strongest opening quarter in the last three years. Follow-on issuance accounted for 60% of total volume.
Japanese follow-on volume reached US$7.6 billion from 36 offerings, up 225.7%compared to the first three months of 2016, posting the highest volume since2014. Follow-on issuance from REITs and Banks captured 25.2% and 24.7% ofthe market, respectively.
Japanese IPO volume totaled US$2 billion from 31 deals, registering a 51.2%increase in volume from the same period in 2016 - the third highest volume in thelast ten years, behind 2010’s US$8.4 billion and 2014’s US$4.9 billion. SushiroGlobal Holdings’ US$680.9 million deal was the largest IPO during the quarter.
Japan Equity & Equity-Related (C1e)
44
3642
37
54
13473
56
74
30
60
90
10
15
20
25
# of
Issu
es
Pro
ceed
s (U
S$b
illion
s)
Industry % Change from Last Quarter 29.1% ▲ ▲52.3% 61.4%*tie
▲ ▲
+20 336.9 100.0
▲
Top Fifteen Total 7,962.9 83.5
Industry % Change from Same Period Last Year 42.6% 154.5%▲
Industry Total 9,540.5 100.0 67
163.2%
0.0 -335.1 99.5
1 1.5 +1 ▲ .7 0.20.1 -0.2 ▼
Okasan Securities Group Inc 15 - 1.6 0.0 0.0 -- 1 1.5 +1 ▲ .3Toyo Securities Co Ltd 14 - 2.2 0.0 0.0
0 - .4 0.1 -1.6 ▼▼
Ichiyoshi Securities Co Ltd 13 12 4.6 0.1 -0.9 ▼ 1 1.53.0 -2 ▼ 1.3 0.4 -1.3
-0.6 ▼Tokai Tokyo Financial Holdings 12 13 18.1 0.2 -0.7 ▼ 2
1 1.5 0 - .5 0.11.0 -2.5 ▼
Citi 11 8 25.1 0.3 -1.6 ▼▼ 3 4.5 -1 ▼ 3.5SBI Holdings Inc 10 9 30.3 0.3 -1.4
+1 ▲ 8.4 2.5 +2.5 ▲▲
Deutsche Bank 9 - 189.3 2.0 +2.0 ▲ 1 1.54.5 +1 ▲ 8.8 2.6 +2.1
+0.8 ▲Bank of America Merrill Lynch 8 7 193.3 2.0 -0.2 ▼ 3
12 17.9 0 - 33.0 9.83.3 +2.5 ▲
Daiwa Securities Group Inc 7 5 569.4 6.0 -2.2 ▼▲ 5 7.5 +3 ▲ 11.1UBS 6 6 738.7 7.7 +5.4
+1 ▲ 8.1 2.4 +1.9 ▲▼
Goldman Sachs & Co 5 11 748.6 7.9 +6.7 ▲ 2 3.022.4 +3 ▲ 33.6 10.0 -13.3
-2.9 ▼Mizuho Financial Group 4 3 942.4 9.9 -9.7 ▼ 15
10 14.9 +5 ▲ 40.9 12.218.4 -11.8 ▼
Mitsubishi UFJ Morgan Stanley 3 2 947.6 9.9 -14.7 ▼▼ 21 31.3 +4 ▲ 62.0Nomura 2 1 1,095.2 11.5 -14.1
+13 ▲ 122.5 36.4 +25.7 ▲Sh. (%) Share Ch.
Sumitomo Mitsui Finl Grp Inc 1 4 2,456.5 25.8 +16.4 ▲ 24Bookrunner Proceeds Sh. (%) Share Ch. Deals Sh. (%)
2017 Rank
2016 Rank
Market Market # of
Japan Common Stock (C4d) Jan 1 - Mar 31 Top 10 Japan Equity & Equity-Related Deals (US$Mil) First Quarter 2017
Proceeds per Bookrunner (US$m) # of Deals per Bookrunner Imputed Fees (US$m)
Industry % Change from Last Quarter 67.3% ▲ 64.4% 91.5% ▲▲Industry % Change from Same Period Last Year 92.1% ▲ 32.1% 97.7% ▲▲
404.3 99.4406.8 100.074
Top Fifteen Total 11,027.4 87.5Industry Total 12,606.4 100.0 +18
Market Change in # of Deals
35.8
.3 -0.1 ▼
Manager Market MarketFees
0.10.1 -1.0 ▼
Toyo Securities Co Ltd 15 - 2.2 0.0 0.0 -0 -
1 1.4 +1 ▲.4Ichiyoshi Securities Co Ltd 14 12 4.6 0.0 -0.6 ▼ 1 1.4
13
00
5
2008 2009 2010 2011 2012 2013 2014 2015 2016 2017
P
IPO Follow-On Convertible # of Issues
$1,577.5
$959.3
$680.9
$673.3
$673.3
$666.8
$666.8
$463.9
$462.1
$461.0
03/13/17
02/08/17
03/21/17
03/14/17
03/14/17
03/14/17
03/14/17
03/13/17
02/10/17
01/30/17
Sumitomo Mitsui Finl Grp Inc
Fujitsu Ltd
Sushiro Global Holdings Ltd
Mitsubishi Chemical Holdings
Mitsubishi Chemical Holdings
Kyushu Electric Power Co Inc
Kyushu Electric Power Co Inc
Macromill Inc
SUMCO Corp
M3 Inc
Visit http://dmi.thomsonreuters.com to view archives and order custom League Tables https://www.thomsonone.com14

Japan Equity & Equity-Related Proceeds by Industry (US$Bil)
-0.1 ▼
Jan 1 - Mar 31
Proceeds per Bookrunner (US$m) # of Deals per Bookrunner Imputed Fees (US$m)Manager Market Market# of MarketMarket
Japan Secondary Offerings (C8d) Jan 1 - Mar 31
1
▼14.8% -21.2%Industry % Change from Last Quarter -61.7% ▼▲19.2% 63.2%Industry % Change from Same Period Last Year 51.2% ▲
100.031 +5 98.698.3
Industry Total 1,961.2 100.096.9Top Eleven Total 1,961.2 100.0
0.4 +0.2 ▲▲ 1 3.2 +1 ▲ .4Okasan Securities Group Inc 11 - 1.6 0.1 +0.10.2 0.0 -▲ 1 3.2 +1 ▲ .2Toyo Securities Co Ltd 10 - 2.2 0.1 +0.10.6 -2.2 ▼▼ 1 3.2 -2 ▼ .6Tokai Tokyo Financial Holdings 9 8 6.2 0.3 -1.62.9 -3.3 ▼▼ 3 9.7 0 - 2.9SBI Holdings Inc 8 6 30.3 1.6 -2.14.5 +4.1 ▲▼ 2 6.5 +1 ▲ 4.4Bank of America Merrill Lynch 7 4 87.7 4.5 -0.23.9 +3.9 ▲▲ 1 3.2 +1 ▲ 3.8UBS 6 - 121.6 6.2 +6.2
13.4 +6.1 ▲▲ 5 16.1 +2 ▲ 13.2▲ 14.3
Sumitomo Mitsui Finl Grp Inc 5 9 228.9 11.7 +10.1Mitsubishi UFJ Morgan Stanley 4Daiwa Securities Group Inc 3 5
14.5 +2.5 ▲▼ 2 6.5 +13 253.8 12.9 -8.7
Mizuho Financial Group 2 2262.9 13.4 +9.3 +4.6 ▲▲ 6 19.4 +1
114.1376.1 19.2 -10.3
▲ 10.0 10.1-8.8 ▼▼ 7 22.6 +1 ▲ 13.9
Share Ch.33.2 33.7▲ -3.7
Fees Sh. (%)# of Deals▼+6Nomura 589.8 30.1 12 38.7
2017 Rank
2016 Rank
MarketBookrunner Sh. (%)Proceeds Sh. (%) Share Ch. Deals
Japan IPOs (C7d)
Change in
Jan 1 - Mar 31
First Quarter 2017 | Equity Capital Markets | Managing Underwriters
Japan Equity Capital Markets
▲▲
$2.419%
$2.318%
$1.915% $1.6
12%
$1.311%
$1.08%$0.7
6%
$0.54%
$0.54%
$0.43%
$0.00%$0.0
0%
High Technology
Real Estate
Financials
Materials
Energy and Power
Retail
Consumer Products and Services
Media and Entertainment
Industrials
Consumer Staples
Healthcare
Japan IPO Quarterly Volume (US$Bil) and Deal Count
70.0 100.069.4 99.1
+2.4 ▲▲
+17.1 ▲
Share Ch.
-15.4 ▼
Top Seven Total 3,066.0 100.0Industry Total 3,066.0 100.0
+2 ▲
-27
1 14.3 0
1.7 2.428.9 +28.9+2 ▲ 20.2
Goldman Sachs & Co 3* - 448.9 14.6 +14.614.6 +14.6 ▲ 28.62
2 28.6▲
▼12.9Mitsubishi UFJ Morgan Stanley 3* - 448.9 14.6 +14.6 ▲ 28.6
+2.0 -22
▼ 18.4 -8.8+2 ▲ 17.712.4
▲ 2 28.61 1 ▼2 2 666.8 21.8
▼-2.3 ▼
-12.1
Market Market
-1 ▼
▼Sh. (%)
24.9 -36.517.4
Jan 1 - Mar 31Japan Convertibles (C9e)
▲
▼ 8 22.2
7 5 -6.5 ▼
Mizuho Financial Group 5 3 566.3 7.5 -6.53.1
+2 ▲ 19.7 8.3▲+1.7
-6.5 ▼UBS 4 6 617.2 8.1 +4.5 ▲ 4
8 22.2 +4 ▲ 26.611.1 +2 ▲ 7.3
11.23.4 +2.4 ▲
Mitsubishi UFJ Morgan Stanley 3 1 693.8 9.2 -17.1Goldman Sachs & Co 2 9 748.6 9.9
▼▲ 8.1
109.3 45.9 +32.3 ▲2 5.6 +1 ▲
Share Ch.Sumitomo Mitsui Finl Grp Inc 1 4 2,227.6 29.4 +15.6 ▲ 19
Sh. (%)2017 Rank
2016 Rank
MarketFees
Manager# of Market Change in # of DealsBookrunner Proceeds Sh. (%) Share Ch. Deals
Proceeds per Bookrunner (US$m) # of Deals per Bookrunner
30.5 -43.6Deals Sh. (%)
▼Sh. (%) Share Ch.
42.9
# of
-1
2017 Rank
2016 Rank
Nomura 936.3 3
Market
+8.0
Change in Market
JP Morgan 3* - 448.9
Bookrunner Proceeds
Mizuho Financial Group
Imputed Fees (US$m)Proceeds per Bookrunner (US$m) # of Deals per Bookrunner
Fees# of DealsMarket ManagerMarket
111.8% 184.9%Industry % Change from Last Quarter 233.5% ▲▲71.4% 230.8%Industry % Change from Same Period Last Year 225.7% ▲
100.036 +15 238.299.5
7,579.3 100.0237.0Top Twelve Total 6,001.8 79.2
Industry Total
0.1 +0.1 ▲▲ 1 2.8 +1 ▲ .1Ichiyoshi Securities Co Ltd 12 - 4.6 0.1 +0.10.3 -0.4 ▼▼ 1 2.8 0 - .8Tokai Tokyo Financial Holdings 11 12 11.8 0.2 -0.20.2 -1.0 ▼▼ 1 2.8 0 - .5Citi 10 7 25.1 0.3 -2.71.8 +1.2 ▲▲ 1 2.8 0 - 4.4Bank of America Merrill Lynch 9 10 105.6 1.4 +0.53.5 +3.5 ▲▲ 1 2.8 +1 ▲ 8.4Deutsche Bank 8 - 189.3 2.5 +2.5
Daiwa Securities Group Inc 306.5 4.0 6 16.725.0Nomura 6 2 -16.3 12.1
23.1 9.7505.4 6.7 9▼ -2 28.7▼
Market
+11 ▲
Imputed Fees (US$m)
Sh. (%)52.8
Market
-7.2 ▼Sumitomo Mitsui Finl Grp Inc 7 3 26.8 0.9 1.8 2.6-▲ 1 14.3 +1 +4.0 ▲3.0 4.3▲Daiwa Securities Group Inc 6 - 89.5 2.9 +2.9
-5.3 ▼
▼Industry % Change from Last Quarter 1977.2% ▲ 600.0% ▲ ###### ▲Industry % Change from Same Period Last Year 4.4% ▲ -22.2% ▼ -4.8%
▲▲
49
20 22
36
54 62
83
98 93
23
-
20
40
60
80
100
120
140
160
-
2
4
6
8
10
12
14
16
2008 2009 2010 2011 2012 2013 2014 2015 2016 2017
# of
Issu
es
Pro
ceed
s (U
S$b
illion
s)
1Q 2Q 3Q 4Q # of Issues
*tie
y g Q
Visit http://dmi.thomsonreuters.com to view archives and order custom League Tables https://www.thomsonone.com15
-
-
-
-
EMEA
-
-Asia-Pacific
-
Japan
Tel: +632.459.1647
Tel: +813.6441.1120
E-mail: [email protected]
Ewelina Jarecka
Tel: +1.646.223.8457E-mail: [email protected]
Tel: +44.207.542.2246
First Quarter 2017 | Equity Capital Markets | Managing Underwriters
League table volumes for Mitsubishi UFJ Financial Group and Morgan Stanley, included herein, reflect changes after the commencement of their jointly established securities firms in Japan: (1) Mitsubishi UFJ Morgan Stanley Securities and (2) Morgan Stanley MUFG Securities. Credit for the newly established joint ventures rolls up to Morgan Stanley. For Japanese involvement league tables Morgan Stanley will be represented as "Mitsubishi UFJ Morgan Stanley".
Convertible Bonds with a minimum life of less than 360 days are excluded. Minimum life defined as the difference between the settlement date and the earliest maturity date or first call/put option.
Imputed fees are generated using a proprietary Thomson Reuters algorithm when spreads or fees are not disclosed. Deal fees are on a gross basis before all expenses. Each underwriter or advisor is allocated its share of deal fees using the Thomson Reuters allocation methodology, based on the number of underwriters or advisors on the deal and their role. No fees are allocated to non-lead loan syndicate members. Fee estimates presented in the Quarterly Review for deals updated prior to February 1st, 2017 were generated by Freeman Consulting in partnership with Thomson Reuters.
Database coverage includes domestic and international placements of equity offerings in addition to domestic and international equity-related transactions. This includes IPOs, follow-on offerings, accelerated bookbuilds and block trades (with certain restrictions) and convertible bonds.
If you would like to participate in the submission process, receive quarterly press releases, or have questions about our full league table criteria please contact:
Evgeniya KolesovaAmericas
E-mail: [email protected]
Non-US dollar denominated transactions are converted to the US dollar equivalent at the time of pricing.
htt // th
Ranking Criteria Summary
E-mail: [email protected]
Aki Sato
Antoinette Reyes
Transactions must be received within 5 business days of pricing. (Rule 144a transactions sold exclusively in the US market, MBS, ABS transactions in all markets and all Federal Credit Agency transactions must be received within 5 business days of settlement.) Transactions not received by the applicable deadline are entered into the database but classified as rank ineligible and are not included in league tables for the current calendar year.
All league tables are based on deal proceeds (total issue amount or number of shares multiplied by the issue price) unless otherwise stated. All data for the periods shown are as reflected in Thomson Reuters databases as of 9:00am EDT on March 31, 2017. Full credit is given to the bookrunner, equal if joint books. In cases of underwriter consolidation, credit is given to the surviving/parent firm.
Vi it htt //d i th t t i hi d d t L T bl
While Thomson Reuters has used reasonable endeavors to ensure that the information provided in this document is accurate and up to date as at the time of issue, neither Thomson Reuters nor its third party content providers shall be liable for any errors, inaccuracies or delays in the information, nor for any actions taken in reliance thereon, nor does it endorse any views or opinions of any third party content provider. Thomson Reuters disclaims all warranties, express or implied, as to the accuracy or completeness of any of the content provided, or as to the fitness of the content for any purpose to the extent permitted by law. The content herein is not appropriate for the purposes of making a decision to carry out a transaction or trade and does not provide any form of advice (investment, tax, legal) amounting to investment advice, nor make any recommendations or solicitations regarding particular financial instruments, investments or products, including the buying or selling of securities. Thomson Reuters has not undertaken any liability or obligation relating to the purchase or sale of securities for or by any person in connection with this document. © 2017 Thomson Reuters. All rights reserved. Thomson Reuters and the Thomson Reuters logo are registered trademarks and trademarks of Thomson Reuters and its affiliated companies. Any third party name or mark herein belongs to the relevant third party.
16

Thomson Reuters Solutions for the Deal Making Community
FOR STRATEGY AND PLANNING TEAMSFOR INFORMATION PROFESSIONALSSDC Platinum is the world’s foremost financial transactions database, covering new issues, M&A, syndicated loans, private equity, project finance, poison pills, and more.
Solution for:• Market Analysis & Trends (Geography, Sector,Asset Class, Deal Type, Deal Size, etc.)• Deal Origination (Debt Maturity Analysis,Company Lifecycle including Private Equity)• Pitch Creation (Firm Credentials, Representative Acquirors)• M&A Targeting (Active Strategic/SponsorAcquirors, Target Company Screener)• Negotiation (T&C Benchmarking)
Thomson Reuters Deals Business Intelligence enables you to slice and dice our renowned Deals and Fees data to create ad hoc reports, analyze market trends, benchmark your performance and identify opportunities – all within a tool built into your workflow in Excel®, saving you valuable time and giving you a competitive edge.
Solution for:• Conducting market analysis and identifying trends• Benchmarking your performance and monitoring competitors• Targeting clients by wallet size and banking relationship• Allocating resources more effectively by evaluating and analyzing lost deals
FOR INVESTMENT BANKERS
evaluating and analyzing lost deals
Send us a sales enquiry at: financial.thomsonreuters.com/salesRead more about our products at: financial.thomsonreuters.com/products
To purchase individual Thomson reuters Deals or League Table reports, please contact our Thomson Reuters On Demand group:
Email: [email protected]
Access unique analysis for free anytime using Thomson Reuters Deals Intelligence website and receive regular updates, delivered direct to your inbox.
Go to: dmi.thomsonreuters.com/dealsintelligence
Thomson Reuters Eikon is the most intuitive and comprehensive way of staying informed. With natural-language search, you can quickly find global information,news, charts and analytics. Company and industry views provide top-level summaries, and then detailed information is just a click away. Identify new opportunities and gain deep understanding of markets, industries, companies and events.
Thomson Reuters Eikon also includes an Add-In for Microsoft® Office to help you increase your efficiency. From screening and targeting to comparables analysis, building league tables, valuing a company
and developing a client pitch book, you can do all this without leaving Microsoft Office. Search and autosuggest features in Excel make model-building easier.
Solution for:• Managing Client Relationships• Deal Origination• New Issues Pre-Marketing/Roadshows• Financial Modeling• Customized League Tables• Simple Deals screening• Valuation analysis and comparabledeal screening• On-brand pitch book creation
©2017 Thomson ReutersThomson Reuters and the Kinesis logo are trademarks of Thomson Reuters. 17