global equity & global fixed income program consultant review · pdf fileglobal equity...
TRANSCRIPT

Global Equity & Global Fixed Income Program Consultant Review
Steve Foresti, Chief Investment Officer, Wilshire ConsultingRose Dean, Managing Director
Thomas Toth, Managing DirectorDaniel Ingram, Vice President
September 18, 2017
Item 6d, Attachment 2, Page 1 of 22
Program Roles in Asset Allocation
Item 6d, Attachment 2, Page 2 of 22

• Global Equity: provides growth exposure and return potential
• Fixed Income: provides stability and income
Role of Programs in Total Fund
3
Global Equity Private Markets
Fixed Income
Liquidity
Inflation Assets
Real Estate
Infrastructure & Forestland
(15)
(10)
(5)
0
5
10
15
(15) (10) (5) 0 5 10 15
Inflat
ion
Expo
sure
Growth Exposure
Expected ReturnBubble Size:
Item 6d, Attachment 2, Page 3 of 22

Global Fixed Income and Global Equity Diversifiers for CalPERS
4
Item 6d, Attachment 2, Page 4 of 22

Global Fixed Income and Global Equity Significant Diversification Benefits
5
Item 6d, Attachment 2, Page 5 of 22

• As part of its review process, Wilshire gathers examples of Staff’s investment behavior and practices to ensure they are consistent with CalPERS’ Investment Beliefs
Adherence to Investment Beliefs
6
Investment Belief Example#8 “Costs matter and need to be effectively managed”
GE’s combination of cost‐effective internalimplementation and external strategy rationalization
#2 “A long time investment horizon is a responsibility and an advantage”
GFI’s consistency in diversifying equity returns over different market cycles throughout the past 20 years
#7 “CalPERS will take risk only where we have a strong belief we will be rewarded for it”
GFI’s tactical management of interest rate risk in the portfolio
#4 “Long‐term value creation requires effective management of three forms of capital: financial, physical and human”
GE’s working group set up to search for positive ESG‐tilted strategies with either reduced downside risk or incremental return relative to benchmark
Item 6d, Attachment 2, Page 6 of 22

Progress on ESG Integration
7
• ESG factors are integrated into the investment decision-making process within GE and GFI because CalPERS believes ESG factors are a critical component of robust investment analysis
• At the staff-level, ESG integration practices are overseen by the Governance and Sustainability Sub-Committee that reports directly to the Investment Strategy Group
• Since this is a newly implemented structure it will be important to monitor through time evidence this process is working effectively
• Both Programs signal to their external partners the importance of considering the impact of ESG risks and opportunities and evaluate their partners’ progress through a detailed ESG questionnaire
• With access to ESG data and analysis from external vendors, Staff have put in place robust processes to monitor and manage ESG risks across individual strategies and the aggregate portfolio
Item 6d, Attachment 2, Page 7 of 22

Global Fixed Income Review
Item 6d, Attachment 2, Page 8 of 22

• Active Investment Process
• 93% managed internally
• 7% allocation to external managers
• Performs well across a full market cycle
• Some aspects may emphasize sensitivity to “economic growth” factor across the total portfolio
• Strong Experienced Team
• MID most tenured INVO team leader
• Senior Staff have long-track records
Global Fixed Income Program
9
• Manage across the credit spectrum –along with inflation sensitive assets
• US Treasuries
• Corporate Credit
• Mortgages
• Asset-backed
• CLOs
• Short-term
• Inflation-linked
• Currency
• Commodities
• TIPs
Item 6d, Attachment 2, Page 9 of 22

SWOT Analysis – Global Fixed Income Program
10
Strengths•Experienced MID•Experienced Team•Time‐Tested investment process•Strong performance and proven diversification benefits relative to Global Equity
•Consolidated cash management
Weaknesses•Organizational structure•Compensation constraints•Promotion restrictions
Opportunities•Risk management•Expansion of expertise to other areas of Total Fund such as the Opportunistic program
Threats•MID succession•Senior turnover and recruiting•Growing complexity of internal management functions
•Additional INVO committee responsibilities
Global Fixed Income Program
Item 6d, Attachment 2, Page 10 of 22

• Recent Performance
• More challenging market environment for the Global Fixed Income asset class in past year (index down -0.9%)
• Strong relative results for the GFI Program over the all time periods (> 60 bps excess return target)
• Longer-term performance of 6.5% provides strong contribution to Total Fund return and outperformed benchmark by 0.7%
Global Fixed Income Performance
11
Item 6d, Attachment 2, Page 11 of 22

• 3-year rolling excess return and tracking error
• Excess return consistently positive following financial crisis ranging from 0.4% to 1.2%
• Tracking error stable and ranging between 0.6% and 1.0% following the recovery from the financial crisis
Global Fixed Income Relative Return and Risk as of June 2017
12
‐4
‐3
‐2
‐1
0
1
2
3
4
5
Jun‐03 Jun‐05 Jun‐07 Jun‐09 Jun‐11 Jun‐13 Jun‐15 Jun‐17
Percen
t(%)
Date
Global Fixed Income Excess Return & Tracking Error (3‐Year Rolling)
Excess Return Tracking Error
Item 6d, Attachment 2, Page 12 of 22

Positive Relative Performance in both up and down markets
Up/Down Market Performance
13
Item 6d, Attachment 2, Page 13 of 22

Strong total score ranking in the 2nd
decile utilizing Wilshire’s manager research scoring framework
• Particularly strong in Information Gathering, Forecasting, and Portfolio Construction
• Broader organizational constraints around long term retention incentives reduces “Firm” score
Global Fixed Income Program Scores
14
Total Qualitative Score 2ndWt. Tier
Organization 20% 4thFIRM 50% 6thQuality and Stabil ity of Senior ManagementQuality of OrganizationOwnership/Incentives
TEAM 50% 3rdStability of Investment ProfessionalsQuality of TeamCommitment to Improvement
Information Gathering 20% 1stInformation ResourcesDepth of InformationBreadth of Information
Forecasting 20% 1stClear & Intuitive Forecasting ApproachRepeatable ProcessStrength, Clarity, and Intuitiveness of Valuation MethodologyForecasting Success‐AtlasUnique Forecasting Approach
Portfolio Construction 20% 1stRisk Budgeting/ControlDefined Buy/Sell DisciplineConsistency of Portfolio Characteristics
Implementation 10% 2ndResourcesLiquidityCompliance/Trading/Monitoring
Attribution 10% 3rdDepth of AttributionIntegration of Attribution
Item 6d, Attachment 2, Page 14 of 22

Global Equity Review
Item 6d, Attachment 2, Page 15 of 22
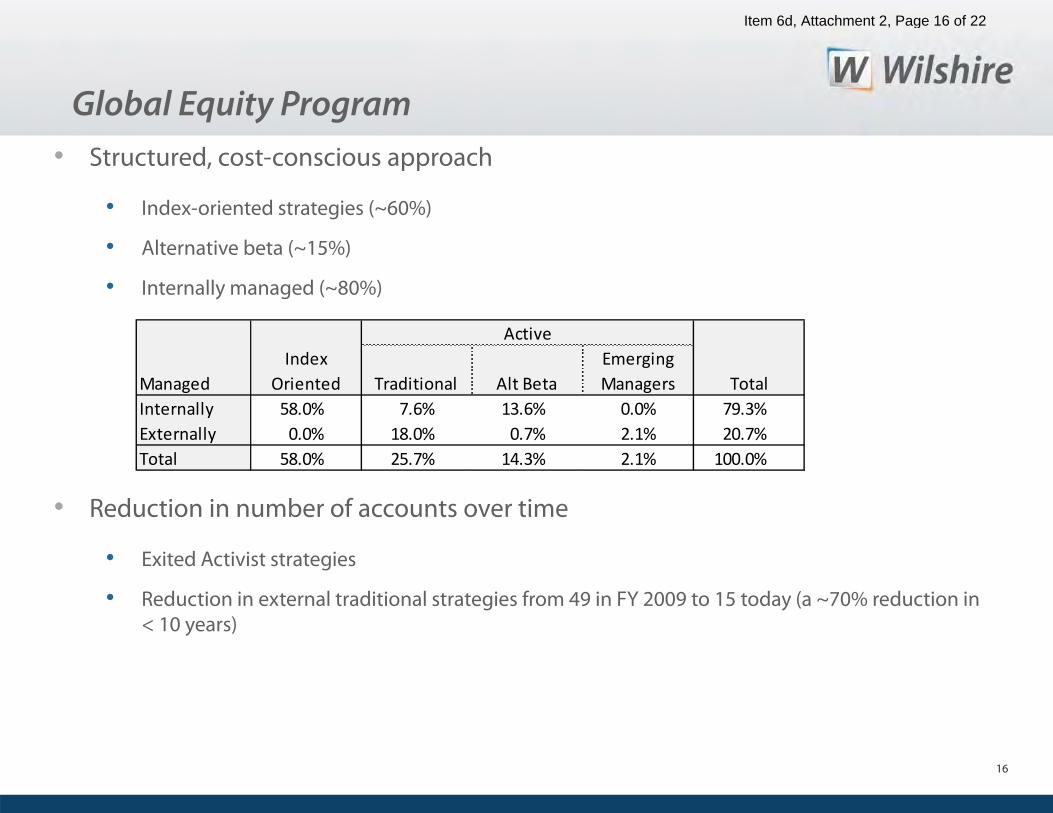
• Structured, cost-conscious approach
• Index-oriented strategies (~60%)
• Alternative beta (~15%)
• Internally managed (~80%)
• Reduction in number of accounts over time
• Exited Activist strategies
• Reduction in external traditional strategies from 49 in FY 2009 to 15 today (a ~70% reduction in < 10 years)
Global Equity Program
16
Managed Traditional Alt BetaEmerging Managers Total
Internally 58.0% 7.6% 13.6% 0.0% 79.3%Externally 0.0% 18.0% 0.7% 2.1% 20.7%Total 58.0% 25.7% 14.3% 2.1% 100.0%
Index Oriented
Active
Item 6d, Attachment 2, Page 16 of 22

SWOT Analysis – Global Equity Program
17
Strengths•Experienced MID•Experienced Team•Risk‐controlled investment approach• Strong performance following GFC and proven diversification benefits relative to Global Fixed Income
•Centralized execution platform
Weaknesses•Organization structure•Compensation constraints• Promotion restrictions
Opportunities•Enhancement of Global Equity characteristics related to role in asset allocation
•Providing support and expertise in asset allocation related activities such as “Portfolio Priorities” project and Asset Allocation
•Committee and subcommittee governance structure enhancements
Threats• Senior turnover and recruiting•Growing complexity of portfolio concepts such as smart beta and enhancements of Global Equity characteristics
•Additional INVO committee responsibilities
Global Equity Program
Item 6d, Attachment 2, Page 17 of 22

• Recent Performance
• Positive environment for the Global Equity asset class in past year (index up nearly 20%)
• Despite negative relative results for the GE Program over the past year, excess returns have exceeded their 15 bps target since the Global Financial Crisis (GFC)
• Longer-term (10 year) relative underperformance continues to reflect significant underperformance during the GFC
Global Equity Performance
18
19.6
5.3
11.6
4.3
19.8
5.3
11.4
4.7
‐0.2
0.1 0.3
‐0.4‐500%
0%
500%
1000%
1500%
2000%
2500%
1 Year 3 Years 5 Years 10 Years
Performance thru June 2016 (% annualized)
Portfolio Benchmark Net
Note that, due to rounding, “Net” figures are not uniformly consistent with the differences in displayed “Portfolio” and “Benchmark” returns.
Item 6d, Attachment 2, Page 18 of 22

• 3-year rolling excess return and tracking error vs. targets
• Target excess return = 15 bps (black line)
• Target tracking error range = 0 to 50 bps (blue line)
Global Equity Relative Return and Risk
19
‐2.0
‐1.5
‐1.0
‐0.5
0.0
0.5
1.0
1.5
Jun‐03 Jun‐05 Jun‐07 Jun‐09 Jun‐11 Jun‐13 Jun‐15 Jun‐17
Percen
t (%)
Date
Global Equity Excess Return & Tracking Error (3‐Year Rolling)Excess Return Excess Return Target Tracking Error Tracking Error Budget
Item 6d, Attachment 2, Page 19 of 22

Up/Down Market Performance
20
Enhancements improved return profile during down markets
Item 6d, Attachment 2, Page 20 of 22

Strong total score ranking in the 2nd decile utilizing Wilshire’s manager research scoring framework
• Particularly strong in Portfolio Construction, Implementation and Attribution. The Program also scores highly in Information due to its access and use of wide breadth of Information and external partners.
• Broader organizational constraints around long-term retention incentives reduces “Firm” score
Global Equity Program Scores
21
CalPERS Global Equity TierTotal Qualitative Score 2nd
Weight TierOrganization 20% 4thFIRM 50% 6thQuality and Stabil ity of Senior ManagementQuality of OrganizationOwnership/IncentivesTEAM 50% 3rdStabil ity of Investment ProfessionalsQuality of TeamCommitment to Improvement
Information Gathering 20% 2ndInformation ResourcesDepth of InformationBreadth of Information
Forecasting 20% 3rdClear & Intuitive Forecasting ApproachRepeatable ProcessStrength, Clarity, and Intuitiveness of Valuation MethodologyForecasting SuccessUnique Forecasting Approach
Portfolio Construction 20% 1stRisk Budgeting/ControlDefined Buy/Sell DisciplineConsistency of Portfolio Characteristics
Implementation 10% 1stResourcesLiquidityCompliance/Trading/Monitoring
Attribution 10% 1stDepth of AttributionIntegration of Attribution
Item 6d, Attachment 2, Page 21 of 22

Important Information
This material contains confidential and proprietary information of Wilshire Consulting, and is intended for the exclusive use of the person to whom it isprovided. It may not be modified, sold or otherwise provided, in whole or in part, to any other person or entity without prior written permission fromWilshire Consulting. The information contained herein has been obtained from sources believed to be reliable. Wilshire Consulting gives norepresentations or warranties as to the accuracy of such information, and accepts no responsibility or liability (including for indirect, consequential orincidental damages) for any error, omission or inaccuracy in such information and for results obtained from its use. Information and opinions are as of thedate indicated, and are subject to change without notice.
This material is intended for informational purposes only and should not be construed as legal, accounting, tax, investment, or other professional advice.
This presentation represents the current opinion of the firm based on sources deemed reliable. The information and statistical data contained herein arebased on sources believed to be reliable. Wilshire does not represent that it is accurate and should not be relied on as such or be the basis for aninvestment decision. This Presentation is for information purposes only. Past performance is no guarantee of future results.
Any opinions expressed in this Presentation are current only as of the time made and are subject to change without notice. Wilshire assumes no duty toupdate any such statements. Any holdings of a particular company or security discussed herein are under periodic review by the author and are subjectto change at any time, without notice.
This report may include estimates, projections and other "forward-looking statements." Due to numerous factors, actual events may differ substantiallyfrom those presented.
This presentation is not to be used or considered as an offer to sell, or a solicitation to an offer to buy, any security. Nothing contained herein should beconsidered a recommendation or advice to purchase or sell any security. Wilshire, its officers, directors, employees or clients may have positions insecurities or investments mentioned in this publication, which positions may change at any time, without notice.
Wilshire® is a registered service mark of Wilshire Associates Incorporated, Santa Monica, California. All other trade names, trademarks, and/or servicemarks are the property of their respective holders.
Copyright © 2017 Wilshire Associates Incorporated. All rights reserved.
22
Item 6d, Attachment 2, Page 22 of 22