global fishery prospects under contrasting management … · global fishery prospects under...
TRANSCRIPT
Global fishery prospects under contrastingmanagement regimesChristopher Costelloa,1, Daniel Ovandoa, Tyler Clavellea, C. Kent Straussb, Ray Hilbornc, Michael C. Melnychukc,Trevor A. Branchc, Steven D. Gainesa, Cody S. Szuwalskia, Reniel B. Cabrala, Douglas N. Raderb, and Amanda Lelandb
aBren School of Environmental Science and Management, University of California, Santa Barbara, CA 93106; bEnvironmental Defense Fund, New York, NY10010; and cSchool of Aquatic and Fishery Sciences, University of Washington, Seattle, WA 98195
Edited by James A. Estes, University of California, Santa Cruz, CA, and approved February 26, 2016 (received for review October 14, 2015)
Data from 4,713 fisheries worldwide, representing 78% of globalreported fish catch, are analyzed to estimate the status, trends,and benefits of alternative approaches to recovering depletedfisheries. For each fishery, we estimate current biological statusand forecast the impacts of contrasting management regimes oncatch, profit, and biomass of fish in the sea. We estimate uniquerecovery targets and trajectories for each fishery, calculate the year-by-year effects of alternative recovery approaches, and model howalternative institutional reforms affect recovery outcomes. Currentstatus is highly heterogeneous—the median fishery is in poor health(overfished, with further overfishing occurring), although 32%of fish-eries are in good biological, although not necessarily economic, con-dition. Our business-as-usual scenario projects further divergence andcontinued collapse for many of the world’s fisheries. Applying soundmanagement reforms to global fisheries in our dataset could gener-ate annual increases exceeding 16 million metric tons (MMT) in catch,$53 billion in profit, and 619 MMT in biomass relative to business asusual. We also find that, with appropriate reforms, recovery can hap-pen quickly, with the median fishery taking under 10 y to reach re-covery targets. Our results show that commonsense reforms tofishery management would dramatically improve overall fish abun-dance while increasing food security and profits.
fishery recovery | fishery reform | rights-based fishery management |bioeconomic model
Recent advances in our understanding of global fishery status(1–4) provide a foundation for estimating the targets for, and
potential benefits from, global fishery recovery. Although existingaggregate estimates make a compelling general case for reform(5, 6) new data, models, and methods allow for more detailedanalysis of the benefits and trade-offs of contrasting managementregimes. Indeed, emerging empirical evidence shows that effectivereforms and scientific assessments taken by some countries havealready placed their fisheries on a positive path (1, 7). Reformsspan a range of approaches, from scientifically informed harvestpolicies to institutional reforms that restructure the incentives in afishery to align profits with conservation. In many cases, thesechanges have successfully reduced fishing effort to sustainablelevels and stabilized overfished stocks (7, 8). These cases of suc-cessful management contain lessons that can be applied morebroadly and also suggest that effects of fishery reform will differacross fisheries, nations, and reform policies. However, these newdata, models, and lessons learned have never been synthesized toinform the future potential from global fishery recovery.Here, we ask, what might be the future of global fisheries under
alternative management regimes? In addition, what might happenif we undertook the reforms that previous studies have stressed areurgently needed? We couple the latest individual fishery data tobioeconomic models to estimate alternative scenarios of fisheryrecovery for individual fisheries, countries, and the globe. We seekto inform policy recommendations for recovering fisheries, in-cluding insights regarding the following: (i) what is the status offisheries across the globe? (ii) Are there strong trade-offs orsynergies between recovery efforts that emphasize fishery profits
vs. catch vs. biomass conservation? (iii) In a world with limitedresources to devote to fishery recovery, which countries providethe most compelling and urgent cases for fishery reform? In ad-dition, (iv) how long will benefits of reform take to arrive?We examined three approaches to future fishery management:
(1) business-as-usual management (BAU) (for which status quomanagement is used for projections) (SI Appendix), (2) fishing tomaximize long-term catch (FMSY), and (3) rights-based fisherymanagement (RBFM), where economic value is optimized. Thelatter approach, in which catches are specifically chosen tomaximize the long-term sustainable economic value of the fish-ery, has been shown to increase product prices (primarily due toincreased quality and market timing) and reduce fishing costs(primarily due to a reduced race to fish); these are reflected inthe model. In all scenarios, we account for the fact that fishprices will change in response to levels of harvest.For each fishery, we estimate future trajectories out to 2050 of
catch, profit, and biomass under each policy. Other social ob-jectives such as employment, equity, or biodiversity conservationare clearly important, and may be correlated with these out-comes, but are not explicitly modeled here. Aggregating acrossfisheries provides country and global estimates of the conse-quences and trade-offs of alternative policies for recoveringfisheries. A strength of our approach is the ability to forecasteffects for fisheries in the Food and Agriculture Organization(FAO) “not elsewhere included” (NEI) category (SI Appendix).Bioeconomic theory provides some predictions for the trade-
offs across alternative societal objectives of food, profit, and
Significance
What would extensive fishery reform look like? In addition, whatwould be the benefits and trade-offs of implementing alternativeapproaches to fisheries management on a worldwide scale? To findout, we assembled the largest-of-its-kind database and coupled it tostate-of-the-art bioeconomic models for more than 4,500 fisheriesaround the world. We find that, in nearly every country of theworld, fishery recoverywould simultaneously drive increases in foodprovision, fishery profits, and fish biomass in the sea. Our resultssuggest that a suite of approaches providing individual or communalaccess rights to fishery resources can align incentives across profit,food, and conservation so that few trade-offs will have to be madeacross these objectives in selecting effective policy interventions.
Author contributions: C.C., C.K.S., R.H., M.C.M., T.A.B., S.D.G., C.S.S., D.N.R., and A.L.designed research; C.C., D.O., T.C., C.K.S., M.C.M., C.S.S., and R.B.C. performed research;D.O., T.C., R.H., M.C.M., C.S.S., R.B.C., and D.N.R. analyzed data; and C.C., S.D.G., R.B.C., D.N.R.,and A.L. wrote the paper.
The authors declare no conflict of interest.
This article is a PNAS Direct Submission.
Freely available online through the PNAS open access option.
See Commentary on page 4895.1To whom correspondence should be addressed. Email: [email protected].
This article contains supporting information online at www.pnas.org/lookup/suppl/doi:10.1073/pnas.1520420113/-/DCSupplemental.
www.pnas.org/cgi/doi/10.1073/pnas.1520420113 PNAS | May 3, 2016 | vol. 113 | no. 18 | 5125–5129
SUST
AINABILITY
SCIENCE
ENVIRONMEN
TAL
SCIENCE
SSE
ECO
MMEN
TARY
biomass conservation. Perhaps the most salient point is that thethree objectives can go hand-in-hand, at least in comparison witha fishery in a depleted state. Consider, for example, a small-scaleopen-access fishery in the developing tropics, with biomass [scaledby biomass at maximum sustainable yield (MSY)] B=BMSY = 0.3(overfished) and fishing pressure (scaled by the fishing pressure thatwould generate MSY) F=FMSY = 1.7 (overfishing). Such a fisherywould be near bionomic equilibrium (9), so biomass and profitwould be low, but stable from year to year. Because the stock hasbeen overfished, the catch is also small—in this case, it is just one-half of MSY. Recovering such a fishery would eventually increasefish catch, profit, and fish biomass.However, there are nontrivial cases in which trade-offs do
exist. For example, consider a fishery with B=BMSY = 0.4 andF=FMSY = 2.5, where biomass is lower than optimal and still de-clining. Despite the low biomass, fishing mortality is so large thatharvest remains high—in this case, it is MSY. Although suchpressure will ultimately reduce the stock, the inevitable economicand food provision consequences of that overexploitation haveyet to be realized. Implementing recovery in such a fishery islikely to increase biomass, and will almost surely increase profitsand catches relative to their long-run values under BAU, but maynot increase catches relative to their current levels (see SI Ap-pendix, Fig. S1, for illustrative example).Any given harvest policy will have effects that play out dif-
ferently over time. By explicitly modeling the dynamics for eachfishery under each harvest policy, we can examine the timing ofeffects in detail. To do so, we estimated the intrinsic growth rate,
carrying capacity, and MSY for each fishery in our dataset, using astructural data-limited assessment approach (10). This arms uswith a microlevel structural bioeconomic model for all fisheriesin our database.Timing of effects is particularly important when considering
food provision and profit motives. For example, China, the countrywith the largest volume of fish catches, has proposed new goals toincrease seafood consumption by 50% over the next 6 y (11). Ouranalysis allows us to examine the extent to which alternative man-agement policies for wild fisheries can achieve such an objective forChina. Similarly, if a country is interested primarily in the profit-ability to fishers, then it may focus on policies that emphasize profitrecovery, which may involve adopting institutional reforms thatimprove economic efficiency. These harvest policies often call forsharp reductions in current fishing effort to allow rapid rebuilding ofstocks (although, because we consider costs, it is rarely optimal tocompletely close the fishery during rebuilding). Such measures oftenimpose significant short-run economic losses that are sometimespolitically infeasible, but when such a policy is economically opti-mal, the long-run gains will outweigh the short-run costs.
Results and DiscussionWe estimate that global MSY is 98 million metric tons (MMT)(after scaling up to account for data gaps), which is substantiallylarger than the 80 MMT reportedly caught across the globe inrecent years (12), but is consistent with MSY calculations in ref.6 (83–100 MMT) and ref. 5 (95 MMT). Our estimate reducesMSY of forage fish and assumes no unreported historical catch.
1
2
3
Global Northeast Pacific
1
2
3
0.0 0.5 1.0 1.5 2.0
B BMSY
FF M
SY
Northeast Atlantic
0.0 0.5 1.0 1.5 2.0
Western Central Pacific
A B
C D
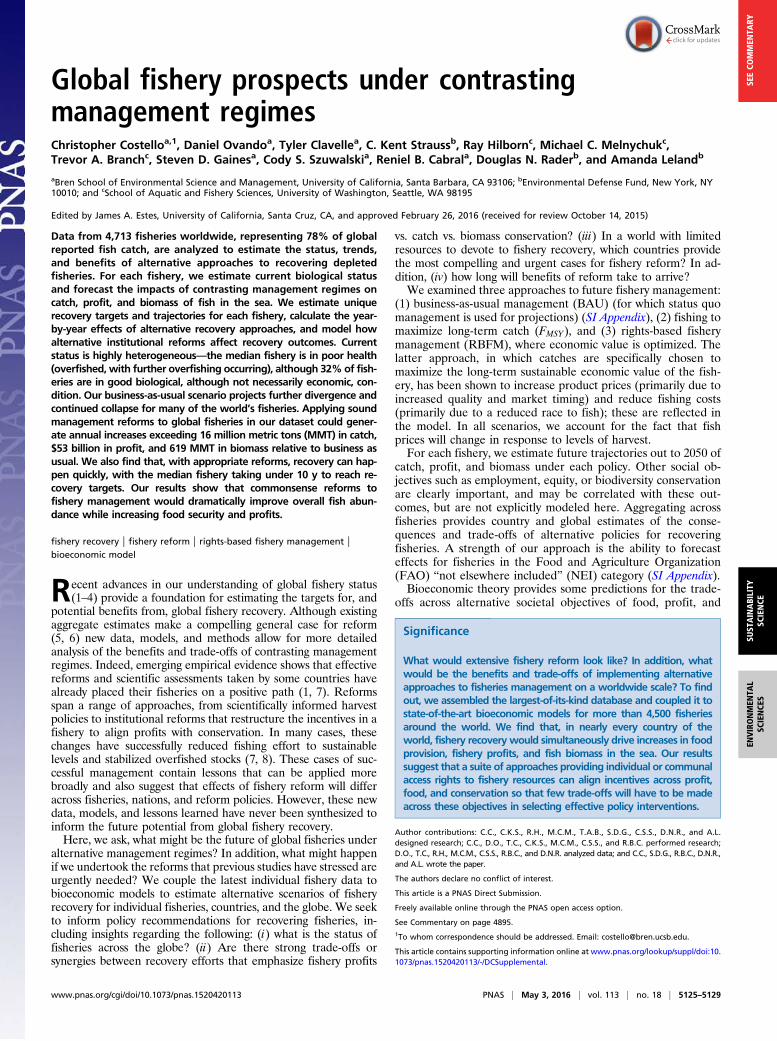
Fig. 1. Current fishery status (“Kobe”) plots for four illustrative regions. Each dot represents a fishery. The red dots represent data from RAM database, andthe black dots represent our estimates for unassessed fisheries. Dot size scales to fishery catch. Shading is from a kernel density plot. The green triangle is themedian and the green square is catch-weighted mean, for the given region. Panels represent data from all global fisheries in our database (A), NortheastPacific (B), Northeast Atlantic (C), and Western Central Pacific (D) regions.
5126 | www.pnas.org/cgi/doi/10.1073/pnas.1520420113 Costello et al.
Incorporating a recent global estimate of illegal fishing (23%)(13), our estimate of MSY would rise to 121 MMT. Our esti-mates of each fishery’s current B=BMSY and F=FMSY are plottedin Fig. 1 for all global fisheries (Fig. 1A) and for three illustrativeoceanic regions (Figs. 1 B–D). The Northeast Pacific is known tobe well managed—our estimates accord with this (Fig. 1B). Manyfisheries in the Northeast Atlantic are in poor condition, al-though 56% are on a path toward sustainability, as fishing pressureis below FMSY (Fig. 1C). As a final illustration, we estimate verylow biomass and continued high fishing mortality for the bulkof fisheries in the Western Central Pacific (Fig. 1D). The worsea fishery’s current status, the larger the potential gains fromreform. Overall, we estimate the global median fishing mor-tality is F=FMSY = 1.5 (overfishing is occurring) and biomass isB=BMSY = 0.78 (stocks are overfished); these are consistent withrefs. 4, 5, and others.Taking estimated current fishery status as a starting point, for
each of the three future policies (BAU, FMSY , RBFM), we con-sider two scenarios. The first scenario applies the policy only tostocks of “conservation concern” (i.e., the 77% of stocks for whichwe estimate B=BMSY < 1 and/or F=FMSY > 1, which roughly corre-sponds to the FAO definition of “fully exploited” or “over-exploited”). Under that scenario, stocks not of conservationconcern are assumed to maintain current biomass forever. Thesecond scenario applies the policy to all stocks. Because the con-servation concern scenario provides a less optimistic estimate ofglobal benefits of reform, we adopt it as the default. There, we findthat simultaneous gains for catch, profit, and biomass (RBFM rel-ative to BAU) is a likely outcome for the majority of stocks (56%;Fig. 1), and countries (23 of the top 30 in harvest) of the world.Focusing on the 10 countries with the greatest potential ab-
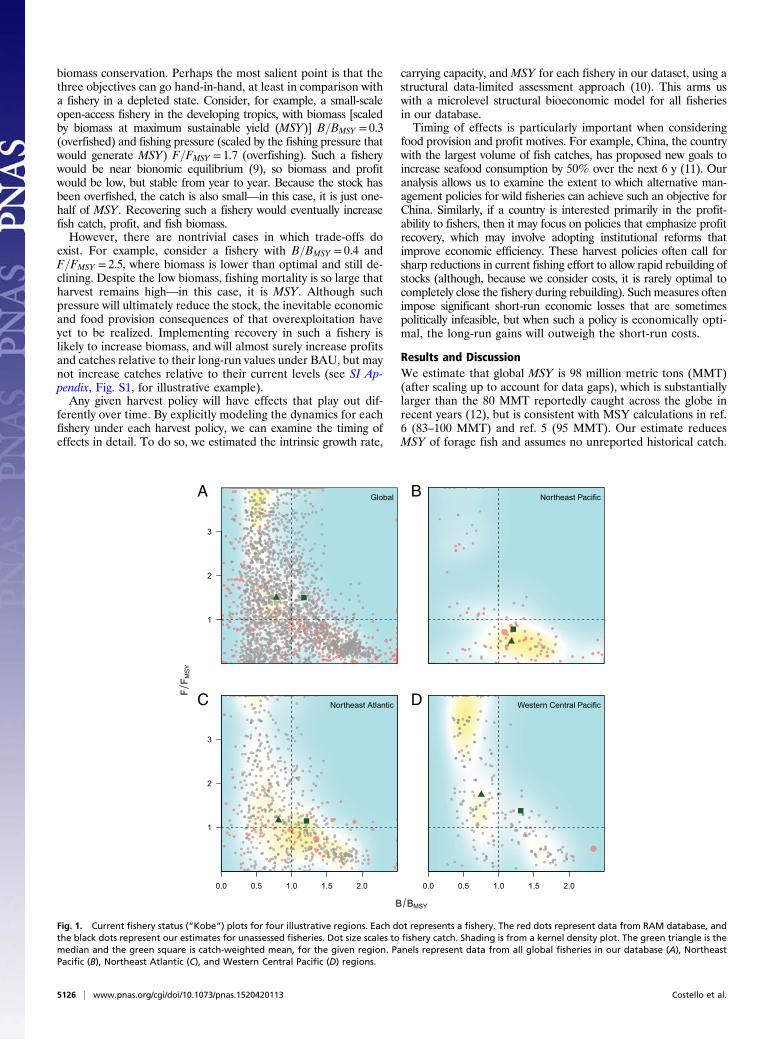
solute increase in fishery profits relative to BAU also shows sub-stantial gains in both conservation and catch (Fig. 2). China’simmense fisheries show enormous potential (Fig. 2A); otherprominent fishing nations in Asia, such as Indonesia, India, Japan,and Philippines, also secure large reform benefits along all threedimensions (Fig. 2B). Seven of these 10 countries derive >50% ofprofit increases from the NEI species groups (red, Fig. 2).Although results thus far suggest that nearly every country in
the world stands to gain from fishery recovery regardless of itsobjectives, some important distinctions emerge across recoverypolicies. Although all reasonable recovery policies are expectedto give rise to increases in biomass of fish, albeit to different
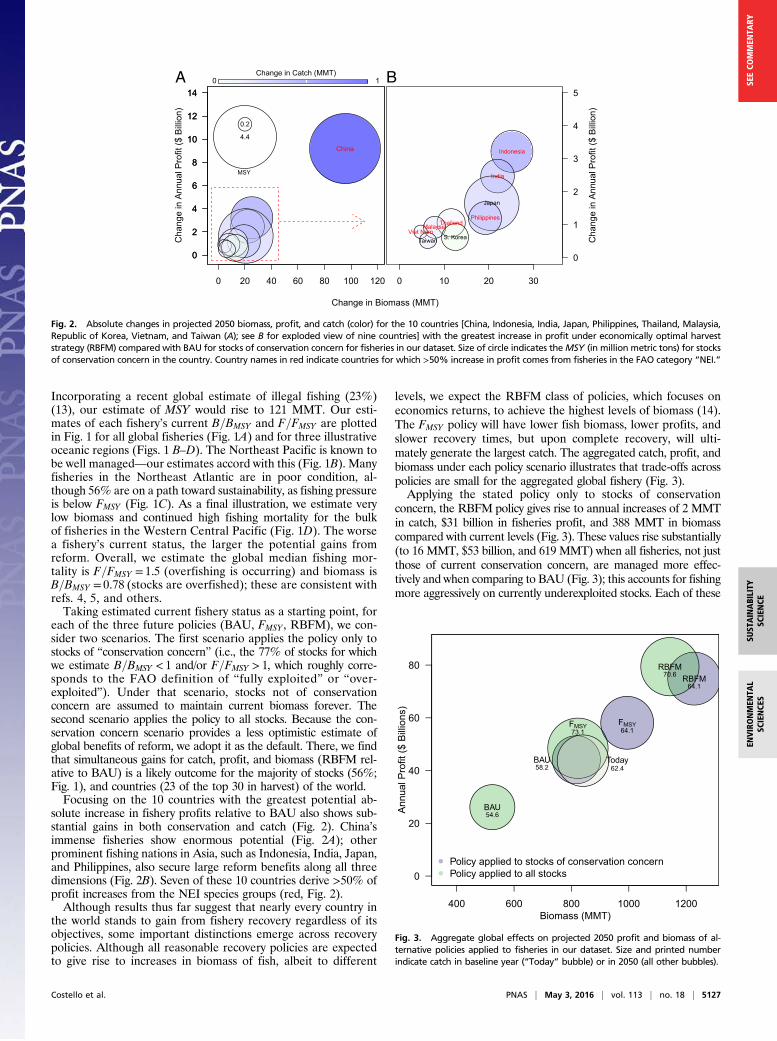
levels, we expect the RBFM class of policies, which focuses oneconomics returns, to achieve the highest levels of biomass (14).The FMSY policy will have lower fish biomass, lower profits, andslower recovery times, but upon complete recovery, will ulti-mately generate the largest catch. The aggregated catch, profit, andbiomass under each policy scenario illustrates that trade-offs acrosspolicies are small for the aggregated global fishery (Fig. 3).Applying the stated policy only to stocks of conservation
concern, the RBFM policy gives rise to annual increases of 2 MMTin catch, $31 billion in fisheries profit, and 388 MMT in biomasscompared with current levels (Fig. 3). These values rise substantially(to 16 MMT, $53 billion, and 619 MMT) when all fisheries, not justthose of current conservation concern, are managed more effec-tively and when comparing to BAU (Fig. 3); this accounts for fishingmore aggressively on currently underexploited stocks. Each of these
0 20 40 60 80 100 120
0
2
4
6
8
10
12
14
0
2
4
6
8
10
12
14
�China
4.4
0.2
Cha
nge
in A
nnua
l Pro
fit ($
Bill
ion)
Change in Biomass (MMT)
MSY
Change in Catch (MMT)0 1
0 10 20 30
0
1
2
3
4
5
Indonesia
India
Japan
PhilippinesThailandMalaysia
Viet NamS. KoreaTaiwan C
hang
e in
Ann
ual P
rofit
($ B
illio
n)
A B
Fig. 2. Absolute changes in projected 2050 biomass, profit, and catch (color) for the 10 countries [China, Indonesia, India, Japan, Philippines, Thailand, Malaysia,Republic of Korea, Vietnam, and Taiwan (A); see B for exploded view of nine countries] with the greatest increase in profit under economically optimal harveststrategy (RBFM) compared with BAU for stocks of conservation concern for fisheries in our dataset. Size of circle indicates theMSY (in million metric tons) for stocksof conservation concern in the country. Country names in red indicate countries for which >50% increase in profit comes from fisheries in the FAO category “NEI.”
400 600 800 1000 1200
0
20
40
60
80
BAU
BAU
RBFMRBFM
FMSY FMSY
Today58.2
54.6
64.1
70.6
73.1 64.1
62.4
Biomass (MMT)
Ann
ual P
rofit
($ B
illio
ns)
Policy applied to stocks of conservation concernPolicy applied to all stocks
Fig. 3. Aggregate global effects on projected 2050 profit and biomass of al-ternative policies applied to fisheries in our dataset. Size and printed numberindicate catch in baseline year (“Today” bubble) or in 2050 (all other bubbles).
Costello et al. PNAS | May 3, 2016 | vol. 113 | no. 18 | 5127
SUST
AINABILITY
SCIENCE
ENVIRONMEN
TAL
SCIENCE
SSE
ECO
MMEN
TARY
values could reasonably be adjusted upward by an additional 28%because our database covers only the 78% of reported catch withadequate data. The largest gains accrue from fisheries with the mostdepleted status, although these gains may be limited if depletedfisheries have crossed tipping points beyond which recovery may notbe possible (15). Even targeting reforms at just fisheries of con-servation concern, global fishery profits are 29% higher underRBFM than under FMSY (Fig. 3); this wedge grows to 64% whenapplying policies to all fisheries (Fig. 3). This increase in profitsunder RBFM relative to FMSY has two components: an “optimiza-tion effect” (68% from optimizing the harvest policy) and a “pe-cuniary effect” (32% from price increases and cost decreases).Although we have not explicitly modeled effects of fishery reformon consumers, they are likely to benefit from the catch increases(and price decreases) that arise from fishery recovery. Consumersmay also benefit from higher quality product under RBFM, albeit ata commensurately higher price.Although the most suitable institutional reforms to achieve
recovery will depend on social, economic, and ecological objec-tives and conditions, various approaches such as cooperatives(16, 17), territorial rights (18, 19), or individual transferablequotas (8, 20) could be used to improve economic results under arange of harvest policies. Although these all fall under the umbrellaof RBFM, each will bring different benefits in different settings thatmust be weighed against the costs of reform. Although these costshave not been explicitly modeled here, experience from countriessuch as Iceland, New Zealand, and Australia suggest that they arelikely to be only a fraction of the potential benefits identified here(21). Our results suggest that some of the greatest economic im-provements in fisheries may come more from improving institutionsthan from improving the status of fished stocks. Furthermore, thesegains in profit can occur quickly following institutional reforms,because they do not exclusively rely on stock recovery. Such rapideconomic gains can help offset many of the necessary short-termcosts associated with stock recovery when catches must temporarilydecline to enable recovery.To ensure model tractability and to apply it at a global scale,
we made a number of simplifying assumptions. SI Appendix containsan extensive description and set of robustness checks and sensitivityanalyses; we note a few here. First, because our entire analysis isbuilt on estimates of the current fishery status, it is natural to askhow sensitive our results are to these uncertain estimates. Weperformed numerous routines to estimate our model’s ability topredict out of sample, broken out by region and fishery size. Resultssuggest that our methods for estimating B=BMSY and F=FMSY aremore robust for fisheries in the developed world that are not ex-tremely overfished. The presence of low-to-moderate unreported
fishing does not bias these estimates (although it will bias MSYestimates downward). Second, predictions of absolute economiceffects rely on estimates of economic parameters (demand andcosts). To this end, we built a price database derived from exportvalues and other data. We transformed the data to ex-vesselequivalents and modeled demand with a constant elasticity of −1.15,consistent with refs. 22 and 23. We model costs by identifying theunassessed fisheries estimated to be in bionomic equilibrium andbacking out the cost that drives profit to zero under open-accessequilibrium. This procedure results in costs per MT that are con-sistent with those in ref. 24 and generates mean cost/revenue ratiosof 67% in the current fishery. We conducted numerous sensitivityanalyses examining the effects of a range of these biological andeconomic parameters; although these affect our quantitative pre-dictions, our qualitative findings are largely unaffected. We alsoperformed a historical analysis where catches for all assessed stocksfrom 1980 to 2012 were predicted using the model with data up to1980 only. Actual catch compares extremely well with the model’sprediction (correlation, 0.99; value of P < 1%).Our model allows us to make novel predictions of the timing of
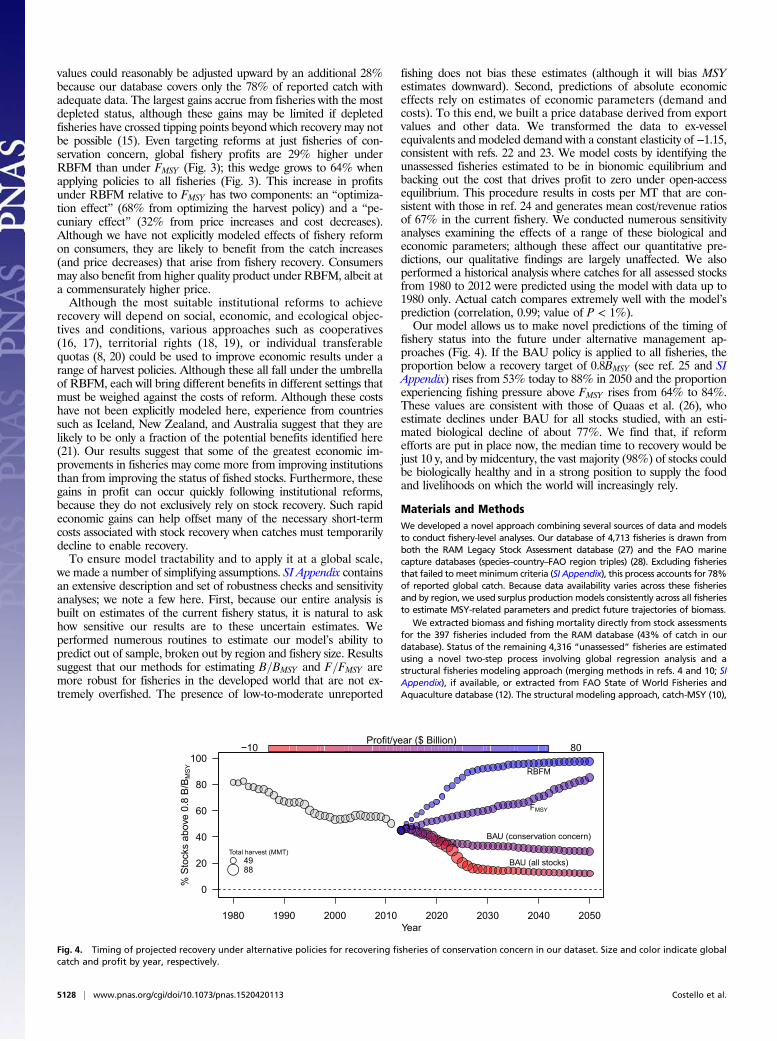
fishery status into the future under alternative management ap-proaches (Fig. 4). If the BAU policy is applied to all fisheries, theproportion below a recovery target of 0.8BMSY (see ref. 25 and SIAppendix) rises from 53% today to 88% in 2050 and the proportionexperiencing fishing pressure above FMSY rises from 64% to 84%.These values are consistent with those of Quaas et al. (26), whoestimate declines under BAU for all stocks studied, with an esti-mated biological decline of about 77%. We find that, if reformefforts are put in place now, the median time to recovery would bejust 10 y, and by midcentury, the vast majority (98%) of stocks couldbe biologically healthy and in a strong position to supply the foodand livelihoods on which the world will increasingly rely.
Materials and MethodsWe developed a novel approach combining several sources of data and modelsto conduct fishery-level analyses. Our database of 4,713 fisheries is drawn fromboth the RAM Legacy Stock Assessment database (27) and the FAO marinecapture databases (species–country–FAO region triples) (28). Excluding fisheriesthat failed tomeet minimum criteria (SI Appendix), this process accounts for 78%of reported global catch. Because data availability varies across these fisheriesand by region, we used surplus production models consistently across all fisheriesto estimate MSY-related parameters and predict future trajectories of biomass.
We extracted biomass and fishing mortality directly from stock assessmentsfor the 397 fisheries included from the RAM database (43% of catch in ourdatabase). Status of the remaining 4,316 “unassessed” fisheries are estimatedusing a novel two-step process involving global regression analysis and astructural fisheries modeling approach (merging methods in refs. 4 and 10; SIAppendix), if available, or extracted from FAO State of World Fisheries andAquaculture database (12). The structural modeling approach, catch-MSY (10),
1980 1990 2000 2010 2020 2030 2040 2050
0
20
40
60
80
100
BAU (all stocks)
BAU (conservation concern)
RBFM
FMSY
Profit/year ($ Billion)−10 80
yyy (( ))
% S
tock
s ab
ove
0.8
B/B
MS
Y
Year
Total harvest (MMT)
8849
Fig. 4. Timing of projected recovery under alternative policies for recovering fisheries of conservation concern in our dataset. Size and color indicate globalcatch and profit by year, respectively.
5128 | www.pnas.org/cgi/doi/10.1073/pnas.1520420113 Costello et al.
assumes stationarity of MSY, FMSY , and BMSY parameters; see SI Appendix forfurther details including sensitivity analyses. The set of fisheries categorized asNEI by the FAO were handled with a two-step process using an appropriatecomparison set of fisheries from the global database and imputing values tothe NEI stock (SI Appendix); this could be improved with better reporting ofcatches of these species. Although trophic effects are not explicitly modeled,they may play a role in the potential benefits of rebuilding fisheries. In reality,each stock we have modeled exists within a larger ecosystem context thatinfluences the dynamics of each species within it (e.g., ref. 15). Recoveringpredatory species increases predation on prey species. Consequently, reformprojections from single-species models may be optimistic for ecosystems inwhich many piscivorous species are recovered. To partially account for this, weconservatively reduced MSY of all forage fish stocks, which provide a foodsource for many higher–trophic-level fish and mammals, by 25% (29).
We assessed the future trajectories of all individual fisheries up to mid-century (2050) using a Pella–Tomlinson surplus production model (30) withfishery-specific life-history parameters, described as follows:
Bt+1 =Bt +ϕ+ 1ϕ
gBt
1−�Bt
K
�ϕ!−Ht , [1]
where ððϕ+ 1Þ=ϕÞg is the intrinsic rate of the growth for the species, K is thecarrying capacity, and Ht is the harvest in year t. We assume stationarity in
g and K parameters. We set the growth curve parameter ϕ at 0.188, per refs.31 and 32, such that BMSY occurs at 40% of K; alternatives are analyzed in SIAppendix. Estimates of MSY and g were also derived from the RAM data-base for assessed fisheries. In cases where only some of these values areprovided, we used available data to calculate missing values (e.g., estimatingMSY from Catch, B=BMSY and F=FMSY , and g as MSY=BMSY) or performed atwo-step process described above.
For each fishery, we modeled a range of fishing policies, each of whichassigned a scaled fishing mortality rate tailored to that specific stock (i.e.,a “control rule”) for all possible realizations of biomass. Profit in a periodis revenue (price times catch) minus the cost of fishing, which is an in-creasing function of the fishing mortality applied. Prices are adjustedeach year from a global seafood demand curve with constant elasticity of−1.15. Our base case scenario assumed zero discounting (for which profitis optimized dynamically); higher discount rate scenarios are reported inSI Appendix. This allowed us to predict the annual catch, profit, andbiomass of fish in the ocean across a range of alternative harvest policies,as reported above.
ACKNOWLEDGMENTS. We are grateful to National Center for EcologicalAnalysis and Synthesis for computation support. We acknowledge financialsupport from the David and Lucile Packard Foundation, Waitt Foundation,and Helmsley Charitable Trust.
1. Worm B, et al. (2009) Rebuilding global fisheries. Science 325(5940):578–585.2. Worm B, Branch TA (2012) The future of fish. Trends Ecol Evol 27(11):594–599.3. Branch TA, Jensen OP, Ricard D, Ye Y, Hilborn R (2011) Contrasting global trends in
marine fishery status obtained from catches and from stock assessments. Conserv Biol25(4):777–786.
4. Costello C, et al. (2012) Status and solutions for the world’s unassessed fisheries.Science 338(6106):517–520.
5. Arnason R, Kelleher K, Willmann R (2009) The Sunken Billions: The EconomicJustification for Fisheries Reform (The International Bank for Reconstruction andDevelopment/The World Bank, Washington, DC).
6. Sumaila UR, et al. (2012) Benefits of rebuilding global marine fisheries outweigh costs.PLoS One 7(7):e40542.
7. Hilborn R, Ovando D (2014) Reflections on the success of traditional fisheries man-agement. ICES J Mar Sci 71:1040–1046.
8. Costello C, Gaines SD, Lynham J (2008) Can catch shares prevent fisheries collapse?Science 321(5896):1678–1681.
9. Clark C, Munro G (1975) The economics of fishing and modern capital theory:A simplified approach. J Environ Econ Manage 2(2):92–106.
10. Martell S, Froese R (2013) A simple method for estimating MSY from catch and re-silience. Fish Fish 14:504–514.
11. Ministry of Agriculture of China (2014) China Food and Nutrition DevelopmentGuideline 2014–2016 (Ministry of Agriculture of China, Beijing).
12. FAO (2014) The State of World Fisheries and Aquaculture (Food and AgricultureOrganization of the United Nations, Rome).
13. Agnew DJ, et al. (2009) Estimating the worldwide extent of illegal fishing. PLoS One4(2):e4570.
14. Clark CW (2010) Mathematical Bioeconomics: The Mathematics of Conservation(Wiley, Hoboken, NJ).
15. Travis J, et al. (2014) Integrating the invisible fabric of nature into fisheries man-agement. Proc Natl Acad Sci USA 111(2):581–584.
16. Deacon RT (2012) Fishery management by harvester cooperatives. Rev Environ EconPolicy 6:258–277.
17. Ovando DA, et al. (2013) Conservation incentives and collective choices in cooperativefisheries. Mar Policy 37:132–140.
18. Wilen JE, Cancino J, Uchida H (2012) The economics of territorial use rights fisheries,or TURFs. Rev Environ Econ Policy 6:237–257.
19. Gelcich S, et al. (2012) Territorial user rights for fisheries as ancillary instruments formarine coastal conservation in Chile. Conserv Biol 26(6):1005–1015.
20. Arnason R (2012) Property rights in fisheries: How much can individual transferablequotas accomplish? Rev Environ Econ Policy 6:217–236.
21. OECD (2003) The Costs of Managing Fisheries (OECD, Paris).22. Asche F, Bjorndal T (1999) Demand Elasticities for Fish: A Review (Food and Agricul-
ture Organization of the United Nations, Rome).23. Delgado CL, Wada N, Rosegrant MW, Meijer S, Ahmed M (2003) Fish to 2020: Supply
and Demand in Changing Global Markets (International Food Policy Research In-stitute and WorldFish Center, Penang, Malaysia).
24. Lam VWY, et al. (2011) Construction and first applications of a global cost of fishingdatabase ICEAS. J Mar Sci 68:1996–2004.
25. Hilborn R (2010) Pretty good yield and exploited fishes. Mar Policy 34:193–196.26. Quaas MF, Reusch TB, Schmidt JO, Tahvonen O, Voss R (2016) It is the economy,
stupid! Projecting the fate of fish populations using ecological-economic modeling.Glob Change Biol 22(1):264–270.
27. Ricard D, Minto C, Jensen OP, Baum JK (2012) Examining the knowledge base andstatus of commercially exploited marine species with the RAM Legacy Stock Assess-ment Database. Fish Fish 13:380–398.
28. FAO (2014) FAO Statistics and Information Service of the Fisheries and AgricultureDepartment: Total Fishery Production 1950–2012 (Food and Agriculture Organizationof the United Nations, Rome).
29. Pikitch EK, et al. (2014) The global contribution of forage fish to marine fisheries andecosystems. Fish Fish 15:43–64.
30. Pella JJ, Tomlinson PK (1969) A generalized stock production model. Inter-Am TropTuna Comm Bull 13:416–497.
31. Branch TA, Hively DJ, Hilborn R (2013) Is the ocean food provision index biased?Nature 495(7442):E5–E6, discussion E7.
32. Thorson JT, Cope JM, Branch TA, Jensen OP (2012) Spawning biomass reference pointsfor exploited marine fishes, incorporating taxonomic and body size information. CanJ Fish Aquat Sci 69:1556–1568.
Costello et al. PNAS | May 3, 2016 | vol. 113 | no. 18 | 5129
SUST
AINABILITY
SCIENCE
ENVIRONMEN
TAL
SCIENCE
SSE
ECO
MMEN
TARY