global fixed capital investment by multinational firms discussion paper series 10-e-044 august 2010...
TRANSCRIPT

DPRIETI Discussion Paper Series 10-E-044
Global Fixed Capital Investment by Multinational Firms
René BELDERBOSKatholieke Universiteit Leuven / Maastricht University / UNU-MERIT
FUKAO KyojiRIETI
ITO KeikoSenshu University
Wilko LETTERIEMaastricht University
The Research Institute of Economy, Trade and Industryhttp://www.rieti.go.jp/en/

RIETI Discussion Paper Series 10-E-044
August 2010
Global Fixed Capital Investment by Multinational Firms*
René BELDERBOS
Katholieke Universiteit Leuven, Maastricht University and UNU-MERIT
Kyoji FUKAO Hitotsubashi University and Research Institute of Economy, Trade and Industry
Keiko ITO
Senshu University
Wilko LETTERIE Maastricht University
Abstract
This paper develops and tests a simple model of the simultaneous determination of
gross fixed capital formation by multinational Japanese firms in home and host
countries. We treat multinational firms as multi-product firms, choosing optimal
investment locations and production scale for each product. We test the predictions of
the model on a unique dataset covering 1707 fixed capital investment decisions by
(affiliates of) Japanese multinational firms in the manufacturing sector based on
research conducted in 1996 and 1997. We find that the rate of investment is not only
determined by factors affecting the return on investment levels in a country (e.g.
effective demand and wages), but also by wage levels in other countries in which the
firm operates manufacturing affiliates. Firms facing global liquidity constraints show
systematically lower investment ratios, suggesting that financing constraints are another
source of interaction between investments.
Key words: Multinational Firms; Foreign Direct Investment
JEL classification: D24; D92; F23
* This research was conducted as part of the project on “Japan’s Productivity and Economic Growth” at the Research Institute of Economy, Trade and Industry (RIETI). Corresponding author: René Belderbos
Katholieke Universiteit Leuven Faculty of Business and Economics Department of Managerial Economics, Strategy and Innovation Naamsestraat 69, B-3000 Leuven, Belgium Phone + 32 16 326912; Fax:+ 32 16 326732 Email: [email protected]
RIETI Discussion Papers Series aims at widely disseminating research results in the form of professional papers, thereby stimulating lively discussion. The views expressed in the papers are solely those of the author(s), and do not present those of the Research Institute of Economy, Trade and Industry.

1. Introduction
Investment decisions are the quintessential decisions over which the multinational
firm will seek central control and the multinational firm is expected to coordinate and decide
centrally on worldwide investment allocation. Although there is an expanding literature on
the role of multinational firms on global trade and international investment flows, very few
studies have analyzed multinational firms' fixed capital investment decisions (Desai et al.
2005a).2
There are two main channels for interaction between investments in different countries by
the multinational firm (e.g. Stevens and Lipsey 1992). First, on the manufacturing side,
locations in different countries may be competing for investment projects as the multinational
firm is likely to compare the expected profitability of performing the project in alternative
locations. On the other hand, investment decisions may also be complementary through their
(local) demand enhancing effects and expansion of vertical intra-firm trade. Second, on the
financing side, different investment projects may also be in competition if the firm faces
financing constraints resulting in an upward sloping capital cost function: projects in one
country may reduce investments in marginal projects in other countries. A counteracting
force may be that multinational firms have more options to utilize internal or external local
2 The behaviour of multinational firms and the consequences of multinational firm activity for the
local economies of host and home countries have received considerable attention in economic
research. Attention has focused on the firm and host country determinants of foreign direct
investment (e.g. Wheeler and Mody 1992, Belderbos and Sleuwaegen 1996, Chen and Moore 2009,
Yeaple 2009, Aw and Lee 2008, Blonigen et al. 2005) the effects of FDI on trade (e.g. Blomström et
al. 1997, Lipsey and Wise 1984 Belderbos and Sleuwaegen 1998, Head and Ries 2001, Hanson et al.
2005), the consequences of multinational activity for domestic wages and employment (e.g. Budd et
al. 2005, Slaughter 2000, Feenstra and Hanson 1996, Brainard and Riker 1997, Head and Ries 2002,
Ito and Fukao, 2005; Konings and Murphy 2006), and (technology) spillovers from foreign direct
investments (e.g. Haskell et al. 2007, Aitken et al. 1997).
2
and international sources of finance, reducing their overall financial constraints (Desai et al.
2004; Harrison et al. 2003).
This paper is the first to examine such potential interactions between global
investment projects by multinational firms at the micro level. Since coordinated global fixed
capital investments decisions are a potential channel for the international transmission of
financial and real shocks across economies, it is of interest to empirically investigate the
magnitude and nature of interactions in fixed capital investments. Studies to date have
however analyzed relationships at the aggregate industry or macro level, have substituted
balance of payments data on the financing of FDI for actual capital expenditure data, or have
narrowed attention to the relationship between foreign direct investment and the domestic
capital stock.3 Only two studies have examined interaction between fixed capital investments
at the firm level. Stevens and Lipsey (1992) used panel data on a sample of 7 US
multinational firms and focused analysis on the impact of finance constraints. They confirmed
a negative interaction effect between foreign and domestic investments stemming from a rise
in marginal capital cost. Desai et al. (2005a) examined the impact of various measures of
foreign activities on domestic (US) activities by multinational firms in a panel of US
multinational firms. Instrumenting aggregate foreign activity of the firms by differences in
host country economic growth, they find a positive relation between FDI and domestic capital
expenditures.
3 Findings in Belderbos (1992) suggest substitution between FDI stocks and domestic assets for Dutch
multinational firms, but the study relied on aggregated industry level balance sheet data. Feldstein
(1995) and Desai et al (2005b) similarly find a negative impact of FDI on the aggregate capital stock
across OECD countries although Desai et al. (2005a) obtain a complementary relationship if the
analysis is restricted to domestic capital of multinational firms. Herzer and Schroten (2006), in
contrast, find a positive relationship between outward FDI flows from the US and domestic aggregate
capital formation, but a negative relationship for Germany.

3
In this paper we attempt to uncover the interactions between investments by multinational
firms in different locations through a systematic study of simultaneous fixed capital
investment decisions. We broaden the focus of analysis by examining investment decisions
in all locations in which the multinational firms are active and we infer interactions between
investments in all these locations (including the home country) from their determinants. We
examine global fixed capital investment decisions by Japanese multinational firms, drawing
on unpublished affiliate level fixed capital investment data contained in the Survey of Trends
in Business Activities of Foreign Affiliates conducted by the Ministry of Economy, Trade
and Industry (METI). Our analysis is informed by a model of the simultaneous gross fixed
capital formation decision by multinational firms. Starting point is the notion of optimal
dynamic investment behaviour under nonconvex adjustment costs, following Abel and
Eberly (1994), Eberly (1997) and Barnett and Sakellaris (1998). We treat multinational firms
as multi-product firms choosing optimal locations for each unique product based on effective
(host country and export) demand, productivity, and wage costs at the industry level. Our
model emphasizes interactions through the manufacturing side and allows for demand as well
as cost considerations in FDI decisions, while controlling for financial constraints.
Examining 1707 fixed capital investment decisions in 1996, we find qualified support for the
predictions of the model. The rate of investment is not only determined by factors affecting
the return on investment in a country and industry but also by the wage of other countries in
which the firm operates manufacturing affiliates.

4
2. A Model of Global Fixed Capital Investments by Multinational Firms
We develop a model of fixed capital investments to determine how a multinational firm
allocates investment over a number of manufacturing locations in C different countries
(including the home country). We study the firm’s optimal dynamic investment behaviour
under non-convex adjustment costs following the investment models developed by Abel and
Eberly (1994), Eberly (1997) and Barnett and Sakellaris (1998). Let Et denote the
expectations operator conditional on information available at time t. The current gross profit
at time t is given by ZKKK Cttt ,,...,, 21 where Kct is the beginning of period stock of
capital in country c and Z denotes the number of products made by the firm. A linear
quadratic adjustment cost function is given by ctctct
ct
ctctctc dIp
K
IKI
2,
2
where Ict is
gross investment in country c at year t and ctp is the unit cost of capital at time t in country c.
The parameter α measures the size of the quadratic adjustment costs. We allow for zero
investment decisions by assuming a non-convexity in the adjustment cost function allowing
for irreversibility of investment. To that end, the dummy variable dct takes the value one if
investment is positive, otherwise it equals zero.4 The value of the firm, accounting for its
international activities, can be expressed as:
(1)
1 1
11
1,..,
,,,..,,,,..,max1 ts
C
ccscscCss
sC
cctctcCttt
IIt KIZKKKIZKKEV
tsCss
4 This implies that the returns of selling capital on the second hand market equal zero.

5
where ρ is the discount factor. The firm maximizes equation (1) subject to the capital
accumulation equations given by: ctctct IKK 11 for c=1,..,C. The first order
condition for investment Ict yields
(2) ctt
ct
ctct EI
KI
,
where the shadow price of installed capital is given by the expression
1
11 ,,,..,1
si ci
cici
ci
ciiiics K
KI
K
ZKK . Following Abel and Eberly (1994),
Eberly (1997) and Barnett and Sakellaris (1998), we can determine the optimal investment
rule as:
(3) ctcttct
ct pEK
I if RHS>0;
0ct
ct
K
I otherwise.
The presence of an investment rate equal to zero in our model stems from the irreversible
nature of investment. 5 When investment is assumed to be irreversible, abstaining from
adjusting the capital stock is preferred to scrapping, as scrapping yields no proceeds while a
zero investment rate provides the option to use the capital assets when economic conditions
improve in the future. 5 An alternative way to model non-convexity that allows explaining zero investment observations is
to assume fixed capital adjustment costs that are independent of the investment size (Abel and Eberly,
1994).

6
Following Abel and Blanchard (1986) and Nilsen and Schiantarelli (2003) we assume
that 2
2
1
ci
ci
ci
cici
K
I
K
KI
is small relative to the marginal profit of capital and therefore
negligible in the expression for cs . If we assume that the marginal profit of capital
ci
cii
ci K
ZKK
K
,,..,. 1 follows an autoregressive process of order 2 (AR(2)), substituting
an AR(2) process into the expression for the marginal profit of capital leads to the following
investment equation (c.f. Abel and Blanchard, 1986, pp. 253-254): 6
(4)
ctctctctct
ct pKKKK
I
21
*2
1
*1
... if RHS>0
0ct
ct
K
I otherwise
The parameters *1 and *
2 are a function of the parameters governing the AR(2) process
just mentioned. Investment is determined by the marginal profit of capital in period t-1 and t-
2.7 Alternatively, if we assume that the marginal profit of capital follows an AR(1) process,
*2 is zero and investment depends on marginal profitability of capital in t-1 only. In the
empirical analysis, we will examine both specifications.
6 This approach disregards the fact that due to non convex adjustment costs the marginal value of
capital depends on the notion that additional capital at date t affects the future probability of
investment (cf. Bontempi et al., 2004). The approach taken here is not likely to lead to omitted
variables since variables that affect the current decision to invest also influence the future probability
to adjust capital (cf. Nilsen and Schiantarelli, 2003; Letterie and Pfann, 2007).
7 Previous studies have suggested that *2
*1 are positive (Nilsen and Schiantarelli, 2003; and
Letterie and Pfann, 2007).

7
The marginal profit of capital
We turn to the firm’s profit maximization behaviour in the short run to determine the
fundamentals of the marginal profit of capital. For notational convenience we drop time
subscripts. The firm produces Z differentiated products. The firm needs specific knowledge
in order to produce each product, and the number of products depends on the firm’s past
R&D activities. The term zc denotes the number of products produced by the firm in country
c. The total number of products is given by
(5) ZzC
cc
1
where C denotes the total number of countries. We assume that firms produce one type of
product in one single location depending on effective demand, wage costs, and productivity.
The time path of Z is exogenously determined and we treat the number of products Z and the
capital stocks located around the world, (K1, K2, …., KC) as given. The firm manufactures a
product in country c using Lc units of labour. Total factor productivity in the country for the
manufacture of the product is denoted by Ωc. Total production in country c by the firm is
equal to ccQz where Qc is the volume of production of a single product. Let the firm’s
production function for each product in country c take the form of a Cobb-Douglas function
with constant returns to scale:
(6)
1
c
c
c
ccc z
L
z
KQ

8
with 0<β<1. Capital stock and labour input are equally distributed across the number of
variants of the product cz .
We consider multiproduct firms under monopolistic competition. Following Helpman et
al. (2004), Yeaple (2009) and Chen and Moore (2010) we assume that preferences across
product varieties have the standard CES form, such that demand of country c’ for the firm’s
output produced in country c can be expressed by:
(7) ''
'1
1
',',
c
c
c
cccc P
E
P
pD
where 0<σ<1 is the elasticity of substitution between products. Ec’ denotes nominal
expenditure on all products in country c’, ',ccp is the market price of a product manufactured
in country c exported to country c’ and 'cP is the price index of all products sold in country c’.
Following Yeaple (2009) and Chen and Moore (2010) we do not close the model through
entry. We furthermore consider the model in partial equilibrium and take the price index 'cP
faced by the firm as exogenous.8
The firm can export from country c to all other countries but faces an iceberg type trade
cost: if the firm exports its products from country c to country c’, only 100/(1+μc, c’) percent
of exported products arrives at the destination, with μc, c=0 and μc, c’>0 for all c≠c’. Therefore,
the firm faces the following constraint on output of each product:
(8) c
C
ccccc QD
1'',',1
8 We also assume that the firm produces goods that are sufficiently differentiated in order to abstract
from substitution within the firm's portfolio or products.

9
The firm maximizes its current gross profit in the short run under a given set of capital stocks
located in each country, Kc: c=1, 2, .., C, the variety of products, Z, and the wage cost per
unit of labour in country c, wc.
(9)
C
cc
C
ccccccC VCDpzZKKK
1 1'',',21 max,,...,,
where the expression c
ccc z
LwVC denotes the variable cost of labour of a single product.
The firm makes a number of choices in the following order. It first determines the number of
products it produces in each country zc: c=1, 2, .., C, with the total number of products, Z,
given. Next, it selects the optimal prices for its products pc, c’: c=1, 2, .., C and c’=1, 2, ..,
C , the optimal level of production Qc: c=1, 2, .., C and demand for labour Lc: c=1, 2, ..,
C simultaneously. In the appendix we show that the optimal number of products to be
manufactured in country c, zc , is given by:
(10) Zs
sz
ccc
ccc
where
111
cccc w captures information concerning the attractiveness of country
c, the expression
C
cc
cc
K
Ks
1
is the share of the firm's total capital stock located in country c
and
cc
ccc s
'
'' denotes the attractiveness of the other countries, weighted by their share
of the existing capital stock. c increases if total factor productivity in country c, ( c )

10
increases, if the unit wage cost wc decreases, and if attractiveness of the country in terms of
effective demand (Γc.) increases. The latter is defined as
C
cc
cc
cc E
P
1''
1
',
1
1
1
'
and captures a positive effect of real expenditures on the product in the country ( 'cE ), and a
positive effect of the opportunity to export at lower cost ( ',cc ). Equation (10) indicates that
it is not only a country's own attractiveness that determines product allocation decisions, but
also the relative attractiveness of other countries in which the multinational firms is
established, in particular those countries in which there are large existing investments in
capital. The same pattern can be observed in the expression for the marginal product of
capital in country c (derived in the appendix):
(11)
1
1
1
.C
cc
ccc
c
c K
Z
sK
The firm’s marginal product of capital in country c depends on the expression for the three
factors. First, it is affected by the country’s own attractiveness given by c . It is
straightforward to derive that the marginal product of capital increases in c . Second, the
marginal productivity of capital decreases as other countries’ attractiveness (the index c )
increases.9 Third, marginal productivity improves if the firm’s number of product varieties
relative to the capital stock ratio
C
ccK
Z
1
increases. Substituting (11) in (4) we see that fixed
9 As σβθ<1. We refer to the appendix, where is defined.

11
capital investments in country c depend on these three factors, as the investment path is
determined by the marginal product of capital in t-1 and t-2.
3. Empirical Model, Data and Variables
If we substitute equation (11) in equation (4) and take a loglinear approximation, we obtain
an empirical version of the investment equation. In case 0*2 , then:
(12) tcC
ctc
ttctctc
tctctcct
ct
pK
Zw
wK
I
,
11,
171,61,51,4
1,31,21,10
if RHS>0
0ct
ct
K
I otherwise
where the upper bar expressions in the above equation denote that the corresponding
variables are calculated as the weighted average of the variable for the other countries. If
0*2 then the differenced values of the variables in equation (12) have to be included as
well. Estimation of equation (12) implies the use of a tobit model, allowing for censoring of
investment ratios at zero.
Data
Our analysis draws on unpublished data on fixed capital investments of Japanese firms from
the sixth Basic Survey of Overseas Business Activities held in 1996 (data for fiscal year
12
1995) and the 27th Trend Survey of Overseas Business Activities held in 1997 (data for fiscal
year 1996). The Basic Survey is an extensive survey among Japanese multinational firms
conducted every three years and the Trend Survey is a shortened survey conducted in the two
years between the Benchmark Surveys. Both surveys are conducted by the Japanese Ministry
of Economy, Trade and Industry (METI, former MITI) and ask firms to supply information
for the parent firm each of their foreign affiliates. The response rates of the surveys at the
parent firm level are 60.4% and 59.1%, respectively, but because non-responding firms are
usually small in size, the coverage in terms of global affiliates is substantially higher.
Affiliate data on capital stocks are only included in the Basic Survey, but gross fixed capital
investment data are included in all surveys. We merged the two datasets at the parent and
affiliate level to analyze investments in fiscal year 1996 (the year ending March 1997) as a
ratio of the capital stock at the end of fiscal year 1995 (March 1996). Data on capital stocks
and gross fixed capital investments in Japan were drawn from the third and the fourth Basic
Survey of Japanese Business Structure and Activities held in 1996 and 1997 by METI (data
for fiscal 1995 and 1996). This survey is mandatory and has a response rate exceeding 90
percent.
We calculate the relevant capital stocks and fixed capital investment of a multinational
firm in all countries in which they operate manufacturing activities by main industry of the
affiliate. If a firm operates more manufacturing affiliates in the same industry in a country,
capital stock and fixed capital investments were aggregated at the country level. If affiliates
operate in different industries, a capital stock and investment variable was derived for each
industry in a host country.10 We selected parent firms active in manufacturing industries and
10 This occurred infrequently (38 firms). For parent firm operations no such detail on capital
expenditures by industry is available. We used the main line of business in Japan to allocate the
domestic capital stock and capital investments to an industry, while the capital stock in Japan was used
as weight cs for all foreign fixed capital investment decisions.

13
responding to two overseas business surveys and the domestic activity survey. Since quite a
few firms tend to respond erratically to the foreign activity survey, this reduced our sample
substantially. Second, for these firms we needed complete information for manufacturing
affiliates worldwide. This required reliable item responses for all relevant variables (capital
stocks and fixed capital investments) for all manufacturing affiliates. Finally, the sample was
reduced due to the unavailability of some explanatory variables (mainly industry-level output
and demand). All this left us with 1707 observations on investments in 29 countries
(including Japan) by 502 Japanese firms active in 20 industries. On average each
multinational firm has capital allocated to 3.5 countries.
The gross investment ratio is total gross fixed capital investment of the firm in a country
in fiscal year 1996 divided by the value of the firm’s fixed tangible assets in the country at
the end of fiscal year 1995. It is equal to zero for 5.3 percent of the observations.
INSERT Tables 1 and 2
The industry- and regional- distribution of our observations is summarized in Tables 1
and 2. The largest number of investment observations in the sample is in the Motor Vehicle
industry (274) followed by Electrical Machinery, Radio TV and Communication Equipment,
Chemicals, and Non-Electrical Machinery (Table 1). The highest capital stocks are present in
capital intensive industries such as Petroleum Refinery and Iron & Steel. Average investment
ratios range from 0.12 for the Food and Beverage industry to 0.67 for Other Transport
Equipment. Table 2 shows that among foreign countries, affiliates in the United States (248),
China, Taiwan and Thailand are best represented. On average the capital stock is much
higher in Japan than abroad, showing that most multinational firms still have most of their

14
assets located in Japan. The ratio of investment to total fixed tangible assets is however
smaller in Japan compared with the comparable ratio in most overseas affiliates.
Explanatory Variables
The wage rate (WAGEi) is measured by the industry wage rate and is calculated as salary
paid divided by the total number of employees in a country and industry, using data on
salaries and employees of the population of Japanese manufacturing affiliates in the
industries and countries in 1995. The average wage rate in other countries in which the firm
is active (WAGEj) is calculated similarly, with wage rates in other countries weighted with
the firm’s fixed tangible assets in each country in 1995. Effective demand (DEMANDi) is
taken as the sum of industry demand of the host country and demand in all other countries
weighted by the distance between countries, with weights r5.0/1 (where r is distance).11
Demand in the host country is weighted by taking as parameter r the radius of the country
using the country’s area size. Industry demand in the countries is calculated as production
levels plus imports minus exports. The industry output and export and import data were
collected from UNIDO (2003a), the OECD’s STAN database for industry analysis, and
Statistics Canada’s World Trade Analyzer. For China data were taken from the China
Statistical Yearbook and for Taiwan data were drawn from Input-Output Tables published by
the Republic of China’s Statistics Bureau. Demand in other countries (DEMANDj) is
calculated in the same manner, and then weighted by the firm’s fixed tangible assets in each
country in 1995.
We proxy for industry and country level differences in total factor productivity by the
ratio of the number of patents generated by inventors domiciled in the countries over industry
level output (per 1 million US dollar) in the country (PRODVi). The industry-level patent 11 This follows Head and Mayer (2004) who term this potential demand. The weight assumes that
demand is equally distributed in a circle of radius r.

15
intensity measure is an indicator of the technology intensity of production in the industry and
country. While direct measures of total factor productivity estimates would obviously be
preferred, TFP estimates do not exist for all the countries in the sample at the detailed
industry level. We assigned patents to industries based on the patent to industry concordance
tables developed by Frauenhofer/OST (Smoch et al. 2003), adapted to third revision ISIC
classifications. This concordance attaches to each international patent classification code
(IPC, describing the technological domain of the patent) a probability that it is originating in
a specific ISIC industry, based on the industries of applicant firms. The technology level in
other countries (PRODVj) is calculated in the same manner and weighted by the firm’s fixed
tangible assets in each country in 1995.
Since information on the number of product or product varieties is not available, we
assume that product development is a function of R&D investments and we proxy
C
ccK
Z
1
by
the R&D to capital stock ratio. The R&D variable (RDINTf) is R&D expenditures in 1995
divided by total global assets in the world at the end of fiscal year 1995.
We lack a suitable proxy for the unit cost of capital goods tcp , as it may differ across
countries and industries, or firms. To the extent that multinational firms buy capital goods on
global markets or use capital goods developed in Japan, we may not expect strong country
variation in the cost of capital goods. Industry variation in the costs of capital goods is taken
into account in the empirical model through the inclusion of industry dummies. 12 We
augment the equation with a measure of liquidity constraints faced by the firm to control for
potential interaction in investment decisions through the marginal cost of capital facing the
12 We experimented with inclusion of a variable measuring the share of capital goods procured from
local sources, following the idea that local over international sourcing is most likely to occur if the
cost of capital goods in the host country market is relatively low, but found no significant impact on
investment.

16
firms (Stevens and Lipsey, 1992). We control for liquidity constraints by including the firm’s
global coverage ratio in 1995 (COVERAGEf). The global coverage ratio is calculated as total
interest payments divided by total interest payment plus cash flow for the firm’s global
operations at the end of fiscal 1995.
All the variables are taken in natural logarithms.13 We estimate equation (12) both under
0*2 and 0*
2 . In the latter case, the first differences (1994-1995) of the variables
(DEMAND, WAGE, and PRODV) are included as well. We calculated the weighted
differenced variables for other countries with the firm’s fixed tangible assets in each country
in 1995 as weights. Table 3 contains the descriptive statistics for the variables; the correlation
matrix is relegated to appendix 2.
INSERT TABLE 3
5. Empirical Results
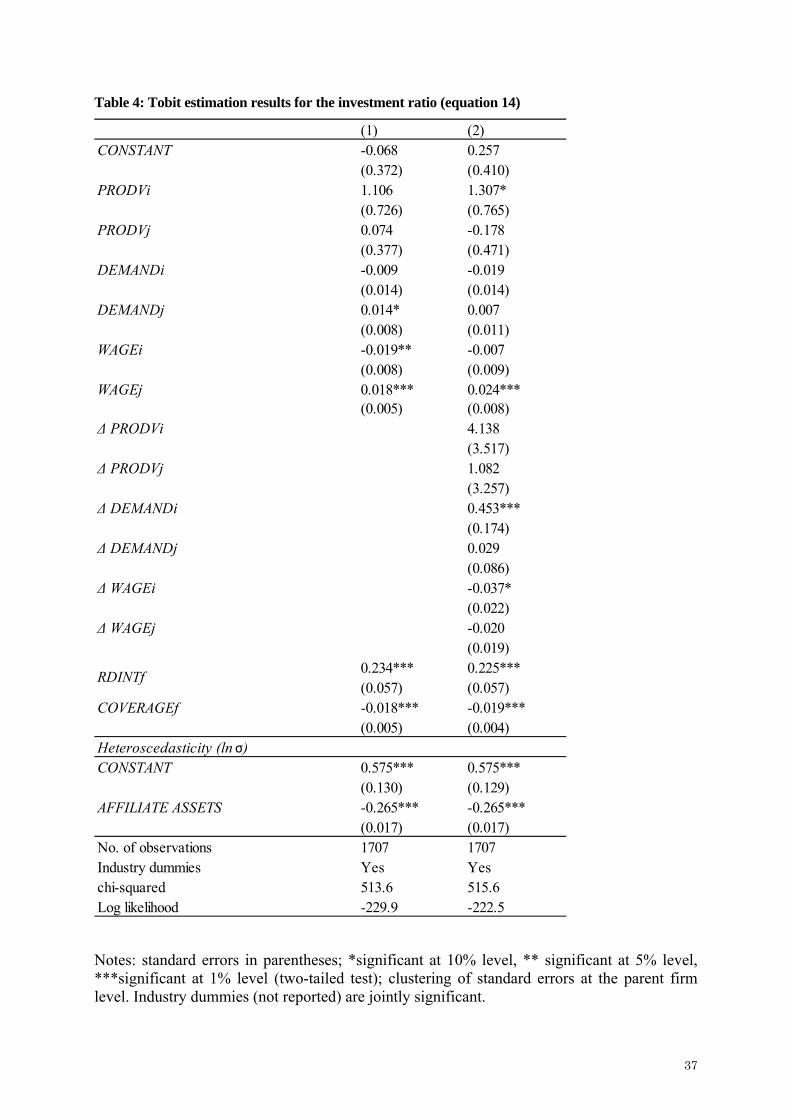
The Tobit estimation results of equation (12) are presented in Table 4. We allow for
heteroscedasticity in the error term dependent on affiliate size (the logarithm of the affiliate’s
total assets) and we allow standard errors to be correlated across observations of the same
parent firm by clustering error terms at the firm level.
INSERT TABLE 4
Model 1 in Table 4 contains the results for the model with 0*2 and Model 2 adds the
differenced values of the country variables ( 0*2 ) in line with the assumption of an AR(2)
13 For variables that can also take the value zero (R&D, patents, and investment) we added the value
one before taking logarithms.

17
process for the marginal rate of return on capital. In both models, the weighted R&D
intensity of the multinational firms (RDINTf) is positive as predicted, and significant. The
coverage ratio (COVERAGEf), as indicator of liquidity constraints faced by the firms in their
global operations, has the expected negative sign and is also significant. The estimated
parameter for heteroscedasticity shows that the variance of the error term is negatively
related to affiliate size.
In model 1, the wage rate in the country and industry (WAGEi) has a significantly
negative impact on the gross fixed capital investment ratio. At the same time, the weighted
average wage rate in other countries in which the firm is active (WAGEj) has the predicted
positive impact and is significant. These two findings imply that a country becomes an
attractive location for the purpose of investing if its wages are low and if wages in other
countries are high. The proxy variable for productivity (PRODV) has no significant impact.
The industry demand variable for other countries (DEMANDj) is marginally significant but
has a counterintuitive positive sign.
Results for model 2 are overall more in line with predictions. The model has a
significantly improved fit, with the loglikelihood ratio test statistic at 14.8 against a critical
value of the Chi-square distribution of 12.53 (at 5 percent significance). The results show that
it is host country wage growth that has the most robust negative impact on fixed capital
investments, rather than wage levels: wage growth is significantly negative, while the wage
level looses its significance. We again find that the average wage rate in other countries in
which the firm operates (WAGEj) is positive and significant. In addition, host country
demand growth (ΔDEMANDi) has the expected positive impact on investment and is
significant, while the level variables for DEMAND are insignificant. The productivity level
(PRODVi) in the host country industry is positive and significant at the 10 percent level in
column 2.
18
Overall the results provide qualified support for the model of global fixed capital
investments. Although levels of significance differ, investment ratios by the multinational
firms in a country are determined by (growth in) local wage costs, local productivity and
demand growth, and R&D intensity as a proxy for product scope. Interaction in investment
decisions cross countries takes places as a function of differences in wage levels and wage
growth, while such influences cannot be found for demand and productivity. This implies
that investment rates are not only driven by host features of the local economy, but also
depend on the multinational firm's existing configuration of affiliates and capital in other
countries and the relative wage in these countries. Interaction furthermore occurs through
financial constraints in the global operations of the multinational firm, which implies that
liquidity constraints of operations in one country affect investments in another.
The marginal effects of the country level and firm drivers of the investment rate are not
insubstantial. We calculated the change in the mean predicted investment rate in the sample
due to a standard deviation change in explanatory variables, with other variables kept at their
actual levels.14 A standard deviation increase in the host country wage rate causes the mean
predicted investment rate to decrease by 7.5 percent, while a standard deviation increase in
wage j increases the investment rate by 5.5 percent (model 1) . In model 2, a standard
deviation increase in growth of host country wages decreases the investment rate by 4.5
percent, while a standard deviation increase in the wage j increases investment with 7 percent.
A standard deviation increase in demand growth in model 2 increases the investment rate by
14 See also Maddala (1983, p. 159) for the calculation of the expexted value in a tobit model. We see
these changes in the mean prediction within the sample as slightly more conservative than estimates
of marginal effects in the mean of the explanatory variables, as the latter are derived for a
hypothetical firm. Marginal effects in the tobit model can be further decomposed in the effect on the
probability of positive investment and the effect on the investment level (McDonald and Moffit,
1980). Given the limited censoring of the investment variable (5 percent of observations is zero), the
elasticities are by and large representative of the effect on investment levels.

19
10 percent, a standard deviation increase in productivity 8 percent, and the effects of R&D
and the coverage ratio are 8 and minus 6 percent, respectively.
Supplementary Analysis
The relatively weak results for effective demand and productivity effects may be partly
caused by the restrictions of the data we are working with. Patent to output ratios are a very
imperfect proxy for local productivity at the country and industry level. The weaker demand
effects may be due to the assumption that effective demand is only weighted by trade cost
related to distance, which abstracts from various degrees of trade barriers between countries.
Also, in case affiliates in host countries manufacture product variants tailored to the host
country, demand in other countries may not be consequential for investment decisions. We
estimated alternative models including a local (host country) demand variable replacing the
effective demand variable, but the empirical results did not show a strong pattern of local
demand driving investment decisions. Similarly,we did not find stronger results by replacing
industry output for revealed demand, or by applying a different weighing method to host
country demand.
We also performed supplementary analysis of extended models including a measure of
the effective tax rate in the countries of investment (e.g. Wheeler and Mody, 1992; Head and
Mayer; 2004; Chen and Moore 2009), measured as the average ratio of Japanese firms'
effective tax payments to profits as indicated by their reporting in the METI surveys. Neither
the tax rate in country i nor the tax rate in other countries j in which the firms operate
manufacturing affiliates exerted a significant influence on the investment rate.

20
6. Conclusions
We examine the determinants of, and interaction between, fixed capital investments
decisions by multinational firms at the micro level. Our focus is on the simultaneous
determination of investment decisions in all locations in which the multinational firms are
active, and we infer interactions between investments in all these locations (including the
home country) from their determinants. To guide our empirical analysis, we developed a
simple model of the simultaneous gross fixed capital formation decision by multinational
firms. Starting point is the notion of optimal dynamic investment behaviour under nonconvex
adjustment costs, following Abel and Eberly (1994), Eberly (1994) and Barnett and
Sakellaris (1998). We treat multinational firms as multi-product firms choosing optimal
locations for each unique product based on effective (host country and potential export)
demand, productivity, and wage costs at the industry level. Our model emphasizes
interactions through the manufacturing side and allows for demand as well as cost
considerations in FDI decisions, while controlling for financial constraints. We test the
predictions of the model on a sample of 1707 fixed capital investment decisions by Japanese
multinational firms in 1996.
We find qualified support for the predictions of the model where it concerns interactions
through relative wages. The rate of investment is not only determined by factors affecting the
return on investment in the country itself (i.e. effective demand, wages and productivity), but
also (positively) by relative wage levels in other countries in which the firm operates
manufacturing affiliates. R&D intensive firms, assumed to have broader product line-ups,
show higher investment ratios over all locations. Global liquidity levels of the firm, as
indicated by the coverage ratio, also increase investment rates. The results provide more
21
support for an investment specification that includes first differenced drivers of the marginal
product of capital consistent with a time path following an AR(2) process, than for a
specification in levels which would be consistent with an AR(1) process.
Our findings suggest that Japanese multinational firms have been responsive to low
cost opportunities abroad and have diverted investments in fixed capital from high wage
countries to low wage countries in the period of study.15 The presence of active wage
arbitrage in fixed capital investment allocation depends on the expansion opportunities and
cost (increases) the multinational firms are facing in their existing configuration of global
activities. This suggests that features of multinationality itself are another source of firm
heterogeneity affecting foreign investment decisions, in addition to heterogeneity related to
competitive advantage and technological strength represented by R&D intensity or
productivity (Yeaple 2009, Chen and Moore 2009).
Our analysis suggests two routes through which multinational firms transmit local
shocks affecting wages or liquidity across countries through their capital investment
allocation decisions. A local wage shock in countries with an important presence of
multinational firms, positively affects capital investment in other countries in which these
firms are active. This transmission mechanism can exacerbate the effects of a local wage
shock and deepen recessions through a sharper reduction in investments in countries with a
sizeable presence of multinational firms. In addition, substitution effects between
investments can occur through increases or decreases in the cost of capital and variation in
the cross-border intra-firm provision of internal funds. Given financial constraints and
increasing marginal costs of capital, a tightening of financial constraints for firms, e.g. as a
consequence of a domestic financial shock, also reduces investments abroad.
15 We note that we cannot derive explicit implications on how exchange rate changes will affect multinational firms’ capital investment, as a currency appreciation will on the one hand raise the country’s relative wage rate (negatively affecting investment), but on the other hand it will raise purchasing power and increase demand for multinational firms’ output (positively affecting investment).
22
Our finding that financing constraints are another source of interaction between
investments is in line with earlier work (Stevens and Lipsey 1991). It is consistent with the
notion that internal capital markets of multinational firms are important and frequently used
by multinational firms to deal with host country capital market imperfections (Desai et al.
2004). It suggests that multinational firms, though they have broader options to source funds
for their global operations affiliates, may still be unable to offset financing restrictions on
investments.
Our results contrast with the findings in Desai et al (2005a), which suggest a positive
impact of foreign investment activity on domestic capital formation by US multinationals.16
There are several possible causes for these differences. First, we examined investment
decisions in multiple countries and did not limit attention to investment in the home country.
Secondly, we explicitly examined cost motivations in investment decisions with wage costs
the driver of interactions in addition to the demand growth motivation studied by Desai et al.
(2005a). Third, the pattern of foreign investments by Japanese firms with a concentration in
South East Asia differs from that of US multinationals which have a greater focus on
Western Europe (e.g. Fukao et al. 2003). Investments in Asia have been driven by cost
considerations and labour cost has been an important driver of location decisions (e.g.
Blomström et al. 2000, Head and Ries 2002). Potential complementarities between
investments in different countries, e.g. through intra-firm trade between upstream and
downstream activities (Hanson et al. 2005), may occur through the operations of other firms
and particularly firms within the Japanese business group, rather than within the boundaries
of the multinational firms (e.g. Belderbos and Sleuwaegen 1998, Blonigen et al. 2005).
Further investigation could examine long term inter-firm relationships and investment
interactions within Japanese business groups. 16 The results are in line with studies in the international business literature on the sensitivity of
affiliate employment to international wage differentials (e.g. Belderbos and Zou 2008).

23
Our results also suggest a number of other fruitful improvements and extensions in future
research. Empirically, future models of fixed capital investments preferably take into account
the dynamics of investment processes, which can only be uncovered through the use of panel
data. Our finding on finance constraints driving interaction between investment decisions
suggests that further research should model these explicitly integrating manufacturing and
finance interactions. Replication of this type of study on data for multinationals from other
countries would show if differences in empirical results on investment interactions are due to
the empirical specification or the different nature of investment motives. Future modelling
work on global investment decisions would pay attention to more complex intra-firm
relationships between manufacturing affiliates (Grossman et al. 2006), and could combine
decisions on establishing affiliates in additional countries (extensive margin) with capital
investment decisions for existing affiliates. Finally, our analysis assumed that multinational
firms operating in a given country and industry face the same given wage level. Recent
evidence by Budd et al. (2005) suggests that wage bargaining processes in multinational
firms are such that wages at the affiliate level are also a function of profitability of the parent.
Perhaps the effects of wage differentials between countries may be mitigated over time if
local unions can bargain for global rent sharing. Future work can examine the joint
determination of investment and wages at the affiliate level and investigate to what extent
wage differentials within the multinational firm persist.
Acknowledgements
This research was conducted as part of the project on “Japan’s Productivity and Economic
Growth” at the Research Institute of Economy, Trade and Industry (RIETI). René Belderbos
gratefully acknowledges financial support from the International Centre for the Study of East

24
Asian Development (ICSEAD) and the Japan Society for the Promotion of Science (JSPS).
We also like to thank Joep Konings, Kaz Miyagiwa and seminar participants at the Academy
of International Business (AIB) 2009 conference in San Diego and the Comparative Analysis
of Enterprise (Micro) Data (CAED) 2009 conference in Tokyo for constructive comments on
earlier drafts of our paper.
25
References
Abel, A.B. and J.C. Eberly, 1994, A Unified Model of Investment under Uncertainty, American
Economic Review 84, 1369-1384.
Abel, A.B. and O.J. Blanchard, 1986, The Present Value of Profits and Cyclical Movements in
Investment, Econometrica 54, 249-273.
Aitken, B., Hanson, G. & Harrison, A., 1997. Spillovers, Foreign Investment, and Export
Behavior. Journal of International Economics, 43 (1–2), 103–32.
Barnett, S.A. and P. Sakellaris, 1998, Nonlinear Response of Firm Investment to Q: Testing a
Model of Convex and Non-Convex Adjustment Costs, Journal of Monetary Economics 42,
261-288.
Bee Yan Aw, Yi Lee, 2008. Firm heterogeneity and location choice of Taiwanese
multinationals, Journal of International Economics 76 ,403–415
Belderbos, R., 1992, Large Multinational Enterprises Based in a Small Economy: Effect on
Domestic Investments, Weltwirtschaftliches Archiv 128, 543-583.
Belderbos, R.A. and L. Sleuwaegen, 1998, Tariff Jumping FDI and Export Substitution:
Japanese Electronics Firms in Europe, International Journal of Industrial Organisation 16 (5),
601-638.
Belderbos. R., and J. Zou, 2007, On the Growth of Foreign Affiliates: Multinational Plant
Networks, Joint Ventures, and Flexibility, Journal of International Business Studies, 38(7):
1095-1112.
Blomström, M. D. Konan, and R.E. Lipsey, 2000, FDI in the Restructuring of the Japanese
Economy, NBER Working Paper w7693, NBER.
Blomström, M., G. Fors, and R.E. Lipsey, 1997, Foreign Direct Investment and Employment:
Home Country Experience in the U.S. and Sweden, The Economic Journal 107, 1778-1797.
Blonigen, B.A., C. J. Ellis, and D. Fausten, 2005, Industrial groupings and foreign direct
investment, Journal of International Economics 65, 75– 91
Bond, S., and J. van Reenen, 2001, Micro-econometric Models of Investment and Employment,
in: James Heckman and Edward Leamer (eds.), Handbook of Econometrics Volume IV,
Amsterdam: Kluwer.
Bontempi, M.E., A. Del Boca, A. Franzosi, M. Galeotti and P. Rota, 2004. Capital
Heterogeneity: Does it Matter? Fundamental Q and Investment on a Panel of Italian Firms,
Rand Journal of Economics 35, 674-690.

26
Brainard, S.L. and D.A. Riker, 1997, Are U.S. Multinationals Exporting U.S. Jobs? NBER
Working Paper 5958.
Budd, J.W., J. Konings, and M.J. Slaughter, 2005, Wages and International Rent Sharing in
Multinational Firms, Review of Economics and Statistics, 87, 73-84.
Carr, D., Markusen, J., Maskus, K., 2001. Estimating the knowledge-capital model of the
multinational enterprise. American Economic Review 91 (3), 691–708.
Chen, M.X., and M.O. Moore, 2010, Location decision of heterogeneous multinational firms,
Journal of International Economics, 80, 188-199
Desai, M.A., C.F. Foley, and J.R. Hines, 2004. A Multinational Perspective on Capital Structure
Choice and Internal Capital Markets, The Journal of Finance, 59 (6), 2451-3487.
Desai, M.A., C.F. Foley, and J.R. Hines, 2005a. Foreign Direct Investment and Domestic
Economic Activity. National Bureau of Economic Research. NBER Working Paper 11717.
Cambridge MA.
Desai, M.A., C.F. Foley and J.R. Hines., 2005b. Foreign Direct Investment and the Domestic
Capital Stock. American Economic Review 95(2): 33-38.
Eberly, J., 1997, International Evidence on Investment and Fundamentals, European Economic
Review 41, 1055-1078.
Feenstra, R.C., and G. Hanson, 1986, Globalisation, Outsourcing, and Wage Inequality,
American Economic Review 86, 220245.
Feldstein, M., 1995. The Effects of Outbound Foreign Direct Investment on the Domestic
Capital Stock. In: Feldstein, M., J.R. Hines Jr., and R.G. Hubbard (eds.). The Effects of
Taxation on Multinational Corporations. Chicago University of Chicago Press). 43-63.
Fukao, K., H. Ishido, and K. Ito, 2003, Vertical Intra-Industry Trade and Foreign Direct
Investment in East Asia, The Journal of the Japanese and International Economies 17(4),
468-506.
Grossman, G. M. E Helpman and A. Szeidl, 2006. Optimal integration strategies for the
multinational firm Journal of International Economics 70, 216– 238.
Hanson, G., R. Mataloni and M. Slaughter, 2005, Vertical Production Networks in Multinational
Firms, Review of Economics and Statistics 87(4): 664–678.
Harrison, A.E. and M.S. McMillan, 2003, Does Foreign Direct Investment Affect Domestic
Credit Constraints? Journal of International Economics 61, 73-100.
Haskel, J.E., Pereira, S., Slaughter, M., 2007. Does inward foreign direct investment boost the
productivity of domestic firms? Review of Economics and Statistics 89 2), 482–496.

27
Head, K. and J. Ries, 2001, Overseas Investment and Firm Exports, Review of International
Economics 9 (1), 108-123.
Head, K. and J. Ries, 2002, Offshore Production and Skill Upgrading by Japanese
Manufacturing Firms, Journal of International Economics 58, 81-105.
Head, K., Mayer, T., 2004. Market potential and the location of Japanese investment in the
European Union. Review of Economics and Statistics 86 (4), 959–972.
Hejazi, W., and P. Pauly, 2003. Motivations for FDI and Domestic Capital Formation. Journal of
International Business Studies 34: 282-289.
Helpman, E., M.J Melitz, and R.S.. Yeaple, 2004, Export versus FDI with Heterogeneous
Firms, American Economic Review, 94, 300-316
Herzer, D., and M. Schrooten, 2008. Outward FDI and Domestic Investment in Two
Industrialized Countries. Economics letters 99(1): 139-143.
Ito K. and K. Fukao, 2005, Physical and Human Capital Deepening and New Trade Patterns in
Japan, in Takatoshi Ito and Andrew Rose, eds., International Trade in East Asia, NBER-East
Asia Seminar on Economics, Volume 14, Chapter 1, pp. 7-49, University of Chicago Press.
Konings, J. and A. P. Murphy, 2006, Do Multinational Enterprises Relocate Employment to Low
Wage Regions: Evidence from European Multinationals, Journal of World Economics. 142
(2), 267-286.
Letterie, W.A. and G.A. Pfann, 2007, Structural Identification of High and Low Investment
Regimes, Journal of Monetary Economics 54, 797-819.
Lipsey, R. E., and M. Y. Weiss, 1984, Foreign Production and Exports of Individual Firms,
Review of Economics and Statistics 66, 304-308.
Maddala, G.S., 1983, Limited Dependent and Qualitative Variables in Econometrics, Cambridge
University Press
METI (Ministry of Economy, Trade and Industry of Japan), various years, Kaigai Jigyou Kihon
Chosa (Basic Survey of Overseas Business Activities), Tokyo: METI.
METI (Ministry of Economy, Trade and Industry of Japan), various years, Kigyou Katsudou
Kihon Chousa (Basic Survey of Japanese Business Structure and Activities), Tokyo: METI.
McDonald, J.F. and R.A. Moffitt, 1980, The Uses of Tobit Analysis, Review of Economics
and Statistics, 62 (2), 318-321
Nilsen, Ø.A. and F. Schiantarelli, Zeroes and Lumps in Investment: Empirical Evidence on
Irreversibilities and Non-Convexities, Review of Economics and Statistics 85, 1021-1037.
Schmoch U., E Laville, P Patel, and R. Frietsch, Linking Technology areas to Industrial Sectors,
Final Report for the Eurepean Commission, DG Research.

28
Slaughter, M, 2000, Production Transfer Within Multinational Enterprises and American Wages,
Journal of International Economics 50, 449-472.
Stevens, G. and R. Lipsey, 1992, Interactions Between Domestic and Foreign Investment,
Journal of International Money and Finance, 40-62.
UNIDO (United Nations Industrial Development Organization) (2003a), Industrial Statistics
Database at the 3-digit level of ISIC Code (Rev.3), United Nations Industrial Development
Organization.
Wheeler, D., and A. Mody, 1992, International Investment Location Decision, Journal of
International Economics 33, 57-76.
Yeaple, S.R, 2009. Firm Heterogeneity and the Structure of U.S. Multinational Activity,
Journal of International Economics, 78, 206-215.

29
Appendix 1: Derivations
1.1. Derivation of gross profit function
In the short run, the firm’s capital stock Kc is given and the firm determines optimal labour
input in country j, Lj to maximize its current profit. Let cw be the wage cost per unit of
labour in country c. Using the production function given in equation (6) to obtain an
expression for c
c
z
L, the variable and marginal cost functions for production of each product in
country c are given by:
(A1)
1
11
1
1
cc
ccc
c
ccc Q
z
Kw
z
LwVC
(A2) c
cc
c
cc
c
c
cc Q
VCQ
z
Kw
Q
VCMC
111
1
1
1
If we use equation (9), (A1) to substitute for cVC , (8) to substitute for cQ , and (7) to
substitute for ',ccD in order to derive the first order condition with respect to the price ',cc
p ,
then the optimal pricing behaviour of the firm is:
(A3) ccc
cc MCp ',
',
1
We note that ',ccp is determined for a given allocation of Z across countries. Hence, zc for
c=1, .. , C is given at this stage of the firm’s decision making process. Using equation (7) in
(8) and applying (A3) and (A2), we have the following condition for optimal output in
country c,

30
(A4) 1
1
ccc MCQ
where
C
cc
cc
cc E
P
1''
1
',
'1
1
1
.
Using (A2) in (A4) and solving for Qc we get:
(A5)
c
ccccc z
KwQ
)1(
)1)(1(
1
where 1)1)(1(
1
. From equation (A1), (A2), and (A5), we also have:
(A6)
c
ccccc z
KwVC 1)1(1
(A7)
1
111111
c
ccccc z
KwMC
Using equation (9), (A3), (8) and (A4) respectively we can derive the gross profit function:
(A8)
C
cccccc
C
ccccc
C
ccc
C
cccccc
zKw
VCMCzVCzDpz
1
1111-
1
1
1 1'',',
)-(1

31
Since the firm chooses its output prices for a given allocation of products across countries,
gross profit depends on zc for c = 1, 2, .. , C. Gross profit in country c increases with higher
total factor productivity ( c ), with higher market potential ( c ), with lower wages wc and a
higher initial stock of capital in country c.
1.2. Derivation of optimal allocation products across countries
We derive the optimal allocation of Z across countries. To this end the firm maximizes (9)
with respect to zc for c = 1, 2, .. , C subject to the constraint in equation (5). Optimization of
this problem making use of the Lagrangian implies that the firm should equalize the marginal
gain across all countries:
(A9)
'
'
'''1111
c
cccc
c
cccc z
Kw
z
Kw
From this condition one can find an explicit solution for 'cz in terms of zc:
(A10)
111
'''
'
c
c
c
c
c
ccc w
wzz
Next, using equation (5) we can derive the optimal value of zc:
(A11) Zs
sz
ccc
ccc
where
111
cccc w ;
C
cc
cc
K
Ks
1
; and
cc
ccc s
'
'' .

32
1.3. Derivation of marginal profit of capital
To derive the marginal profit of capital we use equation (9), (A8) and (A11) to substitute for zc
and obtain
(A12)
C
c C
ccc
ccC
K
KZZKKK
11
1
1
21
'
''
,,..,,
We find after some calculations that
(A13)
11
1
1.
1
1
11
11
1
1
1
1
1
1
1
1
1
211
'
''
''
'''
''
''
'
'
'
'
'
'''''
'
'
'
'
'
'
C
cc
ccc
c
c
c
C
ccc
C
ccc
cc c
cc
C
ccc
c
cc
cc
c
C
cc
c
C
ccccc
c
C
cc
c
C
ccccc
c
K
Z
sK
z
Z
K
Z
K
ZK
zz
Z
K
ZK
zZz
K
KKZ
K
KKZZ
K

33
Appendix 2: Correlation matrix
(obs=1707) (1) (2) (3) (4) (5) (6) (7) (8) (9) (10) (11) (12) (13) (14)(1) INVRATIO 1(2) RDINTf 0,0971 1(3) COVERAGEf -0,0249 -0,1668 1(4) WAGEi -0,0916 0,0259 0,0091 1(5) WAGEj 0,1605 0,1408 -0,0138 -0,3817 1(6) PRODVi 0,0293 0,1412 -0,031 0,312 -0,0184 1(7) PRODVj 0,0569 0,1993 -0,0228 0,0002 0,1878 0,3015 1(8) DEMANDi -0,0648 -0,0081 0,0216 0,4533 -0,2546 -0,2195 -0,1085 1(9) DEMANDj 0,0325 0,0562 -0,0095 -0,228 0,4485 -0,0884 -0,262 0,0854 1(10) Δ WAGEi -0,0519 -0,0268 0,0343 0,2301 -0,1186 -0,0292 -0,0293 0,0372 -0,097 1(11) Δ WAGEj 0,0573 0,0288 0,0239 -0,1858 0,314 -0,0273 0,0033 -0,1377 0,098 -0,0606 1(12) Δ PRODVi 0,0317 -0,0444 -0,0173 -0,3133 0,1418 -0,3461 -0,0407 -0,0598 0,1004 -0,0298 0,0971 1(13) Δ PRODVj -0,0969 -0,1891 -0,0214 0,1209 -0,3307 -0,093 -0,5714 0,1194 -0,0103 0,0881 -0,1162 -0,0891 1(14) Δ DEMANDi 0,1229 0,2076 0,0284 -0,0628 0,135 -0,1131 0,1007 0,1252 0,0675 -0,048 0,0247 -0,0846 -0,2017 1(15) Δ DEMANDj 0,0553 0,2035 0,0428 0,0396 -0,0059 0,1094 0,0513 0,0429 0,0834 -0,0584 -0,0446 -0,1335 -0,2125 0,4359

Table 1. Descriptive statistics by industry
Note: Amounts in million yen
Industry Number of Average capital Average
observations stock investment ratio
Food, Beverages and Tobacco 61 17.618 0,120
Textiles,Clothing,Leather and Footwear 105 8.460 0,152
Wood & Furniture 16 19.730 0,173
Paper, Printing and Publishing 31 36.140 0,191
Chemicals 161 20.437 0,290
Drugs & Medicines 33 17.233 0,225
Petroleum and Coal Products and Refinery 6 180.728 0,186
Rubber and Plastic 88 8.581 0,234
Non Metallic Mineral Products 56 28.342 0,279
Iron & Steel 34 116.124 0,273
Non-Ferrous Metals 55 16.999 0,371
Metal Products 48 16.336 0,222
Non-Electrical Machinery 145 10.194 0,300
Office, Computing and Accounting Machinery 36 8.292 0,401
Electrical Machinery 259 7.881 0,292
Radio, TV and Communication Equipment 191 13.591 0,334
Motor Vehicles 274 15.038 0,304
Other Transport Equipment 8 25.721 0,672
Professional Goods/Medical & optical & precision eq 48 5.523 0,344
Other Manufacturing 52 4.341 0,238
Total 1707 16.159 0,280

35
Table 2. Descriptive statistics by country
Notes: Amounts in million yen. (D) Suppressed to avoid disclosure of data of individual companies.
Country Number of Average Average observations capital stock investment
ratioJapan 502 50.051 0,160United States 248 3.174 0,355United Kingdom 62 1.651 0,376Belgium 5 1.035 0,081France 20 969 0,298Germany 40 1.666 0,304Italy 6 1.935 0,379Netherlands 14 4.770 0,264Sweden 2 (D) 0,555Canada 15 8.414 0,243Ireland 3 922 0,502Portugal 3 632 1,127Spain 13 2.069 0,297Australia 11 733 0,388New Zealand 4 2.192 0,305Brazil 21 1.583 0,153Colombia 2 (D) 0,230Mexico 18 994 0,384Hong Kong 49 541 0,333India 11 4.575 0,419Indonesia 65 2.042 0,361Korea 77 1.044 0,374Malaysia 73 2.828 0,284Philippines 25 779 0,317Singapore 89 1.435 0,417Thailand 104 2.518 0,309Taiwan 111 1.131 0,217China 112 1.168 0,334Hungary 2 (D) 0,302Total 1707 16.159 0,280

36
Table 3. Description of variables
variable
Symbol Description Mean Std. Dev.
INVRATIO ctct KI / Gross investment ratio in 1996 0,28046 0,409218
PRODV 1, tc Industry patent intensity in country i in 1995 0,010784 0,018964
PRODVj 1, tc Industry patent intensity in all other countries (j≠i) in 1995 0,011833 0,017557
DEMANDi 1, tc Industry demand in country i in 1995 20,35743 0,843602
DEMANDj 1, tc Weighted average industry demand in all other countries (j≠i) in 1995 20,62594 0,727617
WAGEi 1, tcw Industry wage rate in country i in 1995 0,486443 1,232282
WAGEj 1, tcw Industry wage rate in all other countries (j≠i) in 1995 1,051268 0,897609
Δ PRODVi Δ 1, tc Growth rate of industry patent intensity in country i from 1994 to 1995 ‐0,00093 0,002709
Δ PRODVj Δ 1, tc Growth rate of industry patent intensity in all other countries from 1994 to 1995 ‐0,00149 0,0022
Δ DEMANDi Δ 1, tc Growth rate of industry demand in country i from 1994 to 1995 0,143347 0,071238
Δ DEMANDj Δ 1, tc Growth rate of weighted average industry demand in all other countries from 1994 to 1995
0,138786 0,058231
Δ WAGEi Δ 1, tcw Growth rate of industry wage in country i from 1994 to 1995 ‐0,00795 0,375647
Δ WAGEj Δ 1, tcw Growth rate of industry wage in all other countries from 1994 to 1995 0,034943 0,227872
RDINTf
C
ctct KZ
11,1 / R&D to global asset ratio in 1995 0,101167 0,110152
COVERAGEf - Global coverage ratio in 1995 ‐3,31739 0,969094 Notes: All variables in natural logarithms (investment ratio, patent intensity, and R&D intensity after adding 1).
37
Table 4: Tobit estimation results for the investment ratio (equation 14)
(1) (2)CONSTANT -0.068 0.257
(0.372) (0.410)PRODVi 1.106 1.307*
(0.726) (0.765)PRODVj 0.074 -0.178
(0.377) (0.471)DEMANDi -0.009 -0.019
(0.014) (0.014)DEMANDj 0.014* 0.007
(0.008) (0.011)WAGEi -0.019** -0.007
(0.008) (0.009)WAGEj 0.018*** 0.024***
(0.005) (0.008)Δ PRODVi 4.138
(3.517)Δ PRODVj 1.082
(3.257)Δ DEMANDi 0.453***
(0.174)Δ DEMANDj 0.029
(0.086)Δ WAGEi -0.037*
(0.022)Δ WAGEj -0.020
(0.019)0.234*** 0.225***(0.057) (0.057)
COVERAGEf -0.018*** -0.019***(0.005) (0.004)
Heteroscedasticity (ln σ)CONSTANT 0.575*** 0.575***
(0.130) (0.129)AFFILIATE ASSETS -0.265*** -0.265***
(0.017) (0.017)No. of observations 1707 1707Industry dummies Yes Yeschi-squared 513.6 515.6Log likelihood -229.9 -222.5
RDINTf
Notes: standard errors in parentheses; *significant at 10% level, ** significant at 5% level, ***significant at 1% level (two-tailed test); clustering of standard errors at the parent firm level. Industry dummies (not reported) are jointly significant.