global forest, paper & packaging industry survey - pwc · welcome to the pricewaterhousecoopers...
TRANSCRIPT

© 2008 PricewaterhouseCoopers LLP 1
Forest, Paper & Packaging
Global Forest, Paper & Packaging Industry Survey2008 Edition – Survey of 2007 Results

PricewaterhouseCoopers’ Global Forest, Paper & Packaging Industry Survey: 2008 Edition – Survey of 2007 Results2
Key contributors to the PwC 2008 Global Forest, Paper & Packaging Industry Survey include:
Craig Campbell Clive Suckling Bruce McIntyre Ken Legg Hosni Zeaiter

© 2008 PricewaterhouseCoopers LLP i
Contents
Leaders’ Message 1
Highlights PwC Top 100 2
PwC Top 100 12
Results by Country/Region 14
Survey Methodology 26
PricewaterhouseCoopers 21st Annual Global Forest & Paper Industry Conference 28
Publications 34
PricewaterhouseCoopers Global Forest, Paper & Packaging Contacts 35

PricewaterhouseCoopers’ Global Forest, Paper & Packaging Industry Survey: 2008 Edition – Survey of 2007 Resultsii

© 2008 PricewaterhouseCoopers LLP 1
Welcome to the PricewaterhouseCoopers Global Forest, Paper & Packaging† Industry Survey – 2008 Edition. The goal of the Survey, now in its 11th year, is to provide insight into the major companies and an overview of the issues and events shaping the industry. This year’s Survey summarizes the 2007 publicly available year-over-year financial information of the PwC Top 100, the 100 largest forest, paper and packaging (FPP) companies in the world, ranked by sales revenue.
Leaders’ Message
Recent PwC thought leadership — the 2008 editions of CEO Perspectives and Branching Out respectively — highlighted how the world in which FPP companies operate is changing dramatically. As we have sought to stress, these changes are bringing new opportunities to the industry. In the meantime, the downsides from these changes are compounding the industry’s weak financial performance, as this Survey shows.
The Survey also includes a summary of our 21st Annual Global Forest & Paper Industry Conference held in May 2008 in Vancouver, Canada. The conference drew more than 500 executives from around the globe, engaging them in dialogue about the challenges and opportunities facing the industry. More details can be found starting on page 28, and
on our website: www.pwc.com/forestconf08. We look forward to hosting the 22nd Annual Conference in Vancouver on 14 May, 2009.
PricewaterhouseCoopers’ thought leadership and depth of industry knowledge have enabled us to not only satisfy our clients’ business needs but to surpass their expectations by offering proactive solutions to help them identify and capitalize on trends. For more information about the services offered by the PricewaterhouseCoopers’ Global Forest, Paper & Packaging Industry Practice, please contact one of the PwC professionals in your region listed inside the back cover of this Survey. We hope you enjoy the 2008 edition of the PricewaterhouseCoopers Global Forest, Paper & Packaging Industry Survey.
Clive SucklingGlobal Leader, Forest, Paper & Packaging PricewaterhouseCoopers
Table 1. PwC Top 100 Companies(US $ billions1)
2007 2006 2005 2004 2003
Turnover $343.3 $317.3 $335.9 $328.2 $304.3
Operating profit 24.7 23.5 21.7 24.5 19.5
Net income 13.5 11.9 9.2 13.7 7.8
Return on equity (%) 7.9% 6.5% 6.2% 9.4% 7.2%
Return on capital employed 2 (%) 4.8% 4.6% 4.9% 5.3% 4.2%
Capital expenditures 25.1 21.9 20.6 19.3 16.0
Depreciation 20.3 20.6 21.4 21.9 20.5
Cash flow from operations 30.6 34.8 29.9 35.7 28.7
† Inclusive of paper packaging only 1. Throughout the Survey all currency references are in US dollars unless otherwise noted. 2. Refer to the Methodology section on page 26 for the definition of return on capital employed.
Craig CampbellPartner, Performance Improvement, Forest, Paper & PackagingPricewaterhouseCoopers
Source: PricewaterhouseCoopers LLP
Highlights PwC Top 100
PricewaterhouseCoopers’ Global Forest, Paper & Packaging Industry Survey: 2008 Edition – Survey of 2007 Results2

© 2008 PricewaterhouseCoopers LLP 3
The performance of the PwC Top 100 is strongly influenced by the general global economic environment. While the first half of 2007 showed strong global economic growth led by the emerging markets, the global economy slowed in the second half, triggered by the credit crisis in the US. Moving into 2008, global growth predictions are being revised down as the turmoil in financial markets spills over into the broader economy.
Real GDP growth rates for the full year in the US, Western Europe and Japan were down on 2006 (2.2%, 2.8% and 2.1% in 2007, respectively). Emerging markets were more resilient and continued to expand strongly led by China and India. In 2007, strong GDP growth continued in China (11.4%), India (9.2%), Russia (8.1%), and Latin America (5.6%). These markets have benefited from robust domestic demand.
Of the many economic factors which have affected the industry, those with the highest impact are continued depreciation of the US dollar and increasing energy, transportation and raw material costs (particularly fibre). In addition to the macro-economic factors, climate change is another key factor starting to shape the industry.
Emerging markets continue to attract significant investment in new capacity, at the same time that capacity in traditional regions adjusts down. Deal activity remained buoyant in 2007 (and even into early 2008), with North America continuing to take the lead in industry restructuring transactions.
Private equity, again with a dominant focus on North America, continued to play a lead in this restructuring. New entrants, notably Brookfield Asset Management in North America and New Zealander Graeme Hart’s Rank Group, have been actively involved in the deals transacted during 2007.
In this Survey, we comment on the impact of these global factors on the PwC Top 100.
PricewaterhouseCoopers’ Global Forest, Paper & Packaging Industry Survey: 2008 Edition – Survey of 2007 Results4
Fibre Supply (Virgin and Recovered)
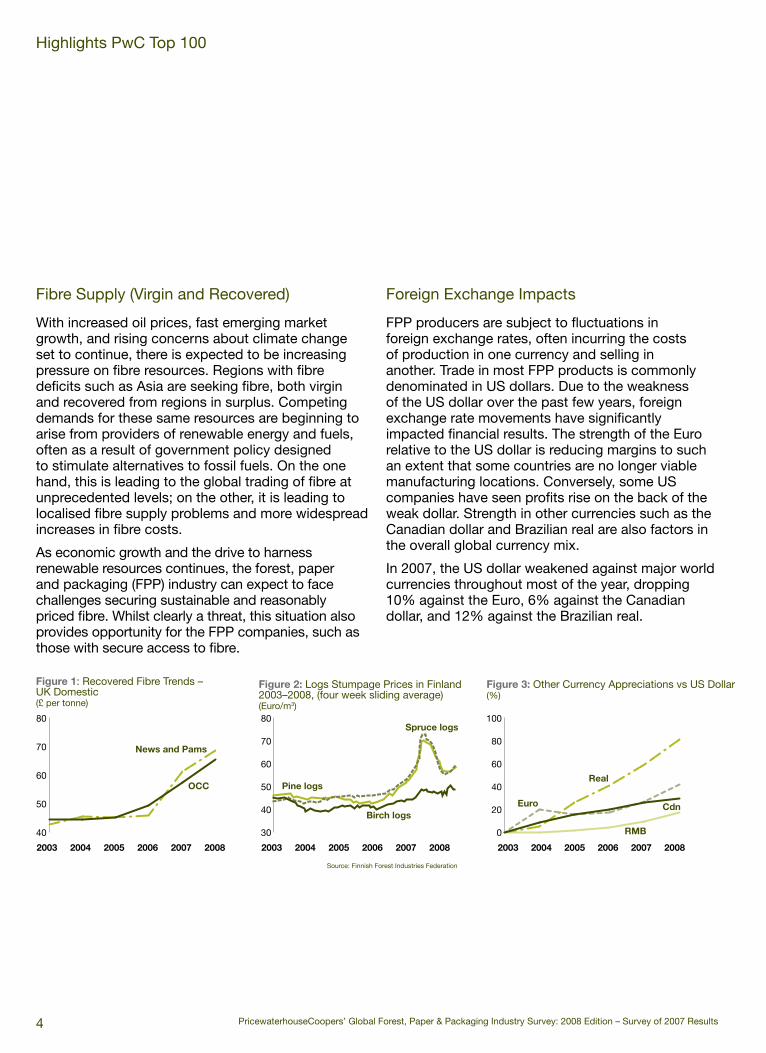
With increased oil prices, fast emerging market growth, and rising concerns about climate change set to continue, there is expected to be increasing pressure on fibre resources. Regions with fibre deficits such as Asia are seeking fibre, both virgin and recovered from regions in surplus. Competing demands for these same resources are beginning to arise from providers of renewable energy and fuels, often as a result of government policy designed to stimulate alternatives to fossil fuels. On the one hand, this is leading to the global trading of fibre at unprecedented levels; on the other, it is leading to localised fibre supply problems and more widespread increases in fibre costs.
As economic growth and the drive to harness renewable resources continues, the forest, paper and packaging (FPP) industry can expect to face challenges securing sustainable and reasonably priced fibre. Whilst clearly a threat, this situation also provides opportunity for the FPP companies, such as those with secure access to fibre.
Foreign Exchange Impacts
FPP producers are subject to fluctuations in foreign exchange rates, often incurring the costs of production in one currency and selling in another. Trade in most FPP products is commonly denominated in US dollars. Due to the weakness of the US dollar over the past few years, foreign exchange rate movements have significantly impacted financial results. The strength of the Euro relative to the US dollar is reducing margins to such an extent that some countries are no longer viable manufacturing locations. Conversely, some US companies have seen profits rise on the back of the weak dollar. Strength in other currencies such as the Canadian dollar and Brazilian real are also factors in the overall global currency mix.
In 2007, the US dollar weakened against major world currencies throughout most of the year, dropping 10% against the Euro, 6% against the Canadian dollar, and 12% against the Brazilian real.
Highlights PwC Top 100
Figure 1: Recovered Fibre Trends – UK Domestic(£ per tonne)
Figure 2: Logs Stumpage Prices in Finland 2003–2008, (four week sliding average)(Euro/m3)
Figure 3: Other Currency Appreciations vs US Dollar(%)
0
20
40
60
80
100
Euro
RMB
Real
Cdn
2003 2004 2005 2006 2007 2008
40
50
60
70
80
2003 2004 2005 2006 2007 2008
OCC
News and Pams
30
40
50
60
70
80
2003 2004 2005 2006 2007 2008
Pine logs
Spruce logs
Birch logs
Source: Finnish Forest Industries Federation

© 2008 PricewaterhouseCoopers LLP 5
Figure 4: Crude Oil Prices (Texas light sweet) (US $/barrel)
Figure 5: Electricity Prices Index (Dayahead)(US $/mwh)
Energy Costs
Energy prices continued their upward trend and rose ever more abruptly in early 2008. Rapid economic expansion in China and other newly developing countries has contributed to rapid growth in energy demand, leading to significant increases in the price of oil, coal and other fuels. The price of oil, as measured by the average world crude price, increased by more than 15%, year-over-year, in US dollar terms and prices have spiralled into 2008. As high energy users, FPP companies continue to be hit, although the impact is uneven. The industry is already a significant user of renewable energy sources, notably forest biomass, and has continued to switch into renewables, as well as reduce energy consumption as primary energy costs have risen. These moves have helped mitigate the impact of rising energy costs to some extent, with modern pulp and integrated paper makers generally in relatively favoured positions.
Transportation Costs
Rising oil prices have increased the cost of transportation around the globe, increasing the pressure on the FPP industry, which is heavily reliant upon road, rail and shipping for inbound and outbound logistics. This problem has been compounded by capacity shortages in the world’s ports. Manufacturers in North America have seen their costs of shipping increase significantly over the past five years. This cost is expected to continue to increase with the soaring oil prices, causing transportation costs to be a major headache for planners. Companies are looking at their operational configurations and transport costs will impact upon current trade flows in forest products.
20
40
60
80
100
120
ChinaEurope
Venezuela
US
2003 2004 2005 2006 200730
60
90
120
150
2005 2006 2007
US
UK
Nordic Pool

Emerging Market Impacts
The emerging markets remain the growth driver in the FPP sector. With the suboptimal returns realised by traditional regions (North America, Western Europe, and Japan) for several years, capital continues to migrate to the higher growth and higher return regions of the emerging markets. This influences capital allocation decisions by producers, and equity investment decisions by portfolio managers. The key emerging markets for FPP are Asia, notably China, Latin America and Russia. On the supply side, competitive advantage continues to shift towards South America, even though the strength
of local currencies has eroded some of their cost advantages, and to a lesser extent other low-cost fibre producing regions. On the demand side, growth in the industry continues to be driven by the emerging markets, especially China.
The number of companies from the emerging markets in the PwC Top 100 continues to increase. In 2007, Chinese companies (Sino Forest Corporation, Shandong Huatai and Lee & Mann Paper) and the first Indian company (Ballarpur Industries) joined the PwC Top 100. With the rapid growth in Asia, an increasing number will be joining the list in the coming years.
Highlights PwC Top 100
PricewaterhouseCoopers’ Global Forest, Paper & Packaging Industry Survey: 2008 Edition – Survey of 2007 Results6

© 2008 PricewaterhouseCoopers LLP 7
Sales and Income
The total sales of the PwC Top 100 were US $343.3 billion in 2007, up from $317.3 billion in 2006. The 20 largest companies accounted for nearly 60% of total sales. Operating income of $24.7 billion represented a modest increase of 5% compared to prior year. Net income increased from $11.9 billion to $13.5 billion in 2007. In addition to some improvement in operating earnings, net income received a boost from gains on asset disposals, notably from Temple-Inland’s $2 billion gain on the sale of its timberlands. Cash flow from operations totaled $30.6 billion in 2007, down from $34.8 billion in 2006.
Figure 6: Sales(US $ billions)
Figure 7: Net Income(US $ billions)
Climate Change
Climate change has become the great environmental challenge for the 21st century. The global debate on climate change is focusing on energy and forests. When managed sustainably, forests can reduce atmospheric CO2 levels, soil degradation and deforestation which all contribute to climate change.
Governments around the world have started to impose rules and regulations to reduce carbon emissions. Regulation of carbon emissions and future cost implications will directly affect the global competitiveness and development of this sector.
While governments are looking for the best mechanism to curb greenhouse gas emissions by implementing carbon levies, via regulatory and fiscal measures, FPP producers are searching for the best options to reduce their soaring energy costs. Many FPP manufacturers are finding that wood fuels are the cheapest alternative to reduce both production costs and carbon emissions.
0 30 60 90 120 150
US
Japan
Canada
Europe
Other
Emerging Markets
20072006
-1 0 1 2 3 4 5 6
US
Japan
Canada
Europe
Other
Emerging Markets
20072006
Source: PricewaterhouseCoopers LLP Source: PricewaterhouseCoopers LLP

PricewaterhouseCoopers’ Global Forest, Paper & Packaging Industry Survey: 2008 Edition – Survey of 2007 Results8
Return on Capital Employed
The average ROCE (return on capital employed) of the PwC Top 100 stayed flat moving from 4.6% to 4.8% in 2007. Thirteen companies earned a return of 10% or more in 2007 (2006: 19 companies). Although the PwC Top 100 continues to be dominated by companies from the traditional regions, six of the top 13 producers, based on ROCE, are from the emerging markets — three in Latin America and three in China.
Despite some slippage in 2007, the ROCEs for Latin American companies at 7.8% (2006: 9.3%) continue to be the highest as a region. However, emerging Asia’s ROCE excluding companies from Taiwan and Korea would be the highest with ROCE at 9.9% (2006: 10.1%).
Highlights PwC Top 100
Figure 8: Highest Return on Capital Employed(%)
Figure 9: Highest Earnings(US $ millions)
Figure 10: Largest Losses(US $ millions)
Setra GroupSweden
Kimberly-ClarkMexico
Kimberly-ClarkUS
Lee & Mann PaperChina
Nine DragonsChina
0 5 10 15 20 25 30
20072006
Kimberly-ClarkUS
Temple InlandUS
VotorantimBrazil
International PaperUS
Svenska CellulosaSweden
0 500 1,000 1,500 2,000
20072006
AbitibiBowaterCanada
CanforCanada
Stora EnsoFinland
MetsäliittoFinland
Louisiana PacificUS
(500) 0 500 1,000
20072006
Source: PricewaterhouseCoopers LLP Source: PricewaterhouseCoopers LLP
Source: PricewaterhouseCoopers LLP

Table 2: ROCE Leaders – Greater than 10%
Company Name Country 2007
ROCE 2006
Setra Group 1 Sweden 25.2% 12.3%
Kimberly-Clark Mexico Mexico 20.3% 17.7%
Kimberly-Clark US 15.2% 12.1%
Lee & Mann Paper Mfg 1 China 15.0% 12.6%
Nine Dragons Paper Holdings China 13.0% 14.2%
Sino Forest Corporation 1, 2 China (Canada) 12.6% 12.4%
Arauco Chile 11.9% 11.2%
Rayonier US 11.4% 12.5%
The Pack Japan 11.0% 10.4%
Votorantim Cellulose Brazil 10.9% 11.9%
Sonoco US 10.5% 9.8%
Packaging Corp of America US 10.4% 8.5%
Portucel Portugal 10.2% 7.4%
Notes:
1. New entrant to Top 100 2. Sino Forest is incorporated and listed in Canada, but its operations are based in China
9© 2008 PricewaterhouseCoopers LLP
Source: PricewaterhouseCoopers LLP

PricewaterhouseCoopers’ Global Forest, Paper & Packaging Industry Survey: 2008 Edition – Survey of 2007 Results10
Reinvestment Ratio
Reinvestment ratio, calculated as capital investment as a percentage of depreciation, measures the extent that capital investment is replacing aging assets. In broad terms, when the ratio is in excess of 1.0, it indicates an expansion of capacity. For the PwC Top 100 as a whole, the reinvestment ratio has been less than 1.0 for many years.
However, in 2007, with the ratio at 1.2, this trend was bucked mainly due to the increasing weight of Chinese and Latin American companies in the PwC Top 100, where the ratios were 3.08 and 2.84 respectively. This demonstrates the high investment taking place in the emerging markets. At the other extreme, Canada’s reinvestment ratio was only 0.4 in 2007.
Highlights PwC Top 100
Figure 11: Reinvestment ratio
2003 2004 2005 2006 2007
United States Europe Canada Japan
China South America Other
0.0
0.5
1.0
1.5
2.0
2.5
3.0
3.5
4.0
Source: PricewaterhouseCoopers LLP

11© 2008 PricewaterhouseCoopers LLP

PricewaterhouseCoopers’ Global Forest, Paper & Packaging Industry Survey: 2008 Edition – Survey of 2007 Results12
PwC Top 100Table 3: Top 100 Global Forest, Paper & Packaging Industry Companies(US $ millions)
1 1 International Paper US $21,890 $21,995 $1,168 $1,050 5.7% 5.3%2 3 Stora Enso 3 Finland 18,322 16,274 (291) 734 3.5% 7.0%3 4 Kimberly-Clark US 18,266 16,746 1,822 1,500 15.2% 12.1%4 5 Svenska Cellulosa Sweden 15,675 13,796 1,056 739 5.7% 6.0%5 2 Weyerhaeuser 3, 4 US 13,949 15,336 462 142 2.5% 1.9%6 6 UPM Finland 13,748 12,588 111 427 3.5% 3.8%7 9 Oji Paper Japan 10,758 10,439 146 181 2.3% 3.2%8 8 Metsaliitto 3 Finland 10,507 10,362 (12) (31) 1.4% 0.7%9 10 Nippon Unipac Japan 9,990 9,908 195 148 2.1% 1.7%10 11 Smurfit Kappa Ireland 9,963 8,833 202 (213) 8.0% 4.0%11 12 Mondi Group 10 UK/South Africa 8,589 7,223 319 98 5.6% 3.2%12 13 Smurfit-Stone US 7,420 7,157 (103) (59) 2.0% 2.1%13 14 MeadWestvaco US 6,906 6,530 285 93 4.8% 3.7%14 16 PaperlinX Australia 6,551 5,574 67 49 5.0% 3.8%15 26 Domtar 3 Canada 5,947 3,306 70 (609) 4.5% 3.5%16 19 Sequana Capital France 5,928 4,998 195 1,203 4.3% 0.9%17 15 Boise Cascade US 5,413 5,780 128 72 8.2% 6.3%18 20 Sappi South Africa 5,304 4,941 202 (4) 6.1% 2.9%19 21 Norske Skog Norway 4,637 4,495 (106) (438) 7.1% 2.1%20 29 Sumitomo Forestry 5 Japan 4,257 3,403 45 19 2.2% 1.2%21 24 Sonoco US 4,040 3,657 214 182 10.5% 9.8%22 17 Temple-Inland 3, 6 US 3,926 4,185 1,305 468 0.7% 1.5%23 23 AbitibiBowater Canada 3,876 3,530 (490) (138) -4.0% 1.9%24 32 Cascades Canada 3,674 3,001 89 3 4.6% 3.5%25 36 Arauco Chile 3,576 2,850 697 622 11.9% 11.3%26 31 DS Smith UK 3,534 3,046 121 8 6.8% 10.2%27 27 Daio Paper Japan 3,520 3,460 90 80 3.2% 3.2%28 28 Rengo Japan 3,500 3,459 80 112 2.5% 3.6%29 33 Cartiere Burgo Italy 3,263 2,991 18 27 0.5% 2.1%30 41 CMPC Chile 3,227 2,260 502 205 8.3% 4.3%31 35 West Fraser Timber Canada 3,100 2,933 (32) 351 -0.4% 4.3%32 30 Canfor Canada 3,063 3,389 (337) 416 -3.0% -0.1%33 38 Holmen Sweden 2,836 2,529 223 198 9.9% 6.4%34 47 Sonae Industria Portugal 2,830 2,134 108 40 8.6% 1.9%35 44 Sodra Sweden 2,634 2,161 202 172 9.8% 10.5%36 34 Tembec 3 Canada 2,571 2,660 (46) (258) -0.1% -2.7%37 40 Unicharm Japan 2,566 2,325 128 131 8.8% 10.5%38 37 Universal Forest Products US 2,513 2,665 21 70 4.9% 11.2%39 55 Pfleiderer Germany 2,467 1,778 79 105 8.2% 7.8%40 39 Graphic Packaging 3 US 2,421 2,321 (75) (101) 3.1% 1.1%41 49 Ahlstrom Finland 2,413 2,009 1 72 1.3% 5.1%42 52 Mayr-Melnhof Karton Austria 2,380 1,900 160 133 8.6% 9.2%43 43 Packaging Corp of America US 2,317 2,187 170 125 10.4% 8.5%44 46 Rock-Tenn US 2,316 2,138 82 29 7.8% 4.8%45 48 NewPage Corporation US 2,168 2,038 (22) (32) 3.1% 4.8%46 54 The Lecta Group UK 2,082 1,810 (42) 22 0.8% 3.2%47 50 Mitsubishi Paper Japan 2,076 1,965 62 62 1.8% 3.8%48 64 Shandong Chenming China 2,001 1,477 128 75 6.3% 6.5%49 51 Myllykoski Finland 1,980 1,925 1 (48) 1.6% 4.6%50 53 Kimberly-Clark Mexico Mexico 1,976 1,848 343 325 20.3% 17.7%
Rank ‘07 Rank ‘06 Company Name 1 Country 10 Sales Net Income ROCE 2
2007 2006 2007 2006 2007 2006
1. All companies have December 31, 2007 year ends except those listed below:
March 31, 2007: All Japanese Companies
April 30, 2007: DS Smith
June 30, 2007: Buckeye Technologies, PaperlinX, Nine Dragons Paper, Ballarpur Industries
September 30,2007: Rock-Tenn, Sappi, Tembec
2. Return on Capital Employed is calculated as net income before unusual items, minority interest, and interest expense, on an after tax basis, divided by average total assets less average non-interest bearing current liabilities.
3. 2006 sales have been restated by the companies.
4. Weyerhaeuser and Plum Creek results exclude the Real Estate Divisions.
5. Results are reported for identifiable forest segment only. Estimates have been made to allocate company-wide expenses as required.
6. Temple Inland results includes $2.01 billion from sales of timberland.
7. New addition this year.
8. Weyerhaeuser results include income from discontinued operations.
9. Votorantim Cellulose results include $989 million gains on exchange of assets.
10. Country's head office is used for grouping (i.e Mondi has dual listings and head offices in the UK and South Africa, and Sino Forest’s head office is in Canada, while all its operations are based in China).
Notes
© 2008 PricewaterhouseCoopers LLP 13
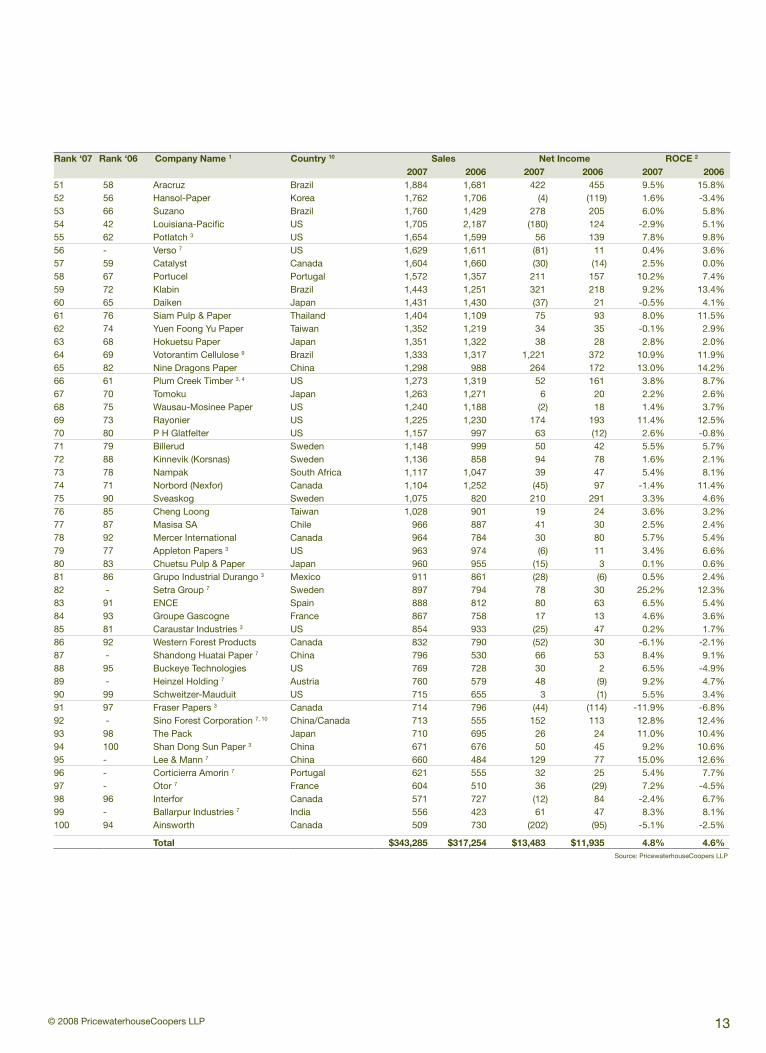
51 58 Aracruz Brazil 1,884 1,681 422 455 9.5% 15.8%52 56 Hansol-Paper Korea 1,762 1,706 (4) (119) 1.6% -3.4%53 66 Suzano Brazil 1,760 1,429 278 205 6.0% 5.8%54 42 Louisiana-Pacific US 1,705 2,187 (180) 124 -2.9% 5.1%55 62 Potlatch 3 US 1,654 1,599 56 139 7.8% 9.8%56 - Verso 7 US 1,629 1,611 (81) 11 0.4% 3.6%57 59 Catalyst Canada 1,604 1,660 (30) (14) 2.5% 0.0%58 67 Portucel Portugal 1,572 1,357 211 157 10.2% 7.4%59 72 Klabin Brazil 1,443 1,251 321 218 9.2% 13.4%60 65 Daiken Japan 1,431 1,430 (37) 21 -0.5% 4.1%61 76 Siam Pulp & Paper Thailand 1,404 1,109 75 93 8.0% 11.5%62 74 Yuen Foong Yu Paper Taiwan 1,352 1,219 34 35 -0.1% 2.9%63 68 Hokuetsu Paper Japan 1,351 1,322 38 28 2.8% 2.0%64 69 Votorantim Cellulose 9 Brazil 1,333 1,317 1,221 372 10.9% 11.9%65 82 Nine Dragons Paper China 1,298 988 264 172 13.0% 14.2%66 61 Plum Creek Timber 3, 4 US 1,273 1,319 52 161 3.8% 8.7%67 70 Tomoku Japan 1,263 1,271 6 20 2.2% 2.6%68 75 Wausau-Mosinee Paper US 1,240 1,188 (2) 18 1.4% 3.7%69 73 Rayonier US 1,225 1,230 174 193 11.4% 12.5%70 80 P H Glatfelter US 1,157 997 63 (12) 2.6% -0.8%71 79 Billerud Sweden 1,148 999 50 42 5.5% 5.7%72 88 Kinnevik (Korsnas) Sweden 1,136 858 94 78 1.6% 2.1%73 78 Nampak South Africa 1,117 1,047 39 47 5.4% 8.1%74 71 Norbord (Nexfor) Canada 1,104 1,252 (45) 97 -1.4% 11.4%75 90 Sveaskog Sweden 1,075 820 210 291 3.3% 4.6%76 85 Cheng Loong Taiwan 1,028 901 19 24 3.6% 3.2%77 87 Masisa SA Chile 966 887 41 30 2.5% 2.4%78 92 Mercer International Canada 964 784 30 80 5.7% 5.4%79 77 Appleton Papers 3 US 963 974 (6) 11 3.4% 6.6%80 83 Chuetsu Pulp & Paper Japan 960 955 (15) 3 0.1% 0.6%81 86 Grupo Industrial Durango 3 Mexico 911 861 (28) (6) 0.5% 2.4%82 - Setra Group 7 Sweden 897 794 78 30 25.2% 12.3%83 91 ENCE Spain 888 812 80 63 6.5% 5.4%84 93 Groupe Gascogne France 867 758 17 13 4.6% 3.6%85 81 Caraustar Industries 3 US 854 933 (25) 47 0.2% 1.7%86 92 Western Forest Products Canada 832 790 (52) 30 -6.1% -2.1%87 - Shandong Huatai Paper 7 China 796 530 66 53 8.4% 9.1%88 95 Buckeye Technologies US 769 728 30 2 6.5% -4.9%89 - Heinzel Holding 7 Austria 760 579 48 (9) 9.2% 4.7%90 99 Schweitzer-Mauduit US 715 655 3 (1) 5.5% 3.4%91 97 Fraser Papers 3 Canada 714 796 (44) (114) -11.9% -6.8%92 - Sino Forest Corporation 7, 10 China/Canada 713 555 152 113 12.8% 12.4%93 98 The Pack Japan 710 695 26 24 11.0% 10.4%94 100 Shan Dong Sun Paper 3 China 671 676 50 45 9.2% 10.6%95 - Lee & Mann 7 China 660 484 129 77 15.0% 12.6%96 - Corticierra Amorin 7 Portugal 621 555 32 25 5.4% 7.7%97 - Otor 7 France 604 510 36 (29) 7.2% -4.5%98 96 Interfor Canada 571 727 (12) 84 -2.4% 6.7%99 - Ballarpur Industries 7 India 556 423 61 47 8.3% 8.1%100 94 Ainsworth Canada 509 730 (202) (95) -5.1% -2.5%
Total $343,285 $317,254 $13,483 $11,935 4.8% 4.6%
Rank ‘07 Rank ‘06 Company Name 1 Country 10 Sales Net Income ROCE 2
2007 2006 2007 2006 2007 2006
Source: PricewaterhouseCoopers LLP

PricewaterhouseCoopers’ Global Forest, Paper & Packaging Industry Survey: 2008 Edition – Survey of 2007 Results14
United States
Economic and market overview
US GDP growth slowed markedly in 2007 to 2.1% from 3.2% in 2006, due to the subprime mortgage lending crisis, which spread into the broader financial markets and economy. As a result, the US economy is forecast to tip into a mild recession in 2008 before starting a modest recovery in 2009. The US dollar continued to slide and closed out lower against other major FPP producing currencies. This decrease encouraged exports and eased the adverse impact of the economic slowdown for some producers.
US housing starts decreased by 35%, from an average of 1.8 million units in 2006 to 1.3 million units in 2007. The housing market is undergoing a major correction, with house prices dropping by up to 10% during 2007, and house starts dropping over 50% from their peak by early 2008.
On the wood products side, the distressed housing market resulted in a weaker demand for lumber. Lumber prices averaged about 6% less in 2007 than in 2006. Sawmill operators struggled to cut their costs, which resulted in more and more mills reducing production or shutting down. The reduced lumber production also impacted the availability of wood fibre to the pulp industry.
The downward trend in newspaper readership and advertising, and the substitution by alternative media, has led to consumption falling 10% from 2006. Despite capacity reduction, prices trended down, finishing the year 11% below 2006 prices. Additional capacity closures in 2008 led by AbitibiBowater are projected to improve operating rates.
Profitability and returns were generally better than average in the packaging and industrial paper sector. Despite increases in input costs, ahead of sales prices, this improvement has been attributed to export opportunities and operational efficiencies, with the direct or indirect beneficial influence of Private Equity (PE) ownership also being cited as a factor.
By 2007 year end, pulp prices were close to their historic peak in 1995. NBSK Pulp prices were up 17% year-over-year. This price gain reflected global trends and restricted domestic supplies as a result of a decrease in supply of fibre from lumber producers and notably the closure of Pope & Talbot’s West Coast pulp mills, with 820,000 tonnes of capacity.
On the M&A front, deal activity was up in 2007, with Private Equity once again being active. Inevitably, if International Paper’s acquisition of Weyerhaeuser’s packaging assets is excluded, deal activity has trended down in 2008. However, PE investable funds remain substantial and with asset prices falling in 2008, PE can be expected to be seeking deals again.
Results by Country/Region

© 2008 PricewaterhouseCoopers LLP 15
Financial performance
There were 24 US-based companies in the PwC Top 100 in 2007. Gone from the list are Bowater (consolidated with Abitibi), Longview Fiber (acquired by Brookfield Asset Management), Pope & Talbot (in creditor protection) and Procter & Gamble (less than 50% FPP). This year, private equity-owned Verso Paper, which acquired the coated and super-calendared papers division of International Paper in August 2006, joined the list in 56th place.
The listed companies reported aggregate sales of $106.7 billion, or 31% of the total sales of the PwC Top 100. Sales remained flat compared to last year. Without M&A activity, 2007 sales would have been down from the previous year.
Net income increased from $4.2 billion to $5.5 billion. Although there were ups and downs amongst US companies, the net income line was dominated by Temple Inland’s $2 billion gain from the disposal of its 1.55 million acres of timberlands to Campbell Group. Weyerhaeuser’s net gain of $700 million on the sale of its fine paper business to Domtar was also notable. The incidence of losses increased with eight companies
reporting losses totaling $500 million in 2007 compared with five and $205 million in 2006. ROCE increased from 5.2% in 2006 to 5.5% in 2007, a return still well below the average cost of capital which is near 10%. Return on equity amounted to 10.5%, compared with 9% in 2006. Kimberly–Clark produced the strongest all round performance, with net income of $1.8 billion in 2007 (2006: $1.5 billion) and ROCE of 15.2% (2006: 12.1%). Rayonier, a timberland owner and specialty fibre producer, was the next highest performer with ROCE of 11.4% (2006: 12.5%).
Table 4: Top US Forest, Paper & Packaging Companies(US $ millions)
International Paper $21,890 $21,995 $1,168 $1,050 5.7% 5.3%
Kimberly-Clark 18,266 16,746 1,822 1,500 15.2% 12.1%
Weyerhaeuser 13,949 15,336 462 142 2.5% 1.9%
Smurfit-Stone 7,420 7,157 (103) (59) 2.0% 2.1%
MeadWestvaco 6,906 6,530 285 93 4.8% 3.7%
Boise Cascade 5,413 5,780 128 72 8.2% 6.3%
Sonoco 4,040 3,657 214 182 10.5% 9.8%
Temple-Inland 3,926 4,185 1,305 468 0.7% 5.2%
Universal Forest Products 2,513 2,665 21 70 4.9% 11.2%
Graphic Packaging 2,421 2,321 (75) (101) 3.1% 1.1%
Packaging Corp of America 2,317 2,187 170 125 10.4% 8.5%
Rock-Tenn 2,316 2,138 82 29 7.8% 4.8%
NewPage Corporation 2,168 2,038 (22) (32) 3.1% 4.8%
Louisiana-Pacific 1,705 2,187 (180) 124 -2.9% 5.1%
Potlatch 1,654 1,599 56 139 7.8% 9.8%
Verso 1,629 1,611 (81) 11 0.4% 3.6%
Plum Creek Timber Co. 1,273 1,319 52 161 3.8% 8.7%
Wausau-Mosinee Paper 1,240 1,188 (2) 18 1.4% 3.7%
Rayonier 1,225 1,230 174 193 11.4% 12.5%
P H Glatfelter 1,157 997 63 (12) 2.6% -0.8%
Appleton Papers 963 974 (6) 11 3.4% 6.6%
Caraustar Industries 854 933 (25) 47 0.2% 1.7%
Buckeye Technologies 769 728 30 2 6.5% -4.9%
Schweitzer-Mauduit 715 655 3 (1) 5.5% 3.4%
Total $106,729 $106,156 $5,541 $4,232 5.5% 5.2%
Company Name Sales Net Income ROCE 2007 2006 2007 2006 2007 2006
Source: PricewaterhouseCoopers LLP

PricewaterhouseCoopers’ Global Forest, Paper & Packaging Industry Survey: 2008 Edition – Survey of 2007 Results16
Western Europe
Economic and market overview
GDP growth in Western Europe was reasonably strong at 2.8% in 2007. Over the course of the year, growth was driven mainly by domestic demand with both consumer spending and business investment performing well in most markets. However, the subprime mortgage crisis in the US played a role in tightening monetary conditions in the Western Europe towards the end of 2007.
Total paper consumption in Western Europe was up slightly in 2007. According to the Confederation of European Paper Industries (CEPI), paper production reached 102.5 million tonnes in 2007, up 0.4% from 2006. The picture on price movements was uneven across grades, although the common feature was an unrelenting increase in input costs. Increases were achieved in paperboard and uncoated fine paper, but in magazine grades, increases remained elusive. Capacity reductions in magazine grades brought better prospects going into 2008 for price increases; however in newsprint, sluggish demand, over capacity and North American imports caused prices to fall in 2007.
Overall, the need to adjust supply to a mature demand environment remains vital if stronger pricing fundamentals are to be achieved; this requires consolidation to start the process. Meantime, the one constant seems to be an increase in input costs (fibre, energy and chemicals), all directly or indirectly influenced by energy (policy and prices) or special factors, such as the Russian log export duties.
The weak US dollar has put further pressure on the European paper industry. The US dollar declined 10% against the Euro during 2007 and has continued to fall in 2008. For the European pulp and paper industry, the weaker dollar has caused exports to decrease, and imports, such as newsprint, to become more attractive.
Deal activity picked up in 2007; however, discounting the acquisition of SIG Holding (Switzerland) by Graham Hart’s Rank Group for $2.3 billion, deal values remained low. The main story remains the lack of consolidation deals and the lack of any decisive moves by private equity.
Turmoil in the global financial markets is expected to have broad negative implications on the region. GDP growth in Western Europe in 2008 is forecast to slow to well below trend to 1.5 % as the stresses in financial markets spread to affect consumer spending and investment growth and the outlook for 2009 is also subdued. This is already making for tough conditions for European FPP producers in 2008.
Financial performance
There were 28 European companies in the PwC Top 100 in 2007, including four new entrants: Setra Group (Sweden) in wood products, Heinzel Holding (Austria) in pulp, Corticierra Amorin (Portugal) in cork and Otor (France) in packaging. Sales of the European companies increased from $109 billion to $123 billion. For the first time, the aggregate sales of European companies were higher than US companies. This mainly reflected Euro appreciation (10%) against the US dollar.
Results by Country/Region
© 2008 PricewaterhouseCoopers LLP 17
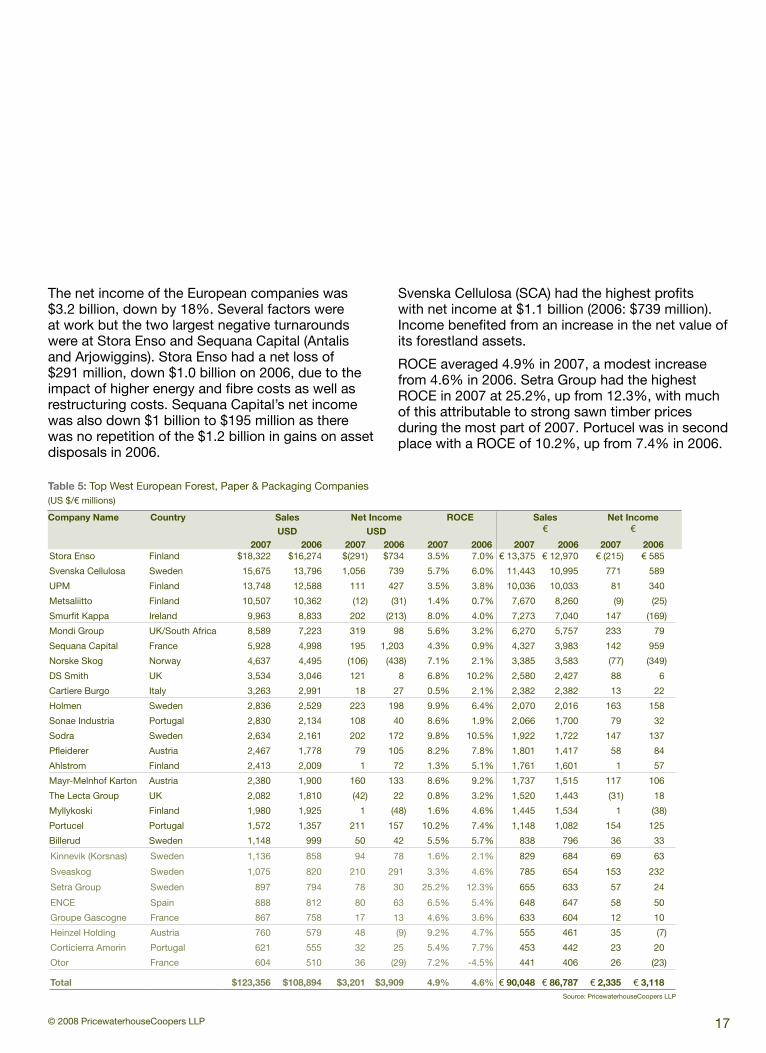
Stora Enso Finland $18,322 $16,274 $(291) $734 3.5% 7.0% € 13,375 € 12,970 € (215) € 585
Svenska Cellulosa Sweden 15,675 13,796 1,056 739 5.7% 6.0% 11,443 10,995 771 589
UPM Finland 13,748 12,588 111 427 3.5% 3.8% 10,036 10,033 81 340
Metsaliitto Finland 10,507 10,362 (12) (31) 1.4% 0.7% 7,670 8,260 (9) (25)
Smurfit Kappa Ireland 9,963 8,833 202 (213) 8.0% 4.0% 7,273 7,040 147 (169)
Mondi Group UK/South Africa 8,589 7,223 319 98 5.6% 3.2% 6,270 5,757 233 79
Sequana Capital France 5,928 4,998 195 1,203 4.3% 0.9% 4,327 3,983 142 959
Norske Skog Norway 4,637 4,495 (106) (438) 7.1% 2.1% 3,385 3,583 (77) (349)
DS Smith UK 3,534 3,046 121 8 6.8% 10.2% 2,580 2,427 88 6
Cartiere Burgo Italy 3,263 2,991 18 27 0.5% 2.1% 2,382 2,382 13 22
Holmen Sweden 2,836 2,529 223 198 9.9% 6.4% 2,070 2,016 163 158
Sonae Industria Portugal 2,830 2,134 108 40 8.6% 1.9% 2,066 1,700 79 32
Sodra Sweden 2,634 2,161 202 172 9.8% 10.5% 1,922 1,722 147 137
Pfleiderer Austria 2,467 1,778 79 105 8.2% 7.8% 1,801 1,417 58 84
Ahlstrom Finland 2,413 2,009 1 72 1.3% 5.1% 1,761 1,601 1 57
Mayr-Melnhof Karton Austria 2,380 1,900 160 133 8.6% 9.2% 1,737 1,515 117 106
The Lecta Group UK 2,082 1,810 (42) 22 0.8% 3.2% 1,520 1,443 (31) 18
Myllykoski Finland 1,980 1,925 1 (48) 1.6% 4.6% 1,445 1,534 1 (38)
Portucel Portugal 1,572 1,357 211 157 10.2% 7.4% 1,148 1,082 154 125
Billerud Sweden 1,148 999 50 42 5.5% 5.7% 838 796 36 33
Kinnevik (Korsnas) Sweden 1,136 858 94 78 1.6% 2.1% 829 684 69 63
Sveaskog Sweden 1,075 820 210 291 3.3% 4.6% 785 654 153 232
Setra Group Sweden 897 794 78 30 25.2% 12.3% 655 633 57 24
ENCE Spain 888 812 80 63 6.5% 5.4% 648 647 58 50
Groupe Gascogne France 867 758 17 13 4.6% 3.6% 633 604 12 10
Heinzel Holding Austria 760 579 48 (9) 9.2% 4.7% 555 461 35 (7)
Corticierra Amorin Portugal 621 555 32 25 5.4% 7.7% 453 442 23 20
Otor France 604 510 36 (29) 7.2% -4.5% 441 406 26 (23)
Total $123,356 $108,894 $3,201 $3,909 4.9% 4.6% € 90,048 € 86,787 € 2,335 € 3,118
Company Name Country Sales Net Income ROCE Sales Net Income
USD USD € €
2007 2006 2007 2006 2007 2006 2007 2006 2007 2006
The net income of the European companies was $3.2 billion, down by 18%. Several factors were at work but the two largest negative turnarounds were at Stora Enso and Sequana Capital (Antalis and Arjowiggins). Stora Enso had a net loss of $291 million, down $1.0 billion on 2006, due to the impact of higher energy and fibre costs as well as restructuring costs. Sequana Capital’s net income was also down $1 billion to $195 million as there was no repetition of the $1.2 billion in gains on asset disposals in 2006.
Svenska Cellulosa (SCA) had the highest profits with net income at $1.1 billion (2006: $739 million). Income benefited from an increase in the net value of its forestland assets.
ROCE averaged 4.9% in 2007, a modest increase from 4.6% in 2006. Setra Group had the highest ROCE in 2007 at 25.2%, up from 12.3%, with much of this attributable to strong sawn timber prices during the most part of 2007. Portucel was in second place with a ROCE of 10.2%, up from 7.4% in 2006.
Table 5: Top West European Forest, Paper & Packaging Companies(US $/€ millions)
Source: PricewaterhouseCoopers LLP

PricewaterhouseCoopers’ Global Forest, Paper & Packaging Industry Survey: 2008 Edition – Survey of 2007 Results18
Domtar $5,947 $3,306 $70 $(609) 4.5% 3.5%
AbitibiBowater 3,876 3,530 (490) (138) -4.0% 1.9%
Cascades 3,674 3,001 89 3 4.6% 3.5%
West Fraser Timber 3,100 2,933 (32) 351 -0.4% 4.3%
Canfor 3,063 3,389 (337) 416 -3.0% -0.1%
Tembec 2,571 2,660 (46) (258) -0.1% -2.7%
Catalyst 1,604 1,660 (30) (14) 2.5% 0.0%
Norbord 1,104 1,252 (45) 97 -1.4% 11.4%
Mercer International 964 784 30 80 5.7% 5.4%
Western Forest Products 832 790 (52) 30 -6.1% -2.1%
Fraser Papers 714 796 (44) (114) -11.9% -6.8%
Interfor 571 727 (12) 84 -2.4% 6.7%
Ainsworth 509 730 (202) (95) -5.1% -2.5%
Total $28,529 $25,558 $(1,101) $(167) -0.1% 2.0%
Canada
2007 was a challenging year for Canadian FPP companies. The total sales of the 13 Canadian companies included in the Top 100 grew from $26 billion in 2006 to $29 billion in 2007 and accounted for 9% of the total sales of the Top 100. This increase reflects acquisitions, notably the Domtar Weyerhaeuser transaction.
Net losses climbed to $1.1 billion from $166 million in 2006. Ten of the 13 companies reported losses in 2007, up from six in 2006. The heaviest losses were at AbitibiBowater and Canfor totaling $827 million. The AbitibiBowater losses were heavily impacted by facility closures. Canfor’s loss is the result of asset write downs related to lumber and panel
operations. For the 13, ROCE dropped to negative 0.1% from 2.0% in 2006, which reflects the extent of the crisis in the Canadian industry. Unsurprisingly, capital investment as a percentage of depreciation reached a record low of 0.4%.
One high spot was NBSK pulp where producers enjoyed good profits, due to the tightening of supply through closures and increasing Asian demand.
The dire financial performance of the industry contrasts with the state of the Canadian economy. GDP grew at 2.7% down from 2.8% in 2006, due in part to slower growth in the US which accounts for more than 80% of Canadian exports. The Canadian dollar increased from US $0.86
in January 2007 to a record high US $1.01 in December 2007. The strong dollar and US housing market slump have combined to hammer operating margins of Canadian producers, leading to many capacity closures.
Slower GDP growth of 1.3%–2.3% is forecast for 2008. High commodity and energy prices are projected to translate to the Canadian dollar remaining near parity with the US dollar. Hence the immediate outlook for the Canadian forest products industry remains poor, as it waits the turning point in US markets. Looking forward, the accelerated impact of mountain pine beetle infestation in British Columbia on harvest levels could tighten wood supplies, and hence prices, sooner than had been predicted.
Results by Country/Region
Table 6: Top Canadian Forest, Paper & Packaging Companies(US $ millions)
Company Name Sales Net Income ROCE 2007 2006 2007 2006 2007 2006
Source: PricewaterhouseCoopers LLP

© 2008 PricewaterhouseCoopers LLP
Japan
The top Japanese FPP companies experienced little change in performance from 2006, with a small drop in net income from the prior year and a decrease in ROCE from 3.6% to 2.5%.
Japan’s GDP grew by 2.1% in 2007, compared to 2.4% in 2006. Forecasts for 2008 project a slow down to 1.4%.
In order to survive in this mature, low-growth environment, the largest Japanese companies are optimizing their manufacturing structure by investing in new equipment and technologies with a view to reducing costs while searching for investment opportunities in the Chinese and adjacent Asian markets. To date, Japanese attempts to achieve further consolidation amongst the major players in order to achieve better returns on investment have not succeeded.
Oji Paper $10,758 $10,439 $146 $181 2.3% 3.2%
Nippon Unipac 9,990 9,908 195 148 2.1% 1.7%
Daio Paper 4,257 3,403 45 19 2.2% 1.2%
Rengo 3,500 3,459 80 112 2.5% 3.6%
Sumitomo Forestry 3,520 3,460 90 80 3.2% 3.2%
Unicharm 2,566 2,325 128 131 8.8% 10.5%
Mitsubishi Paper 2,076 1,965 62 62 1.8% 3.8%
Daiken 1,431 1,430 (37) 21 -0.5% 4.1%
Hokuetsu Paper 1,351 1,322 38 28 2.8% 2.0%
Tomoku 1,263 1,271 6 20 2.2% 2.6%
Chuetsu Pulp 960 955 (15) 3 0.1% 0.6%
The Pack 710 695 26 24 11.0% 10.4%
Total $42,382 $40,632 $764 $829 2.5% 3.6%
Table 7: Top Japanese Forest, Paper & Packaging Companies(US $ millions)
Company Name Sales Net Income ROCE 2007 2006 2007 2006 2007 2006
19
Source: PricewaterhouseCoopers LLP

PricewaterhouseCoopers’ Global Forest, Paper & Packaging Industry Survey: 2008 Edition – Survey of 2007 Results20
Latin America
Economic and market overview
Growth in South American countries has surpassed that in traditional economies. South American and Mexican GDP growth averaged 5.6% during 2007. The outlook for Latin America remains good with forecast GDP growth of 4.3% in 2008 and 3.6% in 2009. Consumer spending growth decelerated slightly in Brazil but remained a key contributor to growth. The Brazilian Central Bank started to cut interest rates to their lowest point in many years at 11.25% at the end of 2007, a trend that has continued into 2008. The impact of the credit crisis in the Northern Hemisphere is having an effect, but so far at a more muted level.
Latin America’s FPP sector experienced continued growth during 2007 due to the high supply of fibre and short harvest cycles. South America has seen significant investment by both local and international companies and is quickly becoming the world’s fibre basket, notably for Europe and Asia. New capacity continues to be built, with Brazil continuing as the largest destination for major investment in plantation-based forestry concentrated in the pulp sector.
Results by Country/Region
Table 8: Top Latin American Forest, Paper & Packaging Companies(US $ millions)
Company Name Country Sales Net Income ROCE 2007 2006 2007 2006 2007 2006
Arauco Chile $3,576 $2,850 $697 $622 11.9% 11.3%
CMPC Chile 3,227 2,260 502 205 8.3% 4.3%
Kimberly-Clark Mexico Mexico 1,976 1,848 343 325 20.3% 17.7%
Aracruz Brazil 1,884 1,681 422 455 9.5% 15.8%
Suzano Brazil 1,760 1,429 278 205 6.0% 5.8%
Klabin Brazil 1,443 1,251 321 218 9.2% 13.4%
Votorantim Cellulose Brazil 1,333 1,317 1,221 372 10.9% 11.9%
Masisa SA Chile 966 887 41 30 2.5% 2.4%
Grupo Industrial Durango Mexico 911 861 (28) (6) 0.5% 2.4%
Total $17,076 $14,384 $3,797 $2,426 7.8% 9.3%Source: PricewaterhouseCoopers LLP
Financial performance
Sales of the nine Latin American producers in the PwC Top 100 rose by 18% to $17.1 billion in 2007 from $14.4 billion in 2006. This increase reflects growth and the appreciation of domestic currencies against the US dollar.
Net earnings for the nine companies were substantially higher at $3.8 billion in 2007 versus $2.4 billion in 2006. Votorantim Cellulose e Papel (VCP) recorded the highest net income at $1.2 billion compared to $372 million in 2006, with earnings boosted by net gains of $955 million from an asset swap with International Paper.
Although ROCE decreased by 1.5% from 9.3% to 7.8% in 2007, Latin America remained the best performing region compared to prior year. Kimberly-Clark Mexico had the highest ROCE in 2007 at 20.3%, up from 2006’s 17.7%. Arauco was in second place with 2007 ROCE of 11.9%, up from 11.3% in 2006. However, Aracruz’s ROCE fell to 9.5% from 15.8% in 2006, as a sharply increased
deferred income tax charge caused net income to fall combined with a near doubling of the company’s capital expenditure during the year.
The strongest improvement came from Chile’s CMPC, where sales increased by 40% and with net income more than doubling, and ROCE almost doubling in 2007 compared to prior year. The main driver for this increase has been the robust growth in its pulp division after the major increases in its market pulp capacity.
The appreciation of the Brazilian real has narrowed Brazil’s cost advantage, and reduced the operating margins of Brazilian producers since most of their production is exported. Nevertheless, with the country’s strong forest base, favorable climate, and land availability it is expected to retain its position as a major supplier of fibre. With average pulp prices reaching record highs, and the increasing demand from Asia, Europe and elsewhere, Latin American countries are expected to continue to set the pace in market pulp.
Table 8: Top Latin American Forest, Paper & Packaging Companies(US $ millions)
Arauco Chile $3,576 $2,850 $697 $622 11.9% 11.3%
CMPC Chile 3,227 2,260 502 205 8.3% 4.3%
Kimberly-Clark Mexico Mexico 1,976 1,848 343 325 20.3% 17.7%
Aracruz Brazil 1,884 1,681 422 455 9.5% 15.8%
Suzano Brazil 1,760 1,429 278 205 6.0% 5.8%
Klabin Brazil 1,443 1,251 321 218 9.2% 13.4%
Votorantim Cellulose Brazil 1,333 1,317 1,221 372 10.9% 11.9%
Masisa SA Chile 966 887 41 30 2.5% 2.4%
Grupo Industrial Durango Mexico 911 861 (28) (6) 0.5% 2.4%
Total $17,076 $14,384 $3,797 $2,426 7.8% 9.3%
21© 2008 PricewaterhouseCoopers LLP

22 PricewaterhouseCoopers’ Global Forest, Paper & Packaging Industry Survey: 2008 Edition – Survey of 2007 Results
Emerging Asia
Economic and market overview
Growth in emerging Asia remained strong in 2007. China’s GDP grew at 11%, India’s by 9%. This economic performance has made the Asia-Pacific region the strongest growth market for FPP products in the world. China continues to account for the largest share of demand for these products. Growing demand for low-cost wood products manufactured in China has increased the demand for imported foreign timber in that country.
The shortage of domestic virgin and recovered fibre in Asia, especially in China and India, is driving activities to secure long-term fibre sources. China’s own industrial plantations are being rapidly expanded as are those in neighbouring countries like Vietnam. To ensure a steady stream of fibre supply, Asian producers are also looking towards Latin and North America. Asia Pulp and Paper (APP) China acquired its first Canadian pulp mill in Meadow Lake, Saskatchewan. In early 2008,
Results by Country/Region
Table 9: Top Forest, Paper & Packaging Companies in Non-Japan Asia(US $ millions)
Shandong Chenming Hlgs. China $2,001 $1,477 $128 $75 6.3% 6.5%
Hansol-Paper Korea 1,762 1,706 (4) (119) 1.6% -3.4%
Siam Pulp & Paper Thailand 1,404 1,109 75 93 8.0% 11.5%
Yuen Foong Yu Paper Taiwan 1,352 1,219 34 35 -0.1% 2.9%
Nine Dragons Paper China 1,298 988 264 172 13.0% 14.2%
Cheng Loong Taiwan 1,028 901 19 24 3.6% 3.2%
Shandong Huatai Paper China 796 530 66 53 8.4% 9.1%
Sino Forest Corporation China (Canada) 713 555 152 113 12.8% 12.4%
Shan Dong Sun Paper China 671 676 50 45 9.2% 10.6%
Lee & Mann Paper Mfg China 660 484 129 77 15.0% 12.6%
Ballarpur Industries India 556 423 61 47 8.3% 8.1%
Total $12,241 $10,068 $974 $615 7.3% 7.4%
Company Name Country Sales Net Income ROCE 2007 2006 2007 2006 2007 2006
Source: PricewaterhouseCoopers LLP

© 2008 PricewaterhouseCoopers LLP 23
APP announced it was adding Pope & Talbot’s three western North American pulp mills (this deal subsequently fell through). Nine Dragons announced it is looking to acquire a stake in an overseas pulp processor to secure its fibre sources. At the same time, steps are being taken to enhance recovery from domestic waste paper sources to reduce dependence on imported waste paper from North America and Europe.
Exchange rate movements against the US dollar have been less marked in Asia. In China, the renminbi’s rate of appreciation against the dollar has increased appreciably since August, but its movement has been more modest in effective terms (5.6%) and the currency is judged by many economists to be substantially undervalued.
Moving forward, the strength of domestic demand in the region, combined with rising food and energy prices are contributing to a buildup of inflation pressures in those markets. Therefore, growth prospects are dependant on how resilient the region’s financial systems and economies will be to the slowdown in traditional economies.
Financial performance
Three new companies from the Emerging Asia region joined the PwC Top 100. Sino Forest Corporation joined at 92, Lee & Mann Paper at 95, and Ballarpur Industries at 99. Sino is a Canadian-listed company with substantially all of its operations and plantations in China. Lee & Mann is becoming one of the major players in the containerboard industry, and Ballarpur is a large paper producer in India.
Sales of the 11 Emerging Asian companies in the PwC Top 100 rose by nearly 22% to $12.2 billion in 2007 from $10.1 billion in 2006. Non-Japanese Asian companies in general and Chinese companies in particular are benefiting from the economic growth and the capital expenditures that occurred in prior years. The collective sales of Shandong Chenming, Nine Dragons, Shandong Huatai and Lee & Mann rose by over 30%, reflecting higher prices and an improvement in operating rates and tonnage produced. The net earnings of the 11 companies were substantially higher at $974 million in 2007 versus $615 million in 2006 due mainly to higher net income from the Chinese companies.
Emerging Asia’s ROCE, at 7.3% in 2007, remained steady with 2006, and as a region was second only to Latin America’s 7.8%. However, it should be noted that the Emerging Asia list includes three from the more developed economies of Korea and Taiwan – Hansol, Yuen Foong Yu Paper and Cheng Loong. The returns of these three companies have been consistently low. Had these three companies been excluded from the Emerging Asia list, ROCE at 9.9% for 2007 (2006: 10.1) would have exceeded Latin America.

PricewaterhouseCoopers’ Global Forest, Paper & Packaging Industry Survey: 2008 Edition – Survey of 2007 Results24
Russia
Russia has one of the fastest growing large economies in the world. Demand for paper products is being propelled by strongly growing domestic consumption. An active construction sector (new build and repair) is driving good demand for wood products. Russia has the largest untapped wood resources in the world. Accordingly, there are strong fundamentals.
However, the dominant forest and paper development for the outside world is Russia’s plan to impose stringent tariffs on unprocessed wood exports, at a time when it has risen to be the world’s largest log exporter. Prior to 1 July 2007, the duty level was 6.5% (subject to a minimum of 4 €/m3). For softwood logs, these duties were escalated to 20% and 25% from 1 July 2007 and 1 April 2008 respectively and with plans to raise to 80% (subject to a minimum of 50 €/m3) from the beginning of 2009. For birch pulpwood, the tax is delayed until 2011 when it rises from zero to 80%. The increases to date and future plans have unsettled both Russia’s neighbours that have relied on these log exports as well markets further afield.
This program of log export taxes has been driven by Russia’s desire to develop a strong domestic value added forest products industry to supply domestic and export markets. The impact, if and when fully implemented, will likely be that harvesting timber in Russia will only be economic if the logs can be processed locally.
It is too early to judge the effectiveness of these taxes in addressing their objectives. There has been some step up in investment in wood processing, but in pulp, although announcements abound, major projects have yet to be implemented. Accordingly, in the short term at least, Russian harvest levels may be reduced with a potentially serious disruptive impact on global wood supplies.
Potential foreign investors remain cautious about significant investment into Russia, despite the rapid growth in domestic demand and the export potential given factors such as infrastructure limitations, illegal logging and political concerns.
In the 2006 survey, Ilim Pulp was included in the Top 100 as the sole Russian representative, but has been omitted this year. At the time of publishing this report, financial information was not available and with the change in its operations and ownership – now 50% owned by International Paper and with its wood products business spun out – we have not made an estimate.
Results by Country/Region
© 2008 PricewaterhouseCoopers LLP 25
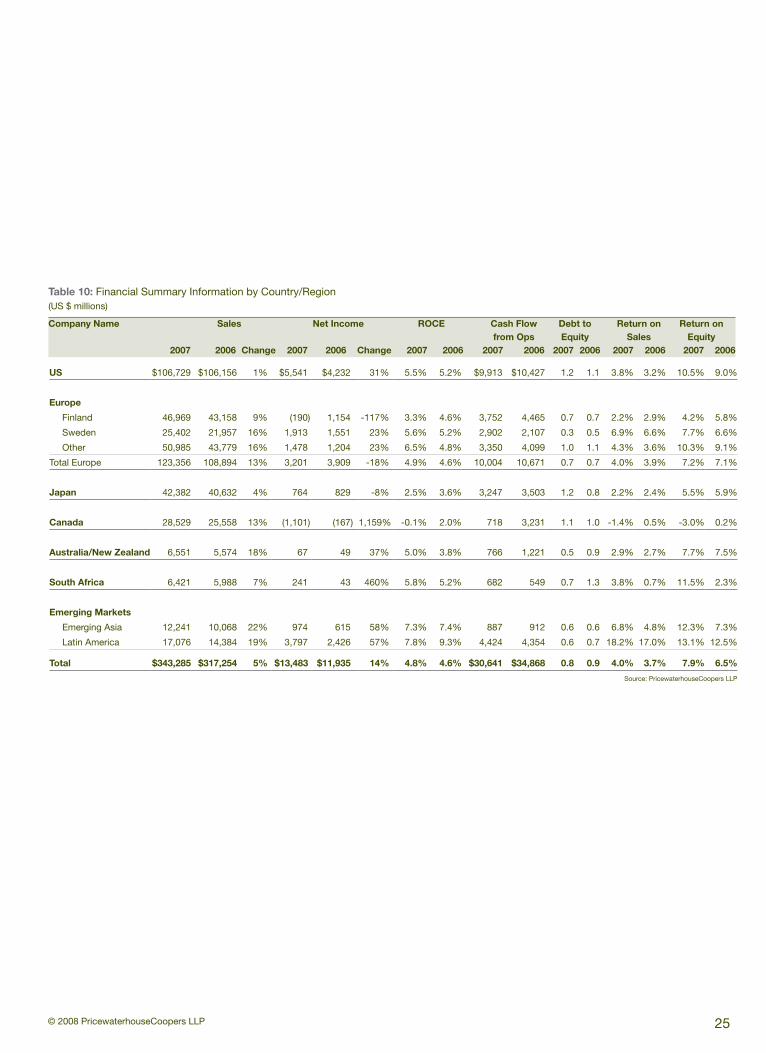
Table 10: Financial Summary Information by Country/Region(US $ millions)
Company Name Sales Net Income ROCE Cash Flow Debt to Return on Return on from Ops Equity Sales Equity 2007 2006 Change 2007 2006 Change 2007 2006 2007 2006 2007 2006 2007 2006 2007 2006
US $106,729 $106,156 1% $5,541 $4,232 31% 5.5% 5.2% $9,913 $10,427 1.2 1.1 3.8% 3.2% 10.5% 9.0%
Europe
Finland 46,969 43,158 9% (190) 1,154 -117% 3.3% 4.6% 3,752 4,465 0.7 0.7 2.2% 2.9% 4.2% 5.8%
Sweden 25,402 21,957 16% 1,913 1,551 23% 5.6% 5.2% 2,902 2,107 0.3 0.5 6.9% 6.6% 7.7% 6.6%
Other 50,985 43,779 16% 1,478 1,204 23% 6.5% 4.8% 3,350 4,099 1.0 1.1 4.3% 3.6% 10.3% 9.1%
Total Europe 123,356 108,894 13% 3,201 3,909 -18% 4.9% 4.6% 10,004 10,671 0.7 0.7 4.0% 3.9% 7.2% 7.1%
Japan 42,382 40,632 4% 764 829 -8% 2.5% 3.6% 3,247 3,503 1.2 0.8 2.2% 2.4% 5.5% 5.9%
Canada 28,529 25,558 13% (1,101) (167) 1,159% -0.1% 2.0% 718 3,231 1.1 1.0 -1.4% 0.5% -3.0% 0.2%
Australia/New Zealand 6,551 5,574 18% 67 49 37% 5.0% 3.8% 766 1,221 0.5 0.9 2.9% 2.7% 7.7% 7.5%
South Africa 6,421 5,988 7% 241 43 460% 5.8% 5.2% 682 549 0.7 1.3 3.8% 0.7% 11.5% 2.3%
Emerging Markets
Emerging Asia 12,241 10,068 22% 974 615 58% 7.3% 7.4% 887 912 0.6 0.6 6.8% 4.8% 12.3% 7.3%
Latin America 17,076 14,384 19% 3,797 2,426 57% 7.8% 9.3% 4,424 4,354 0.6 0.7 18.2% 17.0% 13.1% 12.5%
Total $343,285 $317,254 5% $13,483 $11,935 14% 4.8% 4.6% $30,641 $34,868 0.8 0.9 4.0% 3.7% 7.9% 6.5%
Source: PricewaterhouseCoopers LLP
PricewaterhouseCoopers’ Global Forest, Paper & Packaging Industry Survey: 2008 Edition – Survey of 2007 Results26
The PricewaterhouseCoopers Global Forest, Paper & Packaging Industry Survey examines the 100 largest forest, paper and packaging products companies in the world — whether state, private, publicly owned, or a division of a larger entity — ranked by sales, provided there is sufficient public disclosure to allow meaningful analysis.
Survey Methodology
The data reported is drawn from a number of sources including annual reports, websites, press releases and the companies. Information may be unaudited.
For some companies, such as privately-owned entities, no or limited financial information is available. For those where sales data is available we have listed separately the 17 largest companies on page 27. Had sufficient data been available, these companies would have been included in the PwC Top 100. This list does not purport to be complete. Most notably, the list is topped by Koch Industries which incorporates Georgia-Pacific acquired in 2005.
Two of Emerging Asia’s largest companies, Asia Pulp & Paper (APP) and Asia Pacific Resources International (APRIL), no longer publish their financial information. However, these two companies are too large to ignore. In recent years, we have ranked both of these companies in the PwC Top 100 based on estimated sales data being extrapolations we have made using data that is in the public domain about their operations. We have now concluded it is more appropriate to include these two companies in the list of other major companies, to avoid distorting the PwC Top 100 analyses. Sales of APP and APRIL continue to be estimates as described.
A further notable omission from the PwC Top 100 is New Zealand entrepreneur Graeme Hart’s Rank Group. The Rank Group has spent over $5 billion since 2005 on FPP acquisitions and a further $2.7 billion on Alcoa’s (non-fibre) packaging and consumer businesses. Rank started with the purchase of Carter Holt Harvey, a broad-based forest products group in Australasia, previously controlled by International Paper but with a strong focus on paper packaging. This was followed by the acquisition of SIG Holding, a Swiss company and the second largest food and drink carton packaging company in the world and the separate acquisitions of International Paper’s drinks carton packaging business and Blue
Ridge Paper Products of North Carolina, US, which focuses on cartonboard, food and drink cartons. The two latter businesses are being merged to form Evergreen Packaging, headquartered in Arkansas. Financial data is not available for the Rank Group, but based on the annual sales of the businesses acquired by the Rank Group, we estimate that the annualized sales of its FPP (fibre only) businesses would exceed $5 billion and therefore places the group amongst the top 20 FPP companies by sales.
The PwC Top 100 results include only companies whose forest, paper and fibre packaging products business comprise more than 50% of total sales. Companies are grouped based on the location of their head offices.
For 2007, Procter & Gamble is not on the PwC Top 100 as it does not meet the 50% threshold for forest products.
The 2006 comparative corporate data included in this Survey depends upon the data reported in the companies’ 2007 annual reports PwC takes no responsibility for the correctness of the extrapolated figures. The 2007 Japanese data is for their fiscal year ended March 31, 2007.
Return on Capital Employed (ROCE) is calculated as net income before unusual items, minority interest and interest expense, on an after-tax basis, divided by average total assets less average non-interest bearing current liabilities.
Foreign exchange fluctuations can have a significant impact on the data presented. This Survey has directly adopted the results of companies that report in US dollars; otherwise we have translated income statement items at the 2007 and 2006 average rates for the calendar years (irrespective of year-ends within 2007). Balance sheet items have been translated at the rates as of December 31, 2007 and 2006 respectively.

© 2008 PricewaterhouseCoopers LLP 27
Table 11: Exchange Rates
Currency Type Year End USD @Dec 31 USD Average
Australian Dollar 2007 0.876 0.838
Australian Dollar 2006 0.789 0.754
Brazilian Real 2007 0.565 0.516
Brazilian Real 2006 0.469 0.461
British Pound 2007 1.997 2.001
British Pound 2006 1.959 1.843
Canadian Dollar 2007 1.019 0.935
Canadian Dollar 2006 0.858 0.882
Chilean Peso (000s) 2007 2.010 1.920
Chilean Peso (000s) 2006 1.920 1.880
Chinese Renminbi 2007 0.137 0.132
Chinese Renminbi 2006 0.128 0.125
Euro 2007 1.473 1.370
Euro 2006 1.320 1.256
Japanese Yen (000s) 2007 8.910 8.500
Japanese Yen (000s) 2006 8.410 8.600
Korean Won (000s) 2007 1.070 1.080
Korean Won (000s) 2006 1.090 1.060
Mexican Peso 2007 0.092 0.092
Mexican Peso 2006 0.093 0.092
N Zealand Dollar 2007 0.775 0.736
N Zealand Dollar 2006 0.705 0.649
Norwegian Krone 2007 0.185 0.171
Norwegian Krone 2006 0.161 0.156
Singapore Dollar 2007 0.692 0.664
Singapore Dollar 2006 0.652 0.629
S African Rand 2007 0.156 0.142
S African Rand 2006 0.144 0.149
Swedish Krona 2007 0.156 0.148
Swedish Krona 2006 0.146 0.136
Swiss Franc 2007 0.888 0.834
Swiss Franc 2006 0.820 0.798
Taiwan Dollar 2007 0.031 0.031
Taiwan Dollar 2006 0.031 0.031
Thai Baht 2007 0.034 0.032
Thai Baht 2006 0.028 0.026
Table 12: Other Major Companies
Company Name Country 2007 Estimated
Sales
2006 Estimated
Sales
Koch Industries US $20,000 $19,656
Rank Group New Zealand 5,000 N/A
Asia Pulp and Paper (APP) Singapore 4,500 4,400
Visy Industries Australia 2,514 2,367
Kruger Canada 2,337 1,850
APRIL Singapore 2,200 1,550
SAICA Spain 2,192 1,900
Fritz Egger Austria 2,015 2,324
Tolko Canada 1,650 1,900
North Pacific Lumber Group US 1,200 1,500
Papierfabrik Palm Germany 950 848
Elopak Norway 935 781
Koehler Paper Group Germany 875 753
Menasha US 870 850
Klausner Germany 750 720
Cenibra Brazil 598 576
Fedrigoni Group Italy 568 482 Source: PricewaterhouseCoopers LLP

PricewaterhouseCoopers’ Global Forest, Paper & Packaging Industry Survey: 2008 Edition – Survey of 2007 Results28
Macroeconomic, Sector Background and Impact
That the industry is facing “challenging times” came as no surprise to our panelists or conference attendees. Patricia Croft said the World Bank has declared this the worst credit crisis since the Great Depression; the US sub-prime crisis has created a tangled web of economic issues in the US that had been building over the past 10 years. This crisis born in the US has fanned across other regions of the world exposing the inter-connectivity and often fragility of macroeconomic issues and systems.
The credit crisis, collapse in US housing starts, Russian log export tax, excess lumber capacity, and the beginning of the end of the British Columbia mountain pine beetle epidemic are all factors having a particularly strong impact on the global lumber industry. Many of the same factors are impacting the
pulp and paper sector, which is faced with serious challenges around securing fibre. A number of our speakers took a detailed look at what the impact of these macroeconomic factors on the forest and paper industry is likely to be.
Russ Taylor stressed that US housing starts will be a key demand factor for the entire global industry; however, he opened that the situation should start improving soon. He detailed a number of supply issues, such as the dramatic impact the Russian log export tax is likely to have on supply in Europe (especially Finland), Japan, and China, and speculated that an increase in the log floor price may be coming. Russ argued that lumber and panel capacity will remain excessive, despite a likely decrease in mountain pine beetle wood coming out of Canada, and currency fluctuations may have a substantial impact. His bottom line – the low cost producer wins, or, more pessimistically, loses less.
PricewaterhouseCoopers 21st Annual
Global Forest & Paper Industry Conference
PricewaterhouseCoopers hosted the 21st Annual Global Forest & Paper Industry conference on May 8, 2008 in Vancouver, British Columbia. This year’s conference theme, “Challenging Times, Winning Strategies”, acknowledged the significant financial challenges currently facing the industry, while also taking a forward look at new strategic directions and future opportunities.

© 2008 PricewaterhouseCoopers LLP 29
Tom Wright argued that the fundamentals of the paper industry have changed, with flat demand, rising costs, and falling prices a trend rather than a cyclical low point. The paper industry is responding by divesting non core businesses and closing capacity. The pulp market is shifting from long fibre (softwood) to short fibre (hardwood), but demand will need to grow substantially to keep pace with planned capacity increases. Demand in China, while likely to remain strong, may slow somewhat, so the industry may face some overcapacity in short fibre over the next several years.
Gail Glazerman pointed out that the paper industry has actually worked aggressively to reduce costs in recent years, although the benefits are obscured by inflation. She argued that relative cost position is essential to maintaining competitiveness, with access to lower cost fibre increasingly important, and high transport prices impacting decisions to serve certain markets.
Does Canada have a future in the forest products industry?The current situation: in one presenter’s words, a “train wreck”. Low commodity prices, a weak US dollar and 19 million houses for sale in the US have happened all at once to create financial results that are the worst in recent decades.
Should we declare the Canadian forest industry dead-on-arrival? Some of our panelists think not.
Avrim Lazar provided an optimistic outlook for the forest and paper industry, noting that the ‘horizon is golden’, especially in Canada where the boreal forest is not as impacted by the inter-dependency of fibre, fuel and food.
Ken Shields also saw a number of reasons for optimism in the future. Ken asserted that developments in the US will determine the future prospects of the Canadian softwood lumber industry. Lumber is a commodity industry, and the Canadian lumber market is heavily dependent upon US homebuilding. While the US economy and capital markets are currently facing a crisis, Ken argued that over the long-term housing starts will increase again, with a recovery likely in late 2008 or early 2009 and a higher rate of starts over the long term. In his view, the US economy and capital markets are resilient and will soon weather the current downturn.
Further, current levels of over-supply will slow down as harvests from mountain pine beetle infested wood decreases. In recent years, harvest levels have been maximized to salvage as much of the dead wood as possible and slow the spread of infestation. As dead pine ages, it becomes less suitable as lumber, so unit costs will increase and future harvest levels will be reduced. Ken predicted that lumber production in the British Columbia interior is likely to drop 30–40%. The return of housing starts to the historic trend line and the predicted decrease in production are likely to coincide, raising the question of who will fill the resultant supply gap in North America. Ken argued that this is unlikely to be eastern Canada or the US, so European producers will need to fill the gap. Given the current cost environment, this will inevitably drive prices up substantially – ultimately benefiting the remaining sawmillers in British Columbia. Ken commented that share prices of many Canadian companies are currently below the economic value of their business, so over the long-term, there is much cause for optimism.
Mark your calendarPricewaterhouseCoopers 22nd Annual Global Forest & Paper Industry ConferenceMay 14, 2009 – Vancouver, Canada | Westin Bayshore Resort & Marina
Promising Directions for Investment
Which regions are best positioned? In Gail’s view, the consolidation which has recently taken place in the US markets, as well as the reduced competitiveness of imports due to US dollar weakness and high transport costs, add up to a solid position for US companies. The picture in Europe looks somewhat bleaker, given pressures from rising costs, limited pricing power, and currency issues. Duncan Davies, Interfor, supported Gail’s analysis of the desirability of the US market. He described part of Interfor’s success as attributable to its diversification from Canada into the US.
Craig Campbell detailed the competitive position of the Latin American industry, based on its high comparative forest yields. Despite the strong investment in pulp capacity in Brazil, Tom Wright signaled a cautionary note on future investment given the relative strength of the Brazilian real, which has reduced regional industry’s competitive advantage.
Leo Hambro, Russian Timber Group, advocated strongly for investment in the Russian forest industry. He sees the Russian industry as poised for a period of sustained economic growth. Russia is the most underdeveloped, underutilized timber supply and is next to the largest global market – China. Given the sharp increases in Russian export taxes, he argues that it makes good economic sense to invest in processing within Russia; in fact if timber cannot be processed locally, it will not be economic to harvest it.
Jukka Tiitinen, Metso Paper, explained that in these difficult times, diversified investment in geographic and product terms can enable companies to weather an industry downturn. This view is the antithesis of many strategies pursued in recent years which have aimed for selectivity and focus.
PricewaterhouseCoopers 21st Annual Global Forest & Paper Industry Conference
PricewaterhouseCoopers’ Global Forest, Paper & Packaging Industry Survey: 2008 Edition – Survey of 2007 Results30

© 2008 PricewaterhouseCoopers LLP 31
Looking Towards a Sustainable Future
The forest and paper industry is at the heart of the drive to a more sustainable future, and a number of issues around sustainability were topics of discussion. Forest certification remains an important issue, as highlighted by one of our speakers, but the debate is also moving in several other directions. Teresa Presas described how the European paper industry sees addressing climate change as a top concern. European paper-makers are subject to the EU-Emissions Trading Scheme (EU-ETS) and may face higher costs when the next phase of the scheme takes effect. At the same time, competition for fibre is increasing sharply as countries look for ways to meet the EU’s targets for renewable energy production. The use of forest biomass as a renewable energy source does not only mean facing competition for fibre, though. It also provides excellent opportunities for the industry, which were discussed in some detail by two of our speakers.
Although many may think certification has become the norm for the industry, Kenneth Strassner pointed out that access to timber is constrained because only 10% of the world’s forests are certified. His company, Kimberly-Clark, sees a competitive advantage in sourcing and consuming certified fibre. Kenneth urged the industry to work closer with NGOs, native populations and government to improve the access to and certification of fibre, as well as helping small landowners in the US obtain certification.
What’s the best way to use forest biomass? Niel Barnard reviewed some of the options for biomass energy projects, include burning for heat or power, or bio-refining. The pulp and paper industry has a unique opportunity to capture value as a result of its access to fibre and existing ability to generate energy, however bio-refining may actually provide the best long-term opportunities. He noted that
there will likely be a significant first-mover advantage and that choosing the right technology and the right product will be critical. Niel detailed steps for success focused around improving EBITDA via the elimination of fossil energy purchases and deriving more products (energy, chemicals) from existing feedstock supply and growing revenue by means of product development, with outside energy and chemical product sales and with the selection of product mix and supply chain partners being critical success factors.
If forest products companies begin developing biomass energy projects, will there be a market for the electricity produced? According to Bev Van Ruyven, in British Columbia (BC) the answer is a resounding yes. BC Hydro, a BC utility, has identified a substantial gap between the demand and supply of electricity emerging over the near-term. Part of their strategy to fill the gap includes buying clean energy such as that produced from biomass. In February 08, BC Hydro issued a Bioenergy Call – Phase 1, soliciting potential projects to provide energy generated from forest biomass. A wide range of companies responded with proposals, including both well-known Canadian forest products producers and smaller players.
In PwC’s recent report on mergers and acquisitions activity in the industry, Branching Out, available for download at pwc.com/fpp, we highlighted some key emerging investment trends which relate to sustainability issues. We anticipate an increased interest by institutional investors in sustainable timber assets, including a fast rising trend towards “timber-plus investment strategies”, which reference not only the timber value of the forestland, but also its potential for carbon sequestration and other ecosystem benefits. Biomass-based energy and using waste as a fibre and energy source will also drive investment in the future.

PricewaterhouseCoopers’ Global Forest, Paper & Packaging Industry Survey: 2008 Edition – Survey of 2007 Results32
Understanding Your Customer
PwC’s first edition of CEO Perspectives, our report detailing the views of CEOs from across the industry (available for download at pwc.com/fpp), identified “understand your customer, know your markets”, as one of the key strategies employed by industry executives. Several of our presenters echoed this advice, which remains critical for the industry. Mikael Selling stressed the importance to producers of understanding their customer’s situation; strategic challenges and helping their customers to create competitive advantages. However, he implored
producers to change their business models so that instead of giving away value for free, they are compensated for developed services such as logistics solutions, product consulting and printing techniques. Mark Suwyn discussed the paradigm shift in advertising and the resulting increase in catalogues and direct mailings. His company, NewPage, focuses on this growing market. Boise Cascade’s Tom Stephens explained how his company’s recent restructuring aims to differentiate the company through a better understanding of customers’ needs and a “never stop learning” attitude.
Panelists Niel Barnard, CEO Ceres Ventures Limited, Surrey, UK
Craig Campbell, Partner, PricewaterhouseCoopers, Vancouver, Canada
Patricia Croft, Chief Economist, Philips, Hager and North, Toronto, Canada
Duncan Davies, President and CEO, International Forest Products (Interfor), Vancouver, Canada
Gail Glazerman, Director, US and Global Paper Analyst, UBS, New York, USA
Leo Hambro, Chief Executive, Russian Timber Group, Jersey, Channel Islands
Avrim Lazar, President and CEO, Forest Products Association of Canada, Ottawa, Canada
Teresa Presas, President, International Council of Forest & Paper Associations;
Director General, Confederation of European Paper Industries, Brussels, Belgium
Mikael Selling, Co-founder, Opticom International Research AB, Stockholm, Sweden
Ken Shields, Chairman of the Board, Raymond James Ltd, Vancouver, Canada
Kenneth A. Strassner, Vice President Environment, Energy, Safety, Quality and Consumer Services, Kimberly-Clark, Roswell, USA
W. Thomas Stephens, Chairman and CEO, Boise Cascade LLC, Boise, USA
Mark Suwyn, Chairman and CEO, NewPage Corporation, Miamisburg, USA
Russell E. Taylor, President, International WOOD Markets Group Inc, Vancouver, Canada
Jukka Tiitinen, President, Metso Paper North America
Bev Van Ruyven, Executive VP Customer Care and Conservation, BC Hydro and Power Authority, Vancouver, Canada
Tom Wright, Director, Hawkins Wright, London, UK
Luncheon Guest SpeakerLinda Coady, VP Sustainability for the 2010 Winter Olympics
PricewaterhouseCoopers 21st Annual Global Forest & Paper Industry Conference
© 2008 PricewaterhouseCoopers LLP 33
Following our Forest & Paper Conference, PwC hosted a briefing for FPP executives on how to prepare for conversion to International Financial Reporting Standards (IFRS). All listed companies, and other publically accountable enterprises in Canada, are required to prepare their financial statements under IFRS for years ended on or after 31 December 2011.
First hand insights into the transition process were provided by Nicolas Adlercreutz, the Group Chief Accountant from Svenska Cellulosa (SCA) of Sweden. Nicolas’ key messages were to start the process early, and that the larger benefits of conversion may come from unexpected places such as improved quality of reporting and better integration of finance within the business.
Bo Lagerström of PwC Sweden provided details of other commonly faced transition issues within the industry in Europe as well as the key lessons learned from the process. His overview included remarks on a number of industry-specific concerns,
including the evaluation of growing trees according to IAS 41, a number of issues around property, plant and equipment, asset retirement obligations, and contracts/rights to use land for growing trees or to harvest growing trees. He also flagged a host of general issues related to conversion projects. In Bo’s view, IFRS conversion is not primarily a finance exercise – companies should take a holistic view on the reporting systems and its governing documents/policies. Senior management need to be actively involved and show a commitment to the project by allocating sufficient, skilled resources.
Kevin Bromley from PwC Canada provided an overview of critical deadlines for Canadian companies, which include MD&A disclosure about IFRS transition issues and possible impacts in 2009 and 2010, collection of data in 2010 that will be needed for 2011 IFRS reporting, and full transition to IFRS in 2011. Ed Matley from PwC Canada also gave an overview of what an IFRS
transition project plan might look like, including three key phases. In each phase, its critical not only to change the numbers, but also to change the business, in terms of people, processes and systems.
Todd Stroup from PwC US provided details of recent developments in the US. He urged companies to begin the process of readiness for conversion, including keeping abreast of current developments, embedding IFRS into operations and existing systems, and exploring change management systems. Todd stressed the importance of people to the process, and encouraged companies both to add IFRS talent to their organisation, and begin educating investors and other stakeholders on how IFRS impacts financial reporting.
More information on key developments in IFRS accounting standards is available at www.pwc.com/ifrs. Our territory websites, www.pwc.com/ca and www.pwc.com/us, also provide more specific information for companies located in the US and Canada.
Forest, Paper & Packaging Executive Briefing Conversion to IFRS in Canada and the US

PricewaterhouseCoopers’ Global Forest, Paper & Packaging Industry Survey: 2008 Edition – Survey of 2007 Results34
Branching out – Global deals activity in the forest, paper & packaging industry (2008)
Reviews the recent deals activity in the forestry, paper and fibre packaging sectors, examines the last twelve months’ activity in detail, exploring the key drivers behind transactions in the industry, including the key role of non-traditional investors, in particular private equity. The publication also focuses on deal activity by key regions, the success of deals and considers the future transactions outlook.
CEO Perspectives – Viewpoints of CEOs in forest, paper & packaging companies worldwide (2008)
Our second edition of CEO Perspectives summarises the thoughts of 26 CEOs, or equivalent, from the forest, paper & non-paper packaging sectors around the world on key issues facing the industry. The thoughts of CEOs of companies based in North America; South America; the Middle East, Europe & Africa (EMEA); and Asia, were drawn from face-to-face and telephone interviews by conducted between August and December 2007. The combined sales revenue of the companies interviewed was over USb$120 billion. Questions were focused, but not exclusively, on the following topics: cost structure, customers, supply chain and sustainability.
IFRS in FPP – Applying IFRS in the forest, paper & packaging industry (2007)
This publication and corresponding website (www.pwc.com/fpp/ifrs) contain our solutions so far to help our clients in understanding the implications of IFRS on the forest, paper & packaging industry.
Risks & Rewards – Forest, paper & packaging in South America (2007)
Addresses the state of the industry in South America – a series of interesting growth markets for forest, paper and packaging products – and reflects on key considerations for potential investors. With the lowest wood costs of any leading producer region, South America looks set to become a dominant producer of market pulp globally. The publication includes a major focus on Brazil as well as sections on other key South American markets – Argentina, Chile, Colombia & Uruguay.
Risks & Rewards – Forest, paper & packaging in Russia (2006)
Addresses the state of the industry in Russia and reflects on the key considerations anyone thinking of investing in the sector there should make. Sets the scene on the background of the Russian marketplace, the regulatory environment and its “forest wars”; provides analysis sector by sector (forestry and logging; processed wood products; pulp, paper and paperboard; paper/non-paper packaging); and explores the risks and rewards of doing business in Russia.
Risks & Rewards – Paper & packaging industry in China (2005)
Presents an overview of the impact of China on the paper and packaging sectors including an in-depth look at some key issues of particular importance to companies operating – or looking to invest – in the Chinese marketplace.
Publications from PricewaterhouseCoopers Forest, Paper & Packaging practice are available to download from www.pwc.com/fpp

© 2008 PricewaterhouseCoopers LLP 35
Argentina Mariano Tomatis Phone:+54 (11) 4850 4716
Australia Andrew McPherson Phone: +61 (2) 6271 9350
Austria Ian Murdoch Phone:+43 (1) 5018 81420
Brazil Marcelo Orlando Phone: +55 (11) 3674 3875
Canada Bruce McIntyre Phone: +1 (604) 806 7595
Chile Ricardo Arrano Phone: +56 (2) 940 0000
China Kenny Ch Yeung Phone: +86 (20) 3819 2033
Colombia Gustavo Dreispiel Phone: +57 (1) 635 4802
Ecuador Roberto Tugendhat Phone: +593 (4) 228 8199
Finland Juha Wahlroos Phone: +358 (9) 2280 1437
France Benoît Pinoche Phone: +33 (2) 5184 3636
Germany Alexander Winter Phone: +49 (89) 5790 5400
India Rajan Wadhawan Phone: +91 (124) 462 0555
Indonesia Nita Ruslim Phone: +62 (21) 5289 0899
Ireland John Mcdonnell Phone: +353 (1) 792 8559
Italy Maria Teresa Bernelli Phone: +39 (461) 237 004
Japan Naoyasu Ozawa Phone: +81 (3) 5532 2287
Malaysia Kah Seong Fan Phone: +60 (82) 423 308
Mexico Javier Monroy Phone: +52 (55) 5263 6000
Middle East Robert Barnden Phone: +966 (01) 465 4240
Netherlands Rob Dekker Phone: +31 (10) 407 5230
New Zealand Jonathan Freeman Phone: +64 (9) 355 8303
Norway Erling Elsrud Phone: +47 (95) 260 005
Poland Ewa Woroszyl Phone: +48 (22) 523 4381
Portugal António Correia Phone: +351 (225) 433 114
Russia Alexei Ivanov Phone: +7 (812) 326 6969
Singapore Teck Soon Chew Phone: +65 (62) 363 328
Slovakia Maria Fruhwaldova Phone: +421 (2) 5935 0400
South Africa Heinz Zastrau Phone: +27 (11) 797 4431
South Korea Kwang-Oh Kim Phone: +82 (2) 709 0690
Spain Javier Domingo Phone: +34 (94) 602 2511
Sweden Bo Lagerström Phone: +46 (8) 5553 3041
Switzerland Arno Frieser Phone: +41 (58) 792 2656
UK Clive Suckling Phone: +44 (20) 7213 4887
Ukraine Vladimir Didenko Phone: +380 (44) 490 6777
Uruguay Daniel Garcia Phone: +598 (2) 916 0463
US Todd Stroup Phone: +1 (678) 419 1418
Venezuela Victor Nieto Phone: +58 (281) 418 7935
www.pwc.com/fpp
PricewaterhouseCoopers Global Forest, Paper & Packaging practice comprises a network of industry professionals located in over 35 countries around the world.
Global Leader Clive Suckling Phone: +44 (20) 7213 4887
Global Marketing
Michael Cracknell Phone: +44 (20) 7213 1737
Performance Improvement Leader, Global FPP
Craig Campbell Phone: +1 (604) 806 7603
PricewaterhouseCoopers’ Global Forest, Paper & Packaging Industry Survey: 2008 Edition – Survey of 2007 Results36
www.pwc.com/fpp
PricewaterhouseCoopers is committed to environmental stewardship, including sound paper procurement and usage practices that ensure the sustainability of forests and other natural resources.
To reach this goal we are developing and implementing policies and procedures to guide our paper procurement and use, to promote the responsible use of natural resources, and to recognize and support the environmental initiatives of our suppliers.
© 2008 PricewaterhouseCoopers LLP. All rights reserved. “PricewaterhouseCoopers” refers to the network of member of firms of PricewaterhouseCoopers International Limited, each of which is a separate and independent legal entity.