global industrial enzyme market: opportunities and forecast (2017 – 2022)
TRANSCRIPT

(c) AZOTH Analytics
Global Industrial Enzyme Market By Product Type (Carbohydrase,
Protease, Polymerase and Nuclease, Lipase, Others), Application (Food
and Beverage, Household Cleaning Product, Animal Feed, Biofuel, Others), By Region, By Country: Opportunities and Forecast
(2017 – 2022)
• Industrial Enzymes Market – Sizing,
Growth and Forecast
• Industrial Enzymes Market By Type –
Carbohydrases, Proteases, Polymerases
and Nucleases, Lipases, Others
• Industrial Enzymes Market By
Application – Biofuel, Cleaning Product,
F & B, Animal Feed, Others
• Country Analysis
• Company Analysis
December 2017

(c) AZOTH Analytics 2
Global Industrial Enzyme Market, By Value (2012 –2016)
Global Industrial Enzyme Market, By Value (2017-2022)
North America Industrial Enzyme Market, By Value (2012 – 2016)
North America Industrial Enzyme Market, By Value (2017 – 2022)
Europe Industrial Enzyme Market, By Value (2012-2016)
Europe Industrial Enzyme Market, By Value (2017-2022)
APAC Industrial Enzyme Market, By Value (2012-2016)
APAC Industrial Enzyme Market, By Value (2017-2022)
ROW Industrial Enzyme Market, By Value (2012-2016)
ROW Industrial Enzyme Market, By Value (2017-2022)
Global Coverage Regional Coverage
Global Industrial Enzyme Market By Product Type (Carbohydrase, Protease, Polymerase and Nuclease, Lipase, Others),
Application (Food and Beverage, Household Cleaning Product, Animal Feed, Biofuel, Others), By Region, By Country:
Opportunities and Forecast (2017 – 2022)
Industrial Enzyme Market, By Value (2012-2022)
By Product Type, By Value (2012-2022)
By Application, By Value
(2012-2022)
Country Coverage
Industrial Enzyme Market, By Value (2012 –2022)
Industrial Enzyme Market, By Application, By Value (2012 – 2022)
Company Coverage
Product Benchmarking Sales Production Analysis Business Overview Merger & Acquisition Trend & Drivers
Novozymes, DuPont Danisco DSM BASF Corporation, AB Enzymes, Advanced Enzyme Tech, Adisseo Chr. Hansen A/S Amano Enzymes Inc. Roche
Global Coverage
Region Coverage
Country Coverage
Scope of the Study
Segment Coverage By Product Type By Application
North America
Europe
APAC
Others
United States of America Canada Mexico U.K Germany France India China Brazil
(c) AZOTH Analytics
Table of Content
3
S.No Particulars Page No.
1. Research Methodology 20
2. Executive Summary 21
3. Strategic Recommendation 22
3.1 Focus on APAC region 23
3.2 Focus on Developing Animal Feed Enzymes 24
4. Product Overview 25
5. Global Industrial Enzymes Market: Growth and Forecast 29
5.1 By Value (2012-2016) 30
5.2 By Value (2017-2022) 31
6. Global Industrial Enzymes Market-By Type 34
6.1 Global Industrial Enzymes Market, By Type : Breakdown (%) 34
6.1.1 Global Industrial Enzymes Market- By Type: 2016(%) 35
6.1.2 Global Industrial Enzymes Market – By Type : 2022 (%) 36
6.2 Global Industrial Enzymes Market- By Carbohydrase 37
6.2.1 By Value (2012-2016) 38
6.2.2 By Value (2017-2022) 38
(c) AZOTH Analytics
Table of Content
4
S. No Particulars Page No.
6.3
Global Industrial Enzymes Market- By Protease 39
6.3.1 By Value (2012-2016) 39
6.3.2 By Value (2017-2022) 39
6.4 Global Industrial Enzymes Market- By Polymerases and Nucleases 40
6.4.1 By Value (2012-2016) 40
6.4.2 By Value (2017-2022) 40
6.5 Global Industrial Enzymes Market- By Lipases 41
6.5.1 By Value (2012-2016) 41
6.5.2 By Value (2017-2022) 41
6.6 Global Industrial Enzymes Market- By Others 42
6.6.1 By Value (2012-2016) 42
6.6.2 By Value (2017-2022) 42
7. Global Industrial Enzymes Market-By Application 43
7.1 Global Industrial Enzymes Market, By Application: Breakdown (%) 43
7.1.1 Global Industrial Enzymes Market Size, By Application, 2016 (%) 44
7.1.2 Global Industrial Enzymes Market Size, By Application, 2022 (%) 45

(c) AZOTH Analytics
Table of Content
5
S. No Particulars Page No.
7.2 Global Industrial Enzymes Market, By Food and Beverage 46
7.2.1 By Value (2012-2016) 47
7.2.2 By Value (2017-2022) 47
7.3 Global Industrial Enzymes Market, By Household Cleaning Products 48
7.3.1 By Value (2012-2016) 48
7.3.2 By Value (2017-2022) 48
7.4 Global Industrial Enzymes Market, By Animal Feed 49
7.4.1 By Value (2012-2016) 49
7.4.2 By Value (2017-2022) 49
7.5 Global Industrial Enzymes Market, By Biofuel 50
7.5.1 By Value (2012-2016) 50
7.5.2 By Value (2017-2022) 50
7.6 Global Industrial Enzymes Market, By Others 51
7.6.1 By Value (2012-2016) 51
7.6.2 By Value (2017-2022) 51

(c) AZOTH Analytics
Table of Content
6
S. No Particulars Page No.
8. Global Industrial Enzymes Market: Regional Analysis 52
8.1 Global Industrial Enzymes Market, By Region: Breakdown (%) 52
8.1.1 Global Industrial Enzymes Market Size, By Region, 2016 (%) 53
8.1.2 Global Industrial Enzymes Market Size, By Region, 2022 (%) 54
8.2 North America Industrial Enzymes Market: An Analysis 55
8.2.1 By Value (2012-2016) 56
8.2.2 By Value (2017-2022) 57
8.3 North America Industrial Enzymes Market: By Type 59
8.3.1 North America Industrial Enzymes Market, By Type, By Value (2012-2016) 60
8.3.2 North America Industrial Enzymes Market, By Type, By Value (2017-2022) 61
8.4 North America Industrial Enzymes Market: By Application 62
8.3.1 North America Industrial Enzymes Market, By Application, By Value (2012-2016) 63
8.3.2 North America Industrial Enzymes Market, By Application, By Value (2017-2022) 64

(c) AZOTH Analytics
Table of Content
S. No Particulars Page No.
8.5 North America Industrial Enzymes Market: Country Analysis (U.S., Canada, Mexico) 65
8.5.1 U.S. Industrial Enzymes Market, By Value (2012-2022) 66
8.5.3 U.S. Industrial Enzymes Market, By Application, By Value (2012-2022) 69
8.5.4 Canada Industrial Enzymes Market, By Value (2012-2022) 71
8.5.6 Canada Industrial Enzymes Market, By Application, By Value (2012-2022) 73
8.5.7 Mexico Industrial Enzymes Market, By Value (2012-2022) 75
8.5.8 Mexico Industrial Enzymes Market, By Application, By Value (2012-2022) 76
8.6 Europe Industrial Enzymes Market: An Analysis 78
8.6.1 By Value (2012-2016) 79
8.6.2 By Value (2017-2022) 80
8.7 Europe Industrial Enzymes Market: By Type 83
8.7.1 Europe Industrial Enzymes Market, By Type, By Value (2012-2016) 84
8.7.2 Europe Industrial Enzymes Market, By Type, By Value (2017-2022) 85
7

(c) AZOTH Analytics
Table of Content
8
S. No Particulars Page No.
8.8 Europe Industrial Enzymes Market: By Application 86
8.8.1 Europe Industrial Enzymes Market, By Application, By Value (2012-2016) 87
8.8.2 Europe Industrial Enzymes Market, By Application, By Value (2017-2022) 88
8.9 Europe Industrial Enzymes Market: Country Analysis (Germany, U.K, Rest of Europe) 89
8.9.1 Germany Industrial Enzymes Market, By Value (2012-2022) 90
8.9.2 Germany Industrial Enzymes Market, By Application, By Value (2012-2022) 92
8.9.3 U.K Industrial Enzymes Market, By Value (2012-2022) 94
8.9.4 U.K Industrial Enzymes Market, By Application, By Value (2012-2022) 96
8.9.5 Rest of Europe Industrial Enzymes Market, By Value (2012-2022) 98
8.10 APAC Industrial Enzymes Market: An Analysis 99
8.10.1 By Value (2012-2016) 100
8.10.2 By Value (2017-2022) 101
8.11 APAC Industrial Enzymes Market: By Type 103
8.11.1 APAC Industrial Enzymes Market, By Type, By Value (2012-2016) 104
8.11.2 APAC Industrial Enzymes Market, By Type, By Value (2017-2022) 105

(c) AZOTH Analytics
Table of Content
9
S. No Particulars Page No.
8.12 APAC Industrial Enzymes Market: By Application 106
8.12.1 APAC Industrial Enzymes Market, By Application, By Value (2012-2016) 107
8.12.2 APAC Industrial Enzymes Market, By Application, By Value (2017-2022) 108
8.13 APAC Industrial Enzymes Market: Country Analysis (China, India, Rest of APAC) 109
8.13.1 China Industrial Enzymes Market, By Value (2012-2022) 110
8.13.2 China Industrial Enzymes Market, By Application, By Value (2012-2022) 111
8.13.3 India Industrial Enzymes Market, By Value (2012-2022) 114
8.13.4 India Industrial Enzymes Market, By Application, By Value (2012-2022) 116
8.13.5 Rest of APAC Industrial Enzymes Market, By Value (2012-2022) 118
8.14 Rest of World Industrial Enzymes Market: An Analysis 119
8.14.1 By Value (2012-2016) 120
8.14.2 By Value (2017-2022) 121
(c) AZOTH Analytics
Table of Content
S. No Particulars Page No.
8.15 Rest of World Industrial Enzymes Market: By Type 124
8.15.1 Rest of World Industrial Enzymes Market, By Type, By Value (2012-2016) 125
8.15.2 Rest of World Industrial Enzymes Market, By Type, By Value (2017-2022) 126
8.16 Rest of World Industrial Enzymes Market: By Application 127
8.16.1 Rest of World Industrial Enzymes Market, By Application, By Value (2012-2016) 128
8.16.2 Rest of World Industrial Enzymes Market, By Application, By Value (2017-2022) 129
8.17 Rest of World Industrial Enzymes Market: Country Analysis (Brazil, Rest of ROW) 130
8.17.1 Brazil Industrial Enzymes Market, By Value (2012-2022) 131
8.17.2 Brazil Industrial Enzymes Market, By Application, By Value (2012-2022) 132
8.17.3 Rest of ROW Industrial Enzymes Market, By Value (2012-2022) 134
8.17.4 Rest of ROW Industrial Enzymes Market, By Application, By Value (2012-2022) 135
9. Policy and Regulatory Landscape 137
10

(c) AZOTH Analytics
Table of Content
S. No Particulars Page No.
10 Market Dynamics 139
10.1 Drivers 140
10.2 Challenges 144
11. Market Trends 147
12. Porter’s Five Forces Analysis 151
13. SWOT Analysis 153
14. Company Profiling 155
14.1 Novozymes 156
14.2 DuPont Danisco 157
14.3 DSM 158
14.4 BASF Corporation 159
11

(c) AZOTH Analytics
Table of Content
S. No Particulars
Page No.
14.5 AB Enzymes 160
14.6 Advanced Enzyme Tech 161
14.7 Adisseo 162
14.8 Chr. Hansen A/S 163
14.9 Amano Enzymes Inc. 164
14.10 Roche 165
15. About Us 166
12
(c) AZOTH Analytics
List of Figures
Figure No. Figure Title Page No.
Figure 1: Global Industrial Enzymes Market Size, By value, 2012-2016 (USD Billion) 30
Figure 2: Global Industrial Enzymes Market Size, By Value, Forecast, 2017-2022 (USD Billion) 31
Figure 3: Biofuel production, By Country, By volume (in thousand tonnes oil equivalent) 32
Figure 4: Global Household Care Products Consumption, By volume (in USD Billions) 33
Figure 5: Global Industrial Enzymes Market Share, By Type, 2016 (%) 35
Figure 6: Global Industrial Enzymes Market Share, By Type, 2022 (%) 36
Figure 7: Global Industrial Enzymes Market, By Carbohydrases, By Value, 2012-2016 (USD Billion) 38
Figure 8: Global Industrial Enzymes Market, By Carbohydrases, By Value, 2017-2022 (USD Billion) 38
Figure 9: Global Industrial Enzymes Market, By Proteases, By Value, 2012-2016 (USD Billion) 39
Figure 10: Global Industrial Enzymes Market, By Proteases, By Value, 2017-2022 (USD Billion) 39
Figure 11: Global Industrial Enzymes Market, By Polymerases and Nucleases, By Value, 2012-2016 (USD Billion) 40
Figure 12: Global Industrial Enzymes Market, By Polymerases and Nucleases, By Value, 2017-2022 (USD Billion) 40
Figure 13: Global Industrial Enzymes Market, By Lipases, By Value, 2012-2016 (USD Billion) 41
Figure 14: Global Industrial Enzymes Market, By Lipases, By Value, 2017-2022 (USD Billion) 41
Figure 15: Global Industrial Enzymes Market, By Others, By Value, 2012-2016 (USD Billion) 42
Figure 16: Global Industrial Enzymes Market, By Others, By Value, 2017-2022 (USD Billion) 42
Figure 17: Global Industrial Enzymes Market Size and Share, By Application, 2016 44
Figure 18: Global Industrial Enzymes Market Size and Share, By Application, 2022 45
Figure 19: Global Industrial Enzymes Market, By Food and Beverage, By Value, 2012-2016 (USD Billion) 47
13

(c) AZOTH Analytics
List of Figures
Figure No. Figure Title Page No.
Figure 20: Global Industrial Enzymes Market, By Food and Beverage, By Value, 2017-2022 (USD Billion) 47
Figure 21: Global Industrial Enzymes Market, By Household Care, By Value, 2012-2016 (USD Billion) 48
Figure 22: Global Industrial Enzymes Market, By Household Care, By Value, 2017-2022 (USD Billion) 48
Figure 23: Global Industrial Enzymes Market, By Animal Feed, By Value, 2012-2016 (USD Billion) 49
Figure 24: Global Industrial Enzymes Market, By Animal Feed, By Value, 2017-2022 (USD Billion) 49
Figure 25: Global Industrial Enzymes Market, By Biofuel, By Value, 2012-2016 (USD Billion) 50
Figure 26: Global Industrial Enzymes Market, By Biofuel, By Value, 2017-2022 (USD Billion) 50
Figure 27: Global Industrial Enzymes Market, By Others, By Value, 2012-2016 (USD Billion) 51
Figure 28: Global Industrial Enzymes Market, By Others, By Value, 2017-2022 (USD Billion) 51
Figure 29: Global Industrial Enzymes Market Size and Share, By Region, 2016 53
Figure 30: Global Industrial Enzymes Market Size and Share, By Region, 2022 54
Figure 31: North America Industrial Enzymes Market, By Value, 2012-2016 (USD Billion) 56
Figure 32: North America Industrial Enzymes Market, By Value, Forecast, 2017-2022 (USD Billion) 57
Figure 33: North America Population, 2012-2016 (in Billion) 58
Figure 34: North America Industrial Enzymes Market: By Type, By Value, 2012-2016 (USD Billion) 60
Figure 35: North America Industrial Enzymes Market: By Type, By Value, 2017-2022 (USD Billion) 61
Figure 36: North America Industrial Enzymes Market: By Application, By Value, 2012-2016 (USD Billion) 63
Figure 37: North America Industrial Enzymes Market: By Application, By Value, 2017-2022 (USD Billion) 64
Figure 38: U.S. Industrial Enzymes Market, By Value 2012-2016 (USD Billion) 66
Figure 39: U.S. Industrial Enzymes Market, By Value, 2017-2022 (USD Billion) 66
14

(c) AZOTH Analytics
List of Figures Figure No. Figure Title Page No.
Figure 40: United States Population growth, 2012-2016 (in millions) 67
Figure 41: U.S Per Capita Food Expenditure, 2012-2016 (in USD) 67
Figure 42: U.S. per capita meat and poultry consumption, 2012-2016 (in pounds) 67
Figure 43: U.S Wine consumption per resident, 2011-2016 (in gallons) 68
Figure 44: U.S Industrial Enzymes Market: By Application, By Value, 2012-2016 (USD Billion) 69
Figure 45: U.S Industrial Enzymes Market: By Application, By Value, 2017-2022 (USD Billion) 70
Figure 46: Canada Industrial Enzymes Market, By Value, 2012-2016 (USD Billion) 71
Figure 47: Canada Industrial Enzymes Market, By Value, 2017-2022 (USD Billion) 71
Figure 48: Canada Milk consumption, 2013-2016 (metric tonnes) 72
Figure 49: Canada per capita Meat consumption, 2012-2016 (in Kg) 72
Figure 50: Canada Industrial Enzymes Market: By Application, By Value, 2012-2016 (USD Billion) 73
Figure 51: Canada Industrial Enzymes Market: By Application, By Value, 2017-2022 (USD Billion) 74
Figure 52: Mexico Industrial Enzymes Market, By Value, 2012-2016 (USD Billion) 75
Figure 53: Mexico Industrial Enzymes Market, By Value, 2017-2022 (USD Billion) 75
Figure 54: Mexico Industrial Enzymes Market: By Application, By Value, 2012-2016 (USD Billion) 76
Figure 55: Mexico Industrial Enzymes Market: By Application, By Value, 2017-2022 (USD Billion) 77
Figure 56: Europe Industrial Enzymes Market, By Value, 2012-2016 (USD Billion) 79
Figure 57: Europe Industrial Enzymes Market, By Value, Forecast, 2017-2022 (USD Billion) 80
Figure 58: Europe Household Care Products Sales, 2012-2016 (USD billion) 81
Figure 59: Europe Household Expenditure on Food and Drinks, 2011-2014 (USD billion) 81
Figure 60: Europe Household Expenditure on Food and Drinks, 2012-2015 (USD billion) 82
15

(c) AZOTH Analytics
List of Figures
Figure No. Figure Title Page No.
Figure 61: European Union Healthcare Expenditure Per Capita, 2011-2014 (PPP) 82
Figure 62: Europe Industrial Enzymes Market: By Type, By Value, 2012-2016 (USD Billion) 84
Figure 63: Europe Industrial Enzymes Market: By Type, By Value, 2017-2022 (USD Billion) 85
Figure 64: Europe Industrial Enzymes Market: By Application, By Value, 2012-2016 (USD Billion) 87
Figure 65: Europe Industrial Enzymes Market: By Application, By Value, 2017-2022 (USD Billion) 88
Figure 66: Germany Industrial Enzymes Market, By Value, 2012-2016 (USD Billion) 90
Figure 67: Germany Industrial Enzymes Market, By Value, 2017-2022 (USD Billion) 90
Figure 68: Germany Per capita consumption of meat products (in Kg) 91
Figure 69: Germany Healthcare Expenditure (Total % of GDP) 91
Figure 70: Germany Industrial Enzymes Market: By Application, By Value, 2012-2016 (USD Billion) 92
Figure 71: Germany Industrial Enzymes Market: By Application, By Value, 2017-2022 (USD Billion) 93
Figure 72: U.K. Industrial Enzymes Market, By Value, 2012-2016 (USD Billion) 94
Figure 73: U.K. Industrial Enzymes Market, By Value, 2017-2022 (USD Billion) 94
Figure 74: Household retail purchases of fresh and frozen meat in U.K, 2011-2015 (in 1000 tonnes) 95
Figure 75: U.K. health Expenditure Per Capita, 2011-2016 (USD billion) 95
Figure 76: U.K. Industrial Enzymes Market: By Application, By Value, 2012-2016 (USD Billion) 96
Figure 77: U.K. Industrial Enzymes Market: By Application, By Value, 2017-2022 (USD Billion) 97
Figure 78: Rest of Europe Industrial Enzymes Market, By Value, 2012-2016 (USD Billion) 98
Figure 79: Rest of Europe Industrial Enzymes Market, By Value, 2017-2022 (USD Billion) 98
Figure 80: Asia Pacific Industrial Enzymes Market, By Value, 2012-2016 (USD Billion) 100
16

(c) AZOTH Analytics
List of Figures
Figure No. Figure Title Page No.
Figure 81: Asia Pacific Industrial Enzymes Market, By Value, Forecast, 2017-2022 (USD Billion) 101
Figure 82: Total Population of APAC, by select countries, 2012- 2016 (in billions) 102
Figure 83: Asia Pacific Industrial Enzymes Market: By Type, By Value, 2012-2016 (USD Billion) 104
Figure 84: Asia Pacific Industrial Enzymes Market: By Type, By Value, 2017-2022 (USD Billion) 105
Figure 85: Asia Pacific Industrial Enzymes Market: By Application, By Value, 2012-2016 (USD Billion) 107
Figure 86: Asia Pacific Industrial Enzymes Market: By Application, By Value, 2017-2022 (USD Billion) 108
Figure 87: China Industrial Enzymes Market, By Value, 2012-2016 (USD Billion) 110
Figure 88: China Industrial Enzymes Market, By Value, 2017-2022 (USD Billion) 110
Figure 89: China final consumption expenditure, 2012-2015 (in trillion USD) 111
Figure 90: China GDP (In trillion USD) 111
Figure 91: Per capita meat consumption (In Kg) 111
Figure 92: China Industrial Enzymes Market: By Application, By Value, 2012-2016 (USD Billion) 112
Figure 93: China Industrial Enzymes Market: By Application, By Value, 2017-2022 (USD Billion) 113
Figure 94: India Industrial Enzymes Market, By Value, 2012-2016 (USD Billion) 114
Figure 95: India Industrial Enzymes Market, By Value, 2017-2022 (USD Billion) 114
Figure 96: India Final Consumption Expenditure, 2012-2016 (in trillion USD) 115
Figure 97: India per capita Meat Consumption, 2012-2016 (in Kg) 115
Figure 98: India Biofuel Production, 2012-2016 (in million tonnes oil equivalent) 115
Figure 99: India Industrial Enzymes Market: By Application, By Value, 2012-2016 (USD Billion) 116
Figure 100: India Industrial Enzymes Market: By Application, By Value, 2017-2022 (USD Billion) 117
17
(c) AZOTH Analytics
List of Figures
Figure No. Figure Title Page No.
Figure 101: Rest of Asia Pacific Industrial Enzymes Market, By Value, 2012-2016 (USD Billion) 118
Figure 102: Rest of Asia Pacific Industrial Enzymes Market, By Value, 2017-2022 (USD Billion) 118
Figure 103: Rest of World Industrial Enzymes Market, By Value, 2012-2016 (USD Billion) 120
Figure 104: Rest of World Industrial Enzymes Market, By Value, Forecast, 2017-2022 (USD Billion) 121
Figure 105: Latin America Household Care Products Sales, by Value, 2012-2021 122
Figure 106: South Africa Meat Consumption, by Volume, 2012-2016 123
Figure 107: Latin America Healthcare Expenditure, 2012-2017 (USD per capita) 123
Figure 108: Middle East and Africa Biofuel Production, by Value, 2012-2016 123
Figure 109: Rest of World Industrial Enzymes Market: By Type, By Value, 2012-2016 (USD Billion) 126
Figure 110: Rest of World Industrial Enzymes Market: By Type, By Value, 2017-2022 (USD Billion) 126
Figure 111: Rest of World Industrial Enzymes Market: By Application, By Value, 2012-2016 (USD Billion 128
Figure 112: Rest of World Industrial Enzymes Market: By Application, By Value, 2017-2022 (USD Billion) 129
Figure 113: Brazil Enzymes Market, By Value, 2012-2016 (USD Billion) 131
Figure 114: Brazil Enzymes Market, By Value, 2017-2022 (USD Billion) 131
Figure 115: Brazil Industrial Enzymes Market: By Application, By Value, 2012-2016 (USD Billion) 132
Figure 116: Brazil Industrial Enzymes Market: By Application, By Value, 2017-2022 (USD Billion) 133
Figure 117: Rest of ROW Industrial Enzymes Market, By Value, 2012-2016 (USD Billion) 134
Figure 118: Rest of ROW Industrial Enzymes Market, By Value, 2017-2022 (USD Billion) 134
Figure 119: Rest of ROW Industrial Enzymes Market: By Application, By Value, 2012-2016 (USD Billion) 135
Figure 120: Rest of ROW Industrial Enzymes Market: By Application, By Value, 2012-2016 (USD Billion) 136
18

(c) AZOTH Analytics
List of Figures
Figure No. Figure Title Page No.
Figure 121: Per Capita Consumption of Poultry and Livestock, 2011-2016 (in pounds) 141
Figure 122: Global Wine Consumption, By volume, 2014-2016 (in mhl) 143
Figure 123: Global Wine Trade, By Value, 2012-2016 (USD Million) 143
Table A: Industrial Applications of Enzymes 28
Table B: Global per capita meat consumption, By livestock type, By volume (in Kg/person) 33
Table C: Germany Healthcare Related Statistics 91
19
(c) AZOTH Analytics
Research Methodology
For our study on Industrial Enzymes Market, we have conducted comprehensive secondary research
followed by an extensive primary research. In the process of secondary research, we have scrutinized
industry documents, accessed from open sources, premium paid databases (Bloomberg, Thomson
Reuters, Factiva) and our internal knowledge base. In the process of primary research, we have
interviewed various industry experts across the value chain of the enzymes industry.
Market size of the actual period (2012-2016) has been evaluated on the basis of growth trends of
the industry in the last five years, and confirming the findings through primary research. Annual
reports of the companies are scanned to further validate the market size and to estimate the size of
various other end-user sectors. Market sizing and growth in the forecast period (2017-2022) is
estimated through product mapping, application in end-user industries, growth of allied sectors and
historical growth pattern of the industry. All the relevant data points/ statistics in the forecast
period are validated through relevant and reliable primary sources.
Report Focus: Global Industrial Enzymes Market
- By Type (Carbohydrases, Proteases, Polymerases and Nucleases, Lipases, Others)
- By Application ( Food and Beverage, Household Care Products, Animal Feed, Biofuel, Others)
-- By Region (North America, Europe, Asia Pacific, ROW),
- By Country (U.S., Canada, Mexico, Germany, U.K., China, India, Brazil)
- Company Coverage (Novozymes, DuPont Danisco, DSM, BASF Corporation, AB Enzymes, Advanced
Enzyme Tech, Adisseo, Chr. Hansen A/S, Amano Enzymes Inc., Roche )
20
(c) AZOTH Analytics
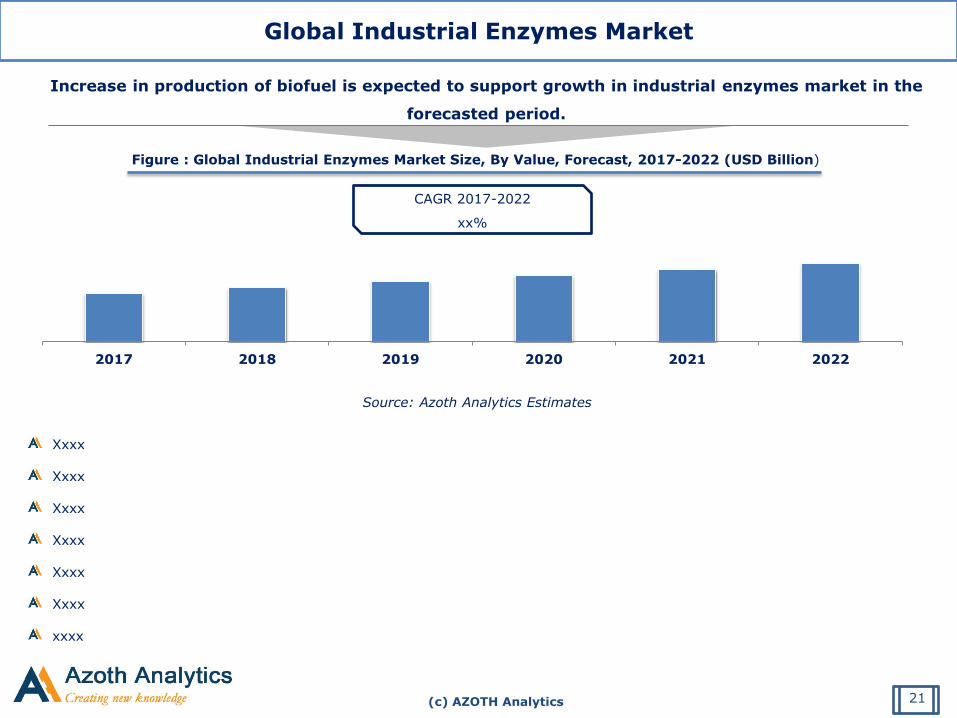
Global Industrial Enzymes Market
Increase in production of biofuel is expected to support growth in industrial enzymes market in the
forecasted period.
2017 2018 2019 2020 2021 2022
Source: Azoth Analytics Estimates
CAGR 2017-2022
xx%
Figure : Global Industrial Enzymes Market Size, By Value, Forecast, 2017-2022 (USD Billion)
Xxxx
Xxxx
Xxxx
Xxxx
Xxxx
Xxxx
xxxx
21

(c) AZOTH Analytics
Global Industrial Enzymes Market- By Application
Figure : Global Industrial Enzymes Market Size
and Share, By Application, 2016
F & B
Household care
Animal Feed
Bio Fuel
Others
Source: Azoth Analytics Estimates
Xxxx
xxxx
Xxxx
xxxx
Xxxx
xxxx
Key Drivers
22
(c) AZOTH Analytics
Source: Azoth Analytics Estimates
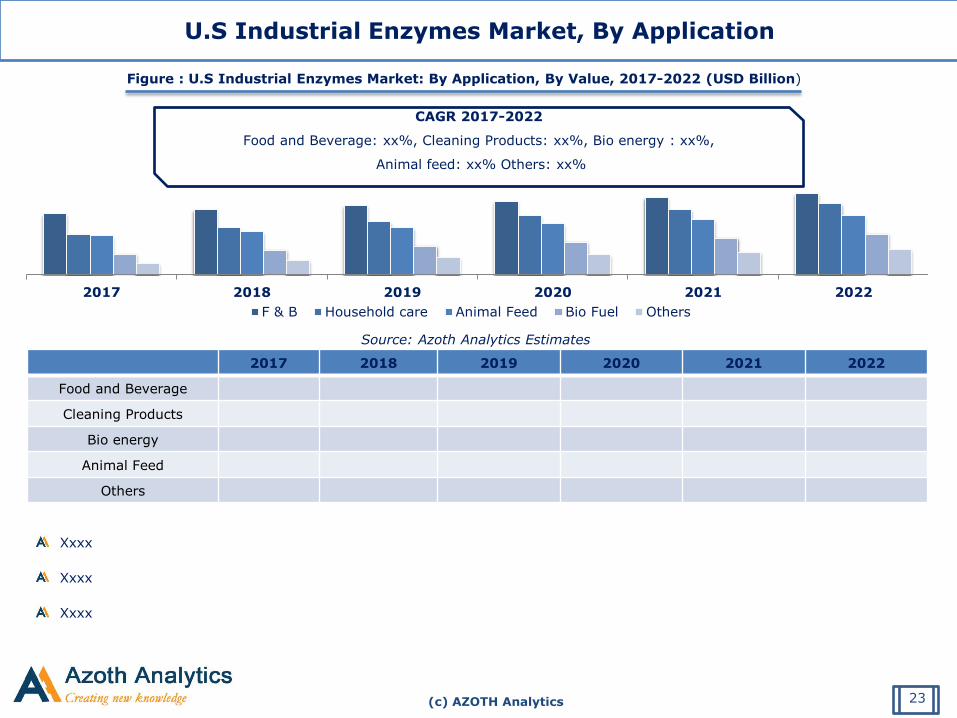
Figure : U.S Industrial Enzymes Market: By Application, By Value, 2017-2022 (USD Billion)
U.S Industrial Enzymes Market, By Application
Xxxx
Xxxx
Xxxx
2017 2018 2019 2020 2021 2022
F & B Household care Animal Feed Bio Fuel Others
CAGR 2017-2022
Food and Beverage: xx%, Cleaning Products: xx%, Bio energy : xx%,
Animal feed: xx% Others: xx%
2017 2018 2019 2020 2021 2022
Food and Beverage
Cleaning Products
Bio energy
Animal Feed
Others
23
(c) AZOTH Analytics
Source: Azoth Analytics Estimates
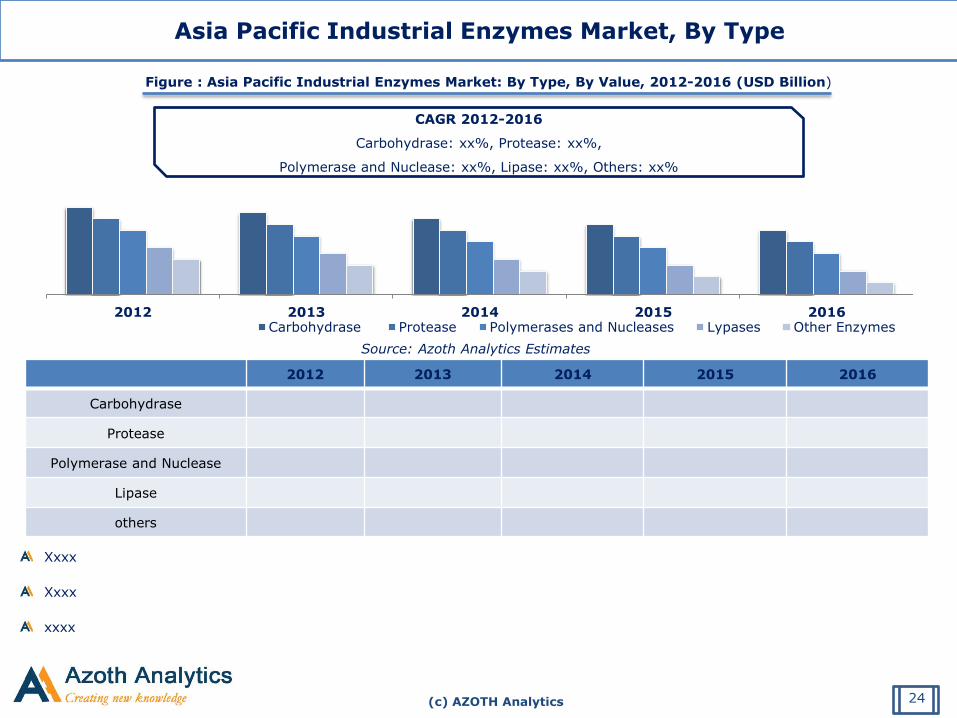
Figure : Asia Pacific Industrial Enzymes Market: By Type, By Value, 2012-2016 (USD Billion)
Asia Pacific Industrial Enzymes Market, By Type
Xxxx
Xxxx
xxxx
2012 2013 2014 2015 2016Carbohydrase Protease Polymerases and Nucleases Lypases Other Enzymes
CAGR 2012-2016
Carbohydrase: xx%, Protease: xx%,
Polymerase and Nuclease: xx%, Lipase: xx%, Others: xx%
2012 2013 2014 2015 2016
Carbohydrase
Protease
Polymerase and Nuclease
Lipase
others
24
(c) AZOTH Analytics
About Azoth Analytics Pvt Ltd.
Azoth Analytics creates in-depth research reports by recording, interpreting and analyzing information through primary and secondary
research. Our strategic market sizing and data dredging techniques include secondary research, interviews with key market players and
industry experts and use of industry specific statistical tools which helps in designing and planning effective research for our global and
local clients. We provide customized market research reports revealing the hidden truths on different verticals like pharmaceutical, oil and
gas, retail, telecommunications, real estate, logistics, energy, healthcare, technology, FMCG, food & beverages and media sectors .
Related Reports:
1. Global Animal Antibiotics and Antimicrobials Market Analysis - Product Type, Delivery Type, Type of Animals, Company
Analysis, Regional and Country Analysis (2017-2022) -– By Product Type (Penicillins, Fluoroguinolones, Aminoglycosides,
Tetracyclines, Fluoroguinolones, Macrolides, Sulfonamides, Lincosamides, Cephalosporins, Others), By Delivery Type (Premixes, Oral
Powder, Oral Solution, Injections and Others), By Type of Animals (Farm Animals, Companion Animals)
2. Global Microinvasive Glaucoma Surgery Device Market: Trends, Opportunities and Forecasts (2017-2021)
• (By Target (Trabecular Meshwork, Suprachoroidal Space and Others) By Surgery (Glaucoma in Conjunction with Cataract, Standalone
Glaucoma By End User (Hospitals, ASCs); By Region: N. America, Europe, APAC and ROW
Disclaimer: Azoth Analytics report information is based mainly on interviews and therefore, is subject to fluctuation. Azoth Analytics
therefore, takes no responsibility for any incorrect information supplied to us by industry experts, manufacturers or users. Azoth does not
warranty the completeness of the information and data. Also, analysis provided in the report are meant for customers’ internal use only
and not for general publication or disclosure to third parties.
166