global investment outlook - blackrock see upside to global economic growth prospects but also...
TRANSCRIPT

Global Investment OutlookQ4 2016
FOR PROFESSIONAL CLIENTS AND QUALIFIED INVESTORS ONLY

We see upside to global economic growth prospects but also greater market volatility in the fourth quarter. This comes after a summer lull in volatility, record highs for US equity markets and a rebound in emerging market (EM) assets. We see early signs of a regime change for market returns due to US reflation and a global pivot from monetary stimulus to fiscal support, even if the immediate economic impact is limited. Our key views:
• Policy limits: we expect the US Federal Reserve to press on with slow interest rate increases while other major central
banks start to approach limits of their easy policies.
• Low returns: our return expectations are at post-crisis lows across asset classes, but we believe investors will be
compensated for taking on risk in equities, selected credit, EM and alternative assets.
• Volatility: central bank asset purchases have smothered volatility and pushed investors to take greater risks, but we could
see short bursts of heightened volatility as the limits of monetary policy become clearer.
• Risks: equity and bond returns are becoming more correlated and could fall in tandem, while rising long-term yields are a
tail risk that could cause an unwanted tightening of financial conditions. A divisive US presidential election is the top
political risk. Near-term China risks have receded amid a gradual currency depreciation and a pick-up in Asia’s export
machine. China’s yuan stability and debt build-up remain medium-term risks, however.
• Markets: we prefer shorter-duration US government bonds and favour selected eurozone peripheral debt over other
sovereigns. We generally like investment grade corporate bonds in the eurozone, UK and US. We find EM debt attractive
but have become more selective, and we see further upside in EM equities. Dividend stocks may come under pressure
from higher bond yields, so we prefer companies that can sustainably grow dividends.
Kate MooreChief Equity Strategist
BlackRock Investment Institute
Jean BoivinHead of Economic and Markets Research
BlackRock Investment Institute
Isabelle Mateos y LagoChief Multi-Asset Strategist
BlackRock Investment Institute
Setting the scene ......................... 3
THEMES ................ 4–6Policy limitsLow returnsVolatility
RISKS ........................ 7Rising yields and China
MARKETS ............8–11Government bondsCreditEquitiesAssets in brief
Jeff Rosenberg Chief Fixed Income Strategist
BlackRock Investment Institute
Richard TurnillGlobal Chief
Investment Strategist
BlackRock Investment Institute
G L O B A L I N V E S T M E N T O U T L O O K2 S U M M A R Y

3G L O B A L I N V E S T M E N T O U T L O O KS E T T I N G T H E S C E N E
Setting the sceneGlobal growth expectations have been on a steady decline since 2015. Yet our proprietary
economic indicator, the BlackRock Macro GPS, indicates the global recovery is grinding on, with
little sign of Brexit contagion. The GPS incorporates big data signals, such as Internet searches
and corporate conference call transcripts, to gauge how growth expectations could evolve over
the next three months. Consensus GDP forecasts for the G7 appear too low, our GPS suggests.
See the Excess pessimism chart. This masks a lot of variation: we see large upside in Japan, for
example, but little in the UK.
A pick-up in economic growth forecasts could spur risk appetite toward the end of the year. EM
growth is set to rebound next year, outperforming growth in developed markets by the most
since 2013, the International Monetary Fund forecasts. China’s stabilizing economy is a positive.
The country has effectively managed a transition to slower, consumer-led growth, in our view —
albeit at a cost of limited reforms to state-owned enterprises.
Global growth expectations have shifted lower in 2016, yet we see room for upside surprises this quarter.
The Fed has been very patient with lifting interest rates in the hope of strengthening the labour
market and stoking higher wages. US wage growth is showing signs of accelerating, greasing
the wheels of a broad pick-up in household spending. The Fed’s favoured measure of core
inflation — core personal consumption expenditures (PCE) — remains steady below its 2% target,
even as other measures of inflation are ticking higher. See the Letting reflation take root chart.
We expect the second US rate increase of this cycle in December, but believe the Fed will move
gradually thereafter and allow employment gains and inflation to run hot. The Fed has been
very slow to lift rates compared with its pre-crisis stance, and we expect it to stay the course.
The Fed’s Summary of Economic Projections in September showed committee members have
reduced their long-term interest rate projections but still expect a median of 2.25 percentage
points of rate rises by the end of 2019. Markets are pricing in a total rate increase of only
around 0.5 percentage points over the same period. We think this is too low — and see risks to
fixed income if market expectations inch closer to the Fed.
Inflationary pressures are bubbling below the surface, yet the Fed’s favourite measure of inflation remains low. This allows the Fed to be patient in raising rates.
Excess pessimismBlackRock Macro GPS, 2015-2016
2.5%
July 2015Jan. 2015
1.5
2
Sept. 2016Jan. 2016
12-m
ont
h ah
ead
GD
P g
row
th
G7 Consensus
G7 GPS
Sources: BlackRock Investment Institute and Consensus Economics, September 2016.Notes: the GPS shows where the 12-month consensus GDP forecast may stand in three months’ time. Consensus forecasts are measured by Consensus Economics. GDP stands for gross domestic product. The G7 countries are the US, UK, Canada, France, Germany, Italy and Japan.
Letting reflation take rootUS wages, inflation and interest rates, 2004–2016
1
2
4
5%
2004 2006 2008 2010 2014 20162012
0
3
Wages
Fed funds rate
US core PCE inflation
Sources: Thomson Reuters Datastream and BlackRock Investment Institute, September 2016.Note: wages are represented by the Atlanta Fed Wage Tracker, which measures the median change in US hourly earnings. Inflation is measured using the core personal consumption expenditure (PCE) price index.

T H E M E S4 P O L I C Y L I M I T S
Theme 1: policy limitsCentral banks are nearing the limits of monetary easing. The Bank of Japan (BoJ) is at the
forefront, owning some 40% of Japanese government bonds (JGBs). At its current pace of
buying, the BoJ would hold two-thirds of the JGB market by 2020, we estimate. The BoJ
appears to have recognised these limits by starting to target 10-year yields, possibly allowing it
to reduce JGB purchases over time. The European Central Bank (ECB) also faces a looming
shortage of eligible bonds. See the Pushing the limits chart.
Central banks are not entirely out of bullets. Options include expanding purchases to riskier
assets, engineering steeper yield curves to offset pressures on banks and even targeting the
level of long-term yields. We see cutting short-term rates more negative as possible but less
likely. Additional measures may have diminishing returns — and unintended consequences.
Steeper yield curves could result in an unwanted tightening of financial conditions. And
negative rates have been blamed for hurting the banking sector and encouraging cash
hoarding. We see the ECB extending its asset purchase program beyond March 2017 and
relaxing self-imposed limits on the types of bonds it can buy.
Monetary policy is becoming less effective in boosting growth.
As monetary policy reaches its limits, some major economies appear on the verge of relying
more on fiscal policy to boost growth. Infrastructure spending proposals feature in the US
presidential campaign. Japan and Canada have pushed ahead with public investment. And the
UK looks set to temper its fiscal consolidation. The result: fiscal expansion in the developed
world should modestly support growth in the medium term, a sea change from years of fiscal
contraction. See the Bye bye austerity chart. Reckless fiscal expansion is never a good idea, we
believe. Yet we see productivity-enhancing measures such as infrastructure investment as more
effective than usual amid near-zero rates. See our Global Macro Outlook of September 2016.
The shift to fiscal policy could mark a regime change for markets. It may spark a rise in long-
term yields, but we see a muted impact. Central banks still have the ability to limit any
unwanted yield rises — and income-hungry investors are eager to pounce on yield spikes.
Policymakers are guiding fiscal policy away from austerity. It is too soon to expect a big growth boost, but the change in tone could support risk sentiment.
Bye bye austerityDeveloped markets’ fiscal contributions to world GDP, 2004-2018
US
Other developed markets
Total
GD
P co
ntri
but
ion
2004 2006 2008 2010 2012 2014 2016 2018
-0.5
0
0.5
1%Estimates
Sources: BlackRock Investment Institute and IMF, September 2016.Notes: the GDP contribution is in percentage points and based on the change in primary structural fiscal deficits of selected economies as a share of world GDP. Other developed markets are the eurozone, Japan, UK and Canada. Data from 2016 onward are adjustments to IMF forecasts based on BlackRock’s estimates of additional stimulus. These estimates are illustrative in nature and do not represent forecasts. They are based on recently announced spending plans, election campaign materials and BlackRock’s analysis.
Pushing the limitsCentral bank share of outstanding bonds, 2009-2020
20
40
60%
2009
0
Bank of England
European Central Bank
Bank of Japan
US Federal Reserve
2011 2013 2015 2017 2020
Shar
e o
f out
stan
din
g b
ond
s Estimates
Sources: BlackRock Investment Institute, Central Banks and IMF, September 2016.Notes: the chart shows total central bank holdings of government debt securities as a percentage of outstanding issuance (including bonds ineligible for purchase). The estimates are illustrative in nature and do not express a forecast; they are constructed using IMF fiscal balances forecasts and with the following assumptions: the Fed maintains re-investment; the ECB and BoJ maintain their current pace of buying; the Bank of England does not expand asset purchases beyond the £60 billion announced in August 2016.

T H E M E S 5L O W R E T U R N S
Theme 2: low returns aheadEquity valuations have risen to their highest absolute levels since the financial crisis. This
would normally be cause for concern. Yet we believe elevated equity valuations may make
sense in a low-return world where risk-free rates are expected to stay low for longer. Equities
still look cheap on a relative basis due to the precipitous drop in bond yields. Our measure of
the gap between expected returns on global equities and real government bond yields — a
proxy for the equity risk premium (ERP) — still sits well above its long-term average. See the
Rewarded for risk chart.
In short, investors are still compensated for taking on equity risk in an environment where we
expect very low returns across asset classes in the next five years. What could undermine this
thesis? A spike in bond yields — perhaps due to a rise in inflation and a steepening of the
expected path of Fed rate hikes — would erode the ERP and diminish the relative attractiveness
of equities.
It is tempting to sit on the sidelines in a market environment with so much uncertainty, yet investors today are still compensated for taking on equity risk.
Talk of Fed ‘normalisation’ is intensifying, yet financial markets are looking less and less
normal. Yields on cash have been driven below zero in the eurozone and Japan — and are paltry
to negative on government debt. See the Desperate for yield chart. Credit markets offer
comparatively attractive returns, albeit below pre-crisis levels. This poses a challenge for
pension funds and other institutional investors aiming to meet long-term liabilities.
Investors are being forced to take on more risk to meet their targeted rates of return. This is
pushing them into smaller asset classes, such as high yield and EM debt, that may be more
prone to bouts of severe volatility. High valuations versus history point to more muted returns
across asset classes in the long run. Yet slowing nominal GDP growth and aging populations
argue for lower bond yields than in the past — and sustained demand for high-quality bonds.
This structural shift changes the prism of assessing today’s valuations. It makes risk assets such
as equities, credit, local EM bonds and selected alternatives look attractive on a relative basis.
We see relative valuations mattering more in a low-growth, low-yield world and focus on uncovering value within and across asset classes.
Desperate for yieldYields of selected assets: current vs. pre-crisis average
Yie
ld
7.5
2.5
5
0
10%
10-year gov’t bonds
EMdebt
Emer
gin
g
Jap
anUK
EuroUS
Loca
l
Do
llar
EuroUS
UK
Euro
Jap
an
Euro
Jap
an
Euro US
UK
US
UK
US
Cash Investment grade
Highyield
Equityearnings yield
Pre-crisis average
Current
Sources: BlackRock Investment Institute, Thomson Reuters, Bank of America Merrill Lynch, J.P. Morgan and MSCI, September 2016. Notes: the pre-crisis average is based on the five-year period before the financial crisis (2003-2008). Cash is based on one-month interbank rates. Corporate bonds are based on Bank of America Merrill Lynch index data; EM dollar debt is based on the J.P. Morgan EMBI; local EM is based on the J.P. Morgan GBI-EM Global Diversified Index. The equity earnings yield is based on the inverse of 12-month forward price-to-earnings ratios for MSCI indexes.
Rewarded for riskProxy for global equity risk premium, 1988–2016
4
12%
200819981988 2013 2016
0
8
20031993
Average
Equi
ty r
isk
pre
miu
m
Sources: BlackRock Investment Institute, Thomson Reuters Datastream, Barclays and MSCI, September 2016.Notes: our equity risk premium proxy is calculated by subtracting the real bond yield from the earnings yield. The real bond yield is the yield on the Barclays Global Treasury Index minus the five-year average US consumer price inflation. The earnings yield is the inverse of the 12-month forward price-to-earnings ratio for the MSCI World Equity Index.

T H E M E S6 V O L AT I L I T Y
Theme 3: volatilityYears of muted volatility and the success of momentum strategies — betting on yesterday’s
biggest gainers rising even further — have led many investors to pile into similar investments.
Popular positions today include overweights in EM debt, US credit and US equities, according
to our Risk and Quantitative Analysis (RQA) group. This is mirrored by consensus underweights
in European equities and the British pound, according to RQA’s analysis of portfolio flows, fund
manager positions and price momentum. See the Navigating the crowds chart.
Positioning in these asset classes has moderated from summer peaks. Yet some popular
investments are still hovering near extreme levels (scores above 2 and below -2), which we see
as an important signal of short-term risk. These positions may be vulnerable to a market shock
or rising volatility, especially when combined with high valuations. It is important to manage
this risk by being selective.
Be mindful of the short-term risks in consensus trades, and look for potential opportunities away from the crowds.
Extraordinary monetary easing by central banks has dampened volatility across financial
markets. Yet expectations of Fed rate normalisation are leading to greater asset price swings.
Commodity and currency markets have led the march higher, with volatility now above the
long-term median. See the Volatility ahoy chart.
The US equity market has been an outlier. US equities recently posted their least volatile
30-day period in more than two decades. This calm is unlikely to last. We expect volatility to
pick up ahead of the US presidential election in November, similar to previous elections. We
also see bond market volatility heading higher. Rock-bottom rates suggest price volatility will
be even greater due to much smaller safety cushions against higher yields. Any further
inflation rise may serve as the spark. We see higher volatility across asset classes as the Fed
presses ahead with rate rises. We favour credit over government bonds in such an
environment. Higher volatility creates risks but also offers opportunities to capture relative
value as asset prices disperse.
We see potential for higher equity and bond volatility amid looming political risks and the Fed’s normalisation of interest rates.
Navigating the crowdsPositioning across asset classes, September 2016
-1
0
2
3
Jan. 2016 March 2016 May 2016 July 2016 Sept. 2016
-3
-2
1US equities
Europeanequities
EM debtPopular overweight
Popular underweight
US credit
Britishpound
Posi
tio
n sc
ore
Sources: BlackRock Investment Institute, Bloomberg, CFTC, EPFR and State Street, September 2016.Note: data are based on BlackRock’s analysis of portfolio flows, fund manager positions as reported by State Street and price momentum. A positive score means investors are overweight the asset class; a negative score indicates the reverse.
Volatility ahoyRealised volatility by asset class, 1996-2016
Vo
lati
lity 20
10
0
30%
Bonds FX US equities CommoditiesDevelopedequities
Emergingequities
90thpercentile
10thpercentile
Median
Current
Sources: BlackRock Investment Institute and Thomson Reuters, September 2016.Notes: volatility is measured as the standard deviation of daily returns over a rolling six-month window on an annualised basis. The green bars show the 10th to 90th percentile since 1996. The grey lines show the median over this period and the purple dots show the current level. Bond volatility is based on an average of 10-year US Treasuries, German bunds, Japanese JGBs and UK gilts. FX volatilities are based on an average of US, euro and yen trade-weighted indexes. Stock volatilities are based on MSCI indexes. Commodities are based on the S&P GSCI Commodity Index.

R I S K S 7R I S I N G Y I E L D S A N D C H I N A
RisksStocks and bonds are trading in greater synchronicity, breaking from their usual inverse
relationship: rising stocks coupled with falling bond prices, and vice versa. Risks are building
that long-term yields could rise and lead to steepening yield curves. Typically that should be
positive for equities: a sign of confidence in stronger economic growth, with the bonus that
steeper yield curves provide to banks’ net interest income.
Yet a jump in long-term yields can hurt stocks — especially low-volatility, dividend-paying ‘bond
proxies’ that have become popular defensive plays. The usual negative relationship between
bonds and stocks has flipped based on one-month correlations, our analysis suggests. This
creates challenges for investors trying to diversify portfolios. Longer-term correlations between
the two asset classes are still negative but also show some signs of turning. See the Correlation
frustration chart. Correlations between stocks and bonds have recently tended to rise in line
with expectations of Fed tightening. Cash may become a useful portfolio buffer. We also see a
role for diversifiers such as gold.
Equity and bond prices are becoming increasingly correlated, posing challenges to traditional portfolio diversification.
China has managed a Goldilocks depreciation by taking advantage of the yuan’s losses on a
trade-weighted basis. See the Stealthy depreciation chart. The weaker yuan is helping China’s
battered industrial sector claw its way out of deflation, we believe. Investor sentiment toward
Asia in general is improving: the region’s export engine shows signs of gaining momentum, and
growth-enhancing reforms are taking place. As a result, we have become more bullish on Asian
equities, in particular selected Indian, Indonesian and Hong Kong-listed Chinese shares.
Medium-term China risks remain, however, including the potential for a credit bust as well as
renewed downward pressure on the yuan causing a resumption of large capital outflows and
spillovers in other markets.
The US presidential election may result in market volatility as well as policy uncertainty,
particularly in the case of a Donald Trump victory. Other political risks are Italy’s December
referendum on constitutional reforms and a potential unravelling of the EU-Turkey refugee deal.
China risks have receded in the short term. A contentious US presidential election campaign highlights looming political risks.
Stealthy depreciationTrade-weighted Chinese yuan and US dollar, 2013-2016
125
120
115
2013
105
100
95
110Chinese yuan
US dollar
2014 2015 2016
Ind
ex
China weakens yuanby most in two decades
IMF approves reservecurrency status for yuan
Sources: BlackRock Investment Institute and JP Morgan, September 2016.Notes: lines show JP Morgan nominal effective exchange rate indexes for China and US rebased to 100 at the start of 2013.
Correlation frustrationGlobal equity and US Treasury return correlations, 1990-2016
60%
40
20
1990
-20
-40
-60
-80
0
Ben Bernanketaper speech
Three-year correlation
One-year correlation
1995 2000 2005 2010 2016
Co
rrel
atio
n
Sources: BlackRock Investment Institute, MSCI and Thomson Reuters, September 2016.Notes: the lines show the one-year and three-year rolling correlation of daily returns for the MSCI World Equity Index and the Datastream US 10-year Benchmark Government Bond Index.
M A R K E T S8 G O V E R N M E N T B O N D S
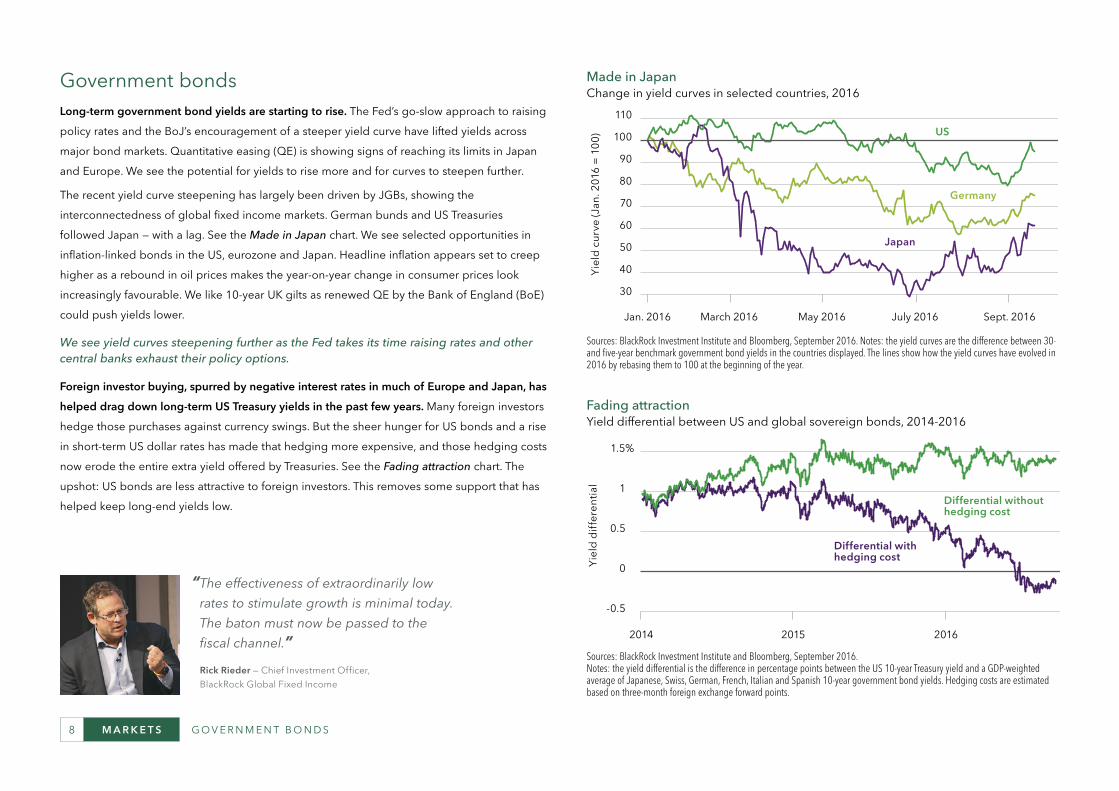
Made in JapanChange in yield curves in selected countries, 2016
Yie
ld c
urve
(Jan
. 201
6 =
10
0)
30
80
70
60
90
50
40
100
110
Jan. 2016 March 2016 May 2016 July 2016 Sept. 2016
US
Japan
Germany
Sources: BlackRock Investment Institute and Bloomberg, September 2016. Notes: the yield curves are the difference between 30- and five-year benchmark government bond yields in the countries displayed. The lines show how the yield curves have evolved in 2016 by rebasing them to 100 at the beginning of the year.
Fading attractionYield differential between US and global sovereign bonds, 2014-2016
Yie
ld d
iffe
ren
tial
Differential without hedging cost
Differential with hedging cost
201620152014
-0.5
0
0.5
1
1.5%
Sources: BlackRock Investment Institute and Bloomberg, September 2016. Notes: the yield differential is the difference in percentage points between the US 10-year Treasury yield and a GDP-weighted average of Japanese, Swiss, German, French, Italian and Spanish 10-year government bond yields. Hedging costs are estimated based on three-month foreign exchange forward points.
“ The effectiveness of extraordinarily low
rates to stimulate growth is minimal today.
The baton must now be passed to the
fiscal channel.”
Rick Rieder — Chief Investment Officer,
BlackRock Global Fixed Income
Government bondsLong-term government bond yields are starting to rise. The Fed’s go-slow approach to raising
policy rates and the BoJ’s encouragement of a steeper yield curve have lifted yields across
major bond markets. Quantitative easing (QE) is showing signs of reaching its limits in Japan
and Europe. We see the potential for yields to rise more and for curves to steepen further.
The recent yield curve steepening has largely been driven by JGBs, showing the
interconnectedness of global fixed income markets. German bunds and US Treasuries
followed Japan — with a lag. See the Made in Japan chart. We see selected opportunities in
inflation-linked bonds in the US, eurozone and Japan. Headline inflation appears set to creep
higher as a rebound in oil prices makes the year-on-year change in consumer prices look
increasingly favourable. We like 10-year UK gilts as renewed QE by the Bank of England (BoE)
could push yields lower.
We see yield curves steepening further as the Fed takes its time raising rates and other central banks exhaust their policy options.
Foreign investor buying, spurred by negative interest rates in much of Europe and Japan, has
helped drag down long-term US Treasury yields in the past few years. Many foreign investors
hedge those purchases against currency swings. But the sheer hunger for US bonds and a rise
in short-term US dollar rates has made that hedging more expensive, and those hedging costs
now erode the entire extra yield offered by Treasuries. See the Fading attraction chart. The
upshot: US bonds are less attractive to foreign investors. This removes some support that has
helped keep long-end yields low.

M A R K E T S 9C R E D I T
CreditWe see opportunities in short-term US credit. Money market reforms due in mid-October have
pushed up yields of short-end corporate and municipal bonds, and we see short-term paper
offering some protection from any jump in long-term rates. US investment grade corporate debt
remains attractive in a yield-hungry world, in our view.
We favour cable/wireless tower operators, software companies, banks and property and
casualty insurers. We expect US high yield returns to be more modest going forward, and like
the cable/satellite, technology and building materials sectors.
We also like European and UK investment grade credit. The ECB’s new corporate bond
purchase program should provide support, even for areas not directly part of the program such
as hybrids and subordinated financials. We like UK credit due to the BoE’s corporate bond
purchases, with spreads slightly wider from their recent lows after the program’s announcement.
See the A helping hand chart.
Credit markets look attractive in a low-yield world, with additional support from central bank asset purchases in the eurozone and UK.
EM debt has seen a new wave of investor demand after three years of heavy outflows. See the
Turning the ship chart. We are growing more selective amid rising valuations. We see the greatest
upside in local-currency EM debt due to stabilising currencies, improving economic fundamentals
such as current account balances, and scope for lower policy rates. Local currency bonds generally
have lower duration than hard-currency EM debt. That should make them more resilient to any
spike in global long-term bond yields. In short, local EM debt is more than just an income-
producing ‘carry trade.’ Risks include a renewed surge in the US dollar.
A helping handNon-financial corporate credit spreads, 2015-2016
Corporate bond purchase announcements
Cre
dit
spre
ad
Eurozone
US
UK
ECB BoE
0.5
1.5
2.5%
Sept. 2016Jan. 2016July 2015Jan. 2015
Sources: BlackRock Investment Institute and Barclays index data, September 2016.Notes: the lines show the option-adjusted spread in percentage points for each region and country’s Barclays corporate industrials index versus the corresponding government bond index. Bonds on these indices are investment grade. Option-adjusted spreads represent the difference in yields offered between corporate bonds and equivalent government bonds. ECB stands for the European Central Bank, BoE for the Bank of England.
Turning the shipEmerging market funds flows, 2013-2016
-10
10%
201520142013 2016
-20
0
Taper tantrum
EM equities
EM fixed income
Shar
e o
f to
tal a
sset
s
Sources: BlackRock Investment Institute and EPFR, September 2016. Notes: the chart shows cumulative fund flows since January 2013, expressed as a percentage of assets at that point.
“If the policy focus is shifting to fiscal and
infrastructure is being upgraded, it will be very
positive for EM and commodities.”
Sergio Trigo Paz — Head of BlackRock
Emerging Markets Fixed Income

M A R K E T S10 E Q U I T I E S
Relative valueValuation of global high-yielding equities, 2001-2016
Stan
dar
d d
evia
tio
ns
Expensive
Cheap
Absolute valuation
Relative to bonds
-3
-2
-1
0
1
2
3
201620132010200720042001
Sources: BlackRock Investment Institute, MSCI and Barclays, September 2016. Notes: high yield equities represented by the MSCI Global High Dividend Index. Absolute valuation based on trailing price to earnings ratio. Relative to bonds based on dividend yield minus yield on Barclays Global Sovereign Index. Valuations show the difference from the average of the period of the chart measured in standard deviations.
Emerging profit reboundEM equities relative performance and profitability, 1996–2016
80
60
100
140
160
1996 2000 2004 2008 20162012
40
120
Relative return on equity
Relative performanceRe
lativ
e p
erfo
rman
ce (1
996
= 1
00)
0.6
0.8
1.2
1.6
1.4
0.4
1
Relative return on eq
uity (ratio)
Sources: BlackRock Investment Institute and MSCI, September 2016.Notes: relative performance is the MSCI Emerging Markets Index (total return) minus the MSCI World Index (total return), rebased to 100 at the start of the chart. Relative ROE measures the ratio of the return on equity (ROE) on these two indexes.
“ We want to own quality companies that have a
solid dividend today – and that we expect can
grow that dividend over time.”
Tony Despirito — Co-head of BlackRock
Equity Dividend team
EquitiesDividend equities have reached their most expensive levels in more than a decade as the
search for yield extended to the stock market. The price-to-earnings ratio of global dividend
stocks has risen to two standard deviations above its long-term mean. Still, dividend equities
look inexpensive versus bonds. See the Relative value chart.
We see the potential for valuations to rise further if yields stay low. The highest-yielding stocks
may follow the bond market lower when rates rise. Yet not all dividend stocks are created
equal. We prefer dividend growers — quality companies with enough free cash flow to
sustainably increase their dividends over time.
We see opportunities globally in technology and non-eurozone financials, and generally
avoid utilities.
We see dividend equities attracting more inflows in a world starved of yield. Dividend growers are likely to prove resilient amid rising rates.
EM equities have outperformed their developed counterparts in 2016, reversing a five-year
run of dramatic underperformance. The EM rebound has coincided with a recovery in
corporate profitability relative to the developed world. See the Emerging profit rebound chart.
We see potential for a virtuous cycle of capital inflows into the EM world boosting domestic
liquidity and reinforcing the recovery in the economy and corporate earnings.
Valuations are still cheap, with the EM world’s price-to-book ratio one standard deviation
below its long-term average. We are focused on countries that are still early in the recovery
cycle, have strong current account positions and are pushing ahead with structural reforms. We
see opportunities in India, Indonesia and China in particular.

M A R K E T S 11
OVERWEIGHT UNDERWEIGHTNEUTRALA S S E T S I N B R I E F
Asset Class View Notes
EQUITIES
United StatesMonetary and fiscal policy should support economic expansion, but political uncertainty may dampen capex. Valuations remain elevated. We like structural growth stories, dividend growers and quality stocks.
EuropePost-Brexit uncertainties challenge already poor profits. We see only modest prospects for an earnings acceleration despite a supportive ECB. Multinationals should benefit from EM demand. We avoid banks.
JapanAttractive valuations and improved corporate governance are not enough to offset a soft economy and strong yen, we believe. The BoJ is nearing the limits of monetary policy.
EMA stable US dollar, economic reform momentum, improving corporate fundamentals and reasonable valuations support the asset class, we believe. We also see more room for inflows given light investor positioning.
Asia ex-JapanFinancial sector reform and rising current account surpluses are encouraging. China’s economic transition is ongoing, but we believe lower growth rates are priced in. We like India and selected ASEAN markets.
FIXED INCOME
US TreasuriesFed normalisation is likely to be very gradual and easy global monetary policy is supportive. Policy shifts that steepen
global yield curves make us cautious of longer-duration bonds.
Municipal bondsRicher valuations and higher US Treasury yields challenge the near-term outlook. Yet we see munis’ tax-exempt income making them a core holding longer term.
US creditWe generally prefer investment grade bonds. Yields offer compensation for the risks entailed, such as rising corporate leverage.
Europeansovereigns
We prefer selected peripheral bond markets due to higher yields and ECB support. An eventual relaxation in the ECB’s self-imposed limits on bond buying should result in steeper yield curves in the eurozone core.
European creditThe ECB’s corporate bond purchases and a modest BoE purchase program support investment grade credit in Europe. Bonds not eligible for the ECB programme also look attractive to us in selected countries.
EM debtWe have become more selective given rising valuations. We prefer the front end of local markets with room to cut rates further, such as Brazil, and also see opportunities in hard currency corporates.
Asia fixed incomeWe see local currency debt as attractive in Asian economies with a monetary easing bias, including India. In China, we are focused on higher-quality issuers.
OTHERCommodities and currencies
Supply rationalisation is improving our outlook for oil and industrial metals. We like gold as a portfolio diversifier. We see major currencies mostly stable, even as a Fed rate rise could nudge up the US dollar.
Assets in briefViews on assets for Q4 from a US dollar perspective

This material is prepared by BlackRock and is not intended to be relied upon as a forecast, research or investment advice, and is not a recommendation, offer or solicitation to buy or sell any securities or to adopt any investment strategy. The opinions expressed are as of September 2016 and may change as subsequent conditions vary. The information and opinions contained in this material are derived from proprietary and nonproprietary sources deemed by BlackRock to be reliable, are not necessarily all-inclusive and are not guaranteed as to accuracy. As such, no warranty of accuracy or reliability is given and no responsibility arising in any other way for errors and omissions (including responsibility to any person by reason of negligence) is accepted by BlackRock, its officers, employees or agents. This material may contain ‘forward-looking’ information that is not purely historical in nature. Such information may include, among other things, projections and forecasts. There is no guarantee that any forecasts made will come to pass. Reliance upon information in this material is at the sole discretion of the reader. This material is intended for information purposes only and does not constitute investment advice or an offer or solicitation to purchase or sell in any securities, BlackRock funds or any investment strategy nor shall any securities be offered or sold to any person in any jurisdiction in which an offer, solicitation, purchase or sale would be unlawful under the securities laws of such jurisdiction. In the US, this material is intended for public distribution. In the EU issued by BlackRock Investment Management (UK) Limited (authorised and regulated by the Financial Conduct Authority). Registered office: 12 Throgmorton Avenue, London, EC2N 2DL. Registered in England No. 2020394. Tel: 020 7743 3000. For your protection, telephone calls are usually recorded. BlackRock is a trading name of BlackRock Investment Management (UK) Limited. This material is for distribution to Professional Clients (as defined by the FCA Rules) and Qualified Investors and should not be relied upon by any other persons. For qualified investors in Switzerland, this material shall be exclusively made available to, and directed at, qualified investors as defined in the Swiss Collective Investment Schemes Act of 23 June 2006, as amended. Issued in Australia and New Zealand by BlackRock Investment Management (Australia) Limited ABN 13 006 165 975 AFSL 230 523 (BIMAL) for the exclusive use of the recipient who warrants by receipt of this material that they are a wholesale client and not a retail client as those terms are defined under the Australian Corporations Act 2001 (Cth) and the New Zealand Financial Advisers Act 2008 respectively. This material contains general information only and does not constitute financial product advice. This material has been prepared without taking into account any person’s objectives, financial situation or needs. Before making any investment decision based on this material, a person should assess whether the information is appropriate having regard to the person’s objectives, financial situation and needs and consult their financial, tax, legal, accounting or other professional advisor about the information contained in this material. This material is not intended for distribution to, or use by any person or entity in any jurisdiction or country where such distribution or use would be contrary to local law or regulation. BIMAL is the issuer of financial products and acts as an investment manager in Australia. BIMAL does not offer financial products to persons in New Zealand who are retail investors (as that term is defined in the Financial Markets Conduct Act 2013 (FMCA)). This material does not constitute or relate to such an offer. To the extent that this material does constitute or relate to such an offer of financial products, the offer is only made to, and capable of acceptance by, persons in New Zealand who are wholesale investors (as that term is defined in the FMCA). BIMAL is a part of the global BlackRock Group which comprises of financial product issuers and investment managers around the world. This material has not been prepared specifically for Australian or New Zealand investors. It may contain references to dollar amounts which are not Australian or New Zealand dollars and may contain financial information which is not prepared in accordance with Australian or New Zealand law or practices. BIMAL, its officers, employees and agents believe that the information in this material and the sources on which the information is based (which may be sourced from third parties) are correct as at the date specified in this material. While every care has been taken in the preparation of this material, no warranty of accuracy or reliability is given and no responsibility for this information is accepted by BIMAL, its officers, employees or agents. Except where contrary to law, BIMAL excludes all liability for this information. Past performance is not a reliable indicator of future performance. Investing involves risk including loss of principal. No guarantee as to the capital value of investments nor future returns is made by BIMAL or any company in the BlackRock Group. In Singapore, this is issued by BlackRock (Singapore) Limited (Co. registration no. 200010143N) for use only with institutional investors as defined in Section 4A of the Securities and Futures Act, Chapter 289 of Singapore. In Hong Kong, this material is issued by BlackRock Asset Management North Asia Limited and has not been reviewed by the Securities and Futures Commission of Hong Kong. This material is for distribution to ‘Professional Investors’ (as defined in the Securities and Futures Ordinance (Cap.571 of the laws of Hong Kong) and any rules made under that ordinance) and should not be relied upon by any other persons or redistributed to retail clients in Hong Kong. In Korea, this material is for Professional Investors only. In Japan, this is issued by BlackRock Japan. Co., Ltd. (Financial Instruments Business Operator: The Kanto Regional Financial Bureau. License No375, Association Memberships: Japan Investment Advisers Association, The Investment Trusts Association, Japan, Japan Securities Dealers Association, Type II Financial Instruments Firms Association.) for Professional Investors only (Professional Investor is defined in Financial Instruments and Exchange Act) and for information or educational purposes only, and does not constitute investment advice or an offer or solicitation to purchase or sells in any securities or any investment strategies. In Taiwan, independently operated by BlackRock Investment Management (Taiwan) Limited. Address: 28/F, No. 95, Tun Hwa South Road, Section 2, Taipei 106, Taiwan. Tel: (02)23261600. In Canada, this material is intended for permitted clients only. In Latin America and Iberia, this material is for educational purposes only and does not constitute investment advice nor an offer or solicitation to sell or a solicitation of an offer to buy any shares of any fund (nor shall any such shares be offered or sold to any person) in any jurisdiction in which an offer, solicitation, purchase or sale would be unlawful under the securities law of that jurisdiction. If any funds are mentioned or inferred to in this material, it is possible that some or all of the funds have not been registered with the securities regulator of Brazil, Chile, Colombia, Mexico, Panama, Peru, Portugal, Spain, Uruguay or any other securities regulator in any Latin American country and thus might not be publicly offered within any such country. The securities regulators of such countries have not confirmed the accuracy of any information contained herein.
The information provided here is neither tax nor legal advice. Investors should speak to their tax professional for specific information regarding their tax situation. Investment involves risk including possible loss of principal. International investing involves risks, including risks related to foreign currency, limited liquidity, less government regulation, and the possibility of substantial volatility due to adverse political, economic or other developments. These risks are often heightened for investments in emerging/developing markets or smaller capital markets.
©2016 BlackRock, Inc. All Rights Reserved. BLACKROCK is a registered trademark of BlackRock, Inc. All other trademarks are those of their respective owners.
Lit. No. BII-OUTLOOK-2016-Q4 007430a-BII-0916 / BII-0183 / BII-0186
BlackRock Investment InstituteThe BlackRock Investment Institute (BII) provides connectivity between BlackRock’s portfolio managers, originates research and publishes insights. Our goals are to help our fund managers become better investors and to produce thought-provoking content for clients and policy makers.
BLACKROCK VICE CHAIR AND HEAD OF BIIPhilipp Hildebrand
GLOBAL CHIEF INVESTMENT STRATEGIST Richard Turnill
HEAD OF ECONOMIC AND MARKETS RESEARCHJean Boivin
EXECUTIVE EDITORJack Reerink
Why BlackRockBlackRock helps people around the world, as well as the world’s largest institutions and governments, pursue their investing goals. We offer:
• A comprehensive set of innovative solutions
• Global market and investment insights
• Sophisticated risk and portfolio analytics