global jobs pact country scan · the global jobs pact country scan for south africa was prepared by...
TRANSCRIPT

Global Jobs Pact Country ScanSouth Africa

1
International Labour Organization
Global Jobs Pact Country Scan,
South Africa

2
Copyright © International Labour Organization 2011
First published 2011
Publications of the International Labour Office enjoy copyright under Protocol 2 of the Universal Copyright
Convention. Nevertheless, short excerpts from them may be reproduced without authorization, on condition
that the source is indicated. For rights of reproduction or translation, application should be made to ILO
Publications (Rights and Permissions), International Labour Office, CH-1211 Geneva 22, Switzerland, or by email:
[email protected]. The International Labour Office welcomes such applications.
Libraries, institutions and other users registered with reproduction rights organizations may make copies in
accordance with the licences issued to them for this purpose. Visit www.ifrro.org to find the reproduction rights
organization in your country.
ISBN 978-92-2-124216-1 (print)
ISBN 978-92-2-124217-8 (web pdf)
The designations employed in ILO publications, which are in conformity with United Nations practice, and
the presentation of material therein do not imply the expression of any opinion whatsoever on the part of the
International Labour Office concerning the legal status of any country, area or territory or of its authorities, or
concerning the delimitation of its frontiers.
The responsibility for opinions expressed in signed articles, studies and other contributions rests solely with
their authors, and publication does not constitute an endorsement by the International Labour Office of the
opinions expressed in them.
Reference to names of firms and commercial products and processes does not imply their endorsement by
the International Labour Office, and any failure to mention a particular firm, commercial product or process is
not a sign of disapproval.
ILO publications and electronic products can be obtained through major booksellers or ILO local offices in
many countries, or direct from ILO Publications, International Labour Office, CH-1211 Geneva 22, Switzerland.
Catalogues or lists of new publications are available free of charge from the above address, or by email:
Visit our website: www.ilo.org/publns
Photocomposed and printed by the International Labour Office, Geneva, Switzerland
3
Foreword
Representatives of governments and employers’ and workers’ organizations adopted the Global
Jobs Pact at the International Labour Conference in June 2009 as a global policy instrument that puts
employment and social protection at the centre of crisis response. It is based on the ILO’s Decent
Work Agenda and commitments made by the ILO constituents in the 2008 Declaration on Social
Justice for a Fair Globalization. The Global Jobs Pact addresses the social and employment impact of
the international financial and economic crisis and proposes a set of policies aimed at stimulating job
creation, extending social protection, respecting international labour standards and promoting social
dialogue, for countries to adapt according to their national needs. Support for the Pact continues to
grow with the strong endorsement from, among others, the United Nations General Assembly and the
Group of Twenty (G20) States. The ILO is providing technical assistance and financial support to
constituents that have decided to apply the Pact to national contexts. Following a request from the
Government of South Africa, the ILO has been working with national constituents to support their
application of the Global Jobs Pact.
The Global Jobs Pact Country Scan for South Africa was prepared by the International Labour
Office and made available to the constituents as an input into their national policy dialogue. It will be
used to enhance policy dialogue and capacity building activities in South Africa It is also serves as an
important knowledge sharing resource for other countries facing similar Decent Work challenges.
The Global Jobs Pact Country Scan was produced jointly by experts from ILO Headquarters, the
Regional Office for Africa and the Pretoria Decent Work Technical Support Team. We thank all those
who were involved in preparing this report.
The work was undertaken as part of the Director General’s Special Office Arrangements to
support constituents to give effect to the Global Jobs Pact. Specifically, this work relates to Special
Assignment No: 1 concerned with “Ensuring sound and integrated technical support to the operational
response to constituents in countries wanting to apply Global Jobs Pact’s policies” coordinated by José
Manuel Salazar-Xirinachs, Executive Director of the Employment Sector (ED/EMP). It examines the
country situation and policy responses, using the Pact as an integrated framework of analysis. The
structure of the Scan follows a template based on the Global Jobs Pact. It thus truly reflects the
information that policymakers from the Government, as well as the employers’ and workers’
organizations, need in order to respond effectively to the crisis and prepare policies that accelerate a
job rich recovery.
We hope that this document will be a useful contribution to policy dialogue in South Africa.
Charles DAN
Regional Director Africa
José Manuel SALAZAR-XIRINACHS
Executive Director, Employment Sector

4
Table of Contents
Introduction ..................................................................................................................................... 8
Part I: Overview of crisis impact in South Africa ........................................................................... 9
1. Impact on major macroeconomic variables ............................................................... 9
2. Impact on the real economy - key sectors affected and regional differences ......... 10
3. Impact on labour market and employment ............................................................. 12
4. Impact on systems for social protection ................................................................... 21
5. Impact on wages and working conditions ................................................................ 29
6. Impact on labour standards, including freedom of association and the right to
collective bargaining ........................................................................................................... 31
Important knowledge gaps that exist in understanding the impact of crisis which need to
be filled for improved policy-making .................................................................................. 32
Part II: Description of crisis response and recovery policies ......................................................... 33
A. Accelerating employment creation, jobs recovery and sustaining enterprises ............ 33
1. Measures to boost effective demand and help maintain wage levels through
including macro-economic policies: ......................................................................... 33
2. Investment in infrastructure, public services, green production, and R&D ......... 36
3. Protection of employed workers through employment retention measures
through well-designed schemes implemented through social dialogue and
collective bargaining. ................................................................................................ 37
4. Help workers find employment through active labour market measures ........... 43
5. Other targeted programmes such as public employment guarantee schemes,
emergency public works, and other direct job creation schemes ............................ 48
6. Support to public and private enterprises (including cooperatives) and micro-
entrepreneurs: .......................................................................................................... 49
7. Support job creation across sectors of the economy, recognizing the value of
the agricultural sector and the need for rural infrastructure, industry and
employment .............................................................................................................. 52
B. Building social protection systems and protecting people ............................................. 55
1. Cash transfer schemes .......................................................................................... 55
2. Building an adequate social protection for all, drawing on a basic social
protection floor ......................................................................…………………………………56
3. Ensuring the long-term unemployed stay connected to labour market .............. 57
4. Measures to narrow gender pay gaps and promote gender equality in the world
of work ................................... ……………………………………………………………………………… 57
C. Strengthening respect for International Labour Standards ............................................ 59
1. Increase vigilance to achieve the elimination and prevention of an increase in
forms of forced labour, child labour, trafficking, and discrimination at work ......... 59
2. Measures to increase the respect for freedom of association, the right to
organize, and the effective recognition of the right to collective bargaining .......... 59
3. Measures that recognise the relevance of international labour Conventions and
Recommendations .................................................................................................... 60

5
D. Social dialogue: identifying priorities, stimulating action, bargaining collectively ........ 62
1. National agreement through tripartite social dialogue ........................................ 62
2. Collective bargaining agreements at all levels ...................................................... 64
3. Tripartite monitoring mechanism of policy implementation ............................... 66
4. Strengthened capacities for labour administration and labour inspection .......... 66
5. Have the social partners been involved in shaping and implementation of crisis
response measures? ................................................................................................. 66
Part III: Shaping a fair and sustainable globalization .................................................................... 67
A. Policy coordination, coherence and cooperation between government ministries ..... 67
B. Policies that promote efficient and well-regulated trade, and markets that benefit all
and avoid protectionism. Varying development levels of countries must be taken into
account in lifting barriers to domestic and foreign markets .............................................. 69
C. Policies, including industrial policies, that enhance economic diversification by building
capacity for value added production and services to stimulate both domestic and external
demand ............................................................................................................................... 71
D. National supervisory and regulatory framework for the financial sector, so that it
serves the real economy, promotes sustainable enterprises and decent work and better
protects savings and pensions of people ............................................................................ 74
E. Policies that contribute to building adequate social protection for all, drawing on a
basic social protection floor including: access to health care, income security for the
elderly and persons with disabilities, child benefits and income security combined with
public employment guarantee schemes for the unemployed and working poor .............. 75
F. Policies that ensure that young women and men have the appropriate education, skills
and opportunities to participate in the economy ............................................................... 76
G. Policies that facilitate shifting to a low-carbon, environmentally friendly economy that
helps accelerate the jobs recovery, reduce social gaps and support development goals
and realize decent work in the process .............................................................................. 77
H. Strategies to create fiscal space to put in place systematic, well-resourced,
multidimensional programmes to create decent work opportunities and sustainable
enterprises .......................................................................................................................... 80
Bibliography ................................................................................................................................... 81

6
List of Acronyms
ABET Adult Basic Education and Training
AIDS Acquired Immuno Deficiency Syndrome
AIS Automotive Investment Scheme
HIV Human Immunodeficiency Virus
ARV Antiretroviral
CCMA Commission for Conciliation, Mediation & Arbitration
CDG Child Disability Grant
CEPPWA Chemical, Energy, Paper, Printing, Wood & Allied Workers Union
CIDB Construction Industry Development Board
CMS Case Management System
CLIG Child Labour Interaction Group
CSG Child Support Grant
CSI Corporate Social Investment
CSR Corporate Social Responsibility
CWP Community Works Programme
DOL Department of Labour
DPRU Development Policy Research Unit
DFI Direct Foreign Investment
DG Disability Grant
DTI Department of Trade and Industry
DHET Department of Higher Education and Training
EC Eastern Cape
ECC Employment Conditions Commission
UNEP United Nations Environment Programme
EPWP Expanded Public Works Programme
ESSA Employment Services of South Africa
FCG Foster Care Grant
FDI Foreign Direct Investment
FEDCRAW Federal Council of Retail and Allied Workers
FET Further Education and Training
FSB Financial Stability Board
GAU Gauteng
GDP Gross Domestic Product
GET General Education and Training
GJP Global Jobs Pact
GIA Grant in Aid
HSRC Human Sciences Research Council
IDC Industrial Development Corporation
ILO International Labour Organization
ITAC International Trade Administration Commission
JHB Johannesburg
KZN KwaZulu Natal

7
LFPR Labour Force Participation Rate
LFS Labour Force Survey
LRA Labour Relations Act
MIP Manufacturing Investment Programme
MPC Monetary Policy Committee
MPU Mpumalanga
NEDLAC National Economic Development and Labour Council
NERSA National Energy Regulator of South Africa
NFA National Framework Agreement
NGP New Growth Path
NQF National Qualifications Framework
NSF National Skills Fund
NUM National Union of Mineworkers
NUMSA National Union of Mineworkers of South Africa
OECD Organization for Economic Cooperation for Development
OAP Old Age Pension
PES Public Employment Services
QLFS Quarterly Labour Force Survey
SA South Africa
SACTWU South African Clothing and Textile Workers Union
SARB South African Bank Reserve
SASSA South African Social Security Agency
SEDA Small Enterprise Development Agency
SETA Sector Education and Training Authority
SMME Small Micro Medium Enterprise
SRD Social Relief of Distress Fund
STATSSA Statistics South Africa
TB Tuberculosis
TL Training Lay-Off
UIF Unemployment Insurance Fund
WAWUSA Wood & Allied Workers Union in South Africa
WC Western Cape
WTO World Trade Organization
WVG War Veterans Grant
8
Introduction
South Africa like most countries has experienced a rise in unemployment created by the
financial and economic crisis which in turn has caused hardship to many working women and men,
families and communities, and worsened poverty. Recognizing that any recovery will not be
sustainable unless decent and productive jobs are created and maintained, the South African
government and the social partners under the auspices of NEDLAC adopted the “National Framework
Response to the International Economic Crisis” a tripartite national framework agreement (NFA) in
February 2009. This national framework provided a vehicle through which a range of measures were
developed to mitigate the impact of the crisis. The NFA reflects many of the elements of the Global
Jobs Pact and represents an integrated policy package. As part of its implementation strategy
established a Leadership Team to oversee its implementation. The statement below by President
Jacob Zuma highlights the government’s resolve to address the crisis in partnership with both
employers and workers through social dialogue.
“The past year has seen the global economy enter a period of crisis unprecedented in
recent decades. While South Africa has not been affected to the extent that a number
of other countries have, its effects are now being clearly seen in our economy. We have
entered a recession. It is more important now than ever that we work in partnership on
a common programme to respond to this crisis. We take as our starting point the
Framework for South Africa’s Response to the International Economic Crisis, concluded
by government, labour and business in February this year. We must act now to
minimise the impact of this downturn on those most vulnerable.”
President Jacob Zuma, State of the Nation address, 3 June 20091
This paper will review both the range of measures that were developed and implemented in
South Africa and their impact. It will also look to the future interventions as the government and the
social partners seek to consolidate an economic recovery and at the same time ensuring that it
translates into job creation. The South African “National Framework Response to the International
Economic Crisis” was one of the inputs into the formulation of the ILO Global Jobs Pact (GJP), adopted
by the International Labour Conference in June, 2009. There is, thus, complete congruence between
the two. The GJP contains a portfolio of policies to promote jobs, protect people and rebalance
policies in line with a more sustainable and inclusive future, based on the Decent Work agenda and a
fair model for globalization. It is a framework for the period ahead and a resource of practical policies
for the multilateral system, governments, workers and employers that will enable each country to
formulate a policy package for a sustainable recovery.
Since the onset of the crisis, the International Labour Organization (ILO) has been supporting
member states, at their request, in their crisis response and recovery measures. This support has been
organized around specific crisis-related policy measures requested by Member States and prioritized
in Decent Work Country Programmes. This has involved all the areas of the decent work agenda: viz.
employment, social protection, labour standards and social dialogue, including gender equality as a
cross-cutting issue. The Government of South Africa requested assistance from the ILO with the
implementation of its crisis response, articulated in the NFA. A key element of the ILO’s strategy to
1 President Jacob Zuma’s state of the nation address, 3 June 2009, www.info.gov.za/speeches/2009/09060310551001.htm)

9
support constituents in applying the Global Jobs Pact is the preparation of the “Global Jobs Pact
Country Scan”. This document is intended to provide a description of the impact of the crisis in the
country, a detailed description of the policy responses using the GJP portfolio as a checklist, and
recommendations on how national policies can contribute to shaping a fair and sustainable
globalization. It looks at the country situation and policy responses “through the lens” of the Pact and
has three essential parts:
• Part I: Overview of crisis impact on Decent Work in the country
• Part II: Description of crisis response and recovery policies
• Part III: Shaping a fair and sustainable globalization
This Global Jobs Pact Scan for South Africa is intended to support constituents and national
policy dialogue around the implementation of the crisis response and recovery.
Part I: Overview of crisis impact in South Africa
1. Impact on major macroeconomic variables
“In South Africa we have experienced at least part of the financial shock. Our exchange
rate has depreciated sharply and the prices of our equities and bonds have fallen far. Yet
our sound and well-regulated banking system is not dependent on foreign lines of credit
and our exposure to toxic assets has been nearly non-existent.”
Former Finance Minister Trevor Manuel on 18 November 2008
In October 2008, the SA economy sunk into it first official recession since the advent of
democracy, marking the end of 55 quarters of uninterrupted positive growth. Thus, while South
Africa’s economy grew at an average of almost five percent annually between 2001 and 2007, as
Figure 1 below indicates, in the last quarter of 2008 South Africa reported its first negative growth rate
of -0.73 percent in seasonally adjusted, annualised quarterly gross domestic product, thus ending 17
years of positive economic growth for the economy. As expected, the contraction in GDP was coupled
with an equally unimpressive employment performance. Hence, employment declined in quarter one
of 2009 by 1.5 percent, and continued to decline at an increasing rate for at least three consecutive
periods. Thus, by the third quarter of 2009 employment growth in the South African economy stood at
an alarming negative 3.64 percent.
Figure 1: Growth Rates in Employment and GDP, Pre- and Post-Crisis
Source: SARB 2009 Economic and Financial Data, Statistics SA LFS (September 2000-September 2007, QLFS
(2008:Q2- 2009Q3) & own Calculations
Since the first negative growth rate in GDP was recorded in the third quarter of 2008 for South
Africa, the period from Q3: 2008 is referred to as the ‘post-crisis’ period, while the years prior to Q3:

10
2008 are noted as the ‘pre-crisis’ period in the remainder of this paper. In order to briefly analyse how
the global financial crisis rapidly manifested itself as a real economy crisis in South Africa, Table 1
below provides a general overview of shifts in key macroeconomic indicators during the pre- and post-
crisis period.
Table 1: Growth Rates in Macro Indicators, Pre- and Post-Crisis
Indicator
Mean Mean Growth Rates
Pre-Crisis
2001:1-2008:2
Post-Crisis
2008:3-2009:3 Pre-Crisis Post-Crisis
GDP (billions) 1,509 1,797* 4.38% - 1.73%*
Inflation (seasonal) 5.65 8.83** 10.33% - 10.5%
Interest rate 9.57 9.47 4.14% - 21.25%***
Money Aggregate (M3) (billions) 1,005 1,917* 18.61% 6.38%*
Credit extension (billions) 1,068 2,032* 16.33% 6.59%**
Source: SARB 2009 Economic and Financial Data, Statistics SA
Note: Asterisk (*) denotes statistically significant change at one percent level, (**) at five percent level and (***) at ten
percent level.
The most significant and obvious sign of the real financial crisis impact on the South African
economy is that while GDP grew on average at 4.38 percent per annum in the pre-crisis period, the
mean growth rate in GDP declined to -1.73 percent in the post-crisis period2, with the worst economic
contraction of -7.76 percent occurring in quarter one of 2009.
2. Impact on the real economy - key sectors affected and regional differences In Figure 2 an analysis of value-added fluctuations by sector makes it clear that the crisis had a
differentiated influence at the sectoral level. Both the tradable and non-tradable sectors however,
appear to have been equally affected by the crisis. In particular though, wholesale and retail trade
experienced a contraction in value added earlier than any other industry in South Africa, ahead of the
rest of the economy by a full quarter. Following the retail trade sector’s lead, the mining and
manufacturing sectors both recorded declines in value added at -9.45 percent and -5.19 percent
respectively in quarter three of 2008. This is when it became visible that the South African economy
would not be able to avoid the real economy impacts of the global financial crisis. However, it should
also be noted that even before the crisis (Q4, 2007) there were some signs that the mining sector had
started to experience a negative trend in value added. These sectors are occupationally segregated
and have predominantly male workforces.
Figure 2: Growth rates in Total Value Added, by Industry: Q2: 2008 - Q3: 2009
Q2: 2008 Q3: 2008 Q4:2008 Q1: 2009 Q2: 2009 Q3: 2009 Post-Crisis
Mean
Agriculture, forestry &
fishing 6.18 17.76 5.58 -3.73 -13.15 -9.81 -0.67
Mining & quarrying 10.51 -9.45 0.11 -30.70 15.85 -5.79 -6.00
Manufacturing 17.43 -5.19 -17.39 -25.54 -11.08 7.57 -10.33
Electricity, gas & water -0.07 6.07 -0.13 -8.12 1.89 4.20 0.78
Construction 5.40 8.55 6.26 10.68 8.68 6.07 8.05
Wholesale & retail trade -3.59 -5.36 -0.27 -2.45 -5.91 -1.14 -3.03
Transport, storage &
communication 3.49 3.81 1.61 -2.07 -0.98 1.15 0.70
Finance & business
services 6.58 8.13 7.48 -2.35 -3.84 -1.51 1.58
2 Due to lack of post-crisis annual data (it only has two observations for GDP figures) we take the mean of the average
annualized growth rate derived from the seasonally adjusted quarterly GDP figures. Effectively, the risk here is stretching the
X-axis of time for these time-series observations.

11
Government services 2.50 6.25 6.17 2.11 3.08 4.86 4.49
Personal services 0.96 3.18 1.47 2.71 3.34 3.54 2.85
Source: SARB 2009 Economic and Financial data, Statistics SA
Amidst crumbling domestic demand however, the construction and finance services sectors
remained strong and were growing at a moderate rate of 7.61 percent on average for at least six
months since the crisis struck, though the financial sector thereafter also followed the global trend
and witnessed a mean contraction of -2.35 percent in Q1: 2009. Two additional sectoral features of
this crisis are noteworthy in the South African context. First, fueled by the state-led infrastructural
investment program linked to large-scale projects such as Gautrain, the 2010 FIFA World Cup and of
course, meeting backlogs in municipal infrastructure, the construction industry served as a vital
counter-cyclical sector in the economy. The second key feature of this first post-1994 recession for
South Africa was that the tradable goods sector was possibly the most visible casualty in the fallout
from the domestic recession. Hence parts of the mining industry, notably platinum, and both
downstream and upstream manufacturing firms (motor vehicles and steel for example) saw a rapid
and fairly brutal decline in revenue over a short period of time. This paper shall re-emphasise these
features of the crisis in greater detail below.
South Africa has always been a commodity export-intensive country, with commodities such
as platinum, gold and steel featuring prominently. Figure 3 below examines the quarterly dollar-
denominated prices of platinum, gold, and steel over the period Q1: 2000 to Q4: 2009.
Figure 3: Prices of Key Resources, Q1: 2000 – Q4: 2009
Source: SARB 2009 Economic and Financial Data, Statistics SA
Examining Figure 3 more closely, it is clear that with the onset of the crisis, the price of
platinum declined drastically from over $2,000 just before the onset of the crisis to below $1,000
when the crisis hit South Africa, thus losing a little more than half of its value in this time. This decline
in the platinum price reflects, in the main, the collapse in the motor vehicle industry as demand for
the metal dropped dramatically. In contrast, the crisis resulted in the safest haven of all – gold –
holdings its own, as investors appetite even for bonds (most notably US treasury bonds) wavered.
Indeed, the data indicates that the gold price grew steadily at about ten percent per annum on
average in the post-crisis period. Finally as an exporter of steel, the collapse in global steel prices had a
deleterious impact on the industry’s revenues in South Africa. In particular, with the steel industry in
South Africa being associated with specific towns and cities, the labour market effects and second-
round real economy outcomes of this decline in the demand for steel were profound for local
economies that are built around the mining and processing of this product.

12
In general, any fluctuations in the demand of these resources would ultimately impact the
demand for labour. Provinces such as the North West, Mpumalanga and to a lesser extent Gauteng,
are classic examples of local economies where mining and processing of natural resources are crucial.
It is unsurprising then that the evidence suggests that between October 2008 and December 2009,
these three provinces were most affected by the job losses in the mining industry – the North West
province accounted for 56 percent of job losses (or 14,000 workers), Gauteng 40 percent of job losses
(or 10,000 workers), and Mpumalanga 36 percent of jobs losses (or 9,000 workers) in the mining
sector.
In summary it is fair to argue that the economic recession in South Africa resulted in both the
non-tradable and tradable sectors of the economy being negatively affected together with almost all
industries contracting under its influence. Counter-cyclical industries like construction, however, did
prevail, carried by state-led infrastructure expansion and World Cup 2010 projects.
3. Impact on labour market and employment
The crisis has had a severe and profound impact on the labour market in South Africa in
general and on employment in particular.
In trying to link the impact of the decline in growth to the consequences for the labour
market, this paper will estimate and evaluate simple output-employment elasticity’s for the domestic
economy. The simple elasticity of employment, or the ratio of percentage change in employment to
the percentage change in GDP, provides a good indication of the sensitivity of GDP to employment
growth and hence serves as some proxy of the labour absorption rate of economic growth.3 The data
shows that GDP grew at an annualized average of 4.54 percent between 2001 and 2007 (the pre-crisis
period), whilst for the same period employment grew by 3.24 percent. In turn, in the post-crisis period
(2008 to 2009), GDP declined by 2.54 percent while employment declined by 5.64 percent. In
combination then, the total elasticity of employment more than tripled from 0.73 in the pre-crisis
period to 2.22 in post-crisis period. Put differently, the employment elasticity results show that for
every one percent growth in GDP, total employment increased by 0.73 percent in the pre-crisis period,
while every one percent decrease in GDP since the onset of the recession resulted in a decrease in
employment of 2.22 percent. This aggregate result thus suggests that employment in the South
African economy is much more sensitive to decreases in GDP than increases in GDP, since the
decrease in GDP during the recessionary period was associated with a much faster decline in
employment than the increase in employment as a result of an increase in GDP during the pre-
recession period.
In an effort to understand this result better, This paper will present in Table 2 below, the
mean employment changes and mean simple elasticity of employment from pre-to post-crisis period
by individual supply characteristics. A differentiation of the simple elasticity of employment by race
makes it clear that the impact of the crisis is heterogeneous across different race groups, with the
African race group displaying the highest elasticity in both the pre- and post-recession periods.
Furthermore, the results show an increase in elasticity for the African race group from 0.95 to 2.6
between the pre- and post-crisis periods. The elasticity results by race thus suggests two things:
Firstly, that African employment is much more sensitive to decreases in GDP than increases in GDP,
and secondly, that although Africans have gained more in formal employment than other race groups
3 It is worth noting here that we attempt to match the percentage change of total employment with the percentage change
of GDP using annual data only, in order to remove the lag effect of the employment data relative to the GDP. This will
therefore limit to taking only the annual figures of both GDP and employment from 2001 to 2009 which gives us only eight
data points for the elasticity measures. However, for the purpose of analysing simple elasticity of employment at this broad
level without formally estimating elasticity’s, this is sufficiently informative.

13
in the pre-crisis period, they were also most vulnerable to job losses when the crisis struck. In turn, the
gender elasticity results show that males appear to be the losers in both pre- and post-crisis periods:
The data suggests that males are less likely to be employed compared to females during periods of
good growth, and more likely to be retrenched than their female counterparts during periods of
recession which in turn may lead to gender-based violence and social unrest. Given the negative
impact of past apartheid practices on Black South Africans it is necessary to break down employment
into racial groups in addition to looking at it from a gender perspective.
Table 2: Mean Growth Rates and Elasticity of Employment, by Race and Sex: Pre- and Post-Crisis
Indicator Pre-Crisis (2001-2007) Post-Crisis (2008-2009)
Employment Change (%) Simple Elasticity Employment Change (%) Simple Elasticity
By Race
African 4.35% 0.95 -6.61% 2.6
Coloured 2.87% 0.73 -2.01% 0.79
Asian 1.77% 0.39 -6.21% 2.44
White -0.21% 0.01 -3.73% 1.47
By Gender
Male 2.76% 0.51 -6.81% 2.68
Female 3.91% 0.82 -4.18% 1.64
By Age
15-24 years 3.74% 0.60 -14.29% 5.63
25-34 years 3.75% 0.79 -7.31% 2.88
35-44 years 2.01% 0.36 -0.64% 0.25
45-54 years 3.66% 0.79 -4.79% 1.89
55-65 years 3.94% 0.70 -4.55% 1.79
By Education
None -3.25% -0.99 -21.35% 8.4
Incomplete GET (Gr0 - Gr8) -1.44% -0.32 -16.32% 6.42
Complete GET (Gr9 - Gr11) 6.23% 1.23 -3.87% 1.52
Complete FET (Gr12) 5.84% 1.38 -2.58% 1.01
Dipl/Cert, less than Gr 12 4.12% -0.02 -30.61% 12.05
Dipl/Cert, with Gr 12 7.14% 1.47 8.60% -3.39
Degree 4.11% 0.61 -1.10% 0.43
Total 3.24% 0.73 -5.64% 2.22
Source: SARB 2009 Economic and Financial data, Statistics SA
The vulnerability of the youth in the South African labour market is well-documented, and it is
unsurprising then, that simple elasticity estimates show that, in particular, workers aged 15-24
experienced the worst reduction in employment levels (5.63 percent) associated with a one
percentage decrease in GDP in the post-crisis period. In fact, the elasticity results for this cohort is
more than double the second highest elasticity of 2.88 for those in the 25-34 year age cohort.
Furthermore, whilst not strictly monotonic, the data shows that employment elasticity for older
cohorts was significantly lower than those derived for young people in the post-crisis period, though
the cohort most buffered from job losses during the recession were 35-44 year olds, where a one
percent decline in GDP resulted in a 0.25 percent drop in employment.
The elasticity of employment by education clearly reveals the importance of education as a
determinant of employment as well as job security, in particular, when the economy is in the midst of
a recession. The cohorts showing negative elasticity even before the advent of the crisis have
disproportionately been those with no education, incomplete GET, and incomplete grade 12 without a
diploma or certificate. Put differently, the pre-crisis elasticity for these cohorts show that they were

14
losers in employment even in the period in which GDP and employment in the economy was growing.
It is unsurprising then, that these groups show the highest decreases in employment, and
consequently the highest employment elasticity, in the post-crisis period. This is in contrast to
individuals with a complete FET, diploma/certificate with grade 12, or a degree, who experienced an
average loss of less than -0.8 percent in employment in the post-crisis period, and furthermore show
the smallest elasticity for the period. The result for better educated individuals thus suggests that the
recession has not had as dramatic and deleterious impact on their employment levels. In fact, the
extremely low estimate for highly educated workers with degrees in particular, suggests a demand for
their labour which is fairly invariant to changes in output.
The fact, as noted above, that the output impact has been heterogeneous across different
sectors of the economy begs the question of the nature of these sectoral shifts and their subsequent
impact on the demand for labour. As is clear from Table 3 below, there is a clear difference between
employment and total value added movements across different sectors, reinforcing and re-
emphasising idiosyncratic variations in output and employment shifts at the sectoral level. In
particular, the manufacturing industry witnessed the most severe decline in output, at 12.42 percent,
relative to all other industries in the post-crisis period, matched by a 10 percent decrease in
employment, thus resulting in an overall elasticity of almost 1 in the post-crisis period. Similarly, both
primary sectors also shrank by 5.54 (agriculture) and 6.72 (mining) percent since the crisis, resulting in
129 000 job losses in total in the primary sectors in the post-crisis period. Associated with these
output decreases in the primary sectors was a more severe decrease in employment in the agricultural
sector of 15 percent, both male and female workers, compared to the mining sector with a male
workforce (5 percent). In contrast, the construction industry experienced a noticeable counter-cyclical
trend, expanding at 7.9 percent in total value added in the post-crisis period, carried of course by the
public infrastructure expansion programme as well as World Cup 2010 projects.
Table 3: Mean Growth Rates and Elasticity of Employment, by Sector: Pre- and Post-Crisis
Sector
Pre-Crisis Post-Crisis
Growth Rates (%) Elasticity
Growth Rates (%) Elasticity
Empl T.V.A. Empl T.V.A.
Agriculture & Fishing -2.65 3.24 -0.91 -14.86 -5.54 2.68
Mining & Quarrying -6.78 0.05 -3.03 -4.78 -6.72 0.71
Manufacturing 2.58 4.15 0.83 -10.12 -12.42 0.81
Electricity & Water Supply 1.41 3.93 0.75 -18.18 -0.65 27.82
Construction 9.2 9.92 0.82 -4.08 7.9 -0.52
Wholesale & Retail Trade 4.16 4.13 -2.09 -10.2 -2.47 4.13
Transport & Communication 5.22 5.81 1 -4.16 -0.08 51.31
Financial & Related Services 6.83 7.01 1 3.06 -0.15 -20.48
Community & Personal Services 3.67 3.4 1.01 -2.17 3.65 -0.59
Source: SARB 2009 Economic and Financial Data, Statistics SA
Notes: T.V.A refers to total value added.
Unsurprisingly, as a consequence of the collapse in domestic aggregate demand, employment
declined in the wholesale and retail trade sector – the largest-employing sector in the economy – by
10 percent since the crisis. Though not expanded on here, this sectoral result also indirectly reflects on
the impact of the crisis on informal sector employment which was particularly adversely affected by
recession. This paper will dwell on this in further detail below. Finally, it is interesting to note that
while this credit crisis eroded employment and value-added in financial institutions around the world,
South Africa (and possibly many other emerging economics) witnessed almost no change in value-
added in its finance sector, and indeed managed to increase their employment marginally in this
sector. Thus, what began as a financial crisis in the largest developed economy of the world
manifested itself in poor employment outcomes in almost all sectors of the South African economy,
15
but mainly the primary, manufacturing, and wholesale and retail trade sectors, to the exclusion of the
financial sector.
The analysis above indicates that the employment response of the South African economy to
the recession was large and differentiated, and dependent on the characteristics of individual workers.
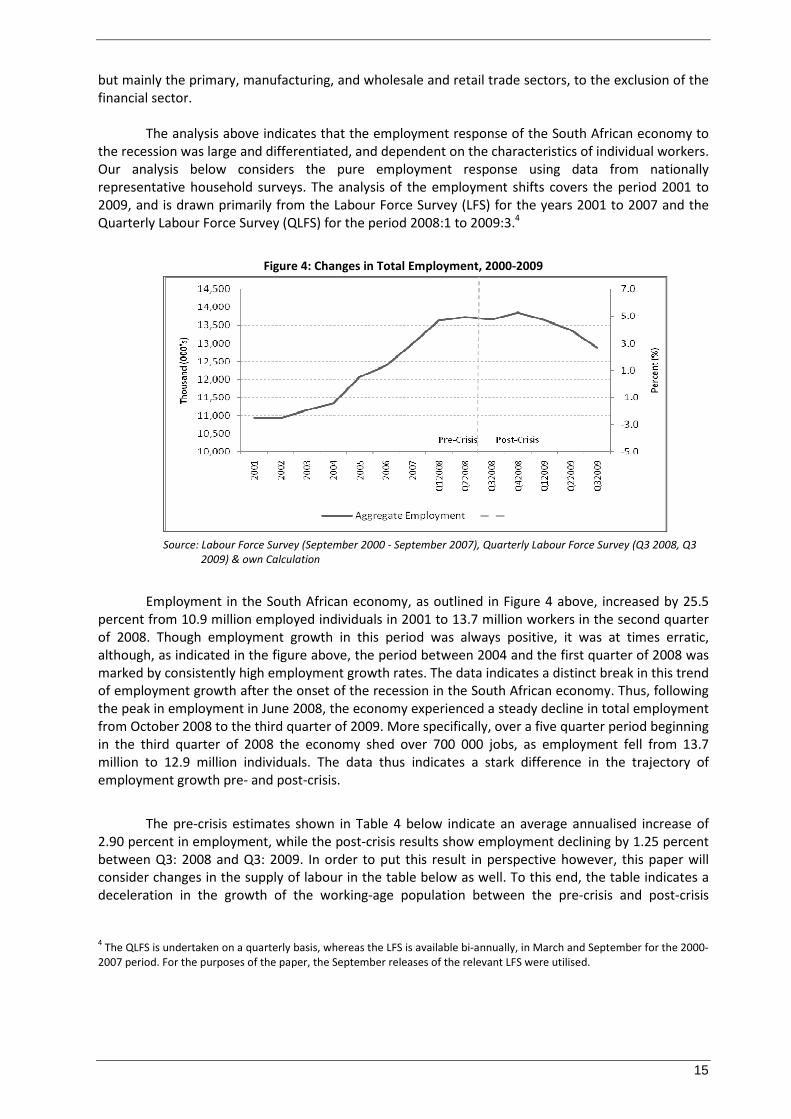
Our analysis below considers the pure employment response using data from nationally
representative household surveys. The analysis of the employment shifts covers the period 2001 to
2009, and is drawn primarily from the Labour Force Survey (LFS) for the years 2001 to 2007 and the
Quarterly Labour Force Survey (QLFS) for the period 2008:1 to 2009:3.4
Figure 4: Changes in Total Employment, 2000-2009
Source: Labour Force Survey (September 2000 - September 2007), Quarterly Labour Force Survey (Q3 2008, Q3
2009) & own Calculation
Employment in the South African economy, as outlined in Figure 4 above, increased by 25.5
percent from 10.9 million employed individuals in 2001 to 13.7 million workers in the second quarter
of 2008. Though employment growth in this period was always positive, it was at times erratic,
although, as indicated in the figure above, the period between 2004 and the first quarter of 2008 was
marked by consistently high employment growth rates. The data indicates a distinct break in this trend
of employment growth after the onset of the recession in the South African economy. Thus, following
the peak in employment in June 2008, the economy experienced a steady decline in total employment
from October 2008 to the third quarter of 2009. More specifically, over a five quarter period beginning
in the third quarter of 2008 the economy shed over 700 000 jobs, as employment fell from 13.7
million to 12.9 million individuals. The data thus indicates a stark difference in the trajectory of
employment growth pre- and post-crisis.
The pre-crisis estimates shown in Table 4 below indicate an average annualised increase of
2.90 percent in employment, while the post-crisis results show employment declining by 1.25 percent
between Q3: 2008 and Q3: 2009. In order to put this result in perspective however, this paper will
consider changes in the supply of labour in the table below as well. To this end, the table indicates a
deceleration in the growth of the working-age population between the pre-crisis and post-crisis
4 The QLFS is undertaken on a quarterly basis, whereas the LFS is available bi-annually, in March and September for the 2000-
2007 period. For the purposes of the paper, the September releases of the relevant LFS were utilised.

16
periods. Thus while, the number of 15-65 year olds in the economy increased at an annual average
rate of 1.11 percent in the pre-crisis period, they only increased by 0.3 percent in the post-crisis
period. Although this deceleration in the growth of the working-age population is not a consequence
of the global financial crisis, it is nonetheless an important result, as it implies a decline in the pool of
potential labour market participants.
In turn, while the growth in the labour force in the pre-crisis period is an important and well-
documented feature of the South African economy (see for instance Oosthuizen, 2006), post-crisis
data indicates a withdrawal of participants from the labour market. In particular, the table below
shows that the official (expanded) labour forces declined by 0.87 (0.22) percent on average in the
post-crisis period – the difference between the pre- and post-crisis growth rates in the labour force is
only significant for the official definition.5 While this result may, in part, be explained by the
deceleration in growth of the working-age population during the post-crisis period, it also hints at the
possibility that those who lost their jobs as a consequence of the crisis have chosen to exit the labour
market rather than search for employment. International studies suggest of course that in times of
recession, many of those who leave the labour market use the opportunity to upgrade their human
capital to improve their probability of securing employment.
Table 4: Growth Rates in Key Labour Market Indicators, Pre- and Post-Crisis
Pre-Crisis
(2001 - 2008:2)
Post-Crisis
(2008:3 - 2009:3)
Working Age Population 1.11 0.30*
Employed 2.90 -1.25*
Official Unemployed -1.76 0.49
Official Labour Force 1.61 -0.87***
Expanded Unemployed -3.30 2.42***
Expanded Labour Force 0.78 -0.22
Official Unemployment Rate -3.43(26.54) 1.38***(23.02**)
Expanded Unemployment Rate -4.10(34.60) 2.65**(28.42*)
Discouraged Work seekers -5.06 8.96***
Source: Statistics SA LFS (September 2000-September 2007, QLFS (2008:Q2-2009Q3) & Own Calculations
Notes: An asterisk (*) denotes that the change is statistically significant at the 99 percent level, two asterisks (**) denotes
that the change is statistically significant at the 95 percent level, and three asterisks (***) denotes that the change is
statistically significant at the 90 percent level. The percentage changes for the pre-crisis are annualised averages while those
for the post-crisis period are quarter-on-quarter changes. The actual mean unemployment rates for both periods are included
and are enclosed by brackets.
The decline in growth and employment associated with the crisis resulted in an increasing
number of people struggling to find jobs in the South African economy. It is unsurprising then that the
number of unemployed labour market participants, using the expanded definition, grew by 2.42
percent since the onset of the crisis, though, as the table above indicates, only the difference between
growth rates in unemployed using the expanded definition pre- and post-crisis was significant. In line
with this result, the data shows growth of 9 percent in the number of discouraged work seekers in the
post-crisis period. The decline in the expanded labour force in the post-crisis period was thus matched
by a decline in employment and increases in both unemployment and discouraged work seekers, with
a particularly large negative growth rate for the latter. This result lends some credence to the
assertion that a portion of retrenched workers in the post-crisis period have lost hope of finding work
and thus exited the labour market in the strict sense.
5 While the official definition of the labour force excludes discouraged workers, the expanded definition includes them.

17
As expected, data on the unemployment rate, or the number of unemployed people to the
labour force, indicates that while unemployment rates, using the formal or expanded definition, were
declining on average during the pre-crisis period, the onset of the recession resulted in a rising rate of
unemployment. More specifically, from Q3: 2008 to Q3: 2009, the official unemployment rate
increased by 1.38 percent while the expanded rate of unemployment increased slightly faster by 2.65
percent. It is important to note though that despite the fact that overall unemployment rates were on
the decline in the pre-crisis period while they increased in the post-crisis period, the peak
unemployment rate during the pre-crisis period was significantly higher than that of the post-crisis
period – the official unemployment rate peaked at 31.3 percent in September 2002, compared with a
high of 24.2 percent in Q3: 2009. This suggests that the gains from growth in the post-apartheid
period have not been completely eroded for the unemployed, given that on average the jobless rate
remained higher in the pre-crisis period by both definitions of unemployment.
It is clear from the above then, that while there was strong, positive employment growth
during the pre-crisis period, the crisis resulted in an unprecedented collapse in employment, with
more than 700 000 jobs being lost. Employment growth however was not the only labour market
indicator which weakened during the post-crisis period, as the official labour force declined by 0.87
percent and the official unemployment rate experienced a mean percentage increase of 1.38 percent.
Finally, even though the economy has started to show signs of recovery from the recession, the labour
market has yet to show that it is on the mend.6
It is worth dwelling on the decline in the labour force in the post-crisis period, since this result
presents a marked shift in one of the key characteristics of the post-apartheid labour market. Before
the onset of the recession, unemployment was, at least in part, a function of the inability of the
economy to create sufficient levels of employment for the expanding labour force as new entrants
streamed into the labour market at a rate faster than the economy was able to absorb these
individuals (Bhorat & Oosthuizen, 2006). The LFPR for the post-crisis period clearly shows in Figure 5
below a distinct departure in this trend. The initial decline in the LFPR after the onset of the crisis was
a gradual one, moving from 57.9 percent in the second quarter of 2008 to 57.3 percent in the first
quarter of 2009, after which the LFPR plummeted to its lowest level in five years by Q3: 2009 – 54.5
percent.
6 The evidence presented showed that total employment declined significantly over the post-crisis period, numbering over
700 000 employees losing gainful employment. To understand, however, in a more detailed and nuanced manner the
quantum of jobs lost as a consequence of the recession, we consider alternative estimates which may collectively assess how
the recession has impacted on total employment. The data shows monotonically rising employment from 2001 to 2008:2,
with total employment peaking at 13.7 million individuals during the pre-crisis period. By the third quarter of 2009, a mere 15
months later, total employment declined by 845 000 workers. Interestingly, these levels of employment were last observed
in September 2006. It is important to note, however, that not all the gains in employment over the last decade were
completely eradicated during the post-crisis period since the mean level of employment in the pre-crisis period was 12.13
million workers compared to the 12.88 million in Q3 2009 – representing the lowest point of total employment since the
recession. Another manner in which to evaluate the impact of the crisis would be to compare the average employment in the
pre-crisis period relative to the average employment in the post-crisis period. The results here indicate that the mean
employment for the post-crisis period was slightly higher than that of the pre-crisis period: Mean employment during the
pre-crisis stood at 12.13 million compared with a mean in the post-crisis period of 13.48 million. This comparison shows that
even though growth in employment weakened significantly during the post-crisis period, at the mean, employment levels
remained higher than the pre-crisis period. Ultimately, though, the key point here is that assessing the number of jobs lost as
a consequence of the crisis, really depends on the question. If we compared the high-point pre-crisis period to the low-point
post-crisis for example, 845 000 jobs were lost. In turn, though, a longer-term measure of comparing average employment in
the seven year pre-crisis period to the average following the crisis yields a rise in employment.

18
Figure 5: Labour Force Participation Rates, 2001 - 2009
Source: Labour Force Survey (September 2001 - September 2007), Quarterly Labour Force Survey (Q3 2008,
Q3 2009) & own Calculation
Note: The narrow definition of the labour force is used when calculating the labour force participation rates.
Though not shown here, the African labour force tracked these trends in the aggregate labour
force quite closely – this is expected since these individuals account for over 70 percent of the labour
force. In general then, the results for the labour force pre- and post-crisis are bifurcated, with an
expanding labour force during the pre-crisis period, and a shrinking one during the post-crisis period.
More disaggregated results, as shown in Appendix 1, indicate that all labour force age groups
experienced negative growth rates in the post-crisis period, though the results were generally worse
for younger labour market participants, particularly those in 15-24 year age category, than older
labour market participants. The data in fact indicates that the youth, or those between 15 and 34
years of age, accounted for 86 percent of the total loss in the labour force, or 591 thousand
individuals, between October 2008 and October 2009.
The data therefore suggests that the decrease in the labour force in the post-crisis period is
linked largely to the youth. Given this, it is possible to ascribe a delayed first-time entry into the labour
market, in part, as being the consequence of young people opting to remain longer in schooling and
the higher education system. In turn, whilst the education data suffers from a small sample size
problem, the results do confirm that individuals with a grade 12 certificate, invariably young
individuals, have opted to delay their entry into the labour market. This would suggest then that, to
some extent, young workers have responded to the crisis by choosing to accumulate additional human
capital, in the hope of improving their probability of employment in future periods. It is also possible
to conclude that the young people who do not have a grade 12 certificate tend to join the high
number of discouraged workers. They also more likely eke out a living in the informal economy.
While African workers account for approximately 70 percent of the employed, they accounted
for 638 000 of the more that 700 000, or 82 percent, of individuals who lost their jobs between the
third quarter of 2008 and the third quarter of 2009. This result suggests that blacks were
disproportionately affected by the recession, since their share of job losses is higher than their share
of total employment during the post-crisis period. Table 5 below shows the mean percentage change
for national employment trends pre- and post-crisis. The disaggregation by race re-iterates the
findings above, clearly demonstrating the sharp and significant deterioration in employment, both for
the aggregate and for the black population, with the onset of the recession. Furthermore, the data
shows that changes in employment growth between the two periods for all other race groups were
statistically insignificant. Thus, given the sharp rise in employment for the black cohort in the pre-crisis

19
period, the data suggests that whilst it was predominantly blacks who benefited from the rise in
employment in the pre-crisis period, it was also black workers who were disproportionately affected
by the collapse in employment engendered by the recession, perhaps mainly based on their lower
skills levels compared to the other racial groups.
Table 5: Mean Growth Rates in Employment, by Race: Pre- and Post-Crisis
Pre-Crisis
(2001 - 2008:2)
Post-Crisis
(2008:3 - 2009:3)
By Race
African 3.92 -1.53*
Coloured 2.50 -0.35
Asian 1.10 -0.54
White -0.17 -0.76
By Gender
Male 2.54 -1.58*
Female 3.42 -0.84**
Total 2.90 -1.25*
Source: Statistics SA LFS (September 2000 - September 2007, QLFS (2008:Q2 – 2009:Q3) & own Calculations
Notes: An asterisk (*) denotes that the change is statistically significant at the one percent level, two asterisks (**) denotes
that the change is statistically significant at the 95 percent level, and three asterisks (***) denotes that the change is
statistically significant at the 90 percent level. The percentage changes for the pre-crisis are annualised averages while those
for the post-crisis period are quarter-on-quarter changes.
Both males and females experienced large growth rates in employment during the pre-crisis
period, followed by a significant decline in the post-crisis period. The post-crisis decrease in
employment for males was higher than for females though, with the male cohort accounting for 67
percent of the loss in employment. In contrast, the pre-crisis results show an equal share of gain in
employment for both males and females. In certain circumstances, rapid population growth and
expanding youth cohorts may be considered as risk factors for instability, together with rapid urban
population growth. Since the employment of young men is an important factor contributing to social
order and peace, youth employment programmes have often focused on job creation for young men.
If young men cannot find work and become marginalized, the consequences for them and society are
very real; delinquency and social unrest.7
The overall decline in employment in the post-crisis period, when disaggregated by sector,
was matched by declines in employment across all sectors of the economy, though particularly severe
declines in employment growth rates associated with the recession were experienced by the two
primary sectors (agriculture and mining), as well as the utilities and manufacturing sector. In numbers
though, the wholesale and retail trade sector, the manufacturing sector and bore the brunt of job
losses associated with the recession, with the wholesale and retail trade sector in particular
accounting for 42 percent of the job losses in the post-crisis economy, while a quarter could be
attributed to the manufacturing sector. Taking employment shares into account too, these sectors are
clearly overrepresented in job losses since they account for around 14 percent (manufacturing) and 22
percent (wholesale and retail trade) of employment in each of the post-crisis years.
7 ILO: Gender equality at the heart of decent work, Report VI, ILC, 98
th Session, Geneva 2009

20
Table 6 Mean Growth Rates in Employment, by Industry: Pre- and Post-Crisis
Pre-Crisis
(2001 - 2008:2)
Post-Crisis
(2008:3 - 2009:3)
Agriculture, Forestry & Fishing -1.96 -3.71
Mining & Quarrying -4.89 -2.75
Manufacturing 2.64 -2.57***
Electricity, Gas & Water Supply 0.99 -2.94
Construction 8.46 -1.34**
Wholesale & Retail Trade 3.36 -1.66
Transport, Storage & Communication 4.62 -0.96**
Financial & Other Related Services 6.43 -0.02**
Community, Social & Personal Services 3.63 -0.05**
Total 2.90 -1.25*
Source: Statistics SA LFS (September 2000 - September 2007, QLFS (2008:Q2 - 2009Q3) & own Calculations
Notes: An asterisk (*) denotes that the change is statistically significant at the 99 percent level, two asterisks (**) denotes
that the change is statistically significant at the 95 percent level, and three asterisks (***) denotes that the change is
statistically significant at the 90 percent level. The percentage changes for the pre-crisis are annualised averages while those
for the post-crisis period are quarter-on-quarter changes.
The decrease in employment for the remaining industries was less dramatic than that for the
wholesale and retail trade and manufacturing sectors. Hence, while the difference between the pre-
and post-crisis mean employment shifts were significant in the transport, finance, and community
services sectors, these sectors did not experience a sizeable mean decline in employment during the
post-crisis period. For instance, employment growth for the transport, storage and communication
sector declined by -0.96 percent while the financial and business services sector experienced a decline
in growth from 6.42 percent to -0.02 percent between the two periods. Thus, while the financial
sector was not completely immune to the global crisis, it escaped relatively unscathed. However, job
losses had started to be observed only in the first 2 quarters of 2010.
Looking more closely at the manufacturing sector, this paper will note that the loss in
employment in this sector can be ascribed most visibly, but not predominantly, to the decline in global
demand for motor vehicles, as firms across the entire motor industry value chain were deleteriously
affected by this collapse in demand. To corroborate this, the within-manufacturing data shows that
workers in the manufacturing of basic metals, fabricated metal products, machinery and equipment,
and office, accounting and computing machinery were affected the most, as 102 000 of these
individuals lost their jobs. Other manufacturing sub-sectors which were also significantly affected by
employment declines due to the recession, include the wood and related products sub-sector (loss of
33 000 workers), the radio, television and communication equipment, and apparatus, and of medical,
precision and optical instruments, watches and clocks sub-sector (loss of 29 000 workers), and
transport equipment subsector (loss of 21 000 workers).
In summary, the impact on the labour market in South Africa was large and may have
exacerbated on-going structural changes prior to the crisis. For example, the case of agriculture where
employment levels began to decline prior to crises and did not come back even when GDP in
agriculture grew almost 4% in Q2 2010 (y-o-y). In fact employment fell almost 13% over the same
period. Through the crisis, some 770 000 workers lost their jobs.. The detailed individual
characteristics analysis shows that it was young, African, male or female workers with incomplete
schooling who bore the brunt of the recession. In terms of sectoral results, large job losses were
experienced in wholesale and retail trade and manufacturing, with semi-skilled workers in particular
negatively affected. Two additional employment results bear mentioning: Firstly the informal
economy has also seen the shedding of jobs. Secondly, the labour force participation rates for the
South African economy declined consistently for the first time since 1994. Young workers delayed
their entry into the labour market. Older workers also declined in participation, presumably as a

21
function of early retirement. The key outcome here though is that the crisis in South Africa witnessed
a sharp and significant decline in LFPR for the first time in over ten years.
4. Impact on systems for social protection
In attempting to link the impact of the economic downturn on social protection, the social
security architecture in South Africa needs to be understood. In Figure 6 this structure is shown. Social
grants are an anchor of the social security system in South Africa and are provided by the government
to the citizens of South Africa who qualify for each of the respective grants. Road users, workers and
employers have access to statutory funds such as the Road Accident Fund but they can also contribute
to voluntary funds such as medical schemes if they choose to. Therefore, a variety of voluntary and
statutory social security measures are in place in South Africa.
Figure 6: South Africa’s Social Security Architecture
Source: National Treasury (2010)
Social Grants
The social grant system in South Africa has always been a vital source of income for many poor
citizens, and even more so for those poor caregivers of children and the elderly.8 At the end of the
2008/2009 financial year, more than 13 million citizens were receiving social assistance benefits, with
the Child Support Grant (CSG) accounting for nearly nine million, or 58 percent, of the grants
disbursed. South Africa’s social security system is therefore a vital security net for many of its poor and
vulnerable citizens.
8 Across the regions, it is most often women rather than men who do care giving work. For example, surveys carried out in six
countries (Argentina, India, Republic of Korea, Nicaragua, South Africa and URT) found that in all of those countries, the mean
time spent on unpaid care work by women was more than twice that for men. D. Budlender: The statistical evidence on care
and non-care work across six countries, Gender and Development Programme Paper No. 4 (Geneva, UNRISD, 2008), p. v.

22
In order to analyze the response to the crisis from the grant system, the figure below
considers the uptake of various grants pre- and post-crisis. It is clear that in the pre-crisis period, the
moderate increase of 3.37% for total social-assistance recipients was mostly accounted for by Foster
Care Grant (FCG), Child Support Grant (CSG) and the Old Age Pension (OAP). However, in the post-
crisis period, new recipients for FCG have declined significantly while the overall increase of 1.79
percentage points in the growth rates of uptake of all grants between the two periods was driven
primarily by recipients of the OAP and CSG. Thus, the data points to two important findings: Firstly it is
crucial to note that the OAP and the CSG are the dominant focus of social assistance support in South
Africa. Together, these two social grants account for 84 percent of all recipients on some form of
social protection. Secondly, it is in turn these two grants which witness a very sharp rise in take-up
rates in the period following the crisis. Specifically the data shows that the number of the old age
pension recipients increased by 160,984 over the crisis period, while the rise in CSG recipients was
from 8,189,975 to 8,765,354. Clearly then fiscal support assistance grants through these social
effectively persons increased as a consequence of the economic crisis in South Africa.
Figure 7: Weighted Percentage Change in Number of Social-Assistance Grant Recipients: Pre- and Post-Crisis
Source: Development Indicators, 2009
Note: Social grants are classified into Child Support Grant (CSG), Care Dependency Grant (CDG), Foster Care Grant (FCG),
Disability Grant (DG), Old Age Grant (OAG), War Veteran’s Grant (WVG) and Grant in Aid (GIA)
In expenditure terms too, Figure 8 below shows a faster growth in grant expenditure in the
post-crisis period (13.92 percent) compared to the period before the crisis stuck (9.53 percent).
Unsurprisingly, the bulk of the surge in spending can be attributed to the increase in the number of
old age grant and child support grant recipients. Thus, by the end of the 2008/2009 financial year, the
government spent a substantial R26,429 million (or 1.1. percent of GDP) on OAP, while the CSG cost
the state R23,367 million or (1 percent of GDP) (National Treasury, 2009).

23
Figure 8: Percentage Change in Social-Assistance Grant Expenditures: Pre-and Post-Crisis
Source: National Treasury, 2009 Expenditure Estimates
Note: Social grants are classified into Child Support Grant (CSG), Care Dependency Grant (CDG), Foster Care Grant (FCG),
Disability Grant (DG), Old Age Grant (OAG), War Veteran’s Grant (WVG) and Grant in Aid (GIA)
Unemployment Insurance Fund
The Unemployment Insurance Fund or UIF is an insurance fund to which employees
and employers in the economy contribute9, and which offers short-term financial assistance
to registered workers when they become unemployed or are unable to work because of
illness, maternity, or adoption leave. Thus, employees who are registered with the UIF and
who have been paying contributions to the Fund can claim from the Fund if they lose their
jobs or cannot work.10 The UIF, as shown in Figure 6, is thus the only component of South
Africa’s social security architecture which is specifically aimed at the unemployed.
As far as unemployment benefits are concerned, registered workers can claim from
the Fund if they have been dismissed or retrenched, or if their contracts have expired.11
Naturally then, one of the major responses as far as the 2008 recession is concerned is the
response in terms of UIF claims of retrenched workers. Using available UIF data for 2009, on
the left hand side of Figure 9 below a total of 275,586 new unemployment claims were made
between April and August 2009. Data on the right hand side of Figure 9 below puts these new
9 Specifically, employers must pay unemployment insurance contributions of two percent of the value of each
worker’s pay per month to the UIF, with the employer and the worker contributing one percent each. UIF contributions are
applicable to all workers and employers except those working less than 24 hours a month, learners, public servants,
foreigners working on contract, employees in receipt of an old-age pension, and workers who earn only commission.
10
There are 5 kinds of benefits covered by UIF: unemployment benefits, illness benefits, maternity benefits, adoption
benefits and death benefits. The Fund also assists the dependents of a contributing worker who has passed on.
11
Those contributing to the Fund for four years or more can claim for up to 238 days, while those contributing for a shorter
period can claim 1 day for every 6 days that they worked while contributing to the Fund. The Fund pays a percentage of the
wage/salary that the claimant earned while contributing to the fund, with the highest amount that can be paid equaling 58
percent of the person’s daily salary.

24
claims into perspective showing a substantial rise in the value of payments made between
April and August 2009 together with a steep rise in the number of beneficiaries.
Figure 9: UIF Payments and Beneficiaries, 2008 and 2009
Source: DPRU (2010) and National Treasury (2010)
While this paper does not have data prior to April 2009 to which to compare the number of
new claims, it is noted, as shown in Figure 9 above, that the number of new claims increased in every

25
month between April and July, and then decreased slightly between July and August. The results for
August thus suggest a possible slowdown in the growth of new claims on the UIF, but this paper will
note that aggregate new claims continued to expand, suggesting that the unemployment
consequences of the recession remain evident for those in the formal economy. The monthly increase
in new claims for most of the period between April 2009 and August 2009 is unsurprising given that
unemployment data from the Quarterly Labour Force Surveys (QLFSs) indicates a significant increase
in the broad unemployment rate from 27 to 29 percent between April and August 2009.
Disaggregating aggregate new UIF unemployment claims (275,586) between April and August
2009 by types of claims in Figure 10 below, this paper will find that 39 percent of claims were due to
contract expirations, followed by retrenchments (28 percent), and dismissals (22 percent). While it
may seem surprising that contract expirations dominated new claims, this paper highlights that
refusing to renew contracts is an effective form of downsizing, suggesting cost strains and profit
margin pressures on employers during the recession.
Figure 10: Average Share of New Claims, by Type of Claim
Source: DPRU (2010)
Thus, contract expirations, retrenchments and dismissals together accounted for 89 percent of
new claims in the period between April 2009 and August 2009, and this is further evidence of the
effect of the recession on employment conditions in the economy during the middle of 2009.
Provincial data is particularly interesting since it indicates, to some degree, the reach of the UIF in
different regions of the country. The data indicates that the largest number of new claims emanated
from Gauteng (27 percent), the Western Cape (19 percent), and KwaZulu-Natal (19 percent). While
these results are not surprising since these provinces account for the largest relative shares of
employment in South Africa, the data further shows that monthly growth in new claims over the
period (see Bhorat et al, 2010) was highest for the Eastern Cape. This result may be indicative of the
economic shock to the local motor industry as a result of global shocks in the industry.

26
Figure 11: Average Share of New Claims, by Province
Source: DPRU (2010)
Furthermore, when comparing the total claim share to total employment share across
provinces (see Appendix 5) the data timidly indicates that the UIF better serves those in metropolitan
areas rather than rural areas with the claim share to employment share being particularly low for the
Eastern Cape, Free State, and the North West. Although such a direct interpretation on ratio of shares
is oblivious of many other factors that could influence the legitimacy of the results, it seems- to imply
that there exists some level of service disconnect or lags in UIF claims particularly for rural and poorer
provinces.
Overall, the education results in Figure 12 below indicate that those with minimal skills and
lack of education are at far greater risk of losing their jobs during the recession than any other
education cohort in the economy. Furthermore, it is clear from the education data that those workers
in the economy with either grade 10, 11 or metric education were most likely to face unemployment
during the recession, and this points to the inability of the schooling system to ensure employment for
those who either completed or almost completed their schooling. In turn, the age data shows that
younger workers (25-44 year olds), on average, are more likely to benefit from UIF payments since
they are more likely to get retrenched than older workers (45-65 year olds), whose experience and
undocumented expertise has counted in their favour as far as recessionary retrenchments are
concerned. This is consistent with QLFS data in the period showing a marked increase in youth
unemployment rates relative to older age cohorts.

27
Figure 12: Average Share of New Claims, by Education and Age
Source: DPRU (2010)
Notes: The ‘special school’ result for education refers to those with a matric education.
While the analysis above shows the number of new UIF claims during the middle of 2009, this
paper will next turn to data from the National Treasury’s Budget Review 2010 to compare the scale of
aggregate UIF beneficiaries and payments before and after the recession. Looking more closely at the
actual number of beneficiaries, the table below shows that while there were 140 086 UIF recipients
per month in the economy in 2007/2008, by the 2009/2010 financial year this number increased
substantially to 207 967. In terms of spending, UIF spending almost doubled from USD 286 million in
the 2007/2008 financial year to USD 560 million in 2009/2010. It is clear then that there has been an
enormous response in terms of UIF uptake and spending due to the recession.
Table 6: UIF Benefits and Beneficiaries, 2006/2007 – 2009/2010
UI Indicator/ Year 2006/2007 2007/2008 2008/2009 2009/2010
UIF Recipients per Month 154 546 140 086 164 301 207 967
UIF Benefits (USD millio) 284 330 405 563
Source: National Treasury (2010)

28
Aside from the response in terms of unemployment insurance coverage linked to the
recession, the UIF board has in addition approved a sum of R2 billion to be invested with the Industrial
Development Corporation to be used as part of the capital available to assist sectors in distress. Thus,
the response in terms of both UIF uptake as well as investment of UIF funds in order to assist sectors
in distress due to the recession has been substantial. However, this paper will note several areas of
concern. Firstly, the provincial data appears to indicate that UIF is more accessible to provinces with
large metropolitan areas rather than more rural provinces. More disaggregated data on the
beneficiaries of the UIF relative to the losers in employment will shed more light on the matter.
Secondly, data is not available on the number of days of benefits received by workers. Access to this
data will provide a clearer picture on the extent to which the UIF is able to adequately protect
unemployed workers during the recession. Finally, the UIF is only available to workers in the formal
sector of the economy leaving vulnerable informal sector workers to fend for themselves during
recessionary periods. To this end, the UIF board has commissioned an investigation into how UIF
benefits can be improved (The Presidency, 2009), and it has been indicated in media reports that
legislative amendments to include people not currently covered by unemployment insurance, such as
workers in the informal sector, are currently being considered.12
The impact on HIV and AIDS
The links between unemployment and HIV and AIDS have been studied in relation to Africa
and specifically to South Africa. In particular, already in the pre-crisis period a study conducted in
200113, showed that the pandemic depresses labour demand through three effects:
1. Declines in the rate of overall economic growth
2. Pronounced declines in sectors that supply investment commodities particularly the construction and
equipment sectors (employing many unskilled and skilled labour
3. AIDS induced morbidity effects on unskilled and semi-skilled workers that tend to depress output in
those sectors, with further negative implications for employment
The crisis, resulting in higher unemployment rates among young people and unskilled workers,
has exacerbated this trend. Furthermore, higher levels of unemployment, due to the financial crisis
can increase the vulnerability of women and men and their level of inability to access prevention or
mitigate the impact by accessing care and support. Studies have shown the link between economic
status and a) HIV knowledge and b) sexual behaviour in South Africa14. Following the study’s
conclusions, this paper will maintain that the economic crisis pushing more people out of the labour
market is likely to result in a decreased access to knowledge around HIV, but also in an increased risky
behaviour, as well a reduction in peoples (especially women) negotiating power. This risks
perpetuating the vicious circle of HIV vulnerability, social exclusion and unemployment. The high levels
of unemployment among the youth populations, discussed supra, will also have an effect on young
people’s vulnerability to HIV, exacerbating the already high prevalence rates (8.7 % in 200815)16).
Women are more likely to become infected and are more often adversely affected by the HIV/AIDS
epidemic than men for a range of socio-cultural and economic reasons; biological differences also play
a part. The greater the gender discrimination in societies and the lower the position of women, the
more they are negatively affected by HIV.17
12
http://www.fin24.com/Business/UIF-coping-with-surge-in-claims-20100323 13
C Arndt, G Lewis, The HIV/AIDS impact in South Africa: Sectoral impacts and unemployment, Journal of International
Development, vol 13, 427-449, 2001
14 L S Tladi, Poverty and HIV/AIDS in South Africa: an empirical contribution, Journal des Aspects sociaux du VIH/Sida, vol 3,
No 1, 2006 15
South African National HIV Survey, 2008 16 South African National HIV Survey, 2008 17
ILOAIDS: Gender and HIV/AIDS in the World of Work, Geneva, 2005.

29
In terms of the impact of the recession on spending, in South Africa, the government budget
for health has been substantially cut due to the financial crisis. This has seen a US$123 million shortfall
in the country’s public sector ARC programme. Furthermore, large private firms, especially mining
companies, are likely to cut their HIV and AIDS prevention programmes. In a survey conducted by ILO
in 200918, the interviewees from South Africa argued that businesses are re-prioritizing their budgets
and the focus is on company survival and staff retention. The Employers’ organizations reiterated that
most of the funding for HIV/AIDS programming came from their membership, and since the crisis has
affected their membership, the resources available for implementing HIV/AIDS workplace
programmes has reduced considerably. In some countries, interviewees emphasized that the crisis
may reduce profits and this may lead to a reduction in Corporate Social Responsibility (CSR) initiatives.
It is clear that the impact of the financial crisis is being felt at the level of the umbrella organizations
(e.g. Employers’ and Workers’ organizations) and also at the level of the individual
enterprises/companies. The study also suggests that employers and businesses do not consider
HIV/AIDS workplace programmes as core to their business and when faced with a reduction in their
budgets, would re-allocate resources to other areas considered more important to their survival.
This will affect thousands of employees and their families. International donors tend to direct
more funds to lower income countries and to focus more on strengthening health system
programmes, thereby extending their focus to include other health issues in addition to HIV and AIDS.
Severe ARV shortages have caused many clinics to stop enrolling patients into ARV programmes and
the waiting lists are growing day by day. To address some of the challenges, the Government
announced that significant improvements to public sector HIV treatment protocols would be
implemented from 1 April 2010. These improvements will enable earlier access to treatment for
children under the age of one as well as TB patients and pregnant women. The President also
announced the launch of a massive testing campaign to mobilise all South Africans to know their
status – the entry point for HIV prevention and treatment, care and support.
5. Impact on wages and working conditions
South Africa has 17 million economically active people but a high unemployment rate. The
unemployment problem is mainly related to structural factors, such as the high rate of population
growth and the existence of large sectors of the economy that are poorly developed but has been
exacerbated by the crisis. The SA labour market is complex and is categorized by different segments
and factors. In the main approximately 30% of wage earners have their wages and working
conditions regulated by collective bargaining whereas the remainder are either regulated by sectoral
determinations or find themselves an unstructured and sometimes under regulated environment or in
the informal sector. In 2008 there were 3.3 million union members in South Africa, representing nearly
40% percent of wage earners. South Africa’s high aggregate level of income inequality increased
between 1993 and 2008. The Gini coefficient in South Africa rose from 0.66 in 1993 to 0.68 in 2000
and further to 0.70 in 2008. This has been attributed to both rising unemployment and rising earnings
inequality within the labour market (Leibbrandt, M. et. al. 2010). The global economic crisis has had a
particularly hard hitting impact on working people, their families and communities in SA. The crisis has
intensified the dispossession of the commons (including both local resources and public goods such as
health and education), the informalisation of labour, unemployment and national social inequality.
18
The impact of the financial crisis on the world of work and HIV/AID Services: An ILO Study in 10 countries in Sub-Saharan
Africa, ILO, 2010

30
There are however examples of positive areas in the period leading up to the crisis which have
not been totally eroded by the said crisis. An increase in enforcement of the Minimum Wage in South
Africa has resulted in a decline in poverty levels, especially for domestic and farm workers, research
covering the period 2001 – 2007 has found. It was also found that overall real wages of covered
workers increased significantly at 2.1 percent per annum between 2001 and 2007. This rise in real
wages was driven by the domestic and farm worker sectors, which experienced real wage increases of
6.6 and 7.3 percent respectively. The significant rise in wage levels in these two sectors may indicate
that minimum wages have had an effect on vulnerable sectors. However, domestic and farm workers
still remain amongst the most vulnerable in the labour market.
The proportion of workers with a written contract also increased significantly during the
period prior to the crisis, as did the number of workers with an employer paying UIF contributions on
their behalf, or contributions to a pension/retirement fund. Whilst overall there was an improvement
in working conditions amongst workers covered by sectoral determinations during the 2001 to 2007
period, domestic workers still remained the worst off, along with workers in the farm, forestry and taxi
sectors. Domestic, farm, forestry and taxi workers were the least likely to receive benefits such as
paid leave, a written contract, pension/retirement, UIF, and medical aid. In other sectors, there was an
increase in all these areas, from receiving benefits to getting a written contract. The crisis has however
has seen an erosion of some of these gains mainly seen through the retrenchment of workers.
Three successive quarters of negative growth in gross domestic product from the fourth
quarter of 2008 to the second quarter of 2009 detracted from labour productivity advances, resulting
in annual labour productivity growth in the formal non-agricultural sector slowing from 1,9 per cent in
2008 to 1,6 per cent in 2009. With formal sector employment having fallen more significantly than
production over the year to the first quarter of 2010, measured labour productivity rose strongly. The
year on-year rate of increase in labour productivity amounted to no less than 5 per cent in the first
quarter of 2010 and 4,6 per cent in the second quarter. A marginal increase in employment in the non-
agricultural sector of the economy, combined with a moderation in total output in the economy,
resulted in the small deceleration in labour productivity during the second quarter of 2010.
At the workplace attempts to address growing wage gaps between low and high wage earners
placed pressure on labour relations and exacerbated tensions, as can be seen in the recent strike wave
in South Africa. This is especially important as rising inequality has devastating effects on society, as
more and more people are pushed to margins of production and consumption patterns. This includes
issues of the distribution of productivity growth, minimum wages and basic income grants as well as
policy issues of taxation and redistribution. The most severe impact of the crisis led to an increase in
employment leaving these workers and their dependants totally reliant on the state for any form of
social security. This has in some instance been tempered by UIF claims.
In the formal collective bargaining arena (30% of employees) the year 2010 saw mostly
inflation linked increases or in some instances higher that inflation increases. This has helped to
absorb some of the pressure on employees but this was unfortunately marked by a number of big
strikes before such agreements were reached, e.g. a public sector strike. In areas falling outside of
formal bargaining arrangements minimum wages are set by government. Furthermore labour law
clearly regulates many of the working conditions required for workers. The challenge that raised its
head during the crisis is that many employers merely ignored the regulated wages and minimum
conditions of employment arguing that they found themselves in a survival mode and therefore not in
a position to comply.

31
Much of this non compliance has gone undetected because of the lack of labour inspectorate
capacity to enforce existing agreements or the law. In the textile industry when some of the
employers were ordered to comply with the minimum wage agreements and the minimum working
conditions they closed down their factories indicating that they would prefer relocate to another
country that was more sympathetic to their plight as compliance would lead to their companies not
being viable entities. This had the potential of a loss of 30 000 jobs in the textile sector.
This matter has been the subject of ongoing negotiation in the textile industry in order to try
and find a resolution. As at the beginning of 2011 the matter still remained unresolved. The wages
and working conditions have also been adversely affected by the high levels of unregulated migrant
workers flowing in from neighbouring countries who offer their services on the labour market at a
much lower rate than that prescribed by collective agreements or regulation. This has in some
instances led to high levels of frustration and even the outburst of isolated instances of xenophobia.
With the increase in unemployment at the advent of the crisis many employees have entered the
informal labour market. This has led to a decrease in wages and conditions of employment with a
concomitant increase in poverty levels of the employee and his/her dependants.
Another area that needs to be mentioned is that of the small business arena. Once again given
the lack of monitoring and inspection capabilities it is difficult to monitor and enforce agreed and/or
regulated minimum wages and conditions of employment. Hence with the downturn in the economy
as a result of the crisis the indications are that this sector has also seen a decrease in the levels of
wages and working conditions. A current question is how to strengthen the link between wages and
productivity as the country enters into a path of recovery. The first point that needs to be
acknowledged is that jobs have continued to be lost since the economy moved out of the recession
which has some serious implications for the “New Growth Path” released by government in November
2010.
6. Impact on labour standards, including freedom of association and the right to collective bargaining
The impact of the crisis on labour standards has not been formally assessed. Research is
underway on the impact of the crisis on collective bargaining. One particular concern relates to the
role of labour brokers. It is clear that post-crisis employment decreased dramatically in the primary
sectors as well as in the Wholesale and Retail Trade, and Manufacturing sectors. Labour brokers and
labour broker activities are typically found within these sectors but unfortunately inadequate data
exists to support this empirically. Assuming that labour broker activities fall largely within the sphere
of primary, manufacturing and commerce sectors, it could be argued that permanent workers in those
sectors were most vulnerable to job losses post-crisis, and that increasing use was being made of
temporary agency contracts in those sectors. According to the employers federation CIETT
(International Confederation of Private Employment Agencies), the sectoral distribution of temporary
agency work in 2009 for South Africa was 23% Manufacturing, 38% Services, 17% Construction, 4%
Public Administration, 2% Agriculture and 16% Other sectors.19 The inability to monitor and enforce
labour standards where labour broking is involved has led to some situations where workers are
subject to below acceptable labour practices. This has led to an emotional public debate and the
possible imminent change to labour legislation to more firmly manage contracts of employment and
the employment relationship, as well as to find an appropriate way to address issues surrounding
private employment agencies.
19 CIETT: The agency work industry around the world, 2011 edition, (Brussels, CIETT, 2011), p. 34.

32
Table 7: Employment by Type
Occupation Employment Nov 2010 Percentage change vs. Nov
2010 (annualized)
Typical (permanent, full‐‐‐‐time) 9,079,761 - 0.21
Atypical (temporary, part‐‐‐‐time) 3,783,462 0.07
‐‐‐‐ of which agencies 979,539 3.84
Total 12,863,223 - 0.13
Source: Adcorp Employment Index December 2010 (Release date: Tuesday, 10 January 2011)
Impact on bargaining: the Textile industry in KwaZulu-Natal
In August 2010, clothing manufacturing bargaining councils initiated state-sanctioned raids on
workplaces in KwaZulu-Natal, on the east coast of South Africa. At least 47 factories were raided due
to non-compliance with the minimum wage. Resulting from the raids was the closure of 30 factories:
Two by the local sheriff, and the rest in solidarity with their colleagues who were pressured into
paying the legal minimum wage. These factories are paying their workers below the required
minimum wage of R324 a week, with some as low as R90 a week. The Newcastle Chinese Chamber of
Commerce, which owns a number of factories in the area, suggested that if bargaining councils
expected the factories to pay all workers above the minimum wage, retrenchments would be the only
option. Due to the high volumes of textile imports from China, it will not be viable for their company
to continue if all workers are paid above minimum wage, the employer argued.
Newcastle (where some of the factories are situated) already has a 60 per cent unemployment
rate. Workers employed by the factories are willing to rather work for a low pay than be unemployed.
More than 15 000 jobs at 385 factories across the country are at risk. Indeed workers have indicated
their willingness to work at the lower wage. Indeed this particular series of events is a stark
manifestation of the harsh wage-employment trade-offs evident in the developing world. The search
for a decent wage on the one hand, needs to be counter-balanced by the creation of employment
opportunities on the other hand. Discussions between factory owners and bargaining councils are still
in process, whilst a new wage model is under consideration and discussion.
Important knowledge gaps that exist in understanding the impact of crisis which need to be filled for improved policy-making
Substantial resources are invested into producing the labour force statistics and Stats SA has a
lot to offer on the impact of the crisis as a result. Unfortunately, not enough people who might
potentially utilise these data are aware of what is on offer. Areas for exploration include developing a
section on the web, simple publications that are accessible to less technically skilled readers, and
deliberate efforts to engage with bodies like the Commission on Gender Equality and new Ministry of
Women, Children and Disabled People.
Examination of the Quarterly labour Force Survey officer’s manual reveals that it says virtually
nothing about gender issues and the impact of the crisis. It is likely that the training offered to survey
officers is similarly gender-blind. One of the first steps of the proposed new gender unit in STATSSA
could be to revise the manual so that it alerts trainees to gender issues, and to check that the training
of officers is aligned with the revised manual. The QLFS questionnaire could be made more gender-
sensitive by including questions on unpaid care work such as child care and housework, questions on
income, questions relating to informal work, questions on migrancy, and questions on rural/urban
location. Stats SA should also give serious thought to how to refine the income question so that it is
better suited to non-employees.

33
Part II: Description of crisis response and recovery policies
The analysis above showed that the global recession resulted in South Africa – a strongly
integrated, trade-dependent economy – sliding into recession in late 2008, leading to the largest
contraction in the economy since the advent of democracy (The Presidency, 2009). As a result from
October 2008 to the third quarter of 2009, the economy shed approximately 700 000 jobs, as
employment fell to 12.9 million individuals. In responding to the crisis, the social partners comprised
of organized labour, business, and government met to consider their options and tabled and adopted
the ‘Framework for South Africa’s Response to the International Crisis’ in February of 2009 in Cape
Town (The Presidency, 2009).
Principles that guided the crisis response included ensuring that activities were aimed at
building decent jobs both during and beyond the crisis; maintaining the planned high level of
investment in public sector infrastructure; encouraging the private sector to maintain and improve
their levels of fixed direct investment and continue with Corporate Social Investment (CSI); and finally
the adoption of targeted, tailored and timely interventions to address the impact of the crisis (The
Presidency, 2009). The partners agreed on a stimulatory response to the crisis, which incorporated
both direct interventions as far as job losses in vulnerable sectors were concerned, as well as the up-
scaling of interventions already in existence.
A. Accelerating employment creation, jobs recovery and sustaining enterprises
1. Measures to boost effective demand and help maintain wage levels through including macro-economic policies:
The parties to the NFA agreed that fiscal and monetary measures were necessary to address
the economic crisis. These needed to be counter-cyclical to prevent a recession and to minimize the
job losses within South Africa. They agreed that the South African Reserve Bank (SARB) needed to
manage and adjust monetary policy accordingly. The value of a competitive exchange rate was also
recognized. The currency’s impact on trade and employment were discussed and proposals were laid
forward to utilize incentive measures for building opportunities for a more competitive exchange rate.
Proposals regarding tax relief to the vulnerable groups such as low-income workers were also tabled.
a) Monetary policy, e.g. quantitative easing and credit expansion
The percentage change in inflation was positive at 10.33 percent in the pre-crisis period, while
post-crisis inflation collapsed at an average of -10.5 percent over the period. This slowdown in
inflation signifies a rapid decline in consumption expenditure, and more generally, a slowdown in
domestic economic activity during the recession. Analogously, given the inflation targeting policy of
the South African Reserve Bank, the interest rate increased moderately on average before the crisis
struck, but with the collapse in inflation associated with the global recession, the nominal interest rate
declined at an average rate of -21.25 percent in the post-recession period. This significant and sudden
drop in the nominal interest rate from the third quarter of 2008 stands as evidence of the attempt
made by the monetary authorities to kick-start the contracting economy. Despite the measures taken
however, money supply remained stagnant growing at an average of only six percent since the
financial crisis. Furthermore, the growth in credit extension though financial institutions slowed down
in the post-crisis period and in fact declined in the last quarter of 2009, suggesting that lending

34
institutions did become notably more circumspect around the provision of credit and financing to both
firms and households since the onset of the recession.20,21
One aspect that has assisted South Africa in remaining relatively stable during the crisis has
been the introduction of a Consumer Credit Act. This has led to strict lending policies and has
benefited the financial markets significantly. In 2005 the South African Government decided that
something needed to be done about debt provision and helping over-indebted consumers. The
National Credit Act was promulgated in 2005, passed into law in 2006 and implemented on the 1st
June 2007. Many economic experts are of the opinion that the forward thinking of the South African
Government is one of the key reasons that the country largely escaped the worst of the economic
crash that hit Europe and the USA in 2008. The Act provides for the control and regulation of ALL
credit transactions - mortgages, credit cards, overdrafts, micro loans, pawn broking and contract loans
such as hire purchase of assets.
The Act also regulates all institutions that provide consumer credit including banks, furniture
companies, clothing, other retailers, micro lenders and pawnbrokers. The Act also regulates credit
bureau and consumer credit information, providing for free access to the information kept at the
credit bureau, and for a process by which any errors on the credit records of consumers can be
corrected. In addition the Act makes provision for the registration of debt counsellors and debt
restructuring for over-indebted consumers. It was these elaborate structures and systems put in place
by the national credit Act which ameliorated the impact of the crisis in the financial market.
The Reserve Bank Governor began a process of cutting interest rates to encourage spending
and to boost economic growth. The Monetary Policy Committee (MPC) of the South African Reserve
Bank (the Bank) first reduced the repurchase rate in December 2008 and subsequently lowered it
further in several steps. This brought the cumulative reduction over the last nine months of 2009 to 5
percentage points and the level of the repurchase rate to 7 per cent per annum. Other interest rates in
the money market remained well aligned with this policy rate. The effect was that South Africa had
the lowest interest rates for the past forty years in its endeavour to counter the impact of the crisis. To
date the Reserve Bank maintains the low interest rate regime.
b) Fiscal policy, e.g., stimulus packages
Fiscal indicators such as the government debt level and the government deficit to GDP ratio
were very high in 1994, but prudent macroeconomic policies in the post-apartheid years saw the level
of both government debt and the deficit to GDP ratio steadily decline in the post-apartheid period.
This allowed government to respond to the economic downturn by maintaining expenditure on social
projects as well as investing in the country’s infrastructure requirements, thus reducing the impact of
the recession on the economy. Table 8 below therefore shows that while government expenditure
stood at R593 billion in 2007/2008, it increased by 20 percent to R714 billion by 2008/2009. In turn,
the period between 2008/2009 and 2009/2010 once again saw a rise in government expenditure by
17 percent to R835 billion. As a result, government expenditure as a percent of GDP increased from 28
percent in 2006/2007 to 34 percent in 2009/2010. Government thus adopted an expansionary policy
20 One of the additional determinants of this reduced access to credit was the passing of the National Credit Act (NC in 1997),
which effectively made it much harder for households and firms to raise credit through financial institutions.
21 In a bid to counter the effects of reduced credit in the economy, the National Debt Mediation Association was created.
This business initiative sought to assist indebted consumers by providing rules, standards, and processes to address debt
restructuring, including term extensions, reduction of interest rates, and payment holidays. A full report of the success of the
initiative was to be provided to NEDLAC, but early indications are that the pilot project achieved a success rate of 57 percent
(The Presidency, 2009).

35
in terms of spending during the recession, in part, to maintain social service and social security
commitments. At the same time, the data below indicates that government revenue declined between
2008/2009 and 2009/2010 due to decreased tax receipts arising out of a contracting economy.
Specifically then, tax receipts declined to 27 percent of GDP in 2009/2010 from 30 percent in the
previous two financial years. It can thus be said that government adopted an expansionary approach
during the recession despite the fact that tax revenue was on the decline as a result of increasing
unemployment.
Table 8: Consolidated Government Fiscal Framework, 2006/2007 – 2009/2010
2006/20
07
2007/2008 2008/2009 2009/2010
Revenue as a % of GDP 541 224 627 669 689 672 657 552
29.50% 30.2% (16%) 29.7% (10%) 26.8% (-5%)
Expenditure as a % of GDP 518 447 593 269 713 890 835 324
28.30% 28,5% (14%) 30.8% (20%) 34.1% (17%)
Total GDP 1 833 2 081 (14%) 2 320 (11%) 2 449 (6%)
Source: National Treasury (2010)
Notes: Annual Percentage change in parenthesis. Actual revenue and expend are in millions of rands
This paper is particularly interested in government spending in the period pertaining to
investment, since investment is essential for long-run growth. Data from the South African Reserve
Bank indicates that general government investment as a proportion of GDP remained at 3 percent
between 2007 and 2009. However, more disaggregated data from the Budget Review 2010 shows that
expenditure on capital by government grew as a proportion of total consolidated expenditure from
4.5 percent in 2007/2008 to 6.9 percent in 2008/2009. This capital investment includes investment in
economic infrastructure, hospital revitalization programmes, and building of schools and sanitation
services (National Treasury, 2010). Furthermore, government announced a R787 billion infrastructure
programme in February 2009, encompassing the expansion of public, energy, transport and social
infrastructure. Furthermore, investment in public corporations as a proportion of GDP rose
substantially from 3 percent of GDP in 2007 to 5 percent of GDP in 2009, highlighting the expansionary
stance taken during the recession.
Thus, in terms of fiscal policy, government chose to expand during the recession, spending on
programmes related to 2010 World Cup projects, as well as on other infrastructure projects in order to
cushion the economy from the harsh effects of the recession. Notwithstanding government’s efforts,
the economy, as noted above, still witnessed a decrease in employment of some 700 000 jobs
between the third quarter of 2008 and Q3: 2009. Without increased government spending in the
period however, it is likely that the effect of the recession on employment levels would have been
much more severe. With the decrease in tax revenue and maintenance of government spending
during the recession though, there has been a sharp rise in the deficit to GDP ratio, as shown in Figure
13 below, shows the deficit/surplus between 2005 and 2010 for South Africa and two comparable
countries – Brazil and India. Unsurprisingly, the figure shows increasing deficits for all three countries
between 2008 and 2010, suggesting that these governments maintained investment and expenditure
spending during times when tax revenues were declining in order to help cushion and resuscitate
struggling economies. During the height of the crisis in 2009, spending by the Indian government
resulted in the rise of the deficit to 6 percent of GDP in the 2009/2010 financial year (Reserve Bank of
India, 2010). In a similar vein, the Brazilian deficit increased from 0.83 percent of GDP to 3.42 percent
of GDP between 2008 and 2009. Finally, the South African experience too indicates a substantial
increase in the deficit of 6 percentage points in the same period.

36
Figure 13: Fiscal surplus/deficit (% of GDP)
Source: The World Bank, Department of National Treasury, International Monetary Fund
These rising deficits have raised concerns around liquidity in countries around the world, thus
prompting economies to consider ways in which to reduce the deficit in the medium-term. To this
end, medium-term estimates of the projected fiscal deficit for South Africa indicates that the
government intends to decrease the deficit to -4.7 percent of GDP by 2012/13, by reducing spending
as well as increasing revenue (National Treasury, 2010).
2. Investment in infrastructure, public services, green production, and R&D
The parties to the NFA agreed that there was a need for significant investment in
infrastructure to respond to the economic downturn. To this end, the South African Government had
announced a major public investment programme, totalling R787 billion over three financial years to
2012. This programme included: road and rail networks improvement and expansion, increasing low-
income housing and publicly owned rental stock, launching energy generation projects, the erection of
more infrastructure with regards to dams, water and sanitation systems, and the increase of
educational and health structures. Through these projects, decent jobs were created by using labour
intensive processes. Private investments were also encouraged to follow in the footsteps of the public
infrastructure expansion. The parties to the NFA also agreed that South Africa needed to develop
strong capacity in green technologies and industries. ‘Green’ jobs are also encouraged and an
incentive scheme is proposed to launch the employment of workers in these industries. Building on
the government’s commitment to develop ‘green jobs’, the Construction Industry Development Board
(CIDB) made recommendations for a scheme in 2009 on the Green House Gas Emission Reduction
Potential of Buildings in South Africa. The scheme recognizes the opportunity for employment
creation and increased efficiencies in the response to climate challenges. The scheme seeks to grasp
this opportunity by supporting the creation of decent and green jobs in SME operating in the local
building and construction sector. It seeks to ‘unleash’ the enterprising spirit of these SMEs to enter the
high growth market for green building services, in the process formalizing their operations, creating
new jobs and reducing the carbon footprint of the local built environment. The scheme will have a
-.08
-.06
-.04
-.02
0.0
2C
ash
surp
lus/
defic
it (%
of G
DP
)
2005 2006 2007 2008 2009 2010Year
South_Africa IndiaBrazil

37
sector focus on the building industry. The industry was chosen for intervention in the short term due
to its high growth potential, high labour absorption capacity, and low entry barriers for semi-skilled
and unskilled labour. The building industry was also chosen mindful of the high concentration of SME,
and emerging entrepreneurs from historically disadvantaged population groups in particular, in this
segment. The building industry has also been chosen since it is a conduit to facilitate the reduction of
greenhouse gas emissions of the built environment by way of reaching out to property
developers/owners through green building service providers.
On the national level, the scheme will be spearheaded by the Economic Development
Department with the support of the Department of Environmental Affairs, National Treasury,
Department of Trade and Industry and Science and Technology as identified in the Delivery Agreement
amongst other departments. At industry-level the scheme will work with the Construction Industry
Development Board, the Center for Scientific and Industrial Research, the Master Builder Association
and the South African Federation of Civil Engineering Contractors on behalf of the employers, and the
National Council of Trade Unions and the Building and Construction Allied Workers Union on behalf of
the workers. The scheme will furthermore work with selected local Business Development Services
(BDS) providers accredited with the Building and Construction Sector Education and Training
Authority. The ILO has supported this work through a study and national workshop on green jobs in
construction in South Africa.
3. Protection of employed workers through employment retention measures through well-designed schemes implemented through social dialogue and collective bargaining.
In the NFA, the tripartite partners agreed that there was a need to avoid retrenchments at all
costs and to increase employment. Employers and Labour were encouraged to explore all possible
alternatives to retrenchment. They agreed to explore ways to strengthen the CCMA in regard to the
role it plays in avoiding retrenchments, particularly in respect of Section 189 and 189A of the LRA. As
Figure 14 below shows the number of firms involved in Section 189 retrenchments experienced a
marked and steep increase in the number of retrenchment cases brought before it in the post crisis
period peaking at 732 cases in March 2009.
Figure 14: Firms Undertaking Section 189-Retrenchments, 2006 - 2009
Source: CCMA Case Management System (CMS) Data, 2006-2009

38
Figure 15 below hones in on retrenchments by sector in 2009 – the first full year within which
the recession impacted on the South African economy. The data presented in the figure stands as a
predictor of the general movement in employment by industry for 2009. It is important to note that
while the data in Figure 14 is at the firm level, the estimates provided in the remainder of the analysis
below are at the employee level, that is, the number of workers retrenched in 2009, thus providing a
more accurate picture of the impact of the recession on retrenchments at the CCMA. The figure shows
that the two sectors which experienced the largest number of retrenchments in 2009 were the mining
and manufacturing sectors, with the mining sector in particular accounting for just over 40 percent (or
5,576) of workers retrenched in the South African economy in 2009 through Section 189
retrenchments at the CCMA. In turn, about a quarter of retrenchments in this year can be attributed
to the manufacturing sector. Thus, together, more than two thirds of retrenchments for the period
occurred in these two sectors.
Figure 15: Proportion of Section 189-Retrenchments, by Sector: 2009
Source: CCMA Case Management System (CMS) Data, 2006-2009
The third largest sector in terms of Section 189 retrenchments was the wholesale and retail
trade sector (10.4 percent). The relatively low number of retrenchments in this sector in comparison
to its share of employment, may, in part, be due to the fact that a significant portion of this sector is
accounted for by workers in the informal sector who typically do not have recourse to services such as
those rendered by the CCMA. Other sectors to display significant retrenchments in the year were the
agriculture (7 percent), financial and business services (6 percent), and transport storage and
communication (4.44 percent) sectors, though the scale of retrenchments in these sectors were
relatively low compared to the mining and manufacturing sectors.
The number of cases that have been handled by the CCMA increased dramatically during the
crisis. CCMA’s involvement in a number of Section 189 disputes affecting the potential jobs of
thousands of workers led to many jobs being saved through none retrenchment settlements.
Nonetheless, the effectiveness of the CCMA has been called into question. This was particularly
highlighted during the three week public sector strike in 2010. As a result, measures to make CCMA
more effective, including among others the capacity building of the mediators have been developed.
Training Layoff Scheme
As part of employee retention measures, the tripartite partners agreed to introduce a training
layoff scheme. The rationale behind the scheme was to provide an alternative to retrenchment for
employers who are forced to lay off workers due to the recession. The alternative was to keep these

39
workers in employment during the economic downturn but re-skilling them as an investment for
future economic recovery (The Presidency, 2009). Hence, this amounts to a temporary suspension of
work during which training occurs. The training layoff scheme, the first of its kind to be introduced in
the South African labour market, was announced by the President in August 2009 as a measure to be
adopted in September 2009.
The scheme is not intended for employers who are in stable going-concerns or who are
experiencing financial distress not related to the recession, but is targeted specifically at employers in
distress due to the recession. The attractiveness of the scheme lies in the fact that both employers and
employees are set to gain. More specifically, employers on the scheme experience a reduction in
payroll costs since employees no longer earn a salary but are allocated training allowances, funded by
the NSF. In turn, while workers are able to keep their employment contracts and earn a lower salary in
the form of training allowances, they also receive training, funded by the SETAs. Importantly,
participation in the scheme is voluntary, and is dependent on agreement between an employer and
trade union on behalf of workers, or between an employer and individual workers who may otherwise
be dismissed due to operational requirements (DOL, 2009). An initial amount of R2.9 billion was
allocated to the scheme, consisting of R2.4 billion for training allowances for workers and R500 million
rand for training costs (The Presidency, 2009).
Any employer, trade union or individual worker may apply for access to the training layoff
scheme, either directly to the CCMA or as part of an alternative to retrenchment at a hearing at the
CCMA. While the CCMA is responsible for facilitating and overseeing all training layoff agreements, if
an agreement is entered into independently of the CCMA, the parties must ensure that the agreement
complies with the terms of the training layoff scheme. Employees on the scheme may not earn more
than R180 000 per annum, and must be within firms that are facing economic distress due to the
recession, and thus contemplating retrenching these employees. The money allocated to the NSF is
used to pay training allowances to workers on the scheme, pegged at 50 percent of their basic wage or
salary, to a maximum of R6 239 per month.22 In turn, participating employers continue to carry the
basic social benefit costs of employees during the period that workers are on the scheme, and this
includes the costs of funerals, deaths, and disabilities. Employers may also choose to combine the
training layoff scheme with short-time work arrangements, though the employee would then be
eligible for both the training allowance and the short-time work pay. The cost of the training is borne
by the relevant SETA, which should assist with the choice of training. It is envisaged that the training
should be linked as far as possible to skills needs of the employer, and may include learnerships,
apprenticeships, and skills development programmes. More generic training such as Adult Basic
Education and Training (ABET) and other generic workplace training is also acceptable. Training should
generally be NQF-aligned and bear credits. Employees can participate in the scheme for a maximum of
three months per worker.
Response to the Training Layoff Scheme
Given that the scheme is the first of its kind in South Africa, it is natural that a large range of
publicity and information-sharing activities are required in order to promote and explain the scheme.
To this end, all ten of the CCMA offices have been involved in promoting the scheme and its
provisions, including presentations to specific constituencies, presentations at CCMA User Forum
meetings, and input to community radio stations. Data below is gleaned from reports compiled by the
CCMA on the uptake of the scheme. The overall result from Table indicates that application for the
training layoff scheme from the inception of the scheme to the 11th of June 2010 was undertaken in
22 This is the overall cap of the UIF threshold.

40
44 cases involving 7 676 workers. This figure is clearly quite low, and this paper will dwell on reasons
for the low uptake further below. The top section of the table shows that by the 11th of June 2010, a
total of 19 training layoff cases involving 5 992 workers cases were either being implemented, or were
being processed by the NSF and SETAs. These 19 cases – accounting for 78 percent of all workers
affected in some way by the scheme – represent the actual uptake of the training layoff scheme, since
these cases have been approved by the advisory committee and are in some stage of being
implemented. Of these 19 cases, 10 cases involving 59 percent of all workers affected by the scheme
have already been approved and training for these workers is underway. In turn, 9 cases involving 1
480 workers were still being processed, though CCMA reports indicates that a number of these cases
have been with the relevant SETAs for over two months. Finally, 2 cases involving 38 workers were
being considered by the CCMA Advisory Committee.
Table 9: Progress to 11 June 2010 with the Training Layoff Scheme
Cases in Various Stages of TL Scheme Process No of Cases No Affected
Workers
Share Total
Workers
Affected
Trainin
g
TL approved by the DoL Committee and training in
process
10 4,512 59%
SETA,
NSF & DoL
TL at the stage of being processed by the SETA & NSF 9 1,480 19%
CCMA TL being considered by the CCMA Advisory Committee 2 38 0%
Total cases that are in the TL Scheme process 21 6,030 79%
Cases Withdrawn from TL Scheme Process No of Cases No Affected
Workers
Share Total
Cases
Withdrawn by Parties 8 557 7%
Cases not Recommended by the CCMA Advisory Committee 13 974 13%
Cases where Eligibility could not be Determined 1 12 0%
Cases where Companies were Liquidated 1 103 1%
Total cases that started the TL process, but did not proceed to training 23 1,646 21%
Total Cases 44 7,676 100%
Source: CCMA (2010)
The bottom section of Table 9 above indicates cases in which the training layoff scheme were
applied for, but were not successfully completed. The table shows that 23 applications involving 1 646
workers were not completed either because the cases were withdrawn, not recommended by the
CCMA, eligibility could not be determined, or the companies were liquidated. Of these, the majority of
cases (13 out of 23) involving 974 workers were cases where the CCMA Advisory Committee did not
recommend the training layoff scheme, either because the CCMA did not find that the companies
were experiencing financial distress due to the recession, or they found that the companies were not
in distress at all. This is an important result since the proportion of workers involved in these cases as
a share of total workers that were referred for a possible training layoff scheme is not insubstantial
(13 percent), and could be an indicator of the fact that employers could be attempting to access the
scheme even though they are not eligible. In turn, another 8 cases involving 7 percent of all workers
were withdrawn for various reasons.
Having considered the overall uptake of the scheme in Table above, this paper will consider
in Table below, the uptake of the scheme in terms of regions. In the following two tables this paper
will concentrate on the 6 030 workers who are either already participating in the scheme or are being
processed to participate in the scheme – the top section of Table above. This paper will also include
the 38 workers from the two cases which are still being considered by the CCMA Advisory Committee,
since there is a possibility that these workers may end up participating in the scheme. Surprisingly,
the table shows that the take-up of the scheme in the Johannesburg area is low, accounting for a mere

41
1 percent of all workers participating in the scheme. In turn, the uptake has been highest in the
Tshwane area accounting for 54 percent of all workers involved in the scheme. There is an implicit
gender dimension to the sector workforces.
Table 10: Cases in the TL Scheme Process, by Province
Prov Emplo
yee/Union Sector Emp
Share of
Workers on TL Stage in Process
GAU- JHB
NUMS Mining 15
1%
TL AGREEMENTS WITH TRAINING
IMPLEMENTATION IN PROCESS NUMSA Metal 9 TL AGREEMENTS BEING PROCESSED BY
THE SETA AND NSF NUMSA Retail 28 TL AGREEMENTS BEING CONSIDERED BY
THE CCMA ADVISORY COMMITTEE
TSW
NUMSA Motor 1,10
3
54%
TL AGREEMENTS WITH TRAINING
IMPLEMENTATION IN PROCESS NUMSA Motor 370
NUMSA Motor 1700
NUMSA Cleaning 20 TL AGREEMENTS BEING PROCESSED BY
THE SETA AND NSF NUMSA Motor 35
KZN
FEDCRAW Retail 25
19% TL AGREEMENTS BEING PROCESSED BY
THE SETA AND NSF SACTWU Clothing/te
xtile
1142
SACTWU Clothing 6
WC
NUMSA /
UASA
Metal 816
18%
TL AGREEMENTS WITH TRAINING
IMPLEMENTATION IN PROCESS NUMSA Metal 3 TL AGREEMENTS BEING PROCESSED BY
THE SETA AND NSF Trawler&Li
ne Union
Food &
Beverage
110
SACTWU Clothing &
textile
130
NUMSA Plastic 10 TL AGREEMENTS BEING CONSIDERED BY
THE CCMA ADVISORY COMMITTEE
EC
NUMSA Motor
components
166
6% TL AGREEMENTS WITH TRAINING
IMPLEMENTATION IN PROCESS
WAWUSA Brick
Manufacturing.
46
SACTWU Leather 112
NUMSA Metal &
Engineering
50
MPU CEPPWAW
U
Forestry 134 2% TL AGREEMENTS WITH TRAINING
IMPLEMENTATION IN PROCESS Total 6,03
0
100%
Source: CCMA (2010)
Unsurprisingly, the uptake of the scheme has been highest in the three provinces which
account for the highest share of employment – Gauteng, Western Cape, and KwaZulu Natal – together
accounting for 92 percent of all workers on the scheme. The only other provinces to feature are the
Eastern Cape and Mpumalanga provinces, together accounting for a mere 8 percent of all workers
involved in training layoffs. It is clear then that the scheme does not feature at all in terms of uptake in
the Northern Cape, Limpopo, North West, and Free State provinces. This is a worrisome result, since it
could indicate that the scheme is seen to be inaccessible to workers in poorer provinces.
Considering the training layoff scheme uptake by sector next, this paper will find, in the table
below that uptake has been highest in the motor and motor components sector accounting for more
than half of all workers on the scheme. In turn, this paper will also find that the metal and engineering
(15 percent) and food and beverage (23 percent) sectors also account for significant proportions of
workers involved in the training layoffs. Together these three sectors account for almost 94 percent of
all workers on the training layoff scheme. These results appear to stem directly from the fact that the
tradable goods sector was possibly the most visible casualty in the fallout from the domestic
recession, with parts of the mining industry, notably platinum, and both upstream and downstream
manufacturing (motor vehicles and steel for example) witnessing fairly brutal declines in revenue over
a short period of time (Bhorat et al, 2010). Considering the results from the table below more closely,
this paper will note that the majority of workers involved in training layoffs are employed in the

42
manufacturing sector. These results are in line with data from the QLFSs which show that the
manufacturing sector was among the sectors most deeply affected by the recession, with the loss in
employment in this sector being ascribed most visibly to the decline in global demand for motor
vehicles, as firms across the entire motor industry value chain were affected by the collapse in
demand (Bhorat et al, 2010). It is fitting then that the vast majority of training layoffs originated from
the motor and motor components sectors.
Table 11: Cases in the TL Scheme Process, by Sector
Sector Number of
Employees
Share of Total
Mining (Mining) 15 0.2%
Metal and Engineering (Manufacturing) 878 14.6%
Retail (Wholesale and Retail Trade) 53 0.9%
Motor and Motor Components (Manufacturing) 3,374 56.0%
Clothing/textile and Leather (Manufacturing) 20 0.3%
Food & Beverage (Manufacturing and Wholesale/Retail Trade) 1,390 23.1%
Plastic (Manufacturing) 110 1.8%
Brick Manufacturing. (Manufacturing) 10 0.2%
Cleaning (Financial and Business Services) 46 0.8%
Forestry (Agriculture) 134 2.2%
Total 6,030 100.0%
Source: CCMA (2010)
Employment losses in the wholesale and retail trade sector were high due to decreased
consumer demand, but the training layoff data shows 53 cases in the retail sector accounting for a
mere 0.9 percent of total employees in the training layoff scheme. While this result is low, this paper
will note two things: Firstly, the food and beverage sector in the table above may refer to both
manufacturing and wholesale and retail trade of food and beverages, bringing the training layoff
uptake for the wholesale and retail trade sector up significantly; and secondly, the wholesale and
retail trade sector is to some extent informalised, and these workers typically do not have access to
such a scheme. The virtually non-existent uptake in the financial services sector is interesting – this
paper will note that while the credit crisis eroded employment and value-added in financial
institutions around the world, South Africa witnessed almost no change in value-added and indeed
managed to increase its employment marginally in this sector between October 2008 and October
2009. It is unsurprising then that this paper will see no training layoff response from the financial
services sector in the data.
Overall Performance of the Scheme
It is clear from the analysis above that uptake of the training layoff scheme has been
lacklustre. In actual numbers, to the 11th of June 2010, a mere 6 030 workers were involved in the
training layoff scheme materially, while a further 1 646 workers had applied to take part in the
scheme, but their applications were not successfully completed for a variety of reasons. The low take-
up of the scheme must partly be attributed to the fact that this is a new project, introduced only in
late 2009, and it is thus plausible that many employers and workers in the economy have not yet
heard of the scheme. In terms of marketing the training layoff initiative to stakeholders in the
economy, the CCMA has undertaken numerous public information drives and will continue to do so.
While there have been some good success stories where training layoffs have resulted in all
jobs being saved instead of retrenchments, one of the major challenges in terms of uptake of the
scheme is the difficulty for both employers and employees in understanding how the scheme
operates, and how it is beneficial to them. A variety of reasons have been put forward to explain the
lack of understanding of the initiative, and these include the fact that the scheme is new and the first

43
of its kind in South Africa, the fact that initial publicity revolved around alerting the public to the
existence of the scheme as opposed to its operation, and the complexity of the scheme itself.
The low take up rate of training layoffs from the side of employers is attributed to a variety of
factors, including the lack of confidence in role players (presumably SETASs), and the fact that the
scheme is seen to be excessively bureaucratic in terms of both information disclosure and turnaround
times. As far as information disclosure is concerned, employers pointed out that the required financial
information for application to the scheme is too onerous on companies, and furthermore that there
are also concerns regarding the confidentiality of information disclosure. In turn, in an attempt to ease
some of the bureaucracy issues regarding turnaround times, the CCMA has set itself a turnaround
time of 15 days from receipt of completed training layoff requests to submission to the relevant SETA
and the NSF. In order to achieve this, a concerted effort is being made to ensure facilitators and
training layoff coordinators are adequately capacitated to ensure parties are fully briefed and training
layoff forms are correctly completed. It is unclear however how bottlenecks in the SETA / NSF
registration process are going to be dealt with, but this is critical to ensure a higher uptake from the
side of employers. From the employee side, there have been concerns about the loss of retrenchment
benefits if employees opt for training layoff in cases when training layoff does not succeed in assisting
the business turnaround process. Furthermore, some employees have noted that the 50 percent
training allowance is inadequate compared to severance benefits.
Finally, and perhaps most importantly, there has been no take-up of the scheme from small
scale retrenchment (Section 135 conciliation) processes, even though small scale retrenchments
account for the majority of retrenchments occurring through the CCMA. This could be because smaller
employers or employers that are not as severely affected by the recession are much more hesitant to
buy into a scheme that is very new and relatively untested, or that they feel the entry costs into the
scheme are too high.
4. Help workers find employment through active labour market measures
a) Public Employment Services
Public Employment Services (PES), or services to link the unemployed to vacancies in the
labour market, has existed in various countries around the world since the 1800s. In South Africa the
Skills Development Act of 1998 (amended in 2003) allowed for the creation of labour centres,
administered by the Department of Labour, around the country. The services provided by the labour
centres include the registration of job-seekers, registering vacancies and work opportunities, and
assisting people to find employment, and access training and employment programmes. However,
since the mandate of the Department of Labour in the early post-apartheid years included skills
development, the employment services function of the department was neglected in favour of skills
development. With the election of a new President in 2009, the mandate of skills development was
transferred to a newly-created Department of Higher Education and Training (DH&T), and this forced
the reorganization of the Department of Labour, with employment services now becoming part of its
core functions. To this end, the Department of Labour is currently reviewing the legislation governing
public employment services in the economy, and considering the regulation of both public and private
employment services.
The basic aim of most PES programmes around the world is to reduce unemployment by
matching the unemployed with vacancies in the economy. PES programmes thus do not create jobs,
but contribute to filling jobs faster and better. Hence, PES initiatives are one part of a range of
initiatives aimed at addressing unemployment in many countries around the world, including South
Africa. While in some countries PES programmes include simply matching people to jobs, in other
countries PESs includes a range of other activities including providing labour market information,

44
disbursing unemployment insurance, job assistance programmes, training, regulation of private
employment agencies, and issuing of permits for foreign workers.
Prior to dwelling on the role of the PESs during the recession, it is essential that this paper will
understand the environment within which labour centres in South Africa operate. This paper will note
firstly that, according to the most recent administrative data, South Africa has 135 labour centres
spread throughout the country, employing some 5 806 staff with a total budgetary commitment of
about R1 billion, including the UIF. This translates into a per capita expenditure of about R175 000 per
staff member within the PES system. Figure 22 below shows the provincial office distribution of labour
centres (with Gauteng having two clusters of centres – Gauteng South and North), expressed as a
share of the total distribution of centres and the total fiscal outlay for labour centres.
Figure 19: Labour Centres Provincial Distribution, by Number of Offices and Budget Share
Source: Department of Labour, 2010
The data shows that collectively, the Gauteng North and South regions capture the largest
share of the department’s allocation, at 22 percent, followed by KZN (16 percent), the Eastern Cape
(13 percent) and then the Western Cape (11 percent). It is not immediately clear, however, how these
allocations are made within the budget process of the department, and whether they are simply
related to historical allocation models or instead based on a more rigorous assessment of labour
market conditions within each of the regions and provinces. This paper will provide, in an attempt at
understanding this allocation, a comparison of the district council budgetary allocations, against the
unemployment rates within these district councils in the figure below.
It would be expected then, at least as a first glance, that unemployment rates at the district
council level would be positively related to the total and per capita expenditure on each matching
labour centre. The figure below shows very clearly that is little relationship between the
unemployment rate at the district council level on the one hand, and the budget allocation to the
relevant labour centre on the other hand.

45
Figure 20: Per Capita Labour Centre Expenditure, by Unemployment Rate
10
20
30
40
50
Dis
tric
t C
ou
nci
l Un
em
plo
yme
nt
Rate
(%
)
160000 180000 200000 220000Per Capita Labour Centre Expenditure (Rands)
Source: Department of Labour (2010) and Labour Force Survey, 2009:2
Indeed, a simple correlation between the two variables indicates no statistically significant
relationship. Inclusion of total expenditure, instead of per capita expenditure, also yields no positive
significant relationship to those areas with higher local unemployment rates. Comparing the number
of staff against these local unemployment rates also yields no relationship. Ultimately then, the
evidence suggests that some closer inspection of the internal budgetary allocation rules for these
labour centres may be required. In particular, the notion that high unemployment rate locations
should attract a disproportionate share of the department’s allocation must surely be an implicit rule
in an attempt at maximising returns to the search behaviour and efforts of the unemployed. In
addition to the above data, which indicates that allocation rules for the PES may not necessarily be
optimal, or at least subject to clear labour market-defined rules, this paper will attempt below a brief,
and fairly simple, comparative overview of how South Africa’s PES commitments compare for a select
sample of economies for which this paper will have similar data. This paper will utilize data for
Germany, the United Kingdom and Hungary in what follows below. Figure 24, for example, attempts
to assess the number of PES staff within the country, available for each ILO-defined unemployed
individual.
Figure 21: Ratio of Unemployed to PES Staff, by Country
Source: Department of Labour, 2010
Notes: Data based on the ILO definition of unemployment for each country. Expenditure
estimates on PES are in nominal values of home currency.

46
The figure is striking, as it reflects clearly on the very high number of unemployed23 per
individual PES staff member for South Africa. Hence whilst Germany has approximately 42
unemployed individuals per PES staff member, and Hungary has 150, the estimate for South Africa is
483 unemployed individuals per PES staff member. Indeed, this paper will could argue that given
South Africa’s much higher proportion of rural unemployed where access to a PES is extremely
difficult, that this number is an underestimate of the true ‘access rate’ to a PES staff member amongst
the unemployed. The figure thus suggests that South Africa has too few PES staff (and indeed PES
offices as well) per unemployed person in comparison to other countries. This paper will note however
that other public offices in South Africa may provide some of the services that the PES offices in other
countries provide, and an example of this would be the UIF facilities. Thus, a full list of centres is
needed in order to determine what services are provided and the type of infrastructure and staffing
which exists. Another manner in which to estimate the efficiency and effectiveness of the PES system,
albeit a blunt instrument, would be to examine the average number of staff per PES office in each
country. The data below uses the same four-country sample, and again the trends are consistent with
the above data.
Figure 22: Average Number of Staff per PES Office, by Country
Source: Department of Labour (2010)
Hence, it is evident Germany has a very high number of staff per PES office, followed by the
United Kingdom and then South Africa. Whilst the average German PES office boasts some 107 staff
members, South Africa’s complement is almost half of this, at 55. Corresponding figures for the UK
and Hungary stand at 70 and 20 respectively. There are two caveats here, which further detailed data
can and should answer. Firstly, it would be important to gain a sense of the distribution of this staff
across the different offices. Hence, does this paper find, for example, that areas with high
unemployment rates are associated with large PES offices? This paper will ask this question keeping in
mind that it is entirely possible that a large PES staff complement on average in a country may be
driven by a few large urban-based PES offices. Secondly, a large staff complement may not be a well-
trained one, and further data must be provided on the quality of the staff available to serve the
unemployed at these PES offices.
In terms of fiscal allocations though, the difference across countries is perhaps most stark.
Germany commits a total of over 36 billion Euros on all its services – and this is expected to rise to 56
billion during this financial year, while Brazil spends between 11-12 billion on employment services
and unemployment insurance. This is compared to the budget for the UK – £3,555 million for cost and
23 We are referring here to unemployed people using the official definition of employment.

47
administration costs and an additional £845 million for outsourced services for job seekers, and
Hungary – 300 million Euros. This paper will note that in the case of Germany and Brazil, it is a difficult
to estimate the actual operational costs of the PES as the global figures include the disbursement of
unemployment and other benefits and other labour market interventions such as training. The ratio of
PES funding per unemployed individual is, however, more relevant.
Figure 23: PES Funding per Unemployment Individual, by Country
Source: Funding details from the PES’ of the respective countries
Notes: Data based on the ILO definition of unemployment for each country
Expenditure Estimates on PES are in nominal values of home currency.
To this end, the data indicates in the figure above that Germany spends just over 9,500 Euros
per unemployed individual on public employment services, while the corresponding figure for Brazil is
about 2,900 Pesos. Whilst the UK spends only 212 Pounds per unemployed worker – the figure for
South Africa stands at an even lower R37.39. Indeed, South Africa spends in relative terms 76 times
less on public employment services, than its middle income country counterpart – Brazil. It is clear
then, on the basis of the above, that South Africa under-spends fairly dramatically on PES. As a
proportion of most variables then, South Africa – at least on this evidence – has a significantly under-
resourced public employment service division.
A final point is the level of technology within different PES programmes around the world.
International examples show different ways in which technology is utilised within PESs to broaden
access to various services offered by the programme, including websites, interactive technology to
match job-seekers and employers which both sets of parties can access from any computer point, and
plasma screens highlighting vacancies and opportunities. In addition, international evidence also
highlights the role of call centres in order to support the PES. This paper will not have data on the level
of technology employed at different labour centres in South Africa but note that, according to
international norms, a fairly high level of technology is needed for optimal results.
As one element of a strategy designed to reduce unemployment then, it is evident that the
institutional environment designed to assist in job search and in general reduce information
asymmetries in the labour market, requires far more attention and policy support. It is possible that
the post-1994 environment within the labour market policy environment was understandably focused
on re-engineering the regulatory environment, and hence there was the unintended consequence of
over-looking this aspect of active labour market policy. However, given the new roles of
responsibilities of the department, and that it has been absolved of the skills portfolio, there is a clear
opportunity to invigorate what must be a key area in any policy programme designed to assist the
unemployed in South Africa.

48
Given the difficult situation under which the PES currently functions in terms of a range of
issues including funding, staff, technology, and so on, this paper will not expect that the PES would
have a significant impact during the recession. This paper will furthermore note that the Employment
Services of South Africa (ESSA) IT systems used at labour centres was not fully functional during the
recession, impacting on the ability of the labour centres to function as effective matching centres
during the recession. An optimised ESSA system went live from the 23 March 2010. In addition, this
paper will note that in a demand-deficient economy, firms are not looking to hire and hence the
success of programmes such as the PES is limited. In general though, the role of PES, both during and
outside of recessionary periods, remains both relevant and critical, and to this end, a draft Public
Employment Services Policy and Bill was finalised by March 2010.24 The draft Public Employment
Services Bill, dealing with training layoffs, setting up a web portal to match vacancies and job-seekers,
and work for persons with disabilities, will however only be finalized by March 201125
5. Other targeted programmes such as public employment guarantee schemes, emergency public works, and other direct job creation schemes
The NFA highlighted the need to improve the employment intake in the public sector as part
of the process of strengthening the education, health and social work sectors and criminal-justice
system. They also agreed to boost the Expanded Public Works Programme (EPWP). The EPWP is a
national programme which was established in 2004/05 with the aim of creating one million jobs in five
years. In particular the programme aimed to create employment by increasing the labour intensity of
government infrastructure projects, creating jobs in public environmental programmes such as
Working for Water, and creating jobs in public social programmes. The EPWP was coordinated by the
Department of Public Works, and consisted of numerous key objectives, including drawing significant
numbers of the unemployed into productive work, providing the unemployed with education and
skills, and ensuring that beneficiaries are either able to find employment or are able to set up their
own businesses once they exit the programme. Furthermore, this programme was meant to reduce
and alleviate unemployment (HSRC, 2007). The International Labour Organisation (ILO) also co-
operated on the project by providing technical assistance for the implementation of the EPWP. Their
focus was specifically in supplying the Limpopo Provincial Government, as well as the Eastern Cape
and KwaZulu-Natal regions with support26.
During 2007, the halfway point of the first phase of the EPWP, the Expanded Public Works
Support Programme commissioned a mid-term review of the EPWP in order to assess the strengths
and weaknesses of the programme and to elicit recommendations on the future of the programme
(HSRC 2007). It was found that the EPWP programme was a complex public works programme, which
unlike other successful programmes around the world, contained a range of different objectives
including increasing employment, improving the skills base of participants to help them find
employment in the future, and contributing to the government’s social protection mandate (McCord,
2007). The implementation model however “offers only a single short-term episode of employment,
and is therefore unlikely to have a significant social protection or employment impact in an economy
that suffers from persistently high levels of unemployment and poverty” (McCord, 2007:8).
Furthermore, both McCord (2007) and the HSRC (2007) findings suggested that the skills development
aspect of the EPWP programme was inappropriate given the skills needs of the economy, and the
nature of unemployment in South Africa. Recommendations for future public works programmes in
South Africa included a clearer set of well-defined objectives for the programme, and delinking
training for the unemployed from public works programmes employment (McCord 2007; HSRC 2007).
24
http://www.pmg.org.za/report/20100505-department-labour-their-strategic-plan-briefing 25
http://www.sabinetlaw.co.za/labour/articles/manyi-public-service-employment-law-only-2011 26
See appendix 6 for detailed information on the ILO involvement

49
The core mandate for the EPWP would then be to provide employment in order to address poverty.
The gender dimension of including women in the workforce needed to be considered as well.
In late 2008, Cabinet agreed to the roll-out of the second phase of the EPWP. EPWP Phase II
was launched in April 2009, with the goal of creating 4.5 million jobs for poor and unemployed people
in South Africa by 2014. The Minister of Public Works released the Expanded Public Works
Programme's (EPWP) second quarter figures in November of 2009, as part of a report back on the
progress of government's Programme of Action since President Jacob Zuma's State of the Nation
Address. According to the figures tabled, government has thus far created a total of 223 568 work
opportunities through its Expanded Public Works Programme (EPWP) from the period 1 April to 31
August 2009. Though this rings as a fairly good result, this paper will note that the nature of the work
opportunities created is unclear.27
Commitments have also been made to accelerate the EPWP Phase II, and to consider the role
of NGOs, trade unions and Community-Based Organizations in offering advice on priority areas, and in
administering resources and running EPWPs through Community Works Programmes (CWP). To this
end, the CWP was recently allocated a further R58.5 million in the October 27th adjustment budget
(The Presidency, 2009). Furthermore, in reviewing the wages paid to workers on public works
programmes, a recommendation for an adjustment was made by the Employment Conditions
Commission (ECC) and will be forwarded to the Minister of Labour for consideration (The Presidency,
2009). In general though, it is evident that the EPWP has been a vehicle for responding to the
employment crisis which had already been in existence but was exacerbated by the crisis. It created
about 480 000 job opportunities in 2009 (according to reports from the Department of Public Works,
The Presidency, 2009). It is clear that the EPWP has thus far been an important tool in combating the
effects of the recession.
6. Support to public and private enterprises (including cooperatives) and micro-entrepreneurs
In the NFA, the parties agreed that de-industrialization and the rebuilding of local industries
needed to be at a key part of the national response to the global economic downturn. The parties
identified a number of vulnerable sectors most susceptible to job losses. They agreed that sector
specific strategies were needed to address the challenges facing these sectors (which include clothing,
textiles and footwear, mining and the auto and capital equipment sectors). The specific needs of
SMME’s were also given special consideration. The parties agreed to a special National Jobs Initiative,
involving an estimated R10 billion over a three year period. The aim of the initiative is to provide
financing of industrial and special employment measures as well as measures to avoid the job losses
and increase employment.
Sectoral Support
In order to provide some reprieve to worsening economic conditions, government instituted
programmes to assist sectors and companies in distress, including the automotive sector, the clothing
and textile sector, as well as SMMEs. The development of the automotive industry has been a vital
part of South Africa’s successful post-apartheid growth strategy. However, the crisis exacted a
heavy toll on the industry through collapsing demand and shrinking business confidence. Hence, as
part of the support for the motor industry, in June 2010 the new Automotive Investment Scheme (AIS)
was finalized as a replacement for the expiring Productive Assets Allowance scheme of the Motor
Industry Development Programme. The new scheme will provide qualifying firms with a taxable cash
27
http://www.epwsp.co.za/archives/091109_01.htm.

50
grant of 20 percent of the qualifying investment value in productive assets - with the condition that
the manufacturer introduces a new or replacement model which demonstrates a minimum of 50 000
annual units of production per plant within 3 years. This scheme is aimed at identifying opportunities
to boost capacity and competitiveness at the original equipment manufacturers level, and a budget
allocation of R2.69 billion has been made available for the scheme for the next three financial years
starting in 2010.
The decline in manufacturing output has been driven, as shown in the sub-sector analysis in
the sector above, partly by the clothing and textile sector. Given the worsening output and
employment conditions in the sector as a result of South Africa’s first post-apartheid recession, on the
25th of March 2009 stakeholders from both business and labour struck an agreement on the broad
terms on how the clothing and textile sector can be assisted during the recession. This includes a
variety of interventions at different levels including trade, customs fraud, and production. As far as
trade is concerned, the clothing sub-sector submitted an application to International Trade
Administration Commission (ITAC) in May 2009 in order to increase the tariffs to the bound level of 45
percent on 35 articles of clothing, and the application was successfully completed. This increase in
tariffs is expected to boost the price competitiveness of local producers (The Presidency, 2009). In
addition, a submission to reduce tariffs on three articles on three articles of textiles through a duty
rebate was also submitted to ITAC.28 As a long-term growth initiative, the DTI introduced a proposal
for a production-based incentive, and submitted it to the social partners for comment. It is envisaged
that the incentive will help the sector to compete sustainably and effectively against international
competitors in both the domestic and the export markets (The Presidency, 2009).
Since the manufacturing sector was one of the hardest hit sectors during the recession, this
paper will dwell briefly on the Manufacturing Investment Programme (MIP), though this programme
was envisaged prior to the onset of the recession. The primary objective of the MIP is to stimulate
manufacturing investment, by providing grant support to large-to-medium sized projects that would
otherwise not be established without the grant. Both local and foreign-owned companies can apply
for an investment grant of up to 30 percent of the value of qualifying investment costs in machinery,
equipment, commercial vehicles, and land and buildings required for establishing a new production
facility, or expanding, or upgrading an existing facility. This programme is expected to boost medium
to long-term manufacturing growth.
Fiscal Support to SMMEs and the Informal Sector
One of the major concerns when assessing the true economic damage caused by the crisis in
South Africa is its impact on the informal sector and small and medium-sized enterprises (SMMEs),
given that these firms are crucial not only to South Africa’s growth process, but also its long-run
employment creation trajectory. Furthermore, the growth potential of enterprises is linked to access
to and control over resources such as land, credit, technology, networks, information and markets;
women’s limited access to each of these factors severely impairs the viability of their income-
generating activities, with the result that women entrepreneurs are concentrated in the smallest and
most precarious enterprises. As in many developing countries, the state in South Africa is a significant
procurer of goods and services from SMMEs. With the onset of the crisis many SMMEs were faced
with a chronic shortage of funds and lack of financing alternatives related to government’s inefficient
and late payments. As a result, cash flow problems became a threat to the survival of many small
businesses in the economy. Indeed as
28 Tariff reviews were also requested in the capital equipment, transport and metal products sector, where a list of products
to be targeted for reviews have been finalised and submitted to the ITAC.

51
Table 12 illustrates, non-payment by government is viewed as a key constraint in doing
business in South Africa.
Table 12: Means and Rank of Problems of running a Small and Medium Sized Contractor Business
Causes Mean Rank
Government does not pay on time 4.22 1
Lack of capital 4.13 2
Difficult to arrange guarantees 4.01 3
Lack of commitment in implementing policies geared to assist small and medium sized contractors
by government officials 3.75 4
Suppliers not willing to offer credit to small and medium sized contractors with no track record 3.28 5
Depending on bank loans and paying high interest 3.12 6
Source: SEDA (2009)
Crippled by collapsing aggregate demand and delayed payments, an immediate response was
needed from the government to accelerate the speed of transactions and improve efficiency.
Therefore, as of 21 September 2009, a government hotline was established to accelerate the clearing
of payments to contractors and other service providers hired by the state. Within two months, R3,662,
908 worth of SMME payments were facilitated by this hotline service alone (SEDA, 2009).
Another constraint faced by SMMEs during the recession was the inability to honour loans due
to liquidity problems arising from the crisis. To this end, the state has kick-started initiatives to
increase access to credit, and provide more flexible measures on repayment periods by SMMEs. More
specifically, a task team has been created comprising of commercial banks, the development finance
institutions (DFIs) (such as the IDC), the DTI, and National Treasury to look at, among other things,
developing guidelines to regulate joint funding interactions and to facilitate information sharing in
relation to firms in distress. The guidelines include the following:
• In a company where both banks and DFIs are involved, develop a watch-list of firms experiencing early
signs of distress by sharing information on a quarterly or monthly basis, in order to facilitate timely
interventions if the need arises
• Banks will share information with the DFIs on distressed companies to allow DFIs to fast track their due
diligence processes
• Banks will inform the IDC of any rescue package which fits the IDC’s rescue criteria
• Banks and DFIs have agreed to a definition of distressed SMMEs. Measures to help distressed SMMEs,
as identified by this definition, include extended repayment periods, increasing the level of indemnity
support from Khula, and the establishment of a technical assistance fund. In addition, the banks and
DFIs will agree on new rules regarding processes to be followed when engaging with SMMEs in distress,
and these include providing for extended repayment periods on outstanding loans, and avoiding
premature legal action in cases of defaulting clients.
• The indemnity provided to banks will lift from R3 million to R5 million in the case of distressed firms
The IDC, in particular, has been key as far as responding to the crisis has been concerned,
establishing a R6.1 billion fund to assist companies in distress. Early reports indicate that applications
for R500 million of funding has been received and finalized by October 2009 from 15 companies,
saving in the region of 5,700 jobs. In addition, 33 more applications were received by December 2009
with a potential value of R2 053 million (The Presidency, 2009).

52
7. Support job creation across sectors of the economy, recognizing the value of the agricultural sector and the need for rural infrastructure, industry and employment
In his inaugural State of the Nation Address in June 2009, President Jacob Zuma stated:
"It is my pleasure and honour to highlight the key elements of our programme of
action. The creation of decent work will be at the centre of our economic policies and
will influence our investment attraction and job creation initiatives. In line with our
undertakings, we have to forge ahead to promote a more inclusive economy."
President Jacob Zuma, State of the Nation address, 3 June 200929
The New Growth Path (NGP)
There is growing consensus that creating decent work, reducing inequality and defeating
poverty can only happen through a New Growth Path. The government has issued a draft NGP for
discussions with the social partners before finalization and adoption. The NGP is founded on the
premise of restructuring of the South African economy to improve its performance in terms of labour
absorption as well as the composition and rate of growth.
The New Growth Path proposes to achieve the above by:
1. Identifying areas where employment creation is possible on a large scale as a result of substantial
changes in conditions in South Africa and globally.
2. Developing a policy package to facilitate employment creation in these areas, above all through:
a. A comprehensive drive to enhance both social equity (for example, race and gender) and
competitiveness;
b. Systemic changes to mobilize domestic investment around activities that can create
sustainable employment; and
c. Strong social dialogue to focus all stakeholders on encouraging growth in employment-creating
activities.
The New Growth Path proposes bold strategies to create five million new jobs by 2020. It also
lays out a vision for how South Africa can collectively achieve a more developed, democratic, cohesive
and equitable economy and society over the medium term, in the context of sustained growth. The
strategy sets out critical markers for employment creation and growth and identifies where viable
changes in the structure and character of production can generate a more inclusive and greener
economy over the medium to long run. To that end, it combines macroeconomic and microeconomic
interventions.
The shift to a new growth path will require the creative and collective efforts of all sections of
South African society. It will require leadership and strong governance. It takes account of the new
opportunities that are available, the strengths and the constraints the country faces. It requires the
development of a collective national will and joint action to change the character of the South African
economy and ensure that the benefits are shared more equitably by all our people, particularly the
poor. Achieving the New Growth Path requires that the addressing of key tradeoffs. Amongst other
decisions, government must prioritize its own efforts and resources more rigorously to support
29
President Jacob Zuma’s state of the nation address, 3 June 2009, www.info.gov.za/speeches/2009/09060310551001.htm)

53
employment creation and equity; business must take on the challenge of investing in new areas; and
business and labour together must work with government to address inefficiencies and constraints
across the economy and partner to create new decent work opportunities. The New Growth Path
starts by identifying where employment creation is possible, both within economic sectors as
conventionally defined and in cross-cutting activities. It then analyses the policies and institutional
developments required to take advantage of these opportunities.
In essence, the aim is to target the existing and additional capital and capacity at activities that
maximize the creation of decent work opportunities. To that end, the NGP proposes to use both
macro and micro economic policies to create a favourable overall environment and to support more
labour-absorbing activities. The proposed main indicators of success will be jobs (the number and
quality of jobs created), growth (the rate, labour intensity and composition of economic growth),
equity (lower income inequality and poverty) and environmental outcomes. To achieve profound
changes in the structure of savings, investment and production, the NGP proposes that the
government must steadily and consistently pursue key policies and programmes over at least a
decade. The NGP advocates that the requisite policy stability and coherence will be supported by
effective social dialogue that helps establish a broad consensus on long-run policy goals and a vision
for the country, and facilitates the necessary tradeoffs and sacrifices by ensuring a visibly fair
distribution of the benefits from growth. The NGP recognizes that engagement with stakeholder
representatives on policy, planning and implementation at national, sectoral and local levels is central
to achieving coherent and effective strategies that are realized without endless debates and delays.
That, in turn, means government must both strengthen its own capacity for engagement and
leadership, and re-design delivery systems to include stakeholders meaningfully.
The NGP acknowledges that long-term structural change also requires phasing to establish the
preconditions for success over time. In the case of employment, the NGP proposes that the steps that
the state should take are:
• In the very short run, the state can accelerate employment creation primarily through direct
employment schemes, targeted subsidies and/or a more expansionary macroeconomic package.
• Over the short to medium term, it can support labour-absorbing activities, especially in the
agricultural value chain, light manufacturing and services, to generate large- scale employment.
Government can provide effective inducements to private investment in targeted sectors
principally by prioritizing labour-absorbing activities for the provision of appropriate and cost-
effective infrastructure, regulatory interventions that effectively address market and state failures,
measures to improve skills systems, and in some cases subsidies to production and innovation.
• In the longer run, as full employment is achieved, the state must increasingly support knowledge-
and capital-intensive sectors in order to remain competitive.
The NGP is clear that this phasing means that in the medium term the state must focus on
facilitating growth in sectors able to create employment on a large scale. But it should not neglect
more advanced industries that are crucial for sustained long-run growth. Government must encourage
stronger investment by the private and public sectors to grow employment-creating activities rapidly
while maintaining and incrementally improving South Africa's core strengths in sectors such as capital
equipment for construction and mining, metallurgy, heavy chemicals, pharmaceuticals, software,
green technologies and biotechnology. These industries build on our strong resource base and our
advanced skills and capacity in some economic sectors.

54
Industrial Policy Action Plan (IPAP) 2
In January 2007, Cabinet adopted the National Industrial Policy Framework (NIPF), which set
out the South African government’s broad approach to industrialization. The NIPF’s core objectives
are:
• To facilitate diversification beyond our current reliance on traditional commodities and non-
tradeable services; this requires the promotion of increased value-addition characterized
particularly by movement into non-traditional tradeable goods and services that compete in export
markets and also against imports;
• The long-term intensification of South Africa’s industrialization process and movement towards a
knowledge economy;
• The promotion of a more labour-absorbing industrialization path with the emphasis on tradeable
labour-absorbing goods and services and economic linkages that create employment;
• The promotion of industrialization characterized by the increased participation of historically
disadvantaged people and marginalized regions in the industrial economy; and
• Contributing to industrial development on the African continent, with a strong emphasis on
building its productive capacity.
• Guided by the NIPF, the implementation of industrial policy is set out in an Industrial Policy Action
Plan (IPAP). In August 2007 Cabinet approved the first Plan, which reflected mainly ‘easy-to-do’
actions. The 2007/08 IPAP has largely been implemented. Highlights include:
• Strengthening of the Competition Act to introduce stronger investigative powers and personal
liability;
• Finalization of a revised programme for the automotive sector for 2013-2020: the Automotive
Production and Development Programme (APDP). This provides long-term certainty, creating
conditions for meeting the production target of 1,2 million (m) vehicles by 2020, with substantial
deepening and broadening of the industry;
• Development of a fundamentally new support programme for the Clothing and Textiles industry
aimed at upgrading competitiveness in order to recapture domestic market share;
• Attraction of substantial investments in Business Process Services with resultant job creation;
• Lowering of input costs through the removal or lowering of a range of import tariffs, particularly on
key intermediate items and materials for manufacture. Tariffs have been removed or lowered on
products including primary chemicals, aluminium and certain textiles not produced in sufficient
commercial quantities in South Africa; and
• Strengthening of building energy-efficiency standards in response to the national electricity
shortage.
However, there has been a growing recognition that industrial policy needs to be scaled up
from ‘easy-to-do’ actions to ‘need-to-do’ interventions to generate a new path of industrialization.
The impact of the crisis precipitated this recognition. This recognition was strengthened under the
new administration and was formalized in the President’s State of the Nation Address of 3 June 2009,
“Building on the successes of our industrial policy interventions, a scaled-up Industrial
Policy Action Plan will be developed.”
President Jacob Zuma, State of the Nation address, 3 June 200930
A process of intensive consultation and analysis – led by the Minister of Trade and Industry
culminated in a revised IPAP for the 2010/11 – 2012/13 financial years. IPAP2 is for a three-year rolling
period, updated annually and with a 10-year outlook on desired economic outcomes. It is reviewed
and updated annually. The IPAP 2 advances the work of the economic sectors and the employment
cluster in a number of respects.
30
President Jacob Zuma’s state of the nation address, 3 June 2009, www.info.gov.za/speeches/2009/09060310551001.htm)

55
It contributes to:
• Rural development through interventions in a range of sectors such as agro-processing, bio-fuels,
forestry, cultural industries, aquaculture and tourism;
• Advanced technological capabilities through interventions in the nuclear, advanced materials,
aerospace, and Information, Communication and Technology (ICT) industries;
• The systematic promotion of green and energy-efficient goods and services;
• Downstream mineral beneficiation;
• Strengthened linkages between tourism and cultural industries;
• Stronger integration between sector strategies, skills development plans and commercialization of
publicly-funded innovation;
• Macro-economic stability through:
- Improvements in the trade balance
- Lowering of inflationary pressures through increased supply and competition in a
range of sectors,
- A profound positive net revenue impact, and
- Medium- to long-term diversification of the economy and hence risk mitigation; and
- A substantial contribution to the creation of sustainable jobs, both directly and
indirectly.
Therefore the industrial policy and the IPAP 2 form part of a larger set of inter-related policies
and strategies as outlined in the NGP aimed at generating more labour intensive and value adding
growth. IPAP 2 is seen as key policy measure in driving the recovery of the manufacturing sector from
the crisis and laying the foundation for sustainable long term manufacturing growth and
competitiveness.
B. Building social protection systems and protecting people
1. Cash transfer schemes
The Social Relief of Distress Fund (SRD)
The Social Relief of Distress Fund (SRD), established prior to the crisis, is a temporary provision
of monthly assistance for a maximum of three months31 for persons in the most dire of economic
circumstances, that is, they are not able to meet their or their families’ most basic needs. While some
provinces in South Africa give the grant in the form of cash, it may also be in the form of a food parcel
or voucher. As a response to recession, the money allocated to the SRD was increased from R13.6
million in November 2008 to R57.2 million in January 2009. Further to the SRD, government, with the
help from the private sector, NGO’s and community based organizations, issued agricultural starter
packs to particularly vulnerable communities as a response to the recession. By the end of 2009, R76
million has been spent in distributing the agricultural starter packs in various provinces.
Apart from the short term measures taken by the relief programme to distribute agricultural
starter packs and money, the accessibility and affordability of basic food items are also key goals for
assisting those who are struggling to manage their living costs due to this recession. To this end, the
Competition Commission and Tribunal are currently investigating the concentration and mark-up
levels in the food supply chain – with a view to assessing behaviour that is harmful to consumers.
31 Extension of the period by a further 3 months may be granted in exceptional cases.
56
Social Grants
To further broaden the reach of grants to vulnerable individuals in the economy, in October
2009 cabinet announced the extension of the child support grant to eligible individuals supporting
children between the ages of 15 and 17 as well. This extension will, it is estimated, provide support for
hundreds of thousands of additional individuals in the South African economy. Furthermore, provi-
sions have been made for the phased extension of the child support grant up to a child’s 18th birthday
and the child support grant shall increase by R10 to R250 a month. Turning next to old age grants, the
reach of the grant has also been broadened, with the eligible age for men being lowered to 63 in July
2008, and lowered further to 60 in 2009. In addition, from April 2009 the maximum value of this grant,
together with the disability and care dependency grants, rose by R50 to R1 010 a month, thus
improving the support that the grant provides (SASSA, 2010). It is clear then that while the social grant
system was substantial in the pre-crisis period, both in terms of spending as well as reach, the post-
crisis period saw an extension of the system, particularly for poor caregivers and the elderly, usually
women.
In addition, the ILO is involved in exploratory research to estimate the potential benefits and
costs of providing social security to African migrant workers. This project, named the Portability of
Social Security Benefits to African Migrant Workers project, aims to identify the legal and
administrative challenges of African migrant workers in accessing social security benefits. Migrant
workers from neighbouring countries such as Lesotho, Mozambique, Swaziland, and Zimbabwe are
investigated. In the first half of 2011, workshops and meetings will take place to share innovative ideas
and knowledge gained.
2. Building an adequate social protection for all, drawing on a basic social protection floor
South Africa’s Social Security System is based on a collection of grant system and enterprise
based or sector based social insurance schemes. Changes had been introduced onto the two largest
social security programmes to extend coverage. The State Old Age Pension (SOAP) had lowered the
age at which men qualify for social pensions from 65 to 60, and increase eligibility into the Child
Support Grant (CSG) from 14 to 16 years of age, and there is further proposal to extend this to 18
years of age. According to the Economic Policy Research Institute Report (2002) one of the weaknesses
of South Africa’s security system is the low rate of take up of its programmes i.e. out of the total
eligible only 43% is covered, old age pension covers 85% and child support only 20%, the application
process identified as a major problem. However, since 2001 the number of recipients of social
assistance has increased from 3.1 to 11 million in 2007, and the bulk of those recipients have been
children under the age of 14 who as at the end of October 2006 exceeded 7.6 million. Inter alia, social
security programmes entail Disability Grant (DG) for the disabled, Foster Care Grant (FCG) for non
biological children under 15 and applies for not more than six months, Care Dependency Grant (CDG)
for children under 18, Grant in Aid, as an emergency, for people already receiving old age grant, is a
temporary relief for people in dire conditions for basic material needs. The condition for eligibility is
that one must be awaiting permanent aid and be medically unfit to undertake work. Disability or War
Veterans Grant and require that he/she must be under care of someone, and the War Veterans Grant
of which recipients must have fought in the Second World War and the Korean war.

57
Table 13 Trends in number of Social Grant Beneficiaries
Type of Grant 1999 2002 2005 2008 Jan-10
Older Person’s 1,818,733 2,010,884 2,097,982 2,222,950 2,508,899
War Veteran’s 4,340 3,790 3,340 1,500 1,293
Disability 459,880 537,925 1,305,464 1,408,456 1,303,203
Foster Child 65,938 95,216 256,949 454,199 504,666
Care
Dependency
22,438 34,978 85,897 102,292 110,359
Child Support
Grant
330,328 1,801,862 5,326,581 8,189,975 9,400,347
Grant-in-aid - - - 37,772 51,998
Total 2,701,657 4,484,655 9,076,213 12,417,144 13,880,765
% Growth - 66% 102% 37% 12%
The value of social grants kept up relatively well with the inflation rate -safety net will
continue to grow over the next few years as a result of recent policy amendments; In 2007 the means
tests for all the grants were significantly raised - in the case of the child support grant it was doubled;
Social Grants consume on average 3,4% of the Gross Domestic Product and about 12% of total
government expenditure. Improved coverage has not been at the expense of a significantly larger
outlay relative to the size of the economy. Quasi state interventions include Food bank South Africa
which as at 2009 has donated food to orphanages, shelters for abused women and children, old age
homes and early childhood development centres. To date Food bank SA networks have been
established in the metropolitans of Cape Town, Johannesburg, Durban, Port Elizabeth and
Pietermaritzburg with 66 000 beneficiaries.
3. Ensuring the long-term unemployed stay connected to labour market Unemployed adults (not including the youth) account for approximately one quarter of the
poverty headcount and the poverty gap in South Africa and the youth unemployed around half of this.
Government introduced in the 2010 Annual Budget a new measure to support youth unemployed
access the labour market by way of wage subsidies. Formalization and access to the labour market in
the framework of the reform of contributory social security is to be encouraged by way of contribution
subsidies for lower income groups, with low attachment to the labour market and stable working
patterns. A Public employment services bill is now under consideration in Parliament aiming at
strengthening active labour market policies. Studies are underway with the support of the ILO to
improve the linkage between Unemployment insurance benefits and active labour market policies.
4. Measures to narrow gender pay gaps and promote gender equality in the world of work
The Government has promulgated various pieces of legislation to support the principles
contained in Conventions 100 and 111. They include the Equality Act, Employment Equity Act, Basic
Conditions of Employment Act, Labour Relations Act and Skills Development Act. Legislation is very
progressive and articulate to eliminating any forms of discrimination in the labour market. Owing to
the country’s Constitution and progressive legislative framework, significant progress has been made
in the protection of women’s rights in various sectors of society including the workplace. Despite
efforts made by Government and the social partners in promoting gender equality in the workplace,
there is a challenge in addressing disparities in remuneration and employment occupation. The labour
market in South Africa still faces the challenge of gender discrimination. The Committee of Experts

58
have raised concerns on Convention 100 about the inclusion of the principle of work of equal value in
the EEA, income differentials, wage determination, job evaluation, women empowerment and
enforcement. Moreover research undertaken by the Office on Conventions 100 and 111 highlighted
gaps in knowledge and implementation capacity in respect of both conventions. In response to the
Committee of Experts’ concerns among other measures the Government has established a Director
General Review Team to ensure that designated companies (in terms of employment equity act) and
especially those listed at the JSE Securities Exchange are targeted to ensure that they comply with the
provisions of the EEA.
The data collection instruments are being amended continuously in order that data collection
and capturing is current and relevant, especially with regards to the income differentials. The biggest
challenge is enforcement by Government and compliance by employers to the letter and spirit of the
Conventions and related labour legislations. Mechanisms to monitor and enforce compliance are
clearly articulated in various documents including Employment Equity Regulations, Employment Equity
Monitoring and Enforcement Guidelines. Ineffective labour inspection does however exacerbate the
challenge of monitoring and enforcement. Trade unions are playing an active role in promoting gender
policies through collective bargaining, member awareness campaigns and workshops. The four key
sectors: retail, hospitality, agriculture and clothing and textile seem to be progressing well in
implementing labour legislations such as BCEA, LRA and EEA. This is shown by compliance to basic
conditions of employment such as minimum wages, leave, and retirement fund.
At a national scale, with the active support of the Office through training, advice and guidance
federation of unions like COSATU, NACTU and FEDUSA are actively involved in ensuring adherence to
gender equality policies at work. They secured agreements on a number of issues affecting women
such as equal pay, parental rights and sexual harassment. The agricultural sector is still experiencing
some resistance to change and better working conditions for women. Unions are also actively involved
in carrying out campaigns on relevant issues that promote and inform members on gender equality.
However, South Africa has made significant strides in ensuring gender equality in the workplace in
particular and in the society as a whole. One of the first measures to narrow gender pay gaps is the
availability of gender statistics. There is both international and local evidence of agreement on the
importance of this issue. The Beijing Platform of Action’s strategic objective requires governments to
“generate and disseminate gender disaggregated data and information for planning and evaluation”.
The ILO has commissioned research and has been working with STATSSA to ensure that
research and data collection is gender sensitive, both quantitatively and qualitatively. Sex
disaggregation of data is one part of the picture. The project also works to ensure that research and
data collection is focused on issues pertinent to promoting gender equality in the workplace, i.e. time
use and work-life balance, availability of childcare, maternity and paternity protection, discrimination
and equal remuneration. At country level, Clause 3(2) of South Africa’s Statistics Act, No 6 of 1999,
states that official statistics must be “sensitive to distribution by gender, disability, regional and similar
socioeconomic features”. Clause 8(1) states further that the Statistics Council must be “broadly
representative of groups or interests concerned with the production and use of official statistics,
including … demographic and social interests, including rural, gender and disability interests.” There is
acknowledgement of the need and importance of “gender-disaggregated data”. STATSSA has already
been providing a large amount of sex disaggregated data. But, by its own admission more could be
done. With such data there can be more effective measures to narrow the gender pay gaps.

59
C. Strengthening respect for International Labour Standards
1. Increase vigilance to achieve the elimination and prevention of an increase in forms of forced labour, child labour, trafficking, and discrimination at work
South Africa is a major destination country of victims of trafficking in Africa. In order to tackle
this plague, efforts will be undertaken to analyze the routes of trafficking, the economic sectors where
victims are economically active, and possibilities to collaborate with the neighbouring countries of the
region in order to assist the victims and to reduce the number of potential victims. Discrimination at
work constitutes not only a violation in basic human rights, but has also negative cost implications in
society. Consequent to the political history of the country, particular heed will be paid to identifying
the levels where discrimination, particularly race and gender based, and against indigenous peoples,
remain in order to suggest solutions to rectify the situation.
South Africa has ratified both the ILO Minimum Age Convention No 138 and the ILO Worst
Forms of Child Labour Convention, No. 182. There is a lack of empirical research and statistics to
establish the current prevalence of child labour but it is apparent that in certain contexts it remains a
problem, closely related to poverty and the high HIV prevalence rate which increase vulnerability of
children to falling victim to child labour. The national Child Labour Action programme (CLPA) sets out
specific actions to be taken in the period to 2012. Child Labour Interactive Group (CLIG) structures
have been established to support local level action but in many areas these structures are not
operating at an optimal level. There is still a need to generate increased public awareness on child
labour, particularly in agricultural and rural communities.
There is an acknowledgement that the elimination of child labour raises many challenges that
cut across government departments and calls for strong collaboration between Ministries and other
role-players in areas such as education, social protection and social care. The successful promulgation
of the regulations on child work will lay a strong foundation for further efforts to combat child labour
particularly its worst forms. Tackling child labour is closely linked to efforts to ensure children remain
in school until the minimum age of employment. The 2010 Matric results show that of the 1.2 million
who registered for schooling 12 years ago only just above 50% sat the Matric exams. A more detailed
analysis of the extent of school drop-out, the underlying causes (e.g., is child labour an issue?), and
opportunities for training and employment for drop-outs would be valuable.
Recent reviews show that young people with no education or incomplete schooling, who did
not fare very well in terms of employment and job security during the better days, have suffered even
more as a result of the crisis. However the indications are that in general, more young people are
delaying entry to the labour market, staying longer at school or seeking some form of training before
entering the labour market.
2. Measures to increase the respect for freedom of association, the right to organize, and the effective recognition of the right to collective bargaining
Freedom of Association and the right to Collective Bargaining are essential to promoting
industrial peace, and in turn vital for socio-economic development. The principles developed by the
two ILO Supervisory bodies will be promoted at a variety of levels, as well as abidance by the

60
comments made by the ILO bodies. South Africa, because of its history already has a strong labour law
regime which safeguards freedom of association and the right to collective bargaining.
3. Measures that recognise the relevance of international labour Conventions and Recommendations32
Twenty international labour Conventions are presently in force in South Africa, including the
eight fundamental Conventions.
Temporary Employment Services
In a report received in November 2009 on the application of the Unemployment Convention,
1919 (No. 2), ratified in 1924, the Government suggests that it will promote the complementarity of
public and private employment services. In South Africa, the definition and practice of labour brokers
is very much contested territory. Temporary employment services are defined in line with Article 1 (b)
of the Private Employment Agencies Convention, 1997 (No. 181) as services whereby agencies (labour
brokers) employ workers with a view to making them available to a third party (user enterprise), and
such employees work under the supervision and instruction of the user enterprise but are
remunerated by the labour broker.33 The workers have a contract with the agency, whereas the
agency has a contract with the user enterprise. A triangular relationship thus exists between the
agency, the worker and the user enterprise in this specific case; however, other services by private
employment agencies do not involve such employment relationships. Triangular employment
relationships are currently regulated by Section 198 of the Labour Relations Act (LRA) of South Africa,
1995, which makes provision that the user enterprise and the labour broker are jointly and severally
liable for any breach of a collective agreement or binding arbitration award that regulates terms and
conditions of employment, of the Basic Conditions of Employment Act; or of a determination made in
terms of the Wage Act..
Recently, Section 198 came under scrutiny from various national experts. The consensus is
that South Africa faces two types of challenges with respect to triangular relationships: the first is a
gap in the existing regulatory framework and the second is the rapid development of abusive
practices. These two factors undermine the basic labour rights of the employees. Workers have no
right to contest dismissal or impose liability to the agency due to the unique relationship of the three
parties. Both the agency and the user enterprise accept no responsibility towards the labour rights of
the employee. This resulted in the misuse/abuse of vulnerable workers by temporary employment
agencies. The protection of the vulnerable worker has thus become a priority in the revision of the
LRA, with COSATU calling for the outright banning of the temporary employment agencies while
FEDUSA on the other hand is calling for their better regulation. The Department of Labour in South
Africa proposed that Section 198 must be repealed. New definitions for employee and employer were
also drafted. The proposed amendment suggests that an employer is a person who directly supervises
the employee. This seeks to prevent the existence of triangular employment relationships in the South
32
These include ILO instruments concerning employment policy, wages, social security, the employment relationship, the
termination of employment, labour administration and inspection, migrant workers, labour conditions on public contracts,
occupational safety and health, working hours and social dialogue mechanisms.
33 However, it should be noted that Article 1 of Convention No. 181 also envisages at least two other forms of labour market
services of private employment agencies, namely (a) ”services matching offers of and applications for employment, without
the private employment agency becoming a party to the employment relationships which may arise there from” and (b)
“other services relating to job seeking, determined by the competent authority after consulting the most representative
employers and workers organizations, such as the provision of information, that do not set out to match specific offers of and
applications for employment.”

61
African labour market. The amendment is therefore intended to avert the risk of abuse of temporary
workers by labour brokers or user enterprises, by clearly defining the employee and employer and
their respective labour rights.
Currently, a consultation process is underway on the four draft labour bills to consider a more
optimal manner in which to incorporate, among other measures, legislation to address the rapid rise
in labour broker services and the increase in worker vulnerability. In its contribution to the 2010
General Survey concerning employment instruments, the Government of South Africa indicated that
almost all provisions of the Employment Service Convention, 1948 (No. 88), are addressed in the
current legislation. It also indicated that the existing regulations on private employment agencies
under the Skills Development Act, 1998, allow for registration of the agencies. It is interesting to note
that the Government is invited by the Committee of Experts to supply information on the adoption
process of the Employment Services Bill and the revision of the Regulations with regard to Private
Employment Agencies (Employment Services for Gain). The Committee of Experts has also encouraged
tripartite consultations in South Africa that would envisage the ratification of the Employment Policy
Convention, 1964 (No. 122), as well as for Conventions Nos. 88 and 181.
Labour inspection
In the current context of the campaign launched by the ILO Director General for the
promotion of the ratification and effective implementation of the governance Conventions and the
repositioning of the DOL as a key player in delivering Decent Work at the workplace, with ILO technical
assistance, consultations are under way on ratifying the Labour Inspection Convention, 1947 (No. 81)
and the Labour Inspection (Agriculture) Convention, 1969 (No. 129). This is conducive to ensuring,
among other things, compliance with minimum terms and conditions of employment, notably wages
and OSH, and safeguarding the effective application of the fundamental principles and rights at work
in practice.
Termination of Employment
South Africa has not ratified the Termination of Employment Convention, 1982 (No.158), but
its influence is evident both in the wording of the statutory protection against unfair dismissal, as well
as in the frequent references to Convention No. 158 in court decisions.34 Applying the same level of
protection afforded by Convention No. 158 may be particularly important in a period of economic
crisis. The country’s highest court, the Constitutional Court, has expressed the view that security of
employment is a core value of the Labour Relations Act (LRA) of South Africa and this should be taken
into account in determining whether a person is an employee, and therefore entitled to protection
against unfair dismissal.35 The Constitutional Court has similarly acknowledged that Article 4 of
Convention No. 158 lays the foundation for South African legislation regarding unfair dismissal based
on misconduct, incapacity and operational requirements.36 According to the Court, Article 4
safeguards the employment relationship by providing that employers cannot dismiss employees at
will.
34
Section 3 of the LRA provides that any person applying the Act must interpret its provisions – (a) to give effect to its
primary objects; (b) in compliance with the Constitution; and (c) in compliance with the public international law obligations
of the Republic. 35
National Education Health and Allied Workers Union v University of Cape Town and others 2003 (3) SA 1 (CC); (2003) 24 ILJ
95 (CC); 2003 (2) BCLR 154 (CC) at para 47. 36
Equity Aviation Services (Pty) Ltd v Commission for Conciliation, Mediation and Arbitration and Others (CCT 88/07)
[2008] ZACC 16; [2008] 12 BLLR 1129 (CC); 2009 (1) SA 390 (CC) ; (2008) 29 ILJ 2507 (CC) ; 2009 (2) BCLR 111 (CC)

62
In another significant decision, the Constitutional Court relied on Article 8 of the Convention37 in
deciding that an arbitrator must act impartially when evaluating the fairness of the dismissal.38 The
Court overturned a decision rendered by the country’s second highest court, the Supreme Court of
Appeal, which found that an arbitrator must show a “measure of deference” concerning the reason
for dismissal given by the employer. A total of 42 judicial decisions refer to Convention No. 158 or
Recommendation No. 166 of 1982; in addition, there are 16 decisions that contain a reference to the
earlier Recommendation No. 119 of 1963.
The Employment Relationship
Over a four year period, South Africa’s National Economic and Development Advisory
Council (NEDLAC) debated the problems surrounding unclear employment relationships and the
emergence of new patterns of work organization through which services or goods are being produced.
In some of these new work arrangements, it was increasingly difficult to establish whether or not an
employment relationship exists between the parties based on the traditional criteria of authority and
subordination. With a view to providing clarity and certainty as to who is an employee for the
purposes of the Labour Relations Act and other labour legislation relationship, a Code of Good
Practice39 was adopted in 2006 to set out guidelines for determining whether persons are employees.
The Code also sets out the interpretive principles contained in the Constitution, labour legislation and
binding international standards that apply to the interpretation of labour legislation and ensure that a
proper distinction is maintained between employment relationships which are regulated by labour
legislation and independent contracting. This Code of Good Practice is one of the most frequently
cited good examples of how a country can give effect to the Employment Relationship
Recommendation (R.198).
D. Social dialogue: identifying priorities, stimulating action, bargaining collectively
1. National agreement through tripartite social dialogue “It is more important now than ever that we work in partnership on a common
programme to respond to this crisis. We take as our starting point the Framework for
South Africa’s Response to the Inter-national Economic Crisis, concluded by government,
labour and business in February this year. We must act now to minimise the impact of
this downturn on those most vulnerable.”
President Jacob Zuma, State of the Nation address, 3 June 200940
In December 2008, the former President Kgalema Motlanthe convened a Presidential
Economic Joint Working Group, of organised labour, government and business to discuss amongst
others, the challenges brought about by the global economic crisis. Subsequent meetings of the
working group were held under the auspices of the National Economic Development and Labour
Council (Nedlac) to discuss how the social partners should respond, collectively to the difficult
economic conditions the country faced. These discussions culminated in the conclusion of the NFA on
37
Article 8 of ILO Convention No. 158 requires that an employee whose employment has been unjustifiably terminated be
afforded recourse to “an impartial body, such as a court, labour tribunal, arbitration committee or arbitrator.” 38
Sidumo & another v Rustenberg Platinum Mine (Pty) Ltd & others (2007) 28 ILJ 2405 (CC). 39
South Africa - Code of Good Practice: Who Is An Employee, 2006 40
President Jacob Zuma’s state of the nation address, 3 June 2009, www.info.gov.za/speeches/2009/09060310551001.htm)
63
19 February 2009. As discussed earlier in this scan, the NFA identified seven key platforms on which to
drive the crisis response. These included investment in public infrastructure amounting to R787 billion;
macro-economic policy; industrial and trade policy; employment policy; social policy, international
coordination through South Africa’s participation in the G20 and WTO and a commitment to
implement these measures through social partnership.
The NFA: Agreement to seven key platforms for the crisis response
Public Sector Investment
Over a three year period (until March 2012) an intensive public investment programme was launched, totalling
R787 billion. Raising the levels of public investments in infrastructure is one of the key responses to the
economic downturn. This programme includes: road and rail networks improvement and expansion, increasing
low-income housing and publicly owned rental stock, launching energy generation projects, the erection of more
infrastructure with regards to dams, water and sanitation systems, and the increase of educational and health
structures. Through these projects, decent jobs were created by using labour intensive processes. Private
investments were also encouraged to follow in the footsteps of the public infrastructure expansion.
Macro-economic Policy
The Working Group collectively decided that fiscal and monetary measures are necessary to address the
economic crisis. Coherence between policies is of vital importance. Fiscal measures must be counter-cyclical to
prevent a recession and to minimise the job losses within South Africa. The South African Reserve Bank (SARB)
must manage and adjust monetary policy accordingly. The value of a competitive rand was also recognised. The
currency’s impact on trade and employment were discussed and proposals were laid forward to utilise incentive
measures for building opportunities for a more competitive exchange rate. Proposals regarding tax relief to the
vulnerable groups such as low-income workers were also tabled.
Industrial and Trade Policy
De-industrialisation and the rebuilding of local industries were on top of the priority list as a national response to
the global economic downturn. Vulnerable sectors and small businesses are most labour intensive. They are
most susceptible to job losses and thus competiveness and performance are encouraged amongst them. The
specific needs of SMME’s are also given special consideration. An estimated R10 billion over a three year period
will be made available for a special National Jobs Incentive. The aim of the incentive is to provide financing to
industrial and special employment measures to avoid the de-employment of workers. A highly visible
development globally is the promotion of green technology. The Working Group acknowledge the negative
effect of climate change and promotes capacity building in green technologies and industries. ‘Green’ jobs are
also encouraged and an incentive scheme is proposed to launch the employment of workers in these industries.
The need for basic, adequate infrastructure was discussed. This will provide a basis for growth and development
in South Africa.
Employment Measures
Avoiding retrenchments and increasing employment is the main concern regarding the crisis’s effect on
employment. The expanded public works programme (EPWP) discussed earlier in the country scan forms part of
this initiative. In addition, the NFA makes provision for a new Training Layoff Scheme (TLS), financed by the NSF
and Sector Education and Training Authorities (SETAs), for workers whose employers would ordinarily retrench
them and which can be introduced on terms that would keep them in employment during the economic
downturn but re-skill them as an investment for the future economic recovery.
Social Measures
Social interventions are becoming increasingly important and needs to be improved. Communities must be
cushioned against the negative effects of the economic crisis such as job losses. The Parties also agreed on an
Emergency Food Relief Programme which will target the poorest communities and provide access to affordable
food. Investigations are also launched to identify the cost-drivers of the food chain. This will improve food
distribution and also reduce prices. Food production on a communal/social scale is also encouraged by the
Working Group.
Global Coordination
The Parties recognised the necessity of global unity in responding to the economic crisis. Collaborations with
other economies are vital, while incentives and interventions must be timely and adequate. Developing
countries and Africa in particular, must be represented better at international financial institutions. This will

64
ensure that global policies reflect developmental objectives more clearly, example at the WTO discussions. The
ILO must be strengthened by all countries to ensure labour standards are observed. The core standards on
freedom of association, the right to collective bargaining, non-discrimination and no child labour must be
proclaimed on all levels in societies. The global growth path and development are also subjected to scrutiny.
Instability brought on by large global macro-economic imbalances must be eliminated. South Africa thus must
ensure that the global growth is beneficial to all.
Social partnership in response to the crisis
South Africa has a well-developed system of social dialogue in Nedlac. An action plan needed to be implemented
timely, and monitoring and evaluation of it are vital. The following task teams are established to give effect to
the NFA:
• Leadership team
• Investment and Financing Task Team
• Social Interventions Task Team
• Employment Task Team
• Distressed Sectors Task Team
2. Collective bargaining agreements at all levels
While the economic crisis placed renewed pressure on negotiations resulting in a spike in
strikes, significant agreements were signed in 2009 and 2010 in bargaining councils and outside of the
bargaining council system. These negotiations also took place in a context of an inflation increase in
2008 and heightened worker expectations resulting from South Africa’s hosting of the FIFA 2010
World Cup. Inequality is very high in South Africa and workers were reluctant to moderate their
demands in wage negotiations in the face of reports they received of the packages received by senior
executives. The industrial relations climate was particularly tense, with industrial action reaching the
highest levels ever in 2010 with major strikes in the construction sector (2009), Transnet the state
owned rail, port and cargo enterprise (2010), in the auto manufacturing sector (2010) and in and the
public sector (2010). Social partners in the metal, mining and automobile manufacturing sectors did
manage to negotiate innovative agreements that aimed at limiting redundancies and retaining jobs
through short-time, extended annual leave and in two or three sectors, the utilization of the TLS to
prevent job losses (see box). By August 2010, an estimated 6 083 workers were placed on training
layoffs instead of being retrenched. However, given that the scheme was new, many union officials
and companies were simply unaware of its existence and proceeded to merely negotiate the terms of
severance pay. A notable feature is the extent to which the security of employment and terms of
temporary workers was also on the bargaining agenda, with collective agreements ensuring the
application of provisions agreed to this category of workers.
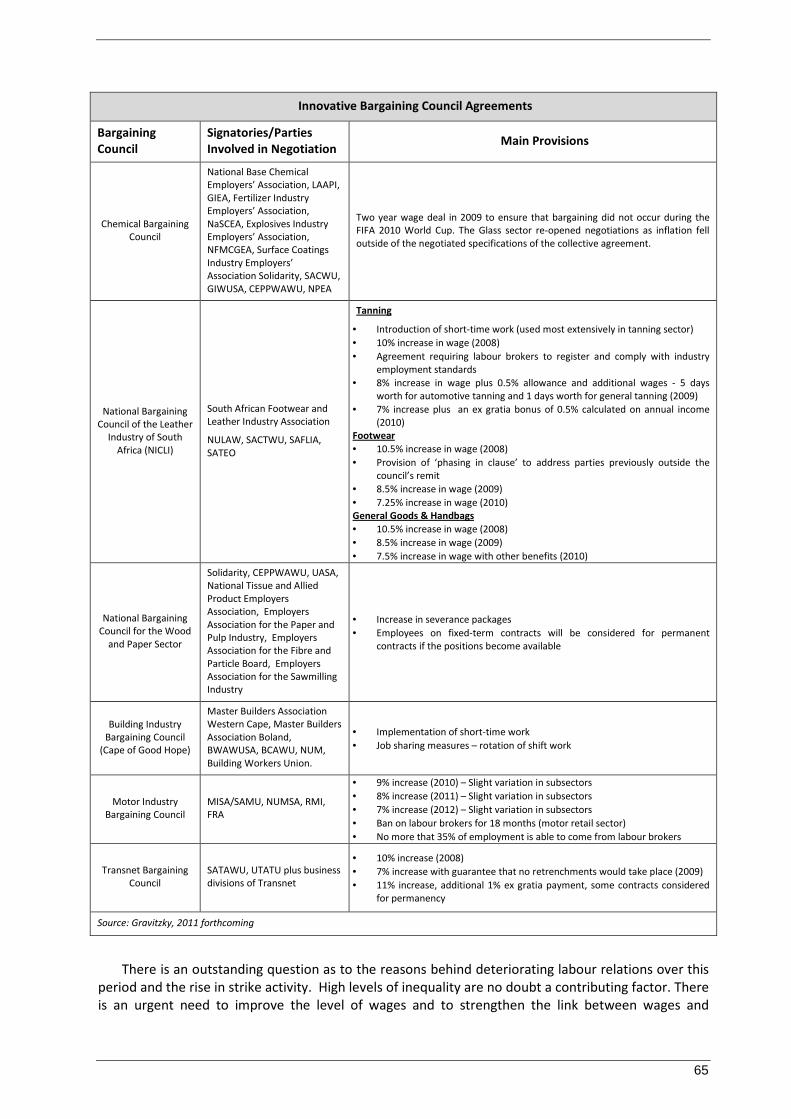
65
There is an outstanding question as to the reasons behind deteriorating labour relations over this
period and the rise in strike activity. High levels of inequality are no doubt a contributing factor. There
is an urgent need to improve the level of wages and to strengthen the link between wages and
Innovative Bargaining Council Agreements
Bargaining
Council
Signatories/Parties
Involved in Negotiation Main Provisions
Chemical Bargaining
Council
National Base Chemical
Employers’ Association, LAAPI,
GIEA, Fertilizer Industry
Employers’ Association,
NaSCEA, Explosives Industry
Employers’ Association,
NFMCGEA, Surface Coatings
Industry Employers’
Association Solidarity, SACWU,
GIWUSA, CEPPWAWU, NPEA
Two year wage deal in 2009 to ensure that bargaining did not occur during the
FIFA 2010 World Cup. The Glass sector re-opened negotiations as inflation fell
outside of the negotiated specifications of the collective agreement.
National Bargaining
Council of the Leather
Industry of South
Africa (NICLI)
South African Footwear and
Leather Industry Association
NULAW, SACTWU, SAFLIA,
SATEO
Tanning
• Introduction of short-time work (used most extensively in tanning sector)
• 10% increase in wage (2008)
• Agreement requiring labour brokers to register and comply with industry
employment standards
• 8% increase in wage plus 0.5% allowance and additional wages - 5 days
worth for automotive tanning and 1 days worth for general tanning (2009)
• 7% increase plus an ex gratia bonus of 0.5% calculated on annual income
(2010)
Footwear
• 10.5% increase in wage (2008)
• Provision of ‘phasing in clause’ to address parties previously outside the
council’s remit
• 8.5% increase in wage (2009)
• 7.25% increase in wage (2010)
General Goods & Handbags
• 10.5% increase in wage (2008)
• 8.5% increase in wage (2009)
• 7.5% increase in wage with other benefits (2010)
National Bargaining
Council for the Wood
and Paper Sector
Solidarity, CEPPWAWU, UASA,
National Tissue and Allied
Product Employers
Association, Employers
Association for the Paper and
Pulp Industry, Employers
Association for the Fibre and
Particle Board, Employers
Association for the Sawmilling
Industry
• Increase in severance packages
• Employees on fixed-term contracts will be considered for permanent
contracts if the positions become available
Building Industry
Bargaining Council
(Cape of Good Hope)
Master Builders Association
Western Cape, Master Builders
Association Boland,
BWAWUSA, BCAWU, NUM,
Building Workers Union.
• Implementation of short-time work
• Job sharing measures – rotation of shift work
Motor Industry
Bargaining Council
MISA/SAMU, NUMSA, RMI,
FRA
• 9% increase (2010) – Slight variation in subsectors
• 8% increase (2011) – Slight variation in subsectors
• 7% increase (2012) – Slight variation in subsectors
• Ban on labour brokers for 18 months (motor retail sector)
• No more that 35% of employment is able to come from labour brokers
Transnet Bargaining
Council
SATAWU, UTATU plus business
divisions of Transnet
• 10% increase (2008)
• 7% increase with guarantee that no retrenchments would take place (2009)
• 11% increase, additional 1% ex gratia payment, some contracts considered
for permanency
Source: Gravitzky, 2011 forthcoming

66
productivity in the recovery period. The New Growth Path places social dialogue at the heart of a
strategy to improve productivity and create jobs at the national, sectoral and enterprise levels.
3. Tripartite monitoring mechanism of policy implementation
The Department of Economic Development was tasked with leading the NFA’s
implementation. A number of task teams have been established with leadership from the social
partners in different sectors to facilitate implementation. The Minister convenes these task teams on
an ad hoc basis to monitor progress. In addition, the CCMA has regularly provided reports on the
implementation of the TLS. The Minister reports to parliament on progress when asked about NFA
implementation.
4. Strengthened capacities for labour administration and labour inspection
Effective labour administration and labour inspection are important for South Africa, more so
in the context of recovering from crisis. An effective labour administration system is vital for good
governance and economic progress as it can make Decent Work a reality at the workplace by helping
to improve the working conditions, safety and health, employment conditions and productivity. This
contributes to sustainable economic development. The Department of Labour in South Africa
conducted a modernization exercise to reform itself in the period of the crisis 2009 – 10. They
requested a rapid assessment of labour administration and labour inspection services from the ILO
regarding the repositioning of DOL to play a key role in advancing the Decent Work Agenda.
The overall aim of the rapid assessment was to assist South Africa to improve the
effectiveness and efficiency of its labour administration system and labour inspection services and
draw up a series of recommendations for the implementation of such improvements. The collection of
both qualitative and quantitative data was conducted through interviews and sought to gather
information regarding the present state of the labour inspection system. Using the assessment
methodology, the ILO team interviewed some representatives from the Department of Labour,
Provincial Offices and Labour Centres and met representatives of the Employers’ Organizations and
Trade Unions. The ILO team also interviewed the management of key parastatal organizations and
visited the Cape Town University. Recommendations were presented for consideration by DOL and the
social partners on certain aspects of labour administration system, with a special focus on
restructuring of the Head Office, functioning of labour inspection and administration of PES.
Arising out of those recommendations numerous measures were undertaken to strengthen
the capacities of labour administration and inspection in South Africa, namely: capacity building of
Labour Inspectors through ILO training on modern inspection systems, training of the Labour Centre
Business Unit Managers, developing a core of Labour Inspector Trainers of trainers within the
Inspectorate for sustainable training of new Inspectors, need to ratify Conventions 81 and 129, need
for collaboration across all the different Inspectorates in government, need for better collaboration
between the DOL and the Social partners on inspections, promotion of self inspection, collaboration
on inspections within the SADC region and development of standardized training manual on
Inspection.
5. Have the social partners been involved in shaping and implementation of crisis response measures?
The NFA set out an intention for the social partners to convene with the monetary authorities
through NEDLAC for the purpose of ‘lowering the cost of capital and significantly reducing the real
interest rate gap between SA and key trading partners as part of responding to the global economic
crisis’. This has been a source for debate in NEDLAC and Discussion was also to be carried out

67
regarding interest rates. A review of ‘preferential procurement legislation’ (p. 11, 12) was urged whereby all
social partners were to source supplies and resources locally where possible. Regarding the Expanded
Public Works Programme (EPWP), the framework agreement also made provisions for the social
partners to update the public works framework agreement. Full consultation through NEDLAC has
been assured between the social partners and the government concerning its stance in future G20
meetings as well as those carried out with members of the government concerned with fiscal matters.
As already outlined above the social partners are currently reviewing and providing their
responses to the NGP prior to its finalization. At a sectoral level the social partners also assisted in
negotiating crisis response packages for several key industrial sectors including the automotive,
clothing and textile and capital equipment, transport equipment and metals fabrication (CETEMF)
sectors. Underlying causes and the extent that social dialogue and addressing the gaps in decent work
for health workers would be a priority rather than only focusing on dispute resolution in relation to
strikes and conflicts in the health sector should become more of a focus; a meeting between ILO office
in South Africa and the Ministry of health to address continuing 'essential services' issues around
strikes in the health sector could provide an avenue for addressing these issues. It may be noted that
during a period of global economic downturn, sectoral social dialogue is a relevant and useful
instrument that can help bring solutions to challenges faced by sectoral parties operating within a
global framework. In this connection, a global framework agreement (GFA), also known as an
international framework agreement (IFA) was signed between the Belgian-based multinational firm
Umicore and the ICEM and the IMF as well as their national affiliates in South Africa. In line with this
GFA, bipartite social dialogue has led to a resolution of conflicts between the parties in South Africa
concerning the structure of employment, recruitment processes, and integration of the plants in South
Africa, and training and education.
Part III: Shaping a fair and sustainable globalization
This part of the Country Scan is based on Section IV of the Global Jobs Pact. It recognized that
the inseparable, interrelated and mutually supportive nature of the four strategic objectives in the
Global Jobs Pact is increasingly looked to, not only as an effective crisis response and recovery
strategy, but as the framework of a new social and economic development paradigm, characterized by
employment centred and income led growth with equity.41 The parties to the NFA recognised the
necessity of global unity in responding to the economic crisis. Collaborations with other economies
were considered vital, while incentives and interventions needed to be timely and adequate.
Developing countries and Africa in particular, needed to be represented better at international
financial institutions. This would help to ensure that global policies reflect developmental objectives
more clearly. As a result the South African government has pursued an aggressive global diplomatic
strategy in the context of the ILO, G20, WTO and recently the invitation to join the BRICS in pursuance
of a fair globalization. The South African international relations is premised on a fair deal for Africa.
A. Policy coordination, coherence and cooperation between government ministries
The government has taken significant steps to improve the policy coordination, coherence and
cooperation between government ministries. This has entailed reshuffling the roles and functions of
41
ILO: Report of the Committee for the Recurrent Discussion on Employment, International Labour Conference, 99th Session,
Geneva, June 2010.

68
the Presidency and creating a Department of Monitoring and Evaluation and the National Planning
Commission. The major functions of these units are outlined below:
Mission of the Presidency
To realize the strategic agenda of government and the enhanced integrity of state by: -
Ensuring coherence in planning, co-ordination, policy development and implementation - Performance
monitoring and evaluation To promote a culture of accountability across the spheres of government-
Communicating progress against the priorities of government- Mobilizing the nation towards a
common vision
Strategic Objectives of the Presidency
• To enhance policy development, co-ordination and integrated strategic planning across all
spheres of government;
• To facilitate effective communication between The Presidency and its stakeholders;
• To monitor and evaluate the implementation of government policies and programmes;
• To promote nation building and social cohesion and a partnership with the people towards the
collective achievement of a common identity and caring society;
The Presidency also further strengthened its organizational machinery through the
establishment of the National Planning and the Performance Monitoring and Evaluation Ministries
respectively, to ensure the effective planning, implementation, monitoring and evaluation of
government priorities and programmes. One of the major programmes of the Presidency is Executive
Co-ordination.
Purpose: To strengthen the strategic management and leadership capability of government
through developing a long-term national strategic plan and ensuring a common perspective on
government’s policy agenda on the country’s future direction taking into account major long-term and
spatial trends and dynamics. This programme also facilitates overall alignment of all spheres of
government programmes, their oversight and integration towards ensuring successful outcomes. The
programme provides long- and medium-term, as well as spatial and regional planning support, policy
advice and co-ordination, and monitoring and evaluation services to enable The Presidency, Cabinet
and government as a whole to manage the implementation of government’s strategic agenda. This
programme comprises two main units:
• Ministry of National Planning Commission
• Ministry of Performance Monitoring and Evaluation
Ministry of National Planning
In line with Presidential Directive, this was a newly established Ministry within The Presidency.
In accordance with the policy for National Planning the Ministry for National Planning includes a
Secretariat to the National Planning Commission. Both the Ministry and the Secretariat will be tasked
with the following functions:
• Long-term Planning
• To provide technical and other support to the National Planning Commission (as well as the
Minister and Mincomplan) in developing the long-term strategic vision (Vision 2025) and
strategies.
• Assisting Performance Monitoring and Evaluation in the development of government’s
Programme of Action from the MTSF including the annual reviews.
• Review plans for cross-cutting/priority programmes and mega projects and provide analysis for
effective intervention where necessary.
The National Planning Commission is a new initiative of government. Chaired by the Minister
in The Presidency for National Planning, the NPC will be responsible for developing a draft long term
vision and strategic plan for South Africa. The process of developing this draft plan will include
discussion and engagement across our country and will also provide opportunities for people to come
forward with ideas and suggestions. This draft will be considered by Cabinet and accepted, amended
69
or rejected. The Commission will also advise on cross-cutting issues that impact on South Africa’s long
term development. Cabinet approved the release of the Green Paper: National Strategic Planning in
August 2009. The Green Paper was publicly released in September alongside a discussion paper on
Performance Monitoring and Evaluation. Both documents were officially tabled in Parliament. The
National Assembly and NCOP solicited comments and representations as part of a broader public
engagement process. A report was presented to the National Assembly and after extensive debate the
report was noted. The main recommendation is that Parliament supports the Green Paper and
recognizes the primacy of Cabinet as the final arbiter and ultimate collective decision-making body
responsible for all major policies and plans. The NCOP report was also supportive of the broad thrust
of the Green Paper and the substantive content of the proposals.
In December 2009 Cabinet resolved that the Minister in The Presidency: National Planning will
drive the process towards the establishment of the NPC and that the President is tasked with the
appointment of the Commissioners and establishment of the Ministerial Committee on Planning. The
NPC has been established and the Commissioners appointed.
Functions of the NPC;
• Lead the development (and periodic review) of a draft Vision 2025 (“South Africa Vision 2025”)
and long –term national strategic plan for approval by Cabinet (first plan 2010)
• Lead investigations into critical long term trends under the supervision of the Minister in the
Presidency for the National Planning Commission, with technical support from a Secretariat
and in partnership with relevant other parties
• Advise on key issues such as food security, water security, energy choices, economic
development, poverty and inequality, structure of the economy, human resource
development, social cohesion, health, defense capabilities and scientific progress
• Assist with mobilizing society around a national vision and other tasks related to strategic
planning
• Contribute to reviews of implementation or progress in achieving the objectives of the
National Plan
• Contribute to the development of international partnerships and networks of expertise on
planning
B. Policies that promote efficient and well-regulated trade, and markets that benefit all and avoid protectionism. Varying development levels of countries must be taken into account in lifting barriers to domestic and foreign markets
South Africa has undertaken significant trade liberalization in the 1990s, both in the context of
the WTO and as a member of regional trade agreements. South Africa is member of the world’s oldest
customs union, the Southern African Customs Union (SACU), created in 1910. Other SACU members
are Botswana, Lesotho, Namibia and Swaziland. As a member of the Southern African Development
Community (SADC), South African exports enjoy favorable access to the markets of other member
states given the realization of the SADC free trade area in August 2008 (World Bank, 2010). SADC
currently has a membership of 15 member states, including all SACU countries. Through its
membership and large political and economic weight in SACU and SADC, South Africa plays a crucial
role for regional trade integration within Africa. Its membership in African regional trade blocks has
also been a determinant of its relationship with trading partners outside the region.
In 1994, the country signed the Marrakesh Agreement and, as a consequence, became a
founding member of the WTO in 1995. In 2006, South Africa (Kucera et al, 2010). In 2006, South Africa
signed together with the other SACU members a free trade agreement (FTA) with the European Free

70
Trade Association (EFTA). This agreement entered into force in May 2008. South Africa, together with
the other SACU members, signed a preferential trade agreement with the Common Market of South
America (MERCOSUR) in April 2009. As part of the SACU, South Africa had also been in negotiations for
an FTA with the United States. However, in June 2009 the United States decided to pull out of the
negotiations and instead focus on separate agreements with individual SACU member states (World
Bank, 2010). South Africa’s trade relations with the European Union (EU) are currently regulated
through a bilateral FTA, the Trade and Development Cooperation Agreement (TDCA) from 1999.
Though not a member of the so-called ACP (African, Caribbean and Pacific) group of countries, the EU
accepted (in 2007) South Africa as a member of the so-called SADC EPA configuration that is currently
negotiating an Economic Partnership Agreement (EPA) with the European Communities. In 2009 the
group split over the signing of an interim EPA with the EU and only four member signed the interim
document. South Africa opted not to sign but continues negotiating a comprehensive agreement
(World Bank, 2010).
South Africa active stance on the front of trade diplomacy reflects that trade liberalization had
been identified as a key component of the Government’s Growth, Employment and Redistribution
(GEAR) strategy, in place from 1996 to 2006 (Hayter et al., 2001; Qualmann, 2008). The trade reform
agenda of past years has resulted in significant trade liberalization through the elimination of non-
tariff barriers and a substantial lowering of nominal tariffs (Quallman, 2008, p.23). Between 1992 and
2000, average tariffs declined from 28 to 7 percent and peak tariffs declined from 1,390 to 55 percent
(Qualmann, 2008, p. 37). As of 2006, average tariffs in South Africa were 8 percent for all goods, 9 for
agricultural goods, and 8 percent for non-agricultural goods (UNCTAD/WTO, 2007).
At the onset of the global economic crisis, an immediate concern was a potential spiral of
trade protective measures with which governments seek to protect their own economies at the
expense of their trading partners. The Global Jobs Pact includes a commitment to restrain from such
policies, and an escalation of protectionism has been avoided thanks to determined global
cooperation. However, like many other countries, South Africa has implemented, and been itself
affected by, some policy measures that can be reasonably classified as hurting the commercial
interests of other countries. The Global Trade Alert (GTA) Database, a watchdog for trade restricting
measures, currently lists 13 measures implemented by South Africa that are classified as almost
certain to hurt foreign commercial interests (red), and another 8 likely to hurt foreign commercial
interests (amber). These measures include tariff increases on wheat and wheat flour, shovels, certain
garments, and a number of chemical products, selective loans or subsidies (which are considered
discriminatory against foreign competitors) as well as a number of anti-dumping measures.
South Africa heads the list of African countries whose commercial interests are affected by
trade distortive measures taken by other countries. The GTA database lists 123 red and another 64
amber measures. None of these measures are classified as retaliations to measures adopted by South
Africa in the database. The majority of these measures are government bailouts and subsidies for
domestic companies, tariff increases, or export support measures. Some of the measures highlighted
specifically in Global Trade Alert (2010) for having hurt African commercial interests include “Buy
American” clauses in the US stimulus package, subsidies for agriculture, textiles, and timber processing
in the Russian Federation, emergency loans and higher subsidies to farmers in the EU, as well as an
intervention of the French government with an international company to save employment in France
at the expense of employment in a plant in South Africa.
While following a general strategy that promotes trade, South Africa has also continued to
strengthen domestic institutions responsible for guaranteeing the smooth functioning of markets. The
regulation of markets in South Africa falls under the responsibility of the Competition Commission.
This is a statutory body constituted in terms of the Competition Act, No 89 of 1998 by the Government
71
of South Africa empowered to investigate, control and evaluate restrictive business practices, abuse of
dominant positions and mergers in order to achieve equity and efficiency in the South African
economy. The Commission’s mandate is to open the economy to ownership by a greater number of
South Africans. To this end, it implements competition law and effective structures to administer that
law and safeguards the efficient functioning of the economy, balancing the interests of workers,
employers and consumers. During the crisis, the Competition Commission investigations in the food
supply chain resulted in a number of cases being referred to the Competition Tribunal including in
respect of bread, dairy products, poultry and silo. Penalties of approximately R394m have been paid to
date. The Commission is conducting further investigations to assess whether cartels are continuing in
other forms. The importance of supporting new entrants and smaller firms in food processing has
been highlighted, together with the possible need for stronger intervention in agricultural inputs. The
extensive investigations by the Competition Commission into collusive behavior in the construction
supply-chain has resulted in a number of admissions by companies and applications for leniency. It is
expected that this will positively influence the remaining infrastructure development programme.
Future work is focusing on strengthening of the Competition Act to introduce stronger investigative
powers and personal liability.
C. Policies, including industrial policies, that enhance economic diversification by building capacity for value added production and services to stimulate both domestic and external demand The Department of Trade and Industry’s (DTI) Industrial Policy Action Plan, now commonly
referred to as ‘IPAP 2’, is a three-year rolling industrial development-related roadmap for the Medium-
Term Expenditure Framework (MTEF) period, commencing in the 2010/11 financial year and ending in
2012/13 . IPAP 2 is fundamentally a policy and action plan designed to help build South Africa’s
industrial base in critical sectors of production and value-added manufacturing, which are largely
labour-intensive industries. IPAP 2 is therefore designed to address the decline in the industrial and
manufacturing capacity and contribute to the reduction of chronic unemployment. IPAP 2 is a product
derived from intensive consultation within the Economic Sectors and Employment Cluster of Ministers
and Departments in the Government and the Social Partners. It reflects the fact that DTI does not
stand alone at the centre of industrial policy and practice.
IPAP 2 was adopted by the National Cabinet in February 2010, following a consultation
process with labour, business and industry organizations, academic and research institutions, and the
public at large. It draws on the theory and practice of other developing peer group countries especially
Brazil, India and China. It builds on the policy perspectives of the National Industrial Policy Framework
(NIPF) of 2007, as well as practical experiences of the recent past. It is premised on the understanding
that it represents one pillar of the ‘New Growth Path’, comprising a larger set of inter-related policies
and strategies, brought together under the Economic Development Department (EDD) by its Minister
Ebrahim Patel. IPAP 2 has four horizontal or transversal themes on which a number of interventions
are built, namely: industrial financing, procurement, competition policy and developmental trade
policies. It comprises 13 vertical sector strategies, whose potential require new and sustained support
divided in 2 groups – those that require the scaling-up of interventions and those that demonstrate
great potential over the medium- long-term. IPAP 2 sets out the economic rationale; key constraints
and opportunities; Key Action Programmes (KAPs); the lead and supporting departments and
agencies; as well as quarterly milestones for all of these interventions across departments, state-
owned enterprises (SOEs) and public agencies. However, if IPAP 2 is to succeed it will require greater
levels of policy coherence and programme integration across departments and agencies. For now i
IPAP 2 will be subject to continuous monitoring and evaluation by government and and the National
Assembly. It will be taken forward and implemented in strengthened consultation and engagement by
government, its social partners, labour and business. It is in this way, over the three-year period that it

72
can be used as a platform on which strong partnerships for industrial development and economic
growth can be built and sustained.
IPAP 2 charts a course for industrial development and the creation of decent work in the first
quarter of the 21st century. The global economic crisis highlighted various structural weaknesses in
the South African economy. The manufacturing sector’s low profitability compared to the service
sector is just one example. The industrial policy of South Africa has been amended to encourage job
creation but also to be adequately tailored to withstand a future economic catastrophe. It is clear that
macro-economic policy, which results in an overvalued exchange rate and high interest rates, will be
detrimental to industrial policy. The Department of Trade and Industry (DTI) recommends coherence
between macro- and micro- economic policies as well as a stronger articulation between the NGP and
the IPAP 2.
Commentators have proposed that the current constraints imposed by the WTO (World Trade
Organisation) require that South Africa needs to revisit the auto & auto components and textile &
clothing sector policies. Assessments of the economy-wide implications of the trade agreements need
to be done particularly after the change in the economic environment since the global economic crisis.
Government also needs to be clear on the responsibility and custodianship of industrial policies
together with the overriding objective, namely raising the productivity and efficiency of firms. Thus
the DTI has to enhance its capacities to effectively manage and direct policies. In essence, IPAP 2 must
focus clearly on raising productivity while also pursuing employment creation and equity. The DTI
argues that industrial policies are heavily dependent on other policies and one of the key constraints is
the lack of skills in South Africa. Thus IPAP 2 depends on the success of the new national Skills
Strategy. Evidence suggests that if -Skill policies are not augmented, it will hamper the impact of
industrial policies. The DTI makes it clear that skills and innovation policies need to be aligned to
sectoral priorities whilst encouraging the development of necessary skills.
The role of the private sector is also of significance. It is suggested that the private sector must
play a leading role in implementing IPAP 2 by identifying constraints as well as opportunities and thus
there is a need for coherence between the government and the private sector for IPAP 2 to succeed.
The DTI additionally proposes the following: Firstly, industrial finance needs to be channelled to real
economic sectors. Secondly, promotion of procurement in both the private and public sector will also
raise domestic production and create employment. Thirdly, policies regarding competition and
regulation must increase productive investments. In summary, government revised the IPAP 1 and
came up with IPAP 2 after the changing of the economic climate. Coherence between macro- and
micro- economic policies are encouraged, as well as between private and public sector. Skills are
identified as one of the key constraints hampering industrial policies’ effectiveness and thus skills
development remains critically important.
The global economy has changed and a structural shift towards knowledge-intensive goods
and services is visible. Global competition has moved away from commodity production, raw material
and manufacturing goods. Environmental and product standards are also driven by governments and
consumers. In the last decades this has all resulted in a vastly different global trade environment. The
DTI argues that due to the shift in resources into higher productivity activities, such as value-added
manufacturing, economic-wide benefits can be reaped. “What a country produces does matter” and it
matters not only for growth. It matters in particular for what the domestic labour force can learn and
what domestic enterprises can learn. Trade policies therefore have to adjust, not only to keep up with
global shifts, but to facilitate new economic activities. Government’s Trade Policy and Strategy
Framework published in April 2010, suggests that the service sector in South Africa is vital to economic
development. Employment in this sector accounts for 72% of total formal employment whilst 74% of
output is generated from service activities. Expansion of the service sector is thus viewed as a priority

73
to promote growth as well as employment creation. Trade policy will need to be adjusted to
incorporate the importance of the service sector.
One of the key constraints, pointed out by almost all commentators, is the limitation of
adequate data and statistics on trade issues, especially on services trade. Information accuracy, quality
and consistency needs to be addressed for trade policy to succeed. South Africa also needs to ensure
that policy space is preserved, economic efficiency is balanced with socio-economic equity, and that
an overall developmental growth path is pursued. Another constraint is, as with the industrial policy,
the lack of adequate skills. Moving towards a more knowledge-intensive export economy requires
sufficient skills. Lastly, the DTI suggests that linkages with social safety nets and worker re-training
needs to be investigated to assess the potential gains from aligning the trade policy with these issues.
Trade policy, in summary, thus needs to be adjusted to accommodate the shift towards skills-intensive
export and be aligned with other policies in South Africa to ensure the promotion of wider socio-
economic development and growth.
Adjusting/fixing the exchange rate
Since the beginning of 2010 the Rand has strengthened significantly against the dollar. Figure
14 indicates the movements of the Rand/Dollar exchange rate from January 2010 to October 2010.
Several prominent voices have spoken out against the strong currency, arguing that it is hampering
export growth and global competitiveness. Given the output intensity of South Africa’s growth path
though, it is not clear that the strong currency is everywhere and always bad for long-run economic
growth.
Figure 14: Rand/Dollar exchange rate; 2010
Source: Own Calculation form South African Reserve Bank (SARB; 2010)
OECD suggests that the South African government should provide policy signals to preside
over the exchange rate as well as the direction of the interest rate. The volatility of the currency is a
significant driver of inflation and thus policies needs to be adjusted if inflation wants to reach its 3-6
per cent target range. A desire for a more stable and competitive exchange rate has also been raised.
Experts have suggested that the Rand has often been overvalued. The South African Reserve Bank has
been intervening in foreign exchange markets to stabilise the Rand, although it’s not clear that such a
policy is viable in the long-run. It thus leaves the South African government with two options: devalue
the rand/ fix the rand at a lower level, or wait for slower global economic growth, which will result in a

74
weaker rand. Finance Minister Pravin Gordon has made it clear that there will be no change to existing
exchange rate policies as of now.
Incorporation of Regulation 28 to retirement fund investments
In the wake of the financial crisis the Government is attempting to regulate the investment
rules governing pension funds. In particular, they are focused on curtailing the share of investment
allowable in hedge fund-type vehicles. The proposal put forward is to include a specific category of
allowable assets in Regulation 28 of the Pension Fund Act. This will allow retirement funds to invest
into portfolios managed by hedge funds. Limitations on total investment will be placed upon the
hedge funds as well as a maximum concentration limit on a single hedge fund investment. Currently,
any regulated hedge fund product allows for some of the activities suggested (such as the use of
leverage), but prudent management of the hedge fund is the key to success. Designing a structure that
allows limited liability and protection of investors’ capital is the aim of this incorporation of Regulation
28. This amendment will impact the hedge funds as follows; Firstly the nature and role of financial
derivatives as assets will change. Secondly, leverage will be affected when used as derivative, thirdly,
the role of script borrowing will adjust in investment strategies. Fourthly, portfolio exposure and the
measurement thereof will be impacted together with the use of unlisted derivatives. Lastly, solvency
protection will change to protect the investor. An interim dispensation exemption is also suggested to
ensure that all hedge funds have significant time to adjust to the new regulation. Various options are
suggested to ensure a smooth transition into the optimal interim solution.
D. National supervisory and regulatory framework for the financial sector, so that it serves the real economy, promotes sustainable enterprises and decent work and better protects savings and pensions of people
Minister Manuel stated in his budget speech on 11 February 2009, that the country’s response
to the crisis is to build on, ‘policies we have consistently pursued over the past decade and half: sound
prudential regulation of the financial sector.’ The National Treasury is responsible for managing South
Africa’s national government finances. Supporting efficient and sustainable public financial
management is fundamental to the promotion of economic development, good governance, social
progress and a rising standard of living for all South Africans. The Constitution of the Republic (Chapter
13) mandates the National Treasury to ensure transparency, accountability and sound financial
controls in the management of public finances.
The National Treasury’s legislative mandate is also described in the Public Finance
Management Act (Chapter 2). The National Treasury is mandated to promote government’s fiscal
policy framework; to coordinate macroeconomic policy and intergovernmental financial relations; to
manage the budget preparation process; to facilitate the Division of Revenue Act, which provides for
an equitable distribution of nationally raised revenue between national, provincial and local
government; and to monitor the implementation of provincial budgets. As mandated by the executive
and Parliament, the National Treasury supports the optimal allocation and utilisation of financial
resources in all spheres of government to reduce poverty and vulnerability among South Africa’s most
marginalized. Over the next 10 years National Treasury priorities include promoting decent work
through increasing investment in infrastructure and industrial capital; improving education and skills
development to raise productivity; improving the regulation of markets and public entities; and
fighting poverty and inequality through efficient public service delivery, expanded employment levels,
income support and empowerment.

75
E. Policies that contribute to building adequate social protection for all, drawing on a basic social protection floor including: access to health care, income security for the elderly and persons with disabilities, child benefits and income security combined with public employment guarantee schemes for the unemployed and working poor
Under consideration in the reform towards comprehensive Social Security and retirement is
the introduction of mandatory defined benefit scheme for all except self employed. There are
proposals for establishing a statutory insurer within the National Social Security Fund (NSSF) ensuring
an expanded risk pooling and related social solidarity measures, affordable benefits to lower income
workers and integration of existing private sector arrangements under a new regulatory framework.
Under this scheme low income workers would benefit from a contribution subsidy. Supplementary
savings would be encouraged to voluntary schemes via tax incentives. A default fund would be set up
as a savings vehicle for people who don’t have access to an occupational retirement fund as
complementary retirement provision on top of basic coverage. Government is currently considering a
number of improvements in basic social protection in the framework of its Comprehensive social
security reform, including:
• Health coverage -- Through the draft National Health Insurance (NHI) scheme there is proposed
universal coverage to a comprehensive “core” package of health services for all citizens.
• Child care-- A comprehensive system of child support should, by 2012, include all qualifying
children covered up to the 18th birthday, an improvement which was confirmed in the 2010
Budget for phasing-in over the next three years; possibility of a Child benefit to age 25 (if
studying)
• Active population-- Study of a continuation social assistance type benefit after the expiration of
the unemployment benefit; Assessment of Expanded public employment program II and its
generalization is ongoing; increased use of Community Work Programs at the local level;
• Old age and disability -- Introducing a universal benefit by setting up progressively the income
threshold at a level which does not result in the arbitrary exclusion of people in need and
thereafter subjecting the benefit to tax claw back arrangements
These important reform proposals are aimed at a very significant strengthening of the social
security system, which may lead to integrating existing system of non-contributory social assistance
benefits - social protection floor – with expanded contributory social insurance mechanisms. Recently
the ILO undertook a technical analysis of the Consultation Document, the findings of which are
summarized below.
Extracts from "Strengthening South African social security system and its links with labour market policies -
A technical analysis of the Consultation Document on Comprehensive social security and retirement reform
in South Africa", ILO paper for South Africa Department of Labour (February 2011).
The proposed reforms in unemployment insurance still fall short to close the gap in social security coverage
for the active population. The ILO supports a proposal for a UIF new employment/training benefit building on
pilot training assistance for unemployed by the UIF on top of the proposed continuation benefit (a social
assistance benefit for the insured unemployed). The ILO also recommends the explicit introduction of a
minimum replacement rate for unemployment benefits in order to raise it up to minimum international
standards set by C. 102 on Social security Minimum Standards. Social assistance should also be set up for the
uninsured unemployed, within that broader social security and employment policy framework. A monthly cash
allowance would be provided as an incentive and subject to participation in employment and training
programs. In case employment guarantee program is also implemented, the two would need to be integrated.
With respect to pensions the proposal aims at building a comprehensive pension system composed of three
tiers: (1) basic, flat rate, possibly universal old-age pension tier build on the current old-age pension (2) new
mandatory, earnings related contributory pension; (3) supplementary tier build on enhanced and better
regulated current system of pension funds. Amongst the recommendation is that it would be desirable that
combined replacement rate from the first two tiers reaches 40% after 30 years for all those with incomes

76
lower than typical levels to comply with ILO Convention no 102 on Minimum Standards in Social Security.
Second is the question of reaching by the reform also those who are already many years on the labor market
(grandfathering). Clear options should be presented with accelerated universalization of the current old-age
pension as one of them. Third there is a strong case for the need for cross-subsidization of disability and
survivors’ pensions with old age retirement taking into account current mortality trends; one should consider
not earmarking contribution rates for these separate contingencies within the overall pension contribution
(suggested 10%). The last point concerns the question of what would be the role of workers and employers in
the supervision of the planned National Social Security Fund, and an open question still on how to secure
members participation in the regulatory framework of the third tier pension funds.
The main issue is how to ensure that the new system combining contributory social insurance with non-
contributory social assistance is strengthened and links in a coherent and coordinated way to the equally
strengthened and coherent system of employment services, public employment programs and active labor
market policies including skills development which would support job search of those able and willing to work
both in the formal and less formal parts of the South African labor market.
The proposed creation of a Department of Social Security integrating policy making and administration
social insurance and social assistance can be seen as a step in a right direction. However, the question
remains how to ensure policy coherence and institutional coordination at national level with the Department
of Labor (employment services, active labor market policies, labor inspection) but also with other government
departments involved in employment policies and programmes and skill development. Forming a cluster
focusing on ensuring policy coherence between social security, employment and labor market policies
would be a minimum necessary requirement. Then there is a need to develop institutional solutions ensuring
close coordination in implementation of these policies locally.
F. Policies that ensure that young women and men have the appropriate education, skills and opportunities to participate in the economy
The government through the Department of Higher Education and Training launched the third
National Skills Development Strategy (NSDS III) in January 2011 to make sure that the energy and
resources of stakeholders are focused on addressing skills challenges, and that measurable impact is
achieved over the next five year period. The strategy follows the integration of higher and further
education and skills development into a single Department of Higher Education and Training in 2009.
The key driving force of this strategy is improving the effectiveness and efficiency of the skills
development system so that it impacts positively on poverty reduction and inequality. The strategy is
informed and guided by other overarching government strategies, especially the Human Resource
Development Strategy, the New Growth Path, the Industrial Policy Action Plan, the outcomes of the
Medium-Term Strategic Framework, the rural development strategy, the new environment strategy
and, sector development plans.
The strategy seeks a closer synergy between the world of work and formal education system
by promoting partnership among employers, public education institutions (Further Education and
Training (FET) colleges, universities, universities of technology), private training providers and Sector
Education and Training Authorities (SETAs). It provides direction to sector skills planning and
implementation as well as a framework for utilization of a skills development levy. It represents an
explicit commitment to encouraging the linking of skills development to career paths, career
development and promoting sustainable employment and in-work progression. The emphasis is
particularly on those who do not have relevant technical skills or adequate reading, writing and
numeracy skills to enable them to access employment.
Each of the above goals has outcomes and outputs that will be the basis for monitoring and
evaluation of implementation and impact of the strategy. NSDS III addresses the scope and mandate
of SETAs, which are expected to facilitate the delivery of sector specific skills interventions. Their role

77
in helping monitor quality on the supply side remains, but will reduce as other institutions, such as the
Quality Council for Trades and Occupations (QCTO), are established. However, SETAs should ensure
that they are backed by employers and workers, are acknowledged as a credible and authoritative
voice on skills and design solutions that address skills needs within their sectors.
A key priority is to improve the quality of basic education and employment services and
linkage among basic education, institutional training, learnership, entrepreneurship and employment
services. This is critical for the NSDS III to be able to contribute to inclusive economic growth.
Furthermore, if the NSDS III is to succeed, it will require greater levels of policy coherence and
programme integration across departments and national skills development institutions, as well as
increased participation of social partners and the private sector.
NSDS III is a key policy thrust in seeking to achieve dramatic improvement in the skills
development system. The following suggestions for qualitative and quantitative expansion of skills
development could be considered as part of the implementation plan for the NSDS III:
• Quality assurance (QA) system is required for all institutions including National Skills Authority
(NSA), quality councils, SETAs and training institutes (FET colleges). The QA system should be
simple and feasible to implement. The emphasis increasingly should be on self- regulation,
transparency of operations, engaging stakeholders, disseminating information publicly about their
performance, linking financing to the performance and promoting excellence thorough
benchmarking and ratings schemes. A feedback mechanism from various stakeholders on the
functioning of these organisations should be set up, preferably on line.
• Give priority to increase coordination and articulation among three sub-frameworks (General and
Further Education and Training, Higher Education, and Trades and Occupations) of the National
Qualification Framework (NQF) managed by three quality councils (Umalusi, the Council on Higher
Education, and the Quality Council for Trades and Occupations).
• Recognition of Prior Learning (RPL) may be given a priority.
• Capacity building of governors of board, principal, teachers and other staff.
• Set up more FET colleges in partnership with industry and private sector. These should be easily
accessible to youth and workers.
• Increase training output through optimal utilization of capacity in existing training institutes by
increasing number of shifts and diversify programme offering in FET colleges to provide short term
training to early school leavers and continuing training programmes. Increase flexibility (part time,
weekend, offsite/ onsite/ e-learning) in training delivery.
• Utilize capacity in industry, particularly in small scale industry, to increase internships, learnerships
and apprenticeships.
• Engage social partners and communities in the training process in FET colleges, for example by
providing vocational and career counseling, mentorship, guest lecturers, internship, projects,
training to institutional staff, and assistance in getting employment.
Role of SETAs is crucial but they need support to improve their governance, capacity and
performance.
G. Policies that facilitate shifting to a low-carbon, environmentally friendly economy that helps accelerate the jobs recovery, reduce social gaps and support development goals and realize decent work in the process
United Nations Environment Programme (UNEP) defines a green economy as one that results
in “improved human well-being and social equity, while significantly reducing environmental risks and
ecological scarcities” (UNEP 2010). In its simplest expression, a green economy is low carbon, resource
efficient, and socially inclusive (UNEP 2011). In the context of a green economy, green jobs reduce the

78
environmental impact of enterprises and economic sectors, ultimately to levels that are sustainable.
Specifically, but not exclusively, this includes jobs that help to protect ecosystems and biodiversity;
reduce energy, materials, and water consumption through high-efficiency strategies; de-carbonize the
economy; and minimize or altogether avoid generation of all forms of waste and pollution. It also
includes work required to adapt to climate change. However, many jobs which are green in principle
are not green in practice because of the environmental damage caused by inappropriate practices
(ILO, 2008). In other words, green jobs need to be decent work, i.e. good jobs which offer adequate
wages and social protection, reasonable career prospects, and worker rights. People’s livelihoods and
sense of dignity are bound up tightly with their jobs. A job that is exploitative, harmful, fails to pay a
living wage, and thus condemns workers to a life of poverty can hardly be hailed as green.
South Africa has embraced opportunities for employment creation under the New Growth
Path (NGP) adopted in 2010 (see also reference in section II.A.8). The NPG is a comprehensive
program of action aimed at bringing about a transformation to an inclusive and greener economy over
the medium to long term. Opportunities for green job creation are identified both within economic
sectors as conventionally defined and in cross-cutting activities. Green technologies and biotechnology
building on South Africa’s strong resource base and on the country’s advanced skills and capacity are
seen as one of the key drivers for achieving the intended growth rate in GDP between 4% and 7% a
year and an employment intensity of that growth42 between 0.5 and 0.8.
Out of the total target of an additional 3 million jobs relative to a business as usual scenario,
the NGP aims at 300,000 additional direct jobs by 2020 in green the economy, with 80,000 in
manufacturing and the rest in construction, operations and maintenance of new environmentally
friendly infrastructure. The potential for job creation rises to well over 400,000 by 2030. Additional
jobs will be created by expanding the existing public employment schemes to protect the
environment, as well as in production of biofuels.
According to the New Growth Path the main strategies to achieve these targets are: • To provide comprehensive support for energy efficiency and renewable energy, including
appropriate pricing policies, combined with programs to encourage the local production of
inputs, starting with solar water heaters;
• To implement public employment and recycling schemes geared to greening the economy;
• To intervene for the achievement of stronger programmes, institutions and systems to diffuse
new technologies to SMEs and households;
• To provide greater support for R&D and tertiary education linked to growth potential and
developing South Africa as the higher education hub for the continent; and
• Continuing to reduce the cost of and improve access to broadband.
The implementation process must ensure the rigorous prioritization of programs and policies
needed for inclusive, green growth. There are risks that the state must manage, among them the still
fragile global recovery; competition and collaboration with the new fast-growing economies; and
competing interests domestically. The management of these and other risks, as well as the enormous
opportunities identified in the document, requires tight coordination and regular review. The table
below provides a summary of the green economy component of the NGP.
42
That is, the rate of growth in employment relative to the rate of growth in GDP.

79
Table 14: Job Driver 3 - Seizing the potential of new economies
The Green Economy Growing the knowledge economy
Potential
employment
target
300,000 additional direct jobs by 2020, of which
80,000 in manufacturing and the rest in
constructions, operations and maintenance, rising
to well over 400,000 by 2030
100,000 by 2020, based on estimated
current employment and taking out
overlaps with niche tourism, IPAP 2 and
public services
Where the jobs
are
Natural resource management and construction in
the short to medium term; renewable energy
construction and manufacturing of inputs in the
medium to long run
ICT, higher education, healthcare,
“green” technologies, mining-related
technologies, pharmaceuticals,
biotechnology
Main changes Comprehensive support for energy efficiency and
use of renewable energy; strategies to encourage
domestic production of inputs, starting with solar-
water heaters
Stronger institutions to diffuse new
technologies to SMEs and households;
greater support for R&D and tertiary
education linked to growth potential;
continue to reduce cost and improve
access to broadband
Core actions IRP to identify options for renewable energy
generation, with appropriate regulatory changes to
follow; development of green industrial support
package with IDC as champion and special
measures for SMEs and co-ops; codes for
commercial buildings to reduce energy use and
waste; social pact to support greening the
economy; targeted skills development; public works
to drive environmental programmes; including
recycling and community cleaning; technology and
fiscal policies to support diffusion of green
technologies for households and enterprises.
Development of strategies to support
employment creation, growth and
exports in knowledge-based services
and production, including strategic
public investment where appropriate;
technology and skills policy as discussed
in policy section; support Square
Kilometre Array.
It is worth mentioning that in the understanding that economic development planning cannot
exist apart from broader social and political progress, the NPG seizes upon strong social dialogue to
focus all stakeholders on encouraging growth in employment-creating activities. Extensive social
dialogue is required to ensure the benefits and sacrifices for the New Growth Path are equally shared.
A relevant issue not explicitly addressed in the NGP is the transition to a green economy in the
labor market. As the move toward a low-carbon and more sustainable economy gathers momentum,
growing numbers of green jobs will be created. Although winners are likely to far outnumber losers,
some workers may be hurt in the economic restructuring toward sustainability. Companies and
regions that become leaders in green innovation, design, and technology development are more likely
to retain and create new green jobs. But workers and communities dependent on mining, fossil fuels,
and smokestack industries—or on companies that are slow to rise to the environmental challenge—
will confront a substantial challenge to diversify their economies. Public policy can and should seek to
minimize disparities among putative winners and losers that arise in the transition to a green
economy, and avoid these distinctions becoming permanent features. In South Africa, the chances of
substantial renewable energy generation occurring are high but have to be balanced with the local
abundance of coal and the important economic role of the mining industry in the local economy
especially with regard to employment. The move to renewable energy generation and energy
efficiency will be gradual and not result immediately in a reduction or cut-back in coal mining.
Measures to accompany the transition with targeted social protection, re-skilling and diversification to
facilitate access to alternative income generation may nonetheless be helpful.

80
H. Strategies to create fiscal space to put in place systematic, well-resourced, multidimensional programmes to create decent work opportunities and sustainable enterprises
The four major policies that the government has put in place to create fiscal space for well
resourced, multi dimensional programmes to create decent work opportunities are:
• Medium Term Strategic Framework (2009 -2014),
• Industrial Policy Action Plan 2
• National Skills Development Strategy 111
• and the New Growth Path
These four policies working in conjunction with others seek to achieve job rich growth on a
sustainable basis. While the last three (Industrial Policy Action Plan 2, National Skills Development
Strategy 111, and the New Growth Path) have been sufficiently outlined in the previous sections, this
section will therefore dwell on the Medium Term Strategic Framework (2009 -2014). The elections in
2009 ushered in a new electoral mandate which defined the strategic objectives and targets of
government for the period 2009 – 2014. These were captured in the Medium Term Strategic
Framework (2009 -2014). This Medium Term Strategic Framework (MTSF, 2009 – 2014) built on
successes of the fifteen years of democracy. It is a statement of intent identifying the development
challenges facing South Africa and outlining the medium-term strategy for improvements in the
conditions of life of South Africans and for enhanced contribution to the cause of building a better
world. The MTSF is meant to guide planning and resource allocation across all the spheres of
government. National and provincial departments were required to develop their five-year strategic
plans and budget requirements taking into account the medium-term imperatives. Similarly, informed
by the MTSF, municipalities were to adapt their Integrated Development Plans in line with the national
medium-term priorities. The MTSF takes into account how global and domestic conditions may
change over time. In weighing trade-offs and making choices, the document also draws from the
lessons identified in the government’s Fifteen Year Review and issues that arose in the Scenario
Planning “Process (South Africa Scenarios 2025: The future we chose?).”
Based on the MTSF, a corresponding five-year Medium Term Expenditure Framework (MTEF)
or at least corresponding five-year broad indicative expenditure trends, will be developed. The MTSF
will be reviewed annually during the mid-year Cabinet lekgotla in the light of new developments and
experience in actual implementation. The yearly reviews will inform both the corresponding three-
year rolling MTEF’s and government’s annual Programme of Action.
In developing targets for 2014, account was taken of the UN Millennium Development Goals,
and the country’s responsibility to strive to attain these goals. The strategic focus of the framework
relates in particular to the understanding that economic growth and development, including the
creation of decent work on a large scale and investment in quality education and skills-development,
are at the centre of the government’s approach.

81
Bibliography
ADCORP, Employment Index, November 2010.
C. Arndt, G. Lewis (2001), “The HIV/AIDS impact in South Africa: Sectoral impacts and unemployment”,
Journal of International Development, vol 13, 427-449
CCMA Case Management System (CMS) Data, 2006-2009 (available at http://www.ccma.org.za )
Competition Commission is a statutory body constituted in terms of the Competition Act, No 89 of
1998
Department of Labour, 2010, Provincial office distribution of labour centres Public Employment
Services.
Department of Labour, 2010, Progress Report: Business Plan/ Strategic Plan 2009-2010 (Available at
http://www.pmg.org.za )
Development Indicators, 2009, (Available at http://www.info.gov.za )
Development Policy Research Unit, 2010, The Impact of Economic Recession on the Unemployment
Insurance Fund – Some results from the period April – August 2009 (Available at
http://www.dpru.uct.ac.za )
Draft Public Employment Services Bill (Available http://www.sabinetlaw.co.za/labour/articles/manyi-
public-service-employment-law-only-2011.
Economic Policy Research Institute Report (2002)
Erick J. Zeballos and Stefanie Garry (2010) “Jobs Recovery: Sectoral coverage - A Global Overview of
Employment Trends and Working Conditions by Economic Activity”, Geneva, (available at,
http://www.ilo.org/public/english/dialogue/sector/papers/themes/crisis/wp279.pdf )
Equity Aviation Services (Pty) Ltd v Commission for Conciliation, Mediation and Arbitration and Others
(CCT 88/07) [2008] ZACC 16; [2008] 12 BLLR 1129 (CC); 2009 (1) SA 390 (CC); (2008) 29 ILJ 2507 (CC);
2009 (2) BCLR 111 (CC)
Framework for South Africa’s Response to the International Economic Crisis, 2009 (Available at
http://www.info.gov.za )
Global Trade Alert. 2010. Africa Resists the Protectionist Temptation. The 5th GTA Report: A Focus on
Sub-Saharan Africa. Edited by Simon Evenett. London: CEPR.
Grawitzky, (2011 forthcoming), “Research study on the Role of Collective Bargaining in the Economic
Crisis and in Recovery”.
Hayter, Susan, Gerhard Reinecke and Raymond Torres. 2001. South Africa. Geneva: International
Labour Office.
ICEM: “ICEM, IMF Complete Umicore GFA Mission to South African Plants”, 31 January 2011.
(Available at http://www.icem.org/en/4-Chemicals-Pharmaceuticals/4215-ICEM-IMF-Complete-
Umicore-GFA-Mission-to-South-African-Plants )
ILO: Report of the Committee for the Recurrent Discussion on Employment, International
Labour Relations Act (LRA) of South Africa. (Available at http://www.labour.gov.za)
Kucera, David, Leanne Roncolato and Erik von Uexkull. (2010). “Trade contraction in the global crisis:
Employment and inequality effects in India and South Africa”. Employment Sector Working Paper No.
54. Geneva: International Labour Office.
L S Tladi (2006), “Poverty and HIV/AIDS in South Africa: an empirical contribution”, Journal des Aspects
sociaux du VIHSida, vol 3, No 1
Medium Term Budget Policy Statement, October 2010 (Available at http://www.treasury.gov.za )
Medium Term Strategic Framework (2009 -2014) (Available at http://www.thepresidency.gov.za )

82
National Credit Act no. 34, 2005 (Available at http://www.ncr.org.za )
National Education Health and Allied Workers Union v University of Cape Town and others 2003 (3) SA
1 (CC); (2003) 24 ILJ 95 (CC); 2003 (2) BCLR 154 (CC) at para
National Framework for South Africa’s Response to the International Crisis’ in February of 2009 in
Cape Town (The Presidency, 2009)
National Industrial Policy Framework, 2007: Available at http://www.dti.gov.za
Industrial Policy Action Plan (2010/11 – 2012/13): Available at http://www.dti.gov.za
National Skills Development Strategy (April 2005 – March): Available at http://www.uif.gov.za
National Treasury, On Social Security and Health Care Financing 2010, (Available at
http://www.treasury.gov.za )
National Treasury, 2010, Consolidated Government Fiscal Framework 2006/7 – 2009/10 (Available at
http://www.treasury.gov.za )
National Treasury, 2009 Expenditure Estimates (Available at http://www.treasury.gov.za ).
National Treasury’s Budget Review 2010 (Available at http://www.treasury.gov.za )
National Treasury (2010) South Africa’s Social Security Architecture
New Growth Path: The Framework (Available at http://www.info.gov.za )
SARB 2009 Economic and Financial Data, Statistics SA LFS (September 2000-September 2007, QLFS (2008:Q2-
2009Q3) & own Calculations.
SARB 2009 Economic and Financial Data for South Africa (Available at http://www.reservebank.co.za ).
Speech by former Finance Minister, Trevor Manuel in 2008, ‘The World in Economic Crisis’ (Available at
http://www.treasury.gov.za )
South African National HIV Survey, 2008
South Africa’s Statistics Act, No 6 of 1999 (Available at http://www.statssa.gov.za )
Statistics South Africa, Quarterly Labour Force Survey (Q3 2008, Q3 2009) Available at
http://www.statssa.gov.za/publications )
Statistics South Africa, Labour Force Survey (September 2000 - September 2007) http://www.statssa.gov.za
The ILO Global Jobs Pact: A Policy Framework to accelerate a job rich recovery (Available at
http://www.ilo.org/jobspact )
Presidential State of the Nation address, 2009 (ww.info.gov.za/speeches/2009)
Presidential State of the Nation Address, 2011: by President Jacob Zuma (Available at http://www.info.gov.za
The impact of the financial crisis on the world of work and HIV/AID Services: An ILO Study in 10 countries in
Sub-Saharan Africa, ILO, 2010
Qualmann, Regine. 2008. South Africa’s reintegration into world and regional markets: Trade
liberalization and emerging patterns of specialization in the post-apartheid era. Baden-Baden: Nomos.
UNCTAD/WTO. 2007. World tariff profiles 2006. Geneva: WTO.
World Bank. 2010. South Africa Trade Brief. World Trade Indicators 2009/10: Country Trade Briefs.
Washington, DC: World Bank.
Web resources:
The World Bank, Department of National Treasury, International Monetary Fund
The third National Skills Development Strategy (NSDS III)
Trade Policy and Strategy Framework, April 2010.