global landscape of renewable energy finance - irena.org · disclaimer: this publication and the...
TRANSCRIPT
Disclaimer: This publication and the material herein are provided “as is”. All reasonable precautions have been taken by IRENA to verify the reliability of the material in this publication. However, neither IRENA nor any of its officials, agents, data or other third-party content providers provides a warranty of any kind, either expressed or implied, and they accept no responsibility or liability for any consequence of use of the publication or material herein. The information contained herein does not necessarily represent the views of the Members of IRENA. The mention of specific companies or certain projects or products does not imply that they are endorsed or recommended by IRENA in preference to others of a similar nature that are not mentioned. The designations employed and the presentation of material herein do not imply the expression of any opinion on the part of IRENA concerning the legal status of any region, country, territory, city or area or of its authorities, or concerning the delimitation of frontiers or boundaries.
All photographs are from Shutterstock unless otherwise indicated.
Unless otherwise stated, material in this publication may be freely used, shared, copied, reproduced, printed and/or stored, provided that appropriate acknowledgement is given of IRENA as the source and copyright holder. Material in this publication that is attributed to third parties may be subject to separate terms of use and restrictions, and appropriate permissions from these third parties may need to be secured before any use of such material.
Citation: IRENA and CPI (2018), Global Landscape of Renewable Energy Finance, 2018, International Renewable Energy Agency, Abu Dhabi.
© IRENA 2018
ISBN: 978-92-9260-054-9
ABOUT IRENA
The International Renewable Energy Agency (IRENA) is an intergovernmental organisation that supports countries in their transition to a sustainable energy future and serves as the principal platform for international co-operation, a centre of excellence and a repository of policy, technology, resource and financial knowledge on renewable energy. IRENA promotes the widespread adoption and sustainable use of all forms of renewable energy, including bioenergy, geothermal, hydropower, ocean, solar and wind energy, in the pursuit of sustainable development, energy access, energy security and low-carbon economic growth and prosperity.
www.irena.org
ACKNOWLEDGEMENTSThis report was jointly prepared by the Climate Policy Initiative (CPI) and the International Renewable Energy Agency (IRENA). The contributing authors are Barbara Buchner, Cameron Carswell, Chavi Meattle, Padraig Oliver and Xueying Wang (CPI) and Henning Wuester and Costanza Strinati (IRENA) with additional contributions by Caroline Dreyer, Elysha Davila and Federico Mazza (CPI) and Rabia Ferroukhi and Diala Hawila (IRENA).
The report benefited from the reviews and comments of experts as well as CPI and IRENA colleagues.
For further information or to provide feedback: [email protected]
ABOUT CPI Climate Policy Initiative works to improve the most important energy and land use policies around the world, with a particular focus on finance. An independent organization supported in part by a grant from the Open Society Foundations, CPI works in places that provide the most potential for policy impact including Brazil, China, Europe, India, Indonesia, and the United States. CPI’s work helps nations grow while addressing increasingly scarce resources and climate risk. This is a complex challenge in which policy plays a crucial role.
www.climatepolicyinitiative.org

4
G LO BAL L AN DSC APE O F RENEWABLE ENERGY FINANCE

5
Figures, tables and boxes . . . . . . . . . . . . . . . . . . . . . . . . . . . . . . . . . . . . . . . . . . . . . . . . . . . . . . . . . . . . . . . 6
Abbreviations . . . . . . . . . . . . . . . . . . . . . . . . . . . . . . . . . . . . . . . . . . . . . . . . . . . . . . . . . . . . . . . . . . . . . . . . . 7
KEY FINDINGS . . . . . . . . . . . . . . . . . . . . . . . . . . . . . . . . . . . . . . . . . . . . . . . . . . . . . . . . . . . . . . . . . . . . 8 EXECUTIVE SUMMARY . . . . . . . . . . . . . . . . . . . . . . . . . . . . . . . . . . . . . . . . . . . . . . . . . . . . . . . . . . 11
1. OVERVIEW . . . . . . . . . . . . . . . . . . . . . . . . . . . . . . . . . . . . . . . . . . . . . . . . . . . . . . . . . . . . . . . . . . . 17
1.1 Falling costs and record capacity in 2016 . . . . . . . . . . . . . . . . . . . . . . . . . . . . . . . . . . . . . . . . . 18
1.2 Explaining the 2016 decline . . . . . . . . . . . . . . . . . . . . . . . . . . . . . . . . . . . . . . . . . . . . . . . . . . . . . 19
2. INVESTMENT BY TECHNOLOGY . . . . . . . . . . . . . . . . . . . . . . . . . . . . . . . . . . . . . . . . . . 20
3. INVESTMENT BY REGION . . . . . . . . . . . . . . . . . . . . . . . . . . . . . . . . . . . . . . . . . . . . . . . . . . 21
4. INVESTMENT BY FINANCIAL INSTRUMENT . . . . . . . . . . . . . . . . . . . . . . . . . . . . . 24
5. INVESTMENT BY SOURCE . . . . . . . . . . . . . . . . . . . . . . . . . . . . . . . . . . . . . . . . . . . . . . . . . 28
5.1 Private investment . . . . . . . . . . . . . . . . . . . . . . . . . . . . . . . . . . . . . . . . . . . . . . . . . . . . . . . . . . . . . 30
5.2 Public investment . . . . . . . . . . . . . . . . . . . . . . . . . . . . . . . . . . . . . . . . . . . . . . . . . . . . . . . . . . . . . 31
5.3 Regional investment by source . . . . . . . . . . . . . . . . . . . . . . . . . . . . . . . . . . . . . . . . . . . . . . . . . 34
6. OUTLOOK . . . . . . . . . . . . . . . . . . . . . . . . . . . . . . . . . . . . . . . . . . . . . . . . . . . . . . . . . . . . . . . . . . . . 39
Annex . . . . . . . . . . . . . . . . . . . . . . . . . . . . . . . . . . . . . . . . . . . . . . . . . . . . . . . . . . . . . . . . . . . . . . . . . . . . . . . 40
References . . . . . . . . . . . . . . . . . . . . . . . . . . . . . . . . . . . . . . . . . . . . . . . . . . . . . . . . . . . . . . . . . . . . . . . . . . . 41
CONTENTS
6
G LO BAL L AN DSC APE O F RENEWABLE ENERGY FINANCE
FIGURES
Figure 1. Renewable energy annual investment by technology type, 2013-2016 . . . . . . . . . . . . . . .17
Figure 2. Solar PV and wind power annual investment and capacity additions, 2013-2016 . . . . . . . . . .18
Figure 3. Breakdown of declining investment in solar and wind power between 2015 and 2016 . . . .19
Figure 4. Investment in solar PV and solar thermal including concentrated solar power, 2013-2016 . . . . . . . . . . . . . . . . . . . . . . . . . . . . . . 20
Figure 5. Investment in onshore and offshore wind power, 2013-2016 . . . . . . . . . . . . . . . . . . . . . . . . 20
Figure 6. Annual investment in marine energy, geothermal power, biomass-fired power, hydropower, biofuels and concentrated solar power, 2013-2016 . . . . . . . . . . . . . . . . . . . . . . . . .21
Figure 7. Annual renewable energy investment by region of destination, 2013-2016 . . . . . . . . . . 22
Figure 8. Solar PV investment by region of destination, 2013-2016 . . . . . . . . . . . . . . . . . . . . . . . . . . . . . . 23
Figure 9. Onshore wind investment by region of destination, 2013-2016 . . . . . . . . . . . . . . . . . . . 24
Figure 10. Top five offshore wind investment destinations, 2013-2016 . . . . . . . . . . . . . . . . . . 25
Figure 11. Global average reported debt-to-equity ratios for solar PV and onshore wind, 2015-2016 . . 27
Figure 12. Average reported debt-to-equity ratios for solar PV and onshore wind by country, 2015-2016 . . . . . . . . . . . . . . . . . . . . . . . . . . . . . . 27
Figure 13. Public and private investment in renewable energy finance, 2013-2016 . . . . . . . . . . . . . . . . 28
Figure 14. Number of countries adopting renewable energy policies, by policy type, 2005, 2010 and 2016 . . . . . . . . . . . . . . . . . . . . . . . . . . . . . . . 29
Figure 15. Total expenditures for renewable energy support in the European Union and Norway by support scheme, 2015 . . . . . . . . . . . . . . . . . 30
Figure 16. Private investment in renewable energy by investment source, 2013-2016 . . . . . . . . . . . . . .31
Figure 17. Public investment in renewable energy by investment source, 2013-2016 . . . . . . . . . . . . . 32
Figure 18. Annual renewable energy investment by state-owned enterprises, 2013-2016 . . . . . . . 33
Figure 19. Public and private investment in renewable energy by region of origin, 2013-2016 . . . . . . 34
Figure 20. Public and private investment in renewable energy by region of destination, 2013-2016 . 35
Figure 21. Domestic and international investment in renewable energy by source, 2013-2016 . . . . 35
Figure 22. Public and private investment in renewable energy by technology, 2013-2016 . . . . . . . . . 36
Figure 23. DFI preferred financing instrument by share of total finance deployed, 2013-2016 . . . . . . . . . 37
Figure 24. Policies, tools and instruments that reduce renewable energy barriers and mitigate
risks . . . . . . . . . . . . . . . . . . . . . . . . . . . . . . . . . . . 38
FIGURES, TABLES AND BOXES
TABLES
Table 1 Average difference between date of financing and commissioning for renewable energy projects . . . . . . . . . . . . . . . . . . . . . . . . . . . . . . . . .19
Table 2 Regional grouping used for the analysis in this report . . . . . . . . . . . . . . . . . . . . . . . . . . . . . . . . . . 40
BOXES
Box 1 Renewable energy finance and electricity access . . . . . . . . . . . . . . . . . . . . . . . . . . . . . . . . . 26
Box 2 Policies in support of renewable energy: status and trends . . . . . . . . . . . . . . . . . . . . . . . . . . . . . . 29
Box 3 The role of state-owned enterprises in mobilising renewable energy finance . . . . . . 33
Box 4 Unlocking renewable energy investment . . . 38

7
FI G U R E S , TAB LE S AN D BOXE S - AB B R E VIATI O NS
BNEF Bloomberg New Energy Finance
CPI Climate Policy Initiative
CSP Concentrated solar power
DFI Development finance institution
EUR Euro
GBP British pound sterling
GW Gigawatts
IEA International Energy Agency
IRENA International Renewable Energy Agency
kWh Kilowatt-hour
MWh Megawatt-hour
OECD Organisation for Economic Co-operation and Development
PV Photovoltaic
REC Renewable energy certificate
UK United Kingdom
US United States
USD United States dollar
ABBREVIATIONS

20162013
Public
Private
8
G LO BAL L AN DSC APE O F RENEWABLE ENERGY FINANCE
KEYFINDINGS
• Renewable energy capacity has grown at record-high levels, even as investment has dipped in dollar terms in 2016. Investment levels are highly responsive to policy changes.
• Offshore wind investment has risen steadily – quadrupling in 2013-2016 – and is poised for further growth.
• Private sources provide the bulk of renewable energy investment globally – over 90% in 2016.
• But public finance can play a key enabling role – covering early-stage project risk and getting new markets to maturity. Public spending on policy implementation far outweighs direct public investments.
• Project developers account for about two-fifths of private investment in the sector. Institutional investors – pension funds, insurance companies, sovereign wealth funds and others – only make up less than 5% of new investments.
• Private investors overwhelmingly favour domestic renewable energy projects (93% of the private portfolio in 2013-2015), whereas public investment is more balanced between in-country and international financing.

9
K E Y F I N DI N G S

1 0
G LO BAL L AN DSC APE O F RENEWABLE ENERGY FINANCE
E XEC U TIVE SU M MARY
1 1
EXECUTIVE SUMMARY
The landscape of renewable energy finance has evolved rapidly. Since 2012, renewable power capacity installations have exceeded non-renewables by a rising margin, representing about 60% of all new power-generating capacity added worldwide in 2016 (IRENA, 2017a). Investment reached a comparable milestone in 2015, when renewable power technologies for the first time attracted more finance than non-renewable power technologies (Buchner et al., 2017), a trend that has continued subsequently.
This report analyses the renewable energy finance landscape. It outlines key trends globally in 2013-2016, regionally and by technology, examines the differing roles and approaches of private and public finance, highlights the important role of risk mitigation instruments, and provides an outlook for renewable energy finance in 2018 and beyond.
EMERGING TRENDS
Global overview
• Global annual investment in renewable energy rose steadily in 2013-2015, peaking at USD 330 billion in 2015 before falling to USD 263 billion in 2016.
• While annual investment declined in 2016, capacity additions in the same year were up from 2015. This is partially due to declining costs and partially to the time lag between financial closure (i.e., the time of investment) and the completion of construction, after which an installation becomes operational.
• Cost declines for key technologies have influenced finance flows. Lower solar and wind power costs, in particular, reduced the total value of renewable energy investment in 2015 and 2016, as each dollar of investment financed more capacity than in previous years.
• Policy changes contributed significantly to global investment trends. The peak in 2015 was partially driven by a rush to complete projects before an expected fall in policy support in key markets. Examples included cuts in feed-in-tariffs in China, Germany, Japan and the UK.
Technology trends
• Investment in solar power (both photovoltaic, or PV, and thermal) and wind power (both onshore and offshore) dominated spending in the sector globally. Investment in these technologies rose from 82% of total renewable energy finance in 2013 to 93% in 2016.
12
G LO BAL L AN DSC APE O F RENEWABLE ENERGY FINANCE
• Offshore wind investment saw an almost fourfold increase in the same period, with its share of total wind investment rising steadily from 10% in 2013 to 25% in 2016. Offshore wind kept growing in absolute terms in 2016 while investment in other technologies declined.
• Investment in biomass-fired power peaked at USD 9 billion in 2014, before trending downwards to USD 5 billion in 2016.
• Investment in geothermal power was stable, averaging USD 2 billion per year over 2013-2016.
• Investment in biofuels averaged USD 1.7 billion per year in 2013-2015, but fell by 84% to USD 250 million in 2016.
• Investment in hydropower fell steadily as fewer large projects were financed. Yet this is not necessarily an ongoing global trend, as 2013-2014 investment levels reflected large hydropower projects in Brazil that may prove to be outliers.
Investment by region
• The East Asia-Pacific region1 was the dominant destination for renewable energy investment, seeing rapid growth from USD 64 billion in 2013 to USD 114 billion in 2015, before a dip to USD 88 billion in 2016. China was the main driver, with investment peaking in 2015 in response to policy support, before incentives were scaled back in 2016. Investment in OECD Asia (consisting of Japan, Israel and the Republic of Korea)2 grew from USD 32 billion in 2013 to USD 37 billion in 2014, then declined sharply in 2016 as Japan reduced solar PV feed-in tariffs.
• Western Europe saw investment peak in 2015 at USD 73 billion before falling to USD 53 billion in 2016. While offshore wind investment in the same
region rose steadily, it was insufficient to offset the 2016 decline in solar PV and onshore wind investment, driven primarily by policy changes in Germany and the UK.
• OECD Americas (Canada, Chile, Mexico and the United States)3 saw investment peak at USD 52 billion in 2015 mainly driven by strength in the US solar PV and wind markets.
• The Latin America-Caribbean region mirrored the global trend, peaking at USD 17 billion in 2015 before falling to USD 9 billion in 2016.
Financial instruments
• Grants and concessional finance accounted for near-negligible shares of total renewable energy finance during the period.
• Utility-scale solar PV and onshore wind were largely financed by a mix of commercial debt and equity, with average debt-to-equity ratios hovering between 60% and 70% globally.
• Although most development finance institutions (DFIs) favoured loans, USD 793 million worth of risk mitigation instruments in Asia and USD 552 million in Africa were extended, primarily to assist in establishing renewables in countries with a limited track record for such projects.
CONTRASTING PUBLIC AND PRIVATE INVESTMENT
• Direct public investment4 has typically constituted a small share of total renewable energy finance, fluctuating between 12% and 16% in 2013-2015, and dipping to 8% in 2016. The bulk of renewable energy investment – more than 90% in 2016 – is financed from private sources.
1. See Table 2 in the Annex for a list of countries included in each region.
2. Members of the Organisation for Economic Co-operation and Development (OECD) in Asia.
3. OECD members in North and South America.
4. Excluding expenditures for feed-in tariffs and other policy support measures.
E XEC U TIVE SU M MARY
13
• Western Europe and the Latin America-Caribbean region were the two largest destinations5 for public renewable energy finance. Western Europe accounted for USD 14 billion, or 36% of public finance in the sector, in 2013-2015, while Latin America-Caribbean accounted for USD 9 billion (22%). Public finance for renewables fell in both regions in 2016.
• Public investment did not favour a particular technology; rather it supported a variety of projects, ranging from advisory work on renewable energy infrastructure to investment in community programmes and upgrades to transmission and distribution networks.
• DFIs (national, bilateral and multilateral) have accounted for the majority of public investment, with an annual average of 85% of the total in 2013-2015. This dropped to 73% in 2016.
• Significant public resources are allocated to establish regulatory instruments and fiscal incentives, seen as key mechanisms to support renewable energy. These are not counted as investments and are therefore additional to the figures cited above. In Western Europe, for example, annual expenditures for renewable electricity support policies6 totalled at least USD 66 billion in 2015 (CEER, 2017), while public investment amounted to just over USD 14 billion.
• By the end of 2016, 147 countries had renewable energy support policies in place. While feed-in tariffs/premiums continue to be implemented, falling costs and grid integration issues7 have driven an increase in the use of auction mechanisms.
• While public finance plays a significant enabling role, the bulk of investment comes from private sources. The East Asia-Pacific region had the highest levels of private finance, averaging USD 101 billion annually in 2015-2016, followed by Western Europe, which averaged USD 55 billion during the same timeframe.
• Overall, private renewable energy investment stayed predominantly (93%) within the country of origin; by contrast, public investment saw a much more balanced split of public investment between in-country financing and international financing.
• Investment in solar and wind (onshore and offshore) accounted for, on average, 90% of total private finance between 2013 and 2016. This reflects the maturity of solar and wind power technologies.
• Project developers contributed 40% of private finance each year, mostly concentrated in China, Japan, the UK and the US. Commercial financial institutions accounted for 23% of investment of such private finance in 2014-2016, hitting a high of USD 69 billion in 2015.
• The share of investment from corporate actors fell from 27% on average in 2013-2014 to 14% on average in 2015-2016. This was driven largely by a decline in solar PV investments by Japanese corporations, apparently in response to changes in feed-in tariffs.
• Institutional and private equity investors contributed less than 1% each to global renewable energy investment during the period. Their investment peaking in 2015 at around USD 3 billion and USD 2 billion, respectively.
5. The destination of finance is defined as the region or country in which the renewable energy asset is ultimately constructed and the investment is made.
6. Including feed-in tariffs, feed-in premiums and green certificates.
7. That is grid overload and curtailment due to a mismatch of supply and demand, which can arise in the presence of feed-in tariffs; grid integration issues can be overcome through the use of auctions by designing it such that the project location is specified and producers have the incentive to generate electricity during peak hours.
14
G LO BAL L AN DSC APE O F RENEWABLE ENERGY FINANCE
OUTLOOK
Meeting international climate goals calls for unprecedented mobilisation of finance in the renewable energy sector. The rise in global mean temperature can be limited to well below 2°C – in line with the Paris Agreement – if the share of renewables in primary energy supply rises from about 15% (the 2015 level) to about 65% in 2050, coupled with greatly improved energy efficiency.
• The envisaged energy transformation necessitates total investment of USD 25 trillion in renewables in the period until 2050, implying approximately a tripling of the current annual investments (IRENA, 2017b).
• Private finance will continue to account for the bulk of this investment, and, to achieve this, institutional investors must be drawn into the renewable energy sector at scale, while divesting from fossil-fuel installations that risk becoming stranded assets.
• Public finance sources – in particular concessional finance, grants to create enabling conditions, guarantees, and other risk mitigation instruments – must all be scaled up. They must also be used in a more targeted manner to spur new investment, especially in emerging economies that are currently lagging behind.
Along with accelerated investment, falling technology costs will help to boost the world’s uptake of renewables.
• Solar PV and onshore wind costs should fall further in 2018 and beyond. Both technologies are already crucial in the renewable mix and could be further bolstered by fast-improving battery storage.
• Offshore wind – the only technology to grow continuously through 2016 – looks likely to continue in the same direction, given the falling costs at recent offshore wind power auctions.
• Concentrated solar power (CSP) may also see a major boost, given recent cost declines for this technology and its potential to provide energy storage independently of battery development.
What happens next will depend largely on China, the US, India and other key markets for renewables. Rising markets, such as Argentina, Indonesia, the Republic of Korea and Viet Nam, also offer significant growth potential. In other developing economies, exponential increases in domestic finance could boost future renewable energy investment.
THE GLOBAL LANDSCAPE ILLUSTRATED
The finance and investment landscape for renewables is depicted in the Sankey diagram that follows. The diagram shows global renewable energy finance flows along the investment life cycle in 2015 and 2016, taking into consideration the full range of sources, instruments, regions and technologies, as well as distinctions between public and private finance sources.
Values are averages of the data from the two years, in USD billion.

15
E XEC U TIVE SU M MARY
GLOBAL LANDSCAPE OF RENEWABLE ENERGY FINANCE 2015/2016
Wind
Public sources
20.3
Private Financial Intermediaries
Private sources
Grant
Unknown
Concessional debt
Equity
Debt
Public
Public-Private
Unknown
Private
No region mapping
Transregional
Latin America and the Caribbean
Central Asia and Eastern Europe
South Asia
MENA (4.0)Sub-Saharan (4.6)
Western Europe
East Asia and Pacific
Hydropower
Marine
Geothermal
Other
Biomass
Biofuels
Solar thermalincl. CSP
O�shore (27.4)
Onshore (92.2)
Solar PV
Africa (0.2)America (<0.1)Asia (0.9)Pacific (<0.1)
OECDAsia (25.3)Oceania (3.6)
Americas (52.1)
Public Financial Intermediaries
75.8
195.1
Africa and Middle East
1.0
0.7
5.8
128.1
161.0
10.7
2.0
4.8
279.1
1.4
6.8
13.7
3.2
14.4
Sources and IntermediariesWhat types of investors are the sources of finance?
InstrumentsWhat types of instruments are used?
RecipientsAre recipients of finance public, private, or both?
RegionWhere is finance flowing?
TechnologyWhich technolo-gies are funded?
8.6
60.6
81.0
106.9134.6
119.6
18.3
0.9
6.3
10.5
2.4
<0.1
4.4Climate funds (1.0)Governments (4.4)
Commercial Financial Institutions (62.2)
Institutional investors (2.2)PE, VC, infra. funds (1.4)
State Owned Enterprises (10.0)
5.4
Bilateral (2.7)National (9.0)Multilateral (8.6)
Households (31.0)
Project developers (127.5)
Corporate Actors (36.7)

1 6
G LO BAL L AN DSC APE O F RENEWABLE ENERGY FINANCE

G LO BAL L AN DSC APE O F RENEWABLE ENERGY FINANCE
17
GLOBAL LANDSCAPEOF RENEWABLE ENERGY
FINANCE, 2013-2016
1. OVERVIEW
This dedicated renewable energy investment landscape looks at the key aspects of renewable energy finance, with a focus on technology investment trends and the role of public and private actors in mobilising renewable energy finance. It aims to capture global annual investment8 in renewable energy based on empirical data drawn from a wide range of primary and secondary sources.
Between 2013 and 2016, the landscape of renewable energy investment evolved significantly (see Figure 1). Solar and wind cemented their places as the leading technologies by volume of investment, and investment in offshore wind increased. Falling solar photovoltaic (PV) and wind power costs (IRENA, forthcoming) have resulted in record capacity additions, while investments across hydropower, geothermal, biomass, biofuels and other technologies have made material contributions to total finance.
8. “Investment” is a financial commitment represented by a firm obligation, for example by means of a Board (or equivalent body) decision, backed by the necessary funds, to provide specified financing whether through debt, equity or other financial instruments. More information on the methodology is available in IRENA and CPI (2018).
Figure 1 Renewable energy annual investment by technology type, 2013-2016
0
50
100
150
200
250
300
350
USD
bill
ion
2013 2014 2015 2016
239
289
330
263
Solar PV Onshore wind Offshore wind Solar thermal including CSPOther Hydropower Biomass GeothermalBiofuels Marine
Note: The “other” category encompasses general policy support and assistance (typically channelled through development finance institutions), along with investment in grid infrastructure which specifically benefits renewable energy.

1 8
G LO BAL L AN DSC APE O F RENEWABLE ENERGY FINANCE
Total renewable energy investment, encompassing all technologies and policy support, grew steadily from 2013, peaking in 2015 with commitments of USD 330 billion globally, as developers moved to finalise projects ahead of planned feed-in tariff reductions in China.
1.1 Falling costs and record capacity in 2016
In 2016 total investment in renewable energy fell by around 20% to USD 263 billion. Despite the lower investment, 2016 saw record increases in installed renewable plant capacity as capacity financed in previous years became operational (IRENA, 2017a).
Investment in solar PV and wind (onshore and offshore) totalled some USD 278 billion in 2015, with combined solar PV and wind capacity additions of 113 gigawatts (GW) (IRENA, 2017a). In 2016, total solar PV and wind investment fell by 17% to USD 230 billion, and combined wind and solar PV capacity additions were up 8%, to 122 GW (IRENA, 2017a) (see Figure 2).
This apparent contradiction between lower investments and higher capacity additions is due to falling costs, and to finalised investments which are not reflected in capacity additions in the year in which the project is financed. The time lag between the financing of a project and its completion varies for a number of reasons including geography, technology type and project-specific factors.
As shown in Table 1, solar PV projects are relatively quick to construct and can be built in less than a year after financing is completed. On average, solar PV construction times are shortest in Europe and Asia. Onshore wind construction times are also comparatively short, again averaging less than one year. Onshore wind projects are typically built fastest in Europe and North America. By contrast, construction of offshore wind projects averages close to two years after financing is agreed, so a project financed in 2015 may not become operational until 2017 or beyond (BNEF, 2017).
Figure 2 Solar PV and wind power annual investment and capacity additions, 2013-2016
0
20
40
60
80
100
120
140
2013 2014 2015 2016 2013 2014 2015 2016
178
232
278
229
71
83
113
122
Annual investment Annual capacity additions
USD
bill
ion
GW
of c
ap
ac
ity a
dd
ed
an
nu
ally
0
50
100
150
200
250
300
Solar PV Onshore wind Offshore wind
Based on: IRENA, 2017a
G LO BAL L AN DSC APE O F RENEWABLE ENERGY FINANCE
19
Figure 3 Breakdown of declining investment in solar and wind power between 2015 and 2016
2015
sola
r and
wind inve
stment
Reductio
n in
wind inve
stment
Reductio
n in
sola
r inve
stment
Reduced
wind cost
Reduced
sola
r cost
2016
sola
r and
wind inve
stment
0
50
100
150
200
250
350
300 297 -15-13
-17-13
239
USD
bill
ion
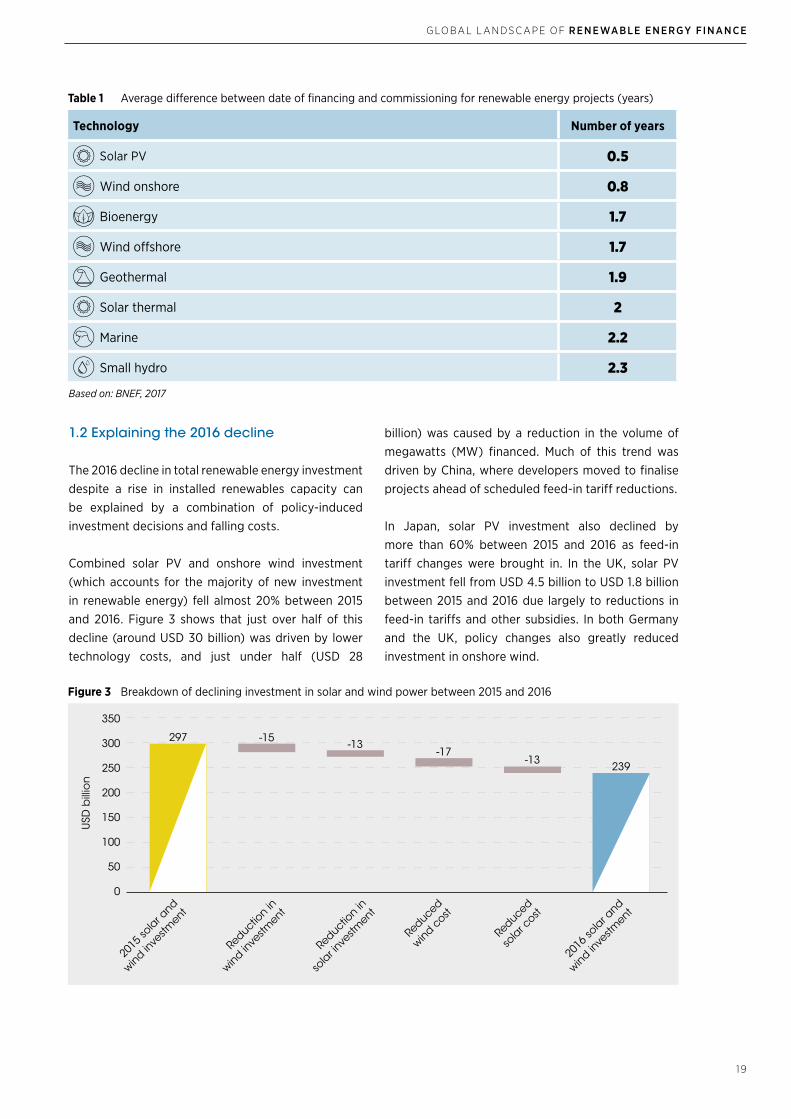
Table 1 Average difference between date of financing and commissioning for renewable energy projects (years)
Technology Number of years
Solar PV 0.5
Wind onshore 0.8
Bioenergy 1.7
Wind offshore 1.7
Geothermal 1.9
Solar thermal 2
Marine 2.2
Small hydro 2.3
Based on: BNEF, 2017
1.2 Explaining the 2016 decline
The 2016 decline in total renewable energy investment despite a rise in installed renewables capacity can be explained by a combination of policy-induced investment decisions and falling costs.
Combined solar PV and onshore wind investment (which accounts for the majority of new investment in renewable energy) fell almost 20% between 2015 and 2016. Figure 3 shows that just over half of this decline (around USD 30 billion) was driven by lower technology costs, and just under half (USD 28
billion) was caused by a reduction in the volume of megawatts (MW) financed. Much of this trend was driven by China, where developers moved to finalise projects ahead of scheduled feed-in tariff reductions.
In Japan, solar PV investment also declined by more than 60% between 2015 and 2016 as feed-in tariff changes were brought in. In the UK, solar PV investment fell from USD 4.5 billion to USD 1.8 billion between 2015 and 2016 due largely to reductions in feed-in tariffs and other subsidies. In both Germany and the UK, policy changes also greatly reduced investment in onshore wind.
20
G LO BAL L AN DSC APE O F RENEWABLE ENERGY FINANCE
2. INVESTMENT BY TECHNOLOGY
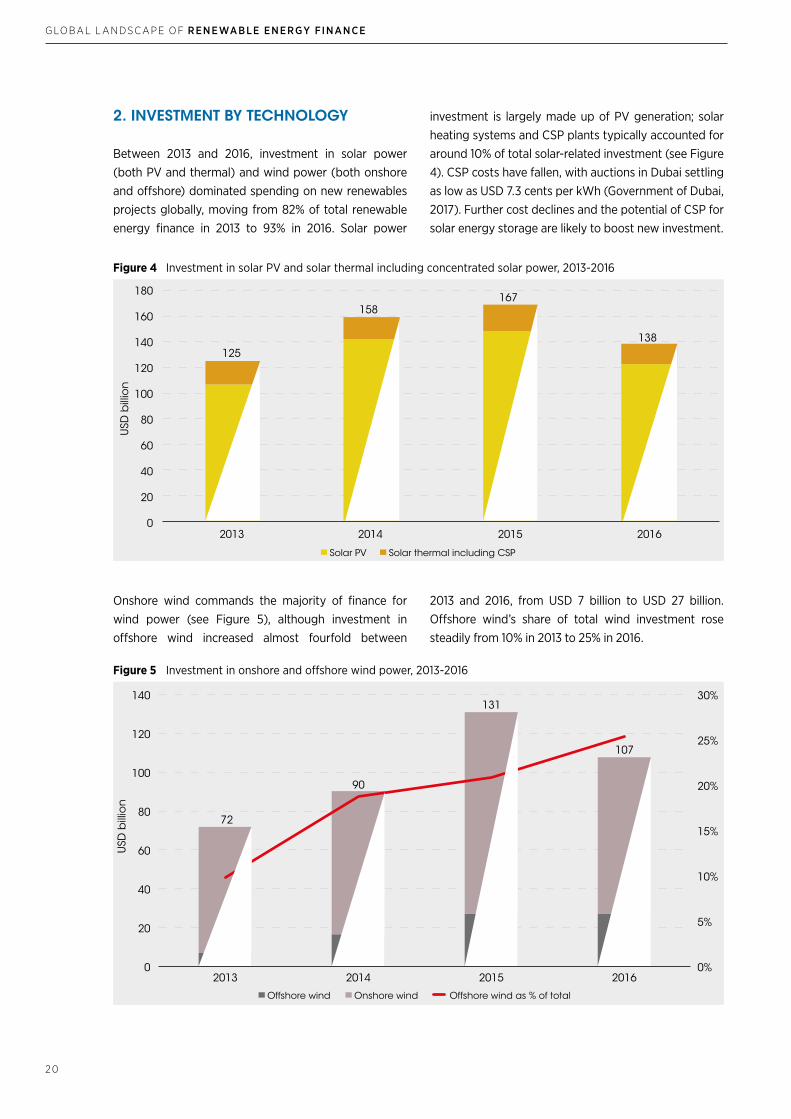
Between 2013 and 2016, investment in solar power (both PV and thermal) and wind power (both onshore and offshore) dominated spending on new renewables projects globally, moving from 82% of total renewable energy finance in 2013 to 93% in 2016. Solar power
investment is largely made up of PV generation; solar heating systems and CSP plants typically accounted for around 10% of total solar-related investment (see Figure 4). CSP costs have fallen, with auctions in Dubai settling as low as USD 7.3 cents per kWh (Government of Dubai, 2017). Further cost declines and the potential of CSP for solar energy storage are likely to boost new investment.
Onshore wind commands the majority of finance for wind power (see Figure 5), although investment in offshore wind increased almost fourfold between
Figure 4 Investment in solar PV and solar thermal including concentrated solar power, 2013-2016
Figure 5 Investment in onshore and offshore wind power, 2013-2016
0
20
40
60
80
100
120
140
160
180
2013 2014 2015 2016
125
158167
138
Solar PV Solar thermal including CSP
USD
bill
ion
0%
5%
10%
15%
20%
25%
30%
0
20
40
60
80
100
120
140
2013 2014 2015 2016
72
90
131
107
Onshore wind Offshore wind as % of totalOffshore wind
USD
bill
ion
2013 and 2016, from USD 7 billion to USD 27 billion. Offshore wind’s share of total wind investment rose steadily from 10% in 2013 to 25% in 2016.
G LO BAL L AN DSC APE O F RENEWABLE ENERGY FINANCE
2 1
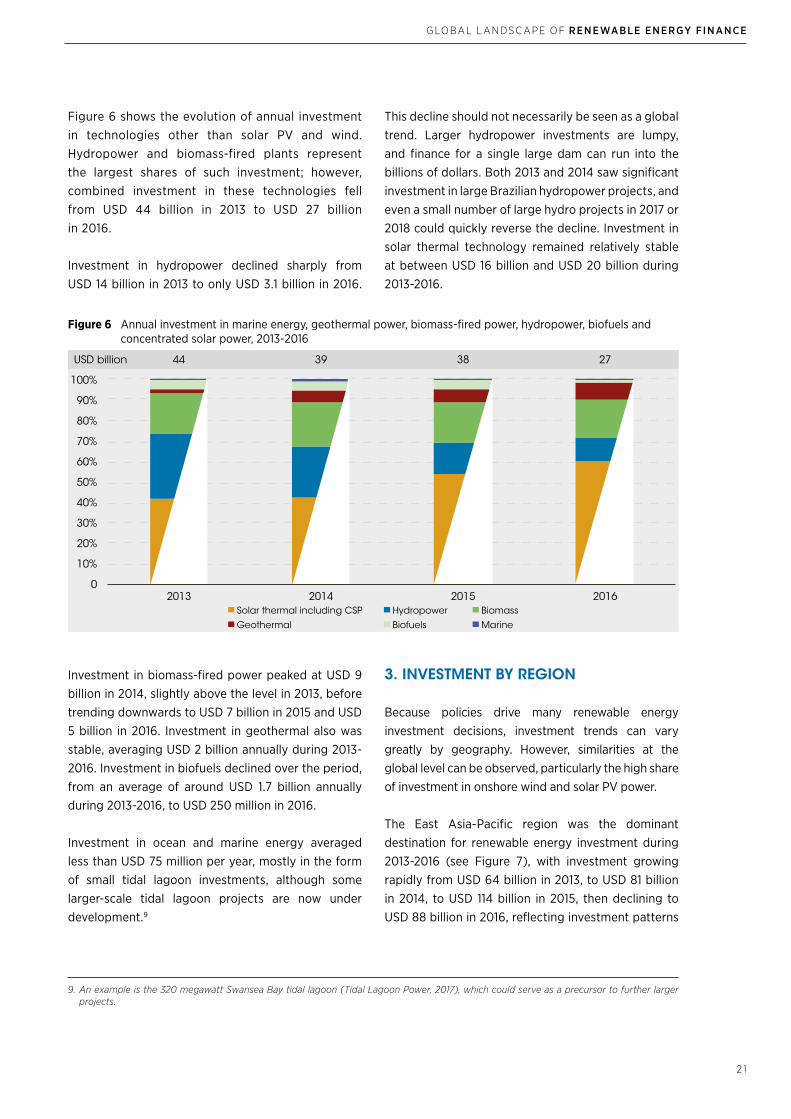
Figure 6 shows the evolution of annual investment in technologies other than solar PV and wind. Hydropower and biomass-fired plants represent the largest shares of such investment; however, combined investment in these technologies fell from USD 44 billion in 2013 to USD 27 billion in 2016.
Investment in hydropower declined sharply from USD 14 billion in 2013 to only USD 3.1 billion in 2016.
This decline should not necessarily be seen as a global trend. Larger hydropower investments are lumpy, and finance for a single large dam can run into the billions of dollars. Both 2013 and 2014 saw significant investment in large Brazilian hydropower projects, and even a small number of large hydro projects in 2017 or 2018 could quickly reverse the decline. Investment in solar thermal technology remained relatively stable at between USD 16 billion and USD 20 billion during 2013-2016.
Figure 6 Annual investment in marine energy, geothermal power, biomass-fired power, hydropower, biofuels and concentrated solar power, 2013-2016
Solar thermal including CSP Hydropower Biomass
Geothermal Biofuels Marine
0
10%
20%
30%
40%
50%
60%
70%
80%
90%
100%
USD billion
2013 2014 2015 2016
44 39 38 27
Investment in biomass-fired power peaked at USD 9 billion in 2014, slightly above the level in 2013, before trending downwards to USD 7 billion in 2015 and USD 5 billion in 2016. Investment in geothermal also was stable, averaging USD 2 billion annually during 2013-2016. Investment in biofuels declined over the period, from an average of around USD 1.7 billion annually during 2013-2016, to USD 250 million in 2016.
Investment in ocean and marine energy averaged less than USD 75 million per year, mostly in the form of small tidal lagoon investments, although some larger-scale tidal lagoon projects are now under development.9
3. INVESTMENT BY REGION
Because policies drive many renewable energy investment decisions, investment trends can vary greatly by geography. However, similarities at the global level can be observed, particularly the high share of investment in onshore wind and solar PV power.
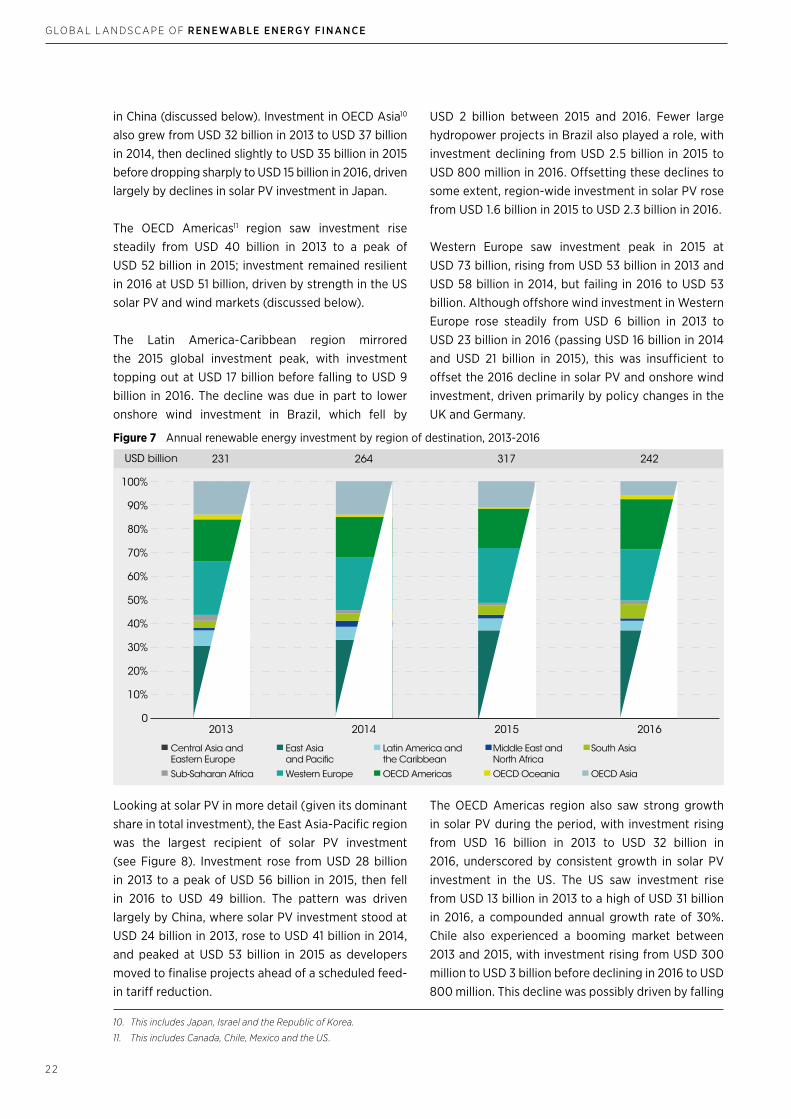
The East Asia-Pacific region was the dominant destination for renewable energy investment during 2013-2016 (see Figure 7), with investment growing rapidly from USD 64 billion in 2013, to USD 81 billion in 2014, to USD 114 billion in 2015, then declining to USD 88 billion in 2016, reflecting investment patterns
9. An example is the 320 megawatt Swansea Bay tidal lagoon (Tidal Lagoon Power, 2017), which could serve as a precursor to further larger projects.
2 2
G LO BAL L AN DSC APE O F RENEWABLE ENERGY FINANCE
in China (discussed below). Investment in OECD Asia10 also grew from USD 32 billion in 2013 to USD 37 billion in 2014, then declined slightly to USD 35 billion in 2015 before dropping sharply to USD 15 billion in 2016, driven largely by declines in solar PV investment in Japan.
The OECD Americas11 region saw investment rise steadily from USD 40 billion in 2013 to a peak of USD 52 billion in 2015; investment remained resilient in 2016 at USD 51 billion, driven by strength in the US solar PV and wind markets (discussed below).
The Latin America-Caribbean region mirrored the 2015 global investment peak, with investment topping out at USD 17 billion before falling to USD 9 billion in 2016. The decline was due in part to lower onshore wind investment in Brazil, which fell by
USD 2 billion between 2015 and 2016. Fewer large hydropower projects in Brazil also played a role, with investment declining from USD 2.5 billion in 2015 to USD 800 million in 2016. Offsetting these declines to some extent, region-wide investment in solar PV rose from USD 1.6 billion in 2015 to USD 2.3 billion in 2016.
Western Europe saw investment peak in 2015 at USD 73 billion, rising from USD 53 billion in 2013 and USD 58 billion in 2014, but failing in 2016 to USD 53 billion. Although offshore wind investment in Western Europe rose steadily from USD 6 billion in 2013 to USD 23 billion in 2016 (passing USD 16 billion in 2014 and USD 21 billion in 2015), this was insufficient to offset the 2016 decline in solar PV and onshore wind investment, driven primarily by policy changes in the UK and Germany.
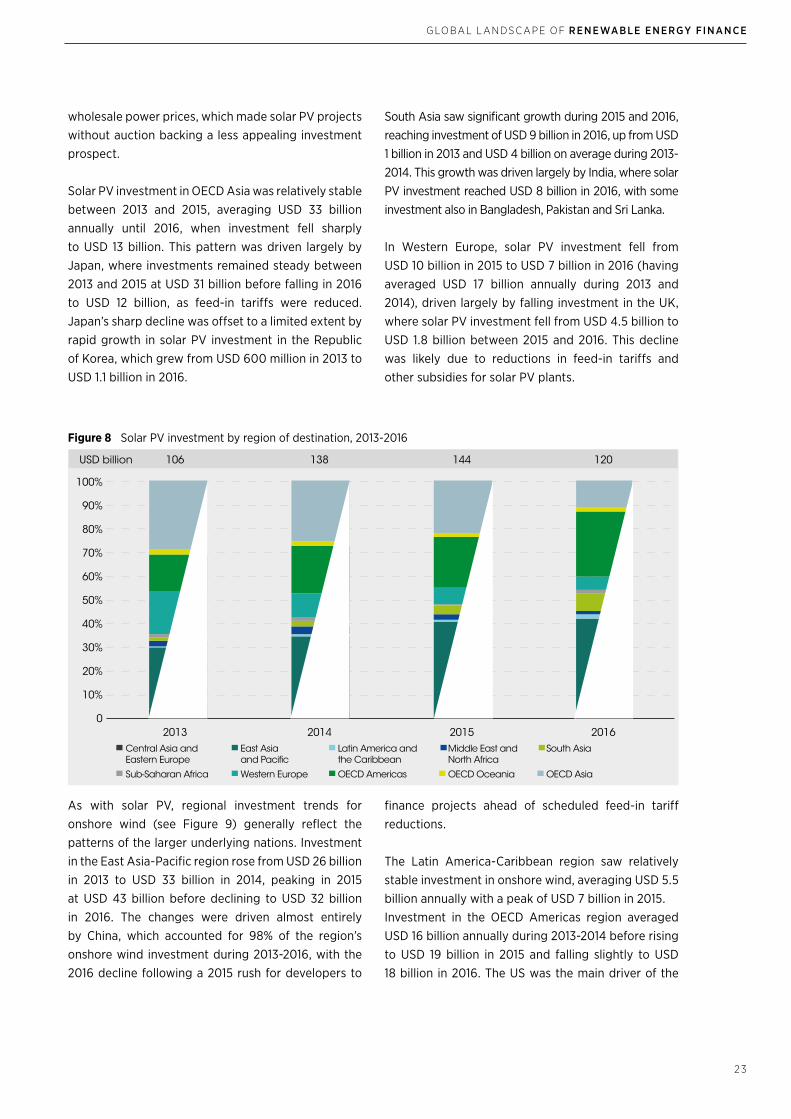
Looking at solar PV in more detail (given its dominant share in total investment), the East Asia-Pacific region was the largest recipient of solar PV investment (see Figure 8). Investment rose from USD 28 billion in 2013 to a peak of USD 56 billion in 2015, then fell in 2016 to USD 49 billion. The pattern was driven largely by China, where solar PV investment stood at USD 24 billion in 2013, rose to USD 41 billion in 2014, and peaked at USD 53 billion in 2015 as developers moved to finalise projects ahead of a scheduled feed-in tariff reduction.
Figure 7 Annual renewable energy investment by region of destination, 2013-2016
2013 2014 2015 2016
231 264 317 242
Central Asia andEastern Europe
East Asiaand Pacific
Latin America andthe Caribbean
Middle East andNorth Africa
Sub-Saharan Africa Western Europe OECD Americas OECD Oceania OECD Asia
South Asia
0
10%
20%
30%
40%
50%
60%
70%
80%
90%
100%
USD billion
The OECD Americas region also saw strong growth in solar PV during the period, with investment rising from USD 16 billion in 2013 to USD 32 billion in 2016, underscored by consistent growth in solar PV investment in the US. The US saw investment rise from USD 13 billion in 2013 to a high of USD 31 billion in 2016, a compounded annual growth rate of 30%. Chile also experienced a booming market between 2013 and 2015, with investment rising from USD 300 million to USD 3 billion before declining in 2016 to USD 800 million. This decline was possibly driven by falling
10. This includes Japan, Israel and the Republic of Korea.
11. This includes Canada, Chile, Mexico and the US.
G LO BAL L AN DSC APE O F RENEWABLE ENERGY FINANCE
2 3
Figure 8 Solar PV investment by region of destination, 2013-2016
2013 2014 2015 2016Central Asia andEastern Europe
East Asiaand Pacific
Latin America andthe Caribbean
Middle East andNorth Africa
Sub-Saharan Africa Western Europe OECD Americas OECD Oceania OECD Asia
South Asia
0
10%
20%
30%
40%
50%
60%
70%
80%
90%
100%
106 138 144 120USD billion
As with solar PV, regional investment trends for onshore wind (see Figure 9) generally reflect the patterns of the larger underlying nations. Investment in the East Asia-Pacific region rose from USD 26 billion in 2013 to USD 33 billion in 2014, peaking in 2015 at USD 43 billion before declining to USD 32 billion in 2016. The changes were driven almost entirely by China, which accounted for 98% of the region’s onshore wind investment during 2013-2016, with the 2016 decline following a 2015 rush for developers to
wholesale power prices, which made solar PV projects without auction backing a less appealing investment prospect.
Solar PV investment in OECD Asia was relatively stable between 2013 and 2015, averaging USD 33 billion annually until 2016, when investment fell sharply to USD 13 billion. This pattern was driven largely by Japan, where investments remained steady between 2013 and 2015 at USD 31 billion before falling in 2016 to USD 12 billion, as feed-in tariffs were reduced. Japan’s sharp decline was offset to a limited extent by rapid growth in solar PV investment in the Republic of Korea, which grew from USD 600 million in 2013 to USD 1.1 billion in 2016.
South Asia saw significant growth during 2015 and 2016, reaching investment of USD 9 billion in 2016, up from USD 1 billion in 2013 and USD 4 billion on average during 2013-2014. This growth was driven largely by India, where solar PV investment reached USD 8 billion in 2016, with some investment also in Bangladesh, Pakistan and Sri Lanka.
In Western Europe, solar PV investment fell from USD 10 billion in 2015 to USD 7 billion in 2016 (having averaged USD 17 billion annually during 2013 and 2014), driven largely by falling investment in the UK, where solar PV investment fell from USD 4.5 billion to USD 1.8 billion between 2015 and 2016. This decline was likely due to reductions in feed-in tariffs and other subsidies for solar PV plants.
finance projects ahead of scheduled feed-in tariff reductions.
The Latin America-Caribbean region saw relatively stable investment in onshore wind, averaging USD 5.5 billion annually with a peak of USD 7 billion in 2015.Investment in the OECD Americas region averaged USD 16 billion annually during 2013-2014 before rising to USD 19 billion in 2015 and falling slightly to USD 18 billion in 2016. The US was the main driver of the

24
G LO BAL L AN DSC APE O F RENEWABLE ENERGY FINANCE
movement, with onshore wind investment growing from USD 8 billion in 2014 to USD 16 billion in 2016. The small decrease in total regional investment in 2016 is explained by reductions in onshore wind investment in Canada, Chile and Mexico.
Western Europe saw investment in onshore wind rise steadily between 2013 and 2015 as policy support took effect. Investment of USD 9 billion in 2013 surged to USD 15 billion in 2014 and a peak of USD 26 billion in 2015, before falling to USD 17 billion
In contrast with solar PV and onshore wind, relatively few countries have pursued offshore wind programmes at a large scale (see Figure 10).12 The UK provides guaranteed power prices through its contract-for-difference scheme (Carbon Brief, 2017), in which developers bid to offer the lowest price per megawatt-hour generated, similar to schemes operated in Belgium,
in 2016. The 2015-2016 decline was likely driven by policy changes in Germany and the UK. German onshore wind investment fell sharply from USD 9 billion in 2015 to USD 4 billion in 2016, probably the result of government moves to slow the expansion of onshore wind in areas suffering from grid congestion by moving to an auction-based system. Onshore wind investment in the UK fell from USD 5.6 billion in 2015 to USD 3 billion in 2016 as certain subsidies were reduced and others were closed to new entrants (Ofgem, 2016).
Figure 9 Onshore wind investment by region of destination, 2013-2016
2013 2014 2015 2016Central Asia andEastern Europe
East Asiaand Pacific
Latin America andthe Caribbean
Middle East andNorth Africa
Sub-Saharan Africa Western Europe OECD Americas OECD Oceania OECD Asia
South Asia
0
10%
20%
30%
40%
50%
60%
70%
80%
90%
100%
65 73 104 80USD billion
Germany and the Netherlands. Partly as a result, the UK saw investment in offshore wind grow from USD 2.5 billion in 2013 to USD 15 billion in 2016, with a high of USD 18 billion in 2015. China, which has used feed-in tariffs to drive offshore wind (GWEC, 2015), is the second-place destination for this investment, averaging USD 5 billion during 2015-2016.
12. For this reason, regional differences are not presented.

G LO BAL L AN DSC APE O F RENEWABLE ENERGY FINANCE
2 5
Figure 10 Top five offshore wind investment destinations, 2013-2016
2013 2014 2015 2016
7
17
26 26
United Kingdom Germany China Netherlands Belgium
0
5
10
15
20
25
30
USD
bill
ion
4. INVESTMENT BY FINANCIAL INSTRUMENT
Renewable energy can be financed using a variety of instruments, from grants to concessional debt and equity to purely commercial debt and equity. Typically, more mature markets and technologies are financed with private finance on commercial terms, whereas grants and concessional finance are often used to stimulate investment in previously untested countries.
Although grants and concessional finance both play a role in stimulating renewable energy investment, they account for near-negligible shares of total finance. Grants averaged around 0.5% of total renewable energy finance annually during 2013-2016, while low-cost debt and concessional equity averaged 4%
over the period, and only 1.5% in 2016. Brazil, India and Indonesia saw significant levels of concessional finance for renewables, although data limitations prevent the breakdown of finance volumes by country.
Concessional finance was often provided for projects aimed at strengthening transmission and distribution networks, which in some areas can be harder to finance through purely commercial capital, whereas grant financing favoured hydropower and solar financing, particularly off-grid solar PV for electricity access in low-income rural areas (see Box 1). Data limitations potentially play a role in understating the level of grants and concessional finance; however, conventional debt and equity are likely the most prominent financing instruments because of the private sector’s dominance of renewable energy financing.
Photo Credit: VoyagerixShutterstock.com

26
G LO BAL L AN DSC APE O F RENEWABLE ENERGY FINANCE
The report Understanding the Landscape: Tracking Finance for Electricity and Clean Cooking Access in High-Impact Countries (SEforALL, 2017) looked at investments in energy and clean cooking across 20 developing countries whose populations suffered from the highest deficits in energy access.
The report found that over the period 2013-2014, investment in renewable energy across the 20 countries averaged more than USD 10 billion per year, with most finance providing electricity access of “Tier 3” or above. The tiering system (Bhatia and Angelou, 2015) is a way of estimating the quality of electricity access delivered, with “Tier 1” access offering electricity for a few hours a day, and “Tier 5” access reflecting reliable, consistently available electricity capable of powering multiple appliances. The report also noted that investment in decentralised electricity generation, required to bring electricity to rural populations, totalled only USD 100 million annually. It is estimated that decentralised electricity will play a central role in providing electricity to remote populations, and renewable energy can be well suited to this task (IEA and World Bank, 2017).
The investment in renewable energy of more than USD 10 billion annually during 2013-2014 is more than double the investment in fossil fuel power of around USD 4 billion per year. In India, for example, four times more finance was committed to renewable energy generation than coal-fired power during this period. Data tracking is imperfect, however, and can understate the true extent of fossil fuel financing. For example, during 2013-2014 India brought into operation 17 GW of coal-fired power (reflecting investment in prior years), roughly five times the capacity of renewable energy plants commissioned in the same period.
Overall, a shift from investment in fossil fuelled-power to renewable energy generation may already be taking place in the developing world. This requires further research to verify.
Box 1 Renewable energy finance and electricity access
Utility-scale assets account for the majority of renewable energy finance globally, and utility-scale solar (IFC, 2015) and wind (WEC, 2016) projects typically are financed with a mixture of equity and non-recourse debt.13 This is also true for most established asset classes of scale, such as biomass power, geothermal power and hydropower. Solar water heaters often are financed with all-equity, while the financing of rooftop solar PV varies by project.
13. “Non-recourse debt” is debt secured on the renewable energy asset; in the event of default the lender has no recourse to attempt to recover amounts beyond the special purpose vehicle which owns the renewable energy asset.
14. See Mazzucato and Semieniuk (2017) for an analysis of the position in China.
15. The high number of projects also produces a larger sample size of projects with disclosed debt-to-equity ratios.
16. In order to present an estimate of the level of debt deployed on projects where debt is used, projects financed solely through equity are excluded from these averages.
Exact debt-to-equity ratios are not disclosed for most transactions. In the absence of data, many databases assume that projects are equity-financed using the developing party’s balance sheet,14 which can understate the role of lenders. This makes it difficult to reach firm conclusions about the balance of debt and equity funding for renewable energy as a whole; however, some indicative conclusions are possible. Given the high shares of solar PV and onshore wind in total investment,15 average debt-to-equity ratios across all projects where debt has been used16 are presented in Figure 11.

G LO BAL L AN DSC APE O F RENEWABLE ENERGY FINANCE
27
Average debt-to-equity ratios for solar PV were broadly comparable across countries, ranging between 60% and 70% for most nations in which significant solar investment takes place (see Figure 12). Onshore wind shows a similar pattern, with debt-to-equity ratios concentrated mainly in that same range. The lower debt-to-equity ratio for projects in India is largely reflective of the small number of
Although relatively few offshore wind transactions reported their debt-to-equity ratios, in the UK and China (the two countries with the largest share of
Figure 11 Global average reported debt-to-equity ratios for solar PV and onshore wind, 2015-2016
Figure 12 Average reported debt-to-equity ratios for solar PV and onshore wind by country, 2015-2016
0
10%
20%
30%
40%
50%
60%
70%
80%
100%
90%
Solar PV Onshore wind
69%
77%
0
10%
20%
30%
40%
50%
60%
70%
80%
100%
90%
China India Japan UnitedKingdom
UnitedKingdom
UnitedStates
China India
69%
61%65%
73% 74%
66%
80%
62%
Solar PV Onshore wind
projects with disclosed debt-to-equity ratios. Wind farms in China are commonly financed with an 80% debt-to-equity ratio (Liu et al., 2015), with certain outlier projects reducing the reported average. The slightly lower than average debt-to-equity ratios in the US possibly reflect contributions from tax equity which reduce the wider requirement for debt financing.
offshore wind investment), debt levels were reported at around 80% of the total transaction value.

28
G LO BAL L AN DSC APE O F RENEWABLE ENERGY FINANCE
5. INVESTMENT BY SOURCE
Public and private finance target different results, operate through different sources and instruments, and show different geographic and technology trends. These differences are explored below.
Private sources accounted for around 87% of total renewable energy finance between 2013 and
2016, averaging USD 223 billion annually during 2013-2014 and USD 270 billion annually during 2015-2016, peaking at almost USD 300 billion in 2015 (see Figure 13).
The share of direct public investment17 varied at between 12% and 16% of the total between 2013 and 2015 (averaging USD 40 billion), before dipping to 8% in 2016 (USD 21 billion).
However, significant public resources are allocated every year to the implementation of a wide variety of support policies to promote the deployment of renewable energy, including regulatory instruments and fiscal incentives (see Box 2).
In total, 147 countries had some kind of renewable energy support policies in place at the end of 2016 (REN21, 2017);
Figure 13 Public and private investment in renewable energy finance, 2013-2016
2013 2014 2015 2016Private Public
239 289 330 263USD billion
0
10%
20%
30%
40%
50%
60%
70%
80%
100%
90%
however, consistent data on government expenditures for such policies are publicly available for only 27 Western European countries18 and Japan.19 Based on these data, such incentives have played an important role in promoting renewable energy markets; in the Western European countries considered, for example, about 50% of the total electricity produced from renewables in 2015 was supported by renewable energy support schemes.
17. Excluding expenditures for feed-in tariffs and other policy support measures.
18. Data are available for 26 European Union member states (excluding Bulgaria and Slovakia) and for Norway.
19. IRENA has explored the availability of data on government expenditures for renewable energy support for more than 60 countries, covering a variety of policy instruments including feed-in tariffs, feed-in premiums, auctions, tax credits and green certificates. Research has found that for most countries such information is not publicly available. Furthermore, when data are available, they are often fragmented and not homogeneous among countries.
G LO BAL L AN DSC APE O F RENEWABLE ENERGY FINANCE
2 9
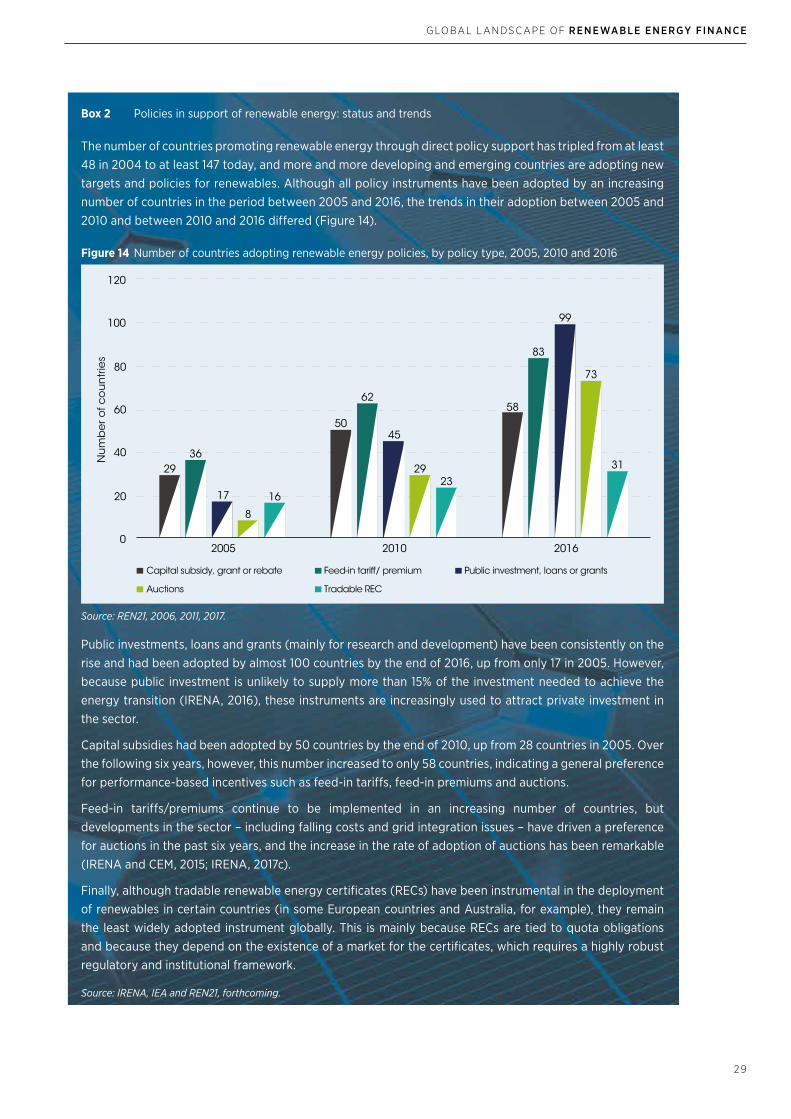
The number of countries promoting renewable energy through direct policy support has tripled from at least 48 in 2004 to at least 147 today, and more and more developing and emerging countries are adopting new targets and policies for renewables. Although all policy instruments have been adopted by an increasing number of countries in the period between 2005 and 2016, the trends in their adoption between 2005 and 2010 and between 2010 and 2016 differed (Figure 14).
Public investments, loans and grants (mainly for research and development) have been consistently on the rise and had been adopted by almost 100 countries by the end of 2016, up from only 17 in 2005. However, because public investment is unlikely to supply more than 15% of the investment needed to achieve the energy transition (IRENA, 2016), these instruments are increasingly used to attract private investment in the sector.
Capital subsidies had been adopted by 50 countries by the end of 2010, up from 28 countries in 2005. Over the following six years, however, this number increased to only 58 countries, indicating a general preference for performance-based incentives such as feed-in tariffs, feed-in premiums and auctions.
Feed-in tariffs/premiums continue to be implemented in an increasing number of countries, but developments in the sector – including falling costs and grid integration issues – have driven a preference for auctions in the past six years, and the increase in the rate of adoption of auctions has been remarkable (IRENA and CEM, 2015; IRENA, 2017c).
Finally, although tradable renewable energy certificates (RECs) have been instrumental in the deployment of renewables in certain countries (in some European countries and Australia, for example), they remain the least widely adopted instrument globally. This is mainly because RECs are tied to quota obligations and because they depend on the existence of a market for the certificates, which requires a highly robust regulatory and institutional framework.
Box 2 Policies in support of renewable energy: status and trends
Figure 14 Number of countries adopting renewable energy policies, by policy type, 2005, 2010 and 2016
0
20
40
60
80
100
120
2005
17
2010 2016
Capital subsidy, grant or rebate Feed-in tariff/ premium Public investment, loans or grants
Auctions Tradable REC
Nu
mb
er o
f co
un
trie
s
2936
83
58
45
2923
62
50
16
8
31
73
99
Source: IRENA, IEA and REN21, forthcoming.
Source: REN21, 2006, 2011, 2017.
3 0
G LO BAL L AN DSC APE O F RENEWABLE ENERGY FINANCE
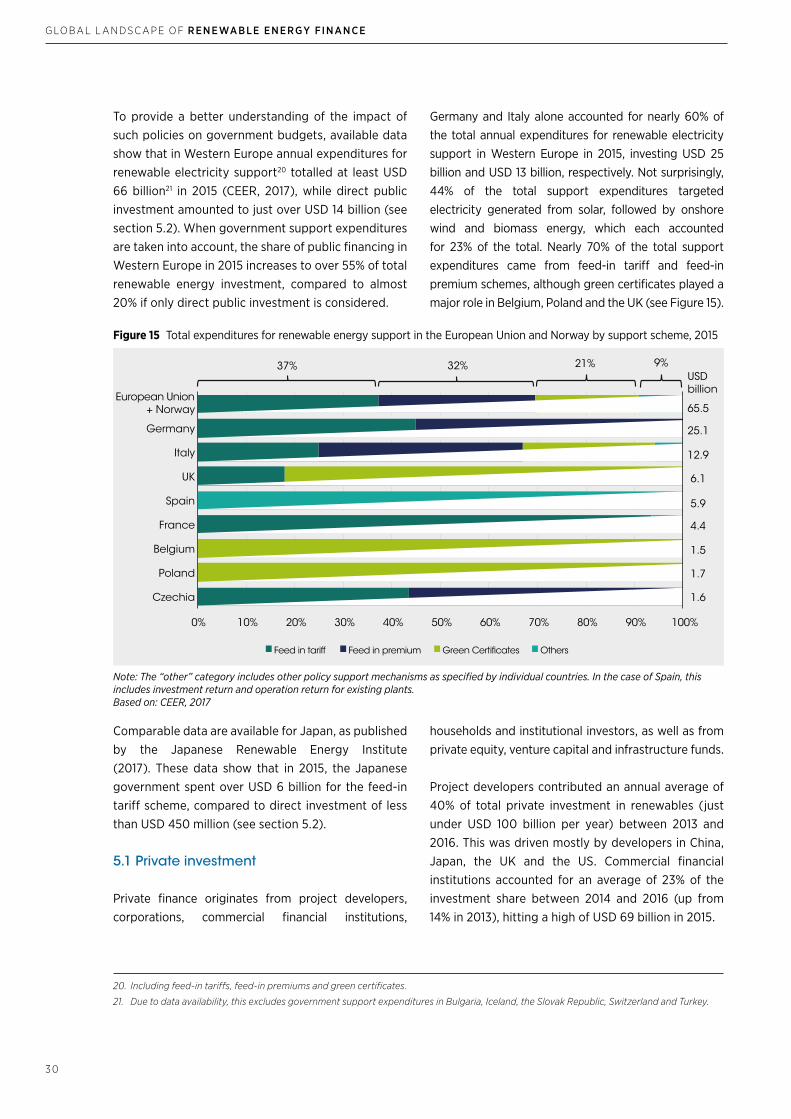
To provide a better understanding of the impact of such policies on government budgets, available data show that in Western Europe annual expenditures for renewable electricity support20 totalled at least USD 66 billion21 in 2015 (CEER, 2017), while direct public investment amounted to just over USD 14 billion (see section 5.2). When government support expenditures are taken into account, the share of public financing in Western Europe in 2015 increases to over 55% of total renewable energy investment, compared to almost 20% if only direct public investment is considered.
Germany and Italy alone accounted for nearly 60% of the total annual expenditures for renewable electricity support in Western Europe in 2015, investing USD 25 billion and USD 13 billion, respectively. Not surprisingly, 44% of the total support expenditures targeted electricity generated from solar, followed by onshore wind and biomass energy, which each accounted for 23% of the total. Nearly 70% of the total support expenditures came from feed-in tariff and feed-in premium schemes, although green certificates played a major role in Belgium, Poland and the UK (see Figure 15).
Comparable data are available for Japan, as published by the Japanese Renewable Energy Institute (2017). These data show that in 2015, the Japanese government spent over USD 6 billion for the feed-in tariff scheme, compared to direct investment of less than USD 450 million (see section 5.2).
5.1 Private investment
Private finance originates from project developers, corporations, commercial financial institutions,
Figure 15 Total expenditures for renewable energy support in the European Union and Norway by support scheme, 2015
0% 10% 20% 30% 40% 50% 60% 70% 80% 90% 100%
Czechia
Poland
Belgium
France
Spain
UK
Italy
Germany
European Union+ Norway
Feed in tariff Feed in premium Green Certificates Others
37% 32% 21% 9%
65.5
USDbillion
25.1
12.9
6.1
5.9
4.4
1.5
1.7
1.6
Note: The “other” category includes other policy support mechanisms as specified by individual countries. In the case of Spain, this includes investment return and operation return for existing plants.Based on: CEER, 2017
20. Including feed-in tariffs, feed-in premiums and green certificates.
21. Due to data availability, this excludes government support expenditures in Bulgaria, Iceland, the Slovak Republic, Switzerland and Turkey.
households and institutional investors, as well as from private equity, venture capital and infrastructure funds.
Project developers contributed an annual average of 40% of total private investment in renewables (just under USD 100 billion per year) between 2013 and 2016. This was driven mostly by developers in China, Japan, the UK and the US. Commercial financial institutions accounted for an average of 23% of the investment share between 2014 and 2016 (up from 14% in 2013), hitting a high of USD 69 billion in 2015.
G LO BAL L AN DSC APE O F RENEWABLE ENERGY FINANCE
3 1
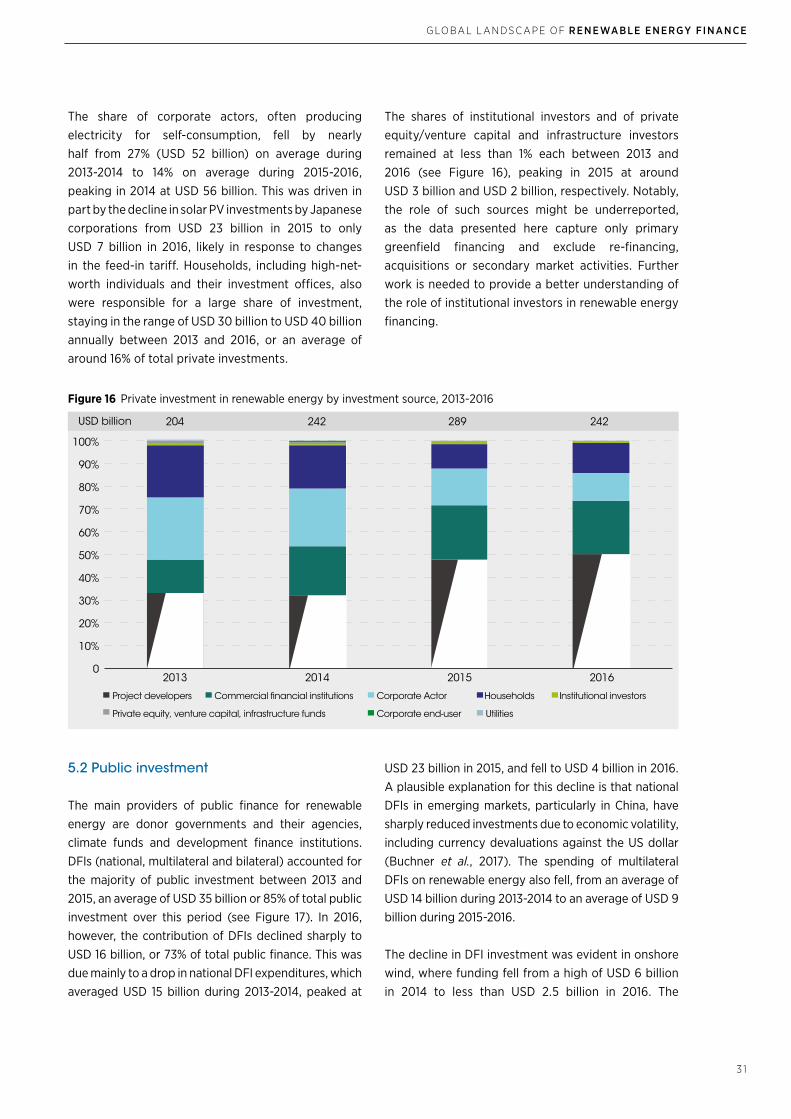
The share of corporate actors, often producing electricity for self-consumption, fell by nearly half from 27% (USD 52 billion) on average during 2013-2014 to 14% on average during 2015-2016, peaking in 2014 at USD 56 billion. This was driven in part by the decline in solar PV investments by Japanese corporations from USD 23 billion in 2015 to only USD 7 billion in 2016, likely in response to changes in the feed-in tariff. Households, including high-net-worth individuals and their investment offices, also were responsible for a large share of investment, staying in the range of USD 30 billion to USD 40 billion annually between 2013 and 2016, or an average of around 16% of total private investments.
The shares of institutional investors and of private equity/venture capital and infrastructure investors remained at less than 1% each between 2013 and 2016 (see Figure 16), peaking in 2015 at around USD 3 billion and USD 2 billion, respectively. Notably, the role of such sources might be underreported, as the data presented here capture only primary greenfield financing and exclude re-financing, acquisitions or secondary market activities. Further work is needed to provide a better understanding of the role of institutional investors in renewable energy financing.
Figure 16 Private investment in renewable energy by investment source, 2013-2016
0
10%
20%
30%
40%
50%
60%
70%
80%
90%
100%
2013 2014 2015 2016
Project developers Commercial financial institutions
Private equity, venture capital, infrastructure funds
Institutional investorsHouseholdsCorporate Actor
UtilitiesCorporate end-user
204 242 289 242USD billion
5.2 Public investment
The main providers of public finance for renewable energy are donor governments and their agencies, climate funds and development finance institutions. DFIs (national, multilateral and bilateral) accounted for the majority of public investment between 2013 and 2015, an average of USD 35 billion or 85% of total public investment over this period (see Figure 17). In 2016, however, the contribution of DFIs declined sharply to USD 16 billion, or 73% of total public finance. This was due mainly to a drop in national DFI expenditures, which averaged USD 15 billion during 2013-2014, peaked at
USD 23 billion in 2015, and fell to USD 4 billion in 2016. A plausible explanation for this decline is that national DFIs in emerging markets, particularly in China, have sharply reduced investments due to economic volatility, including currency devaluations against the US dollar (Buchner et al., 2017). The spending of multilateral DFIs on renewable energy also fell, from an average of USD 14 billion during 2013-2014 to an average of USD 9 billion during 2015-2016.
The decline in DFI investment was evident in onshore wind, where funding fell from a high of USD 6 billion in 2014 to less than USD 2.5 billion in 2016. The

32
G LO BAL L AN DSC APE O F RENEWABLE ENERGY FINANCE
largest reduction came in the “other” category – encompassing advisory work in support of renewable energy infrastructure, investment in community programmes, upgrades to grid infrastructure and mixed renewable technologies – which accounted for 84% of the 2015-2016 decline (USD 17 billion).
Financing by governments and their agencies increased from USD 3 billion in 2013 to around USD 4 billion in both 2015 and 2016, peaking at
USD 7 billion in 2014. Financing by state-owned enterprises averaged 24% (USD 9.3 billion) of public finance in 2013, falling to 14% (USD 7 billion) in 2014 as wider renewable energy investment also increased. In 2015 and 2016 financing by state-owned enterprises averaged 32% of total public finance, falling in absolute terms in 2016 as investment by such enterprises in China declined from 2015. The role of state-owned enterprises is explored further in Box 3.
Figure 17 Public investment in renewable energy by investment source, 2013-2016
0
5
10
15
20
25
30
35
40
45
50
USD
bIll
ion
2013 2014 2015 2016
Public financial institutions - National Public financial institutions - Multilateral Governments
Public financial institutions - Bilateral Climate Fund State-owned enterprises
USD billion 35 47 41 21
Note: Figure includes only enterprises that are more than 50% owned by the state; enterprises with state ownership levels of 50% and below are excluded.
Photo Credit: Ryan JanssensShutterstock.com
G LO BAL L AN DSC APE O F RENEWABLE ENERGY FINANCE
3 3
Research on the role of state-owned enterprises in renewable energy finance is relatively scarce, with these enterprises being presented as both a positive and a negative influence on stimulating investment (OECD, 2017). State-owned enterprises typically enjoy preferential access to credit and other factor inputs compared to their private counterparts (Bureau of Economic and Business Affairs, 2017). In China, the implicit government guarantees lower the borrowing cost for state-owned enterprises by 1-2 percentage points and increase their credit rating by 4-5 investment grades (IMF, 2016).
More than 70% of the global state-owned enterprises analysed in this report (around 180 entities) enjoy a credit rating that is either similar to that of their parent government (42%) or one investment grade lower (30%).22 Strong credit ratings, potentially derived from implicit government guarantees, are likely to drive commercial lending to projects as lenders see projects backed by state-owned enterprises as less likely to default.
China dominates renewable energy spending by state-owned enterprises, accounting for an annual average of almost 80% of global financing from these enterprises between 2013 and 2016, peaking at USD 8.2 billion in 2015. India, too, is noteworthy, accounting for 5% of total financing by state-owned enterprises between 2015 and 2016. This could be a result of the ambitious 175 GW renewable energy target set by the Indian government for 2022 (NITI Aayog, 2015).
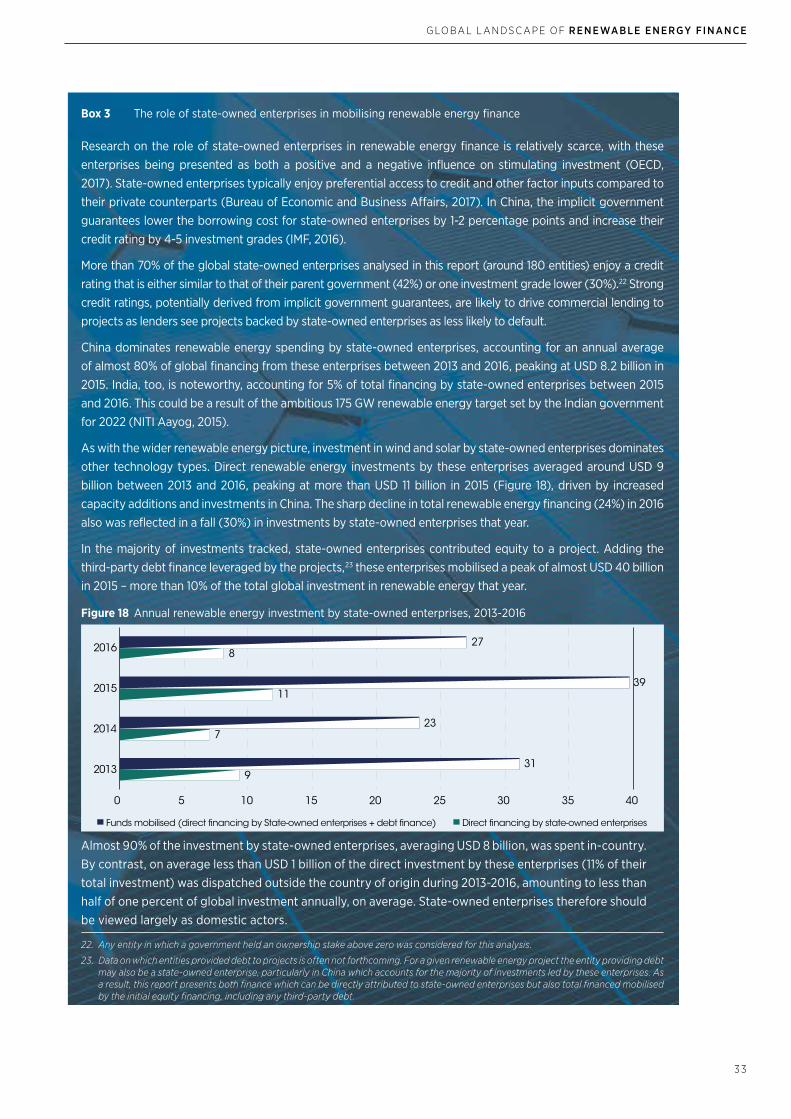
As with the wider renewable energy picture, investment in wind and solar by state-owned enterprises dominates other technology types. Direct renewable energy investments by these enterprises averaged around USD 9 billion between 2013 and 2016, peaking at more than USD 11 billion in 2015 (Figure 18), driven by increased capacity additions and investments in China. The sharp decline in total renewable energy financing (24%) in 2016 also was reflected in a fall (30%) in investments by state-owned enterprises that year.
In the majority of investments tracked, state-owned enterprises contributed equity to a project. Adding the third-party debt finance leveraged by the projects,23 these enterprises mobilised a peak of almost USD 40 billion in 2015 – more than 10% of the total global investment in renewable energy that year.
Almost 90% of the investment by state-owned enterprises, averaging USD 8 billion, was spent in-country. By contrast, on average less than USD 1 billion of the direct investment by these enterprises (11% of their total investment) was dispatched outside the country of origin during 2013-2016, amounting to less than half of one percent of global investment annually, on average. State-owned enterprises therefore should be viewed largely as domestic actors.
Box 3 The role of state-owned enterprises in mobilising renewable energy finance
22. Any entity in which a government held an ownership stake above zero was considered for this analysis.
23. Data on which entities provided debt to projects is often not forthcoming. For a given renewable energy project the entity providing debt may also be a state-owned enterprise, particularly in China which accounts for the majority of investments led by these enterprises. As a result, this report presents both finance which can be directly attributed to state-owned enterprises but also total financed mobilised by the initial equity financing, including any third-party debt.
Figure 18 Annual renewable energy investment by state-owned enterprises, 2013-2016
Funds mobilised (direct financing by State-owned enterprises + debt finance) Direct financing by state-owned enterprises
9
7
11
8
31
23
39
27
0 5 10 15 20 25 30 35 40
2013
2014
2015
2016

3 4
G LO BAL L AN DSC APE O F RENEWABLE ENERGY FINANCE
5.3 Regional investment by source
In 2015, 42% (USD 17 billion) of public finance for renewable energy was sourced from Western Europe,25 a share that fell to 34% (USD 7 billion) in 2016. The Latin America-Caribbean region contributed on average USD 6.9 billion (17% of the total) between 2013 and 2015, but this amount decreased by more than half in 2016 to reach USD 2.6 billion (12% of the total).
Western Europe remained the largest destination26
of public renewable energy finance with around USD 14 billion invested annually during 2013-2015, accounting on average for around 36% of the total. However, this financing fell by more than half in 2016 to USD 6 billion (27%), in line with the overall decline in public finance. The Latin America-Caribbean region accounted on average for around 22% (USD 9 billion) of public investment during 2013-2015, a share that fell to 15% (USD 3 billion) in 2016. The biggest increase has been in the East Asia-Pacific region, where the
25. See Table 2 in the Annex for a full list of countries.
26. The destination of finance is defined as the region or country in which the renewable energy asset is ultimately constructed and the investment is made.
By comparison, 38% of private renewable energy finance (USD 113 billion in 2015 and USD 91 billion in 2016) originated from the East Asia-Pacific region, primarily China (see Figure 19). The other major contributors of private finance were Western Europe with an average USD 56 billion during 2015- 2016 (20% of the total), and the US with an average of USD 48 billion during 2015-2016 (18% of the total).
Figure 19 Public and private investment in renewable energy by region of origin, 2013-2016
0
10%
20%
30%
40%
50%
60%
70%
80%
90%
100%
2013 2014 2015 2016 2013 2014 2015 2016
Public Private
South Asia Middle East andNorth Africa
Latin America andthe Caribbean
East Asiaand Pacific
Central Asia andEastern Europe
OECD AsiaNo region mapping
Transregional
OECD Oceania
OECD Americas Western Europe Sub-Saharan Africa
USD billion 35 47 41 21 204 242 289 242
share of public renewable energy finance increased from below 5% (USD 1.8 billion) on average during 2013-2014 to almost 21% (USD 8.5 billion) in 2015. In 2016, the region’s share fell to 11% of the total, or USD 2.4 billion.
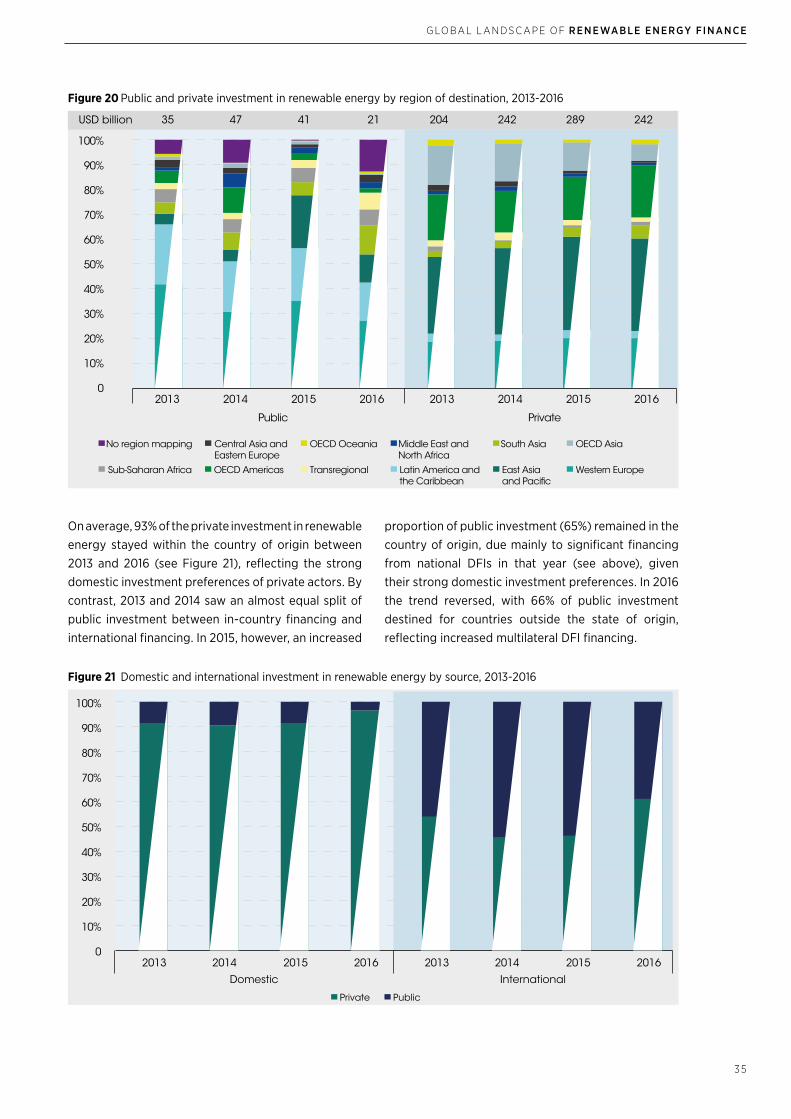
With regard to private investment in renewables, the East Asia-Pacific region was the largest destination (see Figure 20), averaging USD 100 billion (37%) during 2015-2016, followed by Western Europe averaging USD 55 billion annually during this period.
G LO BAL L AN DSC APE O F RENEWABLE ENERGY FINANCE
35
On average, 93% of the private investment in renewable energy stayed within the country of origin between 2013 and 2016 (see Figure 21), reflecting the strong domestic investment preferences of private actors. By contrast, 2013 and 2014 saw an almost equal split of public investment between in-country financing and international financing. In 2015, however, an increased
Figure 20 Public and private investment in renewable energy by region of destination, 2013-2016
2013 2014 2015 2016 2013 2014 2015 2016
Public Private
0
10%
20%
30%
40%
50%
60%
70%
80%
90%
100%
USD billion 35 47 41 21 204 242 289 242
South Asia Middle East andNorth Africa
Latin America andthe Caribbean
East Asiaand Pacific
Central Asia andEastern Europe
OECD AsiaNo region mapping
Transregional
OECD Oceania
OECD Americas Western Europe Sub-Saharan Africa
proportion of public investment (65%) remained in the country of origin, due mainly to significant financing from national DFIs in that year (see above), given their strong domestic investment preferences. In 2016 the trend reversed, with 66% of public investment destined for countries outside the state of origin, reflecting increased multilateral DFI financing.
Figure 21 Domestic and international investment in renewable energy by source, 2013-2016
Private Public
Domestic International
0
10%
20%
30%
40%
50%
60%
70%
80%
90%
100%
2013 2014 2015 2016 2013 2014 2015 2016

3 6
G LO BAL L AN DSC APE O F RENEWABLE ENERGY FINANCE
Because public investment comprises primarily concessional funding and commitments from international development banks, no particular technology is prominent (unlike the dominance of solar and wind power in private investment) (see Figure 22). However, hydropower, solar and wind command around
DFIs play an important role in renewable energy finance, providing capital where the private sector may initially be reluctant to extend finance due to political risk or other factors. IRENA (2016) has explored the role of the public finance institutions and identified a portfolio of measures, instruments and tools that can be used in combination to mobilise private investment at scale (see Box 4).
one-third of the average annual public investment. By contrast, private investment in solar and wind (onshore and offshore) accounted for, on average, 90% of total private finance between 2013 and 2016. This reflects the maturity of many renewable technologies where private capital is the default source of finance.
Figure 22 Public and private investment in renewable energy by technology, 2013-2016
Private Public2013 2014 2015 2016 2013 2014 2015 2016
Onshore windOffshore windSolar thermal including CSPOther
Hydropower Solar PVBiomassGeothermalBiofuelsMarine
0
10%
20%
30%
40%
50%
60%
70%
80%
90%
100%
USD billion 204 242 289 242 35 47 41 21
Note: The “other” category in public finance represents a range of projects including advisory work in support of building renewable energy infrastructure, investment in community programmes, upgrades to grid infrastructure and mixed renewable technologies.
Available data suggest that DFIs generally issue non-concessional loans as their preferred form of capital, averaging almost 85% of total financial instruments by value between 2013 and 2016 (see Figure 23). This is possibly because DFIs may lend to projects that are commercially viable at the project level but that suffer from political or country risk, which discourages purely private capital.
Photo Credit: Kristian ForkelShutterstock.com

G LO BAL L AN DSC APE O F RENEWABLE ENERGY FINANCE
3 7
Figure 23 DFI preferred financing instrument by share of total finance deployed, 2013-2016
2013 2014 2015 20160
10%
20%
30%
40%
50%
60%
70%
80%
90%
100%
BondConcessional loan Credit line EquityGrant Risk MitigationLoan
USD billion 16 23 16 17
Based on: IRENA, 2017d.
Although most DFIs appeared to favour loans, there is evidence of increasing use of risk mitigation instruments in Africa and Asia. During 2013-2016, DFIs deployed USD 793 million27 worth of risk mitigation instruments in Asia, or 42% of all risk mitigation instruments deployed by value over the period. These instruments were targeted mainly at large hydropower (USD 460 million) and onshore wind (USD 102 million), with USD 171 million of instruments also deployed to support geothermal energy in 2015.
DFIs also deployed risk mitigation instruments in Africa, accounting for 30% (USD 552 million) of the total value of such instruments tracked during 2013-2016. In contrast to Asia, these instruments were deployed primarily to support onshore wind (USD 190 million) and CSP projects (USD 155 million during 2013-2016). These instruments likely have played an important role in establishing renewable energy investment in countries that have a limited track record of renewable energy projects.
27. Given data gaps, the true number for both Asia and Africa is likely to be higher.
Photo Credit: HarvepinoShutterstock.com

3 8
G LO BAL L AN DSC APE O F RENEWABLE ENERGY FINANCE
The global energy transition requires a significant increase in renewable energy investment compared to current levels. Although renewable energy technology costs have been falling progressively, underlying market barriers and a perception of high risk still constrain the development and financing of renewable energy projects in many parts of the world.
Since public resources are limited, most of the new investment in renewables must come from the private sector. Hence, scaling up renewable energy investment will depend on the ability of policy makers and public finance institutions to address different investment constraints and crowd in private finance.
IRENA’s report Unlocking Renewable Energy Investment: The Role of Risk Mitigation and Structured Finance (2016) identifies the main risks and barriers to renewable energy investment, and provides policy makers and public finance institutions with a strong portfolio of measures, instruments and tools (see Figure 24) that can be used in combination to mobilise private investment at scale.
Enabling policies and tools create stable and predictable investment environments, help overcome barriers and ensure predictable project revenue streams. While grant funding and project preparation facilities can support the project development process, non-financial interventions such as project initiation and facilitation tools can help improve renewable energy market transparency and liquidity. Debt-based instruments, such as on-lending and co-lending structures, can help local finance institutions overcome key barriers, especially limited access to capital and low experience in lending to renewable energy projects.
Risk mitigation instruments (i.e., guarantees, currency hedging instruments and liquidity reserve facilities) can be used by public finance institutions to effectively mobilise private investment, while at the same time reducing the public capital requirements.
Finally, structured finance mechanisms and tools can be used to make renewable energy projects more accessible to mainstream investors. For example, standardisation of project documents and aggregation are important mechanisms allowing smaller projects to be pooled together. In turn, tools such as green bonds and yieldcos can help open capital market access and attract greater liquidity and long-term finance into the renewable energy sector
The ability to move the energy transition fast enough will ultimately depend on how different actors in developed and developing countries, and in public and private sectors, will redirect action to what is required. IRENA’s report provides case studies and practical recommendations for policy makers and development and climate finance institutions to overcome renewable energy investment constraints and effectively mobilise private capital. In particular, the creation of dedicated risk mitigation financing facilities, tailored to the needs and specificities of renewable energy projects, could significantly accelerate the necessary growth in investment.
Box 4 Unlocking renewable energy investment
Figure 24 Policies, tools and instruments that reduce renewable energy barriers and mitigate risks
Structured financemechanisms and tools
Financial riskmitigation instruments
Enabling policiesand tools
• Financial policies and regulations
• Project preparation facilities
• Project facilitation tools
• On-lending facilities
• Hybrid structures
• Guarantees
• Currency hedging instruments
• Liquidity facilities
• Resource risk mitigation
• Standardisation
• Aggregation
• Securitisation
• Green bonds
• Yieldcos
HighLow
Scalability
Source: IRENA, 2016
G LO BAL L AN DSC APE O F RENEWABLE ENERGY FINANCE
39
6. OUTLOOK
The finance landscape for the energy sector is poised to change dramatically in the next few years. As costs continue to come down, renewable energy will more and more outcompete other energy technologies. Once a tipping point, possibly already in 2020, is reached and demand for other energy sources starts to decline, financial markets will react very rapidly in revaluing energy assets. This will be the basis for a fundamental shift towards renewable energy finance. Public policy and finance can help to accelerate this transition and reduce the disruption it could have on financial markets.
The initial efforts to deploy renewables were driven by climate change and other environmental considerations, and as countries strive to fulfil pledges under the Paris Agreement, they are adopting increasingly ambitious targets for renewables. The need to scale up solar, wind, bioenergy and other technologies to meet international climate goals calls for unprecedented mobilisation of finance in the sector. The rise in global mean temperature can be limited to well below 2°C, if the share of renewables in primary energy supply rises from about 15% in 2015 to about 65% in 2050, coupled with a significant progress in energy efficiency. Such transformation of the energy sector necessitates a total of USD 25 trillion to be invested in renewables in the period up to 2050, implying approximately a tripling of the current annual investments (IRENA, 2017b).
IRENA (2016) finds that this is entirely possible, so long as policy makers and public finance institutions employ a portfolio of approaches, financial instruments and tools (see Box 4).
The rising pace of investment should foster continued cost reductions across the renewable energy portfolio. Private finance accounted for the bulk of renewable energy investment in 2013-2016, a trend that looks set to continue in the years ahead. To reach the scale
required, institutional investors will need to be drawn into the renewable energy sector at scale, as they divest from fossil fuel installations that risk becoming stranded assets. Yet public finance will remain important to cover early-stage project development risk and spur initial investment, especially in developing countries where there is little track record of successful renewable energy investment. The focus of public finance institutions should increasingly be on crowding in additional private capital to scale up investment in renewables. This can be achieved by extending the use of risk mitigation instruments and structured finance mechanisms, which can help address some of the risks and barriers faced by private investors.
Costs for solar PV and onshore wind look set to fall further in 2018 and beyond. Both technologies retain a leading role in the renewable mix and could be bolstered considerably by fast-improving battery storage. Offshore wind – the only technology to grow continuously through 2016 – looks likely to continue in the same direction given the falling costs at recent offshore wind power auctions.
Unless the costs of battery storage fall very rapidly, concentrated solar power (CSP) technology could possibly represent another game changer. Electricity costs from CSP have fallen below those from power plants using imported natural gas, with the latest auction in Dubai setting prices as low as USD 7.3 cents per kilowatt-hour (kWh) (Government of Dubai, 2017). Coupled with its potential for 24-hour availability, CSP has the potential for rapid growth.
What happens next will depend largely on developments in China, the US, India and other major markets for renewable energy investment. Yet rising renewable energy markets, such as Argentina, Indonesia, the Republic of Korea and Viet Nam, also offer significant growth potential. In other emerging economies in Africa, Asia and Latin America, exponential increases in domestic finance could boost future renewable energy investment.
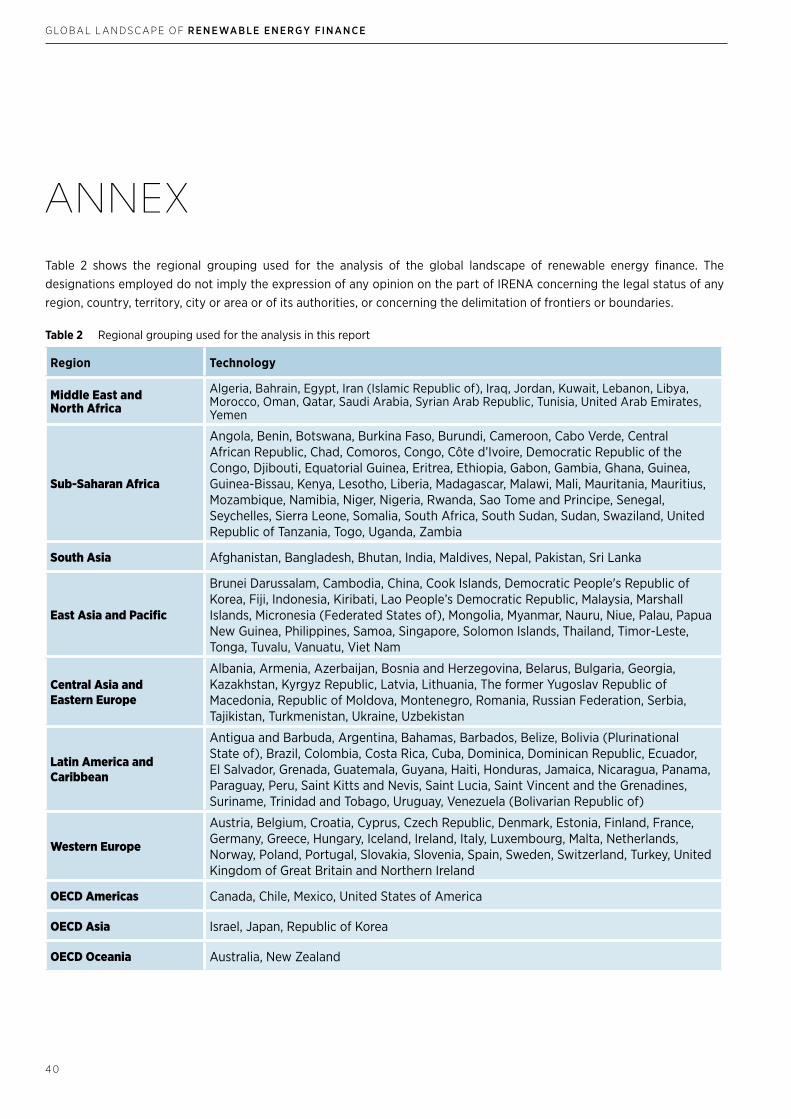
4 0
G LO BAL L AN DSC APE O F RENEWABLE ENERGY FINANCE
ANNEXTable 2 shows the regional grouping used for the analysis of the global landscape of renewable energy finance. The designations employed do not imply the expression of any opinion on the part of IRENA concerning the legal status of any region, country, territory, city or area or of its authorities, or concerning the delimitation of frontiers or boundaries.
Table 2 Regional grouping used for the analysis in this report
Region Technology
Middle East and North Africa
Algeria, Bahrain, Egypt, Iran (Islamic Republic of), Iraq, Jordan, Kuwait, Lebanon, Libya, Morocco, Oman, Qatar, Saudi Arabia, Syrian Arab Republic, Tunisia, United Arab Emirates, Yemen
Sub-Saharan Africa
Angola, Benin, Botswana, Burkina Faso, Burundi, Cameroon, Cabo Verde, Central African Republic, Chad, Comoros, Congo, Côte d’Ivoire, Democratic Republic of the Congo, Djibouti, Equatorial Guinea, Eritrea, Ethiopia, Gabon, Gambia, Ghana, Guinea, Guinea-Bissau, Kenya, Lesotho, Liberia, Madagascar, Malawi, Mali, Mauritania, Mauritius, Mozambique, Namibia, Niger, Nigeria, Rwanda, Sao Tome and Principe, Senegal, Seychelles, Sierra Leone, Somalia, South Africa, South Sudan, Sudan, Swaziland, United Republic of Tanzania, Togo, Uganda, Zambia
South Asia Afghanistan, Bangladesh, Bhutan, India, Maldives, Nepal, Pakistan, Sri Lanka
East Asia and Pacific
Brunei Darussalam, Cambodia, China, Cook Islands, Democratic People's Republic of Korea, Fiji, Indonesia, Kiribati, Lao People’s Democratic Republic, Malaysia, Marshall Islands, Micronesia (Federated States of), Mongolia, Myanmar, Nauru, Niue, Palau, Papua New Guinea, Philippines, Samoa, Singapore, Solomon Islands, Thailand, Timor-Leste, Tonga, Tuvalu, Vanuatu, Viet Nam
Central Asia and Eastern Europe
Albania, Armenia, Azerbaijan, Bosnia and Herzegovina, Belarus, Bulgaria, Georgia, Kazakhstan, Kyrgyz Republic, Latvia, Lithuania, The former Yugoslav Republic of Macedonia, Republic of Moldova, Montenegro, Romania, Russian Federation, Serbia, Tajikistan, Turkmenistan, Ukraine, Uzbekistan
Latin America and Caribbean
Antigua and Barbuda, Argentina, Bahamas, Barbados, Belize, Bolivia (Plurinational State of), Brazil, Colombia, Costa Rica, Cuba, Dominica, Dominican Republic, Ecuador, El Salvador, Grenada, Guatemala, Guyana, Haiti, Honduras, Jamaica, Nicaragua, Panama, Paraguay, Peru, Saint Kitts and Nevis, Saint Lucia, Saint Vincent and the Grenadines, Suriname, Trinidad and Tobago, Uruguay, Venezuela (Bolivarian Republic of)
Western Europe
Austria, Belgium, Croatia, Cyprus, Czech Republic, Denmark, Estonia, Finland, France, Germany, Greece, Hungary, Iceland, Ireland, Italy, Luxembourg, Malta, Netherlands, Norway, Poland, Portugal, Slovakia, Slovenia, Spain, Sweden, Switzerland, Turkey, United Kingdom of Great Britain and Northern Ireland
OECD Americas Canada, Chile, Mexico, United States of America
OECD Asia Israel, Japan, Republic of Korea
OECD Oceania Australia, New Zealand
R EFER EN C E S
41
Bellini, M. (2017), “Mexico’s power auction pre-selects 16 bids with average price of $20.57/MWh and 2.56 GW of combined capacity”, PV Magazine, 16 November. https://www.pv-magazine.com/2017/11/16/mexicos-power-auction-pre-selects-16-bids-with-average-price-of-20-57mwh-and-2-56-gw-of-combined-capacity/.
Bhatia, M. and Angelou, N. (2015), “Beyond Connections: Energy Access Redefined”, ESMAP Technical Report, no. 008/15, World Bank, Washington, DC.
BNEF (Bloomberg New Energy Finance) (2017), “Renewable energy projects and asset finance databases” (database), BNEF. Available at: https://www.bnef.com/assetfinancing/.
Buchner, B., Oliver P., Wang, X., Carswell, C., Meattle, C. and Mazza, F. (2017), Global Landscape of Climate Finance 2017, Climate Policy Initiative.
Bureau of Economic and Business Affairs (2017), Investment Climate Statement for China, U.S. Department of State, Washington, DC.
Carbon Brief (2017), Analysis: UK auction reveals offshore wind cheaper than new gas. Available at: https://www.carbonbrief.org/analysis-uk-auction-offshore-wind-cheaper-than-new-gas.
CEER (Council of European Energy Regulators) (2017), Status Review of Renewable Support Schemes in Europe, CEER, Brussels.
Government of Dubai (2017), DEWA awards AED14.2 billion largest CSP project in the world with a record bid of USD 7.3 cents per kW/h to generate 700MW. Available at: https://www.dewa.gov.ae/en/about-dewa/news-and-media/press-and-news/latest-news/2017/09/dewa-awards-aed142-billion-largest-csp.
GWEC (Global Wind Energy Council) (2015), “China introduces offshore wind feed-in tariffs”. Available at: http://gwec.net/china-introduces-offshore-wind-feed-in-tariffs/.
ICIS (2017), Belgian offshore wind power costs fall to €79/MWh as 716MW finalised, 27 October. Available at: https://www.icis.com/resources/news/2017/10/27/10158217/belgian-offshore-wind-power-costs-fall-to-79-mwh-as-716mw-finalised/.
IEA (International Energy Agency) and World Bank (2017), Global Tracking Framework – Progress Toward Sustainable Energy. World Bank, Washington, DC.
IFC (International Finance Corporation) (2015), Utility-Scale Photovoltaic Power Plants, IFC, Washington, DC.
IMF (International Monetary Fund) (2016), “People’s Republic of China”, IMF Country Report No. 16/271, IMF, Washington, DC.
IRENA (International Renewable Energy Agency) (forthcoming), Renewable Power Generation Costs in 2017, IRENA, Abu Dhabi.
IRENA (2017a), Renewable Energy Statistics 2017, IRENA, Abu Dhabi.
IRENA (2017b). “Chapter 3: Global Energy Transition Prospects and the Role of Renewables”, in Perspectives for the Energy Transition – Investment needs for a low-carbon energy system, IRENA, Abu Dhabi.
IRENA (2017c), Renewable Energy Auctions: Analysing 2016. IRENA, Abu Dhabi.
IRENA (2017d), “Renewable Energy Finance Flow”, IRENA data and statistics (database). Available at: resourceirena.irena.org/gateway/dashboard/?topic=6&subTopic=8 (accessed 12 December 2017).
IRENA (2016), Unlocking Renewable Energy Investment: The Role of Risk Mitigation and Structured Finance, IRENA, Abu Dhabi.
IRENA and CEM (Clean Energy Ministerial) (2015), Renewable Energy Auctions: A Guide to Design, IRENA, Abu Dhabi.
IRENA and CPI (2018), Global Landscape of Renewable Energy Finance, 2018: Methodology, IRENA, Abu Dhabi.
IRENA, IEA and REN21 (forthcoming), Renewable Energy Policies in a Time of Transition.
Liu, Z., Zhang, W., Zhao, C. and Yuan, J. (2015), “The economics of wind power in China and policy implications”, Energies, 8, 1529-1546.
Mazzucato, M. and Semieniuk, G. (2017), “Financing renewable energy: who is financing what and why it matters”, in Technological Forecasting and Social Change.
NITI Aayog (2015), Report on the Expert Group on 175 GW RE by 2022, National Institution for Transforming India.
OECD (Organisation for Economic Co-operation and Development) (2017), The Government Role in Mobilising Investment and Innovation in Renewable Energy, OECD Publishing, Paris.
REFERENCES
42
G LO BAL L AN DSC APE O F RENEWABLE ENERGY FINANCE
Ofgem (2016), Renewables Obligation: Closure of the scheme to onshore wind in England, Scotland and Wales, Ofgem, London.
Renewable Energy Institute (2017), “Feed-in Tariff Statistics in Japan” (database). Available at: https://www.renewable-ei.org/en/statistics/fit.php (accessed 12 December 2017).
REN21 (Renewable Energy Policy Network for the 21st Century) (2017), Renewables 2017 Global Status Report, REN21, Paris.
REN21 (2011), Renewables 2011 Global Status Report, REN21, Paris.
REN21 (2006), Renewables Global Status Report 2006 Update, REN21, Paris.
RenewableUK (2017), Offshore wind prices tumble in record-breaking auction results – cheaper than nuclear and gas. Available at: www.renewableuk.com/news/362971/Offshore-wind-prices-tumble-in-record-breaking-auction-results--cheaper-than-nuclear-and-gas-.htm.
SEforALL (Sustainable Energy for All) (2017), Understanding the Landscape: Tracking Finance for Electrification and Clean Cooking Access in High Impact Countries, SEforALL, Washington, DC.
Tidal Lagoon Power (2017), Projects: Swansea Bay. Available at: http://www.tidallagoonpower.com/projects/swansea-bay/(accessed 4 December 2017).
WEC (World Energy Council) (2016), World Energy Resources: Wind 2016, WEC, London.

