global leader in cloud-based learning and hcmfinal)-flin… · nasdaq: csod. as of february 12,...
TRANSCRIPT

NASDAQ: CSOD
As of February 12, 2019
Global Leader in Cloud-Based Learning and HCM

This presentation includes forward-looking statements. These statements relate to, among other things, our future financial and operating performance, including our GAAP and non-GAAP guidance, the growth of the learning and human capital management market, our business strategy, and our plans and objectives for future operations. In light of the risks and uncertainties outlined below, the future events and circumstances discussed in this presentation may not occur, and actual results could differ materially from those anticipated or implied in the forward-looking statements. The Company has based these forward-looking statements largely on its current expectations and projections about future events and financial trends affecting its business. Forward-looking statements should not be read as guarantees of future performance or results, and will not necessarily be accurate indications of the times at, or by, which such performance or results will be achieved. Forward-looking statements are based on information available at the date of this presentation and management’s good faith belief as of such date with respect to future events, and are subject to risks and uncertainties that could cause actual performance or results to differ materially from those expressed in or suggested by the forward-looking statements. Important factors that could cause such differences include, but are not limited to:
• Statements regarding the Company’s business strategies;
• The Company’s anticipated future operating results and operating expenses;
• The Company’s ability to attract new clients to enter into subscriptions for its solution;
• The Company’s ability to service those clients effectively and induce them to renew and upgrade their deployments of the Company’s solution;
• The Company’s ability to expand its sales organization to address effectively the new industries, geographies and types of organizations the company intends to target;
• The Company’s ability to accurately forecast revenue and appropriately plan its expenses; market acceptance of enhanced solutions, alternate ways of addressing learning and talent management needs or new technologies generally by the Company and its competitors; continued acceptance of SaaS as an effective method for delivering learning and talent management solutions and other business management applications; the attraction and retention of qualified employees and key personnel;
• The Company’s ability to protect and defend its intellectual property; costs associated with defending intellectual property infringement and other claims; events in the markets for the Company’s solution and alternatives to the Company’s solution, as well as in the United States and global markets generally; future regulatory, judicial and legislative changes in the Company’s industry; changes in the competitive environment in the Company’s industry and the markets in which the Company operates; and other factors discussed under “Risk Factors” and “Management’s Discussion and Analysis of Financial Condition and Results of Operations” in the Company’s periodic reports filed with the Securities and Exchange Commission (the “SEC”).
Forward-looking statements speak only as of the date of this presentation. You should not put undue reliance on any forward-looking statement. The Company assumes no obligation to update any forward-looking statements to reflect actual results, changes in assumptions or changes in other factors affecting future performance or results, except to the extent required by applicable laws. If the Company updates one or more forward-looking statements, no inference should be drawn that it will make additional updates with respect to those or other forward-looking statements.
In addition to U.S. GAAP financials, this presentation includes certain non-GAAP financial measures. These non-GAAP financial measures are in addition to, not a substitute for or superior to, measures of financial performance prepared in accordance with U.S. GAAP. Please see the discussion of these non-GAAP financial measures and their reconciliations to the most directly comparable U.S. GAAP measures at the end of this presentation.
Safe Harbor
2

3
The Transformation

Fiscal Year 2018 AchievementsFive-Point Strategic Transformation Plan Has Driven Significant Value
4
1
2
3
4
5
Strategic Plan Value Creation
Focus on recurring revenue and exit enterprise service delivery
FY18 Subscription revenue growth of 19% YoY (18% cc YoY) Recurring revenue 88% of total revenue, up from 82% in 2017
Improve operating margins and cash flow
FY18 Operating Margin doubled to 12% from 6% in 2017 Unlevered FCF margin increased to 12%, or $63M
Create new recurring revenue streams, including aggressively entering the content market
Record content growth of >100% Launched new Customer Success Packages
Bolster the team New, tenured leadership including President, Global Field Sales, CMO, CAO, VP of Field Operations and VP of IR
Improve governance Appointed 3 new board members and independent chair
Source: FY18 results as of December 31, 2018
5
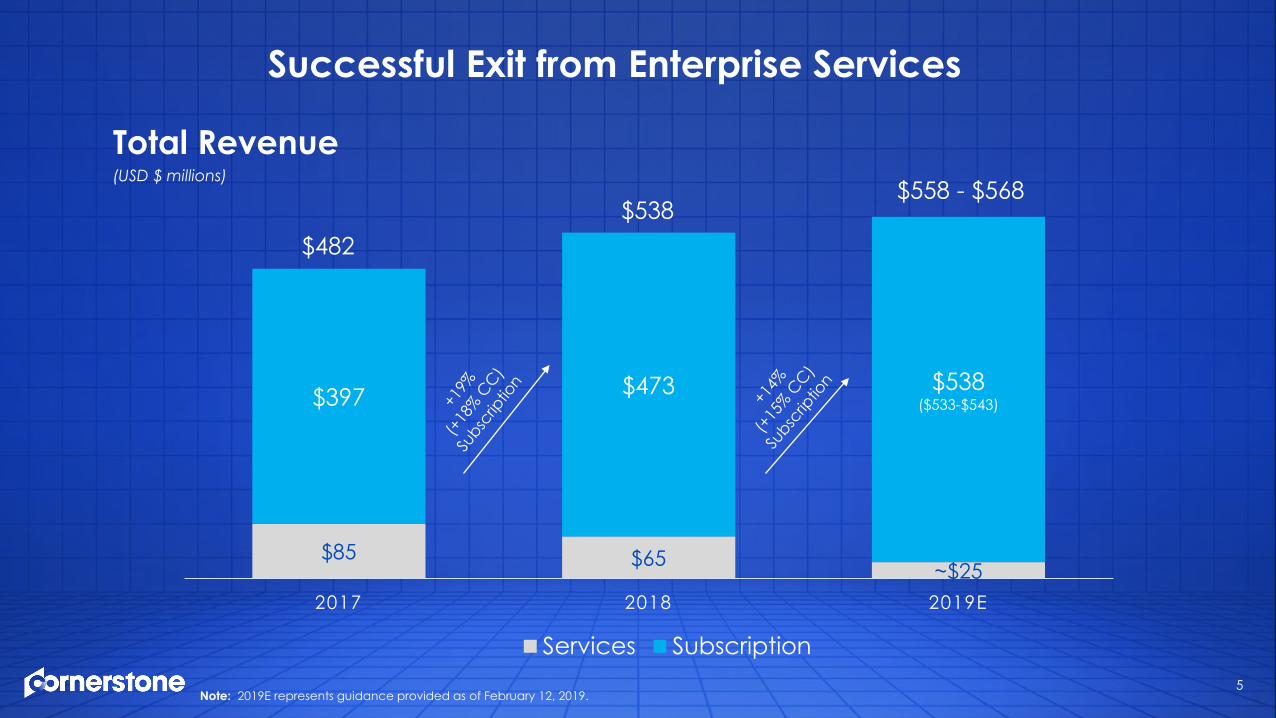
Successful Exit from Enterprise Services
Note: 2019E represents guidance provided as of February 12, 2019.
$85 $65 ~$25
$397 $473 $538($533-$543)
2017 2018 2019E
Services Subscription
$482$538
$558 - $568
Total Revenue(USD $ millions)
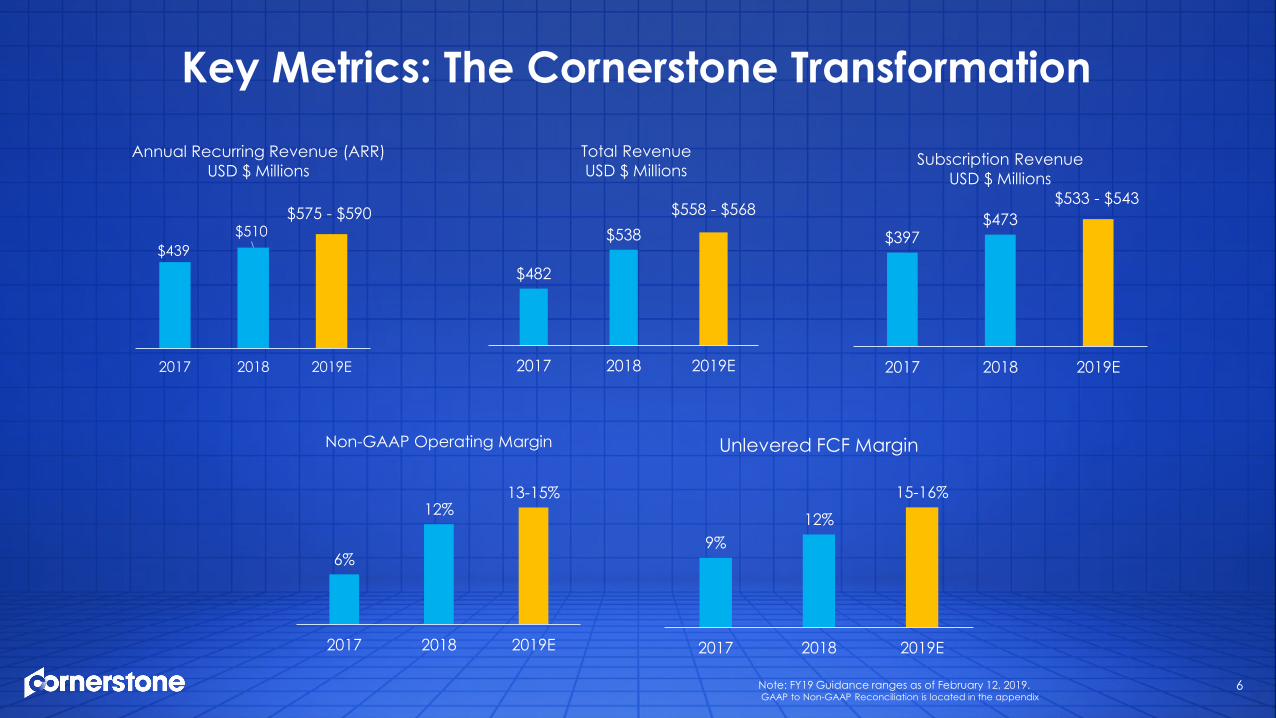
Key Metrics: The Cornerstone Transformation
$439$510
$575 - $590
2017 2018 2019E
Annual Recurring Revenue (ARR)USD $ Millions
Note: FY19 Guidance ranges as of February 12, 2019. GAAP to Non-GAAP Reconciliation is located in the appendix
6
$482
$538 $558 - $568
2017 2018 2019E
Total RevenueUSD $ Millions
$397 $473
$533 - $543
2017 2018 2019E
Subscription RevenueUSD $ Millions
6%
12%13-15%
2017 2018 2019E
Non-GAAP Operating Margin
9%12%
15-16%
2017 2018 2019E
Unlevered FCF Margin

7
Cornerstone Today
8
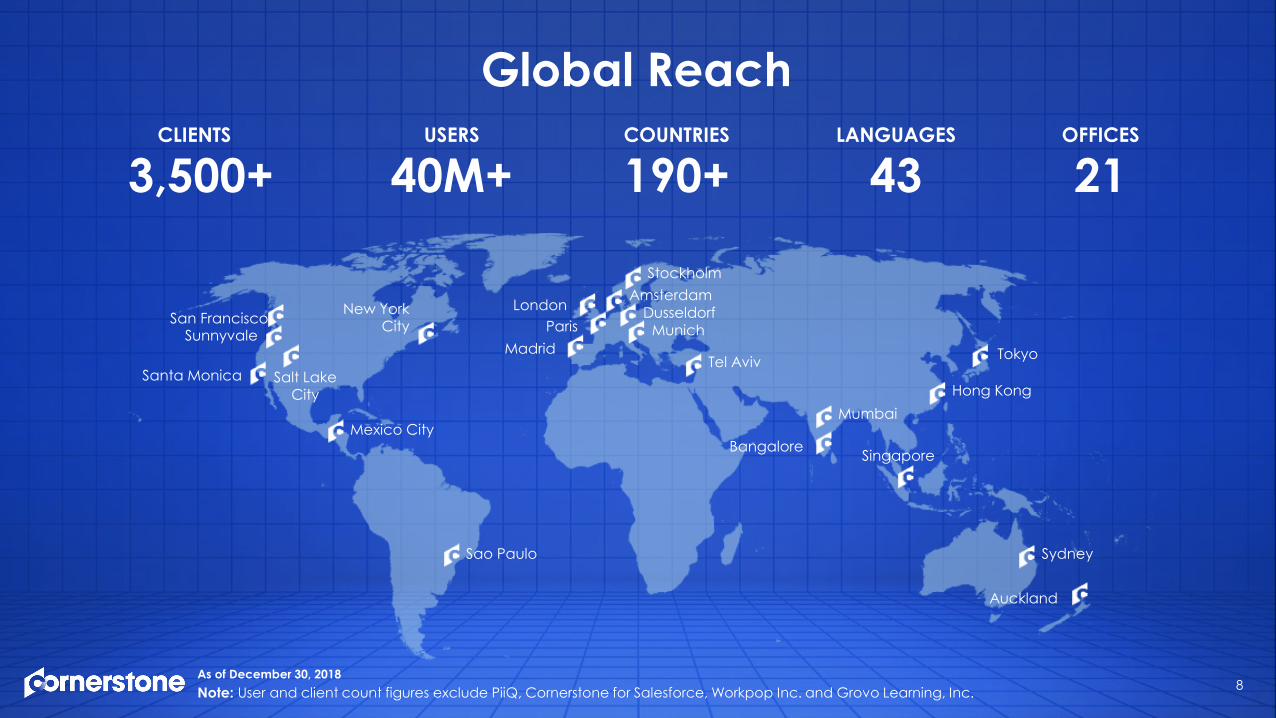
Global ReachCLIENTS
3,500+USERS
40M+COUNTRIES
190+LANGUAGES
43OFFICES
21
Sunnyvale
Santa Monica
Sao Paulo
MadridParis
London
Stockholm
DusseldorfMunich
Tel Aviv
Bangalore
MumbaiHong Kong
Tokyo
Sydney
Auckland
Singapore
Amsterdam
Note: User and client count figures exclude PiiQ, Cornerstone for Salesforce, Workpop Inc. and Grovo Learning, Inc.As of December 30, 2018
Salt Lake City
New York City San Francisco
Mexico City

Marquee Clients Around the WorldAPJUS & LATAM EMEA
9

10
A Decade of Sustained Revenue Growth
IPO
$20 $29 $47 $76
$118
$185
$264
$340
$423
$482
$538
2008 2009 2010 2011 2012 2013 2014 2015 2016 2017 2018
RevenueUSD $ Millions

11
Strong Growth in the Base
168 280
481
805
1,237
1,631
2,153
2,595
2,918
3,250
3,535
2008 2009 2010 2011 2012 2013 2014 2015 2016 2017 2018
Client Growth
2.13.3
4.9
7.5
10.6
14.0
18.1
23.8
29.9
35.3
40.2
2008 2009 2010 2011 2012 2013 2014 2015 2016 2017 2018
User Growth(in Millions)
Note: User and client count figures exclude PiiQ, Cornerstone for Salesforce, Workpop Inc. and Grovo Learning, Inc.; Numbers updated as of 12/31/18

COMPLETENESS OF VISION
ABI
LITY
TO E
XEC
UTE
CHALLENGERS LEADERS
NICHE PLAYERS VISIONARIES
Cornerstone is the Market Leaderin Talent Management
SOURCE: Gartner (September 2018)
2018 Magic Quadrant for Talent Management Suites
Cegid
Saba (TalentSpace)
Skillsoft (SumTotal Systems)
Saba (Saba Cloud)
Haufe
SAP (SuccessFactors)
Talentsoft
PageUp
12

13
The Solution

Skilled Jobs Unskilled Jobs
Skilled Workers Unskilled Labor
The Skills Divide is Real14
15
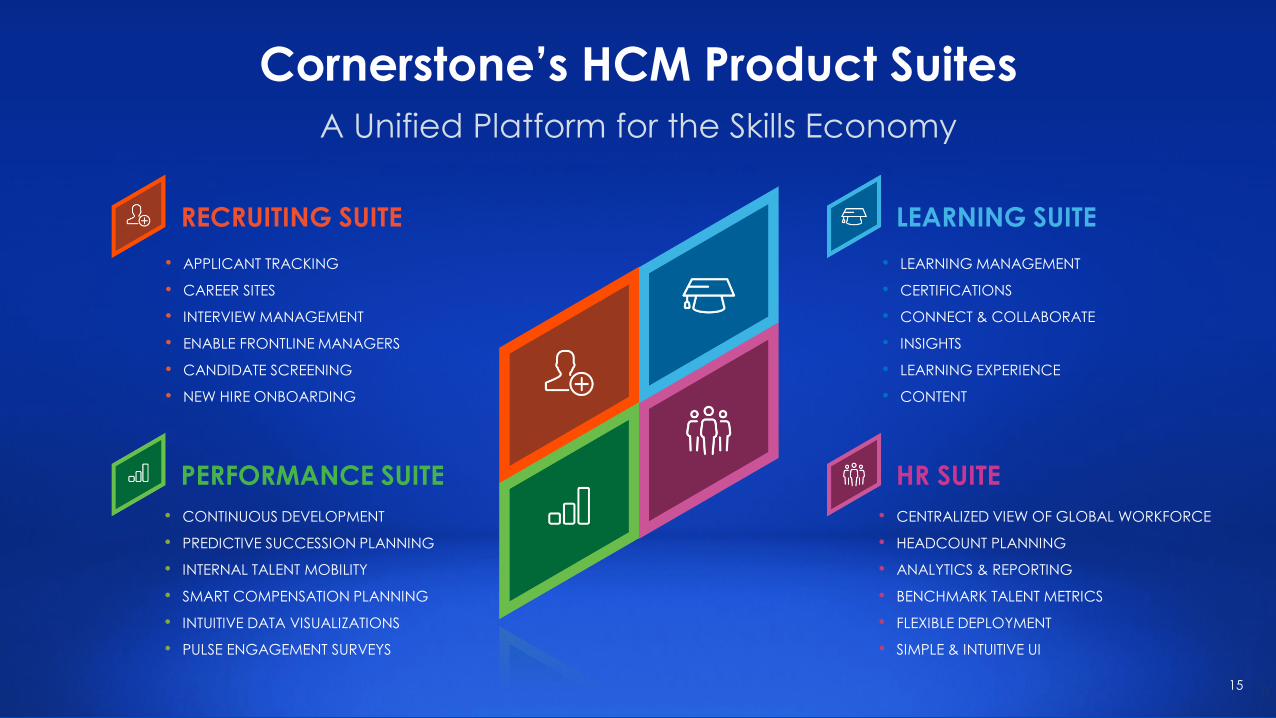
RECRUITING SUITE• APPLICANT TRACKING
• CAREER SITES
• INTERVIEW MANAGEMENT
• ENABLE FRONTLINE MANAGERS
• CANDIDATE SCREENING
• NEW HIRE ONBOARDING
PERFORMANCE SUITE• CONTINUOUS DEVELOPMENT
• PREDICTIVE SUCCESSION PLANNING
• INTERNAL TALENT MOBILITY
• SMART COMPENSATION PLANNING
• INTUITIVE DATA VISUALIZATIONS
• PULSE ENGAGEMENT SURVEYS
LEARNING SUITE• LEARNING MANAGEMENT
• CERTIFICATIONS
• CONNECT & COLLABORATE
• INSIGHTS
• LEARNING EXPERIENCE
• CONTENT
HR SUITE• CENTRALIZED VIEW OF GLOBAL WORKFORCE
• HEADCOUNT PLANNING
• ANALYTICS & REPORTING
• BENCHMARK TALENT METRICS
• FLEXIBLE DEPLOYMENT
• SIMPLE & INTUITIVE UI
Cornerstone’s HCM Product SuitesA Unified Platform for the Skills Economy
16
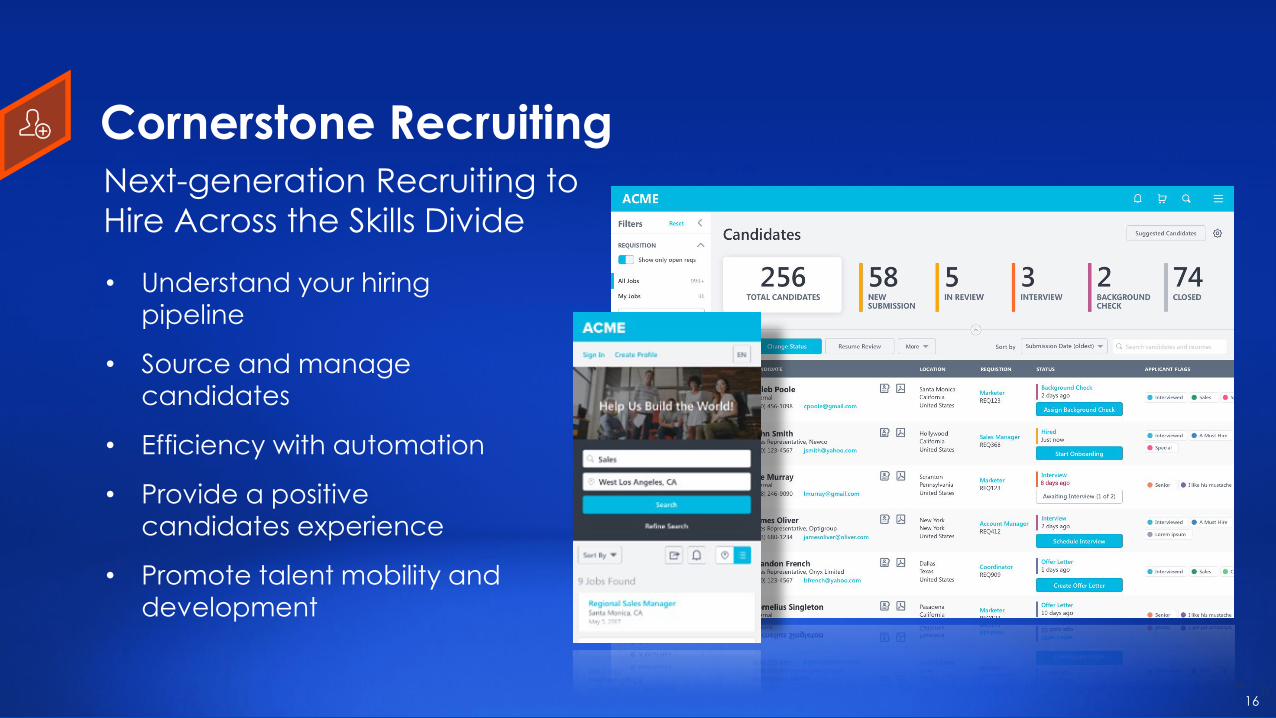
Cornerstone Recruiting
• Understand your hiring pipeline
• Source and manage candidates
• Efficiency with automation
• Provide a positive candidates experience
• Promote talent mobility and development
Next-generation Recruiting to Hire Across the Skills Divide
16

17
Cornerstone Learning
• Configurable, yet simple Learning Management
• The next generation of Learning Experience
• Content you can’t get anywhere else
The World’s Most Robust Learning Platform

18
Cornerstone Performance
• Maintain alignment to drive business outcomes
• Foster a culture of talent mobility
• Reward and recognize high performers
Drive results with Continuous Performance Development

19
Cornerstone HR
• View & manage all employee records in one place
• Empower employees to manage personal data
• Proactively seek out top performers
• Create headcount forecasts
• Get a global view of your organization
Centralizes HR Administration into a Single, Modern System

Collections of Content You Can’t Get Anywhere Else
Wide Partner Ecosystem
with a variety of modalities, topics, and titles
Intelligently Curated Subscriptions
built to solve specific business needs
[Playlists included with each subscription]
Seamlessly Purchased & Loaded
for enhanced user experience
[We handle metadata, thumbnails, content upload]
Subject-matter Experts
to listen to your business needs and recommend
the right content
Client
Curated Subscriptions
Integrated with LXP
Content Consultants
Best-of-breedPartners
20

21
Accelerating Growth:$40B Market Opportunity
22
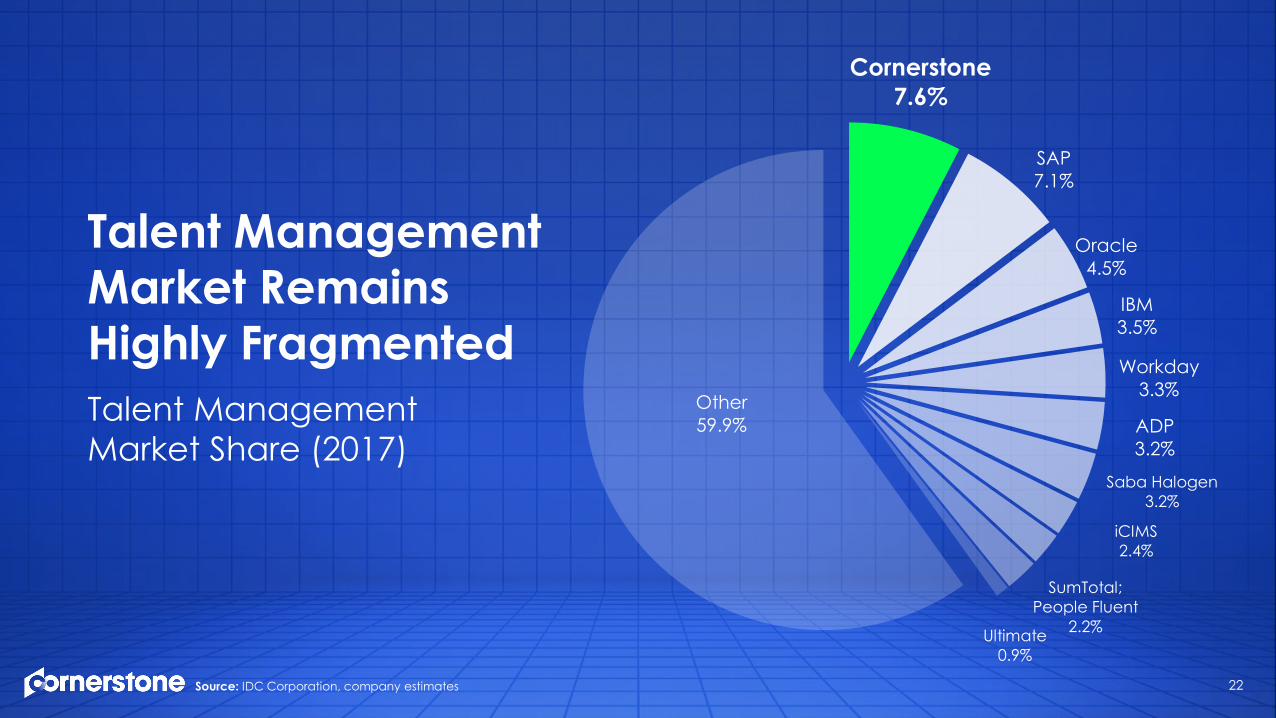
Talent Management Market Share (2017)
Talent Management Market Remains Highly Fragmented
Cornerstone 7.6%
SAP7.1%
Oracle4.5%
IBM3.5%
Workday3.3%
ADP3.2%
Saba Halogen3.2%
iCIMS2.4%
SumTotal; People Fluent
2.2%Ultimate0.9%
Other59.9%
Source: IDC Corporation, company estimates

23
Expanding Market Opportunity
Source: Training Industry Report (2017); Company estimates and WW HCM Apps Forecast, IDC WW Tracker, June 2018 Report
HCM + Content: $40B
*Talent Management – $7B
*Learning – $1.5B
9-11%GROWTH
*Performance – $1.5B
5%GROWTH
*Recruiting – $4B
16%GROWTH
11% GROWTH
HCM – $16B 10%GROWTH

24
Cornerstone's Second Act:$40 Billion Market Opportunity
$3.6B $6B $16
$25
Founding to IPO IPO to 2017 2018
Learning Systems Market Full Talent Management HCM Content
~$40B
2018 and Beyond:Cornerstone Operates in Two Markets
20-Year Start up
Source: Training Industry Report (2017); Company estimates and WW HCM Apps Forecast, IDC WW Tracker, June 2018 Report

1. Installed Base
2. Content
3. Recruiting
4. Cornerstone HR
5. APJ
25
Growth Drivers

26
Installed Base Opportunity
0
500
1,000
1,500
2,000
2,500
3,000
3,500
Learning Performance Recruiting Cornerstone HR
Existing Client Penetration Client Opportunity
Num
ber o
f Clie
nts
50% penetrationamong other suites results in incremental
$500MARR opportunity
Calculated based on 3,535 clients with approximately 11,400 users on average
Four Key Pillars, each a suite, and half of it GREENFIELD

Content at ScaleSizing the Content Opportunity for Cornerstone
3x+Content AnytimeRPU of Learning
33%Expected User Attach
Rate Relative to Learning
~$250MARR Opportunity Today
What We’ve Seen
Relative Opportunity
Today’s ARR Opportunity
27

Recruiting GrowthGrowing adoption of the Recruiting Suite
28

29
Opportunity Exists to Capitalize on the Managing Director Model
We have shifted to a country-specific GTM approach
Australia & New Zealand Japan Asia
Singapore (ASEAN)
Hong Kong
South Korea

30
Cornerstone HR’s Impact on Deals in EMEA
*EMEA deals in 2018Average deal values converted from local currency to USD
Average Suites Purchased
Average RPU
• EMEA clients that purchased Cornerstone HR on average buy ~2x more product suites
• Cornerstone HR increases ARPU by ~2x
1.7
3.6
Without Cornerstone HR With Cornerstone HR
~$30
~$65
Without Cornerstone HR With Cornerstone HR

14% 12% 15% 13%5%
14% 19% 13% 13% 18%
22%19% 19%
16%
16%13%
13%10% 9%
7%
64% 69% 66% 71%79% 73% 68%
77% 78% 75%
0%
10%
20%
30%
40%
50%
60%
70%
80%
90%
100%
TCPU Public Admin FinancialServices
Retail Higher Ed Other Services Healthcare Manufacturing High-Tech AMC
Replace Upgrade Do Nothing
Finding the Blue Ocean in Core HR
Source: Sierra Cedar 2015–2016 HR Systems Survey 18th Annual Edition
Cornerstone HR is attempting to address the “do nothing” segment vs. upgrade (primarily PeopleSoft) & replace (primarily Workday & SAP)
31

32
FY2019 Guidance Summary

$113
$129
$20 $7
-
$20M
$40M
$60M
$80M
$100M
$120M
$140M
Q1 2018 Q1 2019 Guidance
Subscription Services
$473
$538
$65
$25
-
$100M
$200M
$300M
$400M
$500M
$600M
FY18 FY19 Guidance
Subscription Services33
2019 Revenue Guidance
$127.5 – $129.5 $533 – $543
$133M$563M$136M
$538M
First Quarter Full Year
(60%)
$558 – $568$134.5 – $136.5
(Dollar in millions)
Note: Reflects guidance issued as of February 12, 2019.

2018 Actual 2019 Guidance
ARR(1)Growth
$510 $575 - $59013-16% / 13-16% CC
Total RevenueGrowth
$538 $558 - $5684-6% / 5-7% CC
Subscription RevenueGrowth
$473 $533 - $54313-15% / 14-16% CC
Professional Consulting Services Revenue $65 Down ~60%
Operating Profit(1)Margin
$6312%
$74 - $8413-15%
Unlevered Free Cash Flow(1)
Margin
$6312%
$82 - $9215-16%
2019 Guidance
34
OTHER:1. GBP to USD 1.29
EUR to USD 1.14
2. 5% FX Δ = $6 ARR / $6 Revenue
3. Net Interest Expense(2):• GAAP $16• Non-GAAP $12
4. Cash Interest Paid $17
5. Shares outstanding increases from 61M to 66M when Net Income is positive
6. Income tax expense $3
7. SBC as % of revenue ~13%, versus prior year of 11%
8. Capex ~4% of revenue
(Dollar in millions)
Note: Reflects guidance issued as of February 12, 2019. 1. Denotes a non-GAAP metric2. Net Interest Expense is Gross Interest Expense less Interest Income

Q1 2018 Actual Q1 2019 Guidance
Total RevenueGrowth
$133 $134.5 - $136.51-3% / 3-5% CC
Subscription RevenueGrowth
$113 $127.5 - $129.513-14% / 15-17% CC
Professional Consulting Services Revenue $20 Down ~65%
Operating Profit(1)Margin
$1310%
Operating Margin in low double-digits
Unlevered Free Cash Flow(1)
Margin
$(10)(8)%
uFCF Margin similar to prior year
Q1 2019 Guidance
35
OTHER:1. GBP to USD 1.29
EUR to USD 1.14
2. Net Interest Expense(2):• GAAP $4• Non-GAAP $3
3. Cash Interest Paid ~$9
4. Shares outstanding increases from 59M to 65M when Net Income is positive
5. Capex primarily in 1H for tenant improvement build-outs
(Dollar in millions)
Note: Reflects guidance issued as of February 12, 2019, 1. Denotes a non-GAAP metric2. Net Interest Expense is Gross Interest Expense less Interest Income

2020 Growth/Profitability Framework
Note: FY19 guidance updated as of February 12, 2019. 36
2020 Framework
FY18Actual
FY19Guidance
LowGrowth
Moderate Growth
HighGrowth
Subscription Revenue Growth 19% 13-15% < 10% 10 - 20% 21 - 30%
Non-GAAP Operating Margin 12% 13-15% 30%+ 18 - 28% 12 - 22%
Unlevered Free Cash Flow Margin 12% 15-16% 30%+ 20 - 30% 15 - 25%
2020 ‘Moderate Growth’ Target Assumes ~$150M in uFCF and ~$2.00 Per Share

GAAP to Non-GAAP Reconciliation
37
Q1'18 Q2'18 Q3'18 Q4'18 FY16 FY17 FY18
(Loss) income from operations (8,846) (3,095) 1,574 2,598 (56,342) (49,256) (7,769) Stock-based compensation 14,043 15,283 15,489 15,515 54,699 65,830 60,330 Amortization of intangible assets - - 208 625 9,290 7,421 833 Write-off of capitalized software - - - - - 1,339 - Restructuring 7,725 1,000 221 - - 1,539 8,946 Acquisition costs - - 352 705 - - 1,057
Non-GAAP operating income 12,922 13,188 17,844 19,443 7,647 26,873 63,397 Operating margin (6.6%) (2.3%) 1.2% 1.9% (13.3%) (10.2%) (1.4%)Non-GAAP operating income margin 9.7% 10.0% 13.3% 14.1% 1.8% 5.6% 11.8%
Net cash (used in) provided by operating activities (4,580) 17,228 32,617 44,987 35,252 67,510 90,253 Capital expenditures (2,559) (5,068) (2,534) (4,734) (6,228) (7,100) (14,895) Capitalized software costs (6,039) (6,263) (6,641) (6,572) (16,409) (20,571) (25,515) Cash paid for interest 3,000 2,003 8,625 - 3,796 3,841 13,628
Unlevered free cash flow (10,178) 7,900 32,067 33,681 16,411 43,680 63,471 Unlevered free cash flow margin (7.6%) 6.0% 23.9% 24.4% 3.9% 9.1% 11.8%
RECONCILIATION OF NET CASH (USED IN) PROVIDED BY OPERATING ACTIVITIES TO UNLEVERED FREE CASH FLOW AND UNLEVERED FREE CASH FLOW MARGIN
RECONCILIATION OF OPERATING (LOSS) INCOME AND OPERATING MARGIN TO NON-GAAP OPERATING INCOME AND NON-GAAP OPERATING MARGIN:
FY 2018 Full Year

38

Investment Summary
Organically-developed, best-of-breed SaaS platform
Huge, untapped market opportunity
Industry-leading customer retention
Highly scalable business
Top line growth with significant profitability improvement
A leader in cloud-based learning and human capital management
Transformation into a high-margin growth company
39

Thank You!