global nitrogen fertiliser demand and supply: trend, current … · global nitrogen fertiliser...
TRANSCRIPT

© Proceedings of the 2016 International Nitrogen Initiative Conference, "Solutions to improve nitrogen use efficiency for the world", 4 – 8
December 2016, Melbourne, Australia. www.ini2016.com 1
Global nitrogen fertiliser demand and supply: trend, current level and outlook
Patrick Heffer1 and Michel Prud’homme1
1 International Fertilizer Association (IFA), Paris 75116, France, www.fertilizer.org, [email protected]
Abstract
In the perspective of a world reaching more than 9 billion people by 2050, and the need to alleviate persistent
hunger, which still affects more than 800 million people, nutrient management shall ensure continuous
increase of agricultural production. The latest projections by the Food and Agriculture Organization of the
United Nations (FAO) show that feeding that many people would require raising overall food production by
some 60% between 2005/07 and 2050 (FAO, 2012) in the absence of changes to current biofuel mandates.
This shall be done while mitigating environmental impacts of farming in general, and improving plant
nutrient management in particular. Agricultural intensification using fertilizer best management practices is a
desirable and necessary goal. The alternative –agricultural extensification– means increased conversion of
natural habitats to farmland, biodiversity loss, and a significant increase in global greenhouse gas emissions.
The need to improve food security strongly influenced world fertilizer demand over the past decades. Future
demand is likely to be driven by a broader set of considerations, including the need to reduce environmental
impacts from nutrient losses. The paper analyzes global nitrogen (N) fertilizer demand and supply trends and
outlook under this changing operating environment.
Nitrogen Fertilizer Use
Evolution of Global Fertilizer Consumption between 2000/01 and 2013/14
World fertilizer consumption increased steadily between 2000/01 and 2007/08, by 23%, rising from 137.0 to
168.4 teragrams (Tg) of nutrients (N+P2O5+K2O). During the same period, global N fertilizer consumption
rose by 23%, from 82.1 to 100.8 Tg N. In 2008/09, world consumption contracted by 8%, to 155.4 Tg
nutrients, due to the economic downturn and financial crisis. Nitrogen consumption was much less impacted
(-2%) than that of phosphate (P) and potassium (K), which fell by 12% and 20%, respectively. Global
demand started to rebound in 2009/10, to reach 182.3 Tg nutrients by 2013/14, i.e. a 17% increase over this
five-year period (Figure 1). Reflecting the smaller drop in 2008/09, N fertilizer consumption grew more
modestly (+12%) during that period, to 110.4 Tg N. Between 2000/01 and 2013/14, aggregate world
fertilizer consumption rose by 33%. Potash consumption recorded the strongest growth (+39% to 30.6 Tg
K2O), followed by N (+35%, to 110.4 Tg N) and P (+26%, to 41.2 Tg P2O5), reflecting progressive
rebalancing of the N:K ratio.
Figure 1: Evolution of global fertilizer consumption by nutrient
(Tg N+P2O5+K2O) (IFA, 2016a)

© Proceedings of the 2016 International Nitrogen Initiative Conference, "Solutions to improve nitrogen use efficiency for the world", 4 – 8
December 2016, Melbourne, Australia. www.ini2016.com 2
Between 2000/01 and 2013/14, 83% of the increase in world fertilizer consumption came from developing
countries. East Asia and South Asia were the two key drivers, accounting together for 70% of the global
expansion. During that 13-year period, N fertilizer consumption rose by 12.9 Tg N in East Asia (+44%) and
by 6.9 Tg N in South Asia (+48%). Volume increases were much more modest in the rest of the world. In
relative terms, the strongest expansion was observed in Eastern Europe & Central Asia (+84%) reflecting a
progressive rebound of the regional market following the collapse of the Former Soviet Union. Western &
Central Europe is the only region that witnessed a market contraction (-2%) during that period owing to
significant improvements in N use efficiency and increasing manure-N recycling. In the rest of the world, N
fertilizer consumption evolved more modestly (Figure 2).
Figure 2: Evolution of regional N fertilizer consumption by region
(Tg N) (IFA, 2016a)
Global Nitrogen Fertilizer Consumption in 2013/14
Geographical Breakdown of Nitrogen Fertilizer Consumption
Total world N fertilizer consumption in 2013/14 is estimated at 110.4 Tg N. Three national markets
dominate global consumption: China, India and the United States with an aggregate market share of 57%.
Another five countries, with domestic markets between 2 and 4 Tg N, account for 13% of world
consumption: Brazil, Pakistan, Indonesia, Canada and France (Figure 3).
Figure 3: Country breakdown of global N fertilizer consumption
in 20134/14 (IFA, 2016a)
ROW = rest of the world
© Proceedings of the 2016 International Nitrogen Initiative Conference, "Solutions to improve nitrogen use efficiency for the world", 4 – 8
December 2016, Melbourne, Australia. www.ini2016.com 3
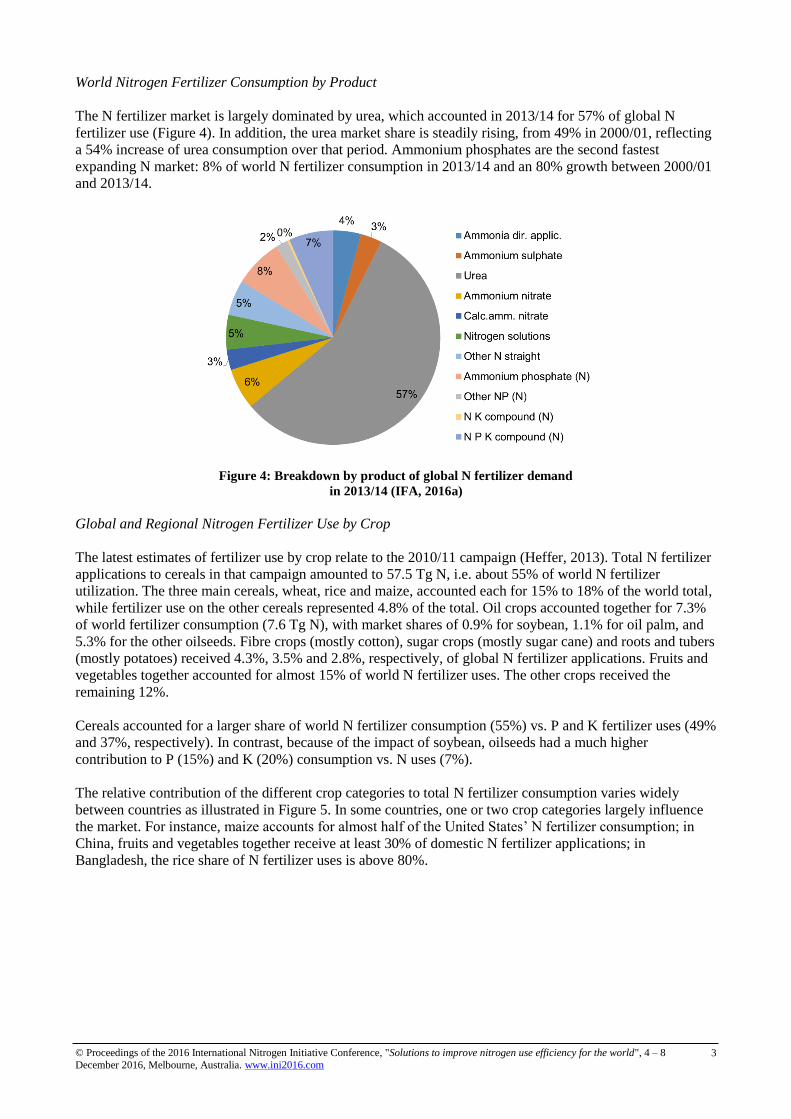
World Nitrogen Fertilizer Consumption by Product
The N fertilizer market is largely dominated by urea, which accounted in 2013/14 for 57% of global N
fertilizer use (Figure 4). In addition, the urea market share is steadily rising, from 49% in 2000/01, reflecting
a 54% increase of urea consumption over that period. Ammonium phosphates are the second fastest
expanding N market: 8% of world N fertilizer consumption in 2013/14 and an 80% growth between 2000/01
and 2013/14.
Figure 4: Breakdown by product of global N fertilizer demand
in 2013/14 (IFA, 2016a)
Global and Regional Nitrogen Fertilizer Use by Crop
The latest estimates of fertilizer use by crop relate to the 2010/11 campaign (Heffer, 2013). Total N fertilizer
applications to cereals in that campaign amounted to 57.5 Tg N, i.e. about 55% of world N fertilizer
utilization. The three main cereals, wheat, rice and maize, accounted each for 15% to 18% of the world total,
while fertilizer use on the other cereals represented 4.8% of the total. Oil crops accounted together for 7.3%
of world fertilizer consumption (7.6 Tg N), with market shares of 0.9% for soybean, 1.1% for oil palm, and
5.3% for the other oilseeds. Fibre crops (mostly cotton), sugar crops (mostly sugar cane) and roots and tubers
(mostly potatoes) received 4.3%, 3.5% and 2.8%, respectively, of global N fertilizer applications. Fruits and
vegetables together accounted for almost 15% of world N fertilizer uses. The other crops received the
remaining 12%.
Cereals accounted for a larger share of world N fertilizer consumption (55%) vs. P and K fertilizer uses (49%
and 37%, respectively). In contrast, because of the impact of soybean, oilseeds had a much higher
contribution to P (15%) and K (20%) consumption vs. N uses (7%).
The relative contribution of the different crop categories to total N fertilizer consumption varies widely
between countries as illustrated in Figure 5. In some countries, one or two crop categories largely influence
the market. For instance, maize accounts for almost half of the United States’ N fertilizer consumption; in
China, fruits and vegetables together receive at least 30% of domestic N fertilizer applications; in
Bangladesh, the rice share of N fertilizer uses is above 80%.

© Proceedings of the 2016 International Nitrogen Initiative Conference, "Solutions to improve nitrogen use efficiency for the world", 4 – 8
December 2016, Melbourne, Australia. www.ini2016.com 4
Figure 5: Relative contribution of the main crop categories to total N fertilizer
consumption in 2010/11 in the main fertilizer markets (Heffer, 2013)
Nitrogen Fertilizer Use Efficiency: An Important Key Driver of Future Demand
Nutrient use efficiency is an indicator of nutrient management performance, which reflects the efficiency of
uptake by crops of the nutrient input to a crop production system. Norton et al. (2015) recommend using the
output/input ratio to monitor N use efficiency (NUE). This indicator is derived from the sum of the N content
in all harvested products and the sum of all N inputs (fertilizers, manure, biological N fixation, etc.) within
the boundary of the system considered.
Nitrogen use efficiency levels and trends vary widely between regions and countries (Norton et al., 2015;
Fixen et al., 2014) because of the diversity of soils, crops, climate, farmers’ access to technology and
knowledge, and policy priorities. However, NUE tends to follow a typical trend in relation to yield over time
(Figure 6), with different countries being at different points on the curve. When N application rates are low,
crop yield is usually low but NUE levels can be well above 100%, illustrating soil N mining. As fertilizer
application rates increase, yield rises while NUE contracts up to a certain point. Beyond that point, NUE and
yield increase in synchrony, reflecting adoption of fertilizer best management practices and, more generally,
sustainable intensification (producing more with less). NUE levels can only increase up to a hypothetical
limit, below 100%, due to unavoidable N losses associated with biological activity in soils. When
approaching the NUE limit, future yield gains would have to come once again from higher N inputs from
different sources as there would be little or no potential to further improve NUE.
At the regional level, the following trends are observed (IFA, 2014a; Fixen et al., 2014; Figure 6):
In developed countries, NUE has undergone steady improvement over the past three decades, driven
by the adoption of fertilizer best management practices. Similar trends are observed for N fertilizer
applied to maize in the United States, wheat in West Europe or rice in Japan.
In China, N fertilizer consumption has been increasing faster than cereal yield gains, triggering a
steady decline of NUE in cereal systems. High application rates to fruits and vegetables also
contributed to NUE contraction. A reversal of trend (i.e. an improvement) is observed for 5-10 years,
reflecting the government’s new focus on resource efficiency.
In India, N fertilizer applications to cereals are still increasing faster than cereal yields, driven by a
fertilizer subsidy regime that has contributed to unbalanced and inefficient fertilizer use. Hence, NUE
is still declining, but a rebound can be anticipated if the fertilizer subsidy policy is revised, reducing
the differential treatment between urea and the other fertilizer products.
In Sub-Saharan Africa (SSA), farmers use 10-15 kg of nutrients per hectare, i.e. about one tenth of the
world average. In most countries, NUE levels are well above 100%, causing widespread soil nutrient
depletion, land degradation and low agricultural productivity. With fertilizer consumption rising
firmly for 5-10 years in some SSA countries, NUE is expected to progressively improve (i.e. decline
below 100%), but SSA would still remain in the top left of the curve.

© Proceedings of the 2016 International Nitrogen Initiative Conference, "Solutions to improve nitrogen use efficiency for the world", 4 – 8
December 2016, Melbourne, Australia. www.ini2016.com 5
Brazil is an exception. The country has been able to take a shortcut, witnessing continuous yield gains
while avoiding a sharp NUE drop. This is largely associated with the sizable proportion of soybean in
the Brazilian crop mix and large-scale farmers having access to new technology and knowledge.
Fig 6: Typical evolution of NUE over time (Adapted from Zhang et al., 2015)
Understanding these different NUE trends is essential for developing meaningful medium- and long-term
national, regional and global fertilizer demand projections.
Lassaletta et al. (2014) and Zhang et al. (2015) have both monitored NUE trends (measured as the N
output/input ratio) in a number of countries over the past five decades. Lassaletta et al. and Zhang et al.
estimated that the global average NUE was of 47% in 2009 and 42% in 2010, respectively. The low NUE
efficiency of some countries is the results of sub-optimal farming practices (nutrient management, crop
varieties, etc.) but also of a crop mix that favours crops with an inherent low NUE (fruits and vegetables) to
the detriment of crops with a comparatively high NUE such as soybean (Zhang et al., 2015).
Medium-term Outlook for World and Regional Nitrogen Fertilizer Demand
Assuming average weather patterns and no major policy changes, the agricultural outlook to 2025 points to
ample inventories and low international prices for most agricultural commodities, with a slight tightening of
market conditions (OECD and FAO, 2016). Reflecting the agricultural prospects and continuous gains in N
use efficiency in developed countries and more recently in China, global N fertilizer demand is seen growing
at relatively low rate compared to the historical trend. The International Fertilizer Association (IFA)
anticipates that world N fertilizer demand would rise by 1.2% per annum (p.a.) between the base year
(average of 2013/14 to 2015/16) and 2020/21 to reach 117.1 Tg N. The growth rate anticipated for N demand
is significantly lower than rates forecast for P (+1.7% p.a.) and K (+2.3% p.a.) as the N:P:K ratio is expected
to progressively rebalance in some large fertilizer-consuming countries (Heffer and Prud’homme, 2016).
The highest growth rates for regional N fertilizer demand are anticipated in Africa (+3.3% p.a.), Latin
America (+3.2% p.a.), and Eastern Europe & Central Asia (+2.5% p.a.), three regions with large agricultural
development potential. N fertilizer demand would also expand firmly in South Asia (+2.4% p.a.), supported
by fertilizer subsidy regimes. Latin America would benefit from the competitive advantage of Brazil and
Argentina on the global maize and sugar markets. Similarly, Eastern Europe & Central Asia has the potential
to increase its share of the global cereal export market. South Asian demand is strongly influenced by
fertilizer subsidy regimes, whose evolution is highly unpredictable; high uncertainty is therefore associated
with forecasts for this region. In East Asia, N fertilizer demand growth is forecast to slow further (0.6% p.a.),
as Chinese N and P demand is likely to reach a plateau by the end of the outlook period owing to the
country’s new ‘zero-growth’ policy capping domestic fertilizer use expansion to 1% p.a. between 2015 and

© Proceedings of the 2016 International Nitrogen Initiative Conference, "Solutions to improve nitrogen use efficiency for the world", 4 – 8
December 2016, Melbourne, Australia. www.ini2016.com 6
2020 and prohibiting further growth beyond 2020. Demand in developed countries is anticipated to rise
marginally, with stronger prospects in Oceania (0.0% p.a. in Western & Central Europe; +0.2% p.a. in North
America; and +1.1% p.a. in Oceania). With N demand in China levelling off, about half the world market
can be considered ‘mature’, i.e. with little growth potential. This major change will strongly influence the
medium- to long-term market outlook. In volume terms, South Asia, East Asia and Latin America would
account for 35%, 19% and 19%, respectively, of the anticipated increase in world N fertilizer demand in the
next five years (Heffer and Prud’homme, 2016).
FAO forecasts a slightly stronger growth, with global fertilizer demand seen expanding by 1.6% p.a., from
184.7 Tg in 2014 to 199.0 Tg in 2019. During the same period, FAO sees world N fertilizer demand rising
by 1.2% p.a. vs. 2.0% p.a. for P fertilizers and 2.5% p.a. for K fertilizers (FAO, 2016a). Regional trends
anticipated by FAO are close to the forecasts by Heffer and Prud’homme (2016).
Long-term Projections for World N Fertilizer Demand
Using a crop-based approach, Integer and LMC (2013) have developed fertilizer demand projections to
2030. At the global level, they project that the harvested area would need to increase by 185 million hectares
(Mha) between 2010 and 2030, compared to 1,547 Mha of arable land and permanent crops in 2010
according to FAO (2016b). The bulk of area expansion would come from grains and oilseeds. Integer and
LMC project that, despite some gains in use efficiency, fertilizer application rates would broadly keep pace
with yield growth. They anticipate that global fertilizer demand will grow by 2% p.a. by 2030, with a
progressive rebalancing of the N:P:K ratio. World N demand is projected up by 1.3% p.a., from 101 Tg N in
2010 to 132 Tg N in 2030 in their baseline scenario. In contrast, world demand for P and K fertilizers is set
up by 1.9% p.a. and 3.3% p.a., respectively. In their slow-growth scenario, Integer and LMC see world N
demand reaching 124 Tg N by 2030 vs. 138 Tg N in their fast-growth scenario. They also anticipate
significant changes in the regional contribution to world N fertilizer demand expansion, with China and India
playing a less prominent role compared to the 1990-2010 period. China, India, the United States and the
European Union would remain the top-4 N fertilizer markets. Crop-wise, cereals would account for 46% of
the increase in world N fertilizer demand, followed by fruits and vegetables with a 20% contribution.
Figure 7: Projections to 2030 for global N fertilizer consumption (Tg N)
under three different economic growth scenarios (Integer and LMC, 2013)
In their projection to 2050 for more sustainable N fertilizer management, Zhang et al. (2015) argue that NUE
could and should be increased from 42% to 67% globally between 2010 and 2050 in order not to exceed a
maximum surplus (total N inputs minus total N outputs) of 52 Tg N, compared to 100 Tg N in 2010. It would
require major improvements in N management in some countries consuming large N fertilizer quantities with
low use efficiency and effectiveness. While such a level of progress could be achieved by 2050 is debatable,
Zhang et al. show the potential and need for improvement. Wider adoption of nutrient stewardship,
development of new technologies and policy reforms are anticipated to help this transition.

© Proceedings of the 2016 International Nitrogen Initiative Conference, "Solutions to improve nitrogen use efficiency for the world", 4 – 8
December 2016, Melbourne, Australia. www.ini2016.com 7
Nitrogen Fertilizer Supply
Feedstock and Energy Use Efficiency Trends in Ammonia Production
Globally, ammonia capacity is forecast to continue to expand beyond 2020 (Prud’homme, 2016). Access to
an adequate, affordable supply of energy feedstock is of critical importance to ammonia producers.
Hydrocarbon feedstocks are the raw materials most commonly used in ammonia production. Decoupling
nitrogen production from hydrocarbons is not likely in the foreseeable future. By 2020 natural gas will
contribute 72% of global ammonia capacity compared with 69% in 2015, and will account for most of the
incremental growth over 2015. Coal is projected to account for 26% of the feedstocks used in ammonia
production by 2020. The share of other feedstocks (e.g. naphtha, fuel oil, hydrogen, electricity) would remain
steady at 2% between 2015 and 2020. (Figure 8).
Figure 8: Ammonia feedstock evolution (Tg N) (Prud’homme, 2016)
ROW = rest of the world
China currently accounts for 95% of global ammonia capacity based on coal feedstock. In view of China’s
ample coal reserves, coal gasification technologies have been further developed and are now used
extensively. In 2016, coal-based ammonia capacity represented 82% of total Chinese ammonia capacity,
which is projected to stabilize between 2016 and 2020, after decreasing in 2015 (Figure 9).
Figure 9: China ammonia production capacity evolution by feedstock
(Prud’homme, 2016)
Since 2012 there has been a surge of announcements of new capacity in the United States, spurred by shale
gas development and thus relatively cheap natural gas supply. US ammonia capacity is forecast to increase
45% between 2015 and 2020, recovering to its level of the late 1990s (Prud’homme, 2016).

© Proceedings of the 2016 International Nitrogen Initiative Conference, "Solutions to improve nitrogen use efficiency for the world", 4 – 8
December 2016, Melbourne, Australia. www.ini2016.com 8
Fertilizer production consumes approximately 1.2% of the world’s total energy, ammonia production
accountings for approximately 90% of the fertilizer industry’s total. Large gains in energy efficiency in
ammonia production have been achieved over the past 30 years as ammonia plants are progressively
equipped with advanced technologies. For example, a nitrogen plant built today typically uses 30% less
energy per tonne of ammonia produced than one constructed 40 years ago (IFA, 2014b). The most efficient
plants are performing close to maximum efficiency (Figure 10).
Figure 10: Global energy use efficiency in the fertilizer industry;
results of the 2012 IFA benchmarking survey (IFA, 2014b)
In light of the nitrogen industry’s continued reliance on hydrocarbon feedstocks, the significant energy
savings that continue to be achieved in ammonia production are vitally important.
Nitrogen Fertilizer Production and Trade – Global Trends
Over the period from 2000 to 2013, global fertilizer supply was more than adequate to meet global demand,
with the notable exception of 2007/08 when the emergence of a food crisis led to a spike in demand for
fertilizers. In response to market signals in 2007/08, many companies heavily invested in the following years
in capacity development projects in a number of fertilizer consuming and producing countries.
Between 2003 and 2013, global production of ammonia (the raw material for almost all N fertilizers)
expanded by 29%, from 107.9 to 139.5 Tg N. Out of the ten IFA regions, ammonia production contracted in
West Europe only. The strongest growth in volume was observed in East Asia, with an 18.3 Tg N (or 51%)
output expansion during than 10-year period, driven by fast capacity expansion in China. In relative terms,
the fastest growth took place in West Asia, where the regional ammonia production more than doubled
(+120% or + 6.8 Tg N) thanks to large availabilities of competitively-priced natural gas. Together, East Asia
and West Asia accounted for four-fifths of the expansion in global ammonia production (IFA, 2016b; Figure
11). Stronger growth of global ammonia production vs N fertilizer consumption between 2003 and 2013
(+29% vs. +25%) reflects faster development of industrial uses vs. fertilizer uses of ammonia and its derived
products.

© Proceedings of the 2016 International Nitrogen Initiative Conference, "Solutions to improve nitrogen use efficiency for the world", 4 – 8
December 2016, Melbourne, Australia. www.ini2016.com 9
Figure 11: World ammonia production by region (Tg N) (IFA, 2016b)
Looking at urea, the most commonly used N fertilizer in the world, world production grew by 46% between
2003 and 2013, to 77.9 Tg N. Similarly to ammonia, East Asia and West Asia accounted for the bulk of the
increase in world urea production. During the same period, global urea trade expanded by 55%, to 20.6 Tg N
(IFA, 2016b). West Asia captured most of the export market expansion. East Asia also increased its position
on the export market, reflecting China’s shift from a net importer to a net exporter status over that period. On
the import side, South Asia accounts for most of the global increase (Figure 12).
Figure 12: World urea exports(left) and imports (right) by region (Tg N) (IFA, 2016b)
Medium-term Global Outlook for Global Nitrogen Supply and Supply/Demand Balances
In their fertilizer outlook, Heffer and Prud’homme (2016) note that:
Ammonia: For the first time in a decade, due to the removal of close to 15 million tonnes of ammonia
capacity in China in 2015-2016, capacity in East Asia will show virtually no net growth. Global
ammonia capacity would reach 231 Tg NH3 (eq. 189 Tg N) in 2020, expanding by 9% compared with
2015. Large increases in capacity are expected in Africa, West Asia, North America and Eastern
Europe & Central Asia. Regional Nitrogen deficits are expected to further expand in South Asia,
suggesting growing import demand for nitrogen products in all forms, while regional surpluses are
seen as expanding in Africa, Eastern Europe & Central Asia and, to a lesser extent, West Asia. Global
Nitrogen supply and demand balances point to accelerating potential surpluses in 2017-2018, reaching
a peak in 2018.
Urea: Urea will contribute two-thirds of the projected ammonia capacity increment. Global urea
capacity is projected to increase by +10%, to 231 Tg urea (eq. 106 Tg N) in 2020. On a regional basis,
Africa, North America and Eastern Europe & Central Asia will account for 70% of overall capacity
growth. Global urea supply is estimated at 209 Tg (eq. 96 Tg N) in 2020, growing at 2.1% p.a. over
© Proceedings of the 2016 International Nitrogen Initiative Conference, "Solutions to improve nitrogen use efficiency for the world", 4 – 8
December 2016, Melbourne, Australia. www.ini2016.com 10
2015. Global demand for urea for all uses (including industrial and feed uses) is forecast to increase by
2% p,a. compared with 2015, to 191 Tg (eq. 88 Tg N) in 2020. Latin America and South Asia would
each contribute close to half the global incremental demand. Sizable potential surpluses are expected
to persist during the next five years, reaching 8% of potential supply availability.
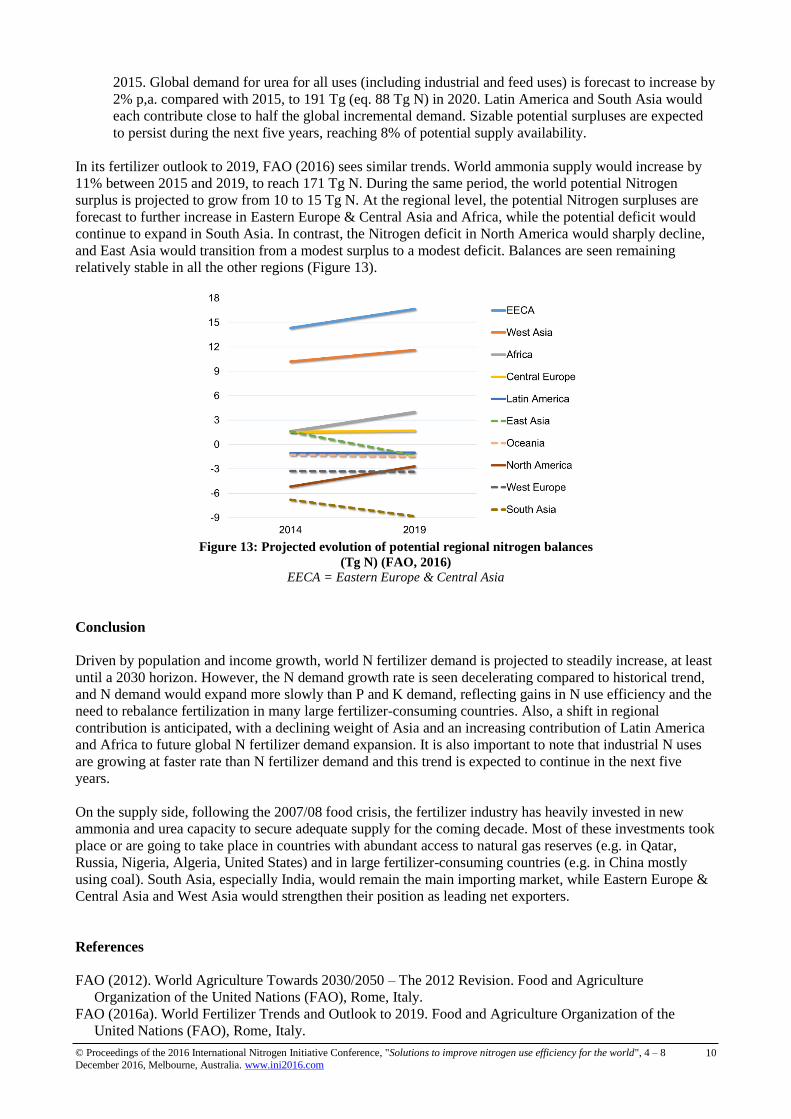
In its fertilizer outlook to 2019, FAO (2016) sees similar trends. World ammonia supply would increase by
11% between 2015 and 2019, to reach 171 Tg N. During the same period, the world potential Nitrogen
surplus is projected to grow from 10 to 15 Tg N. At the regional level, the potential Nitrogen surpluses are
forecast to further increase in Eastern Europe & Central Asia and Africa, while the potential deficit would
continue to expand in South Asia. In contrast, the Nitrogen deficit in North America would sharply decline,
and East Asia would transition from a modest surplus to a modest deficit. Balances are seen remaining
relatively stable in all the other regions (Figure 13).
Figure 13: Projected evolution of potential regional nitrogen balances
(Tg N) (FAO, 2016)
EECA = Eastern Europe & Central Asia
Conclusion
Driven by population and income growth, world N fertilizer demand is projected to steadily increase, at least
until a 2030 horizon. However, the N demand growth rate is seen decelerating compared to historical trend,
and N demand would expand more slowly than P and K demand, reflecting gains in N use efficiency and the
need to rebalance fertilization in many large fertilizer-consuming countries. Also, a shift in regional
contribution is anticipated, with a declining weight of Asia and an increasing contribution of Latin America
and Africa to future global N fertilizer demand expansion. It is also important to note that industrial N uses
are growing at faster rate than N fertilizer demand and this trend is expected to continue in the next five
years.
On the supply side, following the 2007/08 food crisis, the fertilizer industry has heavily invested in new
ammonia and urea capacity to secure adequate supply for the coming decade. Most of these investments took
place or are going to take place in countries with abundant access to natural gas reserves (e.g. in Qatar,
Russia, Nigeria, Algeria, United States) and in large fertilizer-consuming countries (e.g. in China mostly
using coal). South Asia, especially India, would remain the main importing market, while Eastern Europe &
Central Asia and West Asia would strengthen their position as leading net exporters.
References
FAO (2012). World Agriculture Towards 2030/2050 – The 2012 Revision. Food and Agriculture
Organization of the United Nations (FAO), Rome, Italy.
FAO (2016a). World Fertilizer Trends and Outlook to 2019. Food and Agriculture Organization of the
United Nations (FAO), Rome, Italy.
© Proceedings of the 2016 International Nitrogen Initiative Conference, "Solutions to improve nitrogen use efficiency for the world", 4 – 8
December 2016, Melbourne, Australia. www.ini2016.com 11
FAO (2016b). FAOSTAT (http://faostat3.fao.org). Last accessed on 20 September 2016.
Fixen P, Brentrup F, Bruulsema T, Garcia F, Norton R and Zingore S (2014). Nutrient/fertilizer use
efficiency: measurement, current situation and trends. In Managing Water and Fertilizer for Sustainable
Agricultural Intensification; P. Drechsel, P. Heffer, H. Magen, R. Mikkelsen and D. Wichelns (Eds). IFA,
IWMI, IPNI and IPI, Paris, France.
Heffer P (2013). Assessment of Fertilizer Use by Crop at the Global Level, 2010-2010/11. International
Fertilizer Association (IFA), Paris, France.
Heffer P and Prud’homme M (2016). Fertilizer Outlook 2016–2020. International Fertilizer Association
(IFA), Paris, France.
IFA (2014a). IFA Fertilizer Facts “Nitrogen Use Efficiency in Different Parts of the World”. International
Fertilizer Association (IFA), Paris, France.
IFA (2014b). IFA Fertilizer Facts “Ammonia Production: Moving Towards Maximum Efficiency and Lower
GHG Emissions”. International Fertilizer Association (IFA), Paris, France.
IFA (2016a). IFADATA (http://ifadata.fertilizer.org/ucSearch.aspx). Last accessed on 9 September 2016.
IFA (2016b). Production and international trade statistics
(http://www.fertilizer.org//En/Statistics/PIT_Excel_Files.aspx). Last accessed on 4 October 2016.
Integer and LMC (2013). Focus Report “Global Fertilizer Demand: The Long-Term Outlook”. Integer
Research Ltd, London and LMC International, Oxford, UK.
Lassaletta L, Billen G, Grizzetti B, Anglade J and Garnier J (2014). 50 year trends in nitrogen use efficiency
of world cropping systems: the relationship between yield and nitrogen input to cropland. Environ. Res.
Lett., IOP Publishing, 9 (2014).
Norton R, Davidson E and Roberts T (2015). Position Paper - Nitrogen Use Efficiency and Nutrient
Performance Indicators. Global Partnership on Nutrient Management (GPNM), Nairobi, Kenya.
OECD and FAO (2016). OECD-FAO Agricultural Outlook 2016-2025. Organisation for Economic Co-
operation and Development (OECD), Paris, France.
Prud’homme M (2016). Fertilizers and Raw Materials Global Supply 2016-2020. International Fertilizer
Association (IFA), Paris, France. Restricted to IFA members.
Zhang X, Davidson EA, Mauzerall DL, Searchinger TD, Dumas P and Shen Y (2015). Managing nitrogen
for sustainable development. Nature, doi: 10.1038/nature15743.