global ophthalmic devices market: trends, opportunities and forecasts (2015-2020f) - new report by...
TRANSCRIPT
(c) AZOTH Analytics January 2016
Global Ophthalmic Devices (Diagnostic and Treatment) Market: Trends, Opportunities and
Forecasts (2015-2020)• By Type – Diagnostic and Treatment• Diagnostic Devices - By Value, By
Region• Treatment Devices - By Value, By
Region• Key Players – Performance and
Margins• Policy and Regulations
(c) AZOTH Analytics
Table of Content
Figure No.
Title Page No.
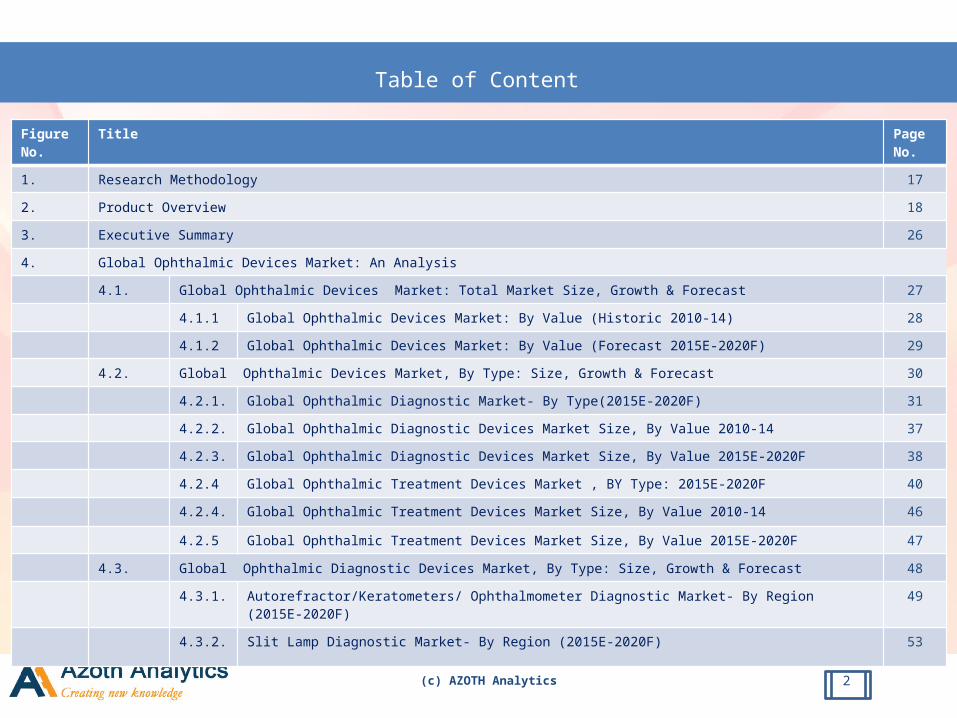
1. Research Methodology 172. Product Overview 183. Executive Summary 264. Global Ophthalmic Devices Market: An Analysis
4.1. Global Ophthalmic Devices Market: Total Market Size, Growth & Forecast 274.1.1 Global Ophthalmic Devices Market: By Value (Historic 2010-14) 284.1.2 Global Ophthalmic Devices Market: By Value (Forecast 2015E-2020F) 29
4.2. Global Ophthalmic Devices Market, By Type: Size, Growth & Forecast 304.2.1. Global Ophthalmic Diagnostic Market- By Type(2015E-2020F) 314.2.2. Global Ophthalmic Diagnostic Devices Market Size, By Value 2010-14 374.2.3. Global Ophthalmic Diagnostic Devices Market Size, By Value 2015E-2020F 384.2.4 Global Ophthalmic Treatment Devices Market , BY Type: 2015E-2020F 404.2.4. Global Ophthalmic Treatment Devices Market Size, By Value 2010-14 46
4.2.5 Global Ophthalmic Treatment Devices Market Size, By Value 2015E-2020F 474.3. Global Ophthalmic Diagnostic Devices Market, By Type: Size, Growth & Forecast 48
4.3.1. Autorefractor/Keratometers/ Ophthalmometer Diagnostic Market- By Region (2015E-2020F) 49
4.3.2. Slit Lamp Diagnostic Market- By Region (2015E-2020F) 53
2
(c) AZOTH Analytics
Table of ContentFigure No.
Page No.
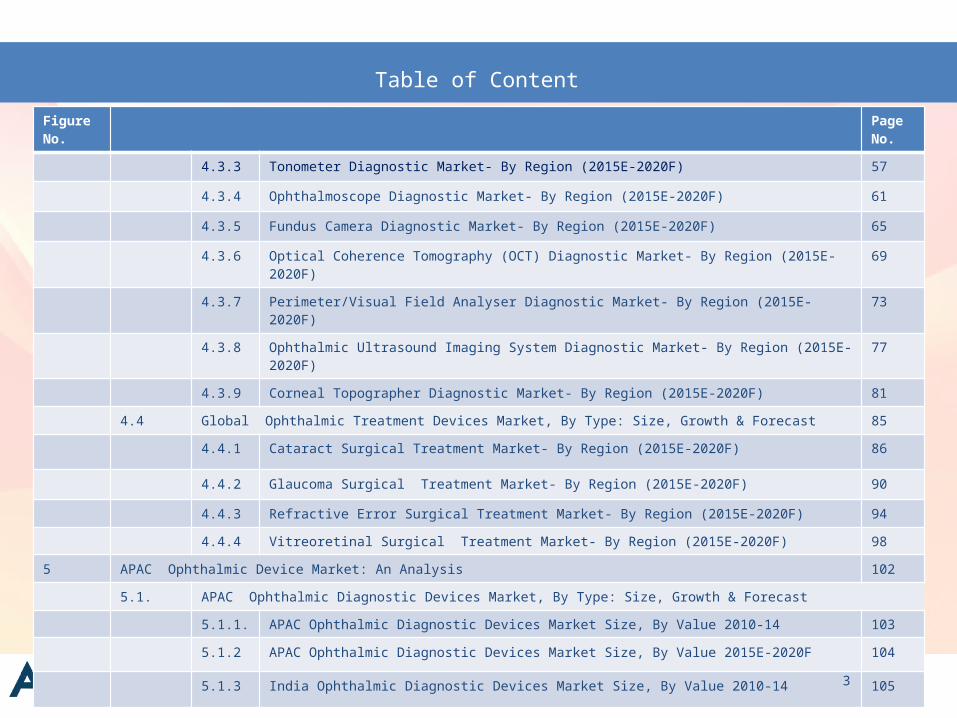
4.3.3 Tonometer Diagnostic Market- By Region (2015E-2020F) 57
4.3.4 Ophthalmoscope Diagnostic Market- By Region (2015E-2020F) 61
4.3.5 Fundus Camera Diagnostic Market- By Region (2015E-2020F) 65
4.3.6 Optical Coherence Tomography (OCT) Diagnostic Market- By Region (2015E-2020F) 69
4.3.7 Perimeter/Visual Field Analyser Diagnostic Market- By Region (2015E-2020F) 73
4.3.8 Ophthalmic Ultrasound Imaging System Diagnostic Market- By Region (2015E-2020F) 77
4.3.9 Corneal Topographer Diagnostic Market- By Region (2015E-2020F) 814.4 Global Ophthalmic Treatment Devices Market, By Type: Size, Growth & Forecast 85
4.4.1 Cataract Surgical Treatment Market- By Region (2015E-2020F) 86
4.4.2 Glaucoma Surgical Treatment Market- By Region (2015E-2020F) 90
4.4.3 Refractive Error Surgical Treatment Market- By Region (2015E-2020F) 944.4.4 Vitreoretinal Surgical Treatment Market- By Region (2015E-2020F) 98
5 APAC Ophthalmic Device Market: An Analysis 1025.1. APAC Ophthalmic Diagnostic Devices Market, By Type: Size, Growth & Forecast
5.1.1. APAC Ophthalmic Diagnostic Devices Market Size, By Value 2010-14 1035.1.2 APAC Ophthalmic Diagnostic Devices Market Size, By Value 2015E-2020F 104
5.1.3 India Ophthalmic Diagnostic Devices Market Size, By Value 2010-14 105
3
(c) AZOTH Analytics
Table of ContentFigure No.
Page No.
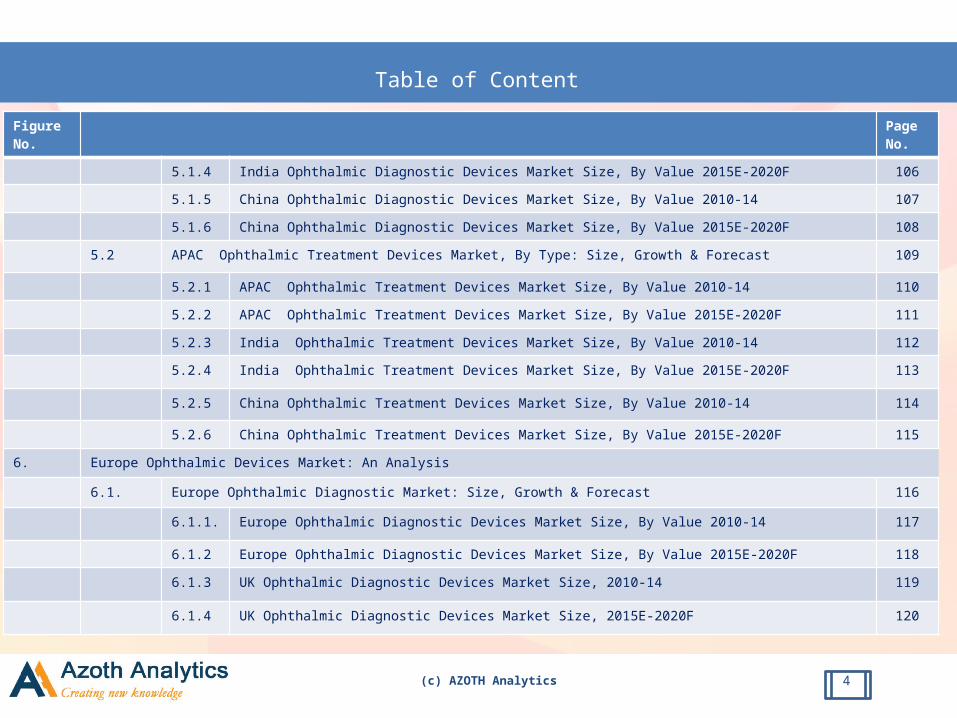
5.1.4 India Ophthalmic Diagnostic Devices Market Size, By Value 2015E-2020F 1065.1.5 China Ophthalmic Diagnostic Devices Market Size, By Value 2010-14 1075.1.6 China Ophthalmic Diagnostic Devices Market Size, By Value 2015E-2020F 108
5.2 APAC Ophthalmic Treatment Devices Market, By Type: Size, Growth & Forecast 109
5.2.1 APAC Ophthalmic Treatment Devices Market Size, By Value 2010-14 1105.2.2 APAC Ophthalmic Treatment Devices Market Size, By Value 2015E-2020F 1115.2.3 India Ophthalmic Treatment Devices Market Size, By Value 2010-14 1125.2.4 India Ophthalmic Treatment Devices Market Size, By Value 2015E-2020F 113
5.2.5 China Ophthalmic Treatment Devices Market Size, By Value 2010-14 114
5.2.6 China Ophthalmic Treatment Devices Market Size, By Value 2015E-2020F 1156. Europe Ophthalmic Devices Market: An Analysis
6.1. Europe Ophthalmic Diagnostic Market: Size, Growth & Forecast 116
6.1.1. Europe Ophthalmic Diagnostic Devices Market Size, By Value 2010-14 117
6.1.2 Europe Ophthalmic Diagnostic Devices Market Size, By Value 2015E-2020F 1186.1.3 UK Ophthalmic Diagnostic Devices Market Size, 2010-14 119
6.1.4 UK Ophthalmic Diagnostic Devices Market Size, 2015E-2020F 120
4
(c) AZOTH Analytics
Table of ContentFigure No.
Page No.
6.1.5 Germany Ophthalmic Diagnostic Devices Market Size, By Value 2010-14 1216.1.6 Germany Ophthalmic Diagnostic Devices Market Size, By Value 2015E-2020F 122
6.2 Europe Ophthalmic Treatment Market: Size, Growth & Forecast 1236.2.1 Europe Ophthalmic Treatment Devices Market Size, By Value 2010-14 1246.2.2 Europe Ophthalmic Treatment Devices Market Size, By Value 2015E-2020F 1256.2.3 UK Ophthalmic Treatment Devices Market Size, By Value 2010-14 1266.2.4 UK Ophthalmic Treatment Devices Market Size, By Value 2015E-2020F 1276.2.5 Germany Ophthalmic Treatment Devices Market Size, By Value 2010-14 1286.2.6 Germany Ophthalmic Treatment Devices Market Size, By Value 2015E-2020F 129
7. Middle East Ophthalmic Devices Market : An Analysis7.1 Middle East Ophthalmic Diagnostic Devices Market: Size, Growth & Forecast 130
7.1.1 Middle East Ophthalmic Diagnostic Devices Market Size, By Value 2010-14 1317.1.2 Middle East Ophthalmic Diagnostic Devices Market Size, By Value 2015E-2020F 1327.1.3 UAE Ophthalmic Diagnostic Devices Market Size, 2010-14 1337.1.4 UAE Ophthalmic Diagnostic Devices Market Size, 2015E-2020F 1347.1.5 Saudi Arabia Ophthalmic Diagnostic Devices Market Size, By Value 2010-14 1357.1.6 Saudi Arabia Ophthalmic Diagnostic Devices Market Size, By Value 2015E-2020F 136
5
(c) AZOTH Analytics
Table of Content
Figure No.
Page No.
7.2 Middle East Ophthalmic Treatment Market 1377.2.1 Middle East Ophthalmic Treatment Devices Market Size, By Value 2010-14 1387.2.2 Middle East Ophthalmic Treatment Devices Market , By Value 2015E-2020F 1397.2.3 UAE Ophthalmic Treatment Devices Market Size, By Value 2010-14 1407.2.4 UAE Ophthalmic Treatment Devices Market Size, By Value 2015E-2020F 1417.2.5 Saudi Arabia Ophthalmic Treatment Devices Market Size, By Value 2010-14 1427.2.6 Saudi Arabia Ophthalmic Treatment Devices Market Size, By Value 2015E-2020F 143
8. The Americas Ophthalmic Devices Market : An Analysis8.1 The Americas Ophthalmic Diagnostic Devices Market 144
8.1.1 The Americas Ophthalmic Diagnostic Devices Market Size, By Value 2010-14 1458.1.2 The Americas Ophthalmic Diagnostic Devices Market Size, By Value 2015E-2020F 146
8.1.3 USA Ophthalmic Diagnostic Devices Market Size, By Value 2010-14 1478.1.4 USA Ophthalmic Diagnostic Devices Market Size, By Value 2015E-2020F 1488.1.5 Brazil Ophthalmic Diagnostic Devices Market Size, By Value 2010-14 1498.1.6 Brazil Ophthalmic Diagnostic Devices Market Size, 2015E-2020F 150
8.2 The Americas Ophthalmic Treatment Market 1518.2.1 The Americas Ophthalmic Treatment Devices Market Size, By Value 2010-14 152
6

(c) AZOTH Analytics
Table of Content
Figure No.
Page No.
8.2.2 The Americas Ophthalmic Treatment Devices Market Size, By Value 2015E-2020F 1538.2.3 USA Ophthalmic Treatment Devices Market Size, By Value 2010-14 1548.2.4 USA Ophthalmic Treatment Devices Market Size, By Value 2015E-2020F 1558.2.5 Brazil Ophthalmic Treatment Devices Market Size, By Value 2010-14 1568.2.6 Brazil Ophthalmic Treatment Devices Market Size, By Value 2015E-2020F 157
9. Africa Ophthalmic Devices Market : An Analysis9.1 Africa Ophthalmic Diagnostic Devices Market 158
9.1.1 Africa Ophthalmic Diagnostic Devices Market Size, By Value 2010-14 1599.1.2 Africa Ophthalmic Diagnostic Devices Market Size, By Value 2015E-2020F 1609.1.3 South Africa Ophthalmic Diagnostic Devices Market Size, By Value 2010-14 1619.1.4 South Africa Ophthalmic Diagnostic Devices Market Size, By Value 2015E-2020F 162
9.2 Africa Ophthalmic Treatment Devices Market Size 1639.2.1 Africa Ophthalmic Treatment Devices Market Size, By Value 2010-14 1649.2.2 Africa Ophthalmic Treatment Devices Market Size, By Value 2015E-2020F 1659.2.3 South Africa Ophthalmic Treatment Devices Market Size, By Value 2010-14 1669.2.4 South Africa Ophthalmic Treatment Devices Market Size, By Value 2015E-2020F 167
10 Regulatory Overview 168
7
(c) AZOTH Analytics
Table of ContentFigure No.
Page No.
11. Market Trends and Developments 17212. Market Dynamics 178
12.1 Drivers and Challenges 17913. Porter Five Forces Analysis 18614. SWOT Analysis 18815. Competitive Landscape 189
15.1 Competitive Benchmarking15.1.1 Sales Comparatives, Top 5 Companies 19015.1.2 EBITDA Comparatives, Top 5 Companies 19115.1.3 EBIT Comparatives, Top 5 Companies 19215.1.4 PBT Comparatives, Top 5 Companies 19315.1.5 PAT Comparatives, Top 5 Companies 19415.1.6 Current Ratio Comparatives, Top 5 Companies 19515.1.7 Profit Margin Ratio Comparatives, Top 5 Companies 19615.1.8 Debt-Equity Ratio Comparatives, Top 5 Companies 197
15.2 Company Profiling 19815.2.1 Aurolab 199
8
(c) AZOTH Analytics
Table of Content
Figure No. Title Page No.
15.2.2 HOYA Corporation 20215.2.3 Abbott Medical Optics (AMO) 20615.2.4 Topcon Corporation 210152.5 Novartis AG 21315.2.6 Valeant Pharmaceuticals Pvt. Ltd. 21715.2.7 Carl Zeiss Meditec AG 22115.2.8 Essilor International 22515.2.9 Nidek Co., Ltd 22815.2.10 Haag Streit 232
16. Strategic Recommendation 23517. About us & Disclaimer 240
9

(c) AZOTH Analytics
List of FiguresFigure No. Title Page
No.Figure 1: Types of Ophthalmic Devices 18
Figure 2: Types of Diagnostic Devices 19Figure 3: Types of Ophthalmic Treatment Devices 22Figure 4: Global Ophthalmic Devices Market Size, 2010-2014 (USD Billion) 28Figure 5: Global Ophthalmic Devices Market Size, 2015E-2020F (USD Billion) 29Figure 6: Global Ophthalmic Diagnostic Market- By Type, 2015 31
Figure 7: Global Ophthalmic Diagnostic Market- By Type, 2020E 31Figure 8: Global Ophthalmic Diagnostic Devices Market Size, 2010-2014 (USD Billion) 37Figure 9: Global Ophthalmic Diagnostic Devices Market Size, 2015E-2020F (USD Billion) 38Figure 10: Global Ophthalmic Treatment Market- By Type, 2015 (USD Billion) 40
Figure 11: Global Ophthalmic Treatment Market- By Type, 2020E (USD Billion) 40
Figure 12: Global Ophthalmic Treatment Devices Market Size, 2010-2014 (USD Billion) 46Figure 13: Global Ophthalmic Treatment Devices Market Size, 2015E-2020F (USD Billion) 47Figure 14: Autorefractor/Keratometers/ Ophthalmometer Diagnostic Market- By Region, 2015 49Figure 15: Autorefractor/Keratometers/ Ophthalmometer Diagnostic Market- By Region, 2020E 49Figure 16: Slit Lamp Diagnostic Market- By Region, 2015 53Figure 17: Slit Lamp Diagnostic Market- By Region, 2020E 53Figure 18: Tonometer Diagnostic Market- By Region, 2015 57Figure 19: Tonometer Diagnostic Market- By Region, 2020E 57
10

(c) AZOTH Analytics
List of FiguresFigure No. Title Page No.Figure 20: Ophthalmoscope Diagnostic Market- By Region, 2015 61Figure 21: Ophthalmoscope Diagnostic Market- By Region, 2020E 61Figure 22: Fundus Camera Diagnostic Market- By Region, 2015 65Figure 23: Fundus Camera Diagnostic Market- By Region, 2020E 65Figure 24: Optical Coherence Tomography (OCT) Diagnostic Market- By Region, 2015 69Figure 25: Optical Coherence Tomography (OCT) Diagnostic Market- By Region, 2020E 69Figure 26: Perimeter Diagnostic Market- By Region, 2015 73Figure 27: Perimeter Diagnostic Market- By Region, 2020E 73Figure 28: Ophthalmic Ultrasound Imaging System Diagnostic Market- By Region, 2015 77Figure 29: Ophthalmic Ultrasound Imaging System Diagnostic Market- By Region, 2020E 77Figure 30: Corneal Topographer Diagnostic Market- By Region, 2015 81Figure 31: Corneal Topographer Diagnostic Market- By Region, 2020E 81Figure 32: Cataract Surgical Treatment Market- By Region, 2015 86Figure 33: Cataract Surgical Treatment Market- By Region, 2020E 86Figure 34: Glaucoma Surgical Treatment Market- By Region, 2015 90Figure 35: Glaucoma Surgical Treatment Market- By Region, 2020E 90Figure 36: Refractive Error Surgical Treatment Market- By Region, 2015 94Figure 37: Refractive Error Surgical Treatment Market- By Region, 2020E 94Figure 38: Vitreoretinal Surgical Treatment Market- By Region, 2015 98Figure 39: Vitreoretinal Surgical Treatment Market- By Region, 2020E 98
11

(c) AZOTH Analytics
List of FiguresFigure No. Title Page No.Figure 40: APAC Ophthalmic Diagnostic Devices Market Size, 2010-2014 (USD Billion) 103Figure 41: APAC Ophthalmic Diagnostic Devices Market Size, 2015E-2020F (USD Billion) 104Figure 42: India Ophthalmic Diagnostic Devices Market Size, 2010-2014 (USD Billion) 105Figure 43: India Ophthalmic Diagnostic Devices Market Size, 2015E-2020F (USD Billion) 106Figure 44: China Ophthalmic Diagnostic Devices Market Size, 2010-2014 (USD Billion) 107Figure 45: China Ophthalmic Diagnostic Devices Market Size, 2015E-2020F (USD Billion) 108Figure 46: APAC Ophthalmic Treatment Devices Market Size, 2010-2014 (USD Billion) 110Figure 47: APAC Ophthalmic Treatment Devices Market Size, 2015E-2020F (USD Billion) 111Figure 48: India Ophthalmic Treatment Devices Market Size, 2010-2014 (USD Billion) 112Figure 49: India Ophthalmic Treatment Devices Devices Market Size, 2015E-2020F (USD Billion) 113Figure 50: China Ophthalmic Treatment Devices Market Size, 2010-2014 (USD Billion) 114Figure 51: China Ophthalmic Treatment Devices Market Size, 2015E-2020F (USD Billion) 115Figure 52: Europe Ophthalmic Diagnostic Devices Market Size, 2010-2014 (USD Billion) 117Figure 53: Europe Ophthalmic Diagnostic Devices Market Size, 2015E-2020F (USD Billion) 118Figure 54: UK Ophthalmic Diagnostic Devices Market Size, 2010-2014 (USD Billion) 119Figure 55: UK Ophthalmic Diagnostic Devices Market Size, 2015E-2020F (USD Billion) 120Figure 56: Germany Ophthalmic Diagnostic Devices Market Size, 2010-2014 (USD Billion) 121Figure 57: Germany Ophthalmic Diagnostic Devices Market Size, 2015E-2020F (USD Billion) 122Figure 58: Europe Ophthalmic Treatment Devices Market Size, 2010-2014 (USD Billion) 124Figure 59: Europe Ophthalmic Treatment Devices Market Size, 2015E-2020F (USD Billion) 125
12

(c) AZOTH Analytics
List of FiguresFigure No. Title Page No.Figure 60: UK Ophthalmic Treatment Devices Market Size, 2010-2014 (USD Billion) 126Figure 61: UK Ophthalmic Treatment Devices Market Size, 2015E-2020F (USD Billion) 127Figure 62: Germany Ophthalmic Treatment Devices Market Size, 2010-2014 (USD Billion) 128Figure 63: Germany Ophthalmic Treatment Devices Market Size, 2015E-2020F (USD Billion) 129Figure 64: Middle East Ophthalmic Diagnostic Devices Market Size, 2010-2014 (USD Billion) 131Figure 65: Middle East Ophthalmic Diagnostic Devices Market Size, 2015E-2020F (USD Billion) 132Figure 66: UAE Ophthalmic Diagnostic Devices Market Size, 2010-2014 (USD Billion) 133Figure 67: UAE Ophthalmic Diagnostic Devices Market Size, 2015E-2020F (USD Billion) 134Figure 68: Saudi Arabia Ophthalmic Diagnostic Devices Market Size, 2010-2014 (USD Billion) 135Figure 69: Saudi Arabia Ophthalmic Diagnostic Devices Market Size, 2015E-2020F (USD Billion) 136Figure 70: Middle East Ophthalmic Treatment Devices Market Size, 2010-2014 (USD Billion) 138Figure 71: Middle East Ophthalmic Treatment Devices Market Size, 2015E-2020F (USD Billion) 139Figure 72: UAE Ophthalmic Treatment Devices Market Size, 2010-2014 (USD Billion) 140Figure 73: UAE Ophthalmic Treatment Devices Market Size, 2015E-2020F (USD Billion) 141Figure 74: Saudi Arabia Ophthalmic Treatment Devices Market Size, 2010-2014 (USD Billion) 142Figure 75: Saudi Arabia Ophthalmic Treatment Devices Market Size, 2015E-2020F (USD Billion 143Figure 76: The Americas Ophthalmic Diagnostic Devices Market Size, 2010-2014 (USD Billion) 145Figure 77: The Americas Ophthalmic Diagnostic Devices Market Size, 2015E-2020F (USD Billion) 146Figure 78: USA Ophthalmic Diagnostic Devices Market Size, 2010-2014 (USD Billion) 147Figure 79: USA Ophthalmic Diagnostic Devices Market Size, 2015E-2020F (USD Billion) 148
13
(c) AZOTH Analytics
List of FiguresFigure No. Title Page No.Figure 80: Brazil Ophthalmic Diagnostic Devices Market Size, 2010-2014 (USD Billion) 149Figure 81: Brazil Ophthalmic Diagnostic Devices Market Size, 2015E-2020F (USD Billion) 150Figure 82: The Americas Ophthalmic Treatment Devices Market Size, 2010-2014 (USD Billion 152Figure 83: The Americas Ophthalmic Treatment Devices Market Size, 2015E-2020F (USD Billion) 153Figure 84: USA Ophthalmic Treatment Devices Market Size, 2010-2014 (USD Billion) 154Figure 85: USA Ophthalmic Treatment Devices Market Size, 2015E-2020F (USD Billion) 155Figure 86: Brazil Ophthalmic Treatment Devices Market Size, 2010-2014 (USD Billion) 156Figure 87: Brazil Ophthalmic Treatment Devices Market Size, 2015E-2020F (USD Billion) 157Figure 88: Africa Ophthalmic Diagnostic Devices Market Size, 2010-2014 (USD Billion) 159Figure 89: Africa Ophthalmic Diagnostic Devices Market Size, 2015E-2020F (USD Billion) 160Figure 90: South Africa Ophthalmic Diagnostic Devices Market Size, 2010-2014 (USD Billion 161Figure 91: South Africa Ophthalmic Diagnostic Devices Market Size, 2015E-2020F (USD Billion) 162Figure 92: Africa Ophthalmic Treatment Devices Market Size, 2010-2014 (USD Billion) 164Figure 93: Africa Ophthalmic Treatment Devices Market Size, 2015E-2020F (USD Billion) 165Figure 94: South Africa Ophthalmic Treatment Devices Market Size, 2010-2014 (USD Billion) 166Figure 95: South Africa Ophthalmic Treatment Devices Market Size, 2015E-2020F (USD Billion) 167Figure 96: Aurolab Financials (USD Million) 2011-2015 199Figure 97: HOYA Financials (USD Million) 2011-2015 202Figure 98: HOYA Percentage Revenue, By Business Segment (2015) 203Figure 99: HOYA Percentage Revenue, By Geography (2015) 203
14
(c) AZOTH Analytics
List of FiguresFigure No. Title Page No.Figure 100: AMO Revenue (USD Million) AY 2011-2014 206Figure 101: AMO Percentage Revenue, By Business Segment (2014 ) 207Figure 102: AMO Percentage Revenue, By Geography (2014) 207Figure 103: Topcon Corporation Revenue (USD Million) 2011-2015 (Mar’ended) 210Figure 104: Topcon Percentage Revenue, By Business Segment (2014) 211Figure 105: Topcon Percentage Revenue, By Geography (2014) 211Figure 106: Novartis AG Revenue (USD Million) AY 2011-2014 213Figure 107: Novartis AG Percentage Revenue, By Business Segment (2014) 214Figure 108: Novartis AG Percentage Revenue, By Geography (2014) 214Figure 109: Valeant Pharmaceuticals Revenue (USD Million) 2011-2014 217Figure 110: Valeant Pharmaceuticals Percentage Revenue, By Product Segment (2014) 218Figure 111: Valeant Pharmaceuticals Percentage Revenue, By Geography (2014) 218Figure 112: Valeant Pharmaceuticals Percentage Revenue, By Markets (2014) 218Figure 113: Carl Zeiss Meditec AG Revenue (USD Million) 2011-2014 (Sep’ended) 221Figure 114: Carl Zeiss Percentage Revenue, By Business Segment (2014) 222Figure 115: Carl Zeiss Percentage Revenue, By Geography (2014) 222Figure 116: Essilor Intrenational Revenue (USD Million) AY 2011-2014 225Figure 117: Essilor Percentage Revenue, By Business Segment (2014) 226Figure 118: Essilor Percentage Revenue of Lenses and optical Instruments, By Geography (2014) 226Figure 119: Nidek Co. Ltd. Revenue (USD Million) FY 2014 228
15
(c) AZOTH Analytics
List of FiguresFigure No. Title Page No.Figure 120: Nidek Co., Ltd. Percentage Global Share, By Global Ophthalmic Laser Market (2014) 229Figure 121: Haag Streit UK Ltd. Revenue (USD Million) AY 2011-2014 232
16
(c) AZOTH Analytics
Research MethodologyResearch Definition
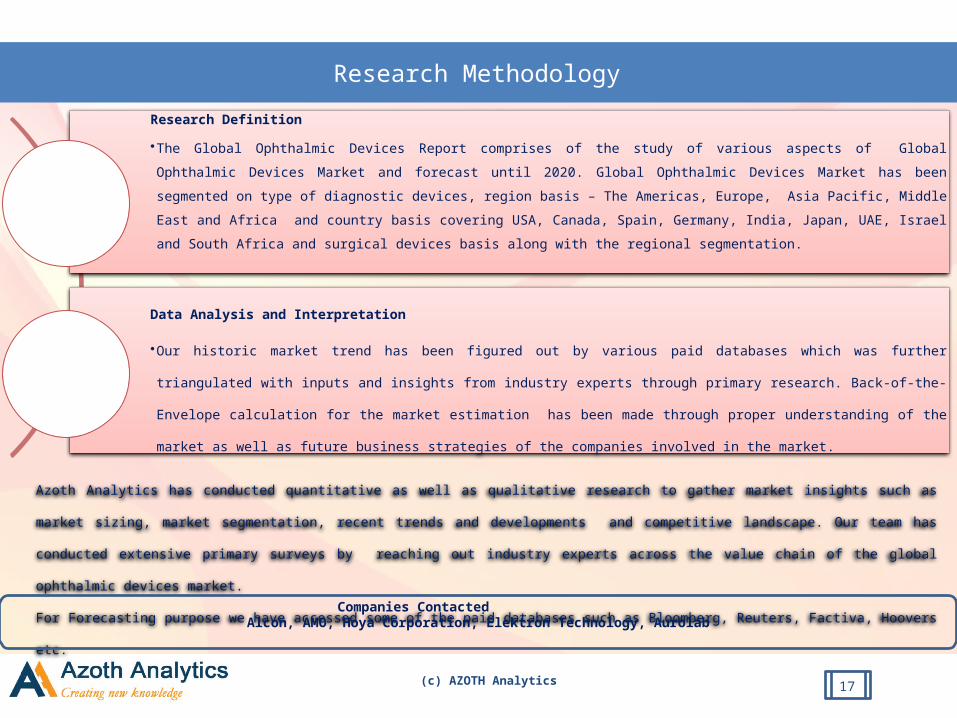
•The Global Ophthalmic Devices Report comprises of the study of various aspects of Global Ophthalmic Devices Market and forecast until 2020. Global Ophthalmic Devices Market has been segmented on type of diagnostic devices, region basis – The Americas, Europe, Asia Pacific, Middle East and Africa and country basis covering USA, Canada, Spain, Germany, India, Japan, UAE, Israel and South Africa and surgical devices basis along with the regional segmentation.
Data Analysis and Interpretation
•Our historic market trend has been figured out by various paid databases which was further triangulated with inputs
and insights from industry experts through primary research. Back-of-the-Envelope calculation for the market
estimation has been made through proper understanding of the market as well as future business strategies of the
companies involved in the market.
Azoth Analytics has conducted quantitative as well as qualitative research to gather market insights such as market sizing, market
segmentation, recent trends and developments and competitive landscape. Our team has conducted extensive primary surveys by
reaching out industry experts across the value chain of the global ophthalmic devices market.
For Forecasting purpose we have accessed some of the paid databases such as Bloomberg, Reuters, Factiva, Hoovers etc.Companies Contacted Alcon, AMO, Hoya Corporation, Elektron Technology, Aurolab
17
(c) AZOTH Analytics
Global Ophthalmic Devices Market Size, By Value
• .
2010 2011 2012 2013 2014
xxxxxx
xxxxxx
xxx
Source: Azoth Analytics
CAGR: xxx%
Figure : Global Ophthalmic Devices Market Size,
2010-2014 (USD Billion)
Source: Azoth Analytics
Figure : Global Ophthalmic Devices Market Size,
2015E-2020F (USD Billion)
Source: Azoth Analytics
Figure : Global Ophthalmic Diagnostic Devices
Market Size, 2010-2014 (USD Billion)
Source: Azoth Analytics
Figure : Global Ophthalmic Diagnostic Devices
Market Size, 2015E-2020F (USD Billion)
2010 2011 2012 2013 2014
xxxxxx
xxxxxx
xxxCAGR: xxx%
2010 2011 2012 2013 2014
xxxxxx
xxxxxx
xxxCAGR: xxx%
2010 2011 2012 2013 2014
xxxxxx
xxxxxx
xxxCAGR: xxx%
18
(c) AZOTH Analytics
Global Ophthalmic Devices Market Size, By Value
• .
Source: Azoth Analytics
Figure : Global Ophthalmic Treatment Devices
Market Size, 2010-2014 (USD Billion)
Source: Azoth Analytics
Figure : Global Ophthalmic Treatment Market
Size, 2015E-2020F (USD Billion)
Source: Azoth Analytics
Figure : Global Ophthalmic Diagnostic Devices
Market Size, 2010-2014 (USD Billion)
Source: Azoth Analytics
Figure : Global Ophthalmic Diagnostic Devices
Market Size, 2015E-2020F (USD Billion)
2010 2011 2012 2013 2014
xxxxxx
xxxxxx
xxxCAGR: xxx%
2010 2011 2012 2013 2014
xxxxxx
xxxxxx
xxxCAGR: xxx%
2010 2011 2012 2013 2014
xxxxxx
xxxxxx
xxxCAGR: xxx%
2010 2011 2012 2013 2014
xxxxxx
xxxxxx
xxxCAGR: xxx%
19

(c) AZOTH Analytics
Global Ophthalmic Diagnostic Devices Market Size, By Value
• .
Figure 6: Global Ophthalmic Diagnostic Market- By Type, 2015E (in USD Million)
XX
XX
XX
XX
XXXX
XX
XX
XX
XX
Autorefractor/Keratometers/ ophthalmometerSlit LampTonometersOphthalmoscopeFundus CameraOptical Coherence Tomography/GonioscopyPerimeterOphthalmic UltrasoundTopographyOthers
Figure 7: Global Ophthalmic Diagnostic Market- By Type, 2020F
XX
XX
XX
XX
XXXX
XX
XX
XX
XX
Autorefractor/Keratometers/ ophthalmometerSlit LampTonometersOphthalmoscopeFundus CameraOptical Coherence Tomography/GonioscopyPerimeterOphthalmic UltrasoundTopographyOthers
20
(c) AZOTH Analytics
Global Ophthalmic Diagnostic Devices Market Size, By Value
• .
Figure 10: Global Ophthalmic Treatment Market- By Type, 2015E (USD Billion)
XX
XXXX
XX
Cataract Treatment Devices Glaucoma Treatment Devices
Vitreoretinal Surgical Devices Refractive Error Surgical Devices
Figure 11: Global Ophthalmic Treatment Market- By Type, 2020F (USD Billion)
XX
XXXX
XX
Cataract Treatment Devices Glaucoma Treatment Devices
Vitreoretinal Surgical Devices Refractive Error Surgical Devices
21
(c) AZOTH Analytics
Global Ophthalmic Diagnostic Devices Market Size, By Value
• .
Figure : Autorefractor/Keratometers/ Ophthalmometer Diagnostic Market- By Region, 2015
xxx%
xxx%
xxx%
xxx%
xxx% AsiaEuropeME AfricaAmericas
Figure : Autorefractor/Keratometers/ Ophthalmometer Diagnostic Market- By Region, 2020E
Figure : Slit Lamp Diagnostic Market- By Region, 2015 Figure : Slit Lamp Diagnostic Market- By Region, 2020E
xxx%
xxx%
xxx%
xxx%
xxx% AsiaEuropeME AfricaAmericas
xxx%
xxx%
xxx%
xxx%
xxx% AsiaEuropeME AfricaAmericas
xxx%
xxx%
xxx%
xxx%
xxx% AsiaEuropeME AfricaAmericas
22

(c) AZOTH Analytics
Global Ophthalmic Diagnostic Devices Market Size, By Value
• .
Figure : Autorefractor/Keratometers/ Ophthalmometer Diagnostic Market- By Region, 2015
Figure : Autorefractor/Keratometers/ Ophthalmometer Diagnostic Market- By Region, 2020E
Figure : Slit Lamp Diagnostic Market- By Region, 2015 Figure : Slit Lamp Diagnostic Market- By Region, 2020E
xxx%
xxx%
xxx%
xxx%
xxx% AsiaEuropeME AfricaAmericas
xxx%
xxx%
xxx%
xxx%
xxx% AsiaEuropeME AfricaAmericas
xxx%
xxx%
xxx%
xxx%
xxx% AsiaEuropeME AfricaAmericas
xxx%
xxx%
xxx%
xxx%
xxx% AsiaEuropeME AfricaAmericas
23

(c) AZOTH Analytics
Global Ophthalmic Diagnostic Devices Market Size, By Value
• .
Figure : Tonometer Diagnostic Market- By Region, 2015
Figure : Tonometer Diagnostic Market- By Region, 2020E
Figure: Ophthalmoscope Diagnostic Market- By Region, 2015
Figure : Ophthalmoscope Diagnostic Market- By Region, 2020E
xxx%
xxx%
xxx%
xxx%
xxx% AsiaEuropeME AfricaAmericas
xxx%
xxx%
xxx%
xxx%
xxx% AsiaEuropeME AfricaAmericas
xxx%
xxx%
xxx%
xxx%
xxx% AsiaEuropeME AfricaAmericas
xxx%
xxx%
xxx%
xxx%
xxx% AsiaEuropeME AfricaAmericas
24
(c) AZOTH Analytics
Global Ophthalmic Diagnostic Devices Market Size, By Value
• .
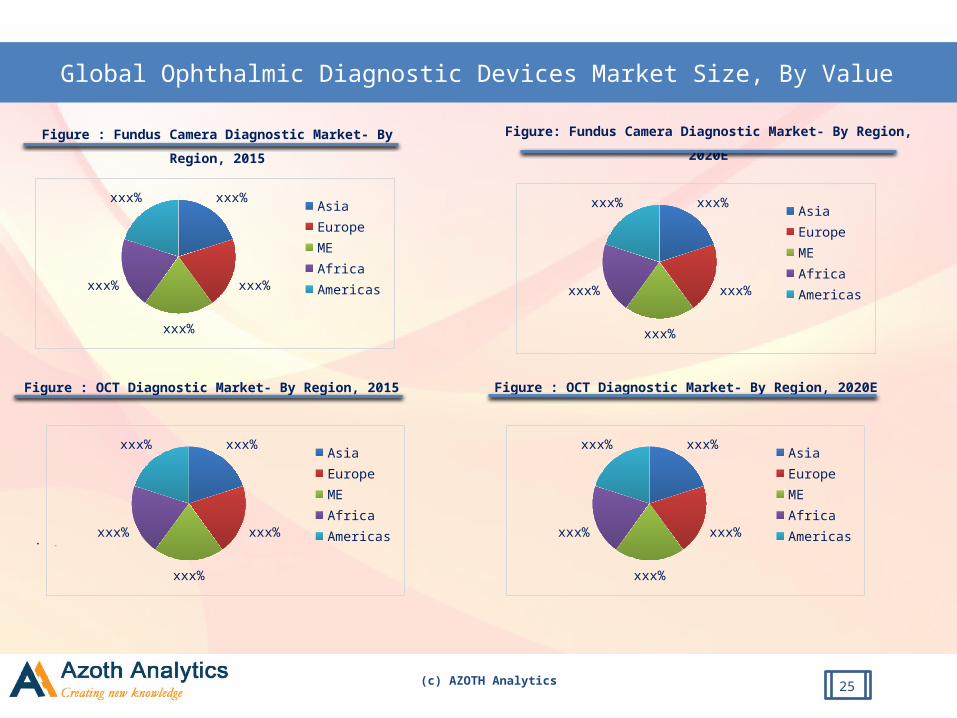
Figure : Fundus Camera Diagnostic Market- By Region, 2015
Figure: Fundus Camera Diagnostic Market- By Region, 2020E
Figure : OCT Diagnostic Market- By Region, 2015 Figure : OCT Diagnostic Market- By Region, 2020E
xxx%
xxx%
xxx%
xxx%
xxx% AsiaEuropeME AfricaAmericas
xxx%
xxx%
xxx%
xxx%
xxx% AsiaEuropeME AfricaAmericas
xxx%
xxx%
xxx%
xxx%
xxx% AsiaEuropeME AfricaAmericas
xxx%
xxx%
xxx%
xxx%
xxx% AsiaEuropeME AfricaAmericas
25
(c) AZOTH Analytics
Global Ophthalmic Diagnostic Devices Market Size, By Value
• .
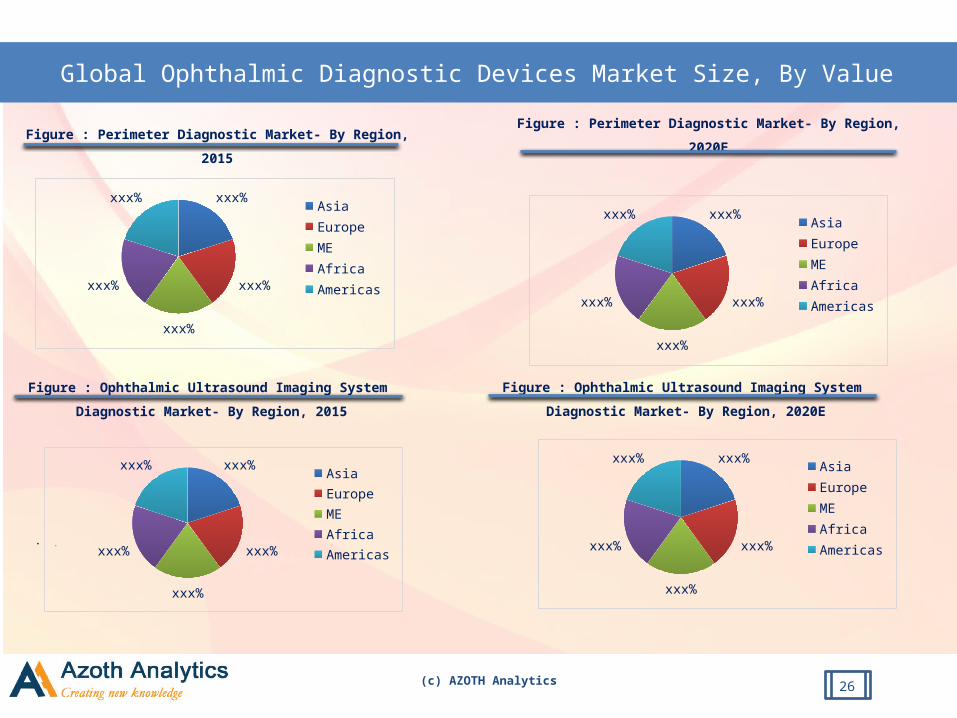
Figure : Perimeter Diagnostic Market- By Region, 2015
Figure : Perimeter Diagnostic Market- By Region, 2020E
Figure : Ophthalmic Ultrasound Imaging System Diagnostic Market- By Region, 2015
Figure : Ophthalmic Ultrasound Imaging System Diagnostic Market- By Region, 2020E
xxx%
xxx%
xxx%
xxx%
xxx% AsiaEuropeME AfricaAmericas
xxx%
xxx%
xxx%
xxx%
xxx% AsiaEuropeME AfricaAmericas
xxx%
xxx%
xxx%
xxx%
xxx% AsiaEuropeME AfricaAmericas
xxx%
xxx%
xxx%
xxx%
xxx% AsiaEuropeME AfricaAmericas
26

(c) AZOTH Analytics
Global Ophthalmic Diagnostic Devices Market Size, By Value
• .
Figure : Corneal Topographer Diagnostic Market- By Region, 2015
Figure : Corneal Topographer Diagnostic Market- By Region, 2020E
Figure : Ophthalmic Ultrasound Imaging System Diagnostic Market- By Region, 2015
Figure : Ophthalmic Ultrasound Imaging System Diagnostic Market- By Region, 2020E
xxx%
xxx%
xxx%
xxx%
xxx% AsiaEuropeME AfricaAmericas
xxx%
xxx%
xxx%
xxx%
xxx% AsiaEuropeME AfricaAmericas
xxx%
xxx%
xxx%
xxx%
xxx% AsiaEuropeME AfricaAmericas
xxx%
xxx%
xxx%
xxx%
xxx% AsiaEuropeME AfricaAmericas
27

(c) AZOTH Analytics
Global Ophthalmic Treatment Devices Market Size, By Value
• .
Figure : Cataract Surgical Treatment Market- By Region, 2015
Figure : Cataract Surgical Treatment Market- By Region, 2020E
Figure: Glaucoma Surgical Treatment Market- By Region, 2015
Figure : Glaucoma Surgical Treatment Market- By Region, 2020E
xxx%
xxx%
xxx%
xxx%
xxx% AsiaEuropeME AfricaAmericas
xxx%
xxx%
xxx%
xxx%
xxx% AsiaEuropeME AfricaAmericas
xxx%
xxx%
xxx%
xxx%
xxx% AsiaEuropeME AfricaAmericas
xxx%
xxx%
xxx%
xxx%
xxx% AsiaEuropeME AfricaAmericas
28
(c) AZOTH Analytics
Global Ophthalmic Treatment Devices Market Size, By Value
• .
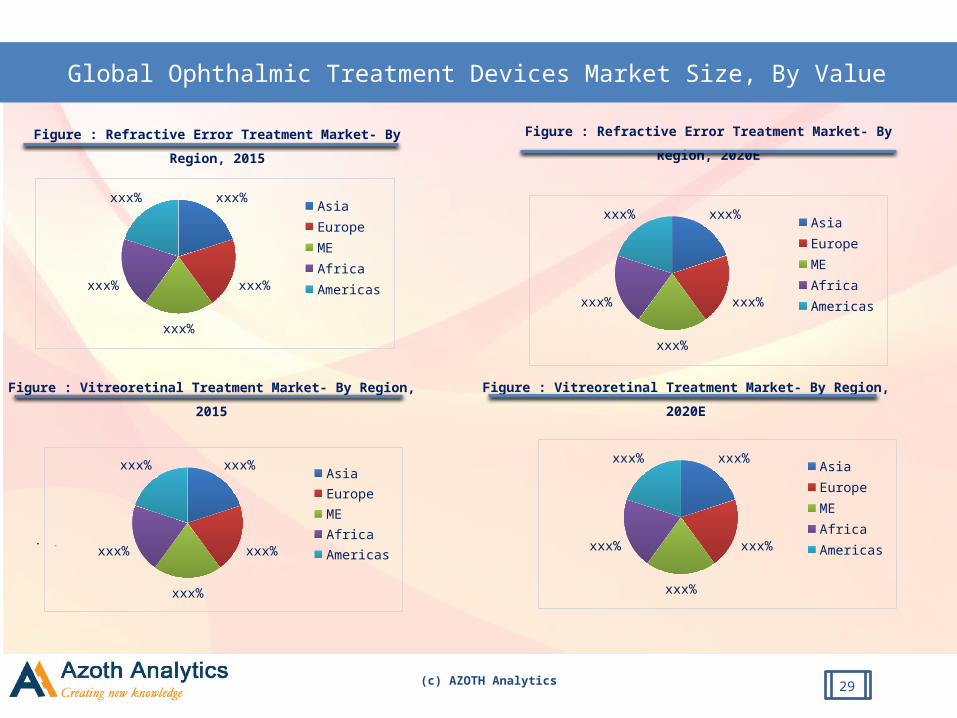
Figure : Refractive Error Treatment Market- By Region, 2015
Figure : Refractive Error Treatment Market- By Region, 2020E
Figure : Vitreoretinal Treatment Market- By Region, 2015
Figure : Vitreoretinal Treatment Market- By Region, 2020E
xxx%
xxx%
xxx%
xxx%
xxx% AsiaEuropeME AfricaAmericas
xxx%
xxx%
xxx%
xxx%
xxx% AsiaEuropeME AfricaAmericas
xxx%
xxx%
xxx%
xxx%
xxx% AsiaEuropeME AfricaAmericas
xxx%
xxx%
xxx%
xxx%
xxx% AsiaEuropeME AfricaAmericas
29

(c) AZOTH Analytics
Global Ophthalmic Treatment Devices Market Size, By Value
• .
Figure : Refractive Error Treatment Market- By Region, 2015
Figure : Refractive Error Treatment Market- By Region, 2020E
Figure : Vitreoretinal Treatment Market- By Region, 2015
Figure : Vitreoretinal Treatment Market- By Region, 2020E
xxx%
xxx%
xxx%
xxx%
xxx% AsiaEuropeME AfricaAmericas
xxx%
xxx%
xxx%
xxx%
xxx% AsiaEuropeME AfricaAmericas
xxx%
xxx%
xxx%
xxx%
xxx% AsiaEuropeME AfricaAmericas
xxx%
xxx%
xxx%
xxx%
xxx% AsiaEuropeME AfricaAmericas
30
(c) AZOTH Analytics
APAC Ophthalmic Devices Market Size, By Value
• .
Source: Azoth Analytics
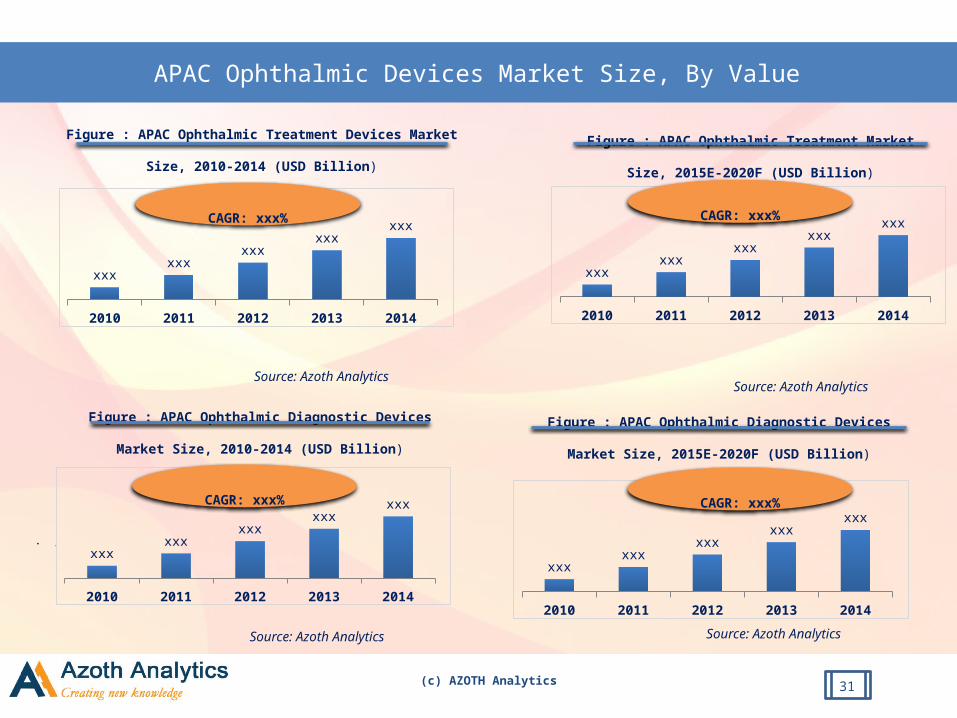
Figure : APAC Ophthalmic Treatment Devices Market
Size, 2010-2014 (USD Billion)
Source: Azoth Analytics
Figure : APAC Ophthalmic Treatment Market Size,
2015E-2020F (USD Billion)
Source: Azoth Analytics
Figure : APAC Ophthalmic Diagnostic Devices
Market Size, 2010-2014 (USD Billion)
Source: Azoth Analytics
Figure : APAC Ophthalmic Diagnostic Devices Market
Size, 2015E-2020F (USD Billion)
2010 2011 2012 2013 2014
xxxxxx
xxxxxx
xxxCAGR: xxx%
2010 2011 2012 2013 2014
xxxxxx
xxxxxx
xxxCAGR: xxx%
2010 2011 2012 2013 2014
xxxxxx
xxxxxx
xxxCAGR: xxx%
2010 2011 2012 2013 2014
xxxxxx
xxxxxx
xxxCAGR: xxx%
31

(c) AZOTH Analytics
Europe Ophthalmic Devices Market Size, By Value
• .
Source: Azoth Analytics
Figure : Europe Ophthalmic Treatment Devices
Market Size, 2010-2014 (USD Billion)
Source: Azoth Analytics
Figure : Europe Ophthalmic Treatment Market
Size, 2015E-2020F (USD Billion)
Source: Azoth Analytics
Figure : Europe Ophthalmic Diagnostic Devices
Market Size, 2010-2014 (USD Billion)
Source: Azoth Analytics
Figure : Europe Ophthalmic Diagnostic Devices
Market Size, 2015E-2020F (USD Billion)
2010 2011 2012 2013 2014
xxxxxx
xxxxxx
xxxCAGR: xxx%
2010 2011 2012 2013 2014
xxxxxx
xxxxxx
xxxCAGR: xxx%
2010 2011 2012 2013 2014
xxxxxx
xxxxxx
xxxCAGR: xxx%
2010 2011 2012 2013 2014
xxxxxx
xxxxxx
xxxCAGR: xxx%
32

(c) AZOTH Analytics
The Americas Ophthalmic Devices Market Size, By Value
• .
Source: Azoth Analytics
Figure : The Americas Ophthalmic Treatment
Devices Market Size, 2010-2014 (USD Billion)
Source: Azoth Analytics
Figure : The Americas Ophthalmic Treatment
Market Size, 2015E-2020F (USD Billion)
Source: Azoth Analytics
Figure : The Americas Ophthalmic Diagnostic
Devices Market Size, 2010-2014 (USD Billion)
Source: Azoth Analytics
Figure : The Americas Ophthalmic Diagnostic
Devices Market Size, 2015E-2020F (USD Billion)
2010 2011 2012 2013 2014
xxxxxx
xxxxxx
xxxCAGR: xxx%
2010 2011 2012 2013 2014
xxxxxx
xxxxxx
xxxCAGR: xxx%
2010 2011 2012 2013 2014
xxxxxx
xxxxxx
xxxCAGR: xxx%
2010 2011 2012 2013 2014
xxxxxx
xxxxxx
xxxCAGR: xxx%
33
(c) AZOTH Analytics
Middle East Ophthalmic Devices Market Size, By Value
• .
Source: Azoth Analytics
Figure : Middle East Ophthalmic Treatment Devices
Market Size, 2010-2014 (USD Billion)
Source: Azoth Analytics
Figure : Middle East Ophthalmic Treatment
Market Size, 2015E-2020F (USD Billion)
Source: Azoth Analytics
Figure : Middle East Ophthalmic Diagnostic
Devices Market Size, 2010-2014 (USD Billion)
Source: Azoth Analytics
Figure : Middle East Ophthalmic Diagnostic Devices
Market Size, 2015E-2020F (USD Billion)
2010 2011 2012 2013 2014
xxxxxx
xxxxxx
xxxCAGR: xxx%
2010 2011 2012 2013 2014
xxxxxx
xxxxxx
xxxCAGR: xxx%
2010 2011 2012 2013 2014
xxxxxx
xxxxxx
xxxCAGR: xxx%
2010 2011 2012 2013 2014
xxxxxx
xxxxxx
xxxCAGR: xxx%
34

(c) AZOTH Analytics
Africa Ophthalmic Devices Market Size, By Value
• .
Source: Azoth Analytics
Figure : Africa Ophthalmic Treatment Devices
Market Size, 2010-2014 (USD Billion)
Source: Azoth Analytics
Figure : Africa Ophthalmic Treatment Market
Size, 2015E-2020F (USD Billion)
Source: Azoth Analytics
Figure : Africa Ophthalmic Diagnostic Devices
Market Size, 2010-2014 (USD Billion)
Source: Azoth Analytics
Figure : Africa Ophthalmic Diagnostic Devices
Market Size, 2015E-2020F (USD Billion)
2010 2011 2012 2013 2014
xxxxxx
xxxxxx
xxxCAGR: xxx%
2010 2011 2012 2013 2014
xxxxxx
xxxxxx
xxxCAGR: xxx%
2010 2011 2012 2013 2014
xxxxxx
xxxxxx
xxxCAGR: xxx%
2010 2011 2012 2013 2014
xxxxxx
xxxxxx
xxxCAGR: xxx%
35
(c) AZOTH Analytics
About Azoth Analytics Pvt Ltd.Azoth Analytics creates in-depth research reports by recording, interpreting and analyzing information through primary and secondary research. Our strategic market sizing and data dredging techniques include secondary research, interviews with key market players and industry experts and use of industry specific statistical tools which helps in designing and planning effective research for our global and local clients. We provide customized market research reports revealing the hidden truths on different verticals like pharmaceutical, oil and gas, retail, automotive, real estate, logistics, energy, healthcare, technology, FMCG, food & beverages and media sectors .
Global Ophthalmic Devices Market: Trends, Opportunities and Forecasts (2015-2020F) - (By Type – Diagnostic and Treatment, Value, By Region, Key Players, Regulatory Overview, Margins and Revenue Contribution)
Date of Publication: January 2016Number of Pages: 240Price: US$ 2600 (Single-User License) : US$ 3000 (Multi-User License)
For Placing an Order of the Report, Please Follow the Link:http://www.azothanalytics.com/report/global-ophthalmic-devices-market-trends-opportunities-and-forecasts-2015-2020f-r12
+91 120 429 5175
36