global partnerships for a sustainable...
TRANSCRIPT
Page 1 of 30
“Global Partnerships for a Sustainable Future”
Page 2 of 30
Table of Contents
Table of Contents .................................................................................................................................. 2
1. What is UI GreenMetric World University Rankings? ................................................................. 3
2. What are the objectives? ............................................................................................................. 3
3. Who can participate?.................................................................................................................... 3
4. What are the benefits? ................................................................................................................. 3
5. How can universities participate? ................................................................................................ 4
6. Who is the team? .......................................................................................................................... 6
7. What is the methodology? ........................................................................................................... 6
8. Who are our networks? ................................................................................................................ 9
9. What are the future plans? ........................................................................................................ 10
10. How to contact us? ..................................................................................................................... 10
Questionnaire (Criteria and Indicators) .............................................................................................. 11
Appendix 1 .......................................................................................................................................... 22
Appendix 2 .......................................................................................................................................... 27
Attachment ......................................................................................................................................... 29
Page 3 of 30
1. What is UI GreenMetric World University Rankings?
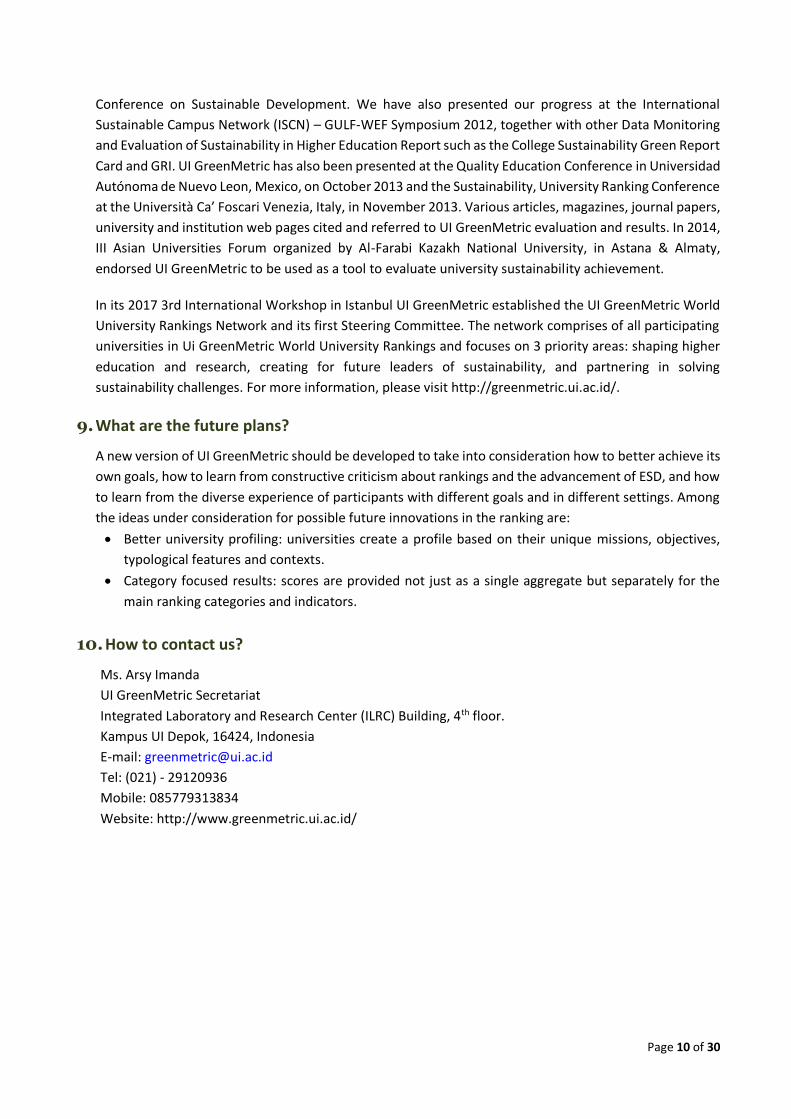
Universitas Indonesia (UI) initiated a world university rankings in 2010, later known as UI GreenMetric World
University Rankings, to measure campus sustainability efforts. It was intended to create an online survey to
portray sustainability programs and policies in universities around the world.
We based the rankings broadly on the conceptual framework of Environment, Economy, and Equity. The
ranking indicators and categories are intended to be relevant to all. We have designed the indicators and
weightings to be as free of bias as possible. The work of collecting and submitting data is relatively
straightforward and requires reasonable staff time. Ninety five universities from 35 countries took part in the
2010 version of Green Metric: 18 from the Americas, 35 from Europe, 40 from Asia and 2 from Australasia. In
2016 the ranking ranked 515 universities from 75 countries around the world. This shows that UI GreenMetric
has been recognized as the first and only world university rankings on sustainability.
Our theme this year is “Global Partnerships for a Sustainable Future”. We would like to focus on universities’
effort to work together with their partners in sustainable issues. We look into details of universities’
partnerships to improve campus sustainability.
2. What are the objectives?
The rankings aim to:
• Contribute to academic discourses on sustainability in education and the greening of campuses;
• Promote university-led social change with regard to sustainability goals.
• be a tool for self-assessment on campus sustainability for higher education institutions (HEIs) around
the globe.
• Inform governments, international and local environmental agencies, and the society about
sustainability programs on campus.
3. Who can participate?
All universities in the world with strong commitment to sustainability issues can participate in the annual UI
GreenMetric World University Rankings.
4. What are the benefits?
Universities which participate in UI GreenMetric by submitting their data to be included in the ranking can
expect to enjoy a number of benefits free of charge.
a. Internationalization and recognition
Participation in UI GreenMetric can help the university’s efforts in internationalization and recognition by
getting its sustainability efforts on the global map. Participation in UI GreenMetric can result in an increase
of hits to the university website, more mentions of the institution connected with the issue of sustainability
on web pages, and more correspondence with institutions interested in your university.
b. Increasing awareness of sustainability issues
Participation can help to raise awareness in the university and beyond about the importance of sustainability
issues. The world faces unprecedented global challenges such as population trends, global warming, over
Page 4 of 30
exploitation of natural resources, oil-dependent energy, water and food shortages and sustainability. We
realize that higher education has a crucial role to play in addressing these challenges. UI GreenMetric
leverages the crucial role that HEIs can play in raising awareness by doing assessment and comparing efforts
in education for sustainable development, sustainability research, campus greening, and social outreach.
c. Social change and action
UI GreenMetric is primarily about awareness raising, but in the future it will be adapted to encourage real
change. Understanding needs to shift to action if we are to address emerging global challenges is crucial.
d. Networking
All participants of UI GreenMetric are automatically members of UIGWURN (UI GreenMetric World University
Rankings Network). In this network, participants can share their best practices in sustainability program(s) as
well as networking with other participants worldwide by attending the annual UI GreenMetric International
Workshop and regional/national workshops hosted by approved host universities. Participants can also
arrange technical workshops on UI GreenMetric at their respective universities.
As a platform to turn sustainability issues into action, the network is managed by UI GreenMetric as the
secretariat. Programs and directions are proposed and decided by the steering committee comprising the UI
GreenMetric secretariat, regional, and national coordinators.
Currently the network comprises 515 participating universities located in the dynamic and diverse Asia,
Europe, Africa, Australia, America and Oceania, 1.537.789 faculty members, 16.500.614 students, with more
than US$ 48.892.548.416 total research funds on environment and sustainability.
5. How can universities participate?
To participate in the ranking is simple. The sustainability director or other person in charge can visit
www.greenmetric.ui.ac.id to learn about the ranking and if interested can e-mail the UI GreenMetric
secretariat ([email protected]) to get an invitation letter and access to the system. If you have already
participated in the rankings, we will send you an invitation to participate. In case, you decide not to participate
due to particular reasons, we would appreciate it if you could inform us. Of course, you can join our survey
again in the future. It is always useful, if your university appoints a person in charge as a contact person. You
are welcome to contact us for any inquiries regarding the survey.
How was UI GreenMetric World University Ranking developed?
The decision to establish UI GreenMetric was influenced by a number of factors:
a. Idealism
Future challenges to civilization include population pressure, climate change, energy security, environmental
degradation, water and food security and sustainable development. Despite many scientific researches and
public discussions, governments around the world have yet to commit to a sustainable agenda. Concerned
people at Universitas Indonesia perceive that universities have a privilege to help develop a consensus on key
areas for action. This includes such concepts as the Triple Bottom Line, the 3 Es: Equity, Economy,
Environment, Green Building, and Education for Sustainable Development (ESD).
Page 5 of 30
UI GreenMetric World University Rankings serves as a tool for universities to deal with sustainability
challenges our world is facing. Universities can work together to reduce negative environmental impacts. UI
GreenMetric is a non-profit institution; therefore, any university can participate for free.
b. UI GreenMetric World University Ranking model
Although UI GreenMetric was not based on any existing ranking system, it was developed with an awareness
of a number of existing sustainability assessment systems and academic university rankings. Sustainability
systems that were referred to during the design phase of UI GreenMetric included the Holcim Sustainability
Awards, GREENSHIP (the rating system recently developed by the Green Building Council of Indonesia which
itself was based on the Leadership in Energy and Environmental Design (LEED) system used in the U.S. and
elsewhere), the Sustainability, Tracking, Assessment and Rating System (STARS) and the College Sustainability
Report Card (also known as the Green Report Card).
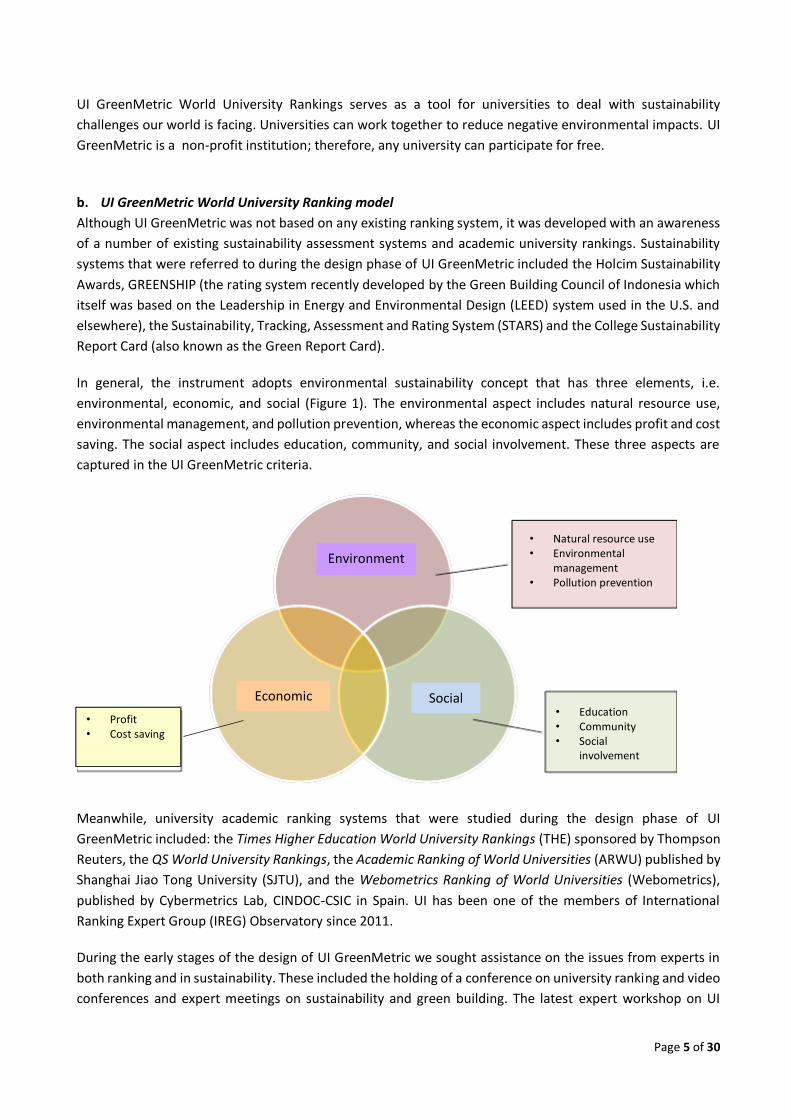
In general, the instrument adopts environmental sustainability concept that has three elements, i.e.
environmental, economic, and social (Figure 1). The environmental aspect includes natural resource use,
environmental management, and pollution prevention, whereas the economic aspect includes profit and cost
saving. The social aspect includes education, community, and social involvement. These three aspects are
captured in the UI GreenMetric criteria.
Meanwhile, university academic ranking systems that were studied during the design phase of UI
GreenMetric included: the Times Higher Education World University Rankings (THE) sponsored by Thompson
Reuters, the QS World University Rankings, the Academic Ranking of World Universities (ARWU) published by
Shanghai Jiao Tong University (SJTU), and the Webometrics Ranking of World Universities (Webometrics),
published by Cybermetrics Lab, CINDOC-CSIC in Spain. UI has been one of the members of International
Ranking Expert Group (IREG) Observatory since 2011.
During the early stages of the design of UI GreenMetric we sought assistance on the issues from experts in
both ranking and in sustainability. These included the holding of a conference on university ranking and video
conferences and expert meetings on sustainability and green building. The latest expert workshop on UI
• Natural resource use • Environmental
management • Pollution prevention
• Education • Community • Social
involvement
• Profit • Cost saving
Environment
Economic
Social
Page 6 of 30
GreenMetric was held on November 21st 2013, in which rectors and representatives from the following
universities shared their experiences, i.e University of Nottingham, UniversitàCa’ Foscari Venezia, University
of Melbourne, Mahidol University, Universitat fur Bodenkultur Wien, Universidad Autónoma de Nuevo Leon,
Kasetsart University, King Mongkut’s University of Technology Thonburi, Da Yeh University, and Universiti
Teknologi Malaysia.
In 2010, 23 indicators were used within the five categories to calculate the ranking scores. In 2011 34
indicators were used. Then in 2012 we removed the indicator of “smoke free and drug free campus
environment” and used 33 indicators to evaluate the green campus. In 2012, we also categorized the
indicators into 6 categories including the education criteria. One change being considered is the formation of
a new category for sustainability education and research. In 2015 the theme was carbon footprint. We add
two questions related this issue in the energy and climate change section.We also improved our methodology
by adding a few sub-indicators that related to water and transportation in the 2015 ranking. A major change
in methodology was done in 2016 by considering new trends in sustainability issues.
c. Realities and challenges
The goal of creating a world university sustainability ranking was done with an understanding that the
diversity of types of universities, their missions and their contexts would pose problems for the methodology.
In particular, we are fully aware of the fact that universities differ with regard to their levels of awareness and
commitment to sustainability, their budgets, the amount of green cover on their campuses and many other
dimensions. These issues are complex, but UI GreenMetric is committed to continually improving the ranking
so that it will be both useful and fair for all.
6. Who is the team?
UI GreenMetric World University Rankings is managed by a team under the Rector of Universitas Indonesia.
The team members come from different academic backgrounds and experiences, such as Environmental
Sciences, Engineering, Architecture and Urban Design, Dentistry, Public Health, Statistics, Chemistry,
Linguistics and Cultural Studies.
7. What is the methodology?
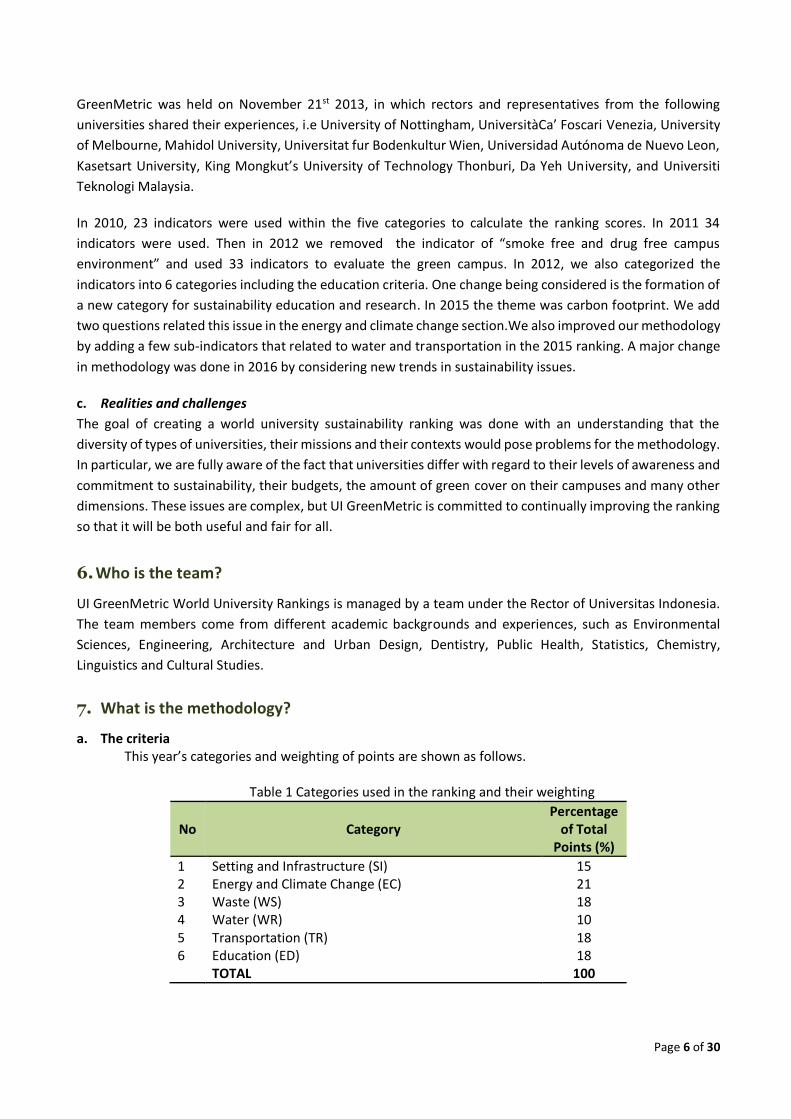
a. The criteria This year’s categories and weighting of points are shown as follows.
Table 1 Categories used in the ranking and their weighting
No Category Percentage
of Total Points (%)
1 Setting and Infrastructure (SI) 15 2 Energy and Climate Change (EC) 21 3 Waste (WS) 18 4 Water (WR) 10 5 Transportation (TR) 18 6 Education (ED) 18 TOTAL 100
Page 7 of 30
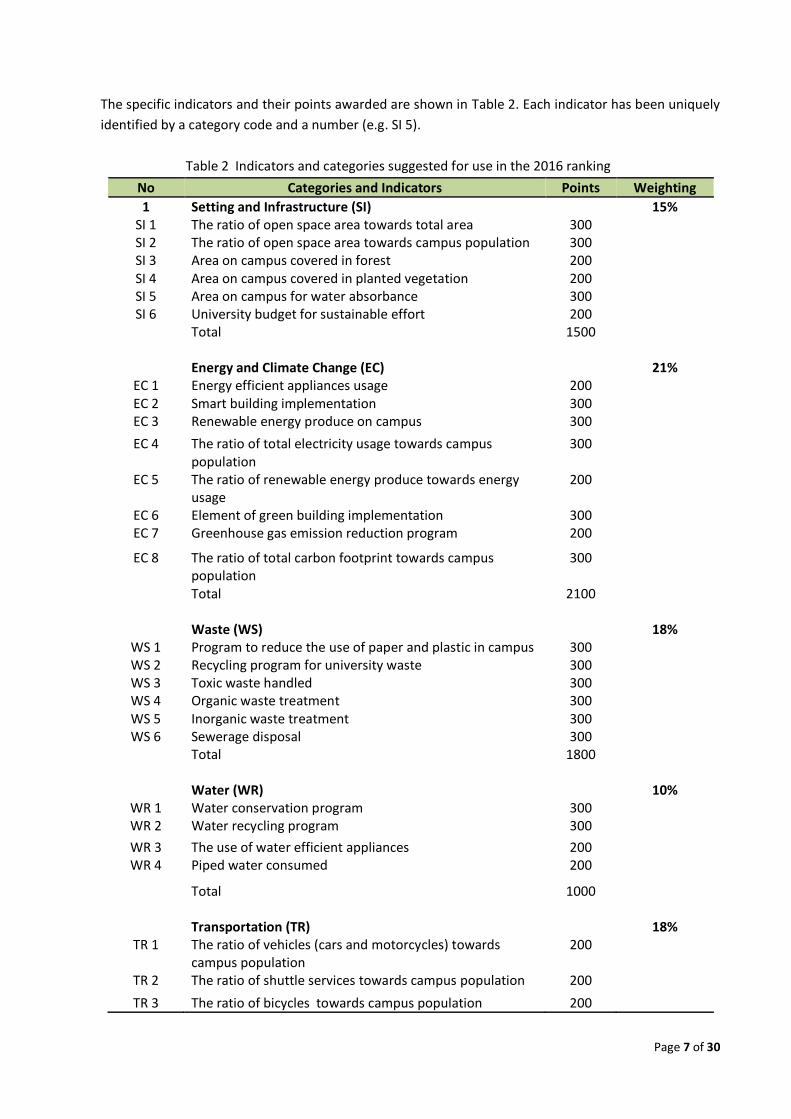
The specific indicators and their points awarded are shown in Table 2. Each indicator has been uniquely
identified by a category code and a number (e.g. SI 5).
Table 2 Indicators and categories suggested for use in the 2016 ranking
No Categories and Indicators Points Weighting
1 Setting and Infrastructure (SI) 15% SI 1 The ratio of open space area towards total area 300 SI 2 The ratio of open space area towards campus population 300 SI 3 Area on campus covered in forest 200 SI 4 Area on campus covered in planted vegetation 200 SI 5 Area on campus for water absorbance 300 SI 6 University budget for sustainable effort 200
Total 1500 Energy and Climate Change (EC) 21%
EC 1 Energy efficient appliances usage 200 EC 2 Smart building implementation 300 EC 3 Renewable energy produce on campus 300
EC 4 The ratio of total electricity usage towards campus population
300
EC 5 The ratio of renewable energy produce towards energy usage
200
EC 6 Element of green building implementation 300 EC 7 Greenhouse gas emission reduction program 200
EC 8 The ratio of total carbon footprint towards campus population
300
Total 2100 Waste (WS) 18%
WS 1 Program to reduce the use of paper and plastic in campus 300 WS 2 Recycling program for university waste 300 WS 3 Toxic waste handled 300 WS 4 Organic waste treatment 300 WS 5 Inorganic waste treatment 300 WS 6 Sewerage disposal 300
Total 1800 Water (WR) 10%
WR 1 Water conservation program 300 WR 2 Water recycling program 300
WR 3 The use of water efficient appliances 200 WR 4 Piped water consumed 200
Total 1000 Transportation (TR) 18%
TR 1 The ratio of vehicles (cars and motorcycles) towards campus population
200
TR 2 The ratio of shuttle services towards campus population 200
TR 3 The ratio of bicycles towards campus population 200
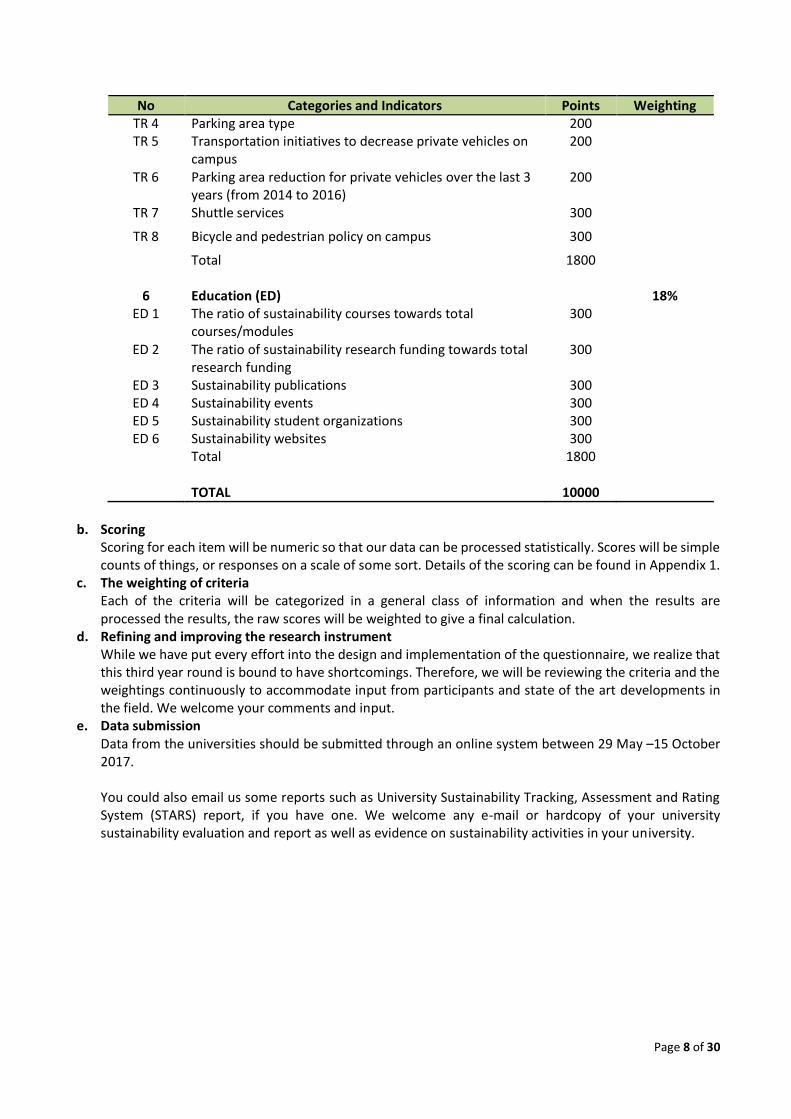
Page 8 of 30
No Categories and Indicators Points Weighting TR 4 Parking area type 200 TR 5 Transportation initiatives to decrease private vehicles on
campus 200
TR 6 Parking area reduction for private vehicles over the last 3 years (from 2014 to 2016)
200
TR 7 Shuttle services 300
TR 8 Bicycle and pedestrian policy on campus 300
Total 1800
6 Education (ED) 18% ED 1 The ratio of sustainability courses towards total
courses/modules 300
ED 2 The ratio of sustainability research funding towards total research funding
300
ED 3 Sustainability publications 300 ED 4 Sustainability events 300 ED 5 Sustainability student organizations 300 ED 6 Sustainability websites 300
Total 1800 TOTAL 10000
b. Scoring
Scoring for each item will be numeric so that our data can be processed statistically. Scores will be simple counts of things, or responses on a scale of some sort. Details of the scoring can be found in Appendix 1.
c. The weighting of criteria Each of the criteria will be categorized in a general class of information and when the results are processed the results, the raw scores will be weighted to give a final calculation.
d. Refining and improving the research instrument While we have put every effort into the design and implementation of the questionnaire, we realize that this third year round is bound to have shortcomings. Therefore, we will be reviewing the criteria and the weightings continuously to accommodate input from participants and state of the art developments in the field. We welcome your comments and input.
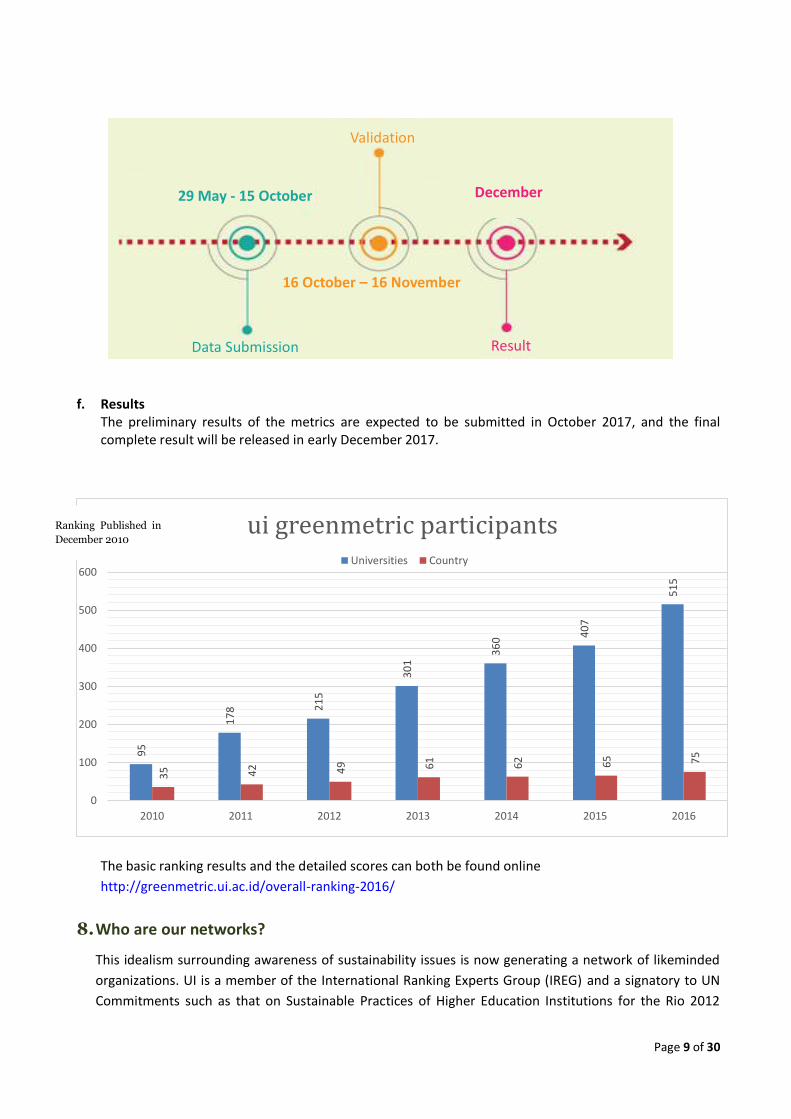
e. Data submission Data from the universities should be submitted through an online system between 29 May –15 October 2017. You could also email us some reports such as University Sustainability Tracking, Assessment and Rating System (STARS) report, if you have one. We welcome any e-mail or hardcopy of your university sustainability evaluation and report as well as evidence on sustainability activities in your university.
Page 9 of 30
f. Results
The preliminary results of the metrics are expected to be submitted in October 2017, and the final complete result will be released in early December 2017.
The basic ranking results and the detailed scores can both be found online
http://greenmetric.ui.ac.id/overall-ranking-2016/
8. Who are our networks?
This idealism surrounding awareness of sustainability issues is now generating a network of likeminded
organizations. UI is a member of the International Ranking Experts Group (IREG) and a signatory to UN
Commitments such as that on Sustainable Practices of Higher Education Institutions for the Rio 2012
95
17
8 21
5
30
1
36
0 40
7
51
5
35 42 49 61 62 65 75
0
100
200
300
400
500
600
2010 2011 2012 2013 2014 2015 2016
ui greenmetric participantsUniversities Country
Validation
Result Data Submission
16 October – 16 November
29 May - 15 October December
Ranking Published in
December 2010
Page 10 of 30
Conference on Sustainable Development. We have also presented our progress at the International
Sustainable Campus Network (ISCN) – GULF-WEF Symposium 2012, together with other Data Monitoring
and Evaluation of Sustainability in Higher Education Report such as the College Sustainability Green Report
Card and GRI. UI GreenMetric has also been presented at the Quality Education Conference in Universidad
Autónoma de Nuevo Leon, Mexico, on October 2013 and the Sustainability, University Ranking Conference
at the Università Ca’ Foscari Venezia, Italy, in November 2013. Various articles, magazines, journal papers,
university and institution web pages cited and referred to UI GreenMetric evaluation and results. In 2014,
III Asian Universities Forum organized by Al-Farabi Kazakh National University, in Astana & Almaty,
endorsed UI GreenMetric to be used as a tool to evaluate university sustainability achievement.
In its 2017 3rd International Workshop in Istanbul UI GreenMetric established the UI GreenMetric World
University Rankings Network and its first Steering Committee. The network comprises of all participating
universities in Ui GreenMetric World University Rankings and focuses on 3 priority areas: shaping higher
education and research, creating for future leaders of sustainability, and partnering in solving
sustainability challenges. For more information, please visit http://greenmetric.ui.ac.id/.
9. What are the future plans?
A new version of UI GreenMetric should be developed to take into consideration how to better achieve its
own goals, how to learn from constructive criticism about rankings and the advancement of ESD, and how
to learn from the diverse experience of participants with different goals and in different settings. Among
the ideas under consideration for possible future innovations in the ranking are:
• Better university profiling: universities create a profile based on their unique missions, objectives,
typological features and contexts.
• Category focused results: scores are provided not just as a single aggregate but separately for the
main ranking categories and indicators.
10. How to contact us?
Ms. Arsy Imanda
UI GreenMetric Secretariat
Integrated Laboratory and Research Center (ILRC) Building, 4th floor.
Kampus UI Depok, 16424, Indonesia
E-mail: [email protected]
Tel: (021) - 29120936
Mobile: 085779313834
Website: http://www.greenmetric.ui.ac.id/
Page 11 of 30
Questionnaire (Criteria and Indicators)
There are six main categories in the questionnaire which consist of setting and infrastructure (SI), energy and
climate change (EC), waste (WS), water (WR), transportation (TR) and education (ED). These categories are
divided into several sections and the detailed explanations of the questions are as follow:
1. Setting and Infrastructure (SI)
The campus setting and infrastructure information will provide the basic information of the university
consideration towards green environment. This indicator also shows whether the campus deserves to
be called a Green Campus. The aim is to trigger the participating universities to provide more spaces for
greenery and to safeguard the environment, as well as develop of sustainable energy.
1.1. Type of higher education institution
Please select one of the following options:
[1] Comprehensive
[2] Specialized higher education institution
1.2. Climate
Please select one of the following options that clearly describes the climate in your region:
[1] Tropical wet
[2] Tropical wet and dry
[3] Semiarid
[4] Arid
[5] Mediterranean
[6] Humid subtropical
[7] Marine west coast
[8] Humid continental
[9] Subarctic
1.3. Number of campus sites
Please state the number of separate locations in which your university has buildings for academic
purposes. For example, if your university has some campuses in different districts, towns or cities which
are separated from the main campus, please state the total number of university locations.
To answer questions below please note that if you have more than one campus sites, please select an
option(s) that best describes those sites.
1.4. Main Campus Setting
Please select one of the following options:
[1] Rural
[2] Suburban
[3] Urban
[4] In city center
[5] High rise building area
Page 12 of 30
1.5. Total main campus area (m2)
Please state the total areas of your campus(es) (in square meters). It is expected that the total area
counted are only those in which academic activities are conducted. Forest and fields and other areas can
only be counted if they are used for academic purposes.
1.6. Total main campus ground floor area of buildings (m2)
The green area of your university will be calculated from the percentage of green area of your university.
Please provide information of the area occupied by buildings, by providing the total area of the ground
floor part of your university buildings.
1.7. Total main campus buildings area (m2)
Please provide information of the area occupied by buildings, by providing the total floor area of your
university buildings in your main campus.
1.8. Total main campus smart building area (m2)
Please provide the information of the total area (including ground floor and other floors) of your
university smart buildings. A smart building should be equipped with energy efficient tools. Smart
building achievement is a measurement of useful building services which make occupants productive
(e.g. illumination, thermal comfort, air quality, physical security, sanitation, etc.). Smart buildings should
be establishedat the lowest cost and generate beneficial environmental impact over the building
lifecycle.
1.9. Total parking area (m2)
Please provide the information of the total parking area in your university. You can validate this by using
google maps.
1.10. Area on campus covered in forest vegetation
Please provide the percentage of the area on campus covered in vegetation in the form of forest (a large
area covered mainly with big-trees, a large number or dense mass of vertical, and undergrowth for
conservation purposes), owned by campus, to the total campus area.
1.11. Area on campus covered in planted vegetation
Please provide the percentage of the area on campus covered in planted vegetation (including lawns,
gardens, green roofs, internal planting; for vegetation purposes) to the total campus area.
1.12. Total area on campus for water absorption besides forest and planted vegetation (m2)
Please provide the percentage of non-retentive surfaces (eg. earth, grass, concrete block, etc.) on your
campus for water absorption as a percentage to the total site area. A larger water absorption area is
desirable.
Page 13 of 30
1.13. Number of students
a. Total Number of Regular Students
The total number of students (full time and part time) registered, as regular and online students, at your
university. If your university has calculated the Effective Full Time Students (EFTS) number, you are
welcome to submit this number.
b. Total Number of Online Students
The total number of students registered as online students only, at your university.
1.14. Number of academic and administrative staff
Please state the total number of lecturers and administrative staff working in your university.
1.15. University budget for sustainability effort
Please provide the percentage calculation of the environment and sustainability budget to the total
university budget.
2. Energy and Climate Change (EC)
The university’s attention to the use of energy and climate change issues is the indicator with the highest
weighting in this ranking. In our questionnaire we define several indicators for this particular area of
concern, i.e. energy efficient appliances usage, the implementation of smart buildings/automation
buildings/intelligent buildings, renewable energy usage policy, total electricity use, energy conservation
programs, elements of green buildings, climate change adaptation and mitigation programs, greenhouse
gas emission reductions policy and carbon footprint. Within these indicators, the university is expected
to increase their efforts in energy efficiency in their buildings and to care more about nature and energy
resources.
2.1. Energy efficient appliances usage are replacing conventional appliances
Energy efficient appliances usages are replacing conventional appliances. This also includes the use of
energy efficient appliances/lighting fixtures (e.g. the use of energy star-rating for electronic devices, LED
light bulbs).
Please select one of the following options:
[1] None
[2] Less than 20%
[3] 20% - 40%
[4] 40% - 60%
[5] 60% - 80%
[6] 80% - 100%
2.2. Smart Building program implementation
Please provide the stage of smart building implementation in your university. This is defined as the
existence of formalized efforts in applying the program in order to accommodate all energy efficient
appliances usage. Please select one of the following options:
[1] None
[2] Program in preparation (e.g. Feasibility Study or Detailed Engineering Design phase)
[3] Program in initial implementation (e.g. Builder already appointed)
Page 14 of 30
[4] Implemented in less than 30% of the total building area
[5] Implemented in between 30% - 70% of the total building area
[6] Implemented in more than 70% of the total building area
Smart Building can be defined as the use of networked technology, embedded within architecture to
monitor and control elements of the architecture for exchange of information between users, systems
and buildings.
2.3. Renewable energy produce on campus per year
Please select one or more of the following alternative energy sources used in your campus and please
provide the capacity of the energy produced in Kilo Watt:
[1] None
[2] Bio Diesel (provide capacity in Kilo Watt)
[3] Clean Biomass (provide capacity in Kilo Watt)
[4] Solar Power (provide capacity in Kilo Watt)
[5] Geothermal (provide capacity in Kilo Watt)
[6] Wind Power (provide capacity in Kilo Watt)
[7] Hydropower (provide capacity in Kilo Watt)
[8] Combine Heat and Power (provide capacity in Kilo Watt)
2.4. Electricity usage per year
Please provide the total energy used in the last 12 months in your entire university (in Kilo Watt Hour or
KWH) for all purposes such as lighting, heating, cooling, running university laboratories, etc.
2.5. Ratio of renewable energy production towards total energy usage per year
Please provide the ratio of renewable energy production towards total energy usage per year Please
select one of the following options:
[1] None
[2] Less than 20%
[3] 20% - 40%
[4] 40% - 60%
[5] 60% - 80%
[6] 80% - 100%
2.6. Elements of green building implementation as reflected in all construction and renovation
policies
Please provide information on the elements of green building implementation as reflected in the
construction and renovation policies in your university. Please select one or more that apply from the
following list:
[1] None. Please select this option if there is no green building implementation in your university.
[2] Natural Ventilation. Please select this option if natural ventilation is used in your university for
air circulation purposes.
[3] Full-Day Natural Lighting. Please select this option if natural light is encouraged for daily source
of lighting during the day time whenever possible.
Page 15 of 30
[4] Existence of a building energy management system. Please select this option if your university
has a building energy management system.
[5] Existence of Green Building. Please select this option if your university has implemented green
building practices.
2.7. Greenhouse gas emission reduction programs
Please select a condition which reflects the current condition of your university in providing formal
programs to reduce greenhouse gas emissions from the following options:
[1] None
[2] Program in preparation
[3] Program in initial implementation
[4] Program implemented in HVAC System / Refrigerator / Laboratory Gases
(Heat, Ventilation, Air Conditioning and Refrigeration)
2.8. Please provide total carbon footprint (CO2 emission in the last 12 months, in metric tons)
Please provide the total carbon footprint of your university. Please exclude carbon footprint from flights
and secondary carbon sources such as dishes and clothes. You can use the carbon footprint calculator
from www.carbonfootprint.com as the standard for carbon footprint calculation, please visit the website
to see elements of carbon footprint that you can count.
For an example of how to calculate your university carbon footprint please refer to the appendix 2.
3. Waste (WS)
Waste treatment and recycling activities are major factors in creating a sustainable environment. The
activities of university staff and students on campus will produce a lot of waste; therefore, some recycling
and waste treatments programs should be among the concern of the university, i.e. recycling program,
toxic waste recycling, organic waste treatment, inorganic waste treatment, sewerage disposal, policies
to reduce the use of paper and plastic oncampus.
3.1. Policy to reduce the use of paper and plastic on campus
Please select one or more which best reflects the current condition of your university in establishing
formal policy to reduce the use of paper and plastic from the following options:
[1] None
[2] Double sided-printing policy program
[3] Use of tumblers
[4] Use of reusable bags
[5] Print only when necessary
3.2. Recycling program for university waste
Please select a condition which reflects the current condition of your university policy led efforts to
encourage staff and students to recycle waste, from the following options:
[1] None
[2] Partial (less than 25% of waste)
[3] Partial (25% - 50% of waste)
[4] Extensive (more than 50% of waste)
Page 16 of 30
3.3. Toxic waste handled
Please select a condition which reflects the current condition of how your university handles toxic
wastes. The handling process includes whether toxic wastes are dealt separately, for example, by
classifying and handling them over to a third party or certified handling companies. Please select one of
the following options:
[1] Not managed
[2] Partly contained and inventoried
[3] Completely contained, inventoried and handled
3.4. Organic waste treatment
The method of organic waste (e.g. garbage, discarded vegetable and plant matter) treatment in your
university. Please select an option that best describes your university’s overall treatment of the bulk of
organic waste:
[1] Open dumping
[2] Partly composted
[3] Partly composted and compost used
[4] Fully composted, compost used
[5] Fully composted, compost used internally and externally
3.5. Inorganic waste treatment
Please describe the method of inorganic waste (e.g. rubbish, trash, discarded paper, plastic, metal, etc.)
treatment in your university. Please select an option that best describes your university’s overall
treatment of the bulk of the inorganic waste:
[1] Burned in open area
[2] Taken off campus to a dump site
[3] Partially recycled (less than 50%)
[4] Fully recycled (more than 50%)
3.6. Sewerage disposal
Please describe the primary method of sewerage treatment in your university. Please select an option
that best describes how the bulk of the sewerage is disposed:
[1] Disposed untreated into waterways
[2] Treated individually in septic tanks
[3] Centralized treatment before disposal
[4] Treatment for recycling
4. Water (WR)
Water use in campus is another important indicator in the UI GreenMetric. The aim is to encourage
universities to decrease water usage, increase conservation programs, and protect the habitants. Water
conservation programs, water recycling programs, water efficient appliances usage, and treated water
usage are among the criteria.
Page 17 of 30
4.1. Water conservation program implementation
Please select a condition describing your current stage in the program, which has a systematic and
formalized program that supports a water conservation program (e.g. for lakes and lake management
systems, rain harvesting systems, water tanks) in your university, from the following options:
[1] None
[2] Program in preparation (e.g. Feasibility Study and promotion)
[3] Program in initial implementation (e.g. initial measurement of potential water conserved)
[4] Implemented in Rain Harvesting Systems
[5] Implemented in Ground Water Tanks
[6] Implemented in Lakes or Ponds
4.2. Water recycling program implementation
Please select a condition which reflects the current condition of your university in establishing formal
policies for water recycling programs (e.g. the use of recycled water for toilet flushing, car washing,
watering plants, etc). Please select an option that describes the current stage of your program :
[1] None
[2] Program in preparation (e.g. water efficient appliances selection priority are identified)
[3] Program in initial implementation (e.g. initial measurement of potential water recycle)
[4] Recycled water is used for garden sprinkler systems
[5] Recycled water is used for toilet flushing
[6] Recycled water is used for the cooling system and/or car wash
4.3. Water efficient appliance usage
Water efficient appliance usages are replacing conventional appliances. This also includes the use of
water efficient appliances (e.g. using censored/automated hand washing taps, high efficient toilet flush,
etc). Please select one of the following options:
[1] None
[2] Program in preparation (e.g. water efficient appliances selection priority have been
identified)
[3] Less than 25% water efficient appliances installed
[4] 25%-50% water efficient appliances installed
[5] 50%-75% water efficient appliances installed
[6] More than 75% water efficient appliances installed
4.4. Piped water consumed
Please indicate the percentage of Piped water consumed (e.g. rain water tank source) from the utility or
piped water system compared to all water sources in your university.
5. Transportation (TR)
Transportation systems play an important role in the carbon emission and pollutant levels in universities.
Transportation policies to limit the number of motor vehicles on campus, the use of campus buses, and
bicycles will encourage a healthier environment. The pedestrian policy will encourage students and staff
to walk around campus, and avoid using private vehicles. The use of environmentally friendly public
transportation will decrease the carbon footprint around campus.
Page 18 of 30
5.1. Number of cars owned by your university
Please indicate the number of cars owned by your university.
5.2. Number of cars entering the university daily
Please indicate the average number of cars that enter your university daily based on a balanced sample,
taking term and holiday periods in consideration.
5.3. Number of motorcycles entering the university daily
Please indicate the average number of motorcycles that enter your university daily based on a balanced
sample, taking term and holiday periods in consideration.
5.4. Number of shuttles operated in your university
Please indicate the number of campus shuttles operating in your university. The campus shuttle can be
in the form of buses, MPV cars or mini vans which are operated inside the campus.
5.5. Average number of passengers of each shuttle
Please indicate the average number of passengers of each shuttle on one trip.
5.6. Total trips of shuttle services each day
Please indicate the total number of shuttle service trips each day.
5.7. Average number of bicycles on campus every day
Please indicate the average number of bicycles on campus daily which include both those owned by the
university and privately owned bikes.
5.8. Parking area types
Please select a condition which reflects the current condition of your university in terms of parking area
type.
[1] Open space or horizontal type
[2] Combination of open space and building
[3] Building or vertical space
[4] Parking is restricted
5.9. Transportation program designed to limit or decrease parking area on campus over the last 3
years (from 2014 to 2016)
Please select a condition which reflects current university program on transportation designed to limit
or decrease the parking area on campus. Please select an option that best describes your university from
the following options:
[1] None
[2] Program in preparation
[3] Program resulting in less than 10% decrease
[4] Program resulting in between 10% - 30% decrease in parking
[5] Program resulting in more than 30% decrease in parking or parking is restricted
Page 19 of 30
5.10. Transportation initiatives to limit or decrease private vehicles on campus
Please select a condition which reflects your university’s current initiatives on the availability of
transportation to limit or decrease the number of private vehicles on campus. Please select an option(s)
that best describes your university from the following:
[1] None
[2] Charging high parking fees
[3] Car sharing
[4] Metro/tram/bus station on campus
[5] Metro/tram/bus services inside campus
5.11. Shuttle services
Please describe the condition of the availability of shuttles for journeys within the campus and whether
the ride is free or charged. Please select an option from the following options:
[1] Shuttle service is possible but not provided
[2] Shuttle service is available, but not free
[3] Shuttle service is available, and free. Or shuttle use is not possible
5.12. Bicycle and pedestrian policy on campus
Please describe the extent to which the use of bicycles or walking are supported. Please select an option
from the following list that applies to your campus:
[1] Bicycle and pedestrian paths are not available
[2] Bicycle use is not possible or practical, but pedestrian paths are available
[3] Bicycle and pedestrian paths are available
[4] Bicycle and pedestrian paths are available, and bicycles are provided freely by the university
5.13. Approximate daily travel distance of a vehicle inside campus only (in kilometers)
Please provide the approximate daily travel distance of a vehicle (e.g. bus, car, motorcycle) inside campus
only in kilometers.
6. Education (ED)
6.1. Number of courses/modules related to environment and sustainability offered
The number of courses related to environment and sustainability offered at your university. Some
universities have already tracked on how many courses/modules available for this. The definition of the
extent to which a course can be stated to be related to environment, sustainability, or both, can be
defined according to your university’s situation. If a course/module contributes in more than a minor or
passing way to increasing awareness, knowledge, or action related to Environment and Sustainability,
then it counts.
6.2. Total number of courses/modules offered
The total number of all courses/modules provided at your university yearly. This information will be used
to calculate to what extend environment and sustainability education has been defined in your university
teaching and learning.
Page 20 of 30
6.3. Total research funds dedicated to environmental and sustainability research (in US Dollars)
Please provide the average funding for research on environment and sustainability per annum over the
last 3 years.
6.4. Total research funds (in US Dollars)
The average total research funds per annum over the last 3 years. This information will be used to
calculate the percentage of environment and sustainability research funding to the overall research
funding.
6.5. Number of scholarly publications on environment and sustainability published
Please provide the average number of indexed publications (Google scholar) on environment and
sustainability published annually over the last 3 years.
6.6. Number of events related to environment and sustainability
Please provide the number of events (e.g. conferences, workshops, awareness raising, practical training,
etc.) related to environment and sustainability hosted or organized by your university (average per
annum over the last 3 years).
6.7. Number of student organizations related to environment and sustainability
Please provide the total number of student organizations at faculty and university level. For example, a
student association on green campus in the Faculty of Humanities can be considered as an organization.
6.8. Existence of a university-run sustainability website
If your university has a sustainability website, please provide the address of the web. Some detailed
information of a university website to educate students and staff as well as providing information of their
latest involvement on green campus, environment and sustainability programs will be very useful.
Page 21 of 30
Related Papers and Publications about UI GreenMetric
[1] Evaluating UI GreenMetric as a tool to Support Green Universities Development: Assessment of the
Year 2011 Ranking by Dr. Nyoman Suwartha and Prof. Riri Fitri Sari, Journal of Cleaner Production,
Volume 61, Pages 46–53 (2013)
[2] Critical review of a global campus sustainability ranking: GreenMetric by Allan Lauder, Riri Fitri Sari,
Nyoman Suwartha, and Gunawan Tjahjono, Journal of Cleaner Production, Volume 108, Part A, Pages
852–863 (2015)
[3] University contributions to environmental sustainability: challenges and opportunities from the
Lithuanian case by Renata Dagiliut and Genovaite Liobikien, Journal of Cleaner Production, Volume
108, Part A, Pages 891–899 (2014)
[4] Opening up the Pandora's box of sustainability league tables of universities: a Kafkaesque perspective
by David R. Jones, Studies in Higher Education, Volume 40, Pages 480-503 (2015)
[5] Sustainable Universities – From Declarations on Sustainability in Higher Education to National Law by
Thomas Skou Grindsted, Journal of Environmental Economics and Management, Volume 2 (2011)
[6] Moving Toward Socially and Environmentally Responsible Management Education—A Case Study of
Mumbai by Ela Goyal and Mahendra Gupta, Journal Applied Environmental Education &
Communication, volume 13, Pages 146-161 (2014)
[7] The comprehensiveness of competing higher education sustainability assessments by Graham Bullock
and Nicholas Wilder, International Journal of Sustainability in Higher Education, Volume 17, Pages
282-304 (2016)
[8] Green Campus initiative and its impacts on quality of life of stakeholders in Green and Non-Green
Campus universities by Ronnachai Tiyarattanachai and Nicholas M. Hollmann, SpringerPlus, Volume
5, no info pages (2016)
[9] Environmental management and sustainability in higher education: The case of Spanish Universities
by Yolanda León-Fernández and Eugenio Domínguez-Vilches, International Journal of Sustainability
in Higher Education, Volume 16, Pages 440-455 (2015)
[10] Getting an empirical hold of the sustainable university: a comparative analysis of evaluation
frameworks across 12 contemporary sustainability assessment tools by Daniel Fischer, Silke Jenssen
and Valentin Tappeser, Journal Assessment & Evaluation in Higher Education, Volume 40, Pages 785‐
800 (2015)
Page 22 of 30
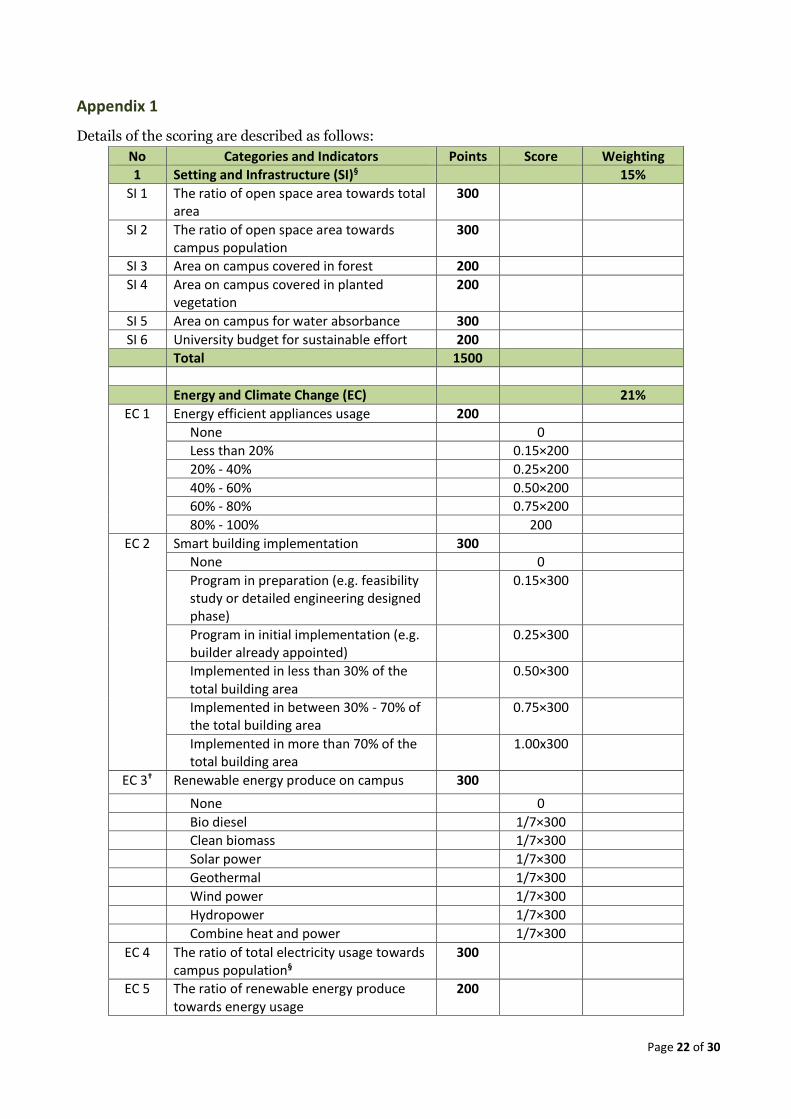
Appendix 1
Details of the scoring are described as follows:
No Categories and Indicators Points Score Weighting
1 Setting and Infrastructure (SI)§ 15%
SI 1 The ratio of open space area towards total area
300
SI 2 The ratio of open space area towards campus population
300
SI 3 Area on campus covered in forest 200
SI 4 Area on campus covered in planted vegetation
200
SI 5 Area on campus for water absorbance 300
SI 6 University budget for sustainable effort 200
Total 1500
Energy and Climate Change (EC) 21%
EC 1 Energy efficient appliances usage 200
None 0
Less than 20% 0.15×200
20% - 40% 0.25×200
40% - 60% 0.50×200
60% - 80% 0.75×200
80% - 100% 200
EC 2 Smart building implementation 300
None 0
Program in preparation (e.g. feasibility study or detailed engineering designed phase)
0.15×300
Program in initial implementation (e.g. builder already appointed)
0.25×300
Implemented in less than 30% of the total building area
0.50×300
Implemented in between 30% - 70% of the total building area
0.75×300
Implemented in more than 70% of the total building area
1.00x300
EC 3† Renewable energy produce on campus 300
None 0
Bio diesel 1/7×300
Clean biomass 1/7×300
Solar power 1/7×300
Geothermal 1/7×300
Wind power 1/7×300
Hydropower 1/7×300
Combine heat and power 1/7×300
EC 4 The ratio of total electricity usage towards campus population§
300
EC 5 The ratio of renewable energy produce towards energy usage
200
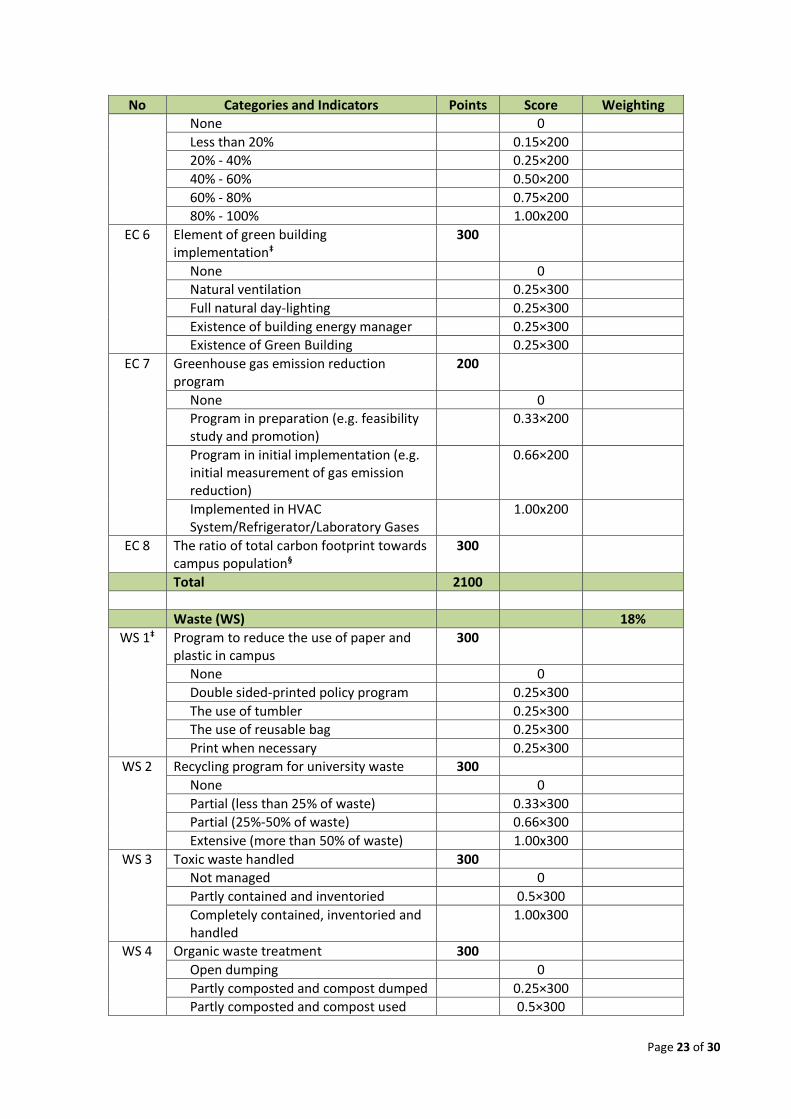
Page 23 of 30
No Categories and Indicators Points Score Weighting
None 0
Less than 20% 0.15×200
20% - 40% 0.25×200
40% - 60% 0.50×200
60% - 80% 0.75×200
80% - 100% 1.00x200
EC 6 Element of green building implementation‡
300
None 0
Natural ventilation 0.25×300
Full natural day-lighting 0.25×300
Existence of building energy manager 0.25×300
Existence of Green Building 0.25×300
EC 7 Greenhouse gas emission reduction program
200
None 0
Program in preparation (e.g. feasibility study and promotion)
0.33×200
Program in initial implementation (e.g. initial measurement of gas emission reduction)
0.66×200
Implemented in HVAC System/Refrigerator/Laboratory Gases
1.00x200
EC 8 The ratio of total carbon footprint towards campus population§
300
Total 2100
Waste (WS) 18%
WS 1‡ Program to reduce the use of paper and plastic in campus
300
None 0
Double sided-printed policy program 0.25×300
The use of tumbler 0.25×300
The use of reusable bag 0.25×300
Print when necessary 0.25×300
WS 2 Recycling program for university waste 300
None 0
Partial (less than 25% of waste) 0.33×300
Partial (25%-50% of waste) 0.66×300
Extensive (more than 50% of waste) 1.00x300
WS 3 Toxic waste handled 300
Not managed 0
Partly contained and inventoried 0.5×300
Completely contained, inventoried and handled
1.00x300
WS 4 Organic waste treatment 300
Open dumping 0
Partly composted and compost dumped 0.25×300
Partly composted and compost used 0.5×300
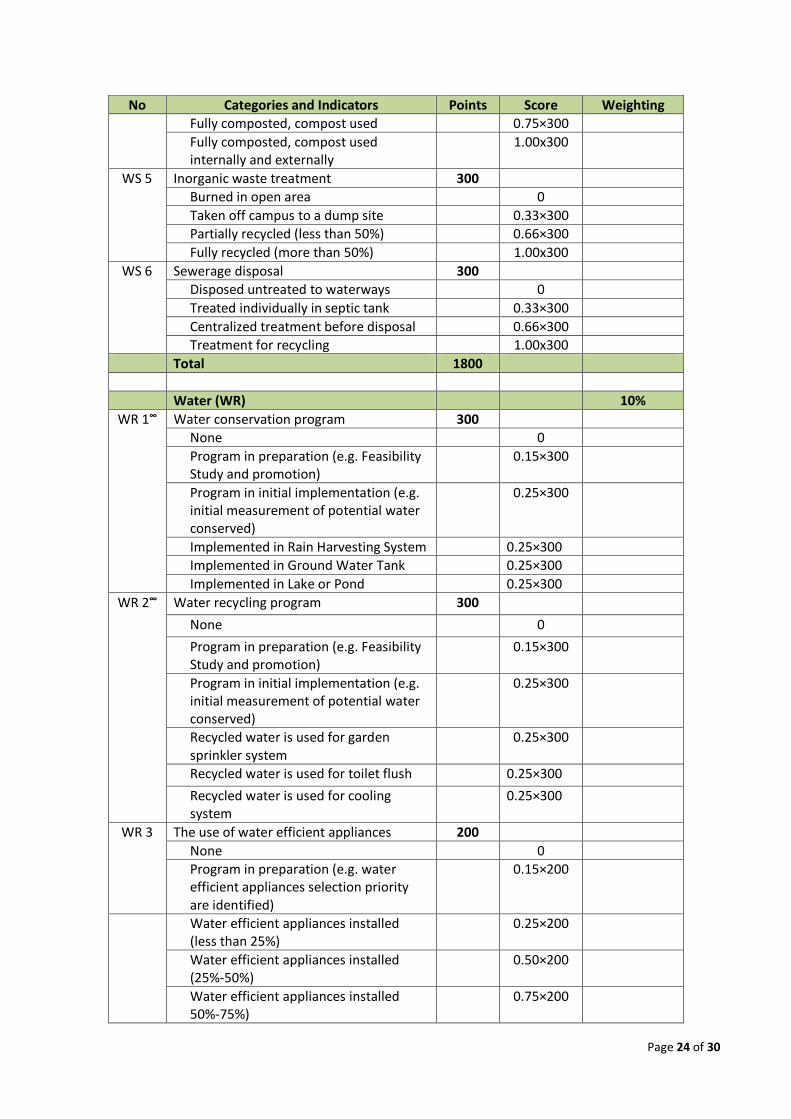
Page 24 of 30
No Categories and Indicators Points Score Weighting
Fully composted, compost used 0.75×300
Fully composted, compost used internally and externally
1.00x300
WS 5 Inorganic waste treatment 300
Burned in open area 0
Taken off campus to a dump site 0.33×300
Partially recycled (less than 50%) 0.66×300
Fully recycled (more than 50%) 1.00x300
WS 6 Sewerage disposal 300
Disposed untreated to waterways 0
Treated individually in septic tank 0.33×300
Centralized treatment before disposal 0.66×300
Treatment for recycling 1.00x300
Total 1800
Water (WR) 10%
WR 1∞ Water conservation program 300
None 0
Program in preparation (e.g. Feasibility Study and promotion)
0.15×300
Program in initial implementation (e.g. initial measurement of potential water conserved)
0.25×300
Implemented in Rain Harvesting System 0.25×300
Implemented in Ground Water Tank 0.25×300
Implemented in Lake or Pond 0.25×300
WR 2∞ Water recycling program 300
None 0
Program in preparation (e.g. Feasibility Study and promotion)
0.15×300
Program in initial implementation (e.g. initial measurement of potential water conserved)
0.25×300
Recycled water is used for garden sprinkler system
0.25×300
Recycled water is used for toilet flush 0.25×300
Recycled water is used for cooling system
0.25×300
WR 3 The use of water efficient appliances 200
None 0
Program in preparation (e.g. water efficient appliances selection priority are identified)
0.15×200
Water efficient appliances installed (less than 25%)
0.25×200
Water efficient appliances installed (25%-50%)
0.50×200
Water efficient appliances installed 50%-75%)
0.75×200
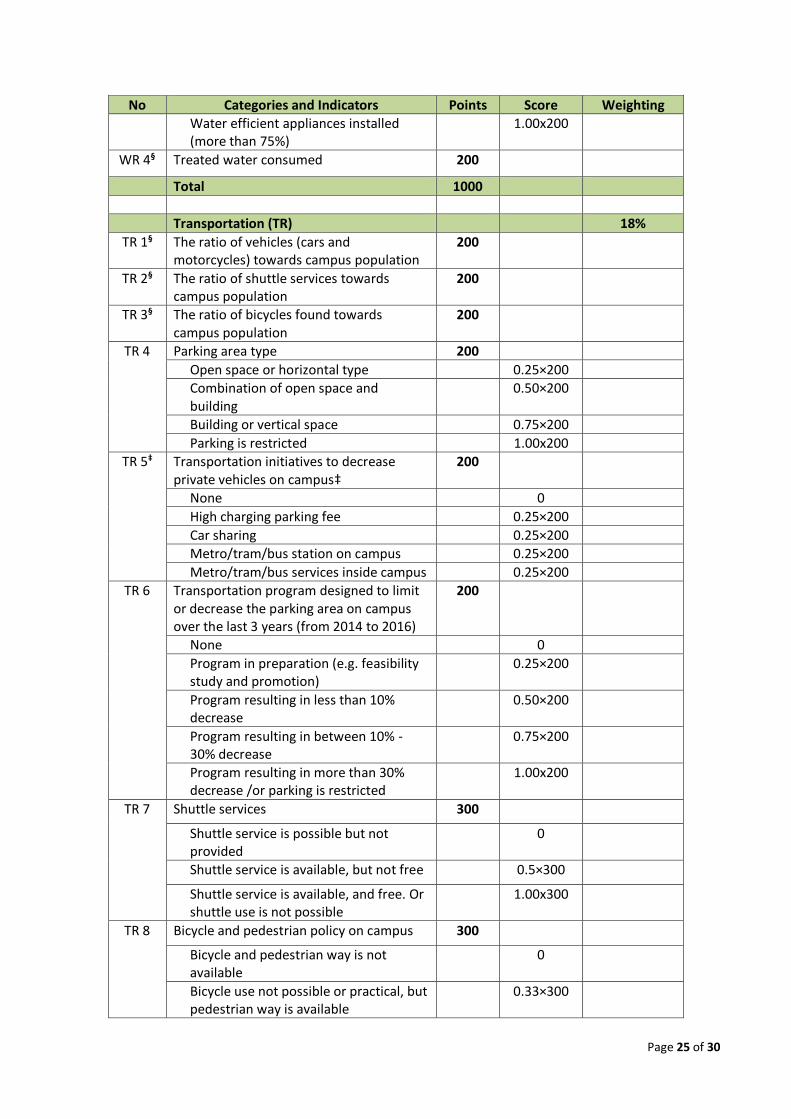
Page 25 of 30
No Categories and Indicators Points Score Weighting
Water efficient appliances installed (more than 75%)
1.00x200
WR 4§ Treated water consumed 200
Total 1000
Transportation (TR) 18%
TR 1§ The ratio of vehicles (cars and motorcycles) towards campus population
200
TR 2§ The ratio of shuttle services towards campus population
200
TR 3§ The ratio of bicycles found towards campus population
200
TR 4 Parking area type 200
Open space or horizontal type 0.25×200
Combination of open space and building
0.50×200
Building or vertical space 0.75×200
Parking is restricted 1.00x200
TR 5‡ Transportation initiatives to decrease private vehicles on campus‡
200
None 0
High charging parking fee 0.25×200
Car sharing 0.25×200
Metro/tram/bus station on campus 0.25×200
Metro/tram/bus services inside campus 0.25×200
TR 6 Transportation program designed to limit or decrease the parking area on campus over the last 3 years (from 2014 to 2016)
200
None 0
Program in preparation (e.g. feasibility study and promotion)
0.25×200
Program resulting in less than 10% decrease
0.50×200
Program resulting in between 10% - 30% decrease
0.75×200
Program resulting in more than 30% decrease /or parking is restricted
1.00x200
TR 7 Shuttle services 300
Shuttle service is possible but not provided
0
Shuttle service is available, but not free 0.5×300
Shuttle service is available, and free. Or shuttle use is not possible
1.00x300
TR 8 Bicycle and pedestrian policy on campus 300
Bicycle and pedestrian way is not available
0
Bicycle use not possible or practical, but pedestrian way is available
0.33×300
Page 26 of 30
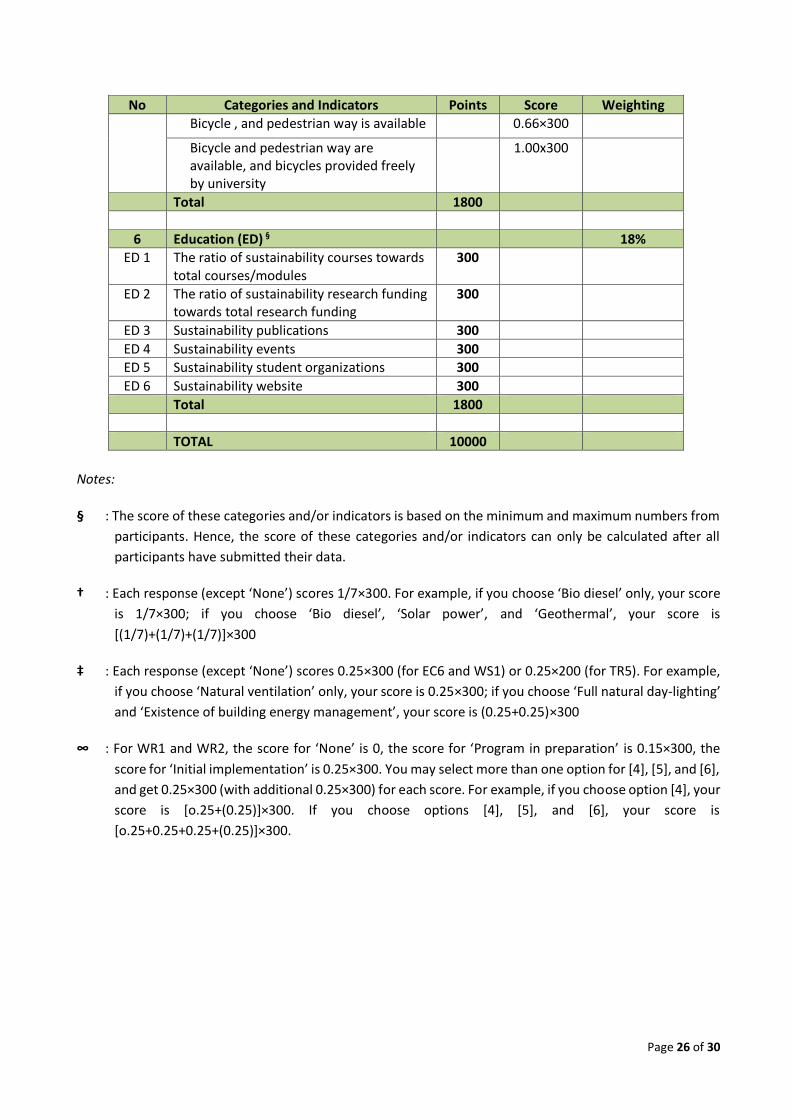
No Categories and Indicators Points Score Weighting
Bicycle , and pedestrian way is available 0.66×300
Bicycle and pedestrian way are available, and bicycles provided freely by university
1.00x300
Total 1800
6 Education (ED) § 18%
ED 1 The ratio of sustainability courses towards total courses/modules
300
ED 2 The ratio of sustainability research funding towards total research funding
300
ED 3 Sustainability publications 300
ED 4 Sustainability events 300
ED 5 Sustainability student organizations 300
ED 6 Sustainability website 300
Total 1800
TOTAL 10000
Notes:
§ : The score of these categories and/or indicators is based on the minimum and maximum numbers from
participants. Hence, the score of these categories and/or indicators can only be calculated after all
participants have submitted their data.
† : Each response (except ‘None’) scores 1/7×300. For example, if you choose ‘Bio diesel’ only, your score
is 1/7×300; if you choose ‘Bio diesel’, ‘Solar power’, and ‘Geothermal’, your score is
[(1/7)+(1/7)+(1/7)]×300
‡ : Each response (except ‘None’) scores 0.25×300 (for EC6 and WS1) or 0.25×200 (for TR5). For example,
if you choose ‘Natural ventilation’ only, your score is 0.25×300; if you choose ‘Full natural day-lighting’
and ‘Existence of building energy management’, your score is (0.25+0.25)×300
∞ : For WR1 and WR2, the score for ‘None’ is 0, the score for ‘Program in preparation’ is 0.15×300, the
score for ‘Initial implementation’ is 0.25×300. You may select more than one option for [4], [5], and [6],
and get 0.25×300 (with additional 0.25×300) for each score. For example, if you choose option [4], your
score is [o.25+(0.25)]×300. If you choose options [4], [5], and [6], your score is
[o.25+0.25+0.25+(0.25)]×300.
Page 27 of 30
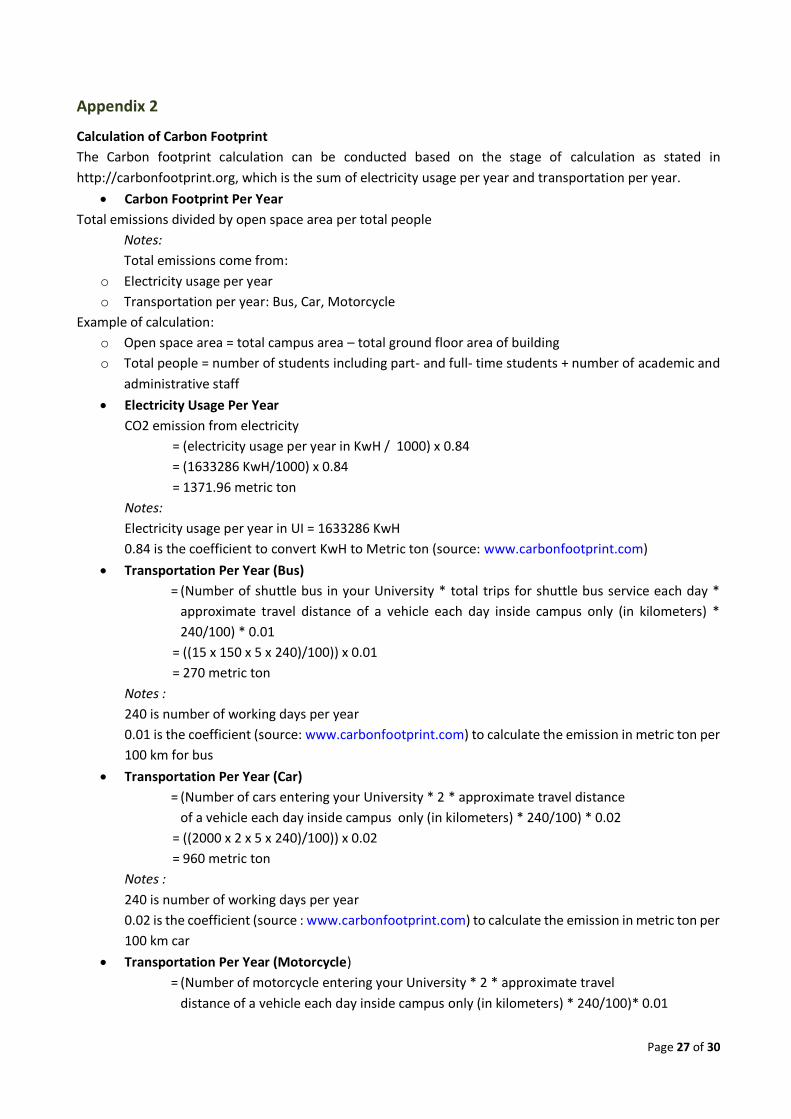
Appendix 2
Calculation of Carbon Footprint
The Carbon footprint calculation can be conducted based on the stage of calculation as stated in
http://carbonfootprint.org, which is the sum of electricity usage per year and transportation per year.
• Carbon Footprint Per Year
Total emissions divided by open space area per total people
Notes:
Total emissions come from:
o Electricity usage per year
o Transportation per year: Bus, Car, Motorcycle
Example of calculation:
o Open space area = total campus area – total ground floor area of building
o Total people = number of students including part- and full- time students + number of academic and
administrative staff
• Electricity Usage Per Year
CO2 emission from electricity
= (electricity usage per year in KwH / 1000) x 0.84
= (1633286 KwH/1000) x 0.84
= 1371.96 metric ton
Notes:
Electricity usage per year in UI = 1633286 KwH
0.84 is the coefficient to convert KwH to Metric ton (source: www.carbonfootprint.com)
• Transportation Per Year (Bus)
= (Number of shuttle bus in your University * total trips for shuttle bus service each day *
approximate travel distance of a vehicle each day inside campus only (in kilometers) *
240/100) * 0.01
= ((15 x 150 x 5 x 240)/100)) x 0.01
= 270 metric ton
Notes :
240 is number of working days per year
0.01 is the coefficient (source: www.carbonfootprint.com) to calculate the emission in metric ton per
100 km for bus
• Transportation Per Year (Car)
= (Number of cars entering your University * 2 * approximate travel distance
of a vehicle each day inside campus only (in kilometers) * 240/100) * 0.02
= ((2000 x 2 x 5 x 240)/100)) x 0.02
= 960 metric ton
Notes :
240 is number of working days per year
0.02 is the coefficient (source : www.carbonfootprint.com) to calculate the emission in metric ton per
100 km car
• Transportation Per Year (Motorcycle)
= (Number of motorcycle entering your University * 2 * approximate travel
distance of a vehicle each day inside campus only (in kilometers) * 240/100)* 0.01

Page 28 of 30
= ((4000 x 2 x 5 x 240)/100)) x 0.01
= 960 metric ton
Notes :
240 is number of working days per year
0.01 is the coefficient (source: www.carbonfootprint.com) to calculate the emission in metric ton per
100 km for motorcycle
• Total Emission Per Year
= total emission from electricity usage + transportation (bus, car, motorcycle)
= 1371.96 + (270 + 960 + 960)
= 3561.96 Metric ton
We compare between total emission per year and open space area per total people.
Page 29 of 30
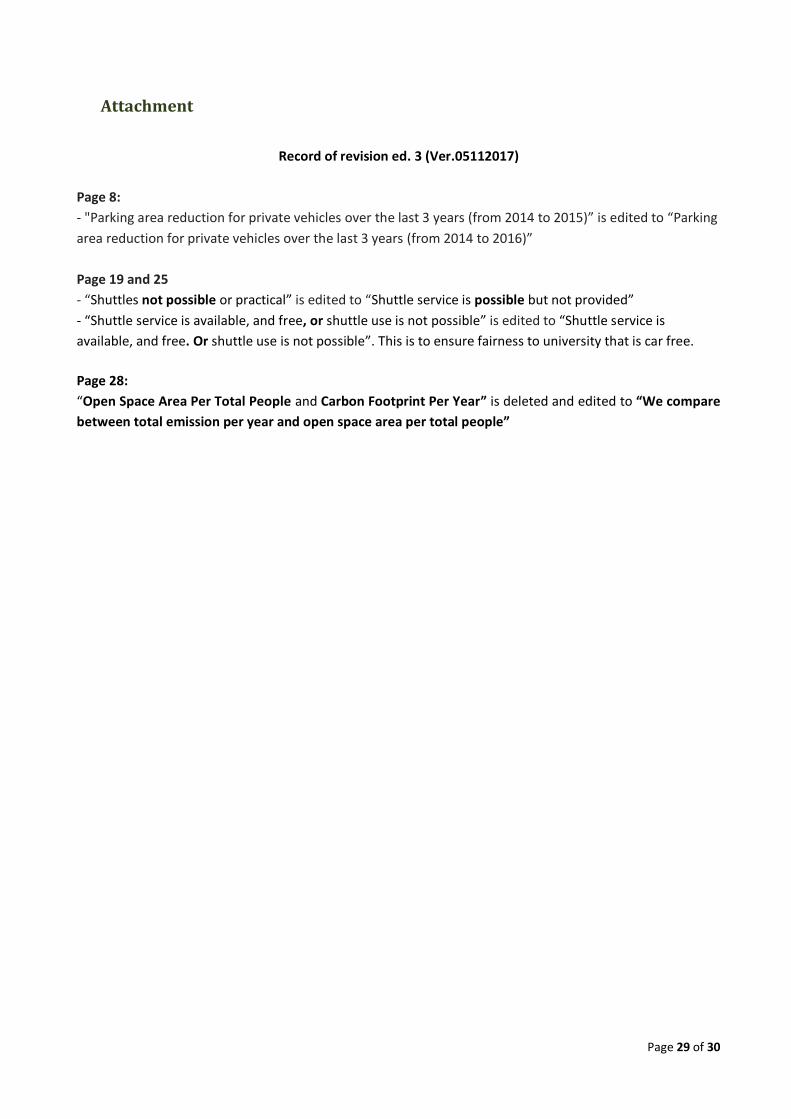
Attachment
Record of revision ed. 3 (Ver.05112017)
Page 8:
- "Parking area reduction for private vehicles over the last 3 years (from 2014 to 2015)” is edited to “Parking
area reduction for private vehicles over the last 3 years (from 2014 to 2016)”
Page 19 and 25
- “Shuttles not possible or practical” is edited to “Shuttle service is possible but not provided”
- “Shuttle service is available, and free, or shuttle use is not possible” is edited to “Shuttle service is
available, and free. Or shuttle use is not possible”. This is to ensure fairness to university that is car free.
Page 28:
“Open Space Area Per Total People and Carbon Footprint Per Year” is deleted and edited to “We compare
between total emission per year and open space area per total people”
UI Greenmetric Secretariat:
Integrated Laboratory and Research Center (ILRC)
Building 4th Fl, University of Indonesia
Kampus Baru UI Depok 16424, Indonesia
Email: [email protected]
Tel: (021) - 29120936
Mobile: 085779313834
Website: http://www.greenmetric.ui.ac.id/
© 2017