global production sharing and wage premium: … · premium: evidence from thai manufacturing’,...
TRANSCRIPT
Chapter 6
Global Production Sharing and Wage
Premium: Evidence from Thai
Manufacturing
Archanun Kohpaiboon Thammasat University, Thailand
Juthathip Jongwanich Asian Institute of Technology, Thailand
March 2013
This chapter should be cited as
Kohpaiboon, A. and J. Jongwanich (2013), ‘Global Production Sharing and Wage
Premium: Evidence from Thai Manufacturing’, in Hahn, C. H. and D. A. Narjoko (eds.),
Impact of Globalization on Labor Market. ERIA Research Project Report 2012, no.4,
pp.135-163. Available at: http:/www.eria.org/RPR_FY2012_No.4_Chapter_6.pdf

135
CHAPTER 6
Global Production Sharing and Wage Premium:
Evidence from Thai Manufacturing*
ARCHANUN KOHPAIBOON1
Thammasat University, Thailand
JUTHATHIP JONGWANICH
2 Asian Institute of Technology, Thailand
The paper examines wage premium across firms with emphasis on the effect of
global production sharing, using firm level data of Thai Manufacturing as the case
study. Our results show the effect of engaging into the global production network on
the wage skill premium varies across firms, depending on the extent to which firms
actively engage. The more active the firm, the larger the benefit expected from the
network. For active firms there are a wide range of activities, far beyond simple
assemble and unskilled-intensive activities, to be participated. This reduces the risk to
be trapped in the production network. The key policy inference is there is benefit from
globalization through global production sharing but is not automatic. The role of
government should emphasize adequate and qualified skilled workers in order to
facilitate the participation of indigenous firms in the network.
Keywords: Skill Premium, Wage differential, Global Production Sharing, Thai
Manufacturing
JEL: JEL: F14, F16, O14, O53
*The author would like to thank Prema-chandra Athukorala, Cassey Lee and Shujiro Urata for
several constructive comments and suggestions. We also benefit from comments and suggestions
received during the two workshops arranged by Economic Research Institute of ASEAN and East
Asia (ERIA). 1 Assistant Professor, Faculty of Economics, Thammasat University, Thailand,
[email protected] 2 Assistant Professor, School of Management, Asian Institute of Technology, Thailand,

136
1. Issues
International trade-wage nexus remains the ongoing debate in the context of
economic globalization. Even though the theoretical postulation from the standard neo-
classical trade theory highlights potential favorable impact on income distribution as a
result of proper resource allocation in line with the country’s comparative advantage and
hence narrowing a wage gap between unskilled and skilled workers (henceforth referred
to the wage premium), empirical results remain mixed at best. Such a favorable impact
is found only in some cases such as Mishra and Kumar (2005) of India, Bigsten &
Durevall (2006) for Kenya, Amiti & Cameron (2012) for Indonesia. There are a number
of empirical evidence (e.g. Currie & Harrison, 1997; Hanson & Harrison, 1999; Galiani
& Sanguinetti, 2003; Attansaio, et al. 2004; Goldberg & Pavcnik, 2007) where wage
premium is persistent. This raises concerns about the impact of globalization on income
inequality.
While the earlier explanation of the persistence of wage premium was on
imperfection of resource reallocation 3 and the protection structure 4 , it is far from
satisfactory (Goldberg & Pavcnik, 2007). The recent explanation is shifted toward the
role of firm heterogeneity. In particular, the recent study by Amiti & Davis (2011) lays
down theoretical ground connecting wages paid, firm performance and trade policy. That
is, firms with different performance would pay different wage and their performance is
related to whether and how firms are globally integrated, i.e. export final goods and
import intermediates. This is to a certain extent related to policy stance toward trade
liberalization.
On par, global production sharing is highlighted as a main cause of the persistence of
wage premium in developed countries (Feenstra & Hanson, 1996, 1997, 1999, and 2003).
3See details in Revenga (1997), Hanson & Harrison (1999), Feliciano (2001), Attanasio, et al. (2004),
Currie & Harrison (1997), Topalova (2004) and Wacziarg & Seddon (2004). Noticeably the results
are largely based on Latin American experience. 4 It was the unskilled labor-intensive sectors like that were protected the most prior to trade reform.
When trade liberalization takes place, inflated demand for unskilled workers as a result of protection
is diminished. Hence, the wage premium would increase. See Hanson &Harrison (1999) and
Robertson (2000; 2004) for Mexico; Currie & Harrison (1997) for Morocco; Attanasio, et al. (2004)
for Colombia.

137
The global production sharing is referred to a circumstance where the whole production
processes are divided into separated stages and economically allocated in many locations
according to competitiveness. Given the fact that developed countries are relatively
endowed by skilled labor as opposed to developing ones, this would positively affect the
relative demand for workers in the former. Empirical studies in this area is lopsided, most
of which examine the impact on developed countries. The effect on developing countries
is both theoretically and empirically unknown. In theory this could either narrow or
widen the wage premium in developing countries. As postulated in the standard HO
theory, activities located in developing countries as a result of global production sharing
would be unskilled-labor intensive so that participating to the global production sharing
would raise demand for unskilled workers and narrow the wage premium. On the other
hand, despite being regarded as unskilled-labor intensive in the context of developed
countries, activities could be skilled-labor intensive in the developing countries. In other
words, developing and developed countries could face different cones of production.
Therefore, global production sharing could induce more demand for skilled workers as
opposed to that for unskilled ones in both developing and developed countries
simultaneously. The impact on developing countries’ labor market is immense policy
relevant as there is growing concern in developing countries’ policymakers that
participating in the global production sharing could make their enterprises to be trapped
in low-skilled or low quality workers and retard technological advancement.
To the best of our knowledge so far, the role of firm heterogeneity and global
production sharing are yet brought under the common framework. Besides, research on
wage premium persistence has so far paid less attention on East Asia relative to developed
countries or Latin-American developing countries. Against this backdrop, this study aims
to examine the determinants of the wage premium by using plant level data of Thai
manufacturing as the case study. This study is distinct from previous studies by
incorporating the effect of global production network along with trade liberalization in
determining the wage premium. Three alternative measures of global production network
are used to ensure the robustness of our results while carefully controlling for firm and
industry specific factors.
Thailand is the excellent case study for the issue in hand for at least two reasons.
First, Thailand has been long engaged into the global production network by

138
multinational enterprises. This would have impact on the relative demand for unskilled
and skilled workers as well as the wage skill premium in the country. Secondly, despite
substantial progress in trade liberalization observed in the past two decades, many remain
to be done. The tariff peak remains unchanged, suggesting protection varies across
sectors. Such protection pattern across sectors is partly influenced by tariff escalation
structure, the key policy implication of import substitution industrialization ideology.
Tariff on finished products are still higher than that on intermediate products. Thus,
further liberalization on both input and output would still have some implication on
allocation of skilled and unskilled labor.
The rest of the paper is organized as follows. Section 2 presents analytical framework
of determinants of the wage skill premium. The brief discussion of the wage skill
premium in Thailand is presented in Section 3. Section 4 discusses the empirical model
while data and variable measurements are in Section 5. Section 6 discusses our empirical
results. Last section presents conclusions and policy inferences.
2. Analytical Framework
This section lays down analytical framework illustrating the effect of global
production sharing and the wage premium. The standard neo-classical trade model
postulates that opening up to the international trade would lead to specialization across
countries according to their comparative advantage. For developing countries whose
comparative advantage is determined by abundance of unskilled workers, opening up to
international trade would raise price of unskilled worker-intensive goods due to export
opportunity. In contrast, these countries would experience a decline in price of the
skilled-labor intensive products as a result of import surge. Changes in the relative price
would affect the relative demand for skilled and unskilled worker. Therefore, it is
expected that wage premium between skilled and unskilled workers would decline. This
would generate a favorable effect on income equality.
Such theoretical postulation is not always supported empirically. In some cases, the
gap was even widened (Goldberg & Pavcnik, 2007; Davis & Mishra, 2007). Earlier
139
explanations of the persistence of wage premium emphasize fiction in labor market that
constrains resource reallocation and the structure of protection. Nonetheless, they could
not be satisfactory in explaining the persistence of wage premium observed. For example,
imperfect labor mobility could be at best the short-run phenomenon and be less important
over time. It is unlikely to be different across firms. Interestingly, the premium is also
observed not only at the economy-wide level, but also within industries and within firms
(Pavcnik, et al. 2004; Verhoogen, 2008).
The research direction is shifted toward firm heterogeneity. Pioneered by Melitz
(2003), the firm heterogeneity literature raises possibility that firms in a given industry
can have different productivity and so behave noticeably different, including wage paid
to their workers. The link between firm heterogeneity is explicitly pronounced in the
general equilibrium framework developed by Amiti & Davis (2011).5 While the model
workhorse is based on Melitz (2003) where firms’ productivity is not unique, Amiti &
Davis (2011) add two additional features into the general equilibrium model. The first
feature is the fair-wage constraint to create link between wages paid and firm
performance. In the fair-wage constraint, workers employed in the high productivity
firms tend to receive higher wages. The second feature in Amiti & Davis (2011: 5) is
firms’ productivity and modes where firms are globally integrated, i.e. export final goods,
import intermediates, or both. The key theoretical proposition in Amiti & Davis (2011)
is wage paid by firms exporting final goods, importing intermediates and doing both is
higher than those without the direct link to the global.
Another branch of literature focuses the effect of participating in global production
sharing. As mentioned above, global production sharing refers to a circumstance where
the whole production processes are divided into separated stages and economically
allocated in many locations according to competitiveness. There are three phases in the
global spread of production sharing (Athukorala, forthcoming). It begins with two-way
exchange between home and host country where parts and component assembly/testing
in the host country to be incorporated in final assembly in the home country. The next
phase is component assembly networks encompassing many host countries whereas
R&D, final assembly and head-quarter functions are still in the home country. The final
5 This study also conducts empirical analysis, using Indonesian manufacturing

140
phase is the full-fledged production networks involving component
production/assembly/tenting and final assembly encompassing host countries. In the last
phase, R&D and head-quarter functions only perform predominantly in the home country.
This would affect the relative demand for skilled and unskilled workers in countries
participating in the global production sharing.
The effect of relative worker demand in the developing countries is ambiguous. On
the one hand, relatively unskilled-labor intensive activities would be located in
developing countries according to their comparative advantage. When specialization in
global production network continues, the wage gap between unskilled and skilled workers
would be narrow down. Nonetheless, the discussion above is under the implicit
assumption that there is a single production cone where there would not be any factor
intensity reversal and firms in developed and developing countries are facing the same
factor endowment vector. In reality, a number of studies point such an assumption is
rather restrictive (Leamer & Levinsohn, 1995; Feenstra, 2004; Leamer, et al., 2005;
Kiyota, 2012). For example, consider the footwear industry. While much of the footwear
in the world is produced in developing countries, the US retains a small number of plants,
e.g. New Balance has a plant in Norridegewock, Maine. Operation there is full with
computerized equipment. This is a far cry from the plants in Asia and China in particular
which using traditional production technology and rely heavily on workers. Therefore,
for any given activity, it can be regarded as unskilled in the North but skilled labor
intensive in the South. Unskilled labor intensive activities outsourced by firms in
developed countries might require relative skillful workers in developing countries to
perform.6 Therefore, it is possible that demand for skilled to unskilled workers increases
in both developing and developed countries simultaneously so that the wage gap is
persistently observed.
6 See the similar evidence in Isaacsan (2011: Chapter 41), the conversation between US President
Barak Obama and Apple Inc. CEO Steve Job. Particularly, Apple had 700,000 factory workers
employed in China, he said, and that was because it needed 30,000 engineers on-site to support those
workers. “You can’t find that many in America to hire”, These factory engineers did not have to be
PhDs or geniuses; they simply needed to have basic engineering skills for manufacturing”. Such
factory engineers are unlikely to be unskilled workers in China as well.

141
3. Wage Premium in Thai Manufacturing
Wages in Thailand are largely determined by the market as The Thai labour force is
largely non-unionized. Domestic and foreign investors have been able to carry on their
business activities without any fear of labour problems. This is a result of the abolition
of the Labour Act of 1956. Establishing labour unions, as well as any form of labour
movement, was prohibited until 1978, when the Labour Act was amended to allow firms
to set up labour unions under the auspices of the Labour Relations Law. Nevertheless,
there has not been any threat of labour unions in Thai manufacturing. In addition, despite
the presence of minimum wage regulations since 1973, their impact on actual wage
behaviour has been low in Thailand (Kohpaiboon, 2006).
Figure 1 illustrates (real) wage pattern in Thailand between 1990 and 2009. Real
wage in Thailand grew at the relatively rapid rate between 1990 and 1996, the pre-crisis
era. The annual growth rate was 10.4 per cent during this period. As a result, Thai baht
experienced real appreciation, deteriorating international competitiveness and eventually
causing the economy to be succumbed to the crisis in 1997/98. When the economy
experienced the 1997/98 crisis, real wage dropped. Not until 2000, real wage has grown
noticeably. From 2002 and 2009, the real wage grew at 1.7 per cent and showed a
noticeably upward trend.
Figure 1: Wage Pattern in Thailand between 1990 and 2009
30
40
50
60
70
80
90
100
110
120
19
90
19
91
19
92
19
93
19
94
19
95
19
96
19
97
19
98
19
99
20
00
20
01
20
02
20
03
20
04
20
05
20
06
20
07
20
08
20
09

142
The upward trend of real wage in Thailand was associated with the low and declining
unemployment rate by developing country standard. In 2011, unemployment rate in
Thailand was 0.7 per cent. Such a rate was much lower than the neighbors in Southeast
Asia, e.g. Malaysia (3 per cent), Indonesia (6.6 per cent), Vietnam (2.0 per cent). This
rather suggests the tightening labor market condition in Thailand.7 Interestingly, patterns
of employment share by sectors (i.e. agriculture, manufacturing and service) suggest labor
tightening in manufacturing sector is getting more serious. Employment share in the
manufacturing sector slighted changed in a small range between 13.6 and 15.8 per cent
during the period 1994-2011. It was the service sector absorbing workers from the
primary sector (agricultural and mining). In 2011, the employment share of service sector
was approaching 50 per cent, increasing from 35.6 per cent in 1994. By contrast, the
share of primary sector dropped from 50.5 per cent in 1994 to 38.8 per cent in 2011
(Figure 2).
Figure 2: Employment Share in Thai Economy 1994-2011
Source: Key Indicator of Asia and the Pacific 2012, Asian Development Bank (ADB).
7 Data for unemployment reported here are the latest available from Key Indicator of Asia and the
Pacific 2012, Asian Development Bank (ADB).
0
10
20
30
40
50
60
Manufacturing Sector
Service Sector
Primary Sector (Agricultural and Mining Sectors)

143
Wage differentials across industries in Thailand are observed but limited. Its estimate
of diary wage was concentrated in 300-600 baht in 2006. By contrast, wage tends to vary
significantly across firms as postulated in the firm heterogeneity literature. Table 1 shows
a simple regression in order to illustrate statistical relationship between wage and several
firm characteristics such as size, whether firms import intermediates, whether firms
export.8 The observed pattern is larger plants and those engaged with international
activities (either export or import) pay higher wage for production workers (henceforth
referred to blue collar workers) than domestically-oriented ones within industries even
after controlling for the skill share among production workers (Columns A and B in Table
1).
Table 1: Wage Across Firms in Thai Manufacturing in 2006
Production Workers Non-production workers
A B C D
Without
Industry
Dummies
With Industry
Dummies
Without
Industry
Dummies
With Industry
Dummies
Intercept 8,89 9,87 8,07 8,7
-349,5 -24,1 -47,51 -13,6
Export share 0,001 0,002 0,002 0,002
-6,27 -9,45 -8,07 -7,5
Import share 0,004 0,002 0,004 0,003
-16,6 -10,2 -11,3 -9,73
Size (output) 0,11 0,09 0,051 0,054
-75,6 -61,8 -17,6 -17,9
Skillshare 0,28 0,12
-22,1 -10,1
Wage of production
workers
0,24 0,19
-15,8 -12
Ad-R2 0,2574 0,41 0,09 0,1102
Source: Authors’ Calculation.
8 The regression does neither aim to estimate wage determination-Mincer-styleequation and nor infer
the causality relationship of wage and other key firm-specific characteristics. It is mainly used for
statistic discussion only.

144
When non-production workers (henceforth referred to white collar workers) are
concerned, the similar regression exercise is applied. That is, wage of white collar
workers is regressed with size, mode of engaging international activities, and wage of
blue collars. The latter is introduced to see whether wage of non-production workers is
generally higher than that of production workers. The results in Columns C and D in
Table 1 are to a large extent similar to Columns A and B where large plants and those
engaged with international activities (either export or import) pay higher wage than
domestically-oriented ones within industries. In addition, non-production workers tend
to receive higher wage than production workers. In other words, wage premium exists in
Thai manufacturing.
Figure 3 presents the scatter plot illustrating difference in wage paid and types of
employed workers across industries according to the extent to which they are engaged to
global production sharing. The share of parts and component imports to total imports is
used as a proxy for the extent to which industries are engaged to global production
sharing.9 In Figure 3a, there is to a certain extent positive relationship between the wage
gap and the share of parts and component imports across industries. This suggests that
the wage gap tends to be higher as industries are increasingly engaged into global
production sharing. The same positive relationship is found between the share of
production to total workers and the share of parts and components imports despite less
clear (Figure 3b).
9 See discussion of the use of parts and component import shares as a proxy for the extent to which
industries are engaged to global production sharing.

145
Figure 3a: Ratio of Non-production to Production Wage
Figure 3b: Ratio of Production to Total Workers Across Industries
-0,6
-0,4
-0,2
0
0,2
0,4
0,6
0,8
1
0 0,2 0,4 0,6 0,8 1 1,2
0,3
0,35
0,4
0,45
0,5
0,55
0,6
0,65
0,7
0,75
0 0,2 0,4 0,6 0,8 1
Share of parts and components imports
Rat
io o
f pro
duct
ion to t
ota
l w
ork
ers
Ratio o
f non-p
roduct
ion t
o p
roduct
ion w
age
(in
natu
ral lo
g)
Share of parts and components to total
imports

146
4. The Empirical Model
The empirical model employed in Amiti & Cameron (2012) is used as a point for
departure. That is, the wage premium (Ws/Wu), the ratio of wage compensation of skilled
worker to unskilled workers is a function of a set of firm specifics including size
(outputi,j), export (EXi,j) and import (IMi,j) status, firms’ ownership (FORi,j).10 In addition,
three additional firm-specific variables are introduced. They include the level of fixed
asset stock capturing the degree of capital deepening at the plant level, the ratio of female
to total worker to examine any possible gender bias, and the region which equals to 1 for
Bangkok and Vicinity and 0 otherwise.
Since the definition of blue and white collar workers in micro dataset can vary from
one to others, dataset-specific aspect in this regard must be taken into consideration. For
Thailand’s industrial census 2006, a number of blue collar workers employed at the plant
are further disaggregated into skilled and unskilled blue workers. The former refer to
supervisors who have long experience and are skillful to look over production lines so
they should be regarded as white collars. Unfortunately, in the dataset, wage
compensations paid to the operation workers are not separated and makes impossible to
re-define more precise wage compensation of true white collar. Hence, to mitigate this
problem, ,i jskillshare , the ratio of skilled to total operation worker, is introduced as one
controlling firm-specific variable for the wage premium equation. The higher value of
,i jskillshare implies that the denominator in the wage premium includes some belonging
to actual skilled workers.
Similar to Amiti & Cameron (2012), input and output tariffs are separated in
determining possible different effect of input and output trade liberalization on the wage
premium in this paper. As argued in Amiti & Cameron (2012) when domestically-
produced inputs are perfectly substitutes by imported ones and input production is more
skilled worker intensive, cutting input tariffs encourages firms to import instead of buying
locally-produced ones. This would reduce demand for skilled workers and, certaris
10 Note that in Amiti & Cameron (2012) the model also includes government ownership perhaps due
to the fact that state-owned firms seem to be relevant for Indonesia. By contrast, state-owned firms in
the manufacturing sector in Thailand were rare so it is excluded in our model.
147
paribus, the wage premium would be narrower. The effect of output tariff would have
the same effect, i.e. reduction in output tariff resulting in a decline in the wage skill
premium. However, it is possible that reduction in output tariff would not have any
significant impact because of the switching effect taking place when firms are to shift
production between multiple products with different factor intensity. Otherwise, firms
must continue in business due to presence of sunk and fixed cost in export business.
Interaction terms these trade liberalization variables with the extent to which firms are
engaged to the international business (export and import) are introduced. The positive
sign is expected for these interaction terms on the wage skill premium.
As mentioned in Section 2, engaging into the global production sharing can have an
implication on the wage skill premium. Ideally, to capture the effect of global production
network jGPN on wage premium, details at firm level (e.g. whether firms are actually
engaged to MNEs’ production network, whether they import tailor-made raw materials
for specific customers, etc.) are needed. Unfortunately, such details at the firm level are
not available for Thai dataset.
In this study, therefore, three alternative proxies are used; First, the share of parts
and component imports to total imports 1jGPN is used to indicate the extent to which
an industry is engaged into the production network. The higher the imported share, the
more important the global production network on the industry. Parts list is a result of a
careful disaggregation of trade data based on the Revision 3 of the Standard International
Trade Classification (SITC, Rev 3) extracted from the United Nations trade data reporting
system (UN Comtrade database).11 It is important to note that the Comtrade database
does not provide for the construction of data series covering the entire range of
fragmentation-based trade. Parts list used here is from that developed in Athukorala &
Kohpaiboon (2009).12 To convert SITC to ISIC, the standard concordance is applied.
11 For details on the decomposition procedure, see Athukorala (2005). The list of parts and
components is available on request. 12 Using lists of parts in Board Economics Classification (BEC) 42 and 53 as a point to departure.
Note that parts in BEC 211 are not included as they are primary products which are usually classified
as traditional rather than fragmented-intermediates.12 Additional lists of parts are included based on
firm interview in Kohpaiboon (2009). Data on trade in parts are separately listed under the commodity
classes of machinery and transport equipment (SITC7) and miscellaneous manufacturing (SITC8).
Based on firm interview in Kohpaiboon (2009).

148
Second, the ratio of parts trade (the sum of imports and exports) to total goods trade
is used 2 jGPN . This is due to the fact that firms might be engaged into the global
production network as parts suppliers, focusing on parts import might mislead to a certain
extent. Using trade instead of import would mitigate such a problem as well as acts as
the robustness check for GPN proxy.
Third, zero-one dummy variable 3 jGPN is used. The dummy variable equals to
one for industries in electronics, electrical appliances, and automotive 13 and zero
otherwise., It is these three industries, in which global production network takes place
intensively as suggested by previous empirical studies (Athukorala, forthcoming;
Kohpaiboon & Jongwanich, 2013).
As argued in Kohpaiboon (2009) and Kohpaiboon & Jongwanich (2013) based on
the firm-case study analysis in Thailand, benefits firms could gain from the network are
not automatic, largely depending on how active firms participate. Some firms gain
substantial benefits from the network and smoothly move up from relatively simple to
more complicated activities. Simultaneously there are the others that are trapped to a
relatively simple unskilled-worker intensive activity. This would have significant impact
of relative demand for skilled and unskilled workers. To examine this argument, the
interaction term between jGPNi and ,i jskillshare is introduced. ,i jskillshare is used as a
proxy to measure how active the firm participates in the network. That is, the higher the
number of employed skill blue collar workers, the more active the firm. The positive sign
of the interaction term is expected. All in all, the overall impacts of engaging into the
global production network also depend on the proportion of skilled and unskilled workers
varying across firms.
The final departure from Amiti & Davis (2012) is to introduce two additional
industry-specific factors instead of heavily relying on industry-specific dummy.14 The
first one is industrial concentration (CRj). In general, industries with high barriers to entry
are likely to be concentrated as it would be relatively more difficult for new entrants to
13 It includes ISIC 2911, 2913, 2915, 2919, 2921, 2922, 2923, 2924, 2925, 2926, 3000,3110, 3120,
3220, 3230, 3311, 3312,3313, 3320, 3330, and 3410. 14 When these two industry-specific variables are introduced into the model, zero-one industry
dummies turn out be statistically insignificant.

149
involve. Such industries are often capital and/or skilled intensive. Hence, in the highly
concentrated industry, demand for skilled workers would be higher and the wage
premium is observed. On the other hand, the effect of industrial concentration could be
negative. As argued in the firm heterogeneity literature, productivity could vary across
firms in a given industry. Over the period, low productivity firms would be faded out so
that the observed industrial concentration would be the outcome that only high productive
firms are operating. This could occur in the unskilled-worker intensive industry where
developing countries like Thailand gain international competitiveness. In this study,
industrial concentration is measured by the sum of sale share of top-4 firms to total.
Theanother industry-specific variable is output growth (GROWTHj) and its
interaction with ,i jskillshare to capture dynamics in labor movement. In general, in
industries which experience rapid output expansion, there would be greater demand for
inputs including labor. Arguably it would be relatively easier for firms in a rapid-
expansion industry to hire unskilled workers relative to skilled ones so that the negative
sign would be expected. To test this hypothesis, both output growth (GROWTHj) and its
interaction with ,i jskillshare . The hypothesis would hold if the coefficients associated
with output growth (GROWTHj) and its interaction with ,i jskillshare are negative and
positive, respectively. That is, while output growth tends to narrow the wage premium,
the impact on wage premium is less for the relatively skilled worker intensity.
All in all, the empirical model employed in this study is as followed;
0 1 2 , 3 4 ,,
5 6 , 7 , 8 , 9 ,
10 , 11 , 12 , 13
/ _ _
+ _ +
+
s u j i j j i ji j
j j i j i j i j i j
i j i j i j
W W inputtariff input IM outputtariff output EX
GPN GPN Skillshare SIZE EX IM
Capital FOR femaleratio S
, 14 ,
15 16 17 , , + _
i j i j
j j j i j i j
killshare region
CR Growth Growth Skillshare
where
,
/s u i jW W = the wage premium of firm i in industry j, measured by the ratio
between

150
wage compensation per workers of non-operation to operation workers
(in
natural logarithm)
inputtariffj (+) = Tariff on raw materials in industry j
input_IMi,j (+) = Interaction term between input tariff and the share of raw material
imports of firm i in industry j
outputtariffj (+) = Tariff on finished products in industry j
output_EXi,j (+) = Interaction term between output tariff and export share of firm i in
industry j
jGPN (?) = Degree that industry j is engaged into the global production network15
GPN_skillsharei,j (+) = Interaction term between degree that industry engaged into the
global production network and labor skill share
,i jSIZE (+) = size of firm i in industry j measured by output (in natural logarithm)
,i jEX (+) = the share of exports of firm i in industry j;
,i jIM (+) = the share of raw material imports of firm i in industry j;
,i jFOR (+) = foreign ownership of firm i in industry j; (1 = foreign firms;
0otherwise)
Capitali,j (+) = Capital of firm i in industry j (in natural logarithm)
female_malei,j (+) = The ratio of female to male workers
,i jSkillshare (-) = Ratio of skill operational workers to total operation workers of firm i
in industry j
regioni,j (-) = Location of firm i in industry j (1 = Bangkok and Vicinity; 0
otherwise)
jCR (?) = Industrial concentration of industry j, measured by the share of top-4
output
plants to total plants in industry j.
jGROWTH (-) = (Real) Output growth of industry j
,i j = Disturbance terms of firm i in industry j
15 See full discussion of the variable measurement in Section 3.
151
5. Data
Data for the study are compiled from unpublished returns to the Industrial Census
2006, the latest industrial census available, conducted by the National Statistics Office
(NSO). A well-known limitation of the cross-sectional data set with each industry
representing a single data point is that they make it difficult to control for unobserved
industry specific differences. Long-term averages tend to ignore changes that may have
occurred over time in the same country. These limitations can be avoided by using the
panel data set compiled by pooling cross-industry and time-series data. Particularly,
when our key interest is the wage premium, panel data at firm level with a comprehensive
information on wage compensation and workers at the disaggregate level, i.e. workers are
properly classified by unskilled, skilled, scientists and office workers.
Unfortunately, given the nature of data availability in this case, this preferred data
choice is not possible. So far there are two industrial census sets, i.e. 1996 and 2006, both
are establishment-level data. Even though both of them provide establishment
identification number, the number is not assigned systematically. For a given ID No., an
establishment in 1996 is not necessarily the same as that in 2006.
The census covers 73,931 plants, classified according to four-digit industries of
International Standard of Industrial Classification (ISIC). The census was cleaned up by
firstly checking duplicated samples. As occurred in the 1996 industrial census, there are
some duplicated records in survey return, presumably because plants belonging to the
same firm filled the questionnaire using the same records. The procedure followed in
dealing with this problem was to treat the records that report the same value of the eight
key variables of interest in this study, are counted as one record. The eight variables are
registered capital, number of male workers, number of female workers, sale value, values
of (initial and ending periods) capital stocks, value of intermediates and initial stock of
raw materials. There are 7,992 such cases so that the final sample drops to 65,940
plants.16 In addition, we delete establishments which had not responded to one or more
the key questions such as sale value, output and which had provided seemingly unrealistic
16 For robustness check, we alter the criteria from 8 to 7 variables (excluding initial raw materials),
the number of duplicated samples slightly increase to 8,067 samples. Hence, we strict with our initial
criteria to maintain as much samples as possible in our analysis.

152
information such as negative output value or the initial capital stock of less than 5,000
baht (less than $200).17
The 2006 census contains a large number of micro-enterprises defined as the plants
with less than 10 workers. There are 39,152 samples which employ less than 10 workers,
out of which 52 per cent of which are micro enterprises which do not hire paid workers
(zero paid workers). The problem of self-employed samples is less severe when
considering the samples with more than 10 workers (1,623 samples out of 26,788).
Hence, our analysis focuses on samples with more than 10 workers net of self-employed
firms. Seven (7) industries that are either to serve niches in the domestic market (e.g.
processing of nuclear fuel, manufacture of weapons and ammunition), in the service
sector (e.g. building and repairing of ships, manufacture of aircraft and spacecraft, and
recycling) or explicitly preserved for local enterprises (e.g. manufacture of ovens,
furnaces and furnace burners, manufacture of coke oven products) are excluded. All in
all, these remained establishment plants accounted for 75% of the Thailand’s
manufacturing gross output and 62% of manufacturing value added in 2006.
In the census, Thai firms are reluctant to share wage compensation information. This
is especially true for non-operation workers (white collars). There are only 13,809
samples providing both wage compensation for operation and non-operation workers.
Among them, there are 2,940 firms that report compensation per operation workers
greater than and equal to that of non-operation workers. It seems unrealistic to observe
such a pattern given the definition of non-operation workers used in the census and labor
market situation in Thailand where most of office workers attain the undergraduate degree
and receive higher wage than those in the production line. Hence, those samples are
excluded and the final sample size drops to 10,706 firms.
Gross output and its corresponding price deflators are from National Economics and
Social Development Board (NESDB). The annual growth rate is based on gross output
at constant price (1988). Trade data are compiled from UN Comtrade and the standard
concordance between ISIC and HS is used. Nominal rate of protection is fresh calculated
in this study based on official data provided by Custom Duty, Ministry of Finance. CR4
17 If we alter to 10,000 baht the number to be dropped increased to 1,289 samples (another 500 samples
dropped).

153
is obtained from Kophaiboon & Ramstetter (2008) in which the concentration is measured
at the more aggegrate level (e.g. many measured at the 4-digit whereas some at the 3-digit
ISIC classification) to guard against possible problems arising from the fact that two
reasonably substitutable goods are treated as two different industries according to the
conventional industrial classification at high level of disaggregation.
Our tariff data is at the 6-digit HS code level. To calculate tariff on raw material,
concordance between 6-digit HS code level and input-output table is developed. The
weight of inputs in each product is calculated by using information from IO table. The
formula to calculate input tariff is as follows:
1
n
i ij ii
inputtariff a t
where ti = nominal tariff on product ith
aij
i
n
1
= the sum of the shares of intermediate inputs (1, …, n) in the output value of
product jth
Since the data from the industrial census is based on the TSIC classification,
concordance between input-output and TSIC classifications is developed to obtain the
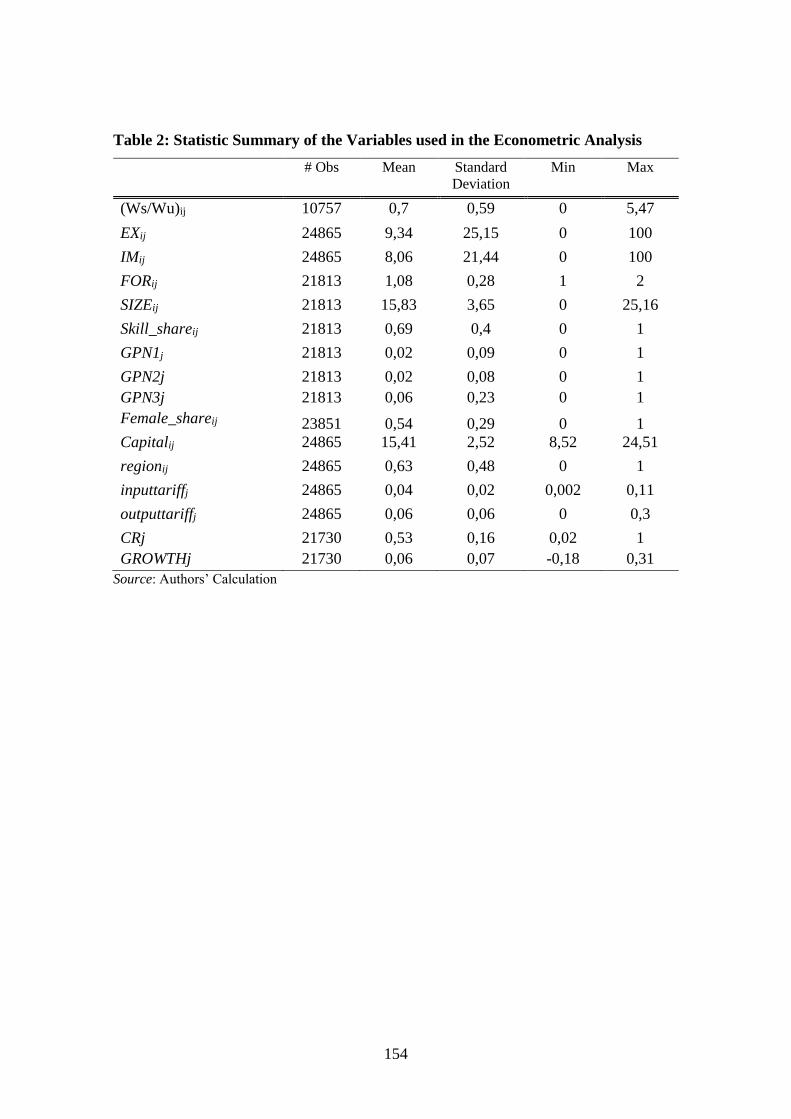
input and output tariff in each industry. Tables 2 and 3 provide a statistical summary as
well as a correlation matrix of all relevant variables in this analysis.
154
Table 2: Statistic Summary of the Variables used in the Econometric Analysis
# Obs Mean Standard
Deviation
Min Max
(Ws/Wu)ij 10757 0,7 0,59 0 5,47
EXij 24865 9,34 25,15 0 100
IMij 24865 8,06 21,44 0 100
FORij 21813 1,08 0,28 1 2
SIZEij 21813 15,83 3,65 0 25,16
Skill_shareij 21813 0,69 0,4 0 1
GPN1j 21813 0,02 0,09 0 1
GPN2j 21813 0,02 0,08 0 1
GPN3j 21813 0,06 0,23 0 1
Female_shareij 23851 0,54 0,29 0 1
Capitalij 24865 15,41 2,52 8,52 24,51
regionij 24865 0,63 0,48 0 1
inputtariffj 24865 0,04 0,02 0,002 0,11
outputtariffj 24865 0,06 0,06 0 0,3
CRj 21730 0,53 0,16 0,02 1
GROWTHj 21730 0,06 0,07 -0,18 0,31
Source: Authors’ Calculation

155
Table 3: Correlation Matrix of The Variables used in the Econometric Analysis
(Ws/W
u)ij
EX
ij
IM
ij
FO
Rij
SIZ
Eij
Skill_sha
reij
Female_sha
reij
Capita
lij
inputtari
ffj
outputtar
iffj
GPN
1j
GPN
2j
GPN
3j
CR
j
GROWT
Hj
(Ws/Wu)ij 1,00
EXij 0,09 1,00
IMij 0,08 0,33
1,00
FORij 0,05 0,32
0,3
2 1,00
SIZEij 0,08 0,27
0,2
3 0,23 1,00
Skill_shareij
-0,05 0,00
-0,0
1 0,01 -0,07 1,00
Female_sha
reij 0,09 0,23
0,0
8 0,06 -0,02 -0,03 1,00
Capitalij 0,08 0,29
0,25 0,29 0,55 -0,08 -0,01 1,00
inputtariffj 0,00 0,06
0,0
6 0,10 0,12 -0,01 -0,11 0,09 1,00
outputtariffj -0,02 0,01
0,0
5 0,05 0,04 0,03 -0,15 0,00 0,39 1,00
GPN1j 0,01 0,08
0,09 0,10 0,09 -0,01 0,02 0,05 0,22 0,08 1,00
GPN2j 0,01 0,06
0,1
1 0,11 0,08 0,01 0,01 0,06 0,22 0,13 0,91 1,00
GPN3j -0,01 0,06
0,1
4 0,14 0,07 0,03 -0,08 0,07 0,38 0,15 0,04 0,06 1,00
CRj 0,00 0,01
0,11 0,05 -0,02 0,06 0,04 -0,03 0,05 0,14 0,07 0,08 0,24
1,00
GROWTHj
-0,05 -
0,09 0,00 0,06 0,00 0,02 -0,23 0,03 0,15 0,22 0,08 0,16 0,17
-
0,01 1,00
regionij 0,05
-
0,02
0,1
0 0,06 0,10 0,02 0,04 0,04 -0,01 0,01 -0,01 0,04 0,08
0,1
4 0,07
Source: Authors’ Calculation.

156
6. Results
The equations are estimated using the ordinary least squares (OLS) method while
paying attention to the possible presence of outliers as well as the performance in
functional form. Cook’s Distance is applied here to identify suspected outliers. Table 4
provides all the estimation results. In general, all equations in Table 4 perform well in
the overall fitness (Wald/F-test). The results with and without the Cook’s Distance
detected outliers are not much different except minor changes in statistical significance.
Three alternative proxies of global production network yielded basically comparable
results. The following discussion focuses on the results based on the trade share of parts
and components to total 1GPN . This choice was made on the basis of the better
performance on overall fit.
The intercept is positive and statistically significant in all cases, suggesting that the
wage skill premium is persistent. Wage compensation paid for white collar workers is on
average 38-43 per cent higher than that for blue collar ones, given the other controlling
factors.
The coefficient on output tariff is positive and statistically significant. The wage
premium is relatively high in firms operating under the high output tariff. This would
reflect unfinished business in tariff restructuring in Thailand. Despite targeting 3 tariff
rates (0-1, 5 and 10 per cent), there are more than one forth of tariff lines yet in the 3 rates
structure. When we examine top 20 in terms of output, they are rather capital intensive
where there would be more demand for skilled workers. This finding is in line with neo-
classical trade model, opening up to the international trade would lead to specialization
across countries according to their comparative advantage. A coefficient on the
interaction term with export share is statistically insignificant. This would not be
surprised. In an industry where firms already export, output tariff is quite low. They are
not capital intensive as opposed to those subject to heavy tariff protection.

157
Table 4: Estimations of Three Alternatives of Global Production Sharing Measures
Notes: t-stat is based on robusted standard error; *, **, and *** indicate the statistical significant level at 10,5 and 1 per cent, respectively.
Source: Authors’ Calculation
Coeff t-stat Coeff t-stat Coeff t-stat Coeff t-stat Coeff t-stat Coeff t-stat
Intercept 0.43***
7,02 0.33*** 7,11 0.42*** 7 0.32*** 7,05 0.42*** 6,84 0.32*** 7,02
inputtariff j -0,18 -0,61 -0.36* -1,54 -0,181 -0,61 -0.35* -1,48 -0,140 -0,45 -0.38* -1,57
inputtariff j* IMij 0,02 1,37 0.02** 2,08 0.015* 1,34 0.015** 1,97 0.015* 1,39 0.02*** 2,75
outputtariff j 0.17** 1,62 0.17** 2,08 0.17* 1,6 0.16** 2 0.18* 1,62 0.16** 1,99
outputtariff j* EXij 0,00 0,19 0,00 -0,46 0,001 0,18 -0,001 -0,48 0,001 0,19 -0,001 -0,22
GPNij -0,09 -0,93 -0.10* -1,52 -0,038 -0,32 -0.13* -1,37 -0,047 -0,88 -0.10*** -3,31
GPNij*Skill_shareij 0.21** 1,59 0.23*** 2,56 0,162 1,03 0.28*** 2,32 0,066 1,04 0.10*** 2,64
SIZEij 0.01*** 3,8 0.01*** 8,89 0.009*** 3,8 0.015*** 8,99 0.01*** 3,86 0.015*** 9,16
EXij 0.001*** 3,22 0.001*** 3,41 0.001*** 3,23 0.001*** 3,26 0.001*** 3,22 0.001*** 3,1
IMij 0,001 0,98 -0,00004 -0,1 0,001 0,98 0,000 -0,12 0,001 0,97 0,000 -0,44
FORij 0.025** 1,34 0,01 0,5 0.03* 1,34 0,010 0,68 0.026* 1,37 0,013 0,93
Capital i,j 0.02*** 5,9 0.02*** 6,1 0.02*** 5,9 0.015*** 5,89 0.021*** 5,87 0.015*** 5,77
Female_share ,j 0.06*** 6,41 0.06*** 9,35 0.06*** 6,37 0.063*** 9,09 0.062*** 6,44 0.064*** 9,3
Skill_share i,j -0.12*** -5,32 -0.12*** -6,58 -0.1*** -5,22 -0.11*** -6,46 -0.12*** -5,26 -0.11*** -6,44
region i,j -0.12*** -6,18 -0.05*** -3,55 -0.1*** -6,2 -0.051*** -3,66 -0.12*** -6,18 -0.052*** -3,76
CRj -0.07*** -2,07 -0.06*** -2,28 -0.07** -2,09 -0.06** -2,07 -0.07** -1,96 -0.054* -1,91
GROWTHj -0.55*** -3,04 -0.65*** -5,04 -0.55*** -3,02 -0.64*** -4,83 -0.53*** -2,9 -0.61*** -4,69
GROWTHj*Skill_share i,j 0.41** 1,83 0.56** 3,45 0.4** 1,77 0.53*** 3,21 0.39* 1,73 0.50*** 3,09
# of Obs 10636 10085 10636 10113 10636 10098
R2 0,0469 0,0504 0,0468 0,049 0,0467 0,0517
F-stat 28.37(p=0) 37.55(p=0) 28.42(p=0) 36.33(p=0) 28.64(p=0) 38.5(p=0)
RESET 1.68(p=0.1699) 2.17(p=0.0897) 1.63(p=0.1799) 2.22(p=0.0832) 2.16(p=0.0901) 3.04(p=0.028)
GPN1 GPN2 GPN3
with outliers without outliers with outliers without outliers with outliers without outliers

158
Note that the interaction term between output tariff and export share (output_Exi,j) is
positive but statistically insignificant. This could be a result of a larger reduction of tariff
in sectors with a high proportion of unskilled workers so that in those sectors, domestic
prices are long approaching to world prices. Incentives for resource allocation between
export and firms who sell their products only in domestic markets are not significantly
different. The wage skill premium between these firms is statistical indifferent.
When input tariff is concerned, the positive sign is found only when the input tariff
is interacted with import share. It indicates that input tariff would have effect only on
firms who actually import intermediates from abroad. The positive sign suggests that as
intermediates are capital/skilled labor intensive so that firms which import them demand
skilled workers are less. Lower tariff encourages firms to import intermediates.
The coefficient associated with GPN1 is negative and statistical significance while
the interaction term between GPN1 and the share of skilled workers (GPN1_skillsharei,j)
is positive and significance. The negative sign on the network variable with the positive
sign on the interaction term would suggests that it is not necessary for plants in the
network would have greater demand for skilled workers. They can be at the unskilled-
labor intensive segment. This could cause worrisome for policymakers for being trapped
in the low-end segment. However, plants which put greater effort tend to move up and
demand for more skilled workers. On average, when we use the mean value of skill share
in Thailand, we find the small positive value of the wage skill premium as a result of
engaging into the network. This raises attention to policymakers in supplying adequate
skilled workers available to ensure the sustainable development while participating into
the global network.
In line with the firm heterogeneity literature, firm-specifics have significant on the
wage premium. All these variables but importer and foreign ownership are statistically
significant at the 1% per cent or better and in line with the previous studies. The wage
skill premium in firms engaged to the global economy is generally higher than that in
those entirely domestically oriented. Interestingly, exporting firms have higher wage
premium than importing ones. Such asymmetry would be due to the fact revealed in a

159
number of case studies18 that there are extra activities for firms engaging international
market. A number of extra activities tend to higher for exporting firms, including
negotiating with customers, bargaining, and overcoming day-to-day problems in the
production line, arranging delivery schedules, and after-sale services. Generally, firms
must hire some professionals with sufficient foreign language ability and invest certain
infrastructures (personal computer, internet, satellites, etc.). All of these incur fixed and
sunk cost to firms. Such extra activities would be far less for imports as opposed to exports
as some activities are shared by their suppliers aboard.
The statistical significance of the firm size variable (Outputi,j) suggests that the larger
the firm, the greater the wage premium observed. The positive sign of capital (Capitali,j)
reflects firms with having the higher degree of capital deepening would need more skilled
worker in order to harness benefits of their capital deepening. This would widen the wage
skill premium. As expected, the wage skill premium tends to be higher for rural area.
For skilled/higher educated workers, extra wage compensation is needed to work in rural
areas. Unskilled workers working in Bangkok and vicinity face higher cost of living so
that wage compensation must at least cover it.
We cannot find the difference between foreign and local firms in our analysis. This
might be the fact that foreign investment policy in Thailand is long open since the early
1960s. Foreign and local firms interact with each other long for workers. The difference
that supposed to have on wage premium disappears. This is especially true after
controlling for capital and size in the equation.
The negative and statistically significance of ,i jSkillshare is in line with our
hypothesis. Due to the way data collected, wage compensation for operation workers
partly cover that of skill workers so that the denominator in the wage premium is inflated.
The effect of industrial concentration on the wage premium is found negative and
statistically significant at 1 per cent in all cases. The negative estimate suggests that the
observed high industrial concentration is the outcome of firm dynamics where top firms
are all highly productive. The highly concentrated industry tends to be relatively
18
See more detail in Kohpaiboon (2006), Kohpaiboon, et al. (2012) and Kohpaiboon and Jongwanich
(2012). Such evidence was revealed, based on experience of firms in processed food, garment, hard
disk drive, automotive industries. The interview period is between 2004-2012 and the sample covers
all firm sizes.

160
unskilled-worker intensive. Firms in the industry experiencing rapid output expansion
(high output growth) tend to have greater demand for workers. To rapidly materialize a
growing business opportunity, worker demands are geared toward unskilled ones, thereby
narrowing the wage premium. Nonetheless, the positive coefficient associated between
output growth and ,i jSkillshare suggests that it would be more difficult for already high-
skill intensity plants to rely on hiring unskilled workers in response to the output
expansion.
7. Conclusion and Policy Inferences
This paper examines the determinants of the wage skill premium, with an emphasis
on the effect of global production sharing, one facet of the ongoing globalization, by using
firm level data of Thai Manufacturing as the case study. Our results show that the impacts
of engaging into the global production network on the wage skill premium varies among
firms and tends to be an increasing function of a number of skill operation workers. When
we use the mean value of skill share in Thailand, it shows that participation into the
network requires more skilled workers than unskilled ones and slightly widens the wage
skill premium within firms.
In addition, output tariffs matter in determining the industry wage skill premium
across firms in Thailand. The positive result of this variable is in line with neo-classical
trade model, where opening up to the international trade would lead to specialization
across countries according to their comparative advantage and reduction in the wage skill
premium. Reduction in input tariff could help to reduce the wage skill premium but only
for firms who import their intermediate input. Our findings also support the important
role of firm- and industry-specific factors on the persistence of the wage skill premium.
Our study inference raises policy awareness on managing globalization. While being
a part of the global production sharing can bring in various benefits including technology
and chance to moving up to more skill intensive activities, it is irrefutable for presence of
risk of being trapped in low-end activities. To avoid the trap, the policy focus should be
on adequate and qualified skilled workers supply to allow firms to harness benefit from

161
the global production sharing. The more the skilled workers available, the less likely the
firms to be trapped. In addition, it is needed for public information dissemination about
pros and cons of being a part of global production sharing as well as systematic case
studies of both indigenous winners and losers. This is to avoid misunderstanding and
misallocation of resources. Our result is also in favor for continued trade liberalization
due to presence of developmental impacts on income inequality.
References
Amiti, M. and D. Davis (2012), ‘Trade, Firms, and Wages: Theory and Evidence’, Review
of Economic Studies, 79, pp.1-36.
Amiti, M. and L. Cameron (2012), ‘Trade Liberalization and the Wage Skill Premium:
Evidence from Indonesia’, Journal of International Economics, 87, pp.277-287.
Athukorala, P. (2005), ‘Product Fragmentation and Trade Patterns in East Asia’, Asian
Economic Papers, 4(3), pp.1-27.
Athukorala, P. (forthcoming), ‘Growing with Global Production Sharing: The Tale of
Penang Export Hub, Malaysia’, Competition and Change.
Attanasio, O., P. Goldberg, and N. Pavcnik (2004), ‘Trade Reforms and Wage Inequality
in Colombia’, Journal of Development Economics, 74, pp.331-366.
Bergin, P.R., R.C. Feenstra, and G. Hanson (2011), ‘Volatility due to Offshoring: Theory
and Evidence’, Journal of International Economics, 85, pp.163-173.
Beyer, H., P. Rojas and R. Vergara (1999), ‘Trade Liberalization and Wage Inequality’,
Journal of Development Economics, 59, pp.103-123.
Bhagwati, J. (2000), The Wind of the Hundred Days: How Washington Mismanaged
Globalization , Oxford: Oxford University Press.
Bigsten, A. and D. Durevall (2006), ‘Openness and Wage Inequality in Kenya: 1964-
2000’, World Development, 34(3), pp.465-480.
Currie, J. and A. Harrison (1997), ‘Trade Reform and Labor Market Adjustment in
Morocco’, Journal of Labor Economics, 15, pp.S44-71.
Davis, D.R. and P. Mishra (2007), ‘Stopler-Samuelson is Dead: And Other Crimes of
Both Theory and Data’, in Harrison, A. (ed.), Globalization and Poverty. Chicago:
University of Chicago Press.
Feenstra, R. and G. Hanson (1996), ‘Foreign Investment, Outsourcing and Relative
Wages’, in Feenstra, R. C. (ed.), Political Economy of Trade Policy: Essays in
Honor of Jadish Bhagwati, Cambridge : MIT Press, pp.89-127.

162
Feenstra, R. and G. Hanson (1997), ‘Foreign Direct Investment and Relative Wages:
Evidence from Mexico’s Maquiladoras’, Journal of International Economics, 42,
pp.371-393.
Feenstra, R. and G. Hanson (1999), ‘The Impact of Outsourcing and High-technology
Capital on Wages: Estimates for the United States, 1979-1990,’ Quarterly Journal
of Economics, 114(3), pp.907-940.
Feenstra, R. and G. Hanson (2003), ‘Global Production Sharing and Rising Inequality: A
Survey of Trade and Wages’, in Choi, E. K.and J. Harrigan (eds.), Handbook of
International Trade, Malden: Blackwell, pp.146-185.
Feenstra, R.C. (2004), Advanced International Trade: Theory and Evidence. Princeton:
Princeton University Press.
Feenstra, R. C. and G. H. Hanson (2001), ‘Global Production Sharing and Rising
Inequality: A Survey of Trade and Wages’, NBER Working Paper 8372.
Cambridge: National Bureau of Economic Research.
Feliciano, Z. (2001), ‘Workers and Trade Liberalization: The Impact of Trade Reforms
in Mexico on Wages and Employment’, Industrial and Labor Relation Review,
55(1), pp.95-115.
Galiani, S. and P. Sanguinetti (2003), ‘The Impact of Trade Liberalization on Wage
Inequality: Evidence from Argentina’, Journal of Development Economics, 72,
pp.497-513.
Goldberg, P. and N. Pavcnik (2007), ‘Distributional Effects of Trade Liberalization in
Developing Countries’, Journal of Economic Literature, 45(1), pp.39-82.
Harrison, A. and G. Hanson (1999), ‘Who Gains from Trade Reform? Some Remaining
Puzzles’, Journal of Development Economics, 59, pp.125-154.
Kiyota, K. (2012), ‘A Many-cone World?’, Journal of International Economics,86,
pp.345-354.
Kohpaiboon, A. (2006), Multinational Enterprises and Industrial Transformation:
Evidence from Thailand, Cheltenham: Edward Elgar.
Kohpaiboon, A. and E. D. Ramstetter (2008), ‘Foreign Ownership and Producer
Concentration in Thai Manufacturing’, Working Paper 2008-05, Kitakyushu:
ICSEAD.
Kohpaiboon, A. (2009), ‘Global Integration of Thai Automotive Industry’, ERTC
Discussion Paper No. 18 Economic Research and Training Centre (ERTC),
Faculty of Economics, Thammasat University.
Kohpaiboon, A. and J. Jongwanich (2013), ‘International Production Network, Clusters
and Industrial Upgrading: Evidence from Automotive and Hard Disk Drive
Industries’, Review of Policy Research 30(2), pp.211-239.
Kohpaiboon, A. , J. Jongwanich, and P. Kulthanavit (2012), ‘Structural Adjustment and
International Migration: An Analysis of the Thai Clothing Industry’, Oxford
Development Studies 40 (2), pp.231-260.

163
Lorentowicz, A., D. Marin, and A. Raubold (2005), ‘Is Human Capital Losing from
Outsourcing?: Evidence for Austria and Poland’, University of Munich
Discussion Paper 2005-22, Munich: University of Munich.
Leamer, E. and P. Schott, and K. Peter, (2005), ‘The Rich (and Poor) Keep Getting
Richer’, Harvard Business Review 83(4), p.20.
Leamer, E. and J. Levinsohn (1995), ‘International Trade Theory: the Evidence’, in
Grossman, G.and K. Rogoff (eds.), Handbook of International Economics, vol. 3.
Amsterdam: Elsevier.
Marin, D. (forthcoming),’A New International Division of Labor in Eastern Europe:
Outsourcing and Offshorring to Eastern Europe’, Journal of European Economic
Association.
Melitz, M. J. (2003), ‘The Impact of Trade on Intra-industry Reallocations and Aggregate
Industry Productivity’, Econometrica, 71, pp.1695-1725.
Mishra, P. and U. Kumar (2005), ‘Trade Liberalization and Wage Inequality: Evidence
from India’, IMF Working Paper No.05/20, Washington, D. C.: International
Monetary Fund.
Pavcnik, N., A. Blom, P. Goldberg, and N. Schady (2004), ‘Trade Policy and Industry
Wage Structure: Evidence from Brazil’, World Bank Economic Review, 18(3),
pp.319-344.
Revenga, A. (1997), ‘Employment and Wage Effects of Trade Liberalization: The Case
of Mexican Manufacturing’, Journal of Labor Economics,15, pp.s20-43.
Robertson, R. (2000), ‘Trade Liberalization and Wage Inequality: Lessons from the
Mexican Experience’, World Economy, 23, pp.827-849.
Robertson, R. (2004), ‘Relative Prices and Wage Inequality: Evidence from Mexico’,
Journal of International Economics,64(3), pp.387-409.
Topalova, P. (2004), ‘Factor Immobility and Regional Impacts of Trade Liberalization:
Evidence on Poverty and Inequality from India’, Yale Mimeo.
Verhoogen, E.A. (2008), ‘Trade, Quality Upgrading and Wage Inequality in the Mexican
Manufacturing Sector’, Quarterly Journal of Economics, 123(2), pp.489-530.
Wacziarg, R. and J.S. Wallack (2004), ‘Trade Liberalization and Intersectoral Labor
Movement’, Journal of International Economics, 64(3), pp.411-435.
Wood, A. (1997), ‘Openness and Wage Inequality in Developing Countries: The Latin
American Challenge to East Asia Conventional Wisdom’, World Bank Economic
Review, 11(1), pp.33-57.