global report - open data...
TRANSCRIPT

Data for everyone
Data people
can
useD
ata people need
Fourth Edi�onGlobal Report
opendatabarometer.org
This 4th edition of the Barometer was supported by grants from the Omidyar Network and the Open Data for Development
(OD4D) programme, a partnership funded by Canada’s International Development Research Centre (IDRC), the World Bank,
United Kingdom’s Department for International Development (DFID), and Global Affairs Canada (GAC). The OD4D programme
supported the report with the aid of a grant from the International Development Research Centre (IDRC), Ottawa, Canada.
Open Data Barometer 4th Edition — Global Report, May 2017 | The World Wide Web Foundation
You can contact the Barometer team at: [email protected]
Members of the media can contact and request further information by emailing: [email protected]
© 2017 Web Foundation - Licensed under a Creative Commons Attribution 4.0 Unported licence
Table of Contents
Context ................................................................................................................................................ 05
Global ranking .................................................................................................................................................................06
The Open Data Charter Principles ............................................................................................................................10
Findings & Recommendations ........................................................................................................... 11
Finding One - Nine out of 10 government datasets are not open ................................................................12
Finding Two - Government data is typically incomplete and low quality ..................................................14
Finding Three - Sustained political will is what makes or breaks the success of open data ................16
Finding Four - Governments are not publishing the data needed to restore citizens’ trust................18
Finding Five - Open government data risks reinforcing inequalities ...........................................................20
Open Data Trends ............................................................................................................................... 22
Data for everyone ...........................................................................................................................................................22
The data people need ..................................................................................................................................................24
Data people can easily use ..........................................................................................................................................27
Access to data ..................................................................................................................................................27
Data Usability ..................................................................................................................................................28
Conclusions ......................................................................................................................................... 30
Methodology ...................................................................................................................................... 31
List of tables ........................................................................................................................................ 32
Acknowledgements ............................................................................................................................ 33
About the Open Data Barometer ...................................................................................................... 34


| 5 |
Context
The Web Foundation believes that open data must be:
for everyone —a right for all.
data people caneasily use.
the datapeople need.
The findings from the fourth edition of the Open Data Barometer show that while some governments are advancing towards these aims, open data remains the exception, not the rule.
Why does this matter? Everyone should be able to access and use open data on an open web to allow them to participate fully in civic life. Without good data, it is impossible to hold governments to account for the decisions that they make, the policies they pass, and the money they budget and spend.
In its fourth edition, the Open Data Barometer covers 115 countries and jurisdictions, a 25 percent increase on coverage from the last edition.
To deliver real change, open data must meet the principles set out in the Open Data Charter — adopted by more than 15 national and 25 local gov-ernments to date.
| 5 |
| 6 |
94
82
88
80
100
78
99
89
68
73
88
88
71
78
47
71
38
59
48
37
42
76
41
46
27
17
100
87
71
71
59
78
58
60
64
71
58
58
71
56
70
69
64
55
50
51
60
41
46
42
54
51
99
96
100
96
95
85
92
84
94
77
83
81
67
83
87
67
75
66
77
79
63
58
73
72
60
70
United Kingdom
Canada
France
United States of America
Korea
Australia
New Zealand
Japan
Netherlands
Norway
Mexico
Spain
Denmark
Austria
Sweden
Germany
Uruguay
Brazil
Switzerland
Italy
Finland
Philippines
Singapore
Colombia
Russia
Ireland
10090858281817975757473737170707061595856565553524947
123455788
1011111314141417181920202223242526
Countr yR ank S core Readiness I mplementat ion I mpac t
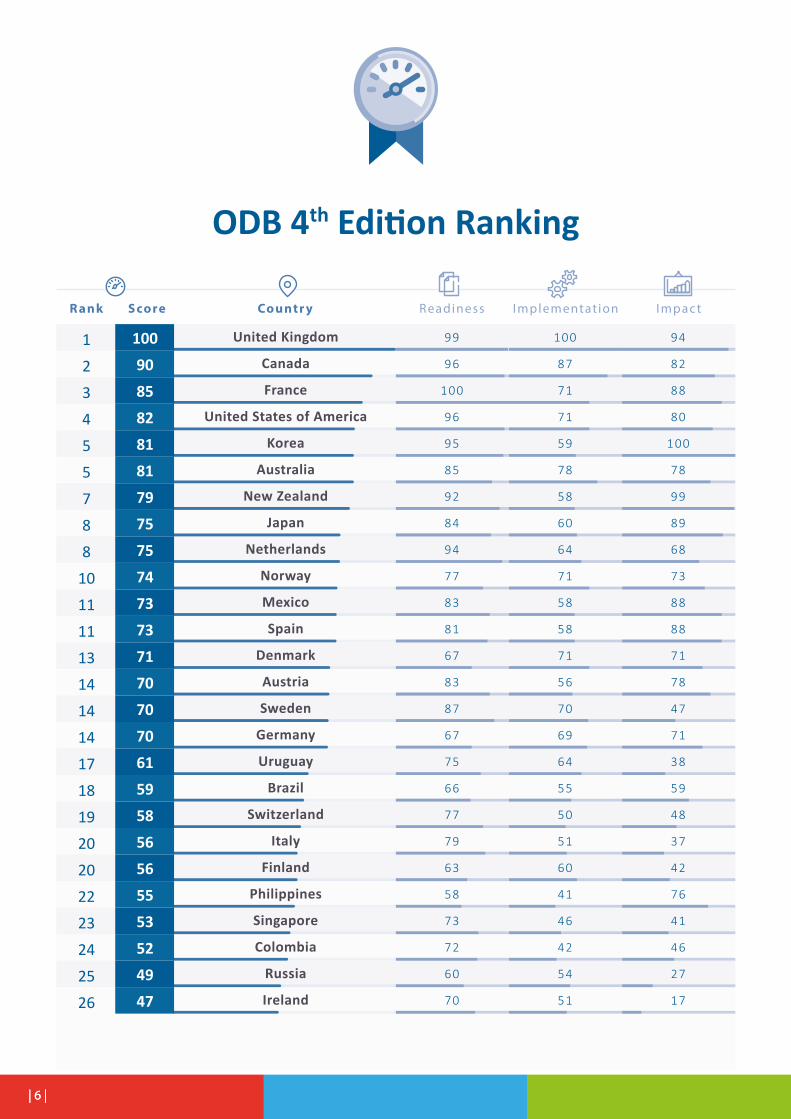
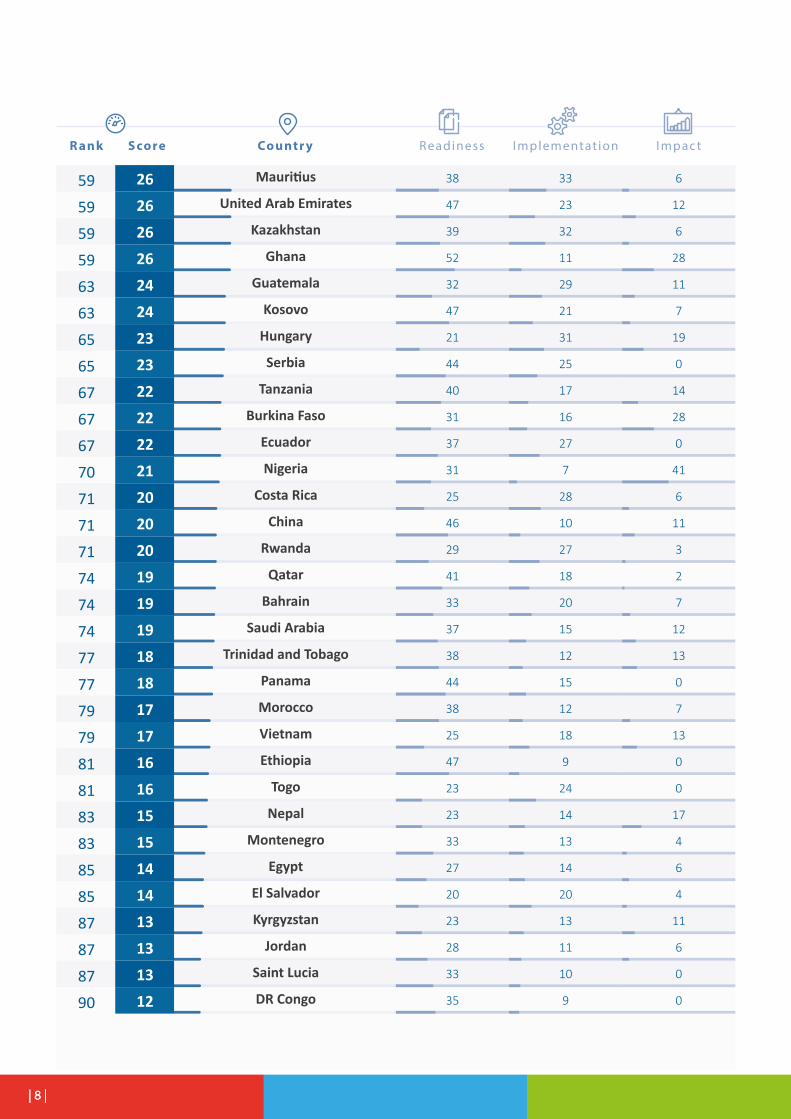
ODB 4th Edition Ranking
| 6 |

| 7 |
16
42
20
34
36
14
35
16
58
20
17
25
23
11
11
36
15
10
19
29
23
14
13
4
22
22
16
19
0
13
11
8
56
37
38
43
44
54
32
47
22
38
47
39
35
45
45
35
53
45
35
28
24
38
29
37
32
32
33
20
43
36
31
24
62
66
79
59
54
55
68
58
57
59
48
51
57
52
51
44
35
49
55
51
61
47
57
54
45
45
35
53
34
33
40
52
Chile
Israel
Belgium
Slovakia
Czech Republic
Moldova
India
Portugal
Kenya
Greece
Iceland
Indonesia
Argentina
Georgia
Bulgaria
Jamaica
Turkey
Estonia
Ukraine
South Africa
Poland
Peru
Macedonia
Albania
Dominican Republic
Tunisia
Paraguay
Malaysia
Latvia
Bolivia
Thailand
Croatia
4746454544444342403939383837373737363634343333323232282828282827
2628292931313334353636383840404040444446464648505050535353535358
Countr yR ank S core Readiness I mplementat ion I mpac t
| 7 |
| 8 |
6
12
6
28
11
7
19
0
14
28
0
41
6
11
3
2
7
12
13
0
7
13
0
0
17
4
6
4
11
6
0
0
33
23
32
11
29
21
31
25
17
16
27
7
28
10
27
18
20
15
12
15
12
18
9
24
14
13
14
20
13
11
10
9
38
47
39
52
32
47
21
44
40
31
37
31
25
46
29
41
33
37
38
44
38
25
47
23
23
33
27
20
23
28
33
35
United Arab Emirates
Mauritius
Kazakhstan
Ghana
Guatemala
Kosovo
Hungary
Serbia
Tanzania
Burkina Faso
Ecuador
Nigeria
Costa Rica
China
Rwanda
Qatar
Bahrain
Saudi Arabia
Trinidad and Tobago
Panama
Morocco
Vietnam
Ethiopia
Togo
Nepal
Montenegro
Egypt
El Salvador
Kyrgyzstan
Jordan
Saint Lucia
DR Congo
2626262624242323222222212020201919191818171716161515141413131312
5959595963636565676767707171717474747777797981818383858587878790
Countr yR ank S core Readiness I mplementat ion I mpac t
| 8 |

| 9 |
4
4
0
2
2
13
4
0
0
7
2
0
0
0
0
0
7
0
0
0
0
0
4
0
0
19
11
7
10
6
16
14
8
9
5
7
7
13
6
4
7
5
5
4
4
3
4
5
6
0
15
26
35
27
32
8
15
25
24
23
23
24
13
19
21
17
12
14
15
14
12
9
2
0
10
Uganda
Venezuela
Côte d’Ivoire
Belarus
Bangladesh
Malawi
Tajikistan
Namibia
Senegal
Sierra Leone
Palestine
Bosnia and Herzegovina
Benin
Haiti
Botswana
Lebanon
Cameroon
Zambia
Pakistan
Mozambique
Mali
Zimbabwe
Myanmar
Swaziland
Yemen
121211111111109988876665443221
00
909093939393979898
100100100103104104104107108108110111111113
114114
Countr yR ank S core Readiness I mplementat ion I mpac t
| 9 |
th
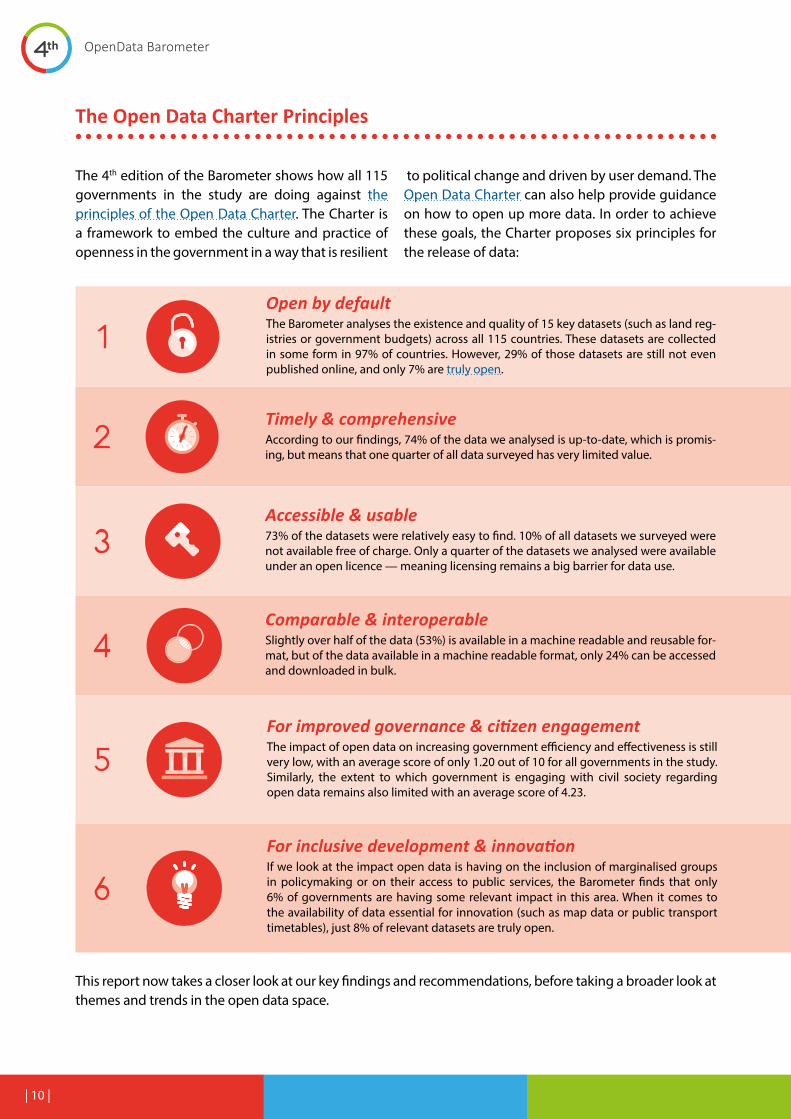
The Open Data Charter Principles
The 4th edition of the Barometer shows how all 115 governments in the study are doing against the principles of the Open Data Charter. The Charter is a framework to embed the culture and practice of openness in the government in a way that is resilient
to political change and driven by user demand. The Open Data Charter can also help provide guidance on how to open up more data. In order to achieve these goals, the Charter proposes six principles for the release of data:
This report now takes a closer look at our key findings and recommendations, before taking a broader look at themes and trends in the open data space.
Open by defaultThe Barometer analyses the existence and quality of 15 key datasets (such as land reg-istries or government budgets) across all 115 countries. These datasets are collected in some form in 97% of countries. However, 29% of those datasets are still not even published online, and only 7% are truly open.
Timely & comprehensiveAccording to our findings, 74% of the data we analysed is up-to-date, which is promis-ing, but means that one quarter of all data surveyed has very limited value.
Accessible & usable73% of the datasets were relatively easy to find. 10% of all datasets we surveyed were not available free of charge. Only a quarter of the datasets we analysed were available under an open licence — meaning licensing remains a big barrier for data use.
Comparable & interoperableSlightly over half of the data (53%) is available in a machine readable and reusable for-mat, but of the data available in a machine readable format, only 24% can be accessed and downloaded in bulk.
For improved governance & citizen engagementThe impact of open data on increasing government efficiency and effectiveness is still very low, with an average score of only 1.20 out of 10 for all governments in the study. Similarly, the extent to which government is engaging with civil society regarding open data remains also limited with an average score of 4.23.
For inclusive development & innovationIf we look at the impact open data is having on the inclusion of marginalised groups in policymaking or on their access to public services, the Barometer finds that only 6% of governments are having some relevant impact in this area. When it comes to the availability of data essential for innovation (such as map data or public transport timetables), just 8% of relevant datasets are truly open.
| 10 |
th
Findings & Recommendations
Overall, this year’s Barometer shows that governments are slowing and stalling in their commitment to open data. In some cases, progress has even been undone.
The bottom line: Most governments are not meeting the basic Open Data Charter principles. In most cases, the right policies are not in place, nor is the breadth and quality of the datasets released sufficient. This means we cannot collectively use open data to truly change people’s lives for the better.
However, those countries that have formally adopted the Charter are gen-erally making good progress on fulfi lling its principles. Their performance has been improving in recent years, and Charter adopters such as the UK, France, Korea, and Mexico have even become regional open data leaders.
| 11 |

th
FINDING
Nine out of 10 government datasets are not open
In this edition of the Barometer, we assessed 1,725 datasets from 15 different sectors across 115 coun-tries. Only seven governments include a statement on open data by default in their current policies. Fur-thermore, we found that only 7% of the data is fully open, only one of every two datasets is machine readable and only one in four datasets has an open licence. While more data has become available in a machine readable format and under an open licence since the first edition of the Barometer, the number of global truly open datasets remains at a standstill.
Availability of data Barometer 4th ed. 3rd ed. 2nd ed. 1st ed.
open data 7% ⬇ 10% ⬅ 10% ⬆ 7%
machine readable 53% ⬇ 55% ⬆ 41% ⬆ 37%
openly licensed 26% ⬆ 24% ⬆ 14% ⬆ 12%
Table 2: Evolution of key open data indicators throughout the four editions of the Barometer. (The number of countries covered has increased over time, which may also influence these figures)
If governments added an open licence to existing datasets that alre-ady meet all other criteria, the number of truly open datasets available would more than double to 15%. For instance, in Canada, the restric-tive licensing of several datasets is one of the primary reasons it has not overtaken the UK’s longstanding leadership position in the ranking.
| 12 |

th
RECOMMENDATION
Government data must be open by default
Government-held data must be open by default and follow the principles set out in the Open Data Char-ter — from proactive publication to clear open li-censing (while being mindful that no personally identifiable data should be released). In addition, governments must maintain their commitments to open data and avoid backsliding. Governments in the UK, US, and Nordic countries have all taken steps backward this year (see Finding Three).
Where in place, right to information (RTI) laws should be revised to pro-vide for proactive disclosure that guarantees non-personal government data will be open by default, available in machine-readable formats, and published under open licences that allow the data to be re-used.
| 13 |

th
FINDING
Government data is typically incomplete and low quality
Government data is usually incomplete, out of date, of low quality, and fragmented. In most cases, open data catalogues or portals are manually fed as the result of informal data management approaches. Procedures, timelines, and responsibilities are frequently unclear among government institutions tasked with this work. This makes the overall open data management and publication approach weak and prone to multiple errors.
a) Although 79 out of the 115 governments surveyed have an open government data portal, often the most complete data is published on a source other than the official open data portal. In such coun-tries, the majority of the most comprehensive datasets (61%) are published by other government agencies.
b) A significant amount of reference data is published by national sta-tistics offices (NSOs) — probably because they have longstanding data management practices that are usually better than those of open data catalogues. Overall, from the 115 governments surveyed, 24% of reference data is published by NSOs. Even in governments that have open data portals, more reference data derives from NSOs (22%) than from open data portals (17%).
c) Data is hard to use because there is no metadata or guidance docu-mentation available. Less than a third (31%) of the published data-sets have some supporting basic metadata or companion guidance documentation.
| 14 |
th
RECOMMENDATION
Governments must decentralise open data across all agencies and departments
In order to guarantee long term sustainability of open data, all government data management prac-tices and systems must be designed with openness in mind from the very beginning of the data man-agement process. It is imperative that governments do not see opening data as an additional step at the end, but as something to be integrated throughout the whole of government. We recommend that gov-ernments review their data governance processes in full and also embed automated data publication processes in their IT systems. This will ensure the lat-est and most complete version of datasets is always available to the public directly from the source and will reduce reliance on manual uploads to one sin-gle central catalogue.
As it stands, open data portals should be considered as a temporary workaround in order to enable access to government data while a more consistent solution is implemented. This might be that data is published in an automated way, as outlined above, on the websites of relevant departments, with a further automated step to populate a central portal in real-time.
| 15 |
th
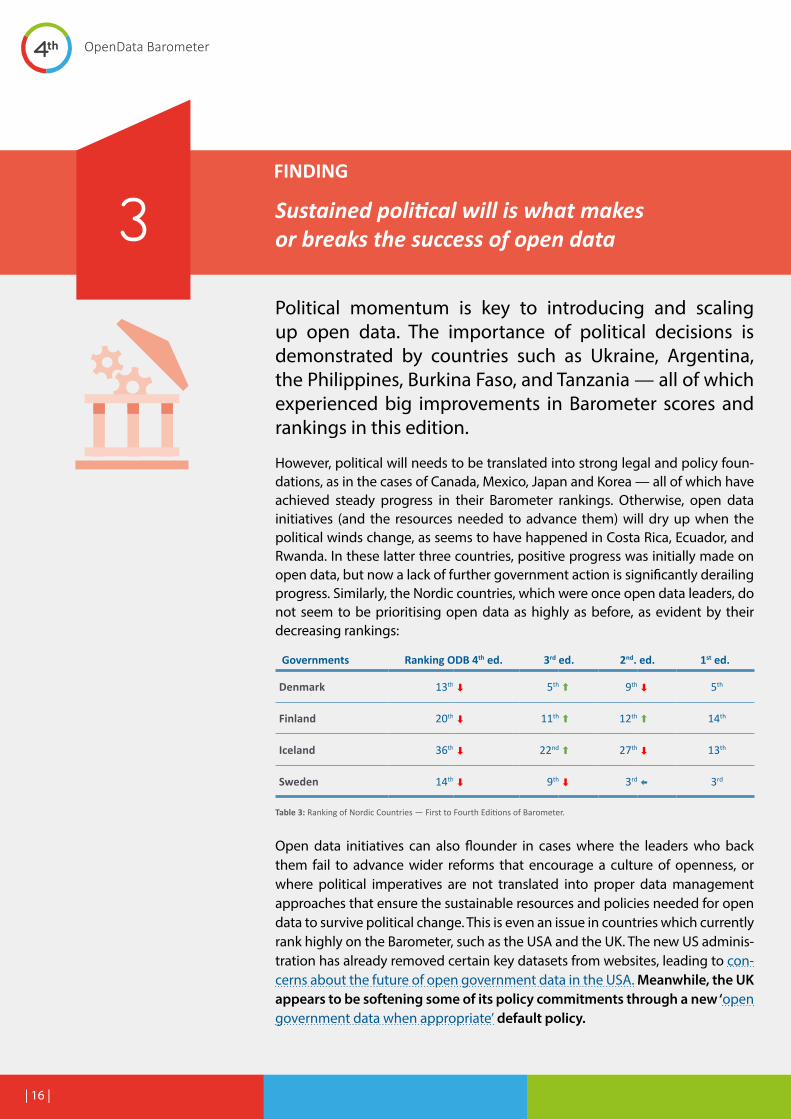
FINDING
Sustained political will is what makes or breaks the success of open data
Political momentum is key to introducing and scaling up open data. The importance of political decisions is demonstrated by countries such as Ukraine, Argentina, the Philippines, Burkina Faso, and Tanzania — all of which experienced big improvements in Barometer scores and rankings in this edition.
However, political will needs to be translated into strong legal and policy foun-dations, as in the cases of Canada, Mexico, Japan and Korea — all of which have achieved steady progress in their Barometer rankings. Otherwise, open data initiatives (and the resources needed to advance them) will dry up when the political winds change, as seems to have happened in Costa Rica, Ecuador, and Rwanda. In these latter three countries, positive progress was initially made on open data, but now a lack of further government action is significantly derailing progress. Similarly, the Nordic countries, which were once open data leaders, do not seem to be prioritising open data as highly as before, as evident by their decreasing rankings:
Governments Ranking ODB 4th ed. 3rd ed. 2nd. ed. 1st ed.
Denmark 13th ⬇ 5th ⬆ 9th ⬇ 5th
Finland 20th ⬇ 11th ⬆ 12th ⬆ 14th
Iceland 36th ⬇ 22nd ⬆ 27th ⬇ 13th
Sweden 14th ⬇ 9th ⬇ 3rd ⬅ 3rd
Table 3: Ranking of Nordic Countries — First to Fourth Editions of Barometer.
Open data initiatives can also flounder in cases where the leaders who back them fail to advance wider reforms that encourage a culture of openness, or where political imperatives are not translated into proper data management approaches that ensure the sustainable resources and policies needed for open data to survive political change. This is even an issue in countries which currently rank highly on the Barometer, such as the USA and the UK. The new US adminis-tration has already removed certain key datasets from websites, leading to con-cerns about the future of open government data in the USA. Meanwhile, the UK appears to be softening some of its policy commitments through a new ‘open government data when appropriate’ default policy.
| 16 |
th
RECOMMENDATION
Governments must adopt the Open Data Charter to ensure open data practices are embedded beyond political mandates
We recommend that governments should adopt and implement the Open Data Charter principles, in order to have:
1. A strong policy foundation that articulates pro-cesses; responsibilities; timelines; resources; appropriate privacy and data protection safe-guards; and the national institutions or authori-ties in charge of its execution to establish a gene-ral right to reuse by means of an explicit ‘open by default’ mandate.
2. A consistent data management strategy and practice, including guidelines for metadata and publication frequency; data inventories; docu-mentation; quality assurance procedures; and management of user feedback.
This will ensure sustainability in creating a culture of open data beyond political transitions. We also recommend that governments add provi-sions to their current right to information (RTI) legislation to reinforce the proactive release of open government data.
| 17 |
th
FINDING
Governments are not publishing the data needed to restore citizens’ trust
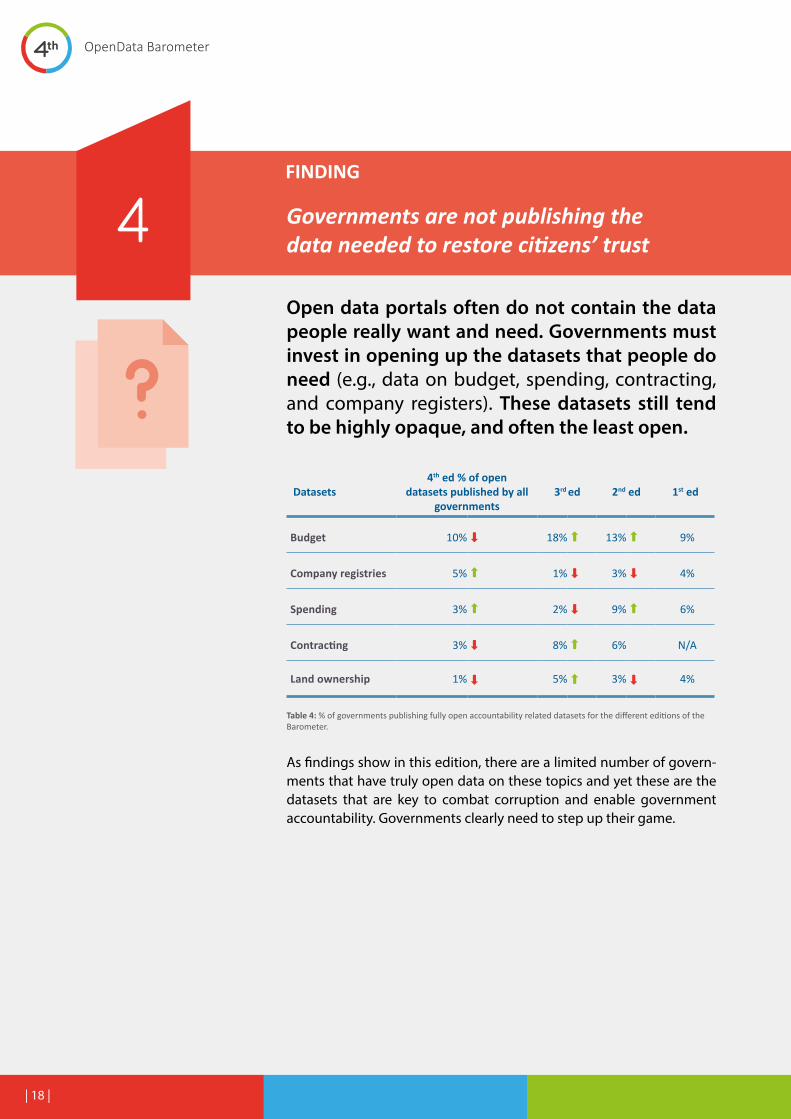
Open data portals often do not contain the data people really want and need. Governments must invest in opening up the datasets that people do need (e.g., data on budget, spending, contracting, and company registers). These datasets still tend to be highly opaque, and often the least open.
Datasets4th ed % of open
datasets published by all governments
3rd ed 2nd ed 1st ed
Budget 10% ⬇ 18% ⬆ 13% ⬆ 9%
Company registries 5% ⬆ 1% ⬇ 3% ⬇ 4%
Spending 3% ⬆ 2% ⬇ 9% ⬆ 6%
Contracting 3% ⬇ 8% ⬆ 6% N/A
Land ownership 1% ⬇ 5% ⬆ 3% ⬇ 4%
Table 4: % of governments publishing fully open accountability related datasets for the different editions of the Barometer.
As findings show in this edition, there are a limited number of govern-ments that have truly open data on these topics and yet these are the datasets that are key to combat corruption and enable government accountability. Governments clearly need to step up their game.
| 18 |
th
RECOMMENDATION
Governments must consult citizens and intermediaries when prioritising which open data to publish first
Governments need to give top priority to opening up the data that will help citizens get what they really need — better public services, more transparency, and accountability. To do this, governments must work with data intermediaries — such as civil society, community organisations and the media — to find out exactly which data and information citizens need to address their problems and improve public services.
Importantly, governments must avoid only consulting the usual sus-pects and should make a dedicated effort to consult a wider range of voices, with a particular focus on groups that are often marginalised from government decision-making. Based on these consultations, governments can prioritise for early release the datasets that would be most useful — for example, which datasets should the government open in order to build better health services that are responsive to citi-zens’ needs?
Restoring citizens’ trust is not just about providing citizens with the data they need. It is also about protecting citizens’ personal data, and making sure that their data is in safe hands. This means making sure citizens are aware of and consent to the way in which their data is collected, processed, and used by the government.
| 19 |
th
FINDING
Few open data initiatives actively promote inclusion and equity
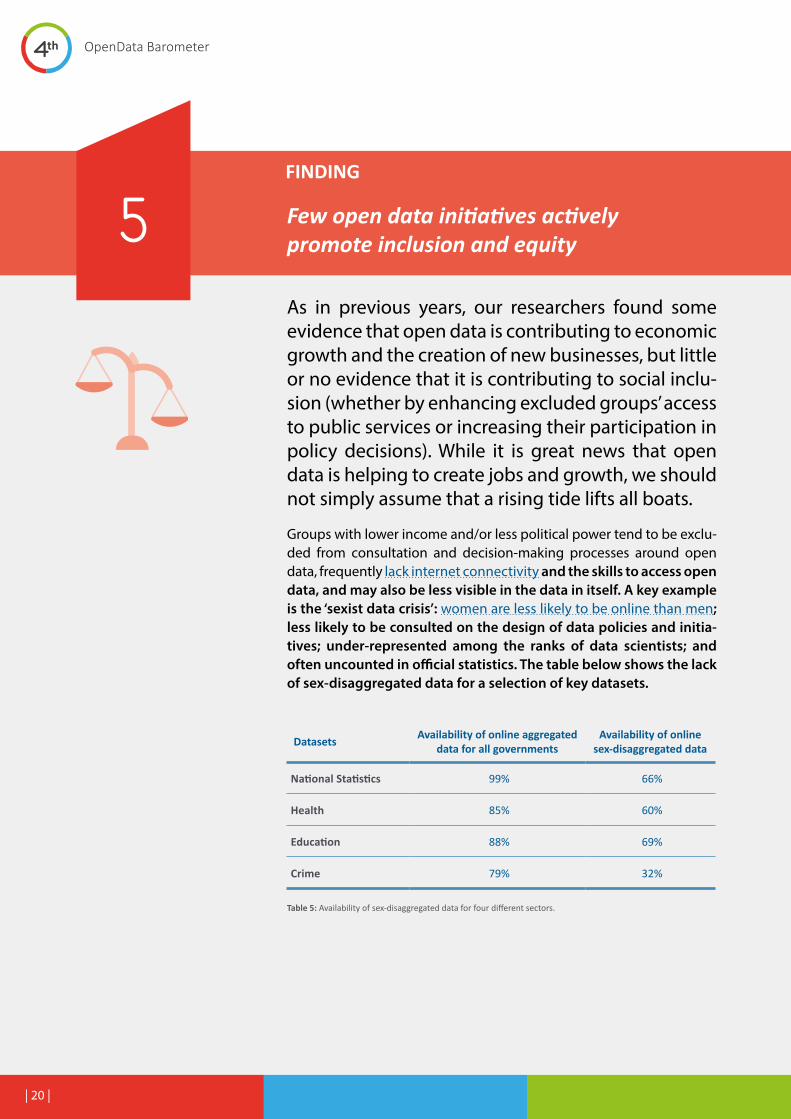
As in previous years, our researchers found some evidence that open data is contributing to economic growth and the creation of new businesses, but little or no evidence that it is contributing to social inclu-sion (whether by enhancing excluded groups’ access to public services or increasing their participation in policy decisions). While it is great news that open data is helping to create jobs and growth, we should not simply assume that a rising tide lifts all boats.
Groups with lower income and/or less political power tend to be exclu-ded from consultation and decision-making processes around open data, frequently lack internet connectivity and the skills to access open data, and may also be less visible in the data in itself. A key example is the ‘sexist data crisis’: women are less likely to be online than men; less likely to be consulted on the design of data policies and initia-tives; under-represented among the ranks of data scientists; and often uncounted in official statistics. The table below shows the lack of sex-disaggregated data for a selection of key datasets.
Datasets Availability of online aggregated data for all governments
Availability of online sex-disaggregated data
National Statistics 99% 66%
Health 85% 60%
Education 88% 69%
Crime 79% 32%
Table 5: Availability of sex-disaggregated data for four different sectors.
| 20 |
th
RECOMMENDATION
To achieve the Sustainable Development Goals — which have poverty eradication and gender equa-lity at their core — making data open by design is a start, but not enough. In line with Open Data Charter principle six, data policies must also be inclusive by design, in order to harness the potential of open data to improve equality and social outcomes.
Concrete steps include:
• Data collection - Invest in greater disaggregation of data by sex, income level, or age, and develop new indicators that allow better analysis of diversity and stratification in our societies.
• Data design - Consult marginalised groups when designing new data collection or data release efforts. This helps to identify positive opportunities for data to advance equity. Inclusive design processes can also help avoid unintended negative consequences that could further entrench discrimination and exclusion.
• Data access - Invest in low-cost and accessible internet access for marginalised groups as costly and scarce internet access puts wom-en, low-income and other marginalised groups at a huge disadvan-tage when it comes to data use.
• Data use - Invest in processes that enable marginalised groups to use data, particularly to participate in policymaking, and with the explicit aim of achieving social policy goals.
Governments must invest in using open data to improve the lives of marginalised groups
| 21 |
th
Open Data Trends
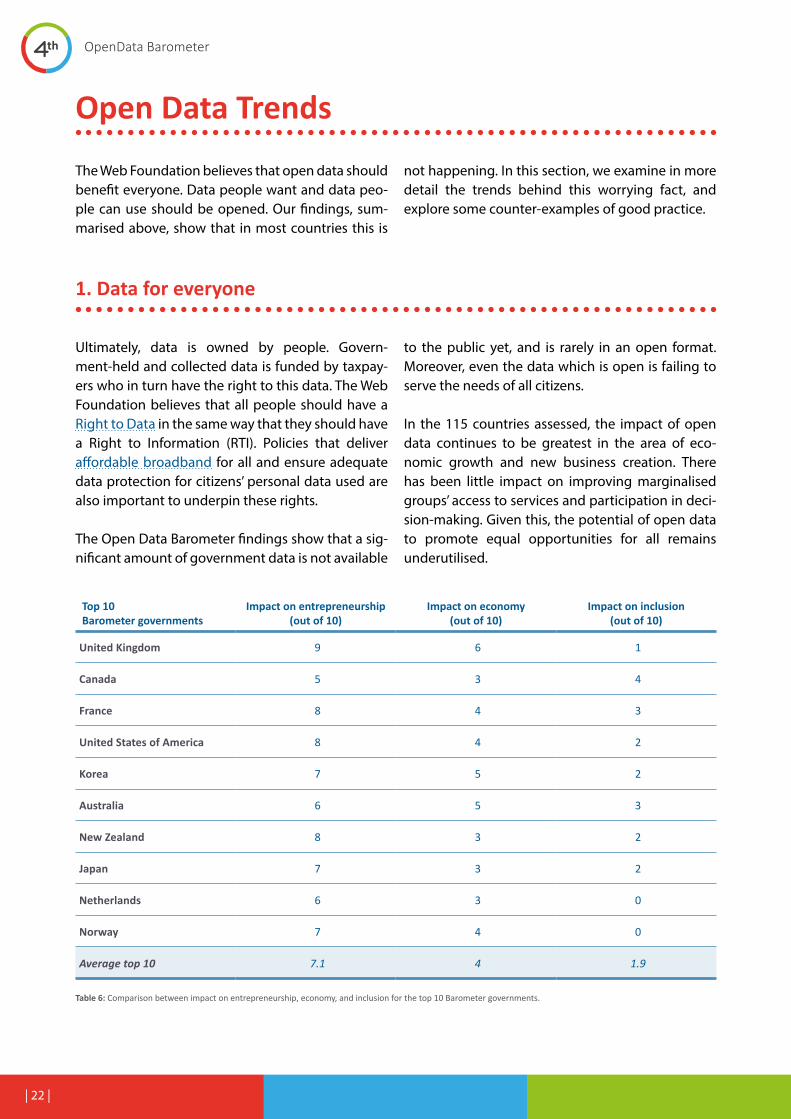
The Web Foundation believes that open data should benefit everyone. Data people want and data peo-ple can use should be opened. Our findings, sum-marised above, show that in most countries this is
not happening. In this section, we examine in more detail the trends behind this worrying fact, and explore some counter-examples of good practice.
1. Data for everyone
Ultimately, data is owned by people. Govern-ment-held and collected data is funded by taxpay-ers who in turn have the right to this data. The Web Foundation believes that all people should have a Right to Data in the same way that they should have a Right to Information (RTI). Policies that deliver affordable broadband for all and ensure adequate data protection for citizens’ personal data used are also important to underpin these rights.
The Open Data Barometer findings show that a sig-nificant amount of government data is not available
to the public yet, and is rarely in an open format. Moreover, even the data which is open is failing to serve the needs of all citizens.
In the 115 countries assessed, the impact of open data continues to be greatest in the area of eco-nomic growth and new business creation. There has been little impact on improving marginalised groups’ access to services and participation in deci-sion-making. Given this, the potential of open data to promote equal opportunities for all remains underutilised.
Top 10 Barometer governments
Impact on entrepreneurship (out of 10)
Impact on economy (out of 10)
Impact on inclusion(out of 10)
United Kingdom 9 6 1
Canada 5 3 4
France 8 4 3
United States of America 8 4 2
Korea 7 5 2
Australia 6 5 3
New Zealand 8 3 2
Japan 7 3 2
Netherlands 6 3 0
Norway 7 4 0
Average top 10 7.1 4 1.9
Table 6: Comparison between impact on entrepreneurship, economy, and inclusion for the top 10 Barometer governments.
| 22 |

th
Data blind spots frequently make the needs and contributions of certain groups less visible to poli-cymakers, so it is critical for data initiatives to devote effort to overcoming such blind spots — often best done by involving marginalised groups at the design stage. This is why on-going dialogue with civil soci-ety and citizens is so important — a more diverse array of actors can help spot potential unintended consequences and avoid data-driven discrimina-tion. Recent examples of open data being misused include the use of open court records to black-list low-income tenants in New York City, and the
unforeseen erosion of women’s informal land rights as a result of the expansion of formal land registries.
How can governments ensure they are including everyone when they are designing their data initi-atives? Statistics Canada launched the Aboriginal Community Data Initiative to provide these groups with important data for planning and understand-ing the demographics of their community and the population in surrounding areas. Other examples from Japan and Côte d’Ivoire (discussed in the text boxes) provide further ideas.
Japan | Helping the elderly and pedestrians with disabilities
In 2015, the Ministry of Land, Infrastructure and Transport (MLIT) set up an open data site to assist pe-
destrians with disabilities and the elderly. MLIT has also developed guidelines for local governments to
develop local datasets for the pedestrian movement support service. This site publicises about 50,000
data points, including approximately 7,000 data points on barrier-free facilities in passenger terminals
such as train stations, and approximately 42,000 free wireless LAN spots. The data is downloadable,
and the service can generate a barrier-free map for people who have difficulties with accessibility. Since
the data release, many ideathons and hackathons have been conducted and applications have been
developed for assisting pedestrians with disabilities.
Côte d’Ivoire | TechMousso gender data initiative
In Côte d’Ivoire, the gender data initiative TechMousso (TechWoman), brought together the tech and gen-
der communities to develop solutions for local problems. It was the first gender data consultation works-
hop and initiative in the country. More than 60 representatives from government and civil society helped to
identify community needs, with a focus on data gaps in health data and entrepreneurship data. Thereafter,
a competitive solutions development process kicked off. From an initial field of over 50 teams, ten winning
teams developed and presented apps designed to generate and use data to improve women’s health, safe-
ty, education, and economic empowerment.
A common theme related to education data — at least two of the teams used such data to analyse high
school dropout rates by sex, and examine the career orientation of high-school students. Government edu-
cation data is abundant, but is currently not open and available to the public. Owing to TechMousso, the
government is now working on publishing and releasing this data on the Open Data Côte d’Ivoire platform.
More broadly, TechMousso participants realised that training, networking, and exposure were key to deli-
vering impact. They also found that local context and diversity matters for gender inclusion. Following the-
se initial steps, the government’s nascent open data initiative has consulted with civil society organisations
and is willing to engage them in opening up data they need.
| 23 |

th
2. The data people need
This edition of the Barometer found that governments are not releasing the data needed to restore or build citizens’ trust, such as detailed budgets or company ownership registries.
Data for Government Accountability
Data needed for citizens to hold governments to account is often missing or hard to find. It is crucial for governments to provide information about the use of public resources. This includes data on how taxes are spent, how government contracts are awarded, and how money is funnelled into political campaigns. This also means releasing data vital to fighting corruption, such as data on budget, spending, contracting, land ownership, company registries, legislation, and election results (see methodology).
For example, only one in 10 budget datasets are open. Unfortunately, open budget data for the USA was no longer available at the time of producing this report, showing how progress in this area may even be backsliding. Even in the only case where land ownership data is available (Canada), it is only available at the sub-national level.
Datasets % of open datasets published by all governments
Total # of governments
Governments publishing these datasets as truly open data
Budget 10% 12 Australia, Brazil, Georgia, Germany, Jamaica, Mexico, Netherlands, Norway, Paraguay, Sweden, UK, Uruguay
Spending 3% 4 Canada, Greece, UK, Uruguay
Contracting 3% 3 Australia, France, Philippines
Land ownership 1% 1 Canada
Company registries 5% 6 Australia, Bulgaria, Canada, Kazakhstan, Latvia, Norway
Legislation 3% 3 New Zealand, Spain, UK
Election results 11% 13 Australia, Austria, Canada, Denmark, France, Ireland, Korea, Peru, Slovakia, Spain, Sweden, Turkey, UK
Table 7: Availability of open datasets for government accountability.
| 24 |
th
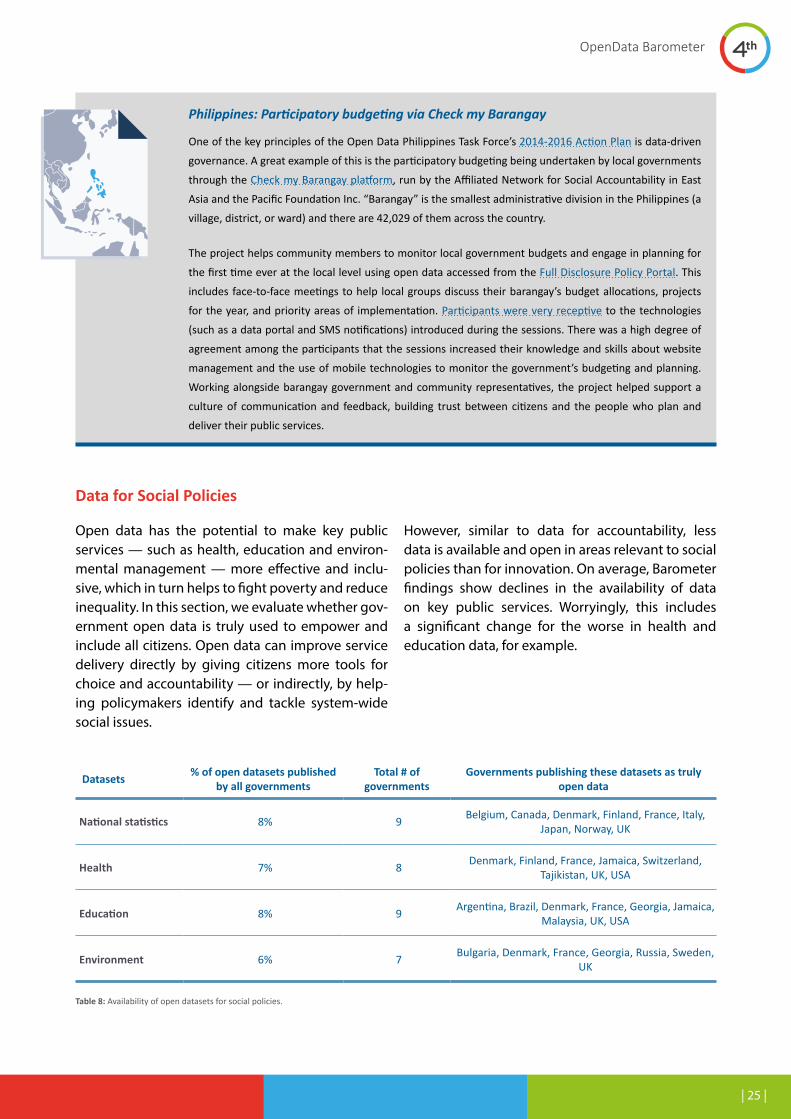
Philippines: Participatory budgeting via Check my Barangay
One of the key principles of the Open Data Philippines Task Force’s 2014-2016 Action Plan is data-driven
governance. A great example of this is the participatory budgeting being undertaken by local governments
through the Check my Barangay platform, run by the Affiliated Network for Social Accountability in East
Asia and the Pacific Foundation Inc. “Barangay” is the smallest administrative division in the Philippines (a
village, district, or ward) and there are 42,029 of them across the country.
The project helps community members to monitor local government budgets and engage in planning for
the first time ever at the local level using open data accessed from the Full Disclosure Policy Portal. This
includes face-to-face meetings to help local groups discuss their barangay’s budget allocations, projects
for the year, and priority areas of implementation. Participants were very receptive to the technologies
(such as a data portal and SMS notifications) introduced during the sessions. There was a high degree of
agreement among the participants that the sessions increased their knowledge and skills about website
management and the use of mobile technologies to monitor the government’s budgeting and planning.
Working alongside barangay government and community representatives, the project helped support a
culture of communication and feedback, building trust between citizens and the people who plan and
deliver their public services.
Data for Social Policies
Open data has the potential to make key public services — such as health, education and environ-mental management — more effective and inclu-sive, which in turn helps to fight poverty and reduce inequality. In this section, we evaluate whether gov-ernment open data is truly used to empower and include all citizens. Open data can improve service delivery directly by giving citizens more tools for choice and accountability — or indirectly, by help-ing policymakers identify and tackle system-wide social issues.
However, similar to data for accountability, less data is available and open in areas relevant to social policies than for innovation. On average, Barometer findings show declines in the availability of data on key public services. Worryingly, this includes a significant change for the worse in health and education data, for example.
Datasets % of open datasets published by all governments
Total # of governments
Governments publishing these datasets as truly open data
National statistics 8% 9 Belgium, Canada, Denmark, Finland, France, Italy, Japan, Norway, UK
Health 7% 8 Denmark, Finland, France, Jamaica, Switzerland, Tajikistan, UK, USA
Education 8% 9 Argentina, Brazil, Denmark, France, Georgia, Jamaica, Malaysia, UK, USA
Environment 6% 7 Bulgaria, Denmark, France, Georgia, Russia, Sweden, UK
Table 8: Availability of open datasets for social policies.
| 25 |
th
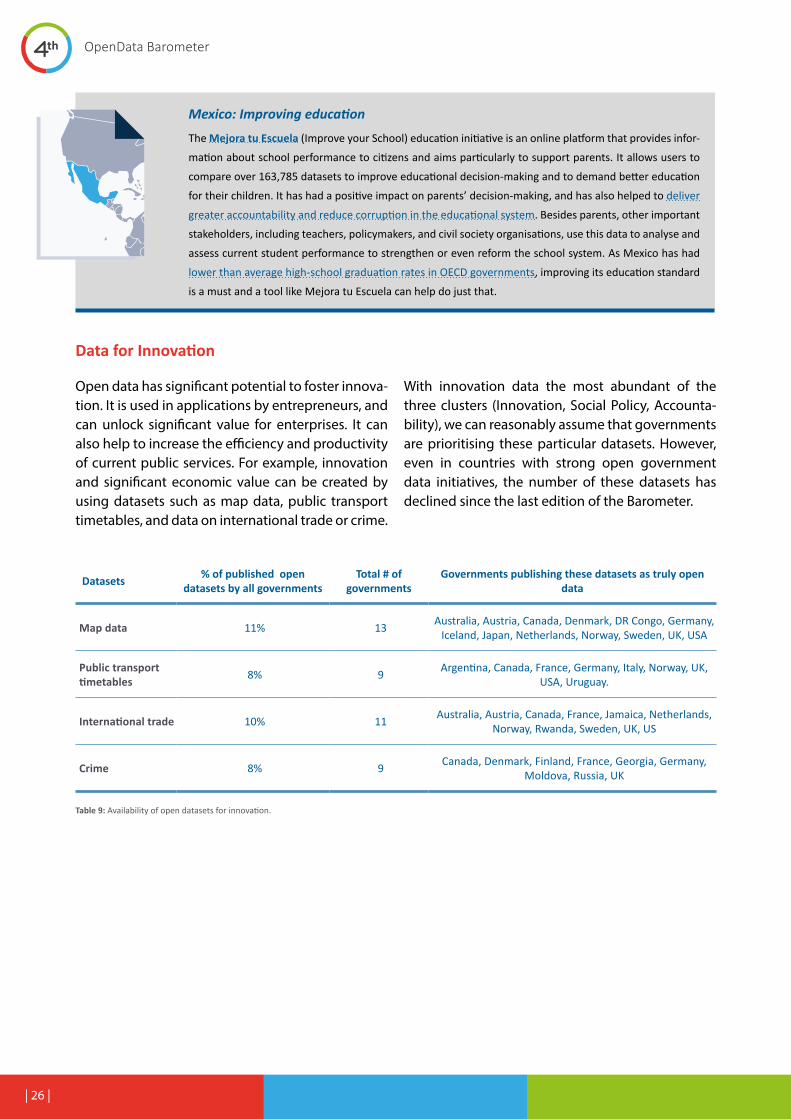
Mexico: Improving education
The Mejora tu Escuela (Improve your School) education initiative is an online platform that provides infor-
mation about school performance to citizens and aims particularly to support parents. It allows users to
compare over 163,785 datasets to improve educational decision-making and to demand better education
for their children. It has had a positive impact on parents’ decision-making, and has also helped to deliver
greater accountability and reduce corruption in the educational system. Besides parents, other important
stakeholders, including teachers, policymakers, and civil society organisations, use this data to analyse and
assess current student performance to strengthen or even reform the school system. As Mexico has had
lower than average high-school graduation rates in OECD governments, improving its education standard
is a must and a tool like Mejora tu Escuela can help do just that.
Data for Innovation
Open data has significant potential to foster innova-tion. It is used in applications by entrepreneurs, and can unlock significant value for enterprises. It can also help to increase the efficiency and productivity of current public services. For example, innovation and significant economic value can be created by using datasets such as map data, public transport timetables, and data on international trade or crime.
With innovation data the most abundant of the three clusters (Innovation, Social Policy, Accounta-bility), we can reasonably assume that governments are prioritising these particular datasets. However, even in countries with strong open government data initiatives, the number of these datasets has declined since the last edition of the Barometer.
Datasets % of published open datasets by all governments
Total # of governments
Governments publishing these datasets as truly open data
Map data 11% 13 Australia, Austria, Canada, Denmark, DR Congo, Germany, Iceland, Japan, Netherlands, Norway, Sweden, UK, USA
Public transport timetables 8% 9 Argentina, Canada, France, Germany, Italy, Norway, UK,
USA, Uruguay.
International trade 10% 11 Australia, Austria, Canada, France, Jamaica, Netherlands, Norway, Rwanda, Sweden, UK, US
Crime 8% 9 Canada, Denmark, Finland, France, Georgia, Germany, Moldova, Russia, UK
Table 9: Availability of open datasets for innovation.
| 26 |
th
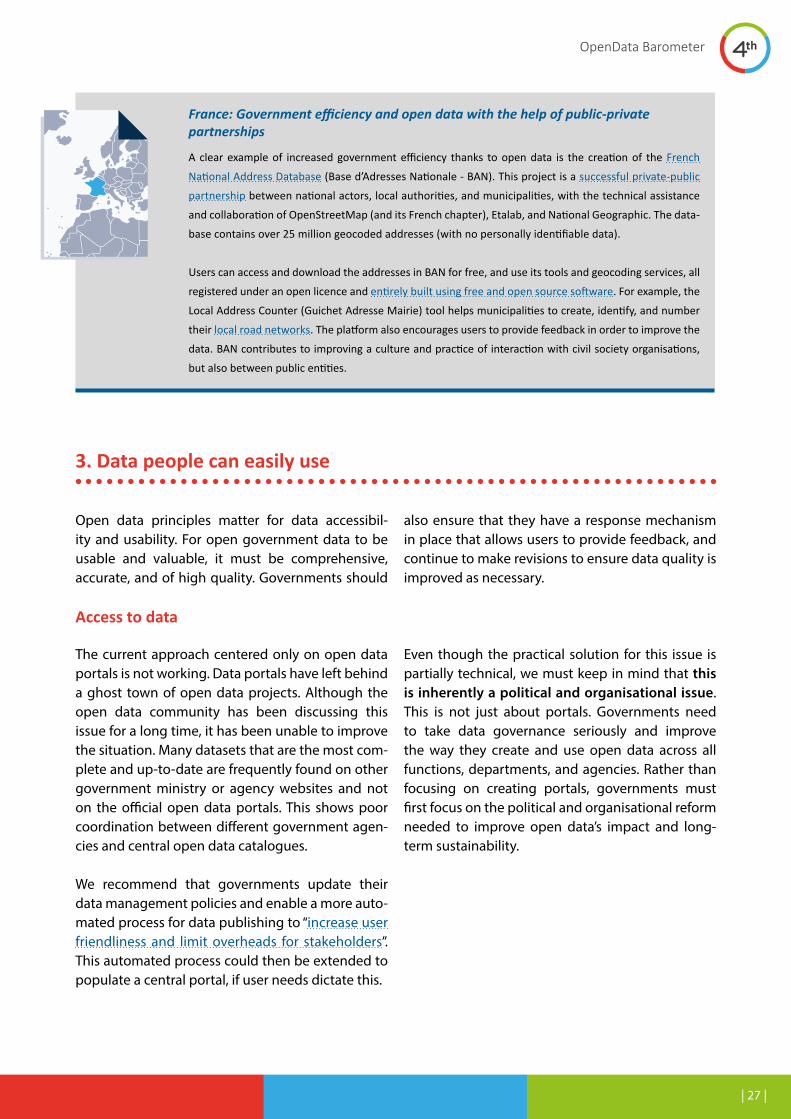
France: Government efficiency and open data with the help of public-private partnerships
A clear example of increased government efficiency thanks to open data is the creation of the French
National Address Database (Base d’Adresses Nationale - BAN). This project is a successful private-public
partnership between national actors, local authorities, and municipalities, with the technical assistance
and collaboration of OpenStreetMap (and its French chapter), Etalab, and National Geographic. The data-
base contains over 25 million geocoded addresses (with no personally identifiable data).
Users can access and download the addresses in BAN for free, and use its tools and geocoding services, all
registered under an open licence and entirely built using free and open source software. For example, the
Local Address Counter (Guichet Adresse Mairie) tool helps municipalities to create, identify, and number
their local road networks. The platform also encourages users to provide feedback in order to improve the
data. BAN contributes to improving a culture and practice of interaction with civil society organisations,
but also between public entities.
3. Data people can easily use
Open data principles matter for data accessibil-ity and usability. For open government data to be usable and valuable, it must be comprehensive, accurate, and of high quality. Governments should
also ensure that they have a response mechanism in place that allows users to provide feedback, and continue to make revisions to ensure data quality is improved as necessary.
Access to data
The current approach centered only on open data portals is not working. Data portals have left behind a ghost town of open data projects. Although the open data community has been discussing this issue for a long time, it has been unable to improve the situation. Many datasets that are the most com-plete and up-to-date are frequently found on other government ministry or agency websites and not on the official open data portals. This shows poor coordination between different government agen-cies and central open data catalogues.
We recommend that governments update their data management policies and enable a more auto-mated process for data publishing to “increase user friendliness and limit overheads for stakeholders”. This automated process could then be extended to populate a central portal, if user needs dictate this.
Even though the practical solution for this issue is partially technical, we must keep in mind that this is inherently a political and organisational issue. This is not just about portals. Governments need to take data governance seriously and improve the way they create and use open data across all functions, departments, and agencies. Rather than focusing on creating portals, governments must first focus on the political and organisational reform needed to improve open data’s impact and long-term sustainability.
| 27 |

th
The issue of third-party providers and open data portals
Sometimes the government does not remain in control of its own data portal when third-party providers
manage it; if external support for the data portal management ends, there is a high probability that the ini-
tiative will end too. For example, in sub-Saharan Africa, many governments (through their NSOs) have part-
nered with the African Development Bank (AfDB) to create online data portals for statistical capacity-buil-
ding. The AfDB also partners with data service providers (third-party providers) such as Knoema, a data
repository, to implement open data solutions in governments across the continent. These ‘third-party’
owned and managed open data portals should not be considered government open data portals because:
• the role of government in the management of the portal is often unclear;
• the origin and purpose of the platform is often unclear;
• the platform and project is usually under the sole control of the ‘third-party’, which raises ques-
tions around ownership and sustainability — such as in the case of the africadata.org portals
that have recently been discontinued;
• the data appears to be compiled not only from government sources but also from other internatio-
nal sources, making it unclear which one comes from where.
Data Usability
Too often government data may be available online, but the available data is still of poor quality, making it hard to use. Good quality open data needs to be:
• Available online so as to reach the widest practi-cal range of users and uses. Less than three quar-ters (71%) of existing data is nowadays available online in any form.
• Machine-readable so that large datasets can be analysed efficiently. More and more data is be-coming available in a reusable format — up to 53% in the current edition — but almost half of the data available is still published in non machi-ne-readable formats.
• Available in bulk so that it can be downloaded as one dataset and easily analysed by a machine.
Unfortunately, only 24% of the datasets in our study can be easily downloaded in bulk.
• Free of charge so that anyone can access it no matter their budget. Ten percent of the data that is available can not be fully accessed for free. Par-ticularly worrying is the case of land ownership data, only free of charge for about one-third of the data available.
• Open-licensed so that anyone has permission to use and reuse the data. Most data is currently not available under open licences (only 26% is). This is an area where there could easily be a quick win — if open licenses were applied across the board, at least 15% of datasets in the Barometer would be considered fully open (more than dou-ble the current measure of 7%).
| 28 |
th
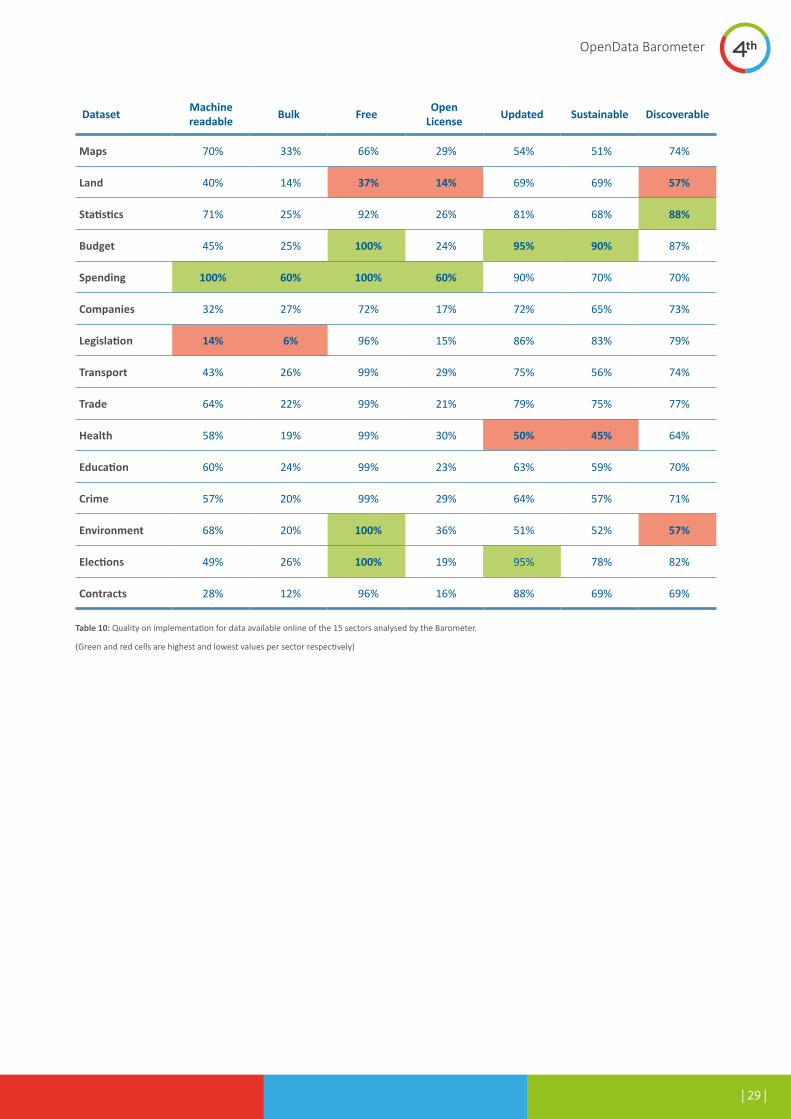
Dataset Machine readable Bulk Free Open
License Updated Sustainable Discoverable
Maps 70% 33% 66% 29% 54% 51% 74%
Land 40% 14% 37% 14% 69% 69% 57%
Statistics 71% 25% 92% 26% 81% 68% 88%
Budget 45% 25% 100% 24% 95% 90% 87%
Spending 100% 60% 100% 60% 90% 70% 70%
Companies 32% 27% 72% 17% 72% 65% 73%
Legislation 14% 6% 96% 15% 86% 83% 79%
Transport 43% 26% 99% 29% 75% 56% 74%
Trade 64% 22% 99% 21% 79% 75% 77%
Health 58% 19% 99% 30% 50% 45% 64%
Education 60% 24% 99% 23% 63% 59% 70%
Crime 57% 20% 99% 29% 64% 57% 71%
Environment 68% 20% 100% 36% 51% 52% 57%
Elections 49% 26% 100% 19% 95% 78% 82%
Contracts 28% 12% 96% 16% 88% 69% 69%
Table 10: Quality on implementation for data available online of the 15 sectors analysed by the Barometer.
(Green and red cells are highest and lowest values per sector respectively)
| 29 |
th
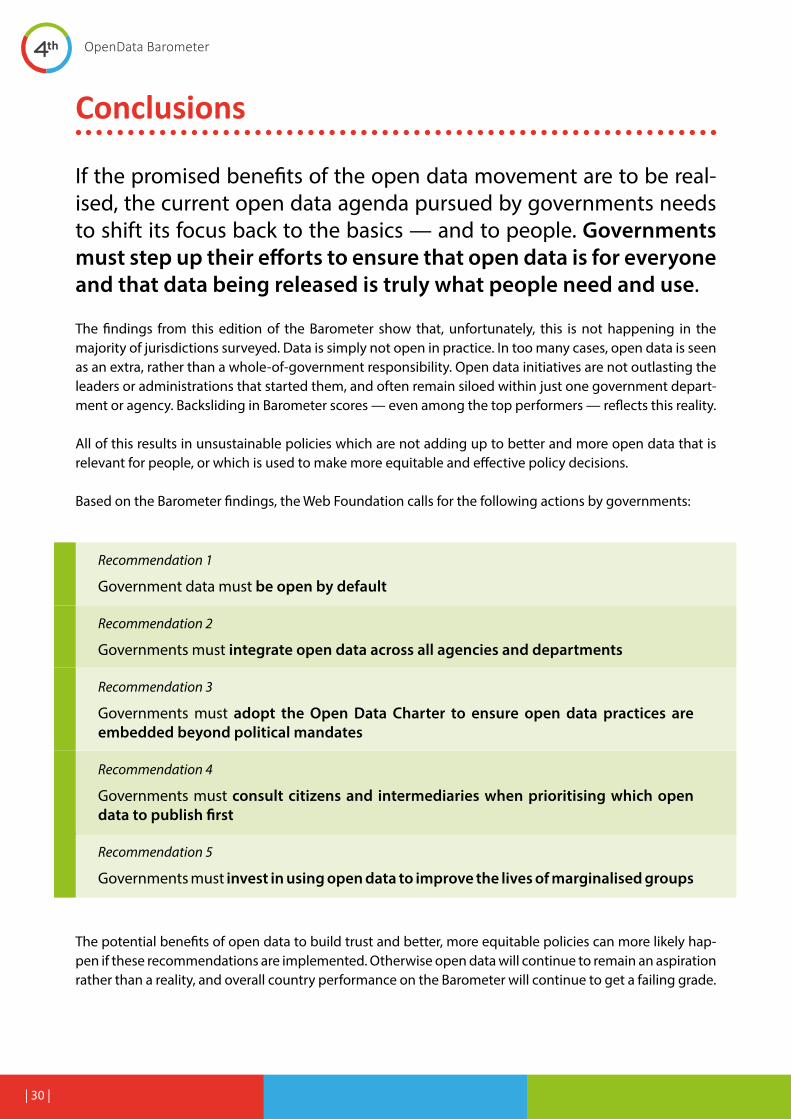
Conclusions
If the promised benefits of the open data movement are to be real-ised, the current open data agenda pursued by governments needs to shift its focus back to the basics — and to people. Governments must step up their efforts to ensure that open data is for everyone and that data being released is truly what people need and use.
The findings from this edition of the Barometer show that, unfortunately, this is not happening in the majority of jurisdictions surveyed. Data is simply not open in practice. In too many cases, open data is seen as an extra, rather than a whole-of-government responsibility. Open data initiatives are not outlasting the leaders or administrations that started them, and often remain siloed within just one government depart-ment or agency. Backsliding in Barometer scores — even among the top performers — reflects this reality.
All of this results in unsustainable policies which are not adding up to better and more open data that is relevant for people, or which is used to make more equitable and effective policy decisions.
Based on the Barometer findings, the Web Foundation calls for the following actions by governments:
Recommendation 1
Government data must be open by default
Recommendation 2
Governments must integrate open data across all agencies and departments
Recommendation 3
Governments must adopt the Open Data Charter to ensure open data practices are embedded beyond political mandates
Recommendation 4
Governments must consult citizens and intermediaries when prioritising which open data to publish first
Recommendation 5
Governments must invest in using open data to improve the lives of marginalised groups
The potential benefits of open data to build trust and better, more equitable policies can more likely hap-pen if these recommendations are implemented. Otherwise open data will continue to remain an aspiration rather than a reality, and overall country performance on the Barometer will continue to get a failing grade.
| 30 |
th
Methodology
The 4th edition of the Open Data Barometer is based upon three kinds of data:
• A peer-reviewed expert survey carried out be-tween May and September 2016, with a range of questions about open data contexts, policy, implementation, and impacts and a detailed da-taset survey completed for 15 kinds of data in each country, which touched on issues of data availability, format, licence, timeliness, and dis-coverability.
• A government self-assessment simplified survey carried out between May and July 2016 with the same range of context, implementation, and impacts questions, as an additional source of information.
• Secondary data selected to complement our expert survey data. This is used in the readiness section of the Barometer, and is taken from the World Economic Forum, World Bank, United Nations e-Government Survey, and Freedom House.
This new edition of the Barometer seeks to repeat the analysis from previous editions, with some small modifications and methodological revisions that are focused on three main aspects:
• Adaptation of the questionnaire to the final ver-sion of the Open Data Charter principles that was initiated in the previous edition of the Barometer on the basis of early drafts of the Charter.
• Adaptation of the implementation checklist to the new criteria defined by the updated open definition v2.1.
• Modifications to the definition of some previous-ly existing datasets [D2, D7 and D8] — all of them part of the global anti-corruption open data in-frastructure promoted by the Anti Corruption Open Up Guide.
Overall, however, we have sought to maintain cer-tain consistency with the questions used in previous editions one more time. Wider methodological revi-sions will continue to be explored in future editions as we keep advancing our measurement methods as part of our work in the Open Data Charter meas-urement and accountability working group.
You can read more about the methodology and research process and method in the detailed methodology description (pdf version) and the research handbook (pdf version). Feel also free to provide your feedback through comments on the respective online versions.
Historical and comparable consolidated data for all four editions of the Barometer is available on the website.
| 31 |
th
List of tables
Table 1: Open Data Barometer 4th Edition Ranking .............................................................................................................................................. 06
Table 2: Evolution of key open data indicators throughout the four editions of the Barometer ......................................................... 12
Table 3: Ranking of Nordic Countries: First to Fourth Editions of Barometer. ............................................................................................. 16
Table 4: % of governments publishing fully open accountability related datasets for the different editions of the Barometer 18
Table 5: Availability of sex-disaggregated data for four different sectors. ................................................................................................... 20
Table 6: Comparison between impact on entrepreneurship, economy, and inclusion for the top 10 governments. ................. 23
Table 7: Availability of open datasets for government accountability. ......................................................................................................... 24
Table 8: Availability of open datasets for social policies. .................................................................................................................................... 25
Table 9: Availability of open datasets for innovation. .......................................................................................................................................... 26
Table 10: Quality on implementation for data available online of the 15 sectors analysed by the Barometer. ............................. 29
| 32 |
th
Acknowledgements
The Open Data Barometer is possible thanks to the participation of a wide network of contributors. Our thanks to the following (by alphabetic order):
Lead authors: Ana Brandusescu, Carlos Iglesias and Kristen
Robinson.
Contributing authors: Jose M. Alonso, Craig Fagan, Anne
Jellema and Dillon Mann.
Research coordination: Carlos Iglesias.
Regional partners: The Caribbean Open Institute (COI), Iniciativa
Latinoamericana por los Datos Abiertos (ILDA), Open Data in
Europe and Central Asia (ODECA), and the Open Data Labs.
Methodological updates: Jose M. Alonso and Carlos Iglesias.
Website, data explorer and visualisations: Ana Brandusescu,
Craig Fagan, Carlos Iglesias and the teams from Simbiosys and
Ubiqware.
Design of PDF report: Nacho Quesada.
Illustrations for the PDF report: Eladio Domínguez.
Main researchers: Gyanu Adhikari, Hatem Ben Yacoub,
Ana Brandusescu, Frederico Cavazzini, Ravi Chhabra, Pierre
Chrzanowski, Veronica Cretu, Feng Gao, Miguel García
González, Shurland George, Jan Gondol, Felipe González,
Elisabeth Häggquist, Kaltrina Hoxha, Thorhildur Jetzek, Hiroichi
Kawashima, Abed Khooli, Haklae Kim, Katarina Kosmina,
Mary Loitsker, Glenn Maail, Leonard Mack, Krzysztof Madejski,
Ikrom Mamadov, Michelle McLeod, Claude Migisha, Maurizio
Napolitano, Mikhail Parfentev, Vinand Prayag, Adhitya Randy,
Igbal Safarov, Marco Sošić, Rayna Stamboliyska, Michail
Vafopoulos, François van Schalkwyk and Lunette Warren.
Peer-reviewers: Hatem Ben Yacoub, Ana Brandusescu, Michael
Canares, Shurland George, Felipe González, Vigan Hoxha,
Carlos Iglesias, Jorina Kadare, Natalia Karkanitsa, Abed Khooli,
Michelle McLeod, Andreas Pawelke, Tania Pendersen, François
van Schalkwyk, Olena Ursu and Lunette Warren.
Governments participating in the self-assessment:
Albania, Australia, Austria, Bangladesh, Belgium, Botswana,
Brazil, Bulgaria, Cameroon, Canada, Chile, Colombia, Cote
d’Ivoire, Croatia, Czech Republic, Estonia, Finland, France,
Ghana, Greece, Iceland, India, Ireland, Israel, Jamaica, Japan,
Kazakhstan, Kenya, Korea, Kosovo (Republic of ), Latvia,
Macedonia, Malawi, Malaysia, Mauritius, Mexico, Moldova,
Montenegro, Morocco, Netherlands, New Zealand, Norway,
Panama, Paraguay, Peru, Philippines, Poland, Portugal, Russian
Federation, Saint Lucia, Saudi Arabia, Serbia, Singapore,
Slovak Republic, Spain, Sweden, Switzerland, Thailand, Tunisia,
Ukraine, United Kingdom and Uruguay.
QA team: Jose M. Alonso, Ana Brandusescu, Michael Canares,
Craig Fagan, Carlos Iglesias, Andreas Pawelke and François van
Schalkwyk.
Note: Some other participants, including researchers, reviewers
and governments, have asked to remain anonymous.
Data sources: We are thankful to the following organisations
whose data we draw upon in the secondary data portion of the
Barometer:
• World Economic Forum • World Bank Group • Freedom House • United Nations
Funding: The 4th edition of the Barometer was supported by the
Open Data for Development (OD4D) programme, a partnership
funded by Canada’s International Development Research
Centre (IDRC), the World Bank, United Kingdom’s Department
for International Development (DFID), and Global Affairs
Canada (GAC).
This work was carried out with the aid of a grant from the
International Development Research Centre (IDRC), Ottawa,
Canada and the Omidyar Network.
| 33 |
th
About the Open Data Barometer
Produced by the World Wide Web Foundation as a collaborative work of the Open Data for Develop-ment (OD4D) network and with the support of the Omidyar Network, the Open Data Barometer (ODB) aims to uncover the true prevalence and impact of open data initiatives around the world. It analy-ses global trends, and provides comparative data on countries and regions using an in-depth meth-odology that combines contextual data, technical assessments and secondary indicators.
Covering 115 jurisdictions in the present edition, the Barometer ranks governments on:
• Readiness for open data initiatives.
• Implementation of open data programmes.
• Impact that open data is having on business, po-litics, and civil society.
This is the fourth edition of the Barometer. After three successful editions, this new one marks another
step towards becoming a global policymaking tool with a participatory and inclusive process and a strong regional focus. This year’s Barometer includes an assessment of governments against their performance in fulfilling the Open Data Charter principles in their final version.
The Barometer is a truly global and collaborative effort, with input from more than 100 researchers and government representatives. It takes over six months and more than 10,000 hours of research work to complete. During this process, we address more than 20,000 questions and respond to more than 5,000 comments and suggestions.
This report is intended to be a summary of some of the most striking findings. The full data and metho-dology is available online, and is intended to sup-port further secondary research and inform better decisions into the progression of open data policies and practices across the world and covers.
About the World Wide Web Foundation
The World Wide Web Foundation was established in 2009 by web inventor, Sir Tim Berners-Lee. Our mission? To advance the open web as a public good and a basic right.
Thanks to the web, for the first time in history we can glimpse a society where everyone, everywhere has equal access to knowledge, voice, and the ability to create. In this future, vital services such as health and education are delivered efficiently, access to knowledge unlocks economic value while access to information enhances transparency and strength-ens democracy.
We seek to harness the potential of open data as a tool for tackling society’s most pressing challenges, ensuring people are able to access, understand, and engage with the data directly affecting them. Our work on open data connects across these themes, working to support inclusive approaches to open data impact across the globe and covers:
• Co-leading the Open Data Charter since incep-tion to promote the adoption of global principles for the release of data and co-chairing the mea-surement and accountability working group.
| 34 |
th
• Being a member of the Open Data for Develop-ment (OD4D) Network to scale effective and via-ble open data solutions for economic and social development.
• Harnessing the Data Revolution for inclusive growth and sustainable development through the formation of the Global Partnership for Sus-tainable Development Data together with more than 100 other organisations.
• Co-leading the development of the world’s first register of beneficial company ownership data to shift norms around corporate transparency
and make it more difficult for corrupt individuals to hide — OpenOwnership.
• Building the Open Contracting Data Standard to make contracting information more useful and accessible, enhancing and promoting disclosure and participation in public contracting.
• Using a combination of research, incubation, tra-ining, and engagement in our Open Data Labs concept, where our goal is to accelerate progress and ensure that open data rapidly becomes a vital tool to tackle practical problems in develo-ping and emerging economies.
About the OD4D Network
OD4D is a global network of leading organisations that are creating locally-driven and sustainable open data ecosystems around the world. The OD4D network builds knowledge and provides support to governments and policymakers in key issues such as policies, standards, innovation, and skills devel-opment. OD4D focuses on building up the supply of quality open data, and also on improving the use of that data by leaders in government, civil society, the media, and business, so that it furthers public interest and improves people’s lives.
The OD4D Network is hosted by Canada’s Interna-tional Development Research Centre (IDRC), and it is co-funded with the World Bank, United Kingdom’s Department for International Development (DFID) and Global Affairs Canada (GAC).
| 35 |
opendatabarometer.org