global-scale latitudinal patterns of plant fine-root
TRANSCRIPT

ARTICLE
NATURE COMMUNICATIONS | 2:344 | DOI: 10.1038/ncomms1346 | www.nature.com/naturecommunications
© 2011 Macmillan Publishers Limited. All rights reserved.
Received 14 Feb 2011 | Accepted 11 May 2011 | Published 14 Jun 2011 DOI: 10.1038/ncomms1346
Most water and essential soil nutrient uptake is carried out by fine roots in plants. It is therefore important to understand the global geographic patterns of fine-root nitrogen and phosphorus cycling. Here, by compiling plant root data from 211 studies in 51 countries, we show that live fine roots have low nitrogen (N) and phosphorus (P), but similar N:P ratios when compared with green leaves. The fine-root N:P ratio differs between biomes and declines exponentially with latitude in roots of all diameter classes. This is in contrast to previous reports of a linear latitudinal decline in green leaf N:P, but consistent with nonlinear declines in leaf litter N:P. Whereas the latitudinal N:P decline in both roots and leaves reflects collective influences of climate, soil age and weathering, differences in the shape of the response function may be a result of their different N and P use strategies.
1 Faculty of Natural Resources Management, Lakehead University, 955 Oliver Rd, Thunder Bay, Ontario, Canada P7B 5E1. 2 College of Forestry and Gardening, Anhui Agricultural University, 130 Changjiang Road, Hefei 230036, China. 3 Department of Forest Resources and Institute on the Environment, University of Minnesota, 115 Green Hall, 1530 Cleveland Ave. N., St Paul, Minnesota 55108-6112, USA. 4 Hawkesbury Institute for the Environment, University of Western Sydney, Richmond, New South Wales 2753, Australia. Correspondence and requests for materials should be addressed to H.Y.H.C. (e-mail: [email protected]).
Global-scale latitudinal patterns of plant fine-root nitrogen and phosphorusZ.Y. Yuan1, Han Y.H. Chen1,2 & Peter B. Reich3,4
ARTICLE NATURE COMMUNICATIONS | DOI: 10.1038/ncomms1346
NATURE COMMUNICATIONS | 2:344 | DOI: 10.1038/ncomms1346 | www.nature.com/naturecommunications
© 2011 Macmillan Publishers Limited. All rights reserved.
As the below-ground analogue of leaves for resource uptake, !ne roots are responsible for water and nearly all essential soil nutrient uptake by plants. "e global N pool in !ne
roots is estimated to be 4.8×10⁸ Mg, approximately 1/7 of all ter-restrial vegetation1. Nutrient release from decomposing roots is a key pathway of signi!cant nutrient $ux in terrestrial ecosystems2. In forests, for example, the amount of nutrients cycled to the soil via !ne-root production and decomposition may equal to or even exceed those of above-ground litterfall3. Given the importance of !ne-root carbon (C), N and P chemistry in biology, physiology, biogeochemistry,and plant-insect and plant-disease interactions4, it is important to understand geographic patterns in root N and P at a global scale and possible links to ecosystem-scale biogeochemical cycling.
Ecological stoichiometry, in particular N:P ratios in plant green leaves, has been used to infer potential nutrient limitation of net primary production5 and plant-herbivore interactions in food webs4. So far, terrestrial ecologists and physiologists have largely focused on ratios of N:P in plant green leaves6,7, but also somewhat on senesced-leaf litter8,9. By contrast, our understanding of N and P stoichiometry in root systems, especially at a global scale, is much less developed.
Plant N and P stoichiometry is related to the variation among species, plant developmental stages, tissue types and environ-ments6,9–12. Plant green-leaf N and P concentrations have been shown to vary among climatic and soil environments, presumably re$ecting both plant adjustment (acclimation and adaptation)13 and biogeographical di%erences in relative N and P supply14. Studies on both plant leaves6–8,15 and on litterfall8,9 indicate that broad latitudi-nal and biome-level di%erences in soil N and P supplies can result in di%erences in plant nutrition and ecosystem nutrient cycles. As metabolically active tissues, !ne roots, similar to green leaves, might be expected to have similar N-to-P stoichiometry7 at local and glo-bal scales. However, !ne roots di%er profoundly from green leaves in many other ways in terms of morphology, chemistry and metabo-lism16, and as a result could di%er from leaves in N and P concen-trations and ratios. For example, the requirement for N in Rubisco leads to a greater N concentration per unit C lost in dark respiration for leaves than roots17 and could also lead to green leaves requiring more N relative to P than !ne roots, which would result in di%er-ences in N to P stoichiometry between these two types of tissues.
Given that the soil total N is o&en lower in both very young and very old soils than in middle-aged soils18,19 and that soil age generally decreases with latitude14,20, N concentration in !ne roots is expected, in a similar manner to that in leaves6,9,10, to increase, peak, and then decrease with increasing latitude. However, some studies have found that the extent of soil N limitation is not associ-
ated with latitude21, indicating that N concentration in !ne roots may not change with latitude. By contrast, !ne-root P is expected to decrease (and N:P ratio to increase) with decreasing latitude because of low soil P availability in low latitudes due to geologically older and highly leached P-limited soils11,14. Also, as stated in the latitudinal compensation hypothesis, species or populations from high-latitude environments may enhance their basal metabolic rates and have high potential growth rates to compensate for the short period of growing seasons22–24. "erefore, plant tissues such as leaves and !ne roots of fast-growing species at high latitudes, based on the growth rate hypothesis25, are expected to have high P demand for P used in P-rich RNA in ribosomes that are needed for synthesis of proteins, thus leading to low N:P ratio at high latitudes. However, at present, we do not know whether global-scale plant !ne-root latitu-dinal patterns are similar to the linear decline in N:P in green leaves6 or to the nonlinear decline in N:P in senesced-leaf litter8.
Here we compile data from 211 published studies on plant roots and show that the N:P ratio in roots declines exponentially with latitude in contrast to a linear decline in green leaves. Di%erences in root N:P ratios were largely due to variation in root P and were associated with variation in soil P rather than soil N, supporting the hypothesis that global latitudinal patterns of plant N:P are driven largely by soil P, providing support for the latitudinal compensation hypothesis and the growth rate hypothesis.
ResultsRoot nutrients and their ratios in relation to root size. We found that C concentration generally increased modestly, and N and P concentrations decreased with root size (Table 1). N:P ratios tended to be higher in coarse roots > 5 mm in diameter than in roots of < 1, 1 < 2, 2 < 5 mm classes, which did not di%er from each other, whereas C:N and C:P increased with root size in live roots (Table 1). Compared with live roots of similar sizes, dead roots had generally lower C and P concentrations, but similar N concentrations. "us, dead roots had higher N:P than live roots, but the patterns of C:N and C:P are inconsistent due to limited sample sizes (Table 1). "e lower P concentrations in dead than live roots (especially given no parallel pattern for N), may indicate P resorption from roots prior to senescence.
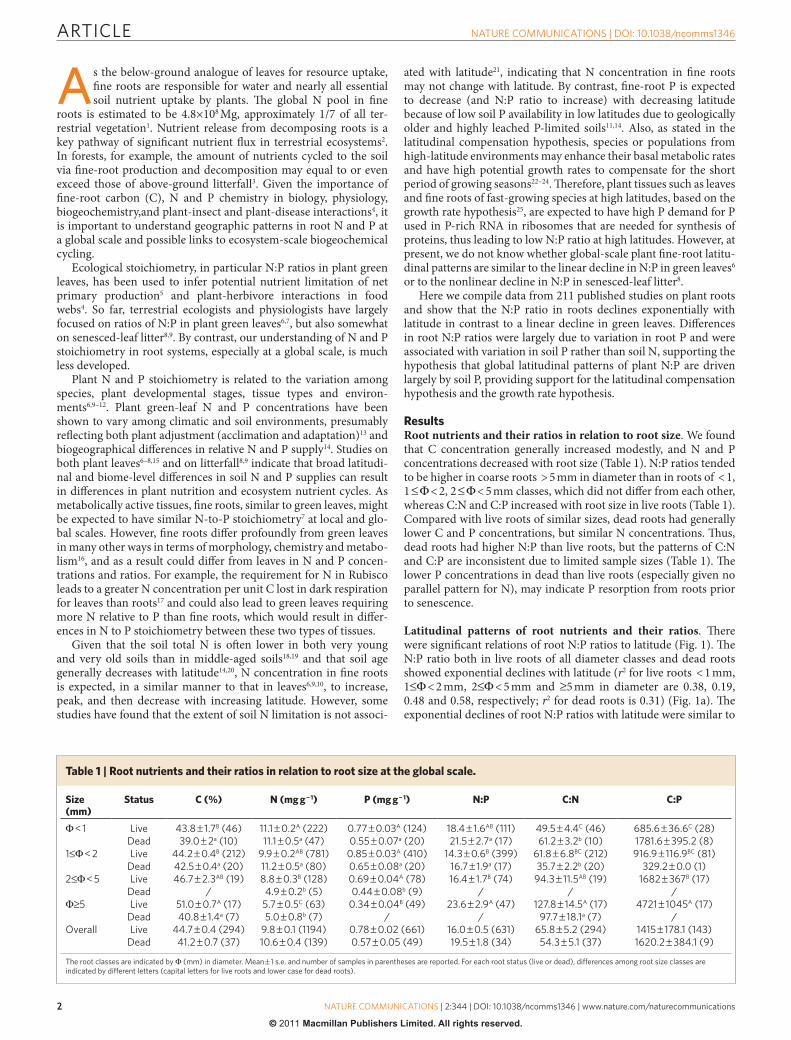
Latitudinal patterns of root nutrients and their ratios. "ere were signi!cant relations of root N:P ratios to latitude (Fig. 1). "e N:P ratio both in live roots of all diameter classes and dead roots showed exponential declines with latitude (r2 for live roots < 1 mm, 1 < 2 mm, 2 < 5 mm and 5 mm in diameter are 0.38, 0.19, 0.48 and 0.58, respectively; r2 for dead roots is 0.31) (Fig. 1a). "e exponential declines of root N:P ratios with latitude were similar to
Table 1 | Root nutrients and their ratios in relation to root size at the global scale.
Size (mm)
Status C (%) N (mg g − 1) P (mg g − 1) N:P C:N C:P
< 1 Live 43.8 1.7B (46) 11.1 0.2A (222) 0.77 0.03A (124) 18.4 1.6AB (111) 49.5 4.4C (46) 685.6 36.6C (28)Dead 39.0 2a (10) 11.1 0.5a (47) 0.55 0.07a (20) 21.5 2.7a (17) 61.2 3.2b (10) 1781.6 395.2 (8)
1 < 2 Live 44.2 0.4B (212) 9.9 0.2AB (781) 0.85 0.03A (410) 14.3 0.6B (399) 61.8 6.8BC (212) 916.9 116.9BC (81)Dead 42.5 0.4a (20) 11.2 0.5a (80) 0.65 0.08a (20) 16.7 1.9a (17) 35.7 2.2b (20) 329.2 0.0 (1)
2 < 5 Live 46.7 2.3AB (19) 8.8 0.3B (128) 0.69 0.04A (78) 16.4 1.7B (74) 94.3 11.5AB (19) 1682 367B (17)Dead / 4.9 0.2b (5) 0.44 0.08b (9) / / /
5 Live 51.0 0.7A (17) 5.7 0.5C (63) 0.34 0.04B (49) 23.6 2.9A (47) 127.8 14.5A (17) 4721 1045A (17)Dead 40.8 1.4a (7) 5.0 0.8b (7) / / 97.7 18.1a (7) /
Overall Live 44.7 0.4 (294) 9.8 0.1 (1194) 0.78 0.02 (661) 16.0 0.5 (631) 65.8 5.2 (294) 1415 178.1 (143)Dead 41.2 0.7 (37) 10.6 0.4 (139) 0.57 0.05 (49) 19.5 1.8 (34) 54.3 5.1 (37) 1620.2 384.1 (9)
The root classes are indicated by (mm) in diameter. Mean 1 s.e. and number of samples in parentheses are reported. For each root status (live or dead), differences among root size classes are indicated by different letters (capital letters for live roots and lower case for dead roots).
ARTICLE NATURE COMMUNICATIONS | DOI: 10.1038/ncomms1346
NATURE COMMUNICATIONS | 2:344 | DOI: 10.1038/ncomms1346 | www.nature.com/naturecommunications
© 2011 Macmillan Publishers Limited. All rights reserved.
that of senesced leaves (r2 = 0.284), but they di%ered from the linear and weaker decline in green leaves (r2 = 0.174) (Fig. 1b).
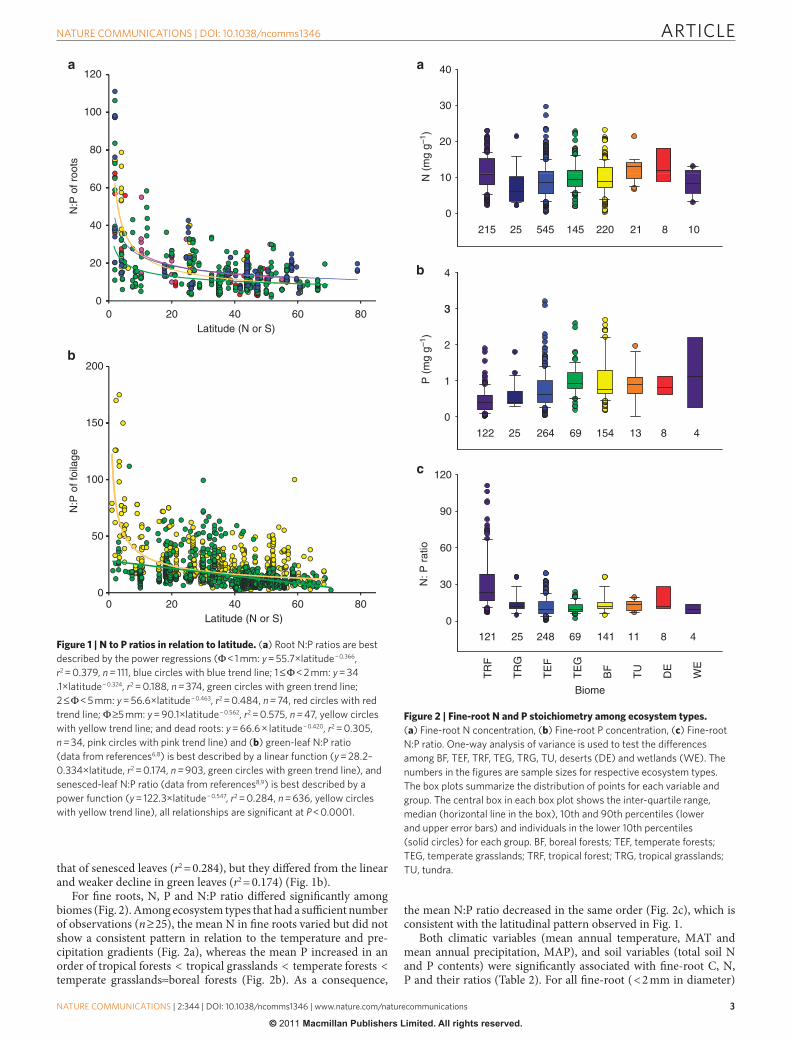
For !ne roots, N, P and N:P ratio di%ered signi!cantly among biomes (Fig. 2). Among ecosystem types that had a su'cient number of observations (n 25), the mean N in !ne roots varied but did not show a consistent pattern in relation to the temperature and pre-cipitation gradients (Fig. 2a), whereas the mean P increased in an order of tropical forests < tropical grasslands < temperate forests < temperate grasslands boreal forests (Fig. 2b). As a consequence,
the mean N:P ratio decreased in the same order (Fig. 2c), which is consistent with the latitudinal pattern observed in Fig. 1.
Both climatic variables (mean annual temperature, MAT and mean annual precipitation, MAP), and soil variables (total soil N and P contents) were signi!cantly associated with !ne-root C, N, P and their ratios (Table 2). For all !ne-root ( < 2 mm in diameter)
20
40
60
80
100
120N
:P o
f roo
tsN
:P o
f foi
lage
00
Latitude (N or S)
200
100
150
0
50
Latitude (N or S)
80604020
0 80604020
Figure 1 | N to P ratios in relation to latitude. (a) Root N:P ratios are best described by the power regressions ( < 1 mm: y = 55.7×latitude − 0.366, r2 = 0.379, n = 111, blue circles with blue trend line; 1 < 2 mm: y = 34.1×latitude − 0.324, r2 = 0.188, n = 374, green circles with green trend line; 2 < 5 mm: y = 56.6×latitude − 0.463, r2 = 0.484, n = 74, red circles with red trend line; 5 mm: y = 90.1×latitude − 0.562, r2 = 0.575, n = 47, yellow circles with yellow trend line; and dead roots: y = 66.6 × latitude − 0.420, r2 = 0.305, n = 34, pink circles with pink trend line) and (b) green-leaf N:P ratio (data from references6,8) is best described by a linear function (y = 28.2–0.334×latitude, r2 = 0.174, n = 903, green circles with green trend line), and senesced-leaf N:P ratio (data from references8,9) is best described by a power function (y = 122.3×latitude − 0.547, r2 = 0.284, n = 636, yellow circles with yellow trend line), all relationships are significant at P < 0.0001.
20
30
40
N (
mg
g–1)
0
10
3
4
215 25 545 145 10
P (
mg
g–1)
0
1
2
3
122 25 264 69 154 13 4
60
90
120
N: P
rat
io
0
30
121 25 248 69 141 11 8 4
TR
F
TR
G
TE
F
TE
G
BF
TU
DE
WE
Biome
821220
8
Figure 2 | Fine-root N and P stoichiometry among ecosystem types. (a) Fine-root N concentration, (b) Fine-root P concentration, (c) Fine-root N:P ratio. One-way analysis of variance is used to test the differences among BF, TEF, TRF, TEG, TRG, TU, deserts (DE) and wetlands (WE). The numbers in the figures are sample sizes for respective ecosystem types. The box plots summarize the distribution of points for each variable and group. The central box in each box plot shows the inter-quartile range, median (horizontal line in the box), 10th and 90th percentiles (lower and upper error bars) and individuals in the lower 10th percentiles (solid circles) for each group. BF, boreal forests; TEF, temperate forests; TEG, temperate grasslands; TRF, tropical forest; TRG, tropical grasslands; TU, tundra.
ARTICLE NATURE COMMUNICATIONS | DOI: 10.1038/ncomms1346
NATURE COMMUNICATIONS | 2:344 | DOI: 10.1038/ncomms1346 | www.nature.com/naturecommunications
© 2011 Macmillan Publishers Limited. All rights reserved.
data pooled, N did not vary with MAT, but !ne-root P decreased (r2 = 0.203) with MAT. Fine-root N increased (albeit very weakly) and !ne-root P decreased with MAP. Fine-root P decreased and N:P ratio increased, respectively in models that included both MAT and MAP; both climate metrics were signi!cant and shared little explanatory power.
Climate data (MAT and MAP) collectively explained 7–34% of the variation in !ne-root C, N, P and stoichiometric ratios (Table 2). Available soil N and P data explained between 43–75% of the variation in !ne-root C, N, P and stoichiometric ratios; however, only a small fraction of all !ne-root data had associated soil data. When soil N and P data were also taken into account, the climate variables accounted for a partial 16–22% of the variation in N, P and stoichiometric ratios, less than they explained on their own because of the correlation between climate variables and soil nutrients at the global scale. Climatic data (MAT and MAP) combined with soil data (N and P contents) explained surprisingly high proportions of root nutrient variation: 59, 76 and 73% of the global variation in !ne-root N, P and N:P, respectively (Table 2).
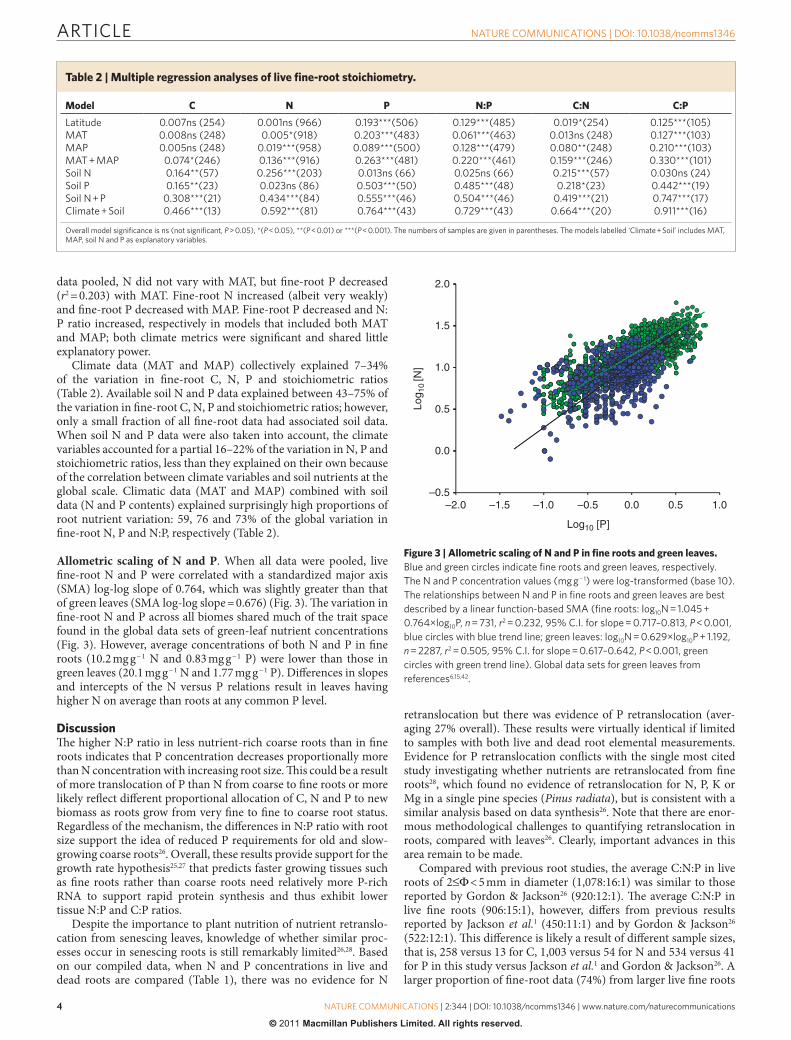
Allometric scaling of N and P. When all data were pooled, live !ne-root N and P were correlated with a standardized major axis (SMA) log-log slope of 0.764, which was slightly greater than that of green leaves (SMA log-log slope = 0.676) (Fig. 3). "e variation in !ne-root N and P across all biomes shared much of the trait space found in the global data sets of green-leaf nutrient concentrations (Fig. 3). However, average concentrations of both N and P in !ne roots (10.2 mg g − 1 N and 0.83 mg g − 1 P) were lower than those in green leaves (20.1 mg g − 1 N and 1.77 mg g − 1 P). Di%erences in slopes and intercepts of the N versus P relations result in leaves having higher N on average than roots at any common P level.
Discussion"e higher N:P ratio in less nutrient-rich coarse roots than in !ne roots indicates that P concentration decreases proportionally more than N concentration with increasing root size. "is could be a result of more translocation of P than N from coarse to !ne roots or more likely re$ect di%erent proportional allocation of C, N and P to new biomass as roots grow from very !ne to !ne to coarse root status. Regardless of the mechanism, the di%erences in N:P ratio with root size support the idea of reduced P requirements for old and slow-growing coarse roots26. Overall, these results provide support for the growth rate hypothesis25,27 that predicts faster growing tissues such as !ne roots rather than coarse roots need relatively more P-rich RNA to support rapid protein synthesis and thus exhibit lower tissue N:P and C:P ratios.
Despite the importance to plant nutrition of nutrient retranslo-cation from senescing leaves, knowledge of whether similar proc-esses occur in senescing roots is still remarkably limited26,28. Based on our compiled data, when N and P concentrations in live and dead roots are compared (Table 1), there was no evidence for N
retranslocation but there was evidence of P retranslocation (aver-aging 27% overall). "ese results were virtually identical if limited to samples with both live and dead root elemental measurements. Evidence for P retranslocation con$icts with the single most cited study investigating whether nutrients are retranslocated from !ne roots28, which found no evidence of retranslocation for N, P, K or Mg in a single pine species (Pinus radiata), but is consistent with a similar analysis based on data synthesis26. Note that there are enor-mous methodological challenges to quantifying retranslocation in roots, compared with leaves26. Clearly, important advances in this area remain to be made.
Compared with previous root studies, the average C:N:P in live roots of 2 < 5 mm in diameter (1,078:16:1) was similar to those reported by Gordon & Jackson26 (920:12:1). "e average C:N:P in live !ne roots (906:15:1), however, di%ers from previous results reported by Jackson et al.1 (450:11:1) and by Gordon & Jackson26 (522:12:1). "is di%erence is likely a result of di%erent sample sizes, that is, 258 versus 13 for C, 1,003 versus 54 for N and 534 versus 41 for P in this study versus Jackson et al.1 and Gordon & Jackson26. A larger proportion of !ne-root data (74%) from larger live !ne roots
2.0
1.0
1.5
0.0
0.5Log 1
0 [N
]
–0.5–2.0
Log10 [P]
1.00.50.0–0.5–1.0–1.5
Figure 3 | Allometric scaling of N and P in fine roots and green leaves. Blue and green circles indicate fine roots and green leaves, respectively. The N and P concentration values (mg g − 1) were log-transformed (base 10). The relationships between N and P in fine roots and green leaves are best described by a linear function-based SMA (fine roots: log10N = 1.045 + 0.764×log10P, n = 731, r2 = 0.232, 95% C.I. for slope = 0.717–0.813, P < 0.001, blue circles with blue trend line; green leaves: log10N = 0.629×log10P + 1.192, n = 2287, r2 = 0.505, 95% C.I. for slope = 0.617–0.642, P < 0.001, green circles with green trend line). Global data sets for green leaves from references6,15,42.
Table 2 | Multiple regression analyses of live fine-root stoichiometry.
Model C N P N:P C:N C:P
Latitude 0.007ns (254) 0.001ns (966) 0.193***(506) 0.129***(485) 0.019*(254) 0.125***(105)MAT 0.008ns (248) 0.005*(918) 0.203***(483) 0.061***(463) 0.013ns (248) 0.127***(103)MAP 0.005ns (248) 0.019***(958) 0.089***(500) 0.128***(479) 0.080**(248) 0.210***(103)MAT + MAP 0.074*(246) 0.136***(916) 0.263***(481) 0.220***(461) 0.159***(246) 0.330***(101)Soil N 0.164**(57) 0.256***(203) 0.013ns (66) 0.025ns (66) 0.215***(57) 0.030ns (24)Soil P 0.165**(23) 0.023ns (86) 0.503***(50) 0.485***(48) 0.218*(23) 0.442***(19)Soil N + P 0.308***(21) 0.434***(84) 0.555***(46) 0.504***(46) 0.419***(21) 0.747***(17)Climate + Soil 0.466***(13) 0.592***(81) 0.764***(43) 0.729***(43) 0.664***(20) 0.911***(16)
Overall model significance is ns (not significant, P > 0.05), *(P < 0.05), **(P < 0.01) or ***(P < 0.001). The numbers of samples are given in parentheses. The models labelled ‘Climate + Soil’ includes MAT, MAP, soil N and P as explanatory variables.

ARTICLE NATURE COMMUNICATIONS | DOI: 10.1038/ncomms1346
NATURE COMMUNICATIONS | 2:344 | DOI: 10.1038/ncomms1346 | www.nature.com/naturecommunications
© 2011 Macmillan Publishers Limited. All rights reserved.
(1 < 2 mm diameter) probably also contributed to higher C:N:P in this study.
"e C:N:P and N:P ratios in live roots (1,053:16:1) was simi-lar to those reported for green leaves (N:P of 13.8 by Reich and Oleksyn6, P = 0.271; 18.2 by Wright et al.15, P = 0.120; one-way ANOVA; C:N:P of 1,212:16:1 (refs 8,29,30)), indicating that live plant tissues from terrestrial ecosystems share a common functional stoichiometry. Also similar to that in senesced leaves (1,016:19:1)9, the C:N:P ratio was 1,059:20:1 for all sized dead roots and 844:19:1 for dead !ne roots, suggesting that terrestrial C:N:P ratios, both in leaves and roots, are equally well constrained at the level of ecosystems as are marine ratios27.
"e exponential and linear declines with latitude in live roots and green leaves, respectively, imply some similar and di%erent mechanisms for latitudinal N:P variations in roots versus leaves. "e latitudinal gradient in soil N versus P availability across latitudes14,21 (soil N is less limited than P across many low-latitude tropical for-ests31) could explain the latitudinal N:P declines in both leaves and roots. As !ne-root P increased positively, but !ne-root N remained relatively constant with latitude (Table 2), the !ne-root N:P ratio declined exponentially, as N:P is an inverse function of latitude. By contrast, the increased green-leaf P with latitudes is accompanied by a increased green-leaf N6; consequently, the N:P decline with increasing latitude in green leaves is not as abrupt as in roots. How-ever, the underlying mechanisms for the di%erences in the latitudi-nal N patterns between the !ne roots and green leaves are not clear.
McGroddy et al.8 proposed that the exceptional ability to resorb P in P-poor conditions, but constrained ability to resorb N in N-poor conditions (owing to the tendency for plants to use some N in proteins that are structural and/or di'cult to resorb) could con-tribute to the di%erences in N:P trends between the linear decline in green leaves and the exponential decline in litterfall8,32. A similar di%erence in live and dead root biogeography would require both that roots routinely resorb nutrients prior to senescence and that resorption of P is stronger than of N in P-poor conditions. Our results, however, show exponential N:P declines with latitude both in live and dead roots (Fig. 1). "e data in our compilation sug-gests that there is apparently no N resorption but considerable P resorption in !ne roots (27%, Table 1), supporting the idea that P can be resorbed more easily than N8; but this resorption pattern shows no latitudinal trend (as evidenced by the parallel variation in live and dead N:P). Because the samples from the !eld include both functionally active (live) and inactive (dead) roots, which are not o&en separated in some original studies owing to the di'culty in distinguishing them, the observed exponential trends in roots do not clearly answer whether the proposed mechanism for leaves8 may also be applicable to root systems. Moreover, roots also di%er signi!cantly from leaves (such as lack of morphologically distinct abscission zones and still closely associating with soils a&er death) that will in$uence the nutrient resorption and contents in root sys-tems. Further studies will be required before !rm conclusions can be made about similarities or di%erences in biogeographical varia-tion in live versus senesced root and leaf chemistry.
"e di%erences in !ne-root N, P and N:P ratio among biomes, with high N:P ratios both in roots (Fig. 2) and in leaves6,8,9,15 in trop-ics, support the idea that variations in P rather than N regulates the large-scale cross-continental biogeochemical patterns of plant N:P stoichiometry and nutrient use strategies4,14,21. "e !ndings of !ne-root C, N, P and their ratios in relation to climatic variable and soil variables (Table 2) also again con!rmed the latitudinal N:P decline patterns in !ne roots (Fig. 1).
"e analyses for soil N and P (Table 2) were based on a much smaller data set than relations with climate metrics. In a model with all four soil and climate parameters, the !ne-root P and N:P ratios were related to soil P and to all climatic variables, especially to MAP, likely re$ecting the close correlation between soil P and MAP which
results from the occurrence of poor leached soils in tropical areas with high precipitation14. "e signi!cant correlations between !ne-root N:P and soil P, together with the observed root (Fig. 1) and leaf latitudinal N:P patterns6,8, appear to support the geochemical hypoth-esis11,14,20, that is, tropical soils are on average geologically older, more weathered with lower supply of P relative to N, consequently result-ing in higher N:P ratios in roots in tropical latitudes. "e variation not explained by climate and soil (Table 2) is likely in part due to biological factors, for example, plant species (such as di%erences in nutrient economy), stand age and disturbance history12,33.
Di%erences in slopes and intercepts of the N versus P relations result in leaves having higher N on average than roots at any com-mon P level (Fig. 3). One possible explanation for this di%erence involves the greater requirement for N in leaves because of the need for N-rich Rubisco in leaves. Leaves and roots di%er in respiratory carbon-to-nitrogen relations, likely for this reason17, suggesting that it may also be involved in N:P di%erences among leaves and roots.
In summary, despite the variability in biomes, species and soil types, our analyses indicate the existence of global patterns in !ne-root N, P and N:P ratio along latitudinal gradients, adding support to a widely held belief in ecosystem ecology that plants in tropical habi-tats are generally more P-limited than those at higher latitudes14. "ese biogeographic gradients exist likely as a result of the collective in$u-ences of complex interactions of climate, soil and biological factors that change in relation to the distance from the equator. Di%erences in N:P ratios were largely due to variation in root P and were associ-ated with variation in soil P rather than soil N, supporting the hypo-thesis that global latitudinal patterns of plant N:P are driven largely by soil P. "e decline of !ne-root N:P with latitude and the allometric scaling of !ne-root N versus P also provide support for the latitudinal compensation hypothesis22–24 and the growth rate hypothesis25,which predicts that selection for rapid-growth with short-growth seasons in high latitudes increases tissue P-content disproportionately (and thus a lower N:P). As the growth rate hypothesis25 predicts, the biota can modify the strength of the geochemical in$uence through plant-soil feedbacks to the N and P cycles, leading to coupling between climate, ecological process and resultant stoichiometric patterns20,34.
MethodsData compilation. We collected data on C, N and P in roots from a range of litera-ture sources (Supplementary References). "e extensive literature search through !ve databases: ISI Web of Science, PubMed, Google Scholar, JSTOR and Scirus, was conducted using keywords of ‘!ne root*’ and ‘nutrient*’. We did not include data from either fertilized experiments in natural environments or the experiments conducted in pots or greenhouses. We included data that had measured roots to at least 20 cm depth in the soil. "e data were averaged for the particular site, if studies provided data for multiple times and locations within a site. We used the Global Gazetteer Version 2.2 (http://www.fallingrain.com/world/) to determine the latitude, longitude or altitude if this information was missing in the original paper. Soil total N and P data were from the original papers or other studies that were conducted in the same sites. Our data cover a wide range of ecosystems, includ-ing arctic tundra, forests, grasslands, wetlands and deserts. We further classi!ed forests into three biomes: boreal, temperate and tropical. Boreal forests included all forests occurring between 46°N and 66°N latitude35, tropical forests included all forests occurring between 23.5°S and 23.5°N latitude36, and temperate forests included all forests between the tropical and boreal latitudes. Study sites varied in stand ages and included both natural and manipulated ecosystems. "e total data set represented 527 sites, including 40 sites subjected to recent disturbances (stand age < 20 years). Site elevation ranges from 3 to 3,520 m. MAT ranges from − 9 to 30 °C; mean annual rainfall ranges from 170 to 10,370 mm per year..
Statistical analysis. Means of root N and P and their ratios were compared among root size classes ( < 1, 1 < 2, 2 < 5 and 5 mm) by using one-way analysis of variance, followed by Tukey’s post hoc comparisons when e%ects were signi!cant. Because of the limited number of samples, dead roots were pooled for all size classes. "e overall means in Table 1 are based on all observations (thus weight size classes by their sampling intensity) and the ratio columns, by default, include only samples with both elements measured, whereas the C, N and P columns include all observations. Weighting overall means equally by all size classes and comparing element means only for those with multiple values per sample does modify the absolute values but does not change the patterns or conclusions of the study. "e relationships between N:P ratios in roots of all diameter classes and latitude were !tted by power functions.

ARTICLE NATURE COMMUNICATIONS | DOI: 10.1038/ncomms1346
NATURE COMMUNICATIONS | 2:344 | DOI: 10.1038/ncomms1346 | www.nature.com/naturecommunications
© 2011 Macmillan Publishers Limited. All rights reserved.
Because of the limited number of samples available for roots 2 mm in diam-eter (Table 1), further analysis was conducted only for !ne roots ( < 2 mm in diam-eter). Fine-root N:P, C:N and C:P ratios were transformed using base-10 logarithm in order to meet the assumptions of normality and homogeneity of variances. "e log transformation eliminated any major departures from normality or homogene-ity of variances, as is commonly used in analyses of leaf and root traits9,17,37. Multi-ple regression analysis with backward stepwise procedure was used to examine the overall patterns of response of !ne-root N and P and their ratios to climatic (MAT and precipitation) and soil variables. Regression models were developed with increasing numbers of independent variables. "e models labelled ‘Climate + Soil’ include MAT, MAP, soil N and P as explanatory variables (Table 2). Overall model signi!cance and goodness-of-!t were judged by using the likelihood ratio statistic and assessing change in Akaike’s information criterion scores. A substantial change is considered when a change in Akaike’s information criterion of > 2 in the descrip-tive ability of the !nal model over the alternatives38.
To describe joint variation of N and P concentrations in both !ne roots and green leaves, we used SMA regression, a Model II regression method recom-mended when the variables can not be clearly separated into independent or dependent, and when error is associated with the measures of both39.
A&er !ne-root and green-leaf nutrient concentration values (mg g − 1) were log-transformed (base 10), the Model II regression analysis was performed in R by using the SMATR package (version 2.1)40. Two-tailed t-tests were used to deter-mine whether the slopes were signi!cantly di%erent. All statistical analyses were performed in R for Window version 2.10.1 statistical so&ware41. Data sets for green leaves were pooled from Reich & Oleksyn6, Wright et al.15, Townsend et al.42, and for senesced leaves, from McGroddy et al.8 and Yuan & Chen9. Data references for dead roots are indicated by a star in the Supplementary References.
References1. Jackson, R. B., Mooney, H. A. & Schulze, E. D. A global budget for !ne root
biomass, surface area, and nutrient contents. Proc. Natl Acad. Sci. USA 94, 7362–7366 (1997).
2. Yuan, Z. Y. & Chen, H. Y. H. Fine root biomass, production, turnover rates, and nutrient contents in boreal forest ecosystems in relation to species, climate, fertility, and stand age: literature review and meta-analyses. Cri. Rev. Plant Sci. 29, 204–221 (2010).
3. Raich, J. W. & Nadelho%er, K. J. Belowground carbon allocation in forest ecosystems—global trends. Ecology 70, 1346–1354 (1989).
4. Agren, G. I. Stoichiometry and nutrition of plant growth in natural communities. Annu. Rev. Ecol. Evol. Syst. 39, 153–170 (2008).
5. Koerselman, W. & Meuleman, A. F. M. "e vegetation N:P ratio: a new tool to detect the nature of nutrient limitation. J. Appl. Ecol. 33, 1441–1450 (1996).
6. Reich, P. B. & Oleksyn, J. Global patterns of plant leaf N and P in relation to temperature and latitude. Proc. Natl Acad. Sci. USA 101, 11001–11006 (2004).
7. Kerkho%, A. J., Fagan, W. F., Elser, J. J. & Enquist, B. J. Phylogenetic and growth form variation in the scaling of nitrogen and phosphorus in the seed plants. Am. Nat. 168, E103–E122 (2006).
8. McGroddy, M. E., Daufresne, T. & Hedin, L. O. Scaling of C : N : P stoichiometry in forests worldwide: Implications of terrestrial red!eld-type ratios. Ecology 85, 2390–2401 (2004).
9. Yuan, Z. Y. & Chen, H. Y. H. Global trends in senesced-leaf nitrogen and phosphorus. Global Ecol. Biogeogr. 18, 532–542 (2009).
10. Kerkho%, A. J., Enquist, B. J., Elser, J. J. & Fagan, W. F. Plant allometry, stoichiometry and the temperature-dependence of primary productivity. Global Ecol. Biogeogr. 14, 585–598 (2005).
11. Lambers, H., Chapin, F. S. & Pons, T. L. Plant Physiological Ecology (Springer, 2008).
12. Yuan, Z. Y. et al. Nitrogen response e'ciency increased monotonically with decreasing soil resource availability: a case study from a semiarid grassland in northern China. Oecologia 148, 564–572 (2006).
13. Gusewell, S. N:P ratios in terrestrial plants: variation and functional signi!cance. New Phytol. 164, 243–266 (2004).
14. Vitousek, P. M., Porder, S., Houlton, B. Z. & Chadwick, O. A. Terrestrial phosphorus limitation: mechanisms, implications, and nitrogen-phosphorus interactions. Ecol. Appl. 20, 5–15 (2010).
15. Wright, I. J. et al. "e worldwide leaf economics spectrum. Nature 428, 821–827 (2004).
16. Reich, P. B. in Plant Roots: the Hidden Half (eds Waise, Y., Eshel, A. & Ka)a!, U.) 205–220 (Marcel Dekker, Inc., New York, 2002).
17. Reich, P. B. et al. Scaling of respiration to nitrogen in leaves, stems and roots of higher land plants. Ecol. Lett. 11, 793–801 (2008).
18. Lambers, H., Brundrett, M. C., Raven, J. A. & Hopper, S. D. Plant mineral nutrition in ancient landscapes: high plant species diversity on infertile soils is linked to functional diversity for nutritional strategies. Plant Soil 334, 11–31 (2010).
19. Lambers, H., Raven, J. A., Shaver, G. R. & Smith, S. E. Plant nutrient-acquisition strategies change with soil age. Trends Ecol. Evol. 23, 95–103 (2008).
20. Chadwick, O. A., Derry, L. A., Vitousek, P. M., Huebert, B. J. & Hedin, L. O. Changing sources of nutrients during four million years of ecosystem development. Nature 397, 491–497 (1999).
21. LeBauer, D. S. & Treseder, K. K. Nitrogen limitation of net primary productivity in terrestrial ecosystems is globally distributed. Ecology 89, 371–379 (2008).
22. Yamahira, K., Kawajiri, M., Takeshi, K. & Irie, T. Inter- and intrapopulation variation in thermal reaction norms for growth rate: Evolution of latitudinal compensation in ectotherms with a genetic constraint. Evolution 61, 1577–1589 (2007).
23. Levinton, J. S. "e latitudinal compensation hypothesis—growth data and a model of latitudinal growth-di%erentiation based upon energy budgets. 1. interspeci!c comparison of ophryotrocha (polychaeta, dorvilleidae). Biol. Bull. 165, 686–698 (1983).
24. Conover, D. O. & Present, T. M. C. Countergradient variation in growth-rate—compensation for length of the growing-season among atlantic silversides from di%erent latitudes. Oecologia 83, 316–324 (1990).
25. Elser, J. J. et al. Biological stoichiometry from genes to ecosystems. Ecol. Lett. 3, 540–550 (2000).
26. Gordon, W. S. & Jackson, R. B. Nutrient concentrations in !ne roots. Ecology 81, 275–280 (2000).
27. Sterner, R. W. & Elser, J. J. Ecological Stoichiometry: the Biology of Elements from Molecules to the Biosphere (Princeton University Press, 2002).
28. Nambiar, E. K. S. Do nutrients retranslocate from !ne roots. Can. J. For. Res. 17, 913–918 (1987).
29. Yan, E. R., Wang, X. H., Guo, M., Zhong, Q. & Zhou, W. C:N:P stoichiometry across evergreen broad-leaved forests, evergreen coniferous forests and deciduous broad-leaved forests in the Tiantong region, Zhejiang Province, eastern China. Chin. J. Plant Ecol. 34, 48–57 (2010).
30. Ren, S. J., Yu, G. R., Tao, B. & Wang, S. Q. Leaf nitrogen and phosphorus stoichiometry across 654 terrestrial plant species in NSTEC. Environ. Sci. 28, 2665–2673 (2007).
31. Hedin, L. O., Brookshire, E. N. J., Menge, D. N. L. & Barron, A. R. "e nitrogen paradox in tropical forest ecosystems. Ann. Rev. Ecol. Evol. Syst. 40, 613–635 (2009).
32. Yuan, Z. Y. & Chen, H. Y. H. Global-scale patterns of nutrient resorption associated with latitude, temperature and precipitation. Global Ecol. Biogeogr. 18, 11–18 (2009).
33. Richardson, S. J., Allen, R. B. & Doherty, J. E. Shi&s in leaf N : P ratio during resorption re$ect soil P in temperate rainforest. Funct. Ecol. 22, 738–745 (2008).
34. Schimel, D. S. et al. Continental scale variability in ecosystem processes: models, data, and the role of disturbance. Ecol. Monogr. 67, 251–271 (1997).
35. Jarvis, P. G., Saugier, B. & Schulze, E. D. in Terrestrial Global Productivity (eds Roy, J., Saugier, B. & Mooney, H.A.) 211–244 (Academic Press, 2001).
36. Park, C. C. Tropical Rainforests (Routledge, 2003).37. Reich, P. B. et al. Evidence of a general 2/3-power law of scaling leaf nitrogen
to phosphorus among major plant groups and biomes. Proc. R. Soc. B 277, 877–883 (2010).
38. Chatterjee, S. & Hadi, A. Regression Analysis by Example (John Wiley & Sons, 2006).
39. Legendre, L. & Legendre, P. Numerical Ecology (Elsevier Science, 1998).40. Warton, D. I. !e ‘SMATR’ package for R. Version 2 (http://www.cran.r-project.
org/web/packages/smatr/index.html, 2007).41. R Development Core Team. R: a language and environment for statistical
computing (http://www.R-project.org, 2009).42. Townsend, A. R., Cleveland, C. C., Asner, G. P. & Bustamante, M. M. C. Controls
over foliar N:P ratios in tropical rain forests. Ecology 88, 107–118 (2007).
AcknowledgmentsWe thank Jane Parker for her constructive comments. "is work was !nancially supported by the Natural Science and Engineering Council of Canada (DG283336-09), Ontario Ministry of Research and Innovation Early Researcher Award program, the National Science Foundation LTER Program (DEB-0080382) of the United States, and the Discovery Grant Program of the Institute on the Environment, University of Minnesota.
Author contributionsZ.Y.Y., H.C., and P.B.R. designed the study, performed the research, analysed data, and wrote the paper.
Additional informationSupplementary Information accompanies this paper at http://www.nature.com/naturecommunicationsCompeting !nancial interests: "e authors declare no competing !nancial interests.Reprints and permission information is available online at http://npg.nature.com/reprintsandpermissions/How to cite this article: Yuan, Z. Y. et al. Global-scale latitudinal patterns of plant !ne-root nitrogen and phosphorus. Nat. Commun. 2:344 doi: 10.1038/ncomms1346 (2011).