global seismographic network records the great sumatra-andaman earthquake
DESCRIPTION
ArtículoTRANSCRIPT

On 26 December 2004 the Indonesian sub-duction zone near the northern end of Sumatrabegan to rupture at 58 minutes, 47 secondspast midnight Greenwich Mean Time.The rup-ture continued for approximately seven min-utes,extending northwestward along the SundaTrench for roughly 1200 km to the AndamanIslands.The seafloor displacement generateda massive tsunami that swept ashore with 10-mamplitude in northern Sumatra and expandedacross the Indian Ocean and Andaman Sea,striking Sri Lanka and Thailand within twohours of the rupture. Confirmed deaths alongthe coastlines of 11 Indian Ocean nationsexceed 220,000, marking this as one of themost lethal natural disasters in human history.
The 2004 Sumatra-Andaman earthquake isthe largest event since the 1964 Good FridayAlaskan earthquake (Mw = 9.2),releasing approx-imately as much strain energy as all globalearthquakes between 1976 and 1990 combined.Displacement occurred across the shallow-dipping thrust fault and may have exceeded20 m in some areas, totaling to a momentmagnitude (Mw) of 9.0 (seismic moment of M0
= 4.0 × 10²² N-m).This is the first earthquake ofthis size to occur since the advent of digital seis-mometry. Its moment release is eight times thatof the previous largest event, the great Peruearthquake of 23 June 2001 (Mw = 8.4).
As the fault ruptured,it radiated seismic wavesinto the surrounding rock.The elastic wavesexpanded outward through Earth’s interior asP and S waves and along its surface as Loveand Rayleigh waves.These waves soundedalarms at the Pacific Tsunami Warning Center inHawaii as they were recorded by telemeteredseismographic stations worldwide.The groundbegan to shake in Sri Lanka when the first Pwave arrived 4 minutes after the onset of rup-ture.After 12 minutes,P waves had reachedEurope and Antarctica.Every position on Earth’ssurface began to vibrate within 21 minutes.And such vibrations they were! The ground
shaking was detected by thousands ofseismometers worldwide, but sensors ofextraordinary bandwidth and dynamic rangewere needed to capture this giant earthquakefully.Fortunately,many such stations have beendeployed in the past few decades.
The Global Seismographic Network (GSN) isfunded by the U.S. National Science Founda-tion (NSF) in partnership with the U.S. Geolog-ical Survey (USGS), and operated by theIncorporated Research Institutions for Seismol-ogy (IRIS), the USGS, the University of Califor-nia, San Diego, and a number of cooperatinginstitutions [Butler et al., 2004].The GSN nowincludes 137 high dynamic range, broadbandseismic stations around the world, deployed asa multi-use facility for global monitoring ofearthquakes and nuclear explosions and scien-tific investigations of earthquakes and Earthstructure.
All GSN data are open and freely availablethrough the IRIS Data Management Center(http://www.iris.edu). Most stations have real-time telemetry through various global commu-nication circuits including Internet and satellitecommunications.An original design goal forthe GSN was to deploy instrumentation thatwould record with high fidelity all seismicmotions for earthquakes anywhere in the worldwith magnitudes as large as 9.0.The Sumatra-Andaman earthquake was the first full-scaletest of the GSN, and the network performedwell (Figure 1).
From the nearest GSN stations with real-timetelemetry (PALK on Sri Lanka and COCO inthe Cocos-Keeling Islands) to those near theevent’s antipode (OTAV in Ecuador), on-scalerecordings of the strongest motions producedby the earthquake were obtained along withthe tiny motions associated with subsequentoscillations of our entire planet.The peak-to-peak ground shaking for Rayleigh waves arriv-ing at PALK was 9.2 cm.Even at the most remotedistances, the ground moved up and downmore than 1 cm as R1 swept across Earth’s surface.Such records are unprecedented; all stationsof the former World Wide Standardized Seis-mic Network were driven off-scale for hours
by the 1964 Alaskan earthquake due to thelimitations of 1960’s seismographic technology.
The Sumatra-Andaman earthquake was feltthroughout southeastern Asia.At greater dis-tances, the largest-amplitude vibrations weretoo slow for human perception; nevertheless,all of Earth’s creatures rode this motion as themain seismic surface waves flexed the surface.
Seismic signals like those in Figure 1 enablerobust determination of the earthquake ruptureprocesses, and form the basis for most of whatcould be determined quickly about its fault-ing.With continuous telemetry of signals fromthe global GSN stations,a variety of near- real-time processing procedures are enabled forall earthquakes.
This includes automatic event detectionfrom the first-arriving seismic waves by earth-quake monitoring operations such as those ofthe USGS National Earthquake InformationCenter and the NOAA Pacific Tsunami WarningCenter.Both of these operations rely extensivelyon real-time GSN data for initial reporting ofglobal earthquakes.Once an event is located,the recorded vibrations allow seismic magni-tude estimation and inversion for fault orien-tation and slip direction. Rapid quantificationof the earthquake source is useful for tsunamiwarning and emergency response.
Unfortunately,ocean pressure sensors are notyet available in the Indian Ocean or AndamanSea to complement seismic analysis procedures,and effective communications and publicwarning systems to reach coastal areas are yetlacking.Thus, the full advantage of rapid analy-sis of seismic data could not be realized forthis event.
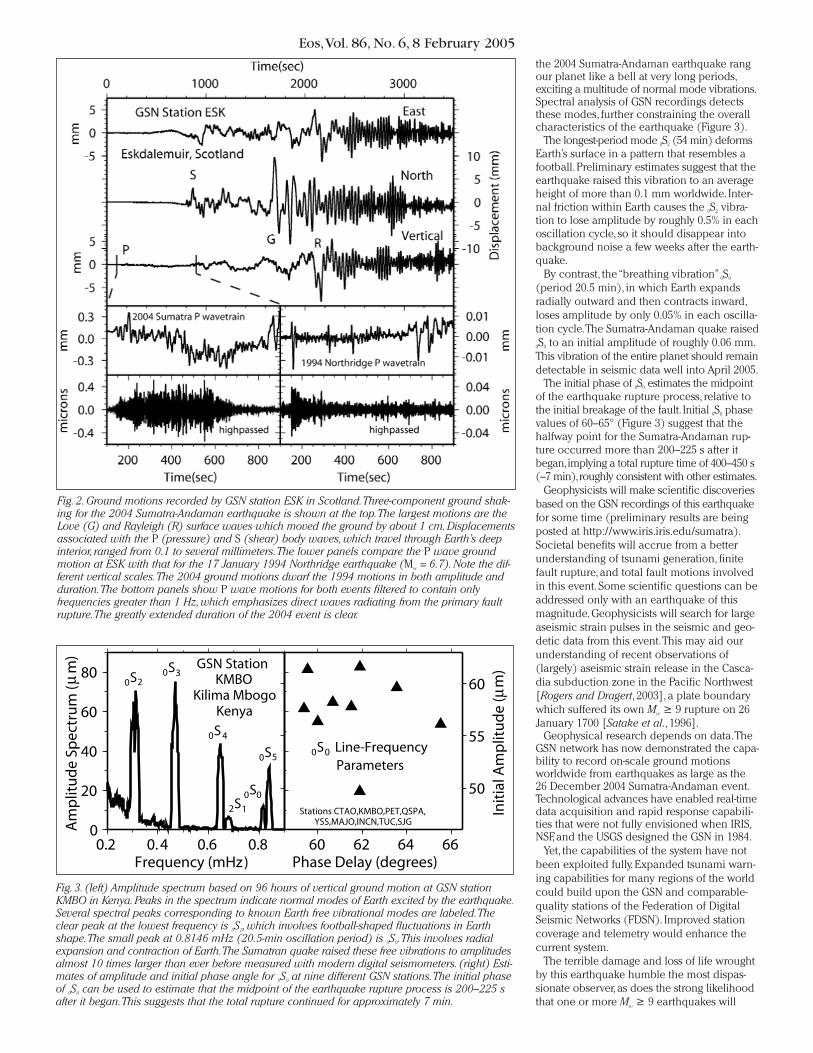
Due to the long rupture duration for theevent, every seismic phase has a correspond-ingly prolonged duration.The P wave energycontinued to arrive for minutes,and this is truefor all subsequent seismic phases such as PP,S, ScS, etc. Figure 2 compares the Sumatra-Andaman seismogram with a recording of the17 January 1994 Northridge earthquake (Mw =6.7) that caused more than 50 deaths andmore than $30 billion in property damage inSouthern California.The greater magnitude ofthe Sumatra-Andaman event is reflected in boththe larger amplitude and the vastly longerrupture process. Discrete pulses in the North-ridge seismogram correspond to the distinctbody wave arrivals P, PP, and PPP.The PP andPPP phases arrive during the prolonged P arrivalfrom the Sumatra-Andaman earthquake,so therupture process cannot be isolated within asingle body wave phase.The high-pass-filtered
VOLUME 86 NUMBER 6
8 FEBRUARY 2005
PAGES 57–64
Eos,Vol. 86, No. 6, 8 February 2005
EOS,TRANSACTIONS, AMERICAN GEOPHYSICAL UNION
PAGES 57, 60–61
Global Seismographic NetworkRecords the Great Sumatra-Andaman Earthquake
BY J. PARK, K.ANDERSON, R.ASTER, R. BUTLER,T. LAY,AND D. SIMPSON

version of the P wave (Figure 2) de-emphasizessecondary surface reflections and suggests~400 s of primary rupture.
The Sumatra-Andaman earthquake rupturedwith strong directionality, piling up energytoward the northwest from the event epicenter.Rupture directionality is critical for earthquakeand tsunami hazard. If rupture had progressedsoutheast along the Indonesian plate boundaryrather than northwest, Banda Aceh and Thai-land’s beaches might have been spared dev-astation, but heavy damage would have beenexpected along the southern Sumatran coast.
P wave timing determines the epicenter, i.e.,where rupture starts. Other observations deter-mine rupture directivity from stations alignedwith and against the strike of the earthquakefault.These include Doppler shifts in amplitudeand frequency content, and station-by-stationvariations in apparent rupture duration. Com-puter algorithms can determine the directionof rupture in a rapid and robust manner fromthe details of P wave signals.Analyses of thefirst 200 s of P wave motion at GSN stations bymany researchers have already yielded slipmodels for the portion of rupture near Sumatra.All models detect northwest rupture progres-sion and slip patches with ~20 m of underthrust-ing motion. Preliminary studies of broadbandsurface waves suggest a total duration of rup-ture of 360 s.
While the integration of geodetic, tsunami,and other constraints will establish details ofthe earthquake more firmly, rapid analysis ofGSN data provided first-order features of theevent and its aftershock sequence. Source-rupture modeling would be a useful augmen-tation to existing tsunami hazard assessmentprocedures.
Surface wave signals sweep around the worldrepeatedly after a large earthquake (see R1 toR4 in Figure 1), forming interference patternsthat comprise standing waves, or normalvibrational modes, within Earth. Effectively,
Eos,Vol. 86, No. 6, 8 February 2005
Fig.1. (a) Map of station locations for theGlobal Seismographic Network with real-timeor near-real-time data availability from theSumatra-Andaman earthquake, showing dis-tance in degrees. (b) Six hours of verticalground shaking for the Sumatra-Andamanearthquake at GSN stations worldwide displayedagainst distance from the source.The groundmotions are dominated by surface waves(Rayleigh waves),which produced peak-to-peak amplitudes of over 1 cm (see scale atlower right) everywhere on Earth’s surface.The series of major arrivals at each stationinvolve R1 (Rayleigh wave that travels alongthe minor great circle arc),R2 (Rayleigh wavetraveling along the major great circle arc),R3
(the same pulse as R1, but with an additionalglobal circuit), and R4 (the same pulse as R2
with an additional global circuit). Signals fora large (Mw = 7.1) aftershock are visible at theclosest stations at a time delay of about 200 min.
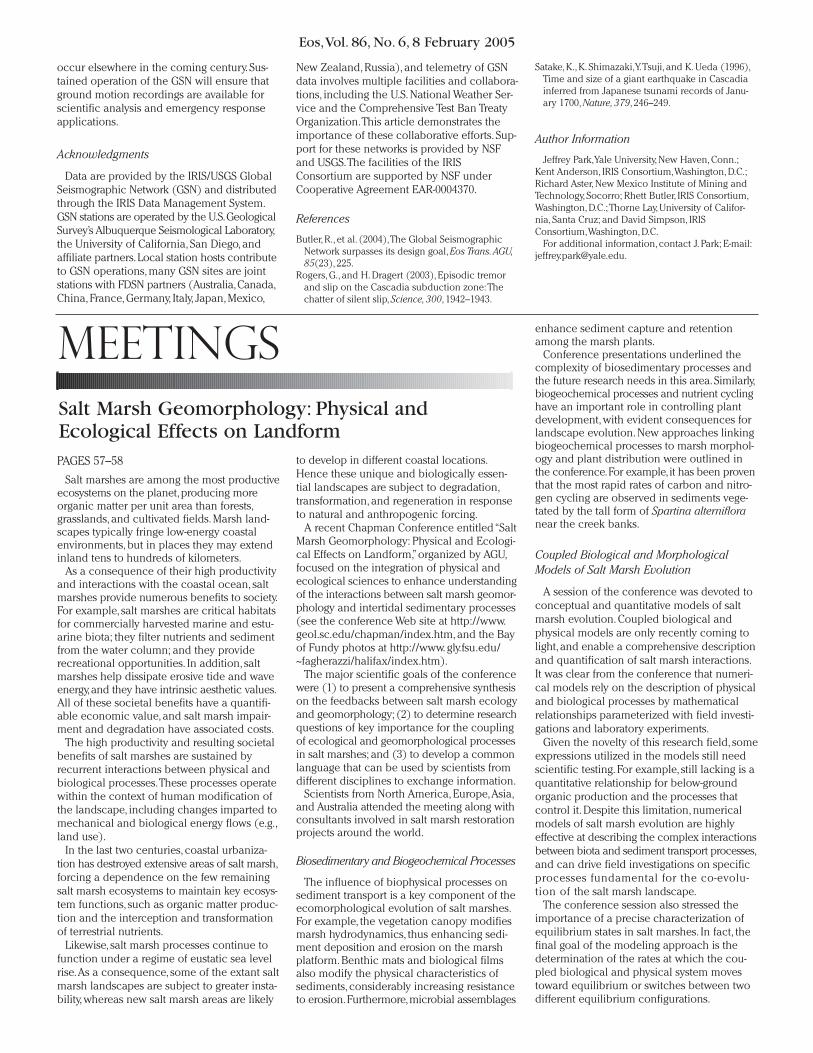
the 2004 Sumatra-Andaman earthquake rangour planet like a bell at very long periods,exciting a multitude of normal mode vibrations.Spectral analysis of GSN recordings detectsthese modes, further constraining the overallcharacteristics of the earthquake (Figure 3).
The longest-period mode 0S2 (54 min) deformsEarth’s surface in a pattern that resembles afootball.Preliminary estimates suggest that theearthquake raised this vibration to an averageheight of more than 0.1 mm worldwide. Inter-nal friction within Earth causes the 0S2 vibra-tion to lose amplitude by roughly 0.5% in eachoscillation cycle, so it should disappear intobackground noise a few weeks after the earth-quake.
By contrast, the “breathing vibration” 0S0
(period 20.5 min), in which Earth expandsradially outward and then contracts inward,loses amplitude by only 0.05% in each oscilla-tion cycle.The Sumatra-Andaman quake raised0S0 to an initial amplitude of roughly 0.06 mm.This vibration of the entire planet should remaindetectable in seismic data well into April 2005.
The initial phase of 0S0 estimates the midpointof the earthquake rupture process, relative tothe initial breakage of the fault. Initial 0S0 phasevalues of 60–65° (Figure 3) suggest that thehalfway point for the Sumatra-Andaman rup-ture occurred more than 200–225 s after itbegan,implying a total rupture time of 400–450 s(~7 min),roughly consistent with other estimates.
Geophysicists will make scientific discoveriesbased on the GSN recordings of this earthquakefor some time (preliminary results are beingposted at http://www.iris.iris.edu/sumatra).Societal benefits will accrue from a betterunderstanding of tsunami generation, finitefault rupture, and total fault motions involvedin this event. Some scientific questions can beaddressed only with an earthquake of thismagnitude. Geophysicists will search for largeaseismic strain pulses in the seismic and geo-detic data from this event.This may aid ourunderstanding of recent observations of(largely) aseismic strain release in the Casca-dia subduction zone in the Pacific Northwest[Rogers and Dragert, 2003], a plate boundarywhich suffered its own Mw ≥ 9 rupture on 26January 1700 [Satake et al., 1996].
Geophysical research depends on data.TheGSN network has now demonstrated the capa-bility to record on-scale ground motionsworldwide from earthquakes as large as the26 December 2004 Sumatra-Andaman event.Technological advances have enabled real-timedata acquisition and rapid response capabili-ties that were not fully envisioned when IRIS,NSF, and the USGS designed the GSN in 1984.
Yet, the capabilities of the system have notbeen exploited fully. Expanded tsunami warn-ing capabilities for many regions of the worldcould build upon the GSN and comparable-quality stations of the Federation of DigitalSeismic Networks (FDSN). Improved stationcoverage and telemetry would enhance thecurrent system.
The terrible damage and loss of life wroughtby this earthquake humble the most dispas-sionate observer,as does the strong likelihoodthat one or more Mw ≥ 9 earthquakes will
Eos,Vol. 86, No. 6, 8 February 2005
Fig.2.Ground motions recorded by GSN station ESK in Scotland.Three-component ground shak-ing for the 2004 Sumatra-Andaman earthquake is shown at the top.The largest motions are theLove (G) and Rayleigh (R) surface waves which moved the ground by about 1 cm.Displacementsassociated with the P (pressure) and S (shear) body waves,which travel through Earth’s deepinterior, ranged from 0.1 to several millimeters.The lower panels compare the P wave groundmotion at ESK with that for the 17 January 1994 Northridge earthquake (Mw = 6.7).Note the dif-ferent vertical scales.The 2004 ground motions dwarf the 1994 motions in both amplitude andduration.The bottom panels show P wave motions for both events filtered to contain onlyfrequencies greater than 1 Hz,which emphasizes direct waves radiating from the primary faultrupture.The greatly extended duration of the 2004 event is clear.
Fig.3. (left) Amplitude spectrum based on 96 hours of vertical ground motion at GSN stationKMBO in Kenya.Peaks in the spectrum indicate normal modes of Earth excited by the earthquake.Several spectral peaks corresponding to known Earth free vibrational modes are labeled.Theclear peak at the lowest frequency is 0S2,which involves football-shaped fluctuations in Earthshape.The small peak at 0.8146 mHz (20.5-min oscillation period) is 0S0.This involves radialexpansion and contraction of Earth.The Sumatran quake raised these free vibrations to amplitudesalmost 10 times larger than ever before measured with modern digital seismometers. (right) Esti-mates of amplitude and initial phase angle for 0S0 at nine different GSN stations.The initial phaseof 0S0 can be used to estimate that the midpoint of the earthquake rupture process is 200–225 safter it began.This suggests that the total rupture continued for approximately 7 min.
Salt marshes are among the most productiveecosystems on the planet,producing moreorganic matter per unit area than forests,grasslands, and cultivated fields. Marsh land-scapes typically fringe low-energy coastalenvironments, but in places they may extendinland tens to hundreds of kilometers.
As a consequence of their high productivityand interactions with the coastal ocean, saltmarshes provide numerous benefits to society.For example, salt marshes are critical habitatsfor commercially harvested marine and estu-arine biota; they filter nutrients and sedimentfrom the water column; and they providerecreational opportunities. In addition, saltmarshes help dissipate erosive tide and waveenergy,and they have intrinsic aesthetic values.All of these societal benefits have a quantifi-able economic value, and salt marsh impair-ment and degradation have associated costs.
The high productivity and resulting societalbenefits of salt marshes are sustained byrecurrent interactions between physical andbiological processes.These processes operatewithin the context of human modification ofthe landscape, including changes imparted tomechanical and biological energy flows (e.g.,land use).
In the last two centuries, coastal urbaniza-tion has destroyed extensive areas of salt marsh,forcing a dependence on the few remainingsalt marsh ecosystems to maintain key ecosys-tem functions, such as organic matter produc-tion and the interception and transformationof terrestrial nutrients.
Likewise, salt marsh processes continue tofunction under a regime of eustatic sea levelrise.As a consequence, some of the extant saltmarsh landscapes are subject to greater insta-bility, whereas new salt marsh areas are likely
to develop in different coastal locations.Hence these unique and biologically essen-tial landscapes are subject to degradation,transformation, and regeneration in responseto natural and anthropogenic forcing.
A recent Chapman Conference entitled “SaltMarsh Geomorphology: Physical and Ecologi-cal Effects on Landform,”organized by AGU,focused on the integration of physical andecological sciences to enhance understandingof the interactions between salt marsh geomor-phology and intertidal sedimentary processes(see the conference Web site at http://www.geol.sc.edu/chapman/index.htm, and the Bayof Fundy photos at http://www. gly.fsu.edu/~fagherazzi/halifax/index.htm).
The major scientific goals of the conferencewere (1) to present a comprehensive synthesison the feedbacks between salt marsh ecologyand geomorphology; (2) to determine researchquestions of key importance for the couplingof ecological and geomorphological processesin salt marshes; and (3) to develop a commonlanguage that can be used by scientists fromdifferent disciplines to exchange information.
Scientists from North America, Europe,Asia,and Australia attended the meeting along withconsultants involved in salt marsh restorationprojects around the world.
Biosedimentary and Biogeochemical Processes
The influence of biophysical processes onsediment transport is a key component of theecomorphological evolution of salt marshes.For example, the vegetation canopy modifiesmarsh hydrodynamics, thus enhancing sedi-ment deposition and erosion on the marshplatform. Benthic mats and biological filmsalso modify the physical characteristics ofsediments, considerably increasing resistanceto erosion.Furthermore,microbial assemblages
enhance sediment capture and retentionamong the marsh plants.
Conference presentations underlined thecomplexity of biosedimentary processes andthe future research needs in this area.Similarly,biogeochemical processes and nutrient cyclinghave an important role in controlling plantdevelopment, with evident consequences forlandscape evolution. New approaches linkingbiogeochemical processes to marsh morphol-ogy and plant distribution were outlined inthe conference.For example,it has been proventhat the most rapid rates of carbon and nitro-gen cycling are observed in sediments vege-tated by the tall form of Spartina alternifloranear the creek banks.
Coupled Biological and Morphological Models of Salt Marsh Evolution
A session of the conference was devoted toconceptual and quantitative models of saltmarsh evolution. Coupled biological andphysical models are only recently coming tolight,and enable a comprehensive descriptionand quantification of salt marsh interactions.It was clear from the conference that numeri-cal models rely on the description of physicaland biological processes by mathematicalrelationships parameterized with field investi-gations and laboratory experiments.
Given the novelty of this research field, someexpressions utilized in the models still needscientific testing. For example, still lacking is aquantitative relationship for below-groundorganic production and the processes thatcontrol it. Despite this limitation, numericalmodels of salt marsh evolution are highlyeffective at describing the complex interactionsbetween biota and sediment transport processes,and can drive field investigations on specificprocesses fundamental for the co-evolu-tion of the salt marsh landscape.
The conference session also stressed theimportance of a precise characterization ofequilibrium states in salt marshes. In fact, thefinal goal of the modeling approach is thedetermination of the rates at which the cou-pled biological and physical system movestoward equilibrium or switches between twodifferent equilibrium configurations.
Eos,Vol. 86, No. 6, 8 February 2005
occur elsewhere in the coming century. Sus-tained operation of the GSN will ensure thatground motion recordings are available forscientific analysis and emergency responseapplications.
Acknowledgments
Data are provided by the IRIS/USGS GlobalSeismographic Network (GSN) and distributedthrough the IRIS Data Management System.GSN stations are operated by the U.S.GeologicalSurvey’s Albuquerque Seismological Laboratory,the University of California, San Diego, andaffiliate partners.Local station hosts contributeto GSN operations, many GSN sites are jointstations with FDSN partners (Australia,Canada,China, France, Germany, Italy, Japan, Mexico,
New Zealand, Russia), and telemetry of GSNdata involves multiple facilities and collabora-tions, including the U.S. National Weather Ser-vice and the Comprehensive Test Ban TreatyOrganization.This article demonstrates theimportance of these collaborative efforts. Sup-port for these networks is provided by NSFand USGS.The facilities of the IRISConsortium are supported by NSF underCooperative Agreement EAR-0004370.
References
Butler, R., et al. (2004),The Global SeismographicNetwork surpasses its design goal, Eos Trans.AGU,85(23), 225.
Rogers, G., and H. Dragert (2003), Episodic tremorand slip on the Cascadia subduction zone:Thechatter of silent slip, Science,300, 1942–1943.
Satake, K., K. Shimazaki,Y.Tsuji, and K. Ueda (1996),Time and size of a giant earthquake in Cascadiainferred from Japanese tsunami records of Janu-ary 1700, Nature,379, 246–249.
Author Information
Jeffrey Park,Yale University, New Haven, Conn.;Kent Anderson, IRIS Consortium,Washington, D.C.;Richard Aster, New Mexico Institute of Mining andTechnology, Socorro; Rhett Butler, IRIS Consortium,Washington, D.C.;Thorne Lay, University of Califor-nia, Santa Cruz; and David Simpson, IRISConsortium,Washington, D.C.
For additional information, contact J. Park; E-mail:[email protected].
PAGES 57–58
Salt Marsh Geomorphology: Physical andEcological Effects on Landform
MEETINGS