global techno-economic trends for solar pv and · pdf filesaudi aramco: company general use...
TRANSCRIPT

Saudi Aramco: Company General Use
Global Techno-Economic Trends for Solar PV and Relevance for MENA 22 January 2016: American University of Beirut
Peter Durante: Division Head – New & Emerging Technology + Market Intelligence Team Saudi Aramco’s Power Systems Renewables Department
2
Saudi Aramco: Company General Use
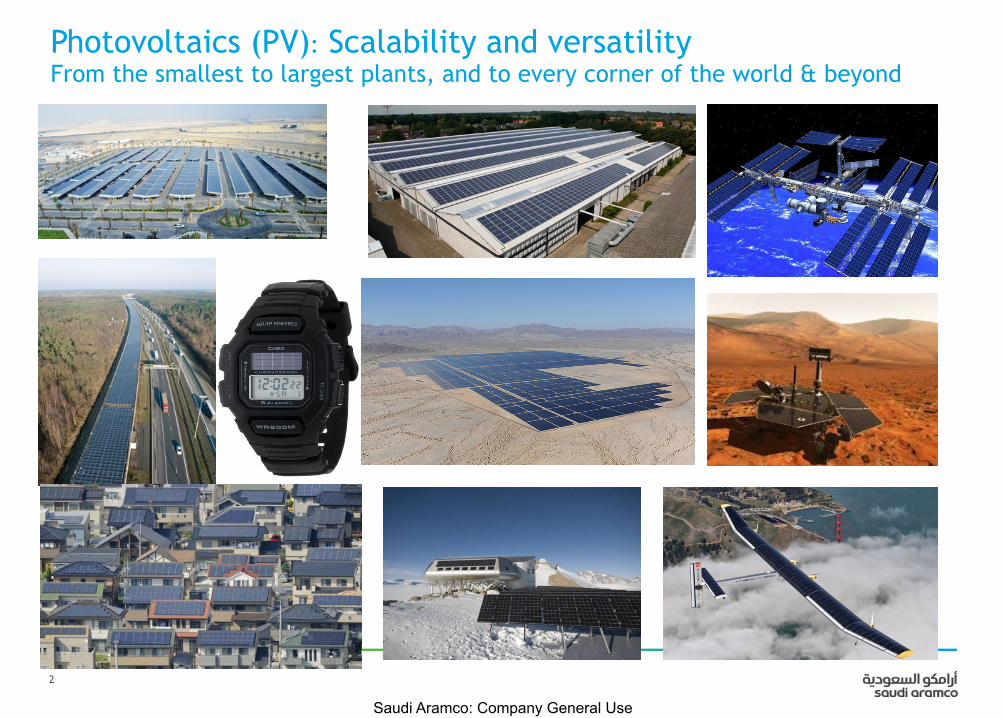
Photovoltaics (PV): Scalability and versatility From the smallest to largest plants, and to every corner of the world & beyond

3
Saudi Aramco: Company General Use
Global Installation Trends – GWp Net Additions by Tech
-50,000.00
0.00
50,000.00
100,000.00
150,000.00
200,000.00
250,000.00
2001
2002
2003
2004
2005
2006
2007
2008
2009
2010
2011
2012
2013
Marine
Geothermal
Biomass & Waste
Solar
Wind
Hydro
Gas
Coal
Oil
Nuclear
Data source: BNEF 2015, subscriber database

4
Saudi Aramco: Company General Use
Global Installation Trends – RE now the majority
0% 10% 20% 30% 40% 50% 60% 70% 80% 90%
100% 20
01
2002
2003
2004
2005
2006
2007
2008
2009
2010
2011
2012
2013
NB: Nuclear and Oil excluded as they were negative from 2009-2013
Coal Gas Hydro Wind Solar Biomass & Waste Geothermal Marine
Source: BNEF 2015, subscriber database

5
Saudi Aramco: Company General Use
Global Installation Trends – Solar’s share growing
0%
10%
20%
30%
40%
50%
60%
70%
80%
90%
100%
2001
2002
2003
2004
2005
2006
2007
2008
2009
2010
2011
2012
2013
2014
2015
2016
% of Total Renewable Energy Capacity Additions by Technology Data Source: BNEF 2015
Marine
Geothermal
Biomass & Waste
Solar
Wind
Hydro
Data source: BNEF 2015, subscriber database

6
Saudi Aramco: Company General Use
Solar Cell Price Decline in Perspective
• Importance of up to date market intelligence.
99% Cost reduction since 1976
-85% since 2008

7
Saudi Aramco: Company General Use
Evolution of Wind and PV LCOE

8
Saudi Aramco: Company General Use
LCOE (Levelized Cost of Energy) Comparison Unsubsidized cost of energy comparison ($/MWh)
Source : Lazard's Levelized Cost of Energy Analysis—Version 9.0 (2015)
DEWA PV PPA = $0.0584/kWh Jordan PV PPAs = $0.061-0.077/kWh
Egyptian Wind PPA ~ $0.04/kWh – 2015 Moroccan Wind PPA ~$0.031/kWh - 2016

9
Saudi Aramco: Company General Use
Costs (and capacity) – What was previously seen as overly optimistic now seems prescient or even conservative
2009
Installed capacity at end-2014 = +180GW
Utility PV cost:
PPA awarded for $0.0584/kWh by DEWA in early 2015
for 2016/7 first power
Other utility PPAs from $0.061-0.085 globally

10
Saudi Aramco: Company General Use
! Industrial goods follow learning curve
! Doubling of cumulative capacity " X % cost reduction
! PV cost reduction X > 20%
! Price often used as proxy for cost
! PV module cost reduction since 1990 > 90% since 1976 > 99%!
Module Learning Curve
Excessive margin period (price distortion)
Source: Graph from IEA, current price from variety of market sources and discussions
2015 prices

11
Saudi Aramco: Company General Use
Predictions – not all estimates are equal
Source: MIT ‘Future of Solar’ study. 2015

12
Saudi Aramco: Company General Use
PV & Wind – leading growth in the energy sector
Source: New energy outlook 2015, Bloomberg New Energy Finance Note: ‘Other Renewables’ = hydro, geothermal, biomass, solar thermal, marine and ‘flexible capacity’ (storage, demand response, etc.) Note: Solar Thermal (CSP) remains less than 1% of installed capacity by 2040 Note: Energy from solar + wind in this forecast = 30% of global total
2012 Fossil Fuel
Nuclear
Other Renewables
Wind
Solar PV
2040
Technology 2012 GW 2040 GW Growth Solar PV 101 3,687 36.5 X
Wind 282 2,033 7.2 X
Other Renewables 1,235 2,572 2.1 X
Coal 1,800 2,310 1.3 X
Nat Gas 1,472 2,448 1.7 X
Oil 359 320 0.9 X
Nuclear 336 533 1.6 X

13
Saudi Aramco: Company General Use
Predictions within top clean-tech analysts also vary (2020 annual installs – 135GW or 80GW?)
Data source: BNEF 2015 New Energy Outlook Data source: GTM 2020 Outlook

14
Saudi Aramco: Company General Use
0
1,000
2,000
3,000
4,000
5,000
6,000
7,000
8,000
2010 2015 2020 2025 2030 2035 2040 2045 2050
GW
cum
mul
ativ
e in
stal
lati
on
Year
BNEF
Agora low
Agora high
IEA (hi-Ren Scenario)
UBSe
Forecasts of Global Installed PV Capacity

15
Saudi Aramco: Company General Use
Cost Reduction Drivers
• Modules
- Efficiency
- Cheaper material
- Less material
- Optimized production
- (Disruptive technology)
• Inverter
- Power Electronics
- Mass production
- Dematerialization
• BOS
- Standardization
- Optimization
- Functional integration
• Installation
- Automation
- Pre-assembly
- Optimization
• Energy
- Higher specific yield
• Financing
- Bankability
- Relative WACC
• O&M
- Automation
- Remote sensing

16
Saudi Aramco: Company General Use
Efficiency is on the Rise - Examples
• Top 10 manufacturer.
• Multi-crystalline Silicon
! Top thin film manufacturer.
! CdTe
11.6%
2011
15.6%**
2015
15.9%*
2011
19.1%*
2015
* Best module, ** best production line (average Q1 2015 at 14.6%)

17
Saudi Aramco: Company General Use
Efficiency Drives Cost Down Beyond Module
• Increased module efficiency :
" Less Material (to build module)
" Less land
" Less civil works
" Less racking
" Shorter cabling
" Less work
Source data: ITRPV and BNEF
18% 15%
8% 10%
32% 26%
12%
12%
8%
7%
16%
13%
7%
6%
0%
10%
20%
30%
40%
50%
60%
70%
80%
90%
100%
current (15%) next (18%)
Effect of cell efficiency increase
Ground
Mounting
Wiring
Inverter
Module assembly
Cell conversion
Wafer
-11%
Efficiency increase largely justifies a higher cell cost. Example: Cell cost +25% à System cost -11%

18
Saudi Aramco: Company General Use
Efficiency is on the Rise: Expansions have higher efficiency 2011 market ≈30GW * 50% " 15 GW
2015 market ≈50GW * 30% " 15 GW
# (Entire) 20GW growth from advanced concepts!
Source: GTM Research

19
Saudi Aramco: Company General Use
Efficiency far from Limit
• Thermodynamic limit ≈95%
• Practical limits
- Single junction (Shockley-Queisser limit) ≈32%
- Multi junction limited only by technical feasibility
• 46% achieved!
Source: NREL
Source: Royal Society
! Myth: “Efficiency is topping out”
! Myth cherry-picks period and technology
! Reality
! 2000-2010 focus on scale
! Since 2010 focus on cost " efficiency improvements.
! Technology shift

20
Saudi Aramco: Company General Use
8%
12%
0%
10%
20%
30%
40%
50%
60%
70%
80%
90%
100%
current (15%) 2050 (30%)
Ground
Mounting
Wiring
Inverter
Module assembly
Cell conversion
Wafer
Efficiency to move beyond 30%
• Effect of 30% commercial efficiency
- All else equal reduces cost by ≈1/3
• But, all other aspects will improve in parallel!
Source: Agora
-36%

21
Saudi Aramco: Company General Use
Inverter Learning Curve
• Similar price decline as for PV modules
• Increased power density (dematerialization)
• Road free to further >2/3 cost reduction
Source: Agora
1995 2005 2014
25kg/kW 10.5kg/kW 2.4kg/kW

22
Saudi Aramco: Company General Use
Balance of System Cost is Declining
• BOS cost can be improved considerably.
- Rail-less, automation, functional integration, pre-assembly, standardization, etc.
Source: Agora

23
Saudi Aramco: Company General Use
Expect disruption
• Forecasts assume:
- No technology breakthrough
- Incremental improvements only
• “Disruptive” events likely in next 35 years
- 3RD Generation PV (i.e. Perovskites)
- Roll-to-roll coating
- Default building material (no more racking cost)
- Cheap storage " >4 time larger PV market potential (learning curve " ≈1/3 cost reduction)
- Fully automated installation
- Fully automated cleaning
- Commercial efficiencies beyond 30%
- …

24
Saudi Aramco: Company General Use
Thank you…
25
Saudi Aramco: Company General Use
• Bloomberg New Energy Finance:
- New Energy Outlook 2015
• Agora Energiewende ‘Current and Future Cost of Solar Photovoltaics’ (2015)
• Lazard’s Levelized Cost of Energy 9.0 (2015)
• MIT Energy Institute: Future of Solar Energy (2015)
• GTM Research Global PV Demand Outlook 2015-2020 (2015)
• US National Renewable Energy Lab – National Center for Photovoltaics
• IHS
• UBS Research
Key Sources: