global temperatures are increasing. what does that...
TRANSCRIPT
1
Global temperatures are increasing. What does that mean about precipitation?
A Module on Sustainability
Teacher Handbook
2
Table of Contents
Module Context and Background ................................................................................................................. 3
Lesson 1: The Water Cycle ............................................................................................................................ 6
Lesson 1: Classwork .................................................................................................................................... 15
Lesson 1: Homework ................................................................................................................................... 17
Lesson 2: Statistics ...................................................................................................................................... 19
Lesson 2: Classwork .................................................................................................................................... 23
Lesson 2: Homework ................................................................................................................................... 24
Lesson 3: Weather & Statistical Persistence ............................................................................................... 25
Lesson 3: Classwork .................................................................................................................................... 30
Lesson 3: Homework ................................................................................................................................... 31
Lesson 4: Introduction to Weather Generators .......................................................................................... 32
Lesson 4: Classwork .................................................................................................................................... 40
Lesson 4: Homework ................................................................................................................................... 41
Lesson 5: Natural Variability in Data ........................................................................................................... 42
Lesson 5: Classwork .................................................................................................................................... 46
Lesson 5: Homework ................................................................................................................................... 47
Lesson 6: Predicting the Future .................................................................................................................. 48
Lesson 6: Classwork & Homework .............................................................................................................. 51
Assessment ................................................................................................................................................. 53
Glossary ....................................................................................................................................................... 57

3
Module Context and Background About this module This module is written to be taught in roughly one week to one and one-half weeks of class time, and is separated into six lessons of approximately 55 minutes each. Lessons can be combined to accommodate a block schedule or lengthened to provide class time for homework assignments. Lessons are intended to be introductory enough to be accessible to 9th grade students with little to no data analysis experience, but have also shown useful for 11th/12th grade college-bound students. In what types of classes could this module be used? This module is suitable for students in Earth Science, Environmental Science, and Biology, and fits well as an application problem after learning the water cycle. The module is also suitable in statistics classes where the focus is on data analysis when summary statistics such as the mean and standard deviation are not the most appropriate summary statistics for the data set. Teachers may wish to reduce or eliminate either lesson one (introduction to the water cycle) or two (introduction to basic statistics) depending on students’ prior scientific or statistical experience. Prerequisite skills
Though it will be reviewed in the first lesson, students should understand the global water cycle and how it is powered.
Students should have a basic understanding of the uses of a spreadsheet program (such as Microsoft Excel or Google Spreadsheet) for data analysis, but skills using the spreadsheet are not necessary.
Required Materials
Standard six-sided dice (1 per student)
Computers with a MS Excel for lessons 3, 4 and 5. Other spreadsheet programs may work if they are macros-enabled.
The weather generator spreadsheet file, available for download in MS Excel format.
Method to watch online animations and videos as a class, such as a computer and projector. Optional Materials
Copies for students are available in two formats: o An entire Student Workbook that includes places for students to capture their notes and
thinking during class, as well as the homework worksheets. Students may use this as a reference as they work through the module.
o Individual handouts for each lesson. These worksheets are shorter and do not provide as much information or note-taking space as the student workbook. These may be provided as tools to provide structure during class and homework and may not be necessary for all classrooms.
Teachers use discretion in determining which format, if any, is needed for their group of students. Summary of Lessons Lesson 1: Students review the water cycle. Then, students work toward understanding the concept of
worldwide sustainability and how that relates to the water cycle. Students learn about our current unsustainable patterns of water use.
Lesson 2: Students learn simple statistics, including basic vs. conditional probability as well as practicing when to apply different mathematical routines based on the situation. Students then relate those concepts to weather.
4
Lesson 3: Students work to understand statistical persistence, create a flow chart for weather-based statistical persistence, and then use dice to simulate data.
Lesson 4: Students use a spreadsheet program to produce precipitation data. Students relate the computations the spreadsheet program performs to the dice lesson the day before. Students work to understand that typical summary statistics are inappropriate for this data set and determine appropriate and relevant methods to summarize the data.
Lesson 5: Students work to understand the difference between natural variability and variability that is the result of hidden, and possibly problematic, variables. Students use the weather generator again to examine and summarize variability that is natural.
Lesson 6: Students use the weather generator again to predict what the future holds. Using output from NCAR models to seed their own weather generator models, students examine data and work to determine how future weather patterns might be different from current patterns. Finally, the module ends with students acknowledging the merits and limitations of model-building.
Next Generation Science Standards addressed:
HS-ESS2-b. - Construct an evidence-based argument about how a natural or human-caused change to one part of
an Earth system can create feedback that causes changes in that system or other systems. HS-ESS2-f. - Read scientific literature critically to evaluate and communicate the causes and effects of climate
change over 10s-100s of years, 10s-100s of thousands of years, and 10s-100s of millions of years. HS-ESS2-l. - Apply scientific reasoning, theory, and models to support the claim that dynamic causes, effects, and
feedbacks among Earth’s systems result in continual coevolution of Earth and the life that exists on it.
Common Core Math Standards addressed: CCSS.Math.Content.HSS-ID.A.3 - Interpret differences in shape, center, and spread in the context of the data sets, accounting for
possible effects of extreme data points (outliers). CCSS.Math.Content.HSS-IC.A.1 - Understand statistics as a process for making inferences about population parameters based on a
random sample from that population. CCSS.Math.Content.HSS-IC.A.2 - Decide if a specified model is consistent with results from a given data-generating process, e.g.,
using simulation. CCSS.Math.Content.HSS-CP.A.3 - Understand the conditional probability of A given B as P(A and B)/P(B), and interpret independence
of A and B as saying that the conditional probability of A given B is the same as the probability of A, and the conditional probability of B given A is the same as the probability of B.
CCSS.Math.Content.HSS-CP.A.4 - Construct and interpret two-way frequency tables of data when two categories are associated with
each object being classified. Use the two-way table as a sample space to decide if events are independent and to approximate conditional probabilities.
5
Common Core English Standards addressed: CCSS.ELA-Literacy.RST.9-10.2 - Determine the central ideas or conclusions of a text; trace the text’s explanation or depiction of a
complex process, phenomenon, or concept; provide an accurate summary of the text. CCSS.ELA-Literacy.RST.9-10.6 - Analyze the author’s purpose in providing an explanation, describing a procedure, or discussing an
experiment in a text, defining the question the author seeks to address. CCSS.ELA-Literacy.RI.9-10.10 - By the end of grade 9, read and comprehend literacy nonfiction in the grades 9-10 text complexity
band proficiently, with scaffolding as needed at the high end of the range. Note to the instructor: The underlying assumption to this module is that global temperatures are changing. This is a sensitive issue that may need to be addressed in your classroom before the beginning of this module. In my classroom I address this by pointing out to students that, indeed, temperatures are changing, and that this change is not a point of contention among scientists. The point of contention stems from the cause of that change: whether it is natural geologic variation or the result of human-induced carbon emissions. I work to impress upon students that we needn’t argue about the cause of temperature change in order to predict what the impacts of this change may include.

6
Lesson 1: The Water Cycle
Summary: Students review the water cycle. Then, students work toward understanding the concept of worldwide sustainability and how that relates to the water cycle. Students learn about our current unsustainable patterns of water use.
Objective 1: Introduce the module question. Then, review the water cycle and introduce the concept
that warmer air holds more water molecules. Objective 2: Develop a concept of sustainability as related to water use. Objective 3: Identify that the water cycle isn’t changing, but when and how water is falling is changing Homework: Read New York Times article, “Study Hints at Greater Threat of Extreme Weather” with written response.
Objective 1: Introduce the module question. Then, review the water cycle and introduce the concept that warmer air holds more water molecules. Just to introduce the unit, tell the students the question, “Global temperatures are rising. What does that mean about precipitation?” Allow them to develop and share their thoughts in whatever fashion works best for your classroom (think-pair-share, jigsaw, open conversation, small group work, etc.). There is space for students to record their thinking on the Lesson 1: Classwork handout. Science teachers likely have a copy of the water cycle in their textbook, and will want students to reference the image that has been used previously in the course. Science teachers may also wish to use an image without arrows or labels to review previously taught content with their students. Math teachers may wish to use the diagram on the following page. With an image of the water cycle on the classroom projector, ask students the following:
1) What are the three different states of water? How are all three states of water present on the planet at any given time? Solid – Ice, Liquid – Water, Gas – Steam or vapor. We can see all three present on the globe at any time as clouds and humidity represent gaseous water; streams, rivers, lakes & oceans represent liquid water; icecaps and glaciers represent solid water. Different environments on earth support each of the three states.
2) Does the water cycle have a beginning or an end? No.
3) Do all water molecules follow the same path? Explain. No. Some water molecules might evaporate from streams directly into the atmosphere; other water molecules might be taken up by plants, and then transpired to the atmosphere. There are many paths. As an activity for students, ask them to follow the possible paths of water molecules that are in various places: a molecule of water that has been ingested; a molecule in a polar ice cap; a molecule in a cloud; a molecule in a lake, etc.

7
4) What powers the water cycle? Explain. The sun powers the water cycle. The sun provides the heat energy needed to melt ice into water
and evaporate water into vapor. 5) Where in this cycle is water created? Destroyed? Nowhere. Water is not created or destroyed in the water cycle. The amount of water we have on
the planet isn’t changing.

8
Source: http://www.exploringnature.org/db/detail.php?dbID=27&detID=1188 9/22/2012
A similar water cycle image : http://water.usgs.gov/edu/watercycle.html 9/20/2104
9
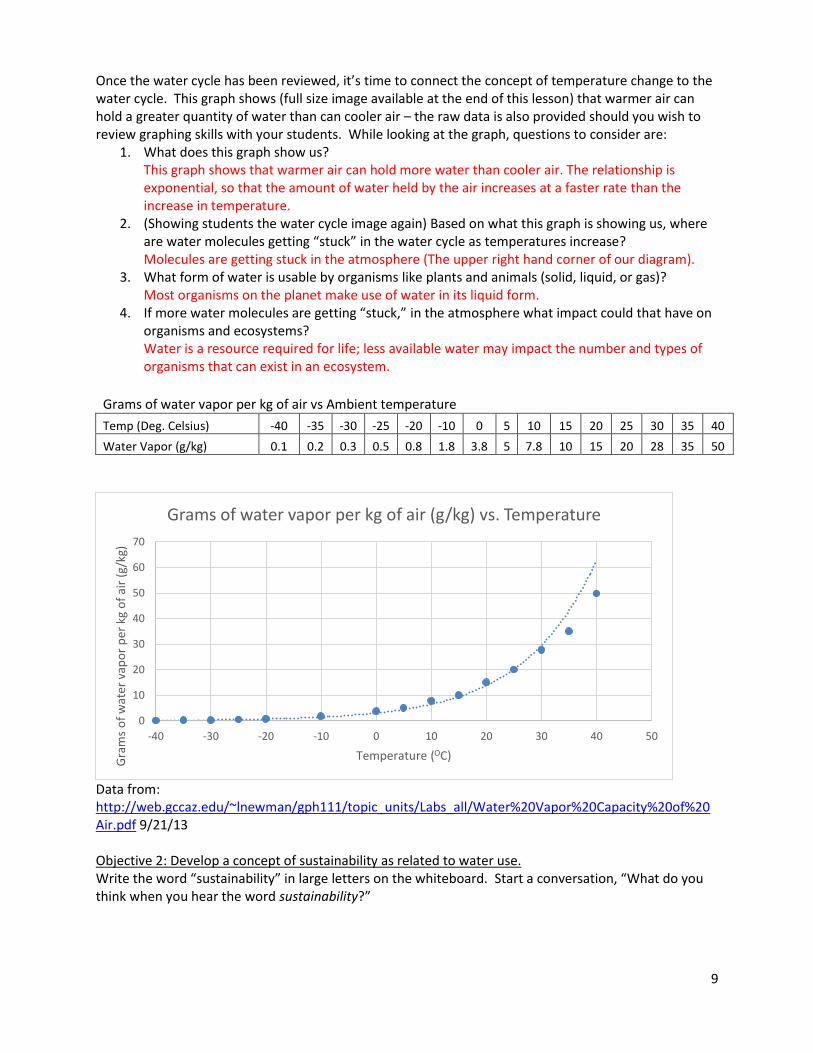
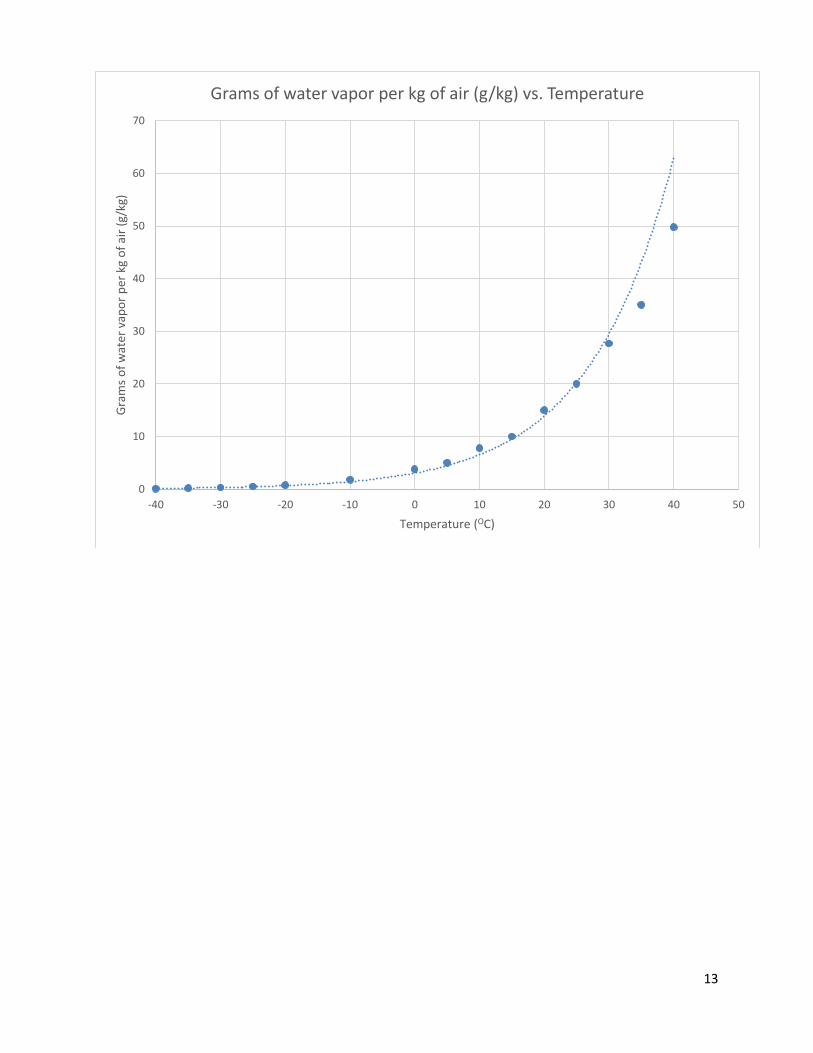
Once the water cycle has been reviewed, it’s time to connect the concept of temperature change to the water cycle. This graph shows (full size image available at the end of this lesson) that warmer air can hold a greater quantity of water than can cooler air – the raw data is also provided should you wish to review graphing skills with your students. While looking at the graph, questions to consider are:
1. What does this graph show us? This graph shows that warmer air can hold more water than cooler air. The relationship is exponential, so that the amount of water held by the air increases at a faster rate than the increase in temperature.
2. (Showing students the water cycle image again) Based on what this graph is showing us, where are water molecules getting “stuck” in the water cycle as temperatures increase? Molecules are getting stuck in the atmosphere (The upper right hand corner of our diagram).
3. What form of water is usable by organisms like plants and animals (solid, liquid, or gas)? Most organisms on the planet make use of water in its liquid form.
4. If more water molecules are getting “stuck,” in the atmosphere what impact could that have on organisms and ecosystems? Water is a resource required for life; less available water may impact the number and types of organisms that can exist in an ecosystem.
Grams of water vapor per kg of air vs Ambient temperature Temp (Deg. Celsius) -40 -35 -30 -25 -20 -10 0 5 10 15 20 25 30 35 40
Water Vapor (g/kg) 0.1 0.2 0.3 0.5 0.8 1.8 3.8 5 7.8 10 15 20 28 35 50
Data from: http://web.gccaz.edu/~lnewman/gph111/topic_units/Labs_all/Water%20Vapor%20Capacity%20of%20Air.pdf 9/21/13 Objective 2: Develop a concept of sustainability as related to water use. Write the word “sustainability” in large letters on the whiteboard. Start a conversation, “What do you think when you hear the word sustainability?”
0
10
20
30
40
50
60
70
-40 -30 -20 -10 0 10 20 30 40 50
Gra
ms
of
wat
er v
apo
r p
er k
g o
f ai
r (g
/kg)
Temperature (OC)
Grams of water vapor per kg of air (g/kg) vs. Temperature

10
Teachers will likely find that students harbor a misconception of sustainability: believing that if humans stop polluting then all things become sustainable. Student responses will probably include: recycling, driving less, and not polluting. If students aren’t forthcoming at first, you can press the discussion by providing them with general definitions of the term: “able to last or continue for a long time” or “able to be used without being completely used up or destroyed” (Merriam-Webster). Ask students to put these general definitions in the context of environmental science. Show students a copy of the EPA’s definition of sustainability (also on Lesson 1: Classwork page):
From: http://www.epa.gov/sustainability/basicinfo.htm 9/22/2012 Work with students to tease apart the finer details of this definition, which may require more or less support depending on their age and experience. Examples of questions include:
What do we need for our survival and well-being? o Food, water, shelter, space are absolutely required. Beyond those things, we need
clothes, transportation, housewares, entertainment, social interaction, etc.
What resources depend directly on our natural environment? o Food, water and most fuels depend on our natural environment directly.
What resources depend indirectly on our natural environment? o Manufactured good depend indirectly on our natural environment.
What is “productive harmony?” o A state of being where all individuals and organisms can coexist in a productive manner
without the interference of the other. Once an understanding of sustainability has been developed in this context, ask students to link the water cycle and the definition of sustainability:
Point out to students that “water” is included in the EPA definition. Ask students to brainstorm what they use water for on a daily basis.
Encourage students to consider their indirect water needs.
Have students give a specific number of how many gallons of water they believe they use every day.
o Once students have given specific amount of water used in a day, reveal to them the estimate that every human uses 80-100 gallons of water per day. http://ga.water.usgs.gov/edu/qa-home-percapita.html has an excellent list of the water requirements for general household events. It is fun to have students keep track of how many times they flush the toilet in a day and have them do the math to calculate how much water they are using on a daily basis.
Then also remind students of your earlier determination that water exists in a cycle that doesn’t include creating or destroying water. Ask them this driving question, “If water exists in a cycle
11
that has no beginning and no end, why does the concept of sustainability include limitations of water availability?”
o This is a great place to do a “think-pair-share” activity with students as most of them will be able to generate some kind of response to this question if given the opportunity to articulate with a peer. During share-out, it is likely that students will provide an answer that involves water pollution rendering water “useless,” but will unlikely associate environmental changes to alterations of the water cycle. (There is space for this activity on the Lesson 1: Classwork handout)
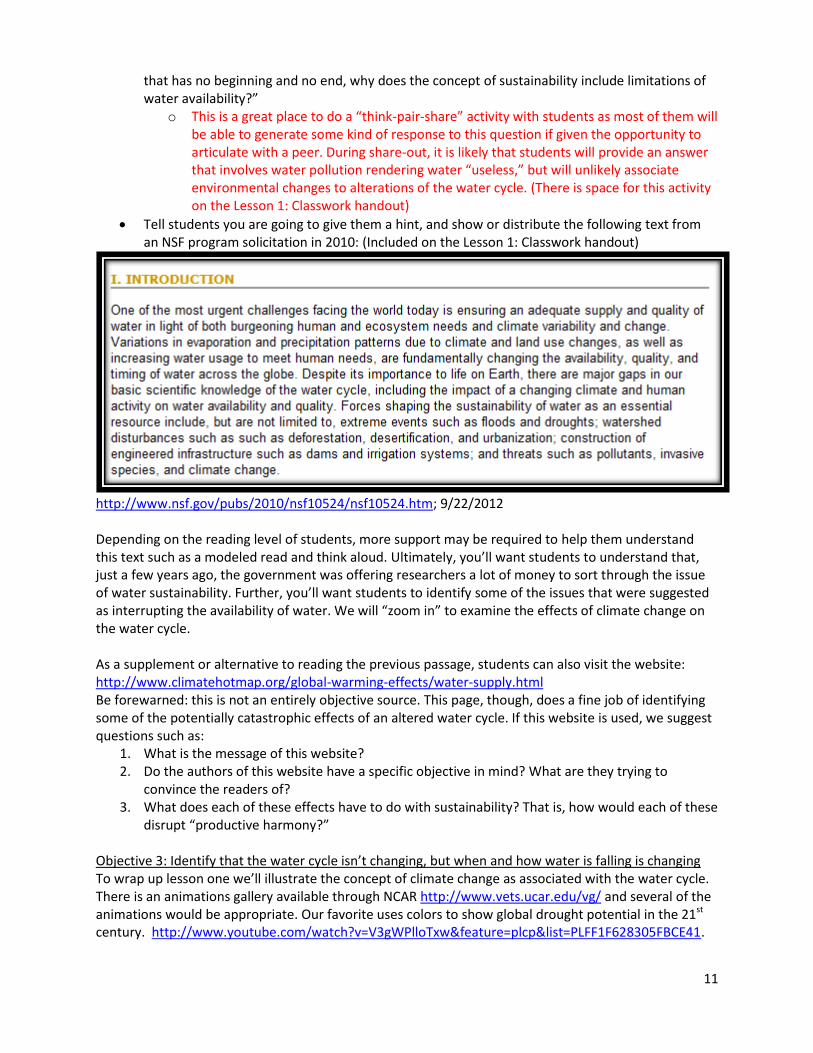
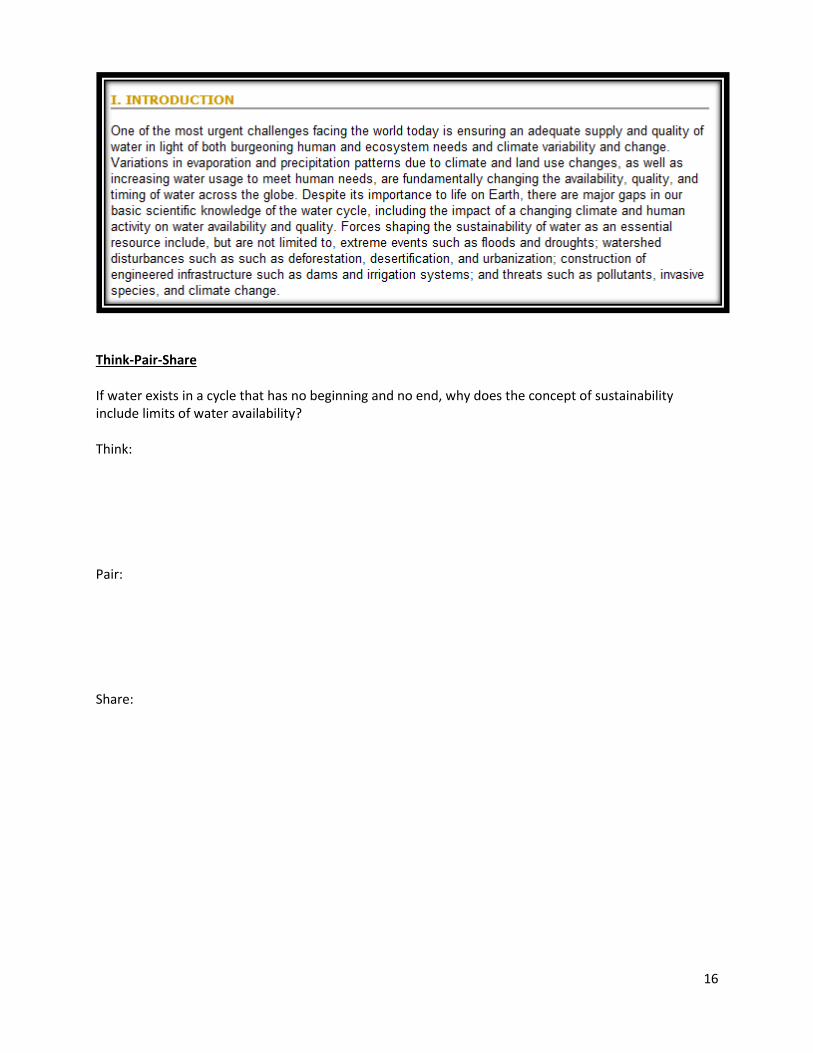
Tell students you are going to give them a hint, and show or distribute the following text from an NSF program solicitation in 2010: (Included on the Lesson 1: Classwork handout)
http://www.nsf.gov/pubs/2010/nsf10524/nsf10524.htm; 9/22/2012 Depending on the reading level of students, more support may be required to help them understand this text such as a modeled read and think aloud. Ultimately, you’ll want students to understand that, just a few years ago, the government was offering researchers a lot of money to sort through the issue of water sustainability. Further, you’ll want students to identify some of the issues that were suggested as interrupting the availability of water. We will “zoom in” to examine the effects of climate change on the water cycle. As a supplement or alternative to reading the previous passage, students can also visit the website: http://www.climatehotmap.org/global-warming-effects/water-supply.html Be forewarned: this is not an entirely objective source. This page, though, does a fine job of identifying some of the potentially catastrophic effects of an altered water cycle. If this website is used, we suggest questions such as:
1. What is the message of this website? 2. Do the authors of this website have a specific objective in mind? What are they trying to
convince the readers of? 3. What does each of these effects have to do with sustainability? That is, how would each of these
disrupt “productive harmony?” Objective 3: Identify that the water cycle isn’t changing, but when and how water is falling is changing To wrap up lesson one we’ll illustrate the concept of climate change as associated with the water cycle. There is an animations gallery available through NCAR http://www.vets.ucar.edu/vg/ and several of the animations would be appropriate. Our favorite uses colors to show global drought potential in the 21st century. http://www.youtube.com/watch?v=V3gWPlloTxw&feature=plcp&list=PLFF1F628305FBCE41.
12
You may need to watch the animations with your students several times to help them understand how the changing colors are associated with rainfall. I like to pause the animation intermittently to ask questions such as:
What do the changes in color mean? o The colors indicate the wetness or dryness of an area. Red indicates very dry locations
and purple represents very wet locations.
Does the whole globe get drier at the same time? o No. This can be seen by directing students to watch North America specifically. You’ll
see that as the continental United States gets progressively drier with time (more red), Alaska get progressively wetter with time (more purple).
Why do some areas actually get more blue (wetter) while some areas get drier? Can we explain this in terms of the water cycle?
o The number of molecules of water that exist on the planet won’t change, but those molecules do different things that we’re used to. For example, the rate of evaporation and transpiration might increase, but the rate of precipitation will decrease, resulting in more water molecules existing in our atmosphere rather than falling as rain.
What’s very important here is to help students avoid a misconception that we are losing water globally. Help them to understand that there are a constant number of water molecules on the planet and in our atmosphere, but where those molecules are going is changing. It is also important here to help students understand that too much water can be just as disastrous as not enough water. We hear frequently in the media about drought and its implications on water supply, but flooding is equally concerning. Plants require oxygen in their roots as much as they need carbon dioxide in their leaves, and overwatering starves the roots of that oxygen. Help students to understand that there is a window of appropriateness for water: enough to provide for the plant’s needs, but not so much as to drown it. Homework: Read the NYT Article “Study Hints at Greater Threat of Extreme Weather” and complete a written response. Other possible resources: Climate Change Visualization
http://www.vets.ucar.edu/vg/ Global Drought Potential.
http://www.youtube.com/watch?v=V3gWPlloTxw&feature=plcp&list=PLFF1F628305FBCE41. Alternative article for reading homework assignment:
http://www.climatecentral.org/news/climate-change-has-intensified-the-global-water-cycle/ Global Warming and the Water Cycle: A summary by National Oceanic and Atmospheric Administration
http://oceanexplorer.noaa.gov/edu/learning/7_water_cycle/activities/global_warming.html Background on Conditional Probability
http://www.epa.gov/caddis/da_exploratory_4.html
13
0
10
20
30
40
50
60
70
-40 -30 -20 -10 0 10 20 30 40 50
Gra
ms
of
wat
er v
apo
r p
er k
g o
f ai
r (g
/kg)
Temperature (OC)
Grams of water vapor per kg of air (g/kg) vs. Temperature

14
15
Name _______________________________________________ Date ________ Period ________ Weather Generators
Lesson 1: Classwork This unit’s driving question is: “Global Temperatures are rising. What does this mean about precipitation?” What thoughts do you have on this question before we begin? Do you think the two topics (temperature increase and precipitation) are completely unrelated? Do you think they are indirectly related but we won’t notice a difference? What initially comes to mind when you read this question? It’s okay if the answer is “not much.”
As we work through today’s lesson we will be working on the question, “What is sustainability?” Start with providing an answer for yourself, but feel free to add to your response as we discuss this as a class.
16
Think-Pair-Share If water exists in a cycle that has no beginning and no end, why does the concept of sustainability include limits of water availability? Think: Pair: Share:
17
Name _______________________________________________ Date ________ Period ________ Weather Generators
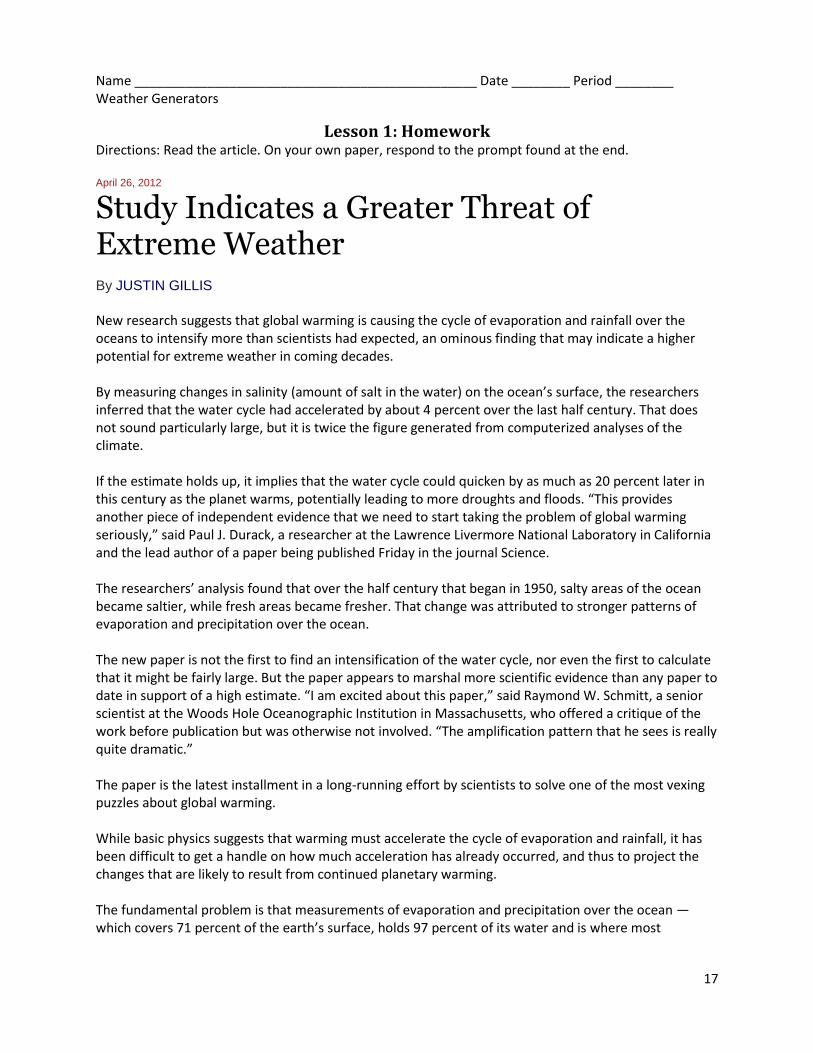
Lesson 1: Homework Directions: Read the article. On your own paper, respond to the prompt found at the end. April 26, 2012
Study Indicates a Greater Threat of Extreme Weather By JUSTIN GILLIS
New research suggests that global warming is causing the cycle of evaporation and rainfall over the oceans to intensify more than scientists had expected, an ominous finding that may indicate a higher potential for extreme weather in coming decades. By measuring changes in salinity (amount of salt in the water) on the ocean’s surface, the researchers inferred that the water cycle had accelerated by about 4 percent over the last half century. That does not sound particularly large, but it is twice the figure generated from computerized analyses of the climate. If the estimate holds up, it implies that the water cycle could quicken by as much as 20 percent later in this century as the planet warms, potentially leading to more droughts and floods. “This provides another piece of independent evidence that we need to start taking the problem of global warming seriously,” said Paul J. Durack, a researcher at the Lawrence Livermore National Laboratory in California and the lead author of a paper being published Friday in the journal Science. The researchers’ analysis found that over the half century that began in 1950, salty areas of the ocean became saltier, while fresh areas became fresher. That change was attributed to stronger patterns of evaporation and precipitation over the ocean. The new paper is not the first to find an intensification of the water cycle, nor even the first to calculate that it might be fairly large. But the paper appears to marshal more scientific evidence than any paper to date in support of a high estimate. “I am excited about this paper,” said Raymond W. Schmitt, a senior scientist at the Woods Hole Oceanographic Institution in Massachusetts, who offered a critique of the work before publication but was otherwise not involved. “The amplification pattern that he sees is really quite dramatic.” The paper is the latest installment in a long-running effort by scientists to solve one of the most vexing puzzles about global warming. While basic physics suggests that warming must accelerate the cycle of evaporation and rainfall, it has been difficult to get a handle on how much acceleration has already occurred, and thus to project the changes that are likely to result from continued planetary warming. The fundamental problem is that measurements of evaporation and precipitation over the ocean — which covers 71 percent of the earth’s surface, holds 97 percent of its water and is where most
18
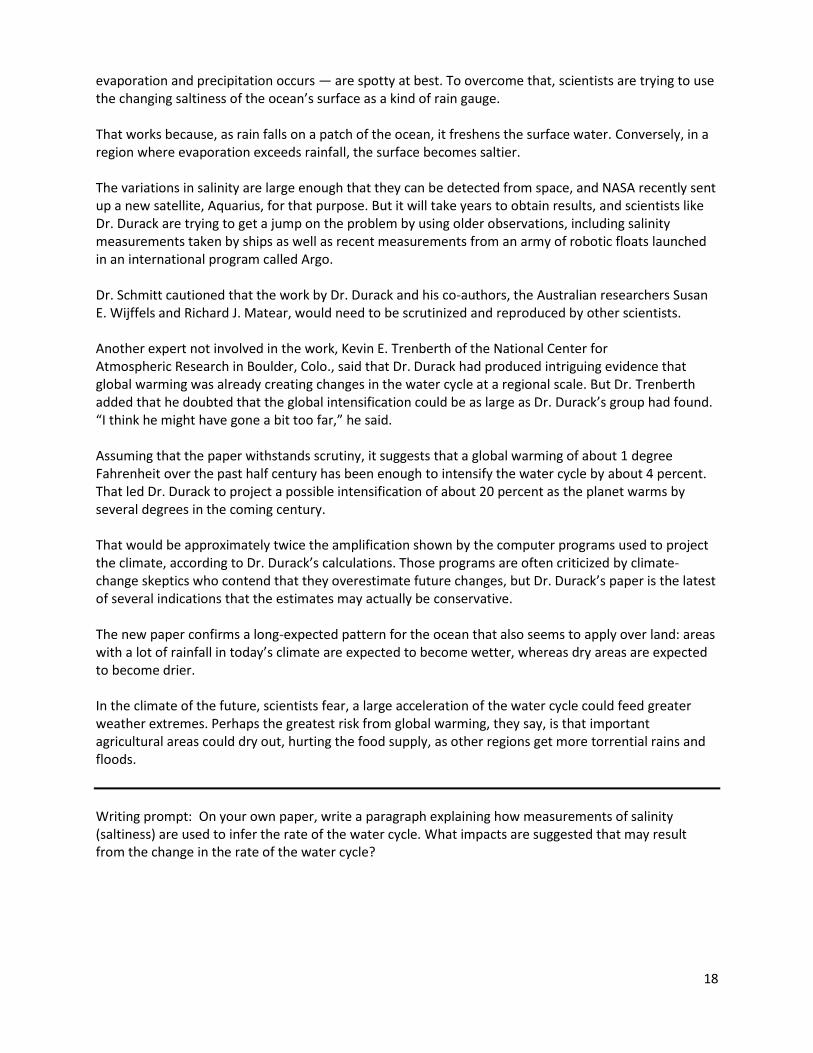
evaporation and precipitation occurs — are spotty at best. To overcome that, scientists are trying to use the changing saltiness of the ocean’s surface as a kind of rain gauge. That works because, as rain falls on a patch of the ocean, it freshens the surface water. Conversely, in a region where evaporation exceeds rainfall, the surface becomes saltier. The variations in salinity are large enough that they can be detected from space, and NASA recently sent up a new satellite, Aquarius, for that purpose. But it will take years to obtain results, and scientists like Dr. Durack are trying to get a jump on the problem by using older observations, including salinity measurements taken by ships as well as recent measurements from an army of robotic floats launched in an international program called Argo. Dr. Schmitt cautioned that the work by Dr. Durack and his co-authors, the Australian researchers Susan E. Wijffels and Richard J. Matear, would need to be scrutinized and reproduced by other scientists. Another expert not involved in the work, Kevin E. Trenberth of the National Center for Atmospheric Research in Boulder, Colo., said that Dr. Durack had produced intriguing evidence that global warming was already creating changes in the water cycle at a regional scale. But Dr. Trenberth added that he doubted that the global intensification could be as large as Dr. Durack’s group had found. “I think he might have gone a bit too far,” he said. Assuming that the paper withstands scrutiny, it suggests that a global warming of about 1 degree Fahrenheit over the past half century has been enough to intensify the water cycle by about 4 percent. That led Dr. Durack to project a possible intensification of about 20 percent as the planet warms by several degrees in the coming century. That would be approximately twice the amplification shown by the computer programs used to project the climate, according to Dr. Durack’s calculations. Those programs are often criticized by climate-change skeptics who contend that they overestimate future changes, but Dr. Durack’s paper is the latest of several indications that the estimates may actually be conservative. The new paper confirms a long-expected pattern for the ocean that also seems to apply over land: areas with a lot of rainfall in today’s climate are expected to become wetter, whereas dry areas are expected to become drier. In the climate of the future, scientists fear, a large acceleration of the water cycle could feed greater weather extremes. Perhaps the greatest risk from global warming, they say, is that important agricultural areas could dry out, hurting the food supply, as other regions get more torrential rains and floods.
Writing prompt: On your own paper, write a paragraph explaining how measurements of salinity (saltiness) are used to infer the rate of the water cycle. What impacts are suggested that may result from the change in the rate of the water cycle?
19
Lesson 2: Statistics
Summary: Students learn simple statistics, including basic vs. conditional probability as well as practicing when to apply different mathematical routines based on the situation. Students then relate those concepts to weather.
Objective 1: Students learn methods of basic probability. Objective 2: Students learn methods of conditional probability. Objective 3: Students learn what it means for data points to be independent. Homework: Practice calculating simple probabilities, conditional probabilities and discerning between
the appropriate situations to do each.
Homework Review: Check with students to confirm their understanding of a few key concepts from the article. Consider having students share their written response with a partner in order to refresh their memories from the previous lesson. The major points to recall are:
The water cycle is not changing.
The water cycle may be accelerating as a result of increased temperatures. This is because warmer air holds more water molecules than cooler air.
Acceleration of the water cycle has ramifications for our lives that may result in unsustainable water needs on a global scale.
Remind students that it is our ultimate objective to predict the future. In order to predict the future we need to understand and analyze the data from the past. Analyzing data involves doing statistics. So before we move forward we need to learn some basic statistical terms and calculations.
Objective 1: Students learn methods of basic probability. To first connect today’s work with probability to yesterday’s work with weather, ask students, “Why are we so bad at predicting the weather?” and “Weather forecasts usually associate a percentage with predictions of rain or snow. Why don’t they know what’s going to happen?” These questions are rather rhetorical in nature. The objective is for students to recognize that probability and statistics are involved in weather forecasting from day-to-day. So, in this module, we are trying to predict weather patterns many years in the future when, in fact, we usually can’t definitively predict the weather from one day to the next. However, any work we do is based on statistics and probabilities. In order to move forward we must teach/review some basic concepts of probability. Ask Students, “When you flip a coin, what is the chance it will come up heads?” Students will most likely tell you 50/50. At this point it’s a good idea to make sure they understand what
that statement means. Extract from students the idea that 50/50 means ½ the time it will come up heads, ½ the time it will not.
Provide students with the background math associated with this statement:
𝑁𝑢𝑚𝑏𝑒𝑟 𝑜𝑓 𝑠𝑢𝑐𝑐𝑒𝑠𝑠𝑓𝑢𝑙 𝑜𝑢𝑡𝑐𝑜𝑚𝑒𝑠
𝑁𝑢𝑚𝑏𝑒𝑟 𝑜𝑓 𝑝𝑜𝑠𝑠𝑖𝑏𝑙𝑒 𝑜𝑢𝑡𝑐𝑜𝑚𝑒𝑠 =
1 𝑠𝑖𝑑𝑒 𝑜𝑓 𝑡ℎ𝑒 𝑐𝑜𝑖𝑛 𝑖𝑠 ℎ𝑒𝑎𝑑𝑠
𝑇ℎ𝑒𝑟𝑒 𝑎𝑟𝑒 2 𝑠𝑖𝑑𝑒𝑠 𝑜𝑓 𝑡ℎ𝑒 𝑐𝑜𝑖𝑛 =
1
2

20
Provide another example: A standard deck of cards has 52 cards, with 13 of each of 4 suits. What are the chances of pulling one card from the deck that is a spade? Students will probably tell you that the chances are ¼ or 25%. Again, make sure they understand the background math.
𝑁𝑢𝑚𝑏𝑒𝑟 𝑜𝑓 𝑠𝑢𝑐𝑐𝑒𝑠𝑠𝑓𝑢𝑙 𝑜𝑢𝑡𝑐𝑜𝑚𝑒𝑠
𝑁𝑢𝑚𝑏𝑒𝑟 𝑜𝑓 𝑝𝑜𝑠𝑠𝑖𝑏𝑙𝑒 𝑜𝑢𝑡𝑐𝑜𝑚𝑒𝑠 =
𝑇ℎ𝑒𝑟𝑒 𝑎𝑟𝑒 13 𝑠𝑝𝑎𝑑𝑒𝑠
𝑇ℎ𝑒𝑟𝑒 𝑎𝑟𝑒 52 𝑐𝑎𝑟𝑑𝑠 𝑖𝑛 𝑡ℎ𝑒 𝑑𝑒𝑐𝑘 =
13
52 =
1
4
Ask students to practice (These problems are listed on the Classwork handout that may be distributed): 1. Using a standard deck of 52 cards (no jokers), what are the chances you will draw a 5 from the deck?
𝑁𝑢𝑚𝑏𝑒𝑟 𝑜𝑓 𝑠𝑢𝑐𝑐𝑒𝑠𝑠𝑓𝑢𝑙 𝑜𝑢𝑡𝑐𝑜𝑚𝑒𝑠
𝑁𝑢𝑚𝑏𝑒𝑟 𝑜𝑓 𝑝𝑜𝑠𝑠𝑖𝑏𝑙𝑒 𝑜𝑢𝑡𝑐𝑜𝑚𝑒𝑠 =
𝑇ℎ𝑒𝑟𝑒 𝑎𝑟𝑒 4 𝑓𝑖𝑣𝑒𝑠 𝑖𝑛 𝑡ℎ𝑒 𝑑𝑒𝑐𝑘.
𝑇ℎ𝑒𝑟𝑒 𝑎𝑟𝑒 52 𝑐𝑎𝑟𝑑𝑠 𝑖𝑛 𝑡ℎ𝑒 𝑑𝑒𝑐𝑘 =
4
52 =
1
13
2. What are the chances of rolling a two on a common, six-sided die?
𝑁𝑢𝑚𝑏𝑒𝑟 𝑜𝑓 𝑠𝑢𝑐𝑐𝑒𝑠𝑠𝑓𝑢𝑙 𝑜𝑢𝑡𝑐𝑜𝑚𝑒𝑠
𝑁𝑢𝑚𝑏𝑒𝑟 𝑜𝑓 𝑝𝑜𝑠𝑠𝑖𝑏𝑙𝑒 𝑜𝑢𝑡𝑐𝑜𝑚𝑒𝑠 =
𝑇ℎ𝑒𝑟𝑒 𝑖𝑠 1 𝑡𝑤𝑜
𝑇ℎ𝑒𝑟𝑒 𝑎𝑟𝑒 6 𝑠𝑖𝑑𝑒𝑠 𝑜𝑛 𝑡ℎ𝑒 𝑑𝑖𝑒 =
1
6
3. Are the chances of rolling each number on the die the same?
Yes, unless it has been tampered with. 4. What are the chances of rolling an even number on a common, six-sided die?
𝑁𝑢𝑚𝑏𝑒𝑟 𝑜𝑓 𝑠𝑢𝑐𝑐𝑒𝑠𝑠𝑓𝑢𝑙 𝑜𝑢𝑡𝑐𝑜𝑚𝑒𝑠
𝑁𝑢𝑚𝑏𝑒𝑟 𝑜𝑓 𝑝𝑜𝑠𝑠𝑖𝑏𝑙𝑒 𝑜𝑢𝑡𝑐𝑜𝑚𝑒𝑠 =
𝑇ℎ𝑒𝑟𝑒 𝑎𝑟𝑒 3 𝑒𝑣𝑒𝑛 𝑛𝑢𝑚𝑏𝑒𝑟𝑠: 2,4,𝑎𝑛𝑑 6
𝑇ℎ𝑒𝑟𝑒 𝑎𝑟𝑒 6 𝑠𝑖𝑑𝑒𝑠 𝑜𝑛 𝑡ℎ𝑒 𝑑𝑖𝑒 =
3
6 =
1
2
“We are going to do a mini-experiment. Everyone roll their die 6 times and write down the numbers you
roll each time.” If you have chosen to make copies of this lessons classwork handout, the data table is provided for students to record their data.
“So, the chance of rolling each number is 1 of 6. We all just rolled our die six times, so we all got each number once, right? No? Why not? Are the dice broken? Are our calculations incorrect?” Students will know intuitively that they won’t all roll each number one time. However, highlighting the difference between predicted probability and results is useful. We predict that we will get each number 1/6 of the times we roll the die. But since each roll is independent of all the other rolls, the results don’t align with the predictions exactly. Point out to students that it is this difference – between predictions and results – that makes it so critical that statisticians use large sample sizes. For example, if we were to roll the die 600 times, we would have pretty close to 100 of each number, but not exactly. The more times we roll the die, or the larger our sample is, the closer to the predicted results we should get. This will be important when we start predicting weather next class period. Objective 2: Students learn methods of conditional probability. “So far all of the probabilities we’ve used have been based on things that are random. Let’s shift gears and consider situations that are a little more complicated.”
21
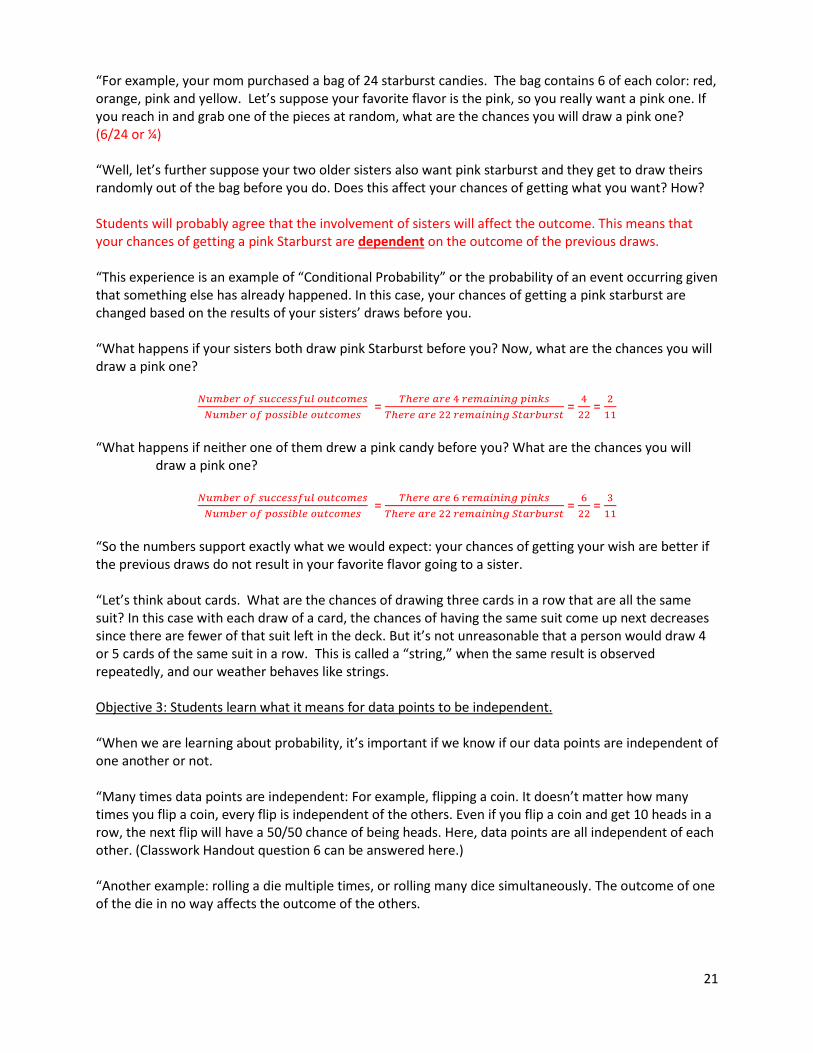
“For example, your mom purchased a bag of 24 starburst candies. The bag contains 6 of each color: red, orange, pink and yellow. Let’s suppose your favorite flavor is the pink, so you really want a pink one. If you reach in and grab one of the pieces at random, what are the chances you will draw a pink one? (6/24 or ¼) “Well, let’s further suppose your two older sisters also want pink starburst and they get to draw theirs randomly out of the bag before you do. Does this affect your chances of getting what you want? How? Students will probably agree that the involvement of sisters will affect the outcome. This means that your chances of getting a pink Starburst are dependent on the outcome of the previous draws. “This experience is an example of “Conditional Probability” or the probability of an event occurring given that something else has already happened. In this case, your chances of getting a pink starburst are changed based on the results of your sisters’ draws before you. “What happens if your sisters both draw pink Starburst before you? Now, what are the chances you will draw a pink one?
𝑁𝑢𝑚𝑏𝑒𝑟 𝑜𝑓 𝑠𝑢𝑐𝑐𝑒𝑠𝑠𝑓𝑢𝑙 𝑜𝑢𝑡𝑐𝑜𝑚𝑒𝑠
𝑁𝑢𝑚𝑏𝑒𝑟 𝑜𝑓 𝑝𝑜𝑠𝑠𝑖𝑏𝑙𝑒 𝑜𝑢𝑡𝑐𝑜𝑚𝑒𝑠 =
𝑇ℎ𝑒𝑟𝑒 𝑎𝑟𝑒 4 𝑟𝑒𝑚𝑎𝑖𝑛𝑖𝑛𝑔 𝑝𝑖𝑛𝑘𝑠
𝑇ℎ𝑒𝑟𝑒 𝑎𝑟𝑒 22 𝑟𝑒𝑚𝑎𝑖𝑛𝑖𝑛𝑔 𝑆𝑡𝑎𝑟𝑏𝑢𝑟𝑠𝑡 =
4
22 =
2
11
“What happens if neither one of them drew a pink candy before you? What are the chances you will
draw a pink one?
𝑁𝑢𝑚𝑏𝑒𝑟 𝑜𝑓 𝑠𝑢𝑐𝑐𝑒𝑠𝑠𝑓𝑢𝑙 𝑜𝑢𝑡𝑐𝑜𝑚𝑒𝑠
𝑁𝑢𝑚𝑏𝑒𝑟 𝑜𝑓 𝑝𝑜𝑠𝑠𝑖𝑏𝑙𝑒 𝑜𝑢𝑡𝑐𝑜𝑚𝑒𝑠 =
𝑇ℎ𝑒𝑟𝑒 𝑎𝑟𝑒 6 𝑟𝑒𝑚𝑎𝑖𝑛𝑖𝑛𝑔 𝑝𝑖𝑛𝑘𝑠
𝑇ℎ𝑒𝑟𝑒 𝑎𝑟𝑒 22 𝑟𝑒𝑚𝑎𝑖𝑛𝑖𝑛𝑔 𝑆𝑡𝑎𝑟𝑏𝑢𝑟𝑠𝑡 =
6
22 =
3
11
“So the numbers support exactly what we would expect: your chances of getting your wish are better if the previous draws do not result in your favorite flavor going to a sister. “Let’s think about cards. What are the chances of drawing three cards in a row that are all the same suit? In this case with each draw of a card, the chances of having the same suit come up next decreases since there are fewer of that suit left in the deck. But it’s not unreasonable that a person would draw 4 or 5 cards of the same suit in a row. This is called a “string,” when the same result is observed repeatedly, and our weather behaves like strings. Objective 3: Students learn what it means for data points to be independent. “When we are learning about probability, it’s important if we know if our data points are independent of one another or not. “Many times data points are independent: For example, flipping a coin. It doesn’t matter how many times you flip a coin, every flip is independent of the others. Even if you flip a coin and get 10 heads in a row, the next flip will have a 50/50 chance of being heads. Here, data points are all independent of each other. (Classwork Handout question 6 can be answered here.) “Another example: rolling a die multiple times, or rolling many dice simultaneously. The outcome of one of the die in no way affects the outcome of the others.
22
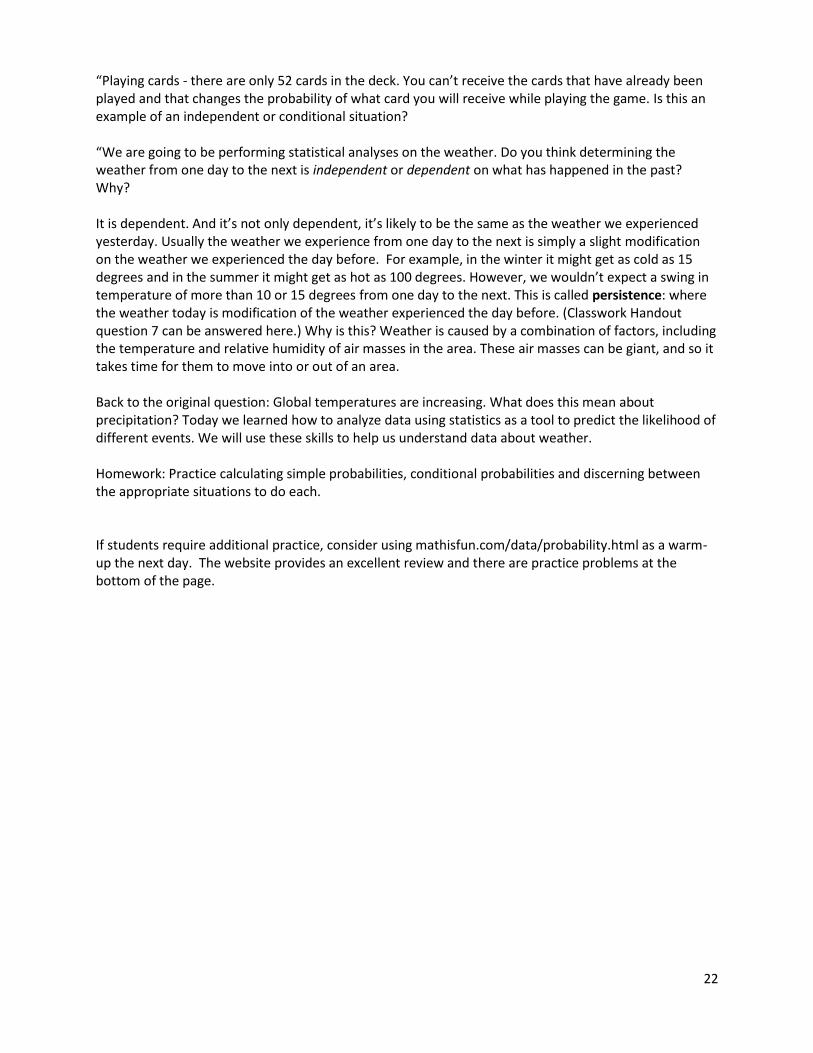
“Playing cards - there are only 52 cards in the deck. You can’t receive the cards that have already been played and that changes the probability of what card you will receive while playing the game. Is this an example of an independent or conditional situation? “We are going to be performing statistical analyses on the weather. Do you think determining the weather from one day to the next is independent or dependent on what has happened in the past? Why? It is dependent. And it’s not only dependent, it’s likely to be the same as the weather we experienced yesterday. Usually the weather we experience from one day to the next is simply a slight modification on the weather we experienced the day before. For example, in the winter it might get as cold as 15 degrees and in the summer it might get as hot as 100 degrees. However, we wouldn’t expect a swing in temperature of more than 10 or 15 degrees from one day to the next. This is called persistence: where the weather today is modification of the weather experienced the day before. (Classwork Handout question 7 can be answered here.) Why is this? Weather is caused by a combination of factors, including the temperature and relative humidity of air masses in the area. These air masses can be giant, and so it takes time for them to move into or out of an area. Back to the original question: Global temperatures are increasing. What does this mean about precipitation? Today we learned how to analyze data using statistics as a tool to predict the likelihood of different events. We will use these skills to help us understand data about weather. Homework: Practice calculating simple probabilities, conditional probabilities and discerning between the appropriate situations to do each. If students require additional practice, consider using mathisfun.com/data/probability.html as a warm-up the next day. The website provides an excellent review and there are practice problems at the bottom of the page.

23
Name _______________________________________________ Date ________ Period ________ Weather Generators
Lesson 2: Classwork
Probability Practice Problems: 1. Using a standard deck of cards, what are the chances you will draw a 5 from the deck?
𝑁𝑢𝑚𝑏𝑒𝑟 𝑜𝑓 𝑠𝑢𝑐𝑐𝑒𝑠𝑠𝑓𝑢𝑙 𝑜𝑢𝑡𝑐𝑜𝑚𝑒𝑠
𝑁𝑢𝑚𝑏𝑒𝑟 𝑜𝑓 𝑝𝑜𝑠𝑠𝑖𝑏𝑙𝑒 𝑜𝑢𝑡𝑐𝑜𝑚𝑒𝑠 =
𝑇ℎ𝑒𝑟𝑒 𝑎𝑟𝑒 4 𝑓𝑖𝑣𝑒𝑠 𝑖𝑛 𝑡ℎ𝑒 𝑑𝑒𝑐𝑘.
𝑇ℎ𝑒𝑟𝑒 𝑎𝑟𝑒 52 𝑐𝑎𝑟𝑑𝑠 𝑖𝑛 𝑡ℎ𝑒 𝑑𝑒𝑐𝑘 =
4
52 =
1
13
2. What are the chances of rolling a two on a common, six-sided die?
𝑁𝑢𝑚𝑏𝑒𝑟 𝑜𝑓 𝑠𝑢𝑐𝑐𝑒𝑠𝑠𝑓𝑢𝑙 𝑜𝑢𝑡𝑐𝑜𝑚𝑒𝑠
𝑁𝑢𝑚𝑏𝑒𝑟 𝑜𝑓 𝑝𝑜𝑠𝑠𝑖𝑏𝑙𝑒 𝑜𝑢𝑡𝑐𝑜𝑚𝑒𝑠 =
𝑇ℎ𝑒𝑟𝑒 𝑖𝑠 1 𝑡𝑤𝑜
𝑇ℎ𝑒𝑟𝑒 𝑎𝑟𝑒 6 𝑠𝑖𝑑𝑒𝑠 𝑜𝑛 𝑡ℎ𝑒 𝑑𝑖𝑒 =
1
6
3. Are the chances of getting each number on the die the same? Explain. Yes, unless it has been tamped with. Each side of the die is equally likely to be face up with the die stops moving. Thus, each number 1 through 6 has equal chances of being rolled. 4. What are the chances of rolling an even number on a common, six-sided die?
𝑁𝑢𝑚𝑏𝑒𝑟 𝑜𝑓 𝑠𝑢𝑐𝑐𝑒𝑠𝑠𝑓𝑢𝑙 𝑜𝑢𝑡𝑐𝑜𝑚𝑒𝑠
𝑁𝑢𝑚𝑏𝑒𝑟 𝑜𝑓 𝑝𝑜𝑠𝑠𝑖𝑏𝑙𝑒 𝑜𝑢𝑡𝑐𝑜𝑚𝑒𝑠 =
𝑇ℎ𝑒𝑟𝑒 𝑎𝑟𝑒 3 𝑒𝑣𝑒𝑛 𝑛𝑢𝑚𝑏𝑒𝑟𝑠: 2,4,𝑎𝑛𝑑 6
𝑇ℎ𝑒𝑟𝑒 𝑎𝑟𝑒 6 𝑠𝑖𝑑𝑒𝑠 𝑜𝑛 𝑡ℎ𝑒 𝑑𝑖𝑒 =
3
6 =
1
2
5. When your teacher asks you to, roll your die 6 times and write down the number you roll each time.
Roll 1 2 3 4 5 6
Result varies
If the chances of rolling each number are 1/6 and you roll the die six times, why are you not guaranteed
to roll one of each number? Each roll is independent of the others, thus, even after I’ve rolled a number, it can still appear in subsequent rolls regardless of whether the others have been rolled. 6. If I am flipping a coin and happen to flip 10 heads in a row, what are the chances that my next flip will result in heads, for the 11th time in a row? How is this possible? Use the term “independent” in your answer. ½. Each coin flip is independent of each other coin flip. It’s not very likely that I will flip 11 heads in a row, but since each flip event is independent of all other flip events, every time I flip the coin I have a chance of ½ that I’ll flip a heads. 7. What is the difference between independent and conditional probability? Independent means the chance of an event occurring is the same regardless of past events. Conditional probability occurs when the chance of something happening changes depending on past events. 8. Is weather prediction based on independent or dependent statistical procedures? Explain your choice. Dependent. Weather is caused by air flow, air masses, and patterns. These patterns tend to change slowly within a range. Thus the weather one day is at least slightly dependent on the previous day’s weather.
24
Name _______________________________________________ Date ________ Period ________ Weather Generators
Lesson 2: Homework
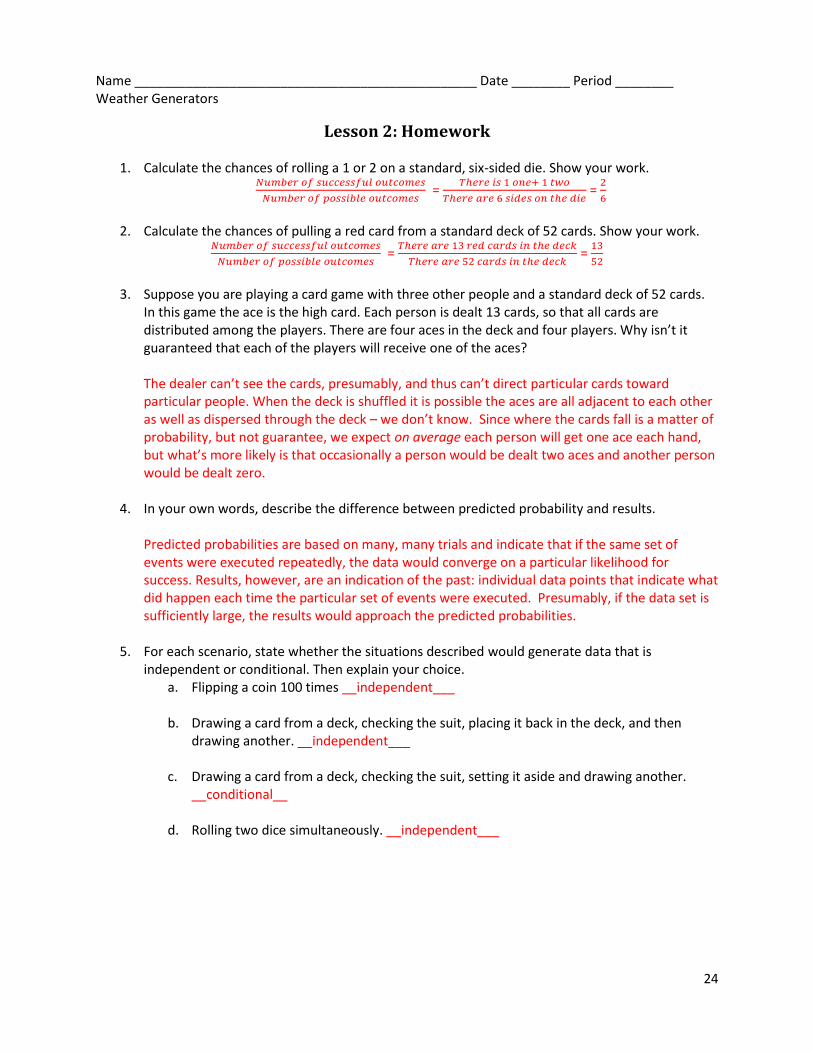
1. Calculate the chances of rolling a 1 or 2 on a standard, six-sided die. Show your work. 𝑁𝑢𝑚𝑏𝑒𝑟 𝑜𝑓 𝑠𝑢𝑐𝑐𝑒𝑠𝑠𝑓𝑢𝑙 𝑜𝑢𝑡𝑐𝑜𝑚𝑒𝑠
𝑁𝑢𝑚𝑏𝑒𝑟 𝑜𝑓 𝑝𝑜𝑠𝑠𝑖𝑏𝑙𝑒 𝑜𝑢𝑡𝑐𝑜𝑚𝑒𝑠 =
𝑇ℎ𝑒𝑟𝑒 𝑖𝑠 1 𝑜𝑛𝑒+ 1 𝑡𝑤𝑜
𝑇ℎ𝑒𝑟𝑒 𝑎𝑟𝑒 6 𝑠𝑖𝑑𝑒𝑠 𝑜𝑛 𝑡ℎ𝑒 𝑑𝑖𝑒 =
2
6
2. Calculate the chances of pulling a red card from a standard deck of 52 cards. Show your work.
𝑁𝑢𝑚𝑏𝑒𝑟 𝑜𝑓 𝑠𝑢𝑐𝑐𝑒𝑠𝑠𝑓𝑢𝑙 𝑜𝑢𝑡𝑐𝑜𝑚𝑒𝑠
𝑁𝑢𝑚𝑏𝑒𝑟 𝑜𝑓 𝑝𝑜𝑠𝑠𝑖𝑏𝑙𝑒 𝑜𝑢𝑡𝑐𝑜𝑚𝑒𝑠 =
𝑇ℎ𝑒𝑟𝑒 𝑎𝑟𝑒 13 𝑟𝑒𝑑 𝑐𝑎𝑟𝑑𝑠 𝑖𝑛 𝑡ℎ𝑒 𝑑𝑒𝑐𝑘
𝑇ℎ𝑒𝑟𝑒 𝑎𝑟𝑒 52 𝑐𝑎𝑟𝑑𝑠 𝑖𝑛 𝑡ℎ𝑒 𝑑𝑒𝑐𝑘 =
13
52
3. Suppose you are playing a card game with three other people and a standard deck of 52 cards.
In this game the ace is the high card. Each person is dealt 13 cards, so that all cards are distributed among the players. There are four aces in the deck and four players. Why isn’t it guaranteed that each of the players will receive one of the aces?
The dealer can’t see the cards, presumably, and thus can’t direct particular cards toward particular people. When the deck is shuffled it is possible the aces are all adjacent to each other as well as dispersed through the deck – we don’t know. Since where the cards fall is a matter of probability, but not guarantee, we expect on average each person will get one ace each hand, but what’s more likely is that occasionally a person would be dealt two aces and another person would be dealt zero.
4. In your own words, describe the difference between predicted probability and results.
Predicted probabilities are based on many, many trials and indicate that if the same set of events were executed repeatedly, the data would converge on a particular likelihood for success. Results, however, are an indication of the past: individual data points that indicate what did happen each time the particular set of events were executed. Presumably, if the data set is sufficiently large, the results would approach the predicted probabilities.
5. For each scenario, state whether the situations described would generate data that is
independent or conditional. Then explain your choice. a. Flipping a coin 100 times __independent___
b. Drawing a card from a deck, checking the suit, placing it back in the deck, and then
drawing another. __independent___
c. Drawing a card from a deck, checking the suit, setting it aside and drawing another. __conditional__
d. Rolling two dice simultaneously. __independent___
25
Lesson 3: Weather & Statistical Persistence
Summary: Students work to understand statistical persistence, create a flow chart for weather-based statistical persistence, and then use dice to simulate data.
Objective 1: Watch a video on how fronts move to explain the concept of statistical persistence. Objective 2: Create a flow chart that describes statistical persistence with relation to dice, including a
definition of wet and dry days. Objective 3: Collect data with persistence; summarize it in a 2x2 grid Homework: Collect data without persistence; summarize it in a 2x2 grid. (This will be used later to see if
our persistence model is working).
Remind students of the module question: Global temperatures are increasing. What does that mean about precipitation? In lesson 1 we learned about the water cycle. In lesson two we learned about statistics. We will now merge those lessons as we try to understand changes in global precipitation patterns. Objective 1: Watch a video on how fronts move to explain the concept of statistical persistence. You Tube has literally thousands of videos about weather fronts and how they are connected to weather. Our favorite is one out of the UK that has graphics that are supportive of the idea of persistence (though that word is not used): http://www.youtube.com/watch?v=G7Ewqm0YHUI Do you think the weather today is related to the weather we’ll have tomorrow? Is weather completely independent day-to-day?
No. Whatever is causing weather today (high pressure and a warm mass of air creating a sunny, warm day or low pressure and a cool mass of air creating a cloudy, cool day) is possibly still going to be affecting weather tomorrow. So weather today and weather tomorrow are not independent of each other.
What does it mean to be “persistent?” Sometimes people are persistent. What does that mean? Student-relevant example: wanting an iPod. If you want one today, you’ll probably want one tomorrow and next week. However, if you don’t get an iPod for a few months, you will probably move on to something newer and different you want. So, being persistent doesn’t mean you’ll never change, just that you get hung up on something for a while. Teachers: A quick summary of persistence as a method of forecasting the weather for your own background knowledge if you would like: http://ww2010.atmos.uiuc.edu/(Gh)/guides/mtr/fcst/mth/prst.rxml, 09/22/2012 Objective 2: Create a flow chart that describes statistical persistence with relation to dice, including a
definition of wet and dry days. Remind students that we are focused on the water cycle and sustainability of water as a resource. Since we are just beginners, we will simplify our predictions to just whether measurable precipitation will fall from the sky (call these “wet” days) or if no measurable precipitation will fall from the sky (call these
26
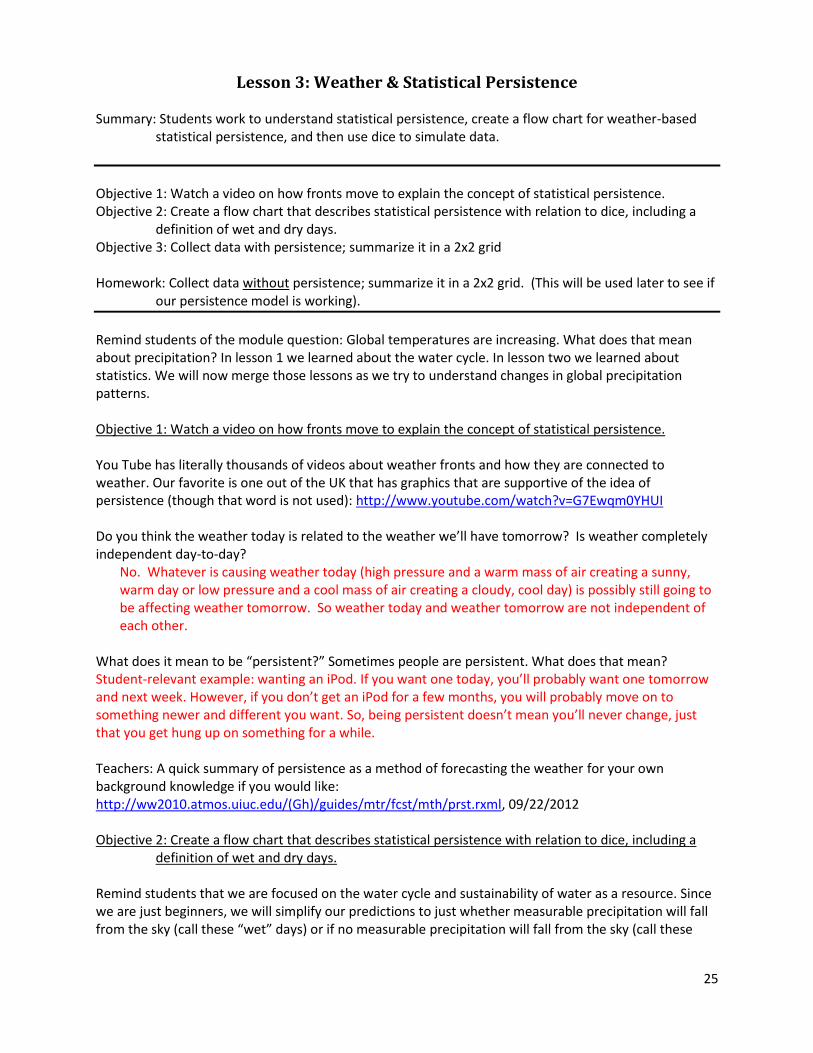
“dry” days). Acknowledge to students that on dry days it’s possible that a few drops of rain will fall but that this trace moisture wouldn’t be considered “measurable.” “Flow charts are tools that help researchers understand the relationships between events, such as whether it will rain or not. We will use flow charts now to understand how our weather data is generated by the computers later. Guide students through the process of developing a flow chart, starting simply. Show students a simple flow chart:
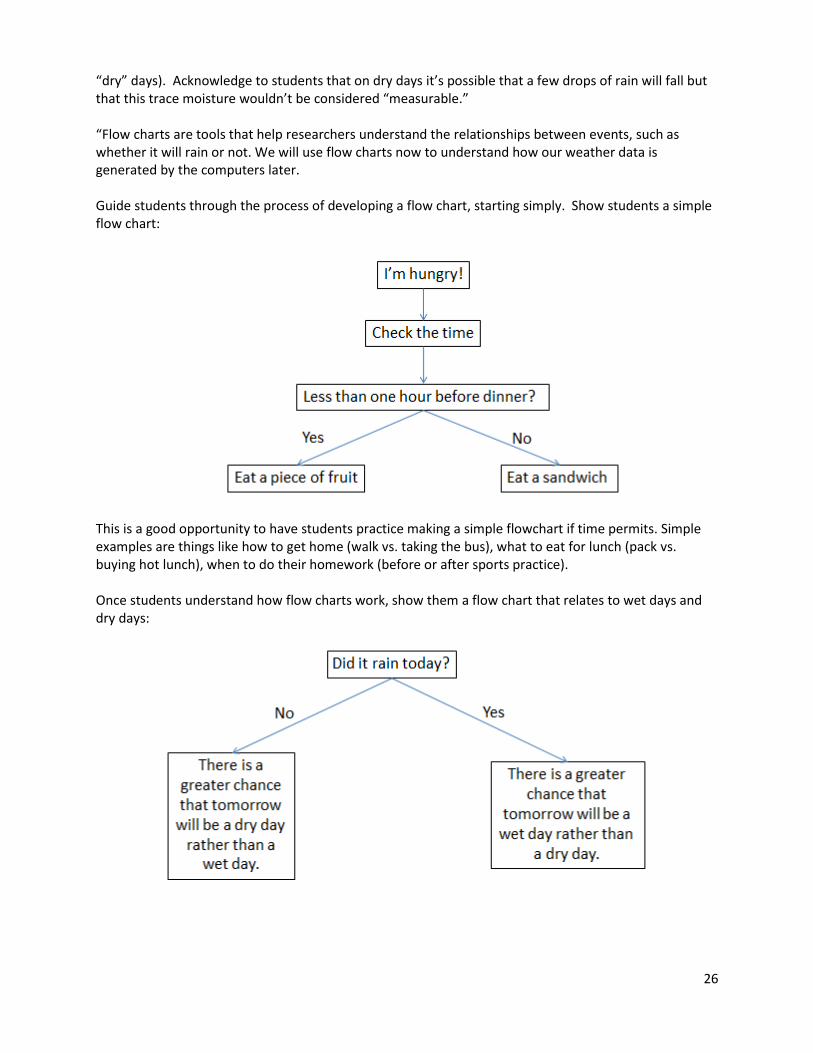
This is a good opportunity to have students practice making a simple flowchart if time permits. Simple examples are things like how to get home (walk vs. taking the bus), what to eat for lunch (pack vs. buying hot lunch), when to do their homework (before or after sports practice). Once students understand how flow charts work, show them a flow chart that relates to wet days and dry days:
27
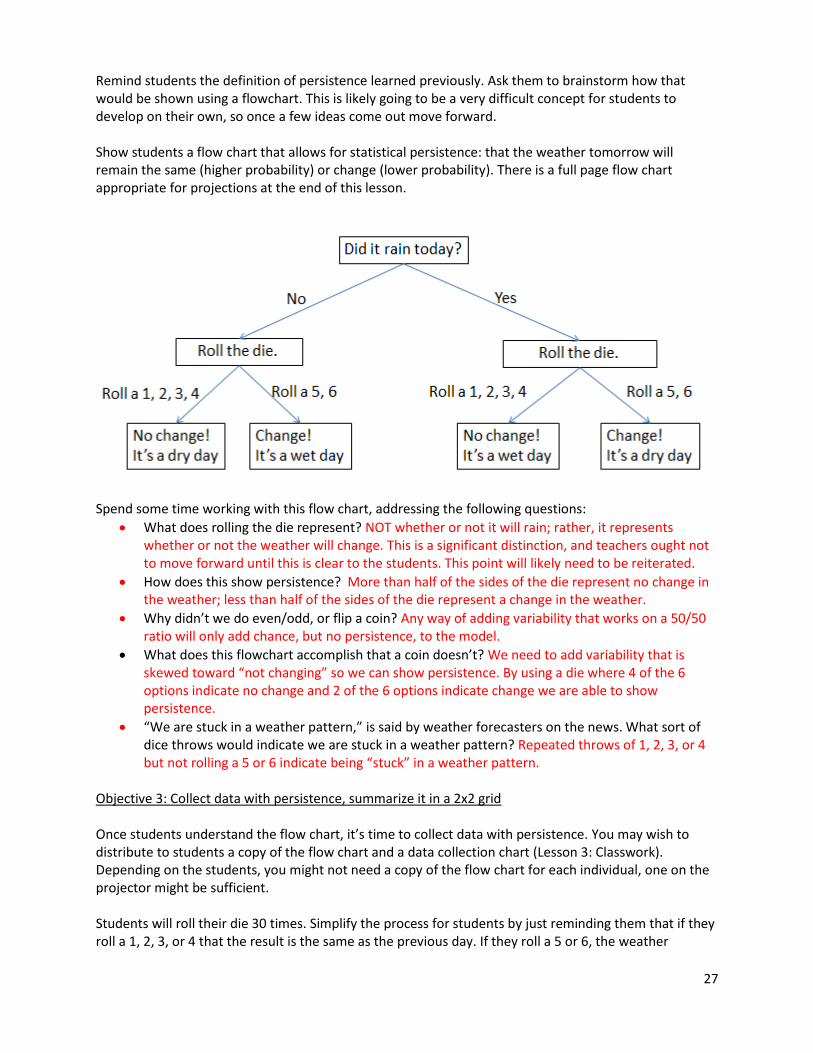
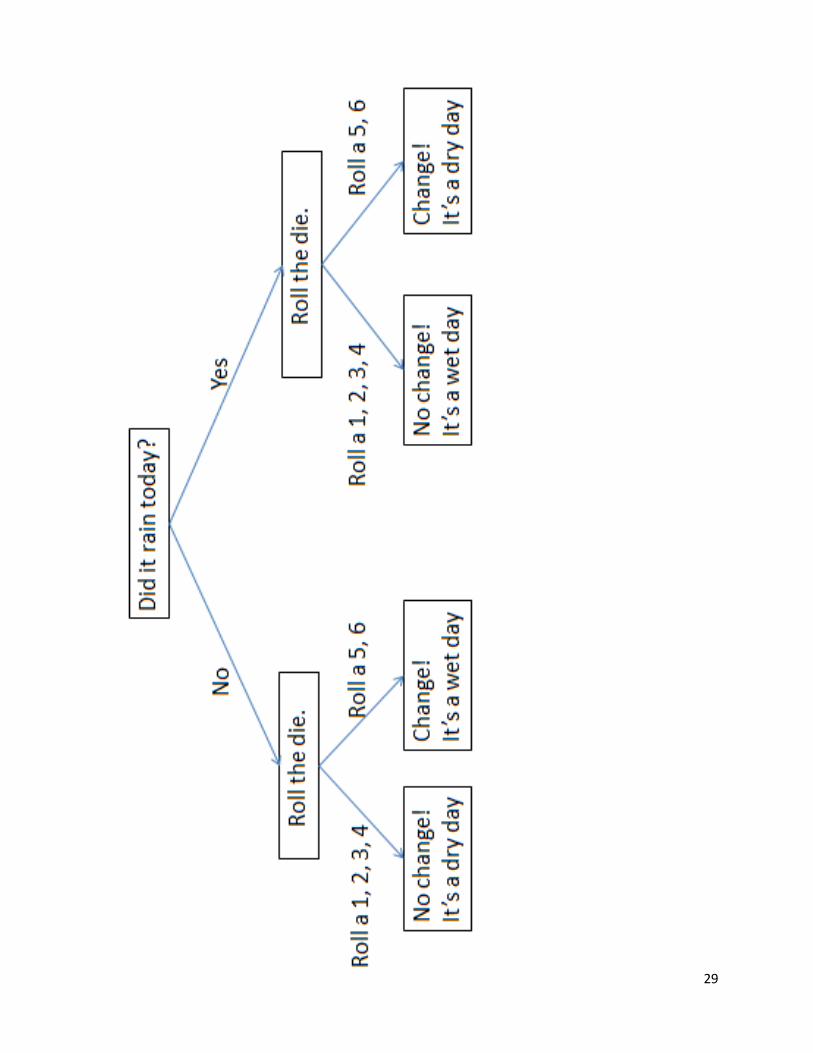
Remind students the definition of persistence learned previously. Ask them to brainstorm how that would be shown using a flowchart. This is likely going to be a very difficult concept for students to develop on their own, so once a few ideas come out move forward. Show students a flow chart that allows for statistical persistence: that the weather tomorrow will remain the same (higher probability) or change (lower probability). There is a full page flow chart appropriate for projections at the end of this lesson.
Spend some time working with this flow chart, addressing the following questions:
What does rolling the die represent? NOT whether or not it will rain; rather, it represents whether or not the weather will change. This is a significant distinction, and teachers ought not to move forward until this is clear to the students. This point will likely need to be reiterated.
How does this show persistence? More than half of the sides of the die represent no change in the weather; less than half of the sides of the die represent a change in the weather.
Why didn’t we do even/odd, or flip a coin? Any way of adding variability that works on a 50/50 ratio will only add chance, but no persistence, to the model.
What does this flowchart accomplish that a coin doesn’t? We need to add variability that is skewed toward “not changing” so we can show persistence. By using a die where 4 of the 6 options indicate no change and 2 of the 6 options indicate change we are able to show persistence.
“We are stuck in a weather pattern,” is said by weather forecasters on the news. What sort of dice throws would indicate we are stuck in a weather pattern? Repeated throws of 1, 2, 3, or 4 but not rolling a 5 or 6 indicate being “stuck” in a weather pattern.
Objective 3: Collect data with persistence, summarize it in a 2x2 grid Once students understand the flow chart, it’s time to collect data with persistence. You may wish to distribute to students a copy of the flow chart and a data collection chart (Lesson 3: Classwork). Depending on the students, you might not need a copy of the flow chart for each individual, one on the projector might be sufficient. Students will roll their die 30 times. Simplify the process for students by just reminding them that if they roll a 1, 2, 3, or 4 that the result is the same as the previous day. If they roll a 5 or 6, the weather
28
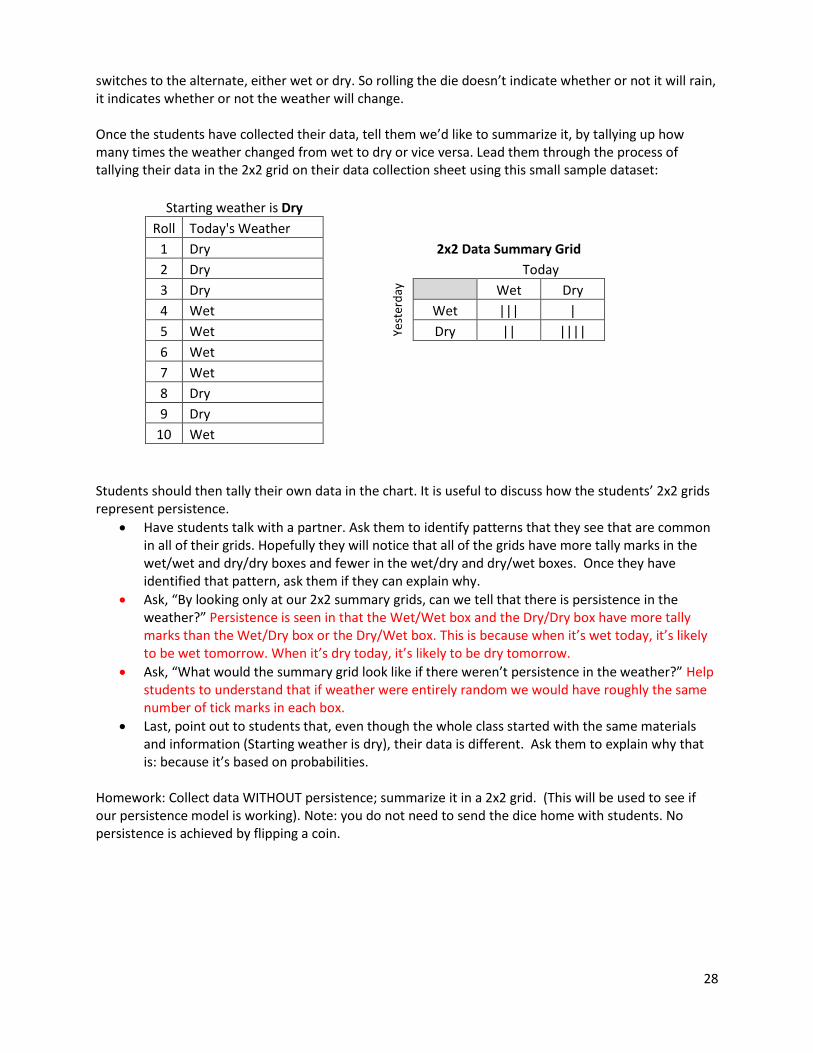
switches to the alternate, either wet or dry. So rolling the die doesn’t indicate whether or not it will rain, it indicates whether or not the weather will change. Once the students have collected their data, tell them we’d like to summarize it, by tallying up how many times the weather changed from wet to dry or vice versa. Lead them through the process of tallying their data in the 2x2 grid on their data collection sheet using this small sample dataset:
Starting weather is Dry Roll Today's Weather 1 Dry
2x2 Data Summary Grid 2 Dry
Today
3 Dry
Yest
erd
ay
Wet Dry 4 Wet
Wet ||| |
5 Wet
Dry || |||| 6 Wet
7 Wet 8 Dry 9 Dry 10 Wet
Students should then tally their own data in the chart. It is useful to discuss how the students’ 2x2 grids represent persistence.
Have students talk with a partner. Ask them to identify patterns that they see that are common in all of their grids. Hopefully they will notice that all of the grids have more tally marks in the wet/wet and dry/dry boxes and fewer in the wet/dry and dry/wet boxes. Once they have identified that pattern, ask them if they can explain why.
Ask, “By looking only at our 2x2 summary grids, can we tell that there is persistence in the weather?” Persistence is seen in that the Wet/Wet box and the Dry/Dry box have more tally marks than the Wet/Dry box or the Dry/Wet box. This is because when it’s wet today, it’s likely to be wet tomorrow. When it’s dry today, it’s likely to be dry tomorrow.
Ask, “What would the summary grid look like if there weren’t persistence in the weather?” Help students to understand that if weather were entirely random we would have roughly the same number of tick marks in each box.
Last, point out to students that, even though the whole class started with the same materials and information (Starting weather is dry), their data is different. Ask them to explain why that is: because it’s based on probabilities.
Homework: Collect data WITHOUT persistence; summarize it in a 2x2 grid. (This will be used to see if our persistence model is working). Note: you do not need to send the dice home with students. No persistence is achieved by flipping a coin.
29
30
Name _______________________________________________ Date ________ Period ________ Weather Generators
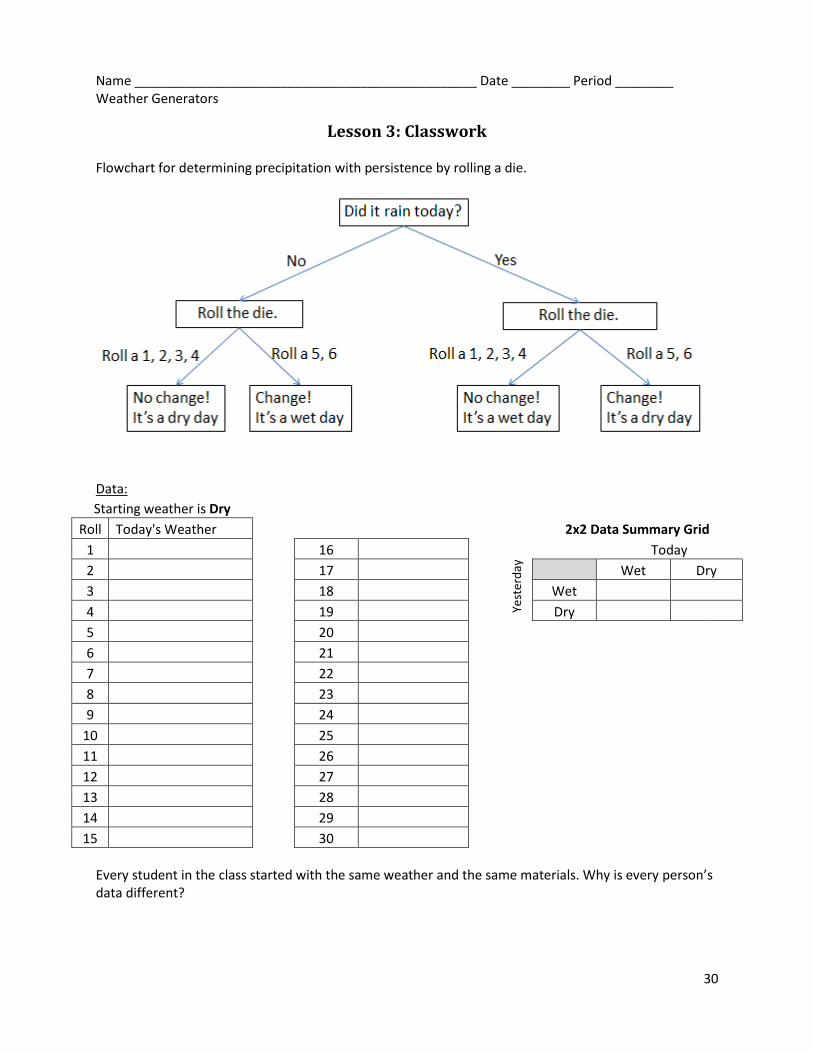
Lesson 3: Classwork
Flowchart for determining precipitation with persistence by rolling a die.
Data:
Starting weather is Dry Roll Today's Weather
2x2 Data Summary Grid
1
16
Today
2
17
Yest
erd
ay
Wet Dry
3
18 Wet
4
19 Dry
5
20 6
21
7
22 8
23
9
24 10
25
11
26 12
27
13
28 14
29
15
30
Every student in the class started with the same weather and the same materials. Why is every person’s data different?
31
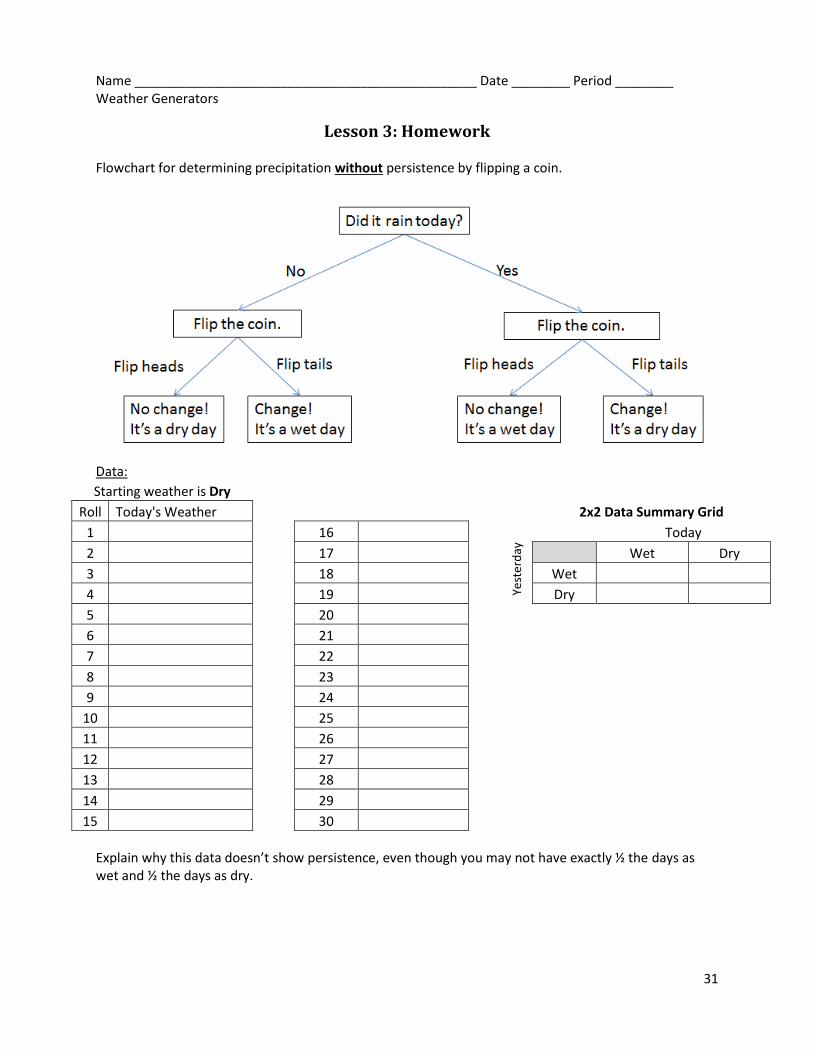
Name _______________________________________________ Date ________ Period ________ Weather Generators
Lesson 3: Homework Flowchart for determining precipitation without persistence by flipping a coin.
Data:
Starting weather is Dry Roll Today's Weather
2x2 Data Summary Grid
1
16
Today
2
17
Yest
erd
ay
Wet Dry
3
18 Wet
4
19 Dry
5
20 6
21
7
22 8
23
9
24 10
25
11
26 12
27
13
28 14
29
15
30
Explain why this data doesn’t show persistence, even though you may not have exactly ½ the days as wet and ½ the days as dry.
32
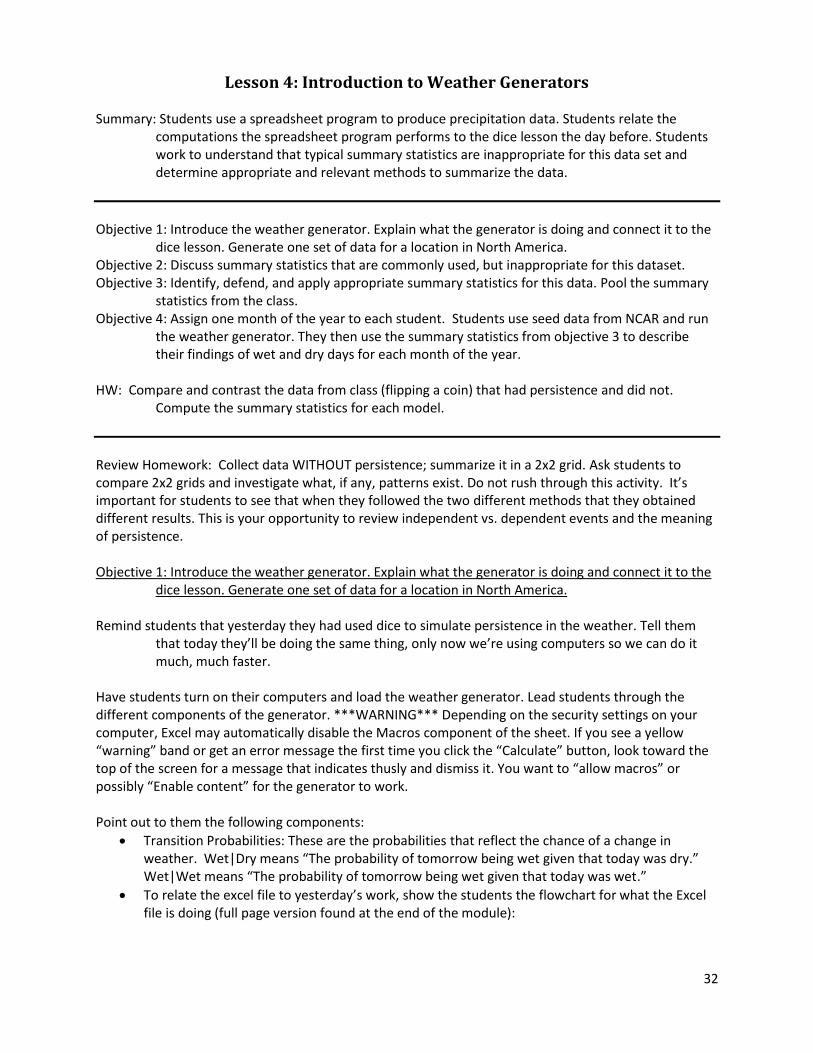
Lesson 4: Introduction to Weather Generators
Summary: Students use a spreadsheet program to produce precipitation data. Students relate the computations the spreadsheet program performs to the dice lesson the day before. Students work to understand that typical summary statistics are inappropriate for this data set and determine appropriate and relevant methods to summarize the data.
Objective 1: Introduce the weather generator. Explain what the generator is doing and connect it to the
dice lesson. Generate one set of data for a location in North America. Objective 2: Discuss summary statistics that are commonly used, but inappropriate for this dataset. Objective 3: Identify, defend, and apply appropriate summary statistics for this data. Pool the summary
statistics from the class. Objective 4: Assign one month of the year to each student. Students use seed data from NCAR and run
the weather generator. They then use the summary statistics from objective 3 to describe their findings of wet and dry days for each month of the year.
HW: Compare and contrast the data from class (flipping a coin) that had persistence and did not.
Compute the summary statistics for each model.
Review Homework: Collect data WITHOUT persistence; summarize it in a 2x2 grid. Ask students to compare 2x2 grids and investigate what, if any, patterns exist. Do not rush through this activity. It’s important for students to see that when they followed the two different methods that they obtained different results. This is your opportunity to review independent vs. dependent events and the meaning of persistence. Objective 1: Introduce the weather generator. Explain what the generator is doing and connect it to the
dice lesson. Generate one set of data for a location in North America. Remind students that yesterday they had used dice to simulate persistence in the weather. Tell them
that today they’ll be doing the same thing, only now we’re using computers so we can do it much, much faster.
Have students turn on their computers and load the weather generator. Lead students through the different components of the generator. ***WARNING*** Depending on the security settings on your computer, Excel may automatically disable the Macros component of the sheet. If you see a yellow “warning” band or get an error message the first time you click the “Calculate” button, look toward the top of the screen for a message that indicates thusly and dismiss it. You want to “allow macros” or possibly “Enable content” for the generator to work. Point out to them the following components:
Transition Probabilities: These are the probabilities that reflect the chance of a change in weather. Wet|Dry means “The probability of tomorrow being wet given that today was dry.” Wet|Wet means “The probability of tomorrow being wet given that today was wet.”
To relate the excel file to yesterday’s work, show the students the flowchart for what the Excel file is doing (full page version found at the end of the module):
33
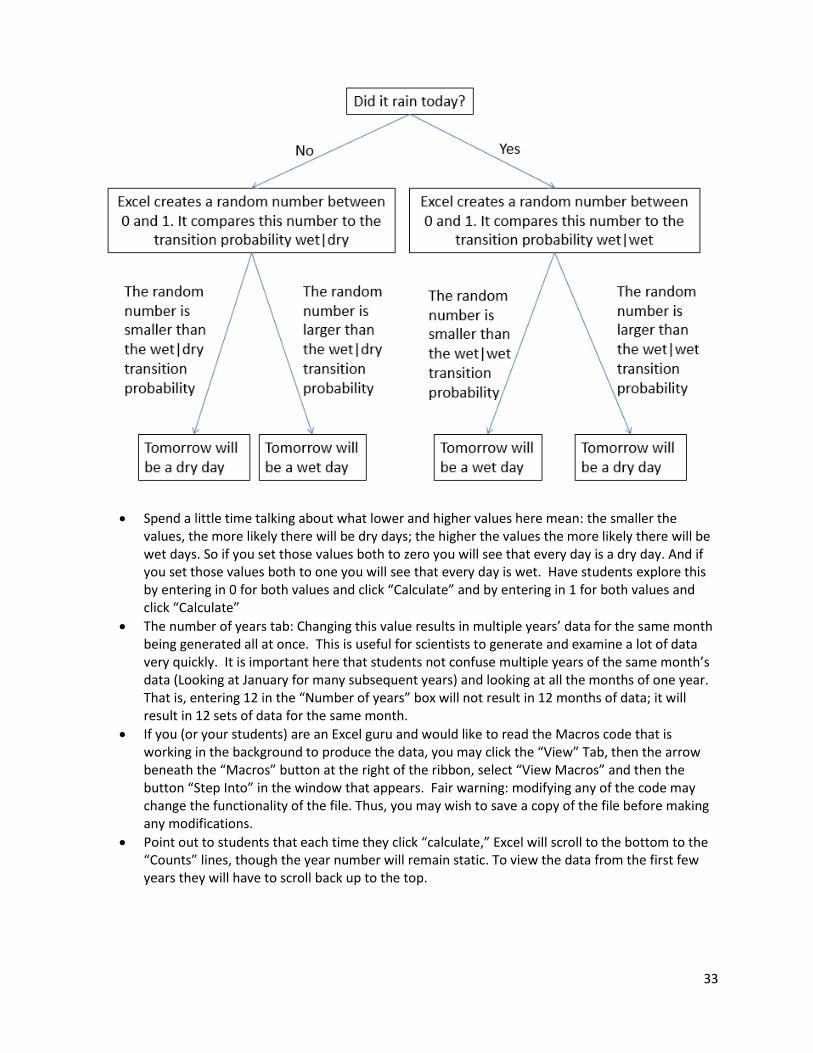
Spend a little time talking about what lower and higher values here mean: the smaller the values, the more likely there will be dry days; the higher the values the more likely there will be wet days. So if you set those values both to zero you will see that every day is a dry day. And if you set those values both to one you will see that every day is wet. Have students explore this by entering in 0 for both values and click “Calculate” and by entering in 1 for both values and click “Calculate”
The number of years tab: Changing this value results in multiple years’ data for the same month being generated all at once. This is useful for scientists to generate and examine a lot of data very quickly. It is important here that students not confuse multiple years of the same month’s data (Looking at January for many subsequent years) and looking at all the months of one year. That is, entering 12 in the “Number of years” box will not result in 12 months of data; it will result in 12 sets of data for the same month.
If you (or your students) are an Excel guru and would like to read the Macros code that is working in the background to produce the data, you may click the “View” Tab, then the arrow beneath the “Macros” button at the right of the ribbon, select “View Macros” and then the button “Step Into” in the window that appears. Fair warning: modifying any of the code may change the functionality of the file. Thus, you may wish to save a copy of the file before making any modifications.
Point out to students that each time they click “calculate,” Excel will scroll to the bottom to the “Counts” lines, though the year number will remain static. To view the data from the first few years they will have to scroll back up to the top.
34
Help the students appreciate that in the last lesson we spent a long time generating 30 days’ worth of data. Now, with this weather generator, the same amount of data can be generated for multiple years in less than a second! Now introduce students to the other two tabs on the bottom of the spreadsheet, titled, “Current” and “Future.” The two tabs look quite similar but contain different information. Where do those “transition probability” numbers come from? When we worked with persistence as was modeled with a die, we said 2/3 of the time the weather will persist and 1/3 of the time the weather will change. We arbitrarily came up with these numbers to illustrate a concept. Scientists around the world are trying to understand the weather patterns that we observe and predict how the weather will change over time. The numbers in these two tabs are a part of that research and prediction. The transition probabilities in the “Current” tab are the result of analysis for thirty years of data from 1970-2000. These are “real” numbers that reflect how often the weather changed from wet to dry over in that specific location, during the month indicated, over the 30 year period. The transition probabilities in the “Future” tab are the result of predictive data from NCAR. These numbers use a model called the “A2 Scenario” to predict the precipitation patterns from the year 2040-2070. If you or your students would like more detail as to how these values are arrived to, the following paragraphs and references may be of use:
Climate models (deterministically) simulate weather over the globe for long periods of time from which distributional properties of weather (i.e., the climate) are inferred. More specifically, they simulate weather as it responds to assumptions about how various forcings (e.g, greenhouse gasses) will evolve in the future. Typically, these models couple an atmospheric model with an ocean model, but more recent versions, the so-called Earth system models, incorporate more components including land use, sea and land ice, etc.
The spatial resolution of climate models is often too coarse for many impacts studies and there is much interest in downscaling. Downscaling can be done in many different ways, but essentially the idea is to start with the coarse scale climate model output and use this to better inform about climate on finer spatial scales. This can be done using statistical approaches or through the use of high-resolution models.
The North American Regional Climate Change Program (NARCCAP) incorporates so-called regional climate models to produce higher resolution projections of climate change over North America. Regional climate models focus on smaller regions and use boundary conditions supplied by global models. In this particular case, the CRCM regional model with boundary conditions supplied by the CGCM3 global model was used. More about the models, including references, can be found at narccap.ucar.edu.
Precipitation time series for selected grid boxes were taken from runs spanning 1970-2000 (current) and 2040-2070 (future). The future runs assume the A2 scenario for greenhouse gas forcings. This scenario includes fairly high emissions of greenhouse gasses. Each of these time series were converted into sequences of wet or dry days, and the transition probabilities computed from these sequences for each month.

35
General climate modeling references:
McGuffie, K. and Henderson-Sellers, A. (2005), A Climate modeling primer, John Wiley & Sons, DOI: 10.1002/0470857617
Goosse H., P.Y. Barriat, W. Lefebvre, M.F. Loutre and V. Zunz, (2014). Introduction to climate dynamics and climate modeling. Online textbook available at http://www.climate.be/textbook.
NARCCAP references:
Mearns, L.O., W. J. Gutowski, R. Jones, L.-Y. Leung, S. McGinnis, A. M. B. Nunes, and Y. Qian, 2009: A regional climate change assessment program for North America. Eos, Trans. Amer. Geophys. Union, 90, 311, doi:10.1029/2009EO360002
Mearns, L.O., Arritt R., Biner, S., Bukovsky, M.S., McGinnis, S., Sain, S., Caya, D., Correia, J., Flory, D., Gutowski, W., Takle, E.S., Jones, R., Leung, R., Moufouma-Okia, W., McDaniel, L., Nunes, A.M.B., Qian, Y., Roads, J., Sloan, L., Snyder, M. (2012), “The North American regional climate change assessment program: Overview of phase I results,”Bulletin of the American Meteorological Society, 93, 1337-1362, doi: 10.1175/BAMS-D-11-00223.1.
Mearns, L.O., Sain, S.R., Leung, L.R., Bukovsky, M.S., McGinnis, S., Biner, S., Caya, D., Arritt, R.W., Gutowski, W., Takle, E., Snyder, M., Jones, R.G., Nunes, A.M.B., Tucker, S., Herzmann, D., McDaniel, L., and Sloan, L. (2013), “Climate change projections of the North American Regional Climate Change Assessment Program (NARCCAP),” Climatic Change Letters, 120, 965-975, doi: 10.1007/s10584-013-0831-3.
Notice that on both tabs you will see two different transition probabilities: one for wet|wet and one for wet|dry. When students work with the data it is important that they understand that they must use both the values for the same month and the same location in order to obtain useful data. Once students have become comfortable with the weather generator and what the different components are, have them use a pair of transition probability values for one location and the same month in order to generate their first set of 5 years of data. After students have run the weather generator ask them to pair up with their neighbor and describe their data to each other (there is space for students to write on this lesson’s Classwork page). This directive is intentionally vague – it’s good for students to recognize that they don’t know how to describe their data. Objective 2: Discuss summary statistics that are commonly used, but inappropriate for this dataset. Start by asking the students if it was hard to have a conversation about their data. It probably was. Also, point out to students that they all have different data sets, and so in order to communicate about what our model produced we’re going to have to summarize the data in some way. Discuss with students:
How data is usually summarized? Students will probably say “Mean, median, and mode” just because these are words they’ve heard before.
36
Would that be useful here? Ask each student group to calculate the mean of the five years of their month’s wet days. They might need reminding that mean is the average number, and how to calculate it.
Objective 3: Identify, defend, and apply appropriate summary statistics for this data. Pool the summary
statistics from the class. Ask students what kinds of data summary tools would be useful for this kind of data. Remind them what the data actually means (it rains vs. it doesn’t rain). Questions to pose:
Do you think the pattern of the wet and dry days matter? At first students might say no. But point out to them that crops need water to grow. Ask them if it mattered to a farmer if, over a growing season, all of the dry days came first followed by all of the wet days. Hopefully they will realize that it does matter.
Remind them that rain can affect us in different ways. First the annual or seasonal total precipitation, second, how long it has been since the last rainfall. What scientists would care only about the annual or seasonal total of precipitation? What scientists would care about the pattern of wet/dry days?
What pattern of water is most useful for your lawn? Rain every few days
What sorts of information might a farmer want to know about rainfall? (Remember, we only have “wet” and “dry,” not amounts) Longest dry spell, longest wet spell
Hopefully at this point students understand that the pattern of rainfall is more important than the average number of days that rain falls. Ask students how we would measure the pattern of precipitation given the data we have. Once students agree on the value of longest dry and wet spells of weather, have each student examine their own data to calculate their longest wet and dry spells. Objective 4: Assign one month of the year to each student. Students use seed data from NCAR and run
the weather generator. They then use the summary statistics from objective 3 to describe their findings of wet and dry days for each month of the year.
1. As a class, choose one location from the “current” tab that you wish to investigate together.
Preferably the location will be close to where you live so students have some personal association with the data.
2. Assign each student or pair of students one month to work with. 3. Have the students run the simulation for 5 years with the appropriate transition probabilities for
their month. For each iteration, have students collect data: total number of wet days, total number of dry days, longest wet spell and longest dry spell for their month.
4. Have all the students with the same month compare their summary statistics. They should find that all of their summary statistics are about the same.
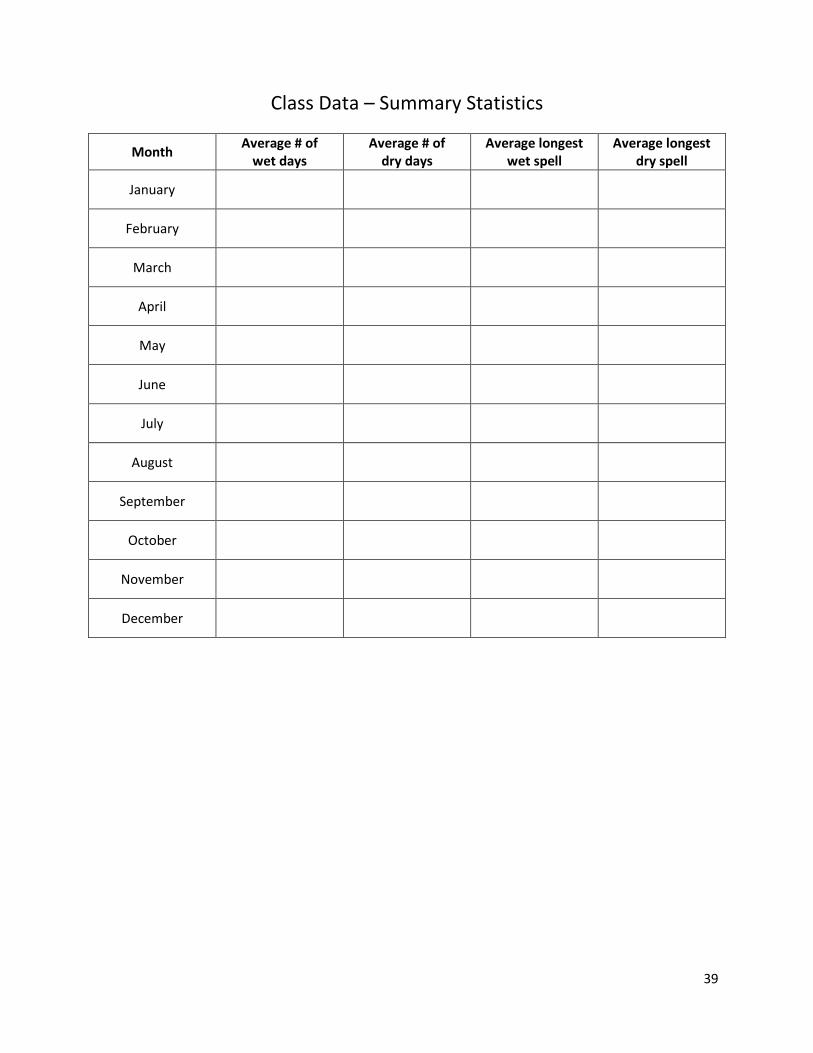
5. Have students report their summary statistics back to the whole class, possibly using the class data table found at the end of this lesson. As a class examine the data. You should find that the inappropriate summary statistics may or may not be very different, but that the appropriate summary statistics more clearly show the difference in weather patterns from season to season throughout the year. Note that because these are real data values, the differences may be quite subtle or quite pronounced depending on the location you choose. Be prepared to facilitate the discussion about either of those trends, bearing in mind that when we talk about global warming and the sea level increasing that we’re looking at the whole planet, not just one

37
location. Some areas will get wetter, some will get drier, and some won’t experience much change at all.
6. Talk about how the data they see matches the experiences they’ve had living in your geographic region. Does it make sense?
Homework: Using the wet/dry data generated with persistence vs. without persistence, compute the same summary statistics we discussed in class – total number of wet days, total number of dry days, longest wet spell and longest dry spell. (These are handouts Lesson 3: Classwork and Lesson 3: Homework). Compare and contrast the statistics. What is similar about the statistics for the two different data sets? What is different?

38
39
Class Data – Summary Statistics
Month Average # of
wet days Average # of
dry days Average longest
wet spell Average longest
dry spell
January
February
March
April
May
June
July
August
September
October
November
December

40
Name _______________________________________________ Date ________ Period ________ Weather Generators
Lesson 4: Classwork
1. You have just used the weather generator for the first time, creating 5 years of data for one month in one location. Describe the results: A “mean” or “average” is a summary statistic used to understand of a set of numbers. Specifically, the sum of the values divided by the number of values. Thus, the mean of the numbers 2, 3, 7, 8 is:
2 + 3 + 7 + 8
4= 5
2. Count and record the number of dry days for each year of data. Then, calculate the mean number of dry days for your data:
Year 1 Dry Days:
Year 2 Dry Days:
Year 3 Dry Days:
Year 4 Dry Days:
Year 5 Dry Days:
Mean number of dry days:
3. Why does the pattern of wet and dry days matter? 5. As a class, choose one location from the “current” tab that you wish to investigate together.
Record which month you’ve been assigned to investigate: ____________________________
Run the simulation for 5 years with the appropriate transition probabilities for your month. For each year, collect data: total number of wet days, total number of dry days, longest wet spell and longest dry spell for your month. Record these values in the data table below. Last compute the mean for each summary statistic.
Compare the summary statistics with other students who have the same month and report your overall mean to the class data table.
Year 1 Year 2 Year 3 Year 4 Year 5 Mean
Total # of wet days
Total # of dry days
Longest wet spell
Longest dry spell
41
Name _______________________________________________ Date ________ Period ________ Weather Generators
Lesson 4: Homework
Homework: Using the wet/dry data generated by hand with persistence vs. without persistence, compute the same summary statistics we discussed in class – total number of wet days, total number of dry days, longest wet spell and longest dry spell. (These are handouts titled Lesson 3: Classwork and Lesson 3: Homework). For the dataset with persistence (Lesson 3: Classwork):
1. What is the total number of wet days? _______
2. What is the total number of dry days? _______
3. What is the longest wet spell? _______
4. What is the longest dry spell? ______ For the dataset without persistence (Lesson 3: Homework):
5. What is the total number of wet days? _______
6. What is the total number of dry days? _______
7. What is the longest wet spell? _______
8. What is the longest dry spell? ______ Compare and contrast the statistics. What is similar about the statistics for the two different data sets? What is different? All students used the same materials to generate data (identical flow charts, die, pennies, and starting data). If we were all to compare data sheets, what should we expect to see similar versus different on different students data? Should we all expect to have the same data? Should we all expect to have the same summary statistics? Which is more likely to be the same among different students? Everyone has different data, but we should have very similar average numbers of dry vs. wet days and very similar lengths of dry and wet spells
42
Lesson 5: Natural Variability in Data Summary: Students work to understand the difference between natural variability and variability that is
the result of hidden, and possibly problematic, variables. Students use the weather generator again to examine and summarize variability that is natural.
Objective 1: Examine the homework from the night before – how were the summary statistics different
for the data with vs. without persistence? Objective 2: Use the weather generator to replicate 15 years of one month’s data. Using histograms,
examine variability that is natural. Objective 3: Working as a class, summarize natural variability for your area over the year. HW: Why are trends in global temperature change hard to identify?
Objective 1: Examine the homework from the night before – how were the summary statistics different
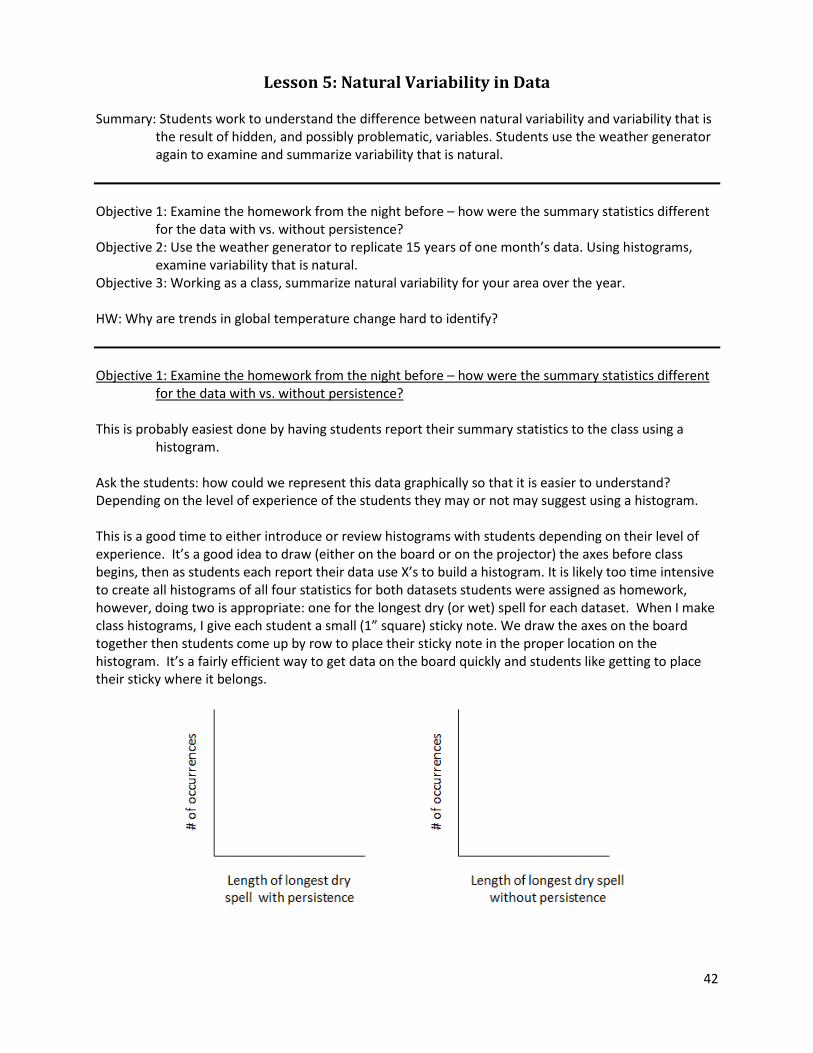
for the data with vs. without persistence? This is probably easiest done by having students report their summary statistics to the class using a
histogram. Ask the students: how could we represent this data graphically so that it is easier to understand? Depending on the level of experience of the students they may or not may suggest using a histogram. This is a good time to either introduce or review histograms with students depending on their level of experience. It’s a good idea to draw (either on the board or on the projector) the axes before class begins, then as students each report their data use X’s to build a histogram. It is likely too time intensive to create all histograms of all four statistics for both datasets students were assigned as homework, however, doing two is appropriate: one for the longest dry (or wet) spell for each dataset. When I make class histograms, I give each student a small (1” square) sticky note. We draw the axes on the board together then students come up by row to place their sticky note in the proper location on the histogram. It’s a fairly efficient way to get data on the board quickly and students like getting to place their sticky where it belongs.

43
Lead a discussion driving home the difference between random events and persistent ones. Questions might include:
In which histogram is the shortest wet or dry spell?
Do there appear to be any trends in the length of the wet and dry spells? (The data with persistence should show longer wet and dry spells.
Why does this data reflect our data collection technique (independent vs. with persistence)? The objective is for students to see that the dataset generated without persistence doesn’t show the same length of wet spells and dry spells and the dataset generated with persistence. This should be evidenced by the histogram for the random data being centered on the smaller values and the histogram for the persistent data being centered on larger values. Depending on the size of your class the differences may be subtle. Objective 2: Use the weather generator to replicate 15 years of one month’s data. (Split the class so that
all months are addressed). Using two histograms (one for longest wet string, one for longest dry string), examine variability that is natural.
You will probably want to use the Lesson 5 Classwork handout for today’s lesson, even if you’ve been avoiding use of the other handouts to this point. Returning to the weather generator file, choose a location for your class to investigate together (probably the same location as yesterday, but it doesn’t need to be). Assign each student a month to investigate and have students generate 15 years’ worth of data, recording the number of wet and dry days in each year, as well as examining the data to determine the longest string of wet days and the longest string of dry days in each year. Then, have students calculate the averages of each parameter and create two histograms: one for the length of longest wet string and one for the length of longest dry string. Again, the Lesson 5 Classwork handout lays it out nicely for students. Objective 3: Working as a class, summarize natural variability for this location over one year. Once all students have generated and summarized the data, it’s time to start looking at how the precipitation changes over the course of a year. This can be accomplished by having the student(s) responsible for each month report back where the center of their histogram is for the longest string of dry days on a class data table and/or a class histogram (blank black-line masters are included at the end of this lesson). If more than one student is working on the same month it is reasonable to have them pool their data to create one histogram and then have each month report back to the class. Here it’s a good idea to point out to students that we can recognize seasonality in our weather based on how the length of wet and dry spells change throughout the year. Connect this idea to the concept that it is difficult to recognize long-term changes in weather pattern since there is considerable variability in the weather pattern throughout the course of a year already. For example, it’s not unreasonable that there is a dry spell of 8 days during the summer months in many locations. However, a dry spell of 8 days in one of the winter months would be extraordinarily rare and possibly an indication of climate change.

44
Class Data – Longest String of Dry Days
Month Longest String of Dry Days
January
February
March
April
May
June
July
August
September
October
November
December
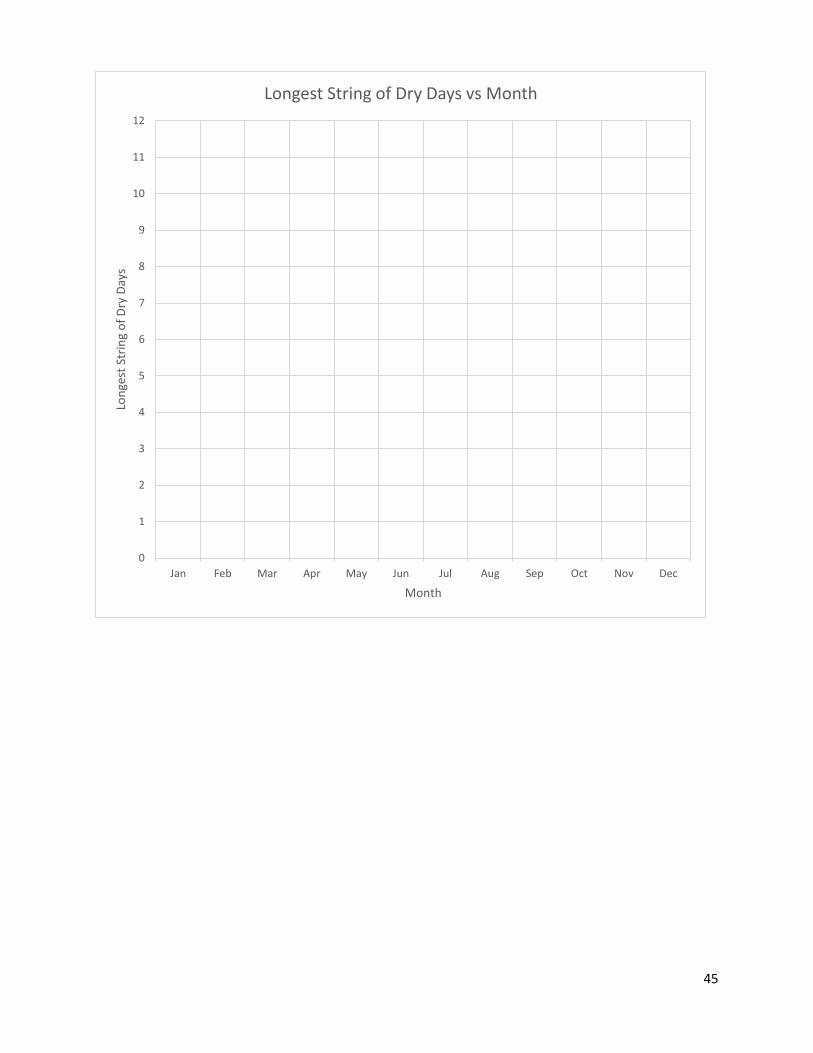
45
0
1
2
3
4
5
6
7
8
9
10
11
12
Jan Feb Mar Apr May Jun Jul Aug Sep Oct Nov Dec
Lon
gest
Str
ing
of
Dry
Day
s
Month
Longest String of Dry Days vs Month

46
Name _______________________________________________ Date ________ Period ________ Weather Generators
Lesson 5: Classwork
Location: ____________________________ Month____________ Transitional Probabilities (from “Current” tab in the weather generator):
Wet|Dry ________ Wet|Wet ________
Remember to enter the values here as well as in the appropriate cells in the weather generator before you click “Calculate”
Trial # wet days # dry days longest string of wet longest string of dry
1
2
3
4
5
6
7
8
9
10
11
12
13
14
15
Averages
Represent your findings by creating two histograms: one for length of longest wet string and one for length of longest dry string.
47
Name _______________________________________________ Date ________ Period ________ Weather Generators
Lesson 5: Homework
Considering the future: How could a change in the water cycle change the day-to-day existence of these organisms? Imagine you are each of the organisms listed below. Based on your current knowledge level of these organisms, predict how a change in the water cycle might affect each. Start by identifying the chief manner in which you believe the organism uses water and then identifying what might happen to the organisms if the quantity of water either increased or decreased. Remember: there is less available water and some areas will get wetter while some will get drier. It is possible that some organisms will benefit from this!
1. A river trout.
2. A coral reef fish.
3. A tree in the rainforest.
4. A cactus in the desert.
5. A cotton farmer.
6. A cattle rancher.
7. A migratory bird.
8. A mosquito.
9. A person living in your hometown who works indoors.
48
Lesson 6: Predicting the Future
Summary: Students use the weather generator again to predict what the future holds. Using output from NCAR models to seed their own weather generator models, students examine data and work to determine how future weather patterns might be different from current patterns. Finally, the module ends with students acknowledging the merits and limitations of model-building.
Objective 1: Run the weather generator with future transition probabilities from NCAR. Summarize the
data using techniques developed in Lesson 5. Objective 2: Compare and contrast the future data with past data. Objective 3: Connect this data to our daily lives. If the weather patterns change for the location the class
investigated, what are the possible repercussion? Objective 4: Discuss the usefulness and limitations of model-building.
Objective 1: Run the weather generator with future transition probabilities from NCAR. Summarize the data using techniques developed in Lesson 5. Up until now we have only explored the implications of transition probabilities from the past. In essence, scientists have taken the actual strings of dry and wet days from the past and produced the transition probabilities based on the actual weather. We will now use the weather generator for what climate scientists more often are interested in: predicting the future. Teaching note: If time permits, you might wish to do a “Think-Pair-Share” here with the driving question, “What does an increase or decrease in a transition probability indicate?” The goal is to reinforce that not all students will see less water/fewer wet days; some will see more water/more wet days. Both of these scenarios indicate that the water cycle is changing. Using the Excel file, The “Future” tab on the weather generator provides another set of transition probabilities. This time, though, rather than using historical data of wet and dry days, scientists have used a predictive climate model to determine what the future transition probabilities will be based on current trends. Scientists continue to collect data every day, and as more data is collected, updated information becomes available. What we are interested in is using these transition probabilities to predict how the overall weather patterns will shift in the future. If you glossed over the information on the origins of these values earlier, you might revisit it now: it’s in the text for Lesson 4. This lesson is now very similar to Lesson 5, except now we are using the transition probabilities from the “Future” tab. There is obviously uncertainty with predicting the future. Just as in lesson 2 we learned how reality is different from predicted probability (remember, if I roll a die six times, I’m not guaranteed to get each number one time). While the weather generator is predictive of the climate we may experience in the future, we don’t expect that any month will actually have a series of wet/dry days exactly like what we are predicting. The whole class will work on one location, with each student being assigned one month – the same month they worked on the period before. This time, collect data for 30 years. The reason we want to
49
collect more data to predict the future than when we were looking at the past is because more data leads to more accurate predictions. The Lesson 6 Classwork Handout provides room for students to record their data, summary statistics and calculated averages. Then, students will create a histogram for the longest wet and dry spells. Objective 2: Compare and contrast the future data with past data. Ask students, “How does the histogram using the “current” transition probabilities of longest wet/dry spells compare to the histogram using “future” transition probabilities? This data can be compared using the Lesson 5 Classwork handout and the Lesson 6 Classwork Handout. Students should look at both where the center of the distribution falls as well as the spread of the data. If time is short, this portion can be assigned as homework since once the students have their data they don’t need the weather generators to move forward. There is space for students to record their thinking on the Lesson 6 Classwork handout. Objective 3: Connect this data to our daily lives. If the weather patterns change for the location the class investigated, what are the possible repercussion? While time will probably not allow a conversation of every month’s results, it is useful to have students report back briefly: is each month going to be wetter, drier, or no change? Then, you can engage a conversation grouping by season: will each season be wetter or drier? What are the implications of this? Example: in Denver, we experience the majority of our moisture in the form of snow that falls in the late winter and spring. This snowpack then melts through the late spring, summer, and fall months and provides the surrounding areas with water. If the weather patterns changed such that winter and spring became drier, we would be faced with a lack of water to fill our reservoirs. This would result in a reduction in available water for drinking and irrigation, and a loss of recreational areas, since we use the reservoirs for boating, fishing, and aquatic recreation. It is useful at this time to have students return to their homework from the night before. You may wish to have students share their responses to the homework scenarios to fully understand how diverse the implications of the water cycle are to different organisms. If students are stumped, encourage them to consider both direct (our own water use) and indirect water needs (manufactured goods and water use of the organisms we eat) for both humans and other organisms. Objective 4: Discuss the usefulness and limitations of model-building. As a wrap up to the module, it is useful for students to have a broader understanding of the role of model-building in answering difficult questions. This will help them transfer their learning in the module to other problems where model-building might be appropriate. Throughout this process, we have addressed probability’s role in climate prediction and used a mathematical model to help us predict the future. It’s useful to deliberately point out to students that they’ve just used a model to simplify and answer a very complex question: “Global Temperatures are rising. What does that mean about precipitation?” Take a few minutes now to allow students to try to answer that question. Help them realize that, no matter what they answer, their answer is much more complete than it was at the beginning of the unit. If you had them record their thinking on the Lesson 1: Classwork sheet it is useful for them to go back
50
and look at their initial response to this question so they can see how their understanding has grown in the last week. In an attempt to help students understand the value of mathematical modeling, try to pry out of them a summary of what we did to answer this question:
We learned basic science and basic math to understand the scope of the problem. (The water cycle and basic probability)
Then we simplified the problem to something manageable. (Instead of trying to learn about all precipitation, we simplified to look at just wet vs dry days)
Next we collected data based on some assumptions (the transition probabilities are valid; that the excel model is appropriate to predict the future reasonably).
We then analyzed that data to understand what it means. (We used strings of wet/dry days to understand what the data meant, and made histograms to see how it changed from past to future).
Last we extrapolated our understandings from data collection in order to actually answer our driving question. (We return to the question at hand with more information and more understanding than we did before. We are able to base an answer to the question on the model).
Point out to students that while this process of simplification, data collection, then extrapolation is useful, it has limitations. Brainstorm with students what the benefits and limitations of model building are: Limitations might include: First, in the process of simplification we may have inadvertently eliminated a variable from the model that plays a role in the process. This oversimplification may have lead us to completely different, inappropriate outcomes. We have no way of knowing for certain how accurate our predictions are until the future arrives. All we can do presently is to continue to collect data that can be used to update and revise the model in the hopes it will become more accurate at predicting the future. Benefits might include: Well, we actually have an answer to the question. The answer is based on data, not opinion. This lends credibility to the results. We were able to quantify questions and problems that are otherwise difficult to work with intellectually.
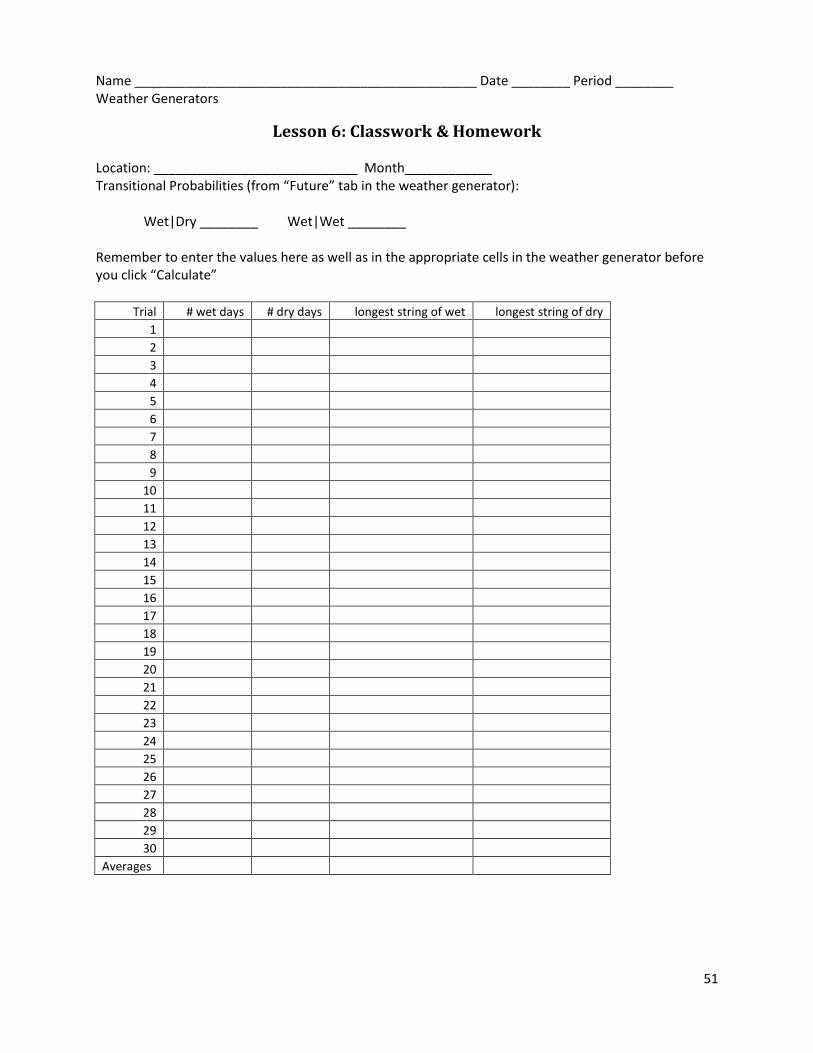
51
Name _______________________________________________ Date ________ Period ________ Weather Generators
Lesson 6: Classwork & Homework Location: ____________________________ Month____________ Transitional Probabilities (from “Future” tab in the weather generator):
Wet|Dry ________ Wet|Wet ________
Remember to enter the values here as well as in the appropriate cells in the weather generator before you click “Calculate”
Trial # wet days # dry days longest string of wet longest string of dry
1
2
3
4
5
6
7
8
9
10
11
12
13
14
15
16
17
18
19
20
21
22
23
24
25
26
27
28
29
30
Averages
52
Represent your findings by creating two histograms: one for length of longest wet string and one for length of longest dry string.
Now, compare the histograms from the “present” data (from Lesson 5 Classwork) with those from the “future” data you just created. What are the differences and similarities? Are the histograms centered in the same place? What does this indicate about the future? This unit’s driving question is: “Global Temperatures are rising. What does this mean about precipitation?” What thoughts do you have on this question now that you have completed the module? If your teacher had you record a response to this question at the beginning of the module, go back and read your original response. How has your understanding of this question changed?

53
Name _______________________________________________ Date ________ Period ________ Weather Generators
Assessment Multiple Choice: Choose the one answer that best addresses the question. 1) Which is true of the water cycle? a) It creates water molecules from air molecules. b) It has no beginning or end. c) It only influences individuals who live near a large body of water. d) It only occurs in labs; never naturally. 2) What powers the water cycle? a) wind b) electricity c) chemical reactions d) the sun 3) Why is the sustainability of water of concern to climate scientists? a) Water is an essential natural resource. b) Variations in precipitation patterns have caused concern.
c) There are gaps in our understanding of how the water cycle could change with increasing global temperatures.
d) All of the above. 4) If you flip a fair coin 10 times and all 10 times you flipped heads, what are the chances the next flip will also be heads?
a) Very slim. The chances of flipping heads 11 times in a row are quite small. b) Very high. You are clearly on a string of heads; there’s no reason to suspect it would change
now. c) 50/50, or 1/2. Each flip is independent of all of the others and since the coin is “fair” each
time you flip it you have equal chances of both heads and tails. d) It’s impossible to predict the future. 5) A student is playing cards at lunch with three friends. There are four aces in the deck and the
deck is dealt until all cards are out. Which of the following is true? a) The student has a 1 in 4 chance of getting each ace in the deck. b) The student is guaranteed to receive an ace each hand since there are four players and four
aces. c) The student will never receive two aces in the same hand since there are four players and
four aces. d) The student has a 1 in 4 chance of receiving multiple aces in each hand since it seems like
someone is always getting stuck with no aces.
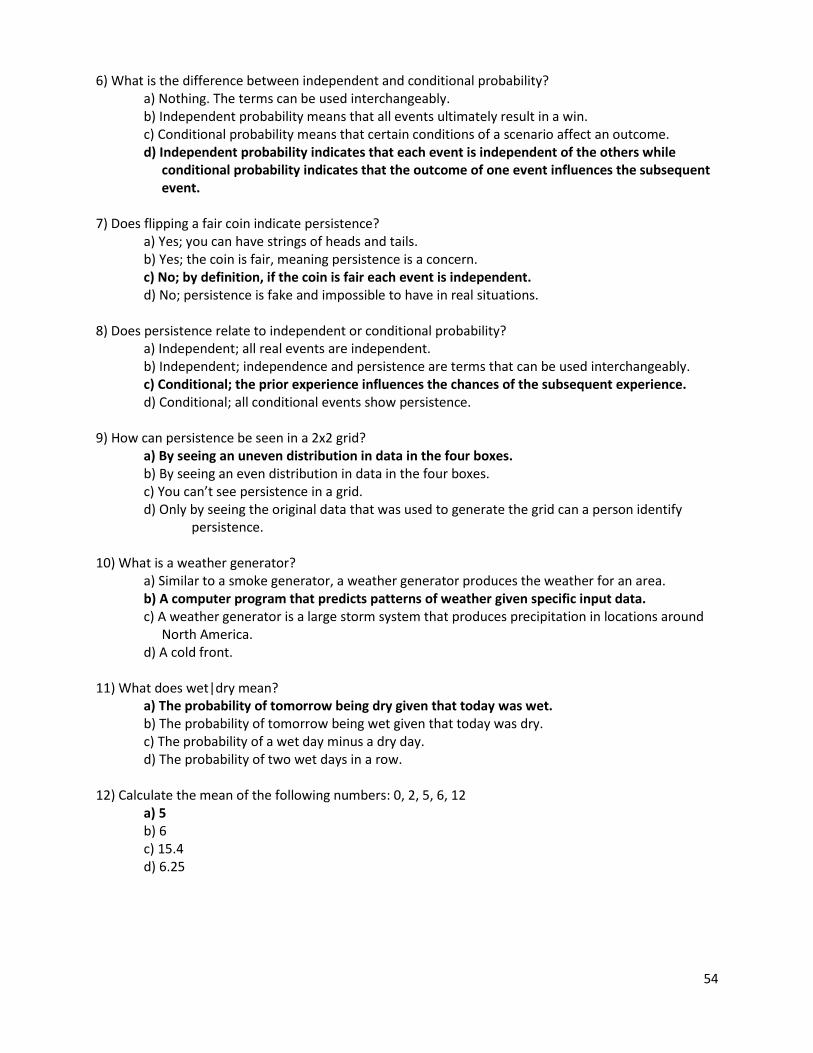
54
6) What is the difference between independent and conditional probability? a) Nothing. The terms can be used interchangeably. b) Independent probability means that all events ultimately result in a win. c) Conditional probability means that certain conditions of a scenario affect an outcome.
d) Independent probability indicates that each event is independent of the others while conditional probability indicates that the outcome of one event influences the subsequent event.
7) Does flipping a fair coin indicate persistence? a) Yes; you can have strings of heads and tails. b) Yes; the coin is fair, meaning persistence is a concern. c) No; by definition, if the coin is fair each event is independent. d) No; persistence is fake and impossible to have in real situations. 8) Does persistence relate to independent or conditional probability? a) Independent; all real events are independent. b) Independent; independence and persistence are terms that can be used interchangeably. c) Conditional; the prior experience influences the chances of the subsequent experience. d) Conditional; all conditional events show persistence. 9) How can persistence be seen in a 2x2 grid? a) By seeing an uneven distribution in data in the four boxes. b) By seeing an even distribution in data in the four boxes. c) You can’t see persistence in a grid.
d) Only by seeing the original data that was used to generate the grid can a person identify persistence.
10) What is a weather generator?
a) Similar to a smoke generator, a weather generator produces the weather for an area. b) A computer program that predicts patterns of weather given specific input data. c) A weather generator is a large storm system that produces precipitation in locations around
North America. d) A cold front.
11) What does wet|dry mean?
a) The probability of tomorrow being dry given that today was wet. b) The probability of tomorrow being wet given that today was dry. c) The probability of a wet day minus a dry day. d) The probability of two wet days in a row.
12) Calculate the mean of the following numbers: 0, 2, 5, 6, 12 a) 5 b) 6 c) 15.4 d) 6.25
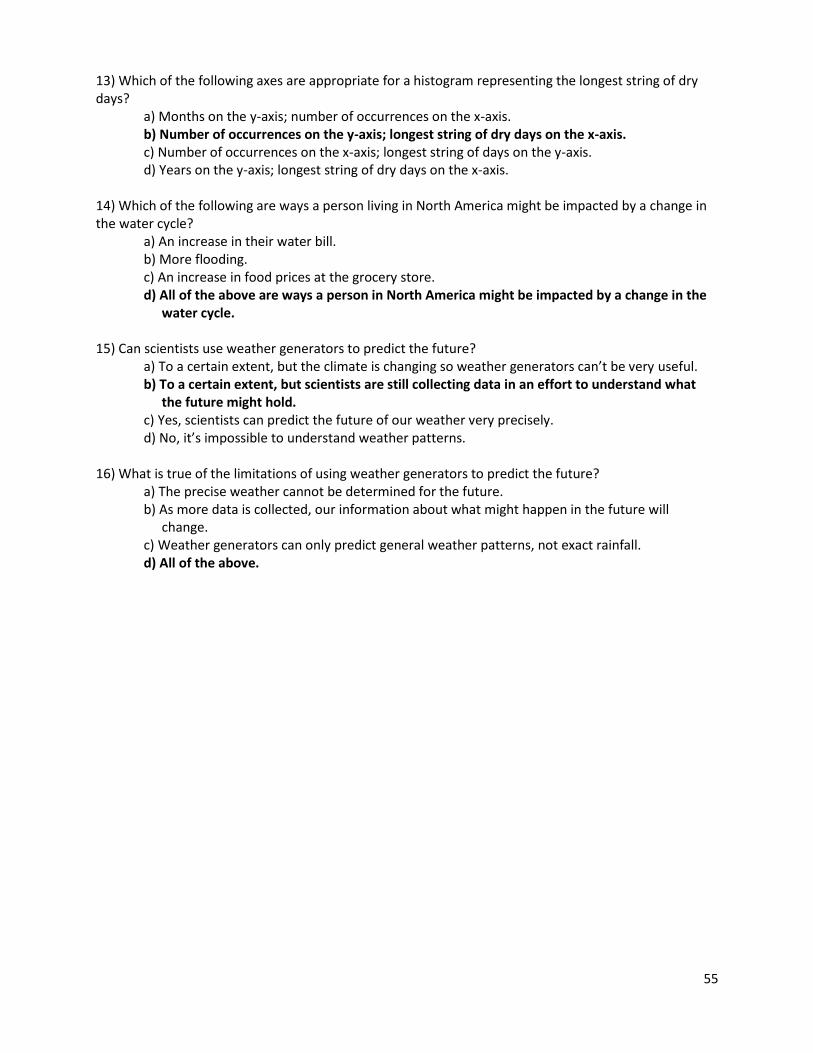
55
13) Which of the following axes are appropriate for a histogram representing the longest string of dry days? a) Months on the y-axis; number of occurrences on the x-axis. b) Number of occurrences on the y-axis; longest string of dry days on the x-axis. c) Number of occurrences on the x-axis; longest string of days on the y-axis. d) Years on the y-axis; longest string of dry days on the x-axis. 14) Which of the following are ways a person living in North America might be impacted by a change in the water cycle? a) An increase in their water bill. b) More flooding. c) An increase in food prices at the grocery store.
d) All of the above are ways a person in North America might be impacted by a change in the water cycle.
15) Can scientists use weather generators to predict the future? a) To a certain extent, but the climate is changing so weather generators can’t be very useful.
b) To a certain extent, but scientists are still collecting data in an effort to understand what the future might hold.
c) Yes, scientists can predict the future of our weather very precisely. d) No, it’s impossible to understand weather patterns. 16) What is true of the limitations of using weather generators to predict the future? a) The precise weather cannot be determined for the future.
b) As more data is collected, our information about what might happen in the future will change.
c) Weather generators can only predict general weather patterns, not exact rainfall. d) All of the above.
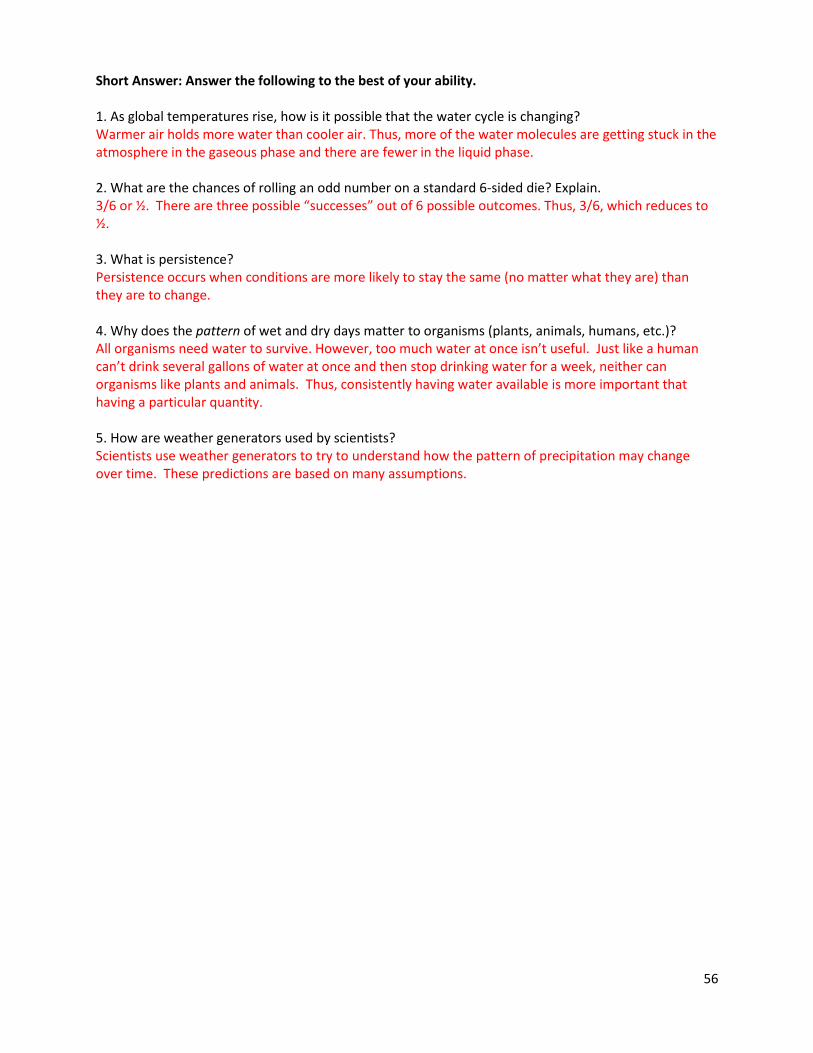
56
Short Answer: Answer the following to the best of your ability. 1. As global temperatures rise, how is it possible that the water cycle is changing? Warmer air holds more water than cooler air. Thus, more of the water molecules are getting stuck in the atmosphere in the gaseous phase and there are fewer in the liquid phase. 2. What are the chances of rolling an odd number on a standard 6-sided die? Explain. 3/6 or ½. There are three possible “successes” out of 6 possible outcomes. Thus, 3/6, which reduces to ½. 3. What is persistence? Persistence occurs when conditions are more likely to stay the same (no matter what they are) than they are to change. 4. Why does the pattern of wet and dry days matter to organisms (plants, animals, humans, etc.)? All organisms need water to survive. However, too much water at once isn’t useful. Just like a human can’t drink several gallons of water at once and then stop drinking water for a week, neither can organisms like plants and animals. Thus, consistently having water available is more important that having a particular quantity. 5. How are weather generators used by scientists? Scientists use weather generators to try to understand how the pattern of precipitation may change over time. These predictions are based on many assumptions.

57
Glossary Condensation – The conversion of gas to liquid. In the case of water, the gas is water vapor. Conditional probability – The probability of an event given that another event has already occurred. Evaporation – The conversion of liquid to gas. Histogram – A graphical display of data. Data is typically grouped into “bins” or ranges and then plotted
as vertical bars. Mean – syn. Average. The sum of the values of a set divided by the number. Median – the middle value in a series of values. Mode – The value that occurs most frequently in a particular data set. Molecule – A group of atoms bonded together. NCAR – National Center for Atmospheric Research Persistence – when data occurs in a way such that each data point is not independent of the previous.
Rather, each data point is somewhat, though not entirely, dependent on the previous data point.
Precipitation – Rain, snow, sleet, or hail that falls from the sky. Salinity – The dissolved salt content of water. Simple probability – The chance, or likelihood, of a particular event occurring. Sustainability – The endurance of systems or processes. Transition Probability – The probability of going from a given state to the next or alternate state. Transpiration – The process of water being absorbed by a plant’s roots, move upward through the
shoots, and evaporate as water vapor from the leaves. Weather generator – Statistical model that aims to predict particular aspects of future weather
conditions.