global trends in online shopping - squarespace · asia pacific usa north america germany world ......
TRANSCRIPT

Global Trends in Online Shopping
Keillen Ndlovu
Head of Listed Property Funds
Implications for Listed Property

2
The Rise of Online Shopping
Source: Google

3
Online Shopping in South Africa
2006 2007 2008 2009 2010 2011 2012 2013 2014 2015 2016
% Growth year-on-year 15.3% 12.4% 11.7% 4.9% 7.0% 9.1% 8.7% 6.7% 7.4% 7.6% 8.2%
On-line as % of total
retail sales0.17% 0.20% 0.23% 0.29% 0.35% 0.41% 0.50% 0.62% 0.76% 0.88% 0.97%
Source: National Treasury, World Wide Worx, Deutsche Securities March 2017

4
Online shopping as a % of total retail sales across the world
Source: Bank of America Merrill Lynch , Euromonitor June 2016
0.0% 2.0% 4.0% 6.0% 8.0% 10.0% 12.0% 14.0% 16.0% 18.0%
ChinaSouth Korea
United KingdomAsia Pacific
USANorth America
GermanyWorld
Western EuropeJapan
FranceAustralia
New ZealandEastern Europe
IndiaRussiaBrazilSpain
ItalyLatin America
CanadaMexico
IndonesiaMiddle East & Africa

5
2016 US Performance by REIT Type
Industrial Outperformed and Malls Underperformed
Source: Deutsche Bank, SNL December 2016
35.0%
30.0%
25.0%
20.0%
15.0%
10.0%
5.0%
0.0%
-5.0%
-10.0
Average
30.6%
27.2%
23.2%
21.6%
17.1%
14.3%
10.7%9.2%
4.9% 4.9%
-4.9%
-7.5%
8.6%

6
Global Online Penetration by Category
0%
5%
10%
15%
20%
25%
30%
35%
Apparel and FootwearSpecialst Retailers
Beauty and PersonalCare Internet Retailing
Electronics andAppliance Specialist
Retailers
Home and GardenSpecialist Retailers
2000
2014
2019E
Source: Bank of America Merrill Lynch , Euromonitor June 2016

7
How Consumers View Internet Versus Physical Shopping for Different Aspects
80.7
73.8
73.1
70.6
67.2
59.2
49.3
29.9
28.9
18.4
18
14.2
6.3
8.1
8.6
14.4
15.9
17.2
33.8
36.9
18.5
44.4
32.1
47.5
0 10 20 30 40 50 60 70 80 90
Easy to compare prices
Price
Range
Convenience
Browsing
Product info
Speed of purchase
Enjoyment
Product quality
Customer service
Trust in Retailer
Refunds
Regular store shopping is better
The internet is better
Source: Bank of Merrill Lynch Real Estate Industry Overview, June 2016

8
Use of Apps to Enhance the Shopping Experience
Source: Wayfair

9
Westfield – One of Largest Retail Landlords Globally Identified 6 Shopper “Tribes” in the UK in 2016
Source: Bank of Merrill Lynch Real Estate Industry Overview, June 2016

10
Move Towards More “Experiential” Retail Means Retailers may Consolidate into Larger Flagship Stores
Source: Westfield Corp October 2016 Presentation
11
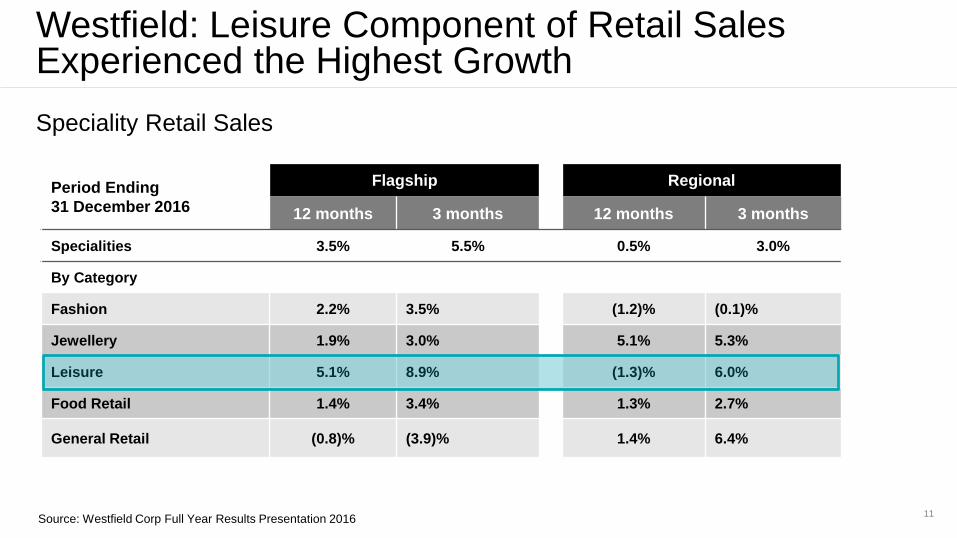
Westfield: Leisure Component of Retail Sales Experienced the Highest Growth
Speciality Retail Sales
Period Ending
31 December 2016
Flagship Regional
12 months 3 months 12 months 3 months
Specialities 3.5% 5.5% 0.5% 3.0%
By Category
Fashion 2.2% 3.5% (1.2)% (0.1)%
Jewellery 1.9% 3.0% 5.1% 5.3%
Leisure 5.1% 8.9% (1.3)% 6.0%
Food Retail 1.4% 3.4% 1.3% 2.7%
General Retail (0.8)% (3.9)% 1.4% 6.4%
Source: Westfield Corp Full Year Results Presentation 2016

12
Unibail: Leisure Component Also Generated the Highest Growth
Source: Unibail Full Year 2016 Results Presentation
Fashion Bags, Footwear
& Accessories
Culture, Media
& Technology
Dining Health & Beauty Entertainment
+0.6%
-1.0%
+0.8%
+4.4%
+5.1%+5.3%

13
Addition of Lifestyle Components to Shopping CentresThis Trend has Started in South Africa
Source: Westfield Corp October 2016 Presentation
14
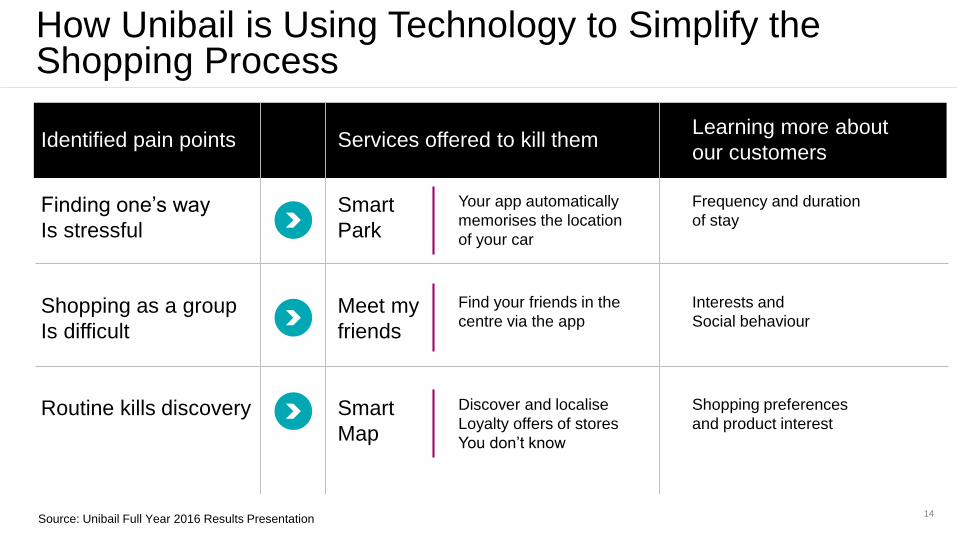
How Unibail is Using Technology to Simplify the Shopping Process
Identified pain points
Source: Unibail Full Year 2016 Results Presentation
Services offered to kill themLearning more about
our customers
Finding one’s way
Is stressful
Shopping as a group
Is difficult
Routine kills discovery
Smart
Park
Meet my
friends
Smart
Map
Your app automatically
memorises the location
of your car
Find your friends in the
centre via the app
Discover and localise
Loyalty offers of stores
You don’t know
Frequency and duration
of stay
Interests and
Social behaviour
Shopping preferences
and product interest

15
Use of Shopping Centre Apps to Target Marketing Material to the Relevant Shopper
Source: CNBC Retail May 2015; Unibail-Rodamco Results Presentation February 2016
Meet My Friends
Smart Map
Smart Park

16
Introducing Electric Car Charging Ports to Parking Lots Attracts consumers and increases centre dwell time
Source: Unibail Full Year 2016 Results Presentation
224electric car
charging stations
4sites with Tesla chargers
20sites targeted in 2017

17
Using Games like Pokemon Go to Attract Footfall Particularly Useful for Attracting Young Adults
Source: Unibail Full Year 2016 Results Presentation
Deploying game features and events in
58 Shopping Centres
Exclusivityin Continental Europe
Footfall
Customer Engagement
Enriching Customer Experience

18
Use of Data Analytics to Fine-Tune Tenant Mix

19
Landlords Taking an Omni-Channel Approach to Enhance the Shopping Centre Experience
Amazon pick up lockers at Drake’s Circus
Shopping Centre in Plymouth (British Land)
Quick check-out handsets at Waitrose, Plymouth
Source: STANLIB Research November 2016

20
Occupancy Rates of Listed Mall Landlords in Key Markets
Source: Bank of Merrill Lynch Research, Company Data, June 2016
100%
90%
80%
70%
60%
50%
2007 2008 2009 2010 2011 2012 2013 2014
Average listed Australia mall operators
Average EU listed mall operators
Average US listed mall operators
Dead mall danger zone

21
Rental Growth for Mall Landlords in Key Markets
0%
1%
2%
3%
4%
5%
6%
7%
Source: Bank of Merrill Lynch Research, Company Data, June 2016

22
Problems Encountered When Buying Online
0% 2% 4% 6% 8% 10% 12% 14% 16% 18%
Speed of delivery slower than indicated
Technical failure of website during ordering or payment
Wrong or damaged goods delivered
Difficulties in finding information on legal rights
Complaints difficult
Final Costs higher than indicated
Foreign retailer did not sell in my country
Fraud
Source: Eurostat 2016

23
Vast Majority of Retail Sales Should Continue to Occur in Stores
Source: Bank of Merrill Lynch Research, Euromointor, Company Data, June 2016
0%
10%
20%
30%
40%
50%
60%
70%
80%
90%
100%
2011 2012 2013 2014 2015 2020E
Online Retail Sales
Brick and Mortar Sales
9.6% 10.2% 11.7% 13.2% 14.9%
24.8%
90.4% 89.8% 88.3% 86.8%
85.1%
75.2%

24
Impact of Drone Delivery on Both Retail and Logistics Properties
Source: Bank of Merrill Lynch Real Estate Industry Overview, June 2016
Amazon Prime in action DHL Packstation with SkyPort and Parcelcopter

Manufacturer
Retailer landscape in the past Retailer landscape now
Importer
Regional Distribution Unit
Local Distribution Unit
Retail Stores
Consumers
Manufacturer Importer
National Distribution Unit
Local Distribution Unit
Retail Stores Consumers
Delivery parcel
(returns)
25
Evolving Retailer LandscapeModern supply chain now consumer facing
Source: LondonMetric 2016

26
US Industrial Vacancies at All-Time Lows
Source: Prologis March 2017
350
250
150
50
(50)
(150)
(250)
U.S.Square Feet, Millions
10
9
8
7
6
5
4
3
2
1
0
%
19
91
19
93
19
95
19
97
19
99
20
01
20
03
20
07
20
09
20
11
20
13
20
15
20
16
20
17
E
20
18
F
Completions (L) Net Absorption (L) Vacancy Rate (R)

27
Prologis (PLD) – Significant Opportunity to Increase Logistics Space
0.000
1.000
2.000
3.000
4.000
5.000
6.000
US Europe China Japan Other PLDRegions
Additional Modern Stock Required Today
Current Modern Stock
Modern Logistics SpaceSquare Feet, Millions
Source: Prologis March 2017

0.0
0.5
1.0
1.5
2.0
2.5
3.0
3.5
4.0
4.5
2010 2011 2012 2013 2014 2015 2016E 2017F 2018F 2019F 2020F
28
Global E-Commerce Sales Projected to Grow by 162% Between 2015 and 2020
Source: Prologis March 2017
14
12
10
8
6
4
2
0
%Modern Logistics SpaceSquare Feet, Millions
E-Commerce Sales (L) E-Commerce as a % of Total Retail Sales (R)

29
Shopping Centres are the Ultimate Multi-Channel destination
Source: Hammerson Plc February 2017
In-Centre
sales 1 2 3
1. In-store multichannelAdditional click and collect sales,
‘in-store online’ channel and net
effect of online returns +10%
2. Retail haloIncremental market share of online
sales catchment +5%
3. Collection kiosksIntegrate pure online retailers
into centre +1-2%
(1)
(2)
(3)
Productivity of the centre extends by
a further 17%

30
STANLIB Global Property Fund
Top Retail and Industrial Property Holdings
Industrial
• US
– Prologis
• UK and Europe
– Prologis
– LondonMetric
– Segro
• Asia
– Prologis
– Global Logistics Properties
• Australia and New Zealand
– Goodman Group
Retail• UK and Europe
– Hammerson
– Unibail Rodamco
– Westfield
• Asia
– CapitaMall Trust
– Hongkong Land
– Wharf Holdings
• Australia and New Zealand
– Scentre Group
– Westfield
• US
– Westfield
– Simon Property Group
– General Growth Properties
Source: STANLIB February 2017

31
STANLIB Global Property Holdings by Property Sector
Retail REITs, 31.30%
Industrial & Office …
Residential REITs, …
Specialty REITs, 13.76%
Real Estate Holding & Development,
5.99%
Diversified REITs, 4.50%
Hotel & Lodging REITs, 1.61%Cash, 1.50%
Source: STANLIB February 2017

Thank You

33
Disclaimer
Collective Investment Schemes (CIS) in Securities are generally medium to long-term investments. An investment in the participations of
a collective investment scheme in securities is not the same as a deposit with a banking institution. The value of participatory interests
may go down as well as up and past performance is not necessarily a guide to the future. CIS are traded at ruling prices and can engage
in borrowing and scrip lending. A schedule of fees and charges and maximum commissions is available on request from STANLIB
Collective Investments (“the Manager”). Commission and incentives may be paid and if so, would be included in the overall costs.
Forward pricing is used. Fluctuations or movements in exchange rates may cause the value of underlying international investments to go
up or down. Liberty is a full member of the Association for Savings & Investment SA (ASISA). The Manager is a member of the Liberty
group of companies.
The information and content of this document are intended to be for information purposes only and STANLIB does not guarantee the
suitability or potential value of any information contained herein. STANLIB Wealth Management Limited does not expressly or by
implication propose that the products or services offered in this document are appropriate to the particular investment objectives or needs
of any existing or prospective client. Potential investors are advised to seek independent advice from an authorised financial adviser in
this regard. STANLIB Wealth Management Limited is an authorised Financial Services Provider in terms of the Financial Advisory and
Intermediary Services Act 37 of 2002 (Licence No. 26/10/590)