global value chains and industrial clusters
Upload: duke-university-center-on-globalization-governance-competitiveness
Post on 19-Jan-2017
291 views
TRANSCRIPT

© 2015 CGGC, Duke University
GLOBAL VALUE CHAINS
AND INDUSTRIAL CLUSTERS
1
Gary GereffiDuke University
October 30, 2016
iBEGIN conference
Fox School of Business, Temple University
Philadelphia, PA

© 2014 Duke CGGC
AGENDA
1. GVCs and Industrial Clusters: Co-evolution of
Knowledge Networks and Economic Upgrading
2. Costa Rica’s High Tech GVCs
– Medical Devices
– Electronics
– Offshore Services
3. Initial Takeaways
© 2014 Duke CGGC
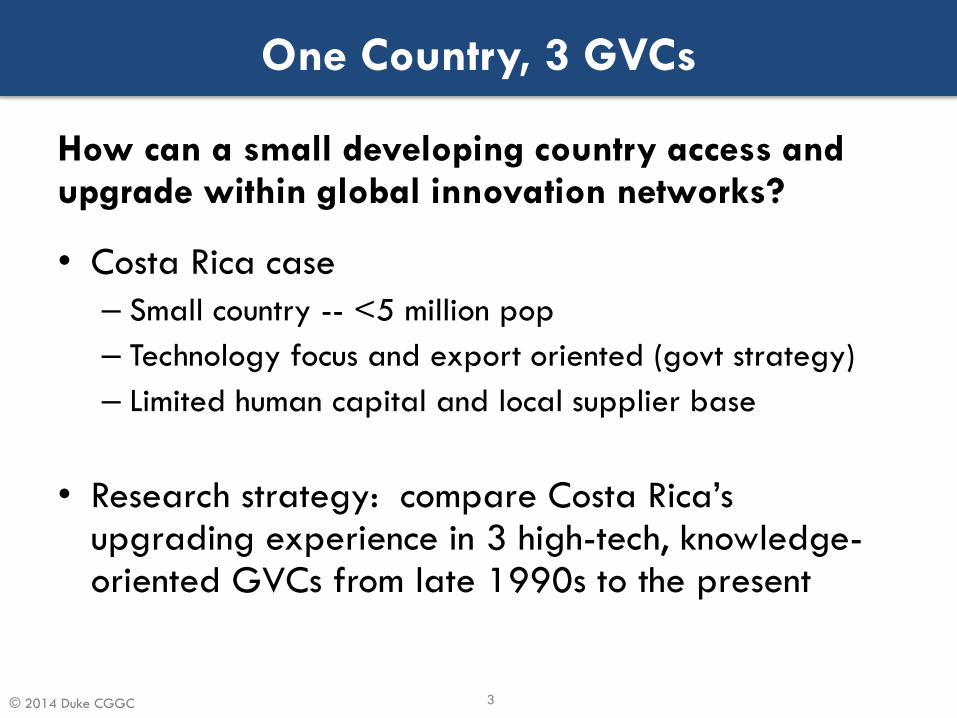
One Country, 3 GVCs
How can a small developing country access and upgrade within global innovation networks?
• Costa Rica case
– Small country -- <5 million pop
– Technology focus and export oriented (govt strategy)
– Limited human capital and local supplier base
• Research strategy: compare Costa Rica’s upgrading experience in 3 high-tech, knowledge-oriented GVCs from late 1990s to the present
3

© 2015 CGGC, Duke University
Components
Manufacturing
Plastics extrusion
& molding
Precision metal
works
Electronics
development
Software
Development
Weaving/Knittin
g Textiles
Assembly
Packaging
Sterilization
Assembly /
ProductionDistribution &
Marketing
Resin Metals
Chemicals Textiles
Input Suppliers
Disposables
US$575.5 millionInstruments
US$270.5 million
Capital Equip.
US$32.5 million
Therapeutics
US$301 million
Main Segments: Exports
Post-Sales
Services
Consulting
Maintenance,
Repair
Training
Research &
Product
Development
Regulatory
Approval
Process
Development
Sustaining
Engineering
Prototype
Local firms are mainly in packaging & support services (12 of 19) versus 4 in limited
role in plastics molding & metal finishing and 1 OEM with exports under $2 million.
Number of Firms
0 - 5
6 - 10
11 - 15
16 - 20
COSTA RICA IN THE MEDICAL DEVICES GLOBAL VALUE CHAIN, 2012
Wholesale
distributors
Individual Patients
Doctors & Nurses
Hospitals
(Public/Private)
4

© 2015 CGGC, Duke University
0
200
400
600
800
1,000
1,20019
98
19
99
20
00
20
01
20
02
20
03
20
04
20
05
20
06
20
07
20
08
20
09
20
10
20
11
Exp
ort
Valu
es (
$U
S M
ilio
n)
Year
Costa Rica's Medical Exports by Product Category: 1998-2011
Disposables Therapeutics Instruments Capital Equipment
EVOLUTION OF MEDICAL DEVICES EXPORTS FROM COSTA RICA,
1998-2011
• Disposables still the largest product category exported, but no longer a
strong growth area.
• Exports in surgical instruments have grown steadily since 2005.
• Therapeutics has become 2nd largest category since 2008; likely to increase
as newly established firms complete transfer of new product lines.
• Limited export of highest value capital equipment (eg. Electronic/software
devices)5
© 2015 CGGC, Duke University
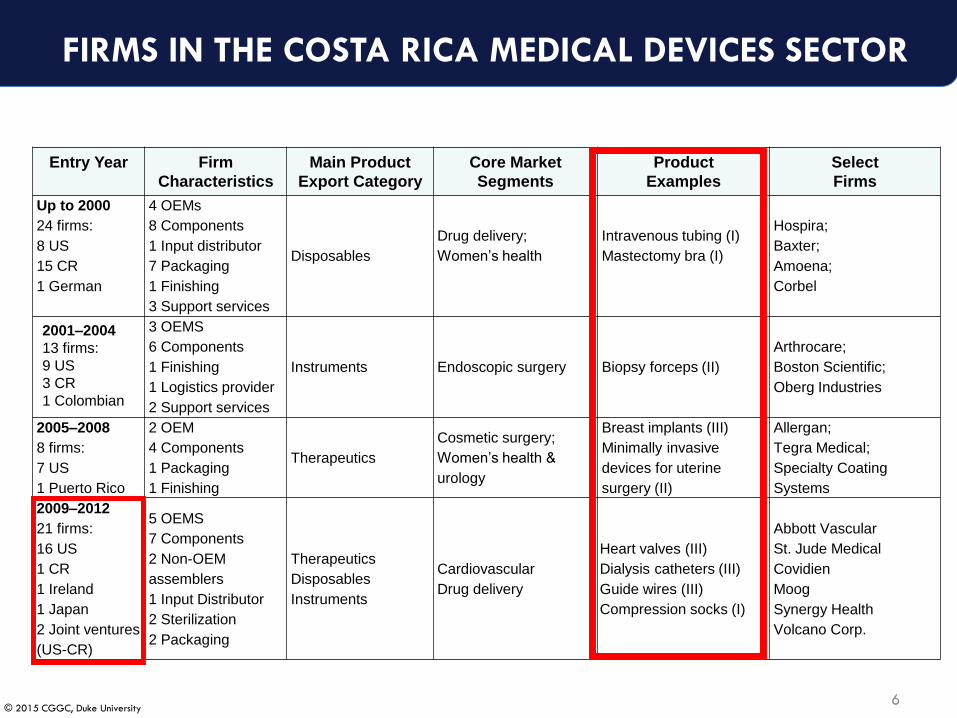
Entry Year Firm
Characteristics
Main Product
Export Category
Core Market
Segments
Product
Examples
Select
Firms
Up to 2000
24 firms:
8 US
15 CR
1 German
4 OEMs
8 Components
1 Input distributor
7 Packaging
1 Finishing
3 Support services
Disposables
Drug delivery;
Women’s health
Intravenous tubing (I)
Mastectomy bra (I)
Hospira;
Baxter;
Amoena;
Corbel
2001–2004
13 firms:
9 US
3 CR
1 Colombian
3 OEMS
6 Components
1 Finishing
1 Logistics provider
2 Support services
Instruments Endoscopic surgery Biopsy forceps (II)
Arthrocare;
Boston Scientific;
Oberg Industries
2005–2008
8 firms:
7 US
1 Puerto Rico
2 OEM
4 Components
1 Packaging
1 Finishing
Therapeutics
Cosmetic surgery;
Women’s health &
urology
Breast implants (III)
Minimally invasive
devices for uterine
surgery (II)
Allergan;
Tegra Medical;
Specialty Coating
Systems
2009–2012
21 firms:
16 US
1 CR
1 Ireland
1 Japan
2 Joint ventures
(US-CR)
5 OEMS
7 Components
2 Non-OEM
assemblers
1 Input Distributor
2 Sterilization
2 Packaging
Therapeutics
Disposables
Instruments
Cardiovascular
Drug delivery
Heart valves (III)
Dialysis catheters (III)
Guide wires (III)
Compression socks (I)
Abbott Vascular
St. Jude Medical
Covidien
Moog
Synergy Health
Volcano Corp.
FIRMS IN THE COSTA RICA MEDICAL DEVICES SECTOR
6

© 2015 CGGC, Duke University© 2015 CGGC, Duke University
UPGRADING SUCCESS:
A LEADING MEDICAL DEVICES MNC
2010
Initial plant reopens after restructuring
• 2004: Manufacturing functions
• 2012: Engineering for process improvements Focused on cardiology segment; strategy – to alleviate R&D costs in the US.
Functional Upgrading
• Biopsy forceps Labor intensive, basic metal works & extrusion.
• Urethral stent Thermoforming, laser marking, coating capabilities.
• Guide Wires Sophisticated Laser cutting & welding.
• Today – CR facilities cover 42 manufacturing processes.
Product & Process Upgrading
• Gastroenterology segment Urology CardiovascularMarket
Diversification
• Recent co-location of sterilization vendors will allow the firm to export directly to global distribution centers
Forward Linkages
2004
First production plant
opens in Costa Rica
(10,000m2)
2008
Second plant opens.
(32,000m2)
First plant restructuring
2005 2011
Exports:
US$18 million
Exports:
US$120 million
7

© 2015 CGGC, Duke University© 2015 CGGC, Duke University
Costa Rica’s Electronics Exports, 2005-2015
8
$1.8
$2.1
$2.5
$2.3
$1.6
$1.9
$2.1
$2.3
$2.6
$0.3
0.0
0.5
1.0
1.5
2.0
2.5
3.0
2005 2006 2007 2008 2009 2010 2011 2012 2013 2015
Exp
ort
Val
ue
($U
S,
Bil
lio
ns)
Integrated Circuts (8542) Computer Parts (8473) Medical Equipment (901819) Other
Intel represented >80% of exportsIntel left CR
during 2014; 88%
decline in exports
(2013-15)

© 2015 CGGC, Duke University
© 2013 Duke CGGC
OFFSHORE SERVICES GLOBAL VALUE CHAIN
Infrastructure
Software
Network Management
Applications Management
Applications Development
Applications Integration
Desktop management
CRM (Customer
Relationship Management)
HRM(Human Resource
Management)
ERM (Enterprise Resource
Management)
Marketing & Sales
Finance & Accounting
Procurement, Logistics and Supply Chain Management
Training
Payroll
Recruiting Contact Centers/Call
Centers
Talent Management
Content/Document
Management
ITO Information Technology Outsourcing
BPOBusiness Process Outsourcing
KPOKnowledge Process Outsourcing
Horizontal ActivitiesVertical Activities a
Industry specific bBanking, Financial
Services and Insurance (BFSI)
Ex. Investment research, private equity research, and risk management
analysis
TelecommunicationsEx. IP transformation,
Interoperability testing and DSP and multimedia
ManufacturingEx. Industrial Engineering and sourcing and vendor
management
Retail eComerce and Planning,
merchandising and demand intelligence
Health/Pharma
Ex. R&D, clinical trials, medical transcript
Others
Travel & Transportation
Revenue management systems, customer loyalty
solutions
Business ConsultingBusiness Analytics
Market IntelligenceLegal Services
EnergyEx. Energy Trading and Risk Management , and Digital
oil field solutions
ERP (Enterprise Resource Planning): manufacturing/operations, supply chain
management, financials & project management
Infrastructure Management
IT Consulting
Software R&D
Va
lue
Ad
de
d
LOW
HIGH
9

© 2015 CGGC, Duke University
COSTA RICA: LEAD OFFSHORE SERVICES COMPANIES
ITOGeneral Business Activities Industry Specific
Activities
Va
lue
Ad
de
d
Broad Spectrum
(ITO, BPO & KPO)
d
Cal
l & C
on
tact
C
en
ters
Cal
l Ce
nte
rs IT
Bac
k O
ffic
e
BPO
KPO
10

© 2015 CGGC, Duke University
COSTA RICA IN THE OFFSHORE SERVICES GVC, 2011
KPO
General Business Activities Industry Specific Activities
Va
lue
Ad
de
d
Broad Spectrum
(ITO, BPO & KPO)
d
$638m
$223m
$186m
$141m
Cal
l& C
on
tact
Ce
nte
rsC
allC
en
ters
ITB
ack
Off
ice
$51m
$66m
$85m
10,472
6,034
BPO
7,753
6,106
792
1,123890
11
ITO
© 2015 CGGC, Duke University
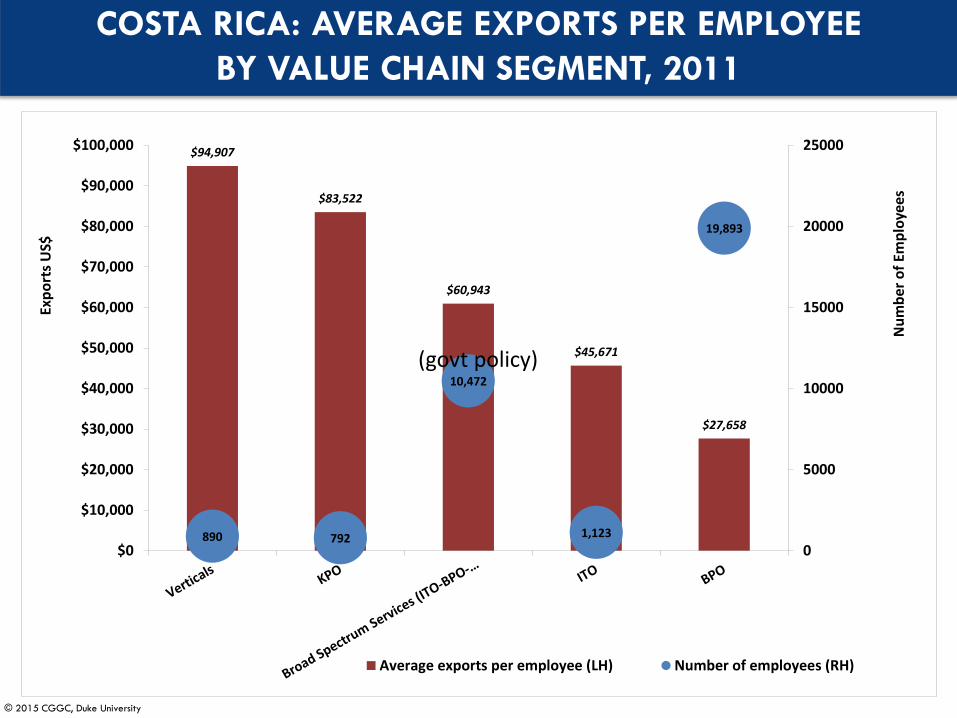
COSTA RICA: AVERAGE EXPORTS PER EMPLOYEE
BY VALUE CHAIN SEGMENT, 2011
$94,907
$83,522
$60,943
$45,671
$27,658
890 792
10,472
1,123
19,893
0
5000
10000
15000
20000
25000
$0
$10,000
$20,000
$30,000
$40,000
$50,000
$60,000
$70,000
$80,000
$90,000
$100,000
Nu
mb
er o
f Em
plo
yees
Exp
ort
s U
S$
Average exports per employee (LH) Number of employees (RH)
(govt policy)
© 2015 CGGC, Duke University
INITIAL TAKEAWAYS
13
• GVC governance structures (role of lead firms) differ significantly across the 3 sectors
• Nature of local “clusters” (supply base) in CR varies in density, ownership and knowledge spillover potential
• GVC lead firm strategies and local clusters co-evolve – global & national factors
• Costa Rica’s state policies matter a lot
• Close relationship between high-value goods & services activities in GVC is critical to upgrading

© 2015 CGGC, Duke University
http://www.cggc.duke.edu
Gary Gereffi
14