global views 12-05-14 - global banking and markets · global views corporate bond ... global...
TRANSCRIPT
Foreign Exchange Strategy Fixed Income Strategy Fixed Income Research Emerging Markets Strategy Portfolio Strategy Economics
Weekly commentary on economic and financial market developments
Global Views
Corporate Bond Research
Contact Us
Global Views is available on scotiabank.com, Bloomberg at SCOT and Reuters at SM1C
December 5, 2014
Key Data Preview A1-A2
Key Indicators A3-A5
Global Auctions Calendar A6
Events Calendar A7
Global Central Bank Watch A8
Forecasts A9
Latest Economic Statistics A10-A11
Latest Financial Statistics A12
Forecasts & Data
This Week’s Featured Chart
Economics
Has The Grand Old Party Gained Both Chambers But Lost Its Leverage? 2-4
Derek Holt
Falling Oil Prices Temper Canadian Growth Expectations 5
Adrienne Warren
Global Economic Realignment Drives A Strong USD Outlook 6
Pablo Bréard and Camilla Sutton
Did Markets Misinterpret The Bank Of Canada? 7
Derek Holt
Tempering The Optimism Around Chinese Policy Action 8-9
Frances Donald
South Korea — Economic Outlook 2015-16 10
Tuuli McCully
Fixed Income Strategy
UK Autumn Statement 11-13
Alan Clarke
European Central Bank December Decision 14-15
Frédéric Prêtet
Foreign Exchange Strategy
Latin America Week Ahead: For The Week Of December 8 - 12 16-17
Eduardo Suárez 0
10
20
30
40
50
60
70
80
09 10 11 12 13 14
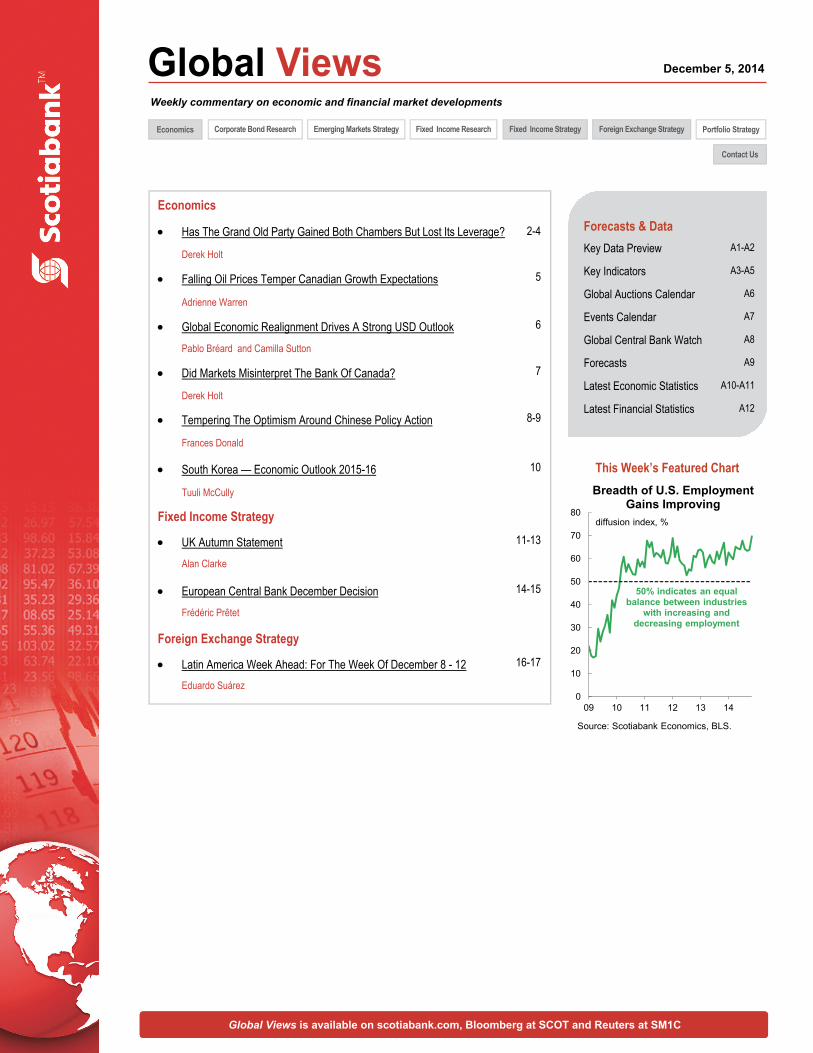
Breadth of U.S. Employment Gains Improving
diffusion index, %
Source: Scotiabank Economics, BLS.
50% indicates an equal balance between industries
with increasing and decreasing employment

Economics
Global Views
December 5, 2014
2
Has The Grand Old Party Gained Both Chambers But Lost Its Leverage?
Please see our full indicator, central bank, auction and event calendars on pp. A3-A8.
US — No Shutdown This Time
Thursday should be the only day next week that poses potentially significant domestic market risk. The first reading of how US retail sales are performing into the holiday season and the deadline for an agreement to extend funding for the US government beyond next Thursday will dominate market attention.
Thursday’s retail sales for November could post a modest gain. New vehicle sales were up by about 5% m/m and the whole auto and parts category carries a one-fifth weight in retail sales. That is comparable to a 10% weight on a 9% drop in seasonally unadjusted regular unleaded gasoline prices from an average of US$3.15 a gallon in October to $2.88 in November. Yes, autos, parts, and gasoline embody the American love for the automobile with a total weighting of about 30% in retail sales. Americans are taking advantage of lower gasoline prices to drive auto sales higher. In fact, November’s seasonally adjusted auto sales print was the second highest monthly tally since 2006 and only behind this past August’s total. Because one of these influences is simply a price effect (lower gasoline prices), it could well be that the volume of sales that flow through to value-added concepts like GDP will be more positive when we get sales volume figures (as opposed to dollar values in the first print) after the November CPI report that lands on December 17th. The question that remains is whether the garage is full but the cupboard is otherwise bare. Is there anything else left to spend after putting lower gasoline prices toward more auto sales? Core retail sales excluding autos and gasoline will be closely watched for signs of breadth. Note, however, that revision risk is always high on the advance retail sales estimate which is based on a small sub-sample of about 4,900 companies drawn from the eventual full retail sales sample of about 12,000 retailers. Chart 1 shows the monthly spread between the initial sales estimate and the final revised estimates and differences of +/-0.5% m/m between the two estimates are common. Therefore, what we understand by way of the first print could turn out to be significantly different on the final estimate. What’s also worth noting is that the National Retail Federation’s estimate of Thanksgiving holiday weekend sales is of little use in predicting holiday spending; it reported an 11% decline this year over last, but did so using a survey of only 4,631 shoppers rather than hard data from retailers and this survey does not track actual holiday spending terribly well.
The US Treasury auctions 3s, 10s and 30s next week and may be doing so into the Thursday deadline for funding the US government. Can the Republican brass keep their troops in line this time and avert another shutdown or last-minute theatrics? The GOP’s House of Representatives Speaker John Boehner has pledged not to set up a government shutdown this time around, but he wasn’t much able to control the fringe within the GOP in the lead-up to last October’s shutdown. A difference now, however, is that the ‘tea party’ elements appear to be relatively quiet and willing to put up a fight not on broad funding issues but narrower matters into the new year. The Republicans have just proposed extending funding until next September for most of the government except for the branch that controls immigration policy that they are willing to fund only until March. I highly doubt we’ll get another government shutdown. Republicans did well in the recent Congressional elections and will take control of both chambers next month, but they suffered in the polls and likely don’t want to run greater
Derek Holt (416) 863-7707 [email protected]
THE WEEK AHEAD
-12
-10
-8
-6
-4
-2
0
2
4
00 02 04 06 08 10 12 14
Massive U.S. Fiscal Improvement
% of nominal GDP
U.S. Treasury Federal Budget Surplus / Deficit
Source: Scotiabank Economics, U.S. Treasury.
-1.0
-0.5
0.0
0.5
1.0
1.5
2.0
08 09 10 11 12 13 14
Retail Sales Are Subject To Big Revisions
current - initial m/m % change estimate
U.S. Retail Sales
Source: Scotiabank Economics, U.S. Census Bureau.
Chart 1
Chart 2

Economics
Global Views
December 5, 2014
3
… continued from previous page
risk heading into the 2016 Presidential elections. In any event, it’s not clear that fiscal uncertainty mattered much to Treasury yields even when deficit funding needs were greater. Nevertheless, given the vast improvement in the fiscal position of the US federal government from a deficit-to-GDP ratio of about 10% at its worst point to under 3% today (chart 2), the sensitivities concerning what happens to fiscal shenanigans in Washington are less acute. We’re at the point where fiscal policy is neutral to growth risks versus having shaved over 1.5 percentage points off of last year’s economic growth and so the worst of the fiscal policy risks may be behind the US economy until, well, they may ramp up again! That may arise when unfunded social security obligations start to mount into the next decade at the same time that the Fed’s SOMA portfolio of Treasury holdings starts to roll down beginning in 2016. For now, however, fiscal repair has resulted in a loss of leverage for the GOP in one sense, even though it is likely to flex its muscle with majorities in the Senate and House next year on matters like approving Presidential appointment nominees.
The Federal Reserve will slip into its black-out period on Tuesday and ahead of the FOMC meeting on December 16-17. So far only Atlanta Fed President Dennis Lockhart (alternate 2014, voting 2015) is scheduled to speak just ahead of the black-out. He will address the economic outlook and monetary policy on Monday including audience Q&A and press coverage.
Tertiary data risk will be posed by the JOLTS job vacancies reading on Tuesday, the Federal Reserve’s flow of funds accounts of the US economy including household net worth figures, and the University of Michigan consumer sentiment gauge on Friday.
Asia — Declaring War On The Yen
A wave of Chinese macro updates and expected upward revisions to Japanese GDP will have Asian markets playing an active role in determining the global market tone next week. In addition, currency wars may be a renewed theme when the Bank of Korea meets, but as chart 3 shows, the sharp drop in the yen since summer is posing significant risk to the trade competitiveness and capital flows across a number of Japan’s neighbours. At the top of the list of currencies that have appreciated versus the yen over this period is China’s renminbi that is up by about one-fifth (same as the rise in the USD versus the yen given the loose RMB peg). The won is posting the softest gain versus the yen among Asian crosses and yet, when combined with some concern that its corporate darlings may be more pressured on growth in key product lines, it is sparking considerable concern over the Korean economy’s outlook.
Partly because business investment appears to have performed better than initially estimated, Japan’s economy will likely fare better than initially estimated. The first estimate for Q3 GDP growth showed a 1.6% annualized contraction over Q2 and tossed Japan back into recession following the prior quarter’s 7.3% annualized retreat. The revision into the Monday Asian market open is expected to shrink the pace of Q3 contraction to an annualized 0.5%.
Markets will be keenly watching for signs of bottoming Chinese economic growth when the country releases key macro updates next week. Export growth, CPI inflation, data on company financings, retail sales, and industrial production will be focal points. Consensus expects most of these readings to stabilize but with potential upsides to financing data and slightly weaker industrial output.
Four regional central banks release policy decisions including the RBNZ, Bank of Korea, Bank Indonesia and Bangko Sentral ng Pilipinas. Only the Bank of Korea is thought to be a possibility for a 25bps cut in its seven day repo rate from 2% according to a minority of forecasters. Having just been to Seoul to speak with our accounts as part of a two-week sweep through Asia, the concern over spillover effects from Abenomics and BoJ policies was
Derek Holt (416) 863-7707 [email protected]
THE WEEK AHEAD
0 5 10 15 20
South Korean Won
Malaysian Ringgit
Singapore Dollar
Taiwanese Dollar
Indonesian Rupiah
Indian Rupee
Philippine Peso
Thai Baht
Hong Kong Dollar
Chinese Renminbi
Source: Scotiabank Economics, Bloomberg.
% change since July 1st, 2014
Japan Is Rattling its Neighbours
Chart 3
Economics
Global Views
December 5, 2014
4
… continued from previous page
emphasized. Ditto in Bangkok, Jakarta, and Malaysia that were also parts of the trip and that have also witnessed sizeable currency gains versus the yen. The yen’s slide to 120 to the USD from just over 100 a few months ago has coincided with a 9% appreciation in the won versus the yen. That is prompting concerns that Japan is cannibalizing its neighbours’ export sectors and the BoK may counteract such effects by more overt attempts to weaken the won.
Jobs data from the commodity-oriented countries like Australia and Canada have been volatile and difficult for financial markets to take without a grain of salt. Australia releases another jobs print on Wednesday. The pattern has oscillated between a loss of 24,000 in September to gains of about 25,000 in each of October and July.
Other regional releases will include exports from India and Philippines, as well as India’s inflation rate and industrial production.
Canada — All Quiet
Canada should be quiet and generally follow the global market tone next week. Data risk will be light, earnings season will be largely done with the banks releasing their results this week, and event risk should be low.
Two Bank of Canada events hosted by Governor Poloz may post some risk following the BoC’s recent dovish rate statement. On Wednesday, Bank of Canada Governor Stephen Poloz and his Senior Deputy Governor Carolyn Wilkins will hold a press conference on the Financial System Review — their assessment of the risks facing the stability of the Canadian financial industry. The focus may be upon elaborating on why the BoC mentioned in its recent statement that “Household imbalances, meanwhile, present a significant risk to financial stability.” Canada continues to lack a truly credible economy-wide measure of the household debt service burden, in my view, and that may be revisited. The next day, Poloz goes to New York to speak at the Economic Club of NY and will then hold a press conference. He’s likely to take the message that, contrary to the OECD’s forecast, he is nowhere close to raising interest rates. Our view remains that the central bank will be on hold throughout at least all of next year.
Following strength in September’s volume of housing permits, we could see housing starts rebound on Monday particularly in the multiples category. Unfortunately we’ll only get October’s building permits on the same day as November’s housing starts, so we have little to go by in making the call.
Provincial bond watchers may have an eye on BC Premier Christy Clark’s speech on Monday. Her topic is “British Columbia’s Promise: Building A Strong Economy As Canada’s Pacific Gateway.” This comes at a time of caution regarding the BC economy’s outlook as a depreciated currency and improving prospects for the US economy insulate against some of the risks governing the highly inflated Vancouver housing market, a sharp drop in some commodity prices, and potential knock-on effects on BC government finances as Moody’s has the province’s AAA rating under negative outlook. Scotiabank Economics expects BC economic growth to bottom this year at 2.1% and to modestly accelerate to the 2.7-2.8% range over the next two years.
Canada auctions 30 year real return bonds on Wednesday.
Europe — Eyes Abroad
With central banks and the A-list for data risk out of the way, we’re left with the B-list next week as European markets are more likely to be affected by developments abroad in China and the US. At the top of that list will be how Germany’s exports are performing which will also serve the purpose of indicating how the broader economy is evolving following no growth for the past two quarters that followed earlier optimism that the Eurozone was turning a corner.
Norway’s Norges Bank and the Swiss National Bank issue policy decisions. Modest data risk may be posed by updates for French CPI that previously came in at 0.5% y/y and may push lower thanks to the drop in global oil prices; industrial output in the UK, Germany, Italy and France; as well as trade figures out of France and the UK.
Derek Holt (416) 863-7707 [email protected]
THE WEEK AHEAD
Economics
Global Views
December 5, 2014
5
Falling Oil Prices Temper Canadian Growth Expectations
We have lowered our forecast of Canadian GDP growth for 2015 and 2016 to 2.3% and 2.0%, respectively (from our prior forecast of 2.5% and 2.4%) to reflect the impact of lower oil prices on energy-sector investment. Outside of the energy sector, domestic demand and export sales are expected to remain reasonably buoyant, supported by low interest rates, lower pump prices for consumers, strengthening U.S. demand and a more competitive currency. Key implications for the economy are summarized below.
A limited near-term production impact. Barring a move in WTI crude oil prices below US$70/bbl for a sustained period, current cost structures suggest only a modest reduction in oil production by 2016. Longer-term, however, production may be more substantially affected if lower prices lead to a more marked pullback in investment in the sector.
A more muted business investment recovery. Rising non-energy exports and tightening capacity utilization rates should support a gradual pickup in business plant and equipment investment in 2015-16. At the same time, however, lower oil prices are expected to reduce energy sector drilling and capital investment, especially among smaller producers, and potentially impact longer-term production capacity.
Rising non-oil exports. Lower oil prices will exert further downward pressure on the Canadian dollar, bolstering Canada’s export competitiveness and reducing import competition. Reinforced by strengthening U.S. demand, we anticipate a further narrowing in Canada’s real net export deficit in 2015-16. Roughly 83% of Canada’s goods & services export receipts are made up of non-oil exports.
Weaker terms-of-trade. The transmission of lower energy export prices to Canada’s terms-of-trade should be fairly quick, and will be reinforced by higher import costs from a weaker Canadian dollar. The deterioration in the terms-of-trade will partially offset the improvement in net export volumes, and is expected to push the merchandise trade balance back into deficit in 2015-16 after returning to a modest surplus this year.
Increased household purchasing power. A sustained 10% drop in the retail price of gasoline would generate $4.5 billion in annual household savings that could be allocated to other spending, savings or paying down debt. While there could be some offsetting impact on household finances from slower employment and income gains, consumers on average should still come out on top.
Reduced operating costs for many businesses. Lower energy prices should benefit many businesses outside of the oil sector that use energy fairly intensely, including manufacturers and a wide range of service providers. Among small businesses, high energy costs consistently rank as one of the most significant production constraints.
Slower profit growth. Profit growth is expected to slow to the mid-single digits next year from nearly 10% in 2014. While profitability will slump in the oil & gas sector, the falloff will be cushioned by improvement in the manufacturing and service sectors, which account for more than two-thirds of non-financial corporate profits.
Shifting sectoral growth patterns. Housing and retail activity will benefit from the ultra-low interest rate environment that should persist amid more moderate growth and low inflation. Manufacturing should benefit from the combination of lower energy costs and a weaker Canadian dollar. Transportation, hospitality and household/personal services industries also are relatively energy intensive.
A narrowing in regional growth disparities. Lower energy prices and a weaker Canadian dollar will shift growth momentum away from resource-rich regions, primarily in the West, toward the more manufacturing-centric provinces in Central Canada. For Alberta, we have tempered our still-strong forecast for auto sales and housing starts to reflect some slowing in employment and income growth, and in net interprovincial migration.
Lower inflation. We estimate that falling gasoline and fuel oil prices will shave about 0.4 percentage points from headline inflation in 2015, to an average of 1.6%. While there should be some passthrough of lower oil prices to core inflation, primarily in service-based components, this may be largely offset by the inflationary impact of a weaker Canadian dollar on a range of imported retail products, from clothing to appliances.
Adrienne Warren (416) 866-4315 [email protected]
GLOBAL FORECAST UPDATE

Economics
Global Views
December 5, 2014
6
Global Economic Realignment Drives A Strong USD Outlook
Volatility in global foreign exchange markets continues to escalate, fuelled by intensifying price wars amongst global oil producers. Ongoing evidence of softening activity in systemically relevant high-income economies (Japan and Europe) and developing countries (Russia and Brazil) instils a renewed sense of caution into investment decisions. The sharp collapse in crude oil prices, falling 35% from the June high to the end of November, was mainly supply driven and therefore not mimicked across commodity markets; yet it sends disruptive shock waves to commodity-sensitive currencies.
The US dollar (USD) is widely expected to appreciate in 2015. Third quarter US real GDP growth came in at 3.9% q/q annualized, outpacing the bulk of the advanced economies and marking the second quarter of robust gains; this supports our expectation that the Federal Reserve (Fed) will hike interest rates in the second quarter of 2015. In addition, strong US equity markets coupled with low global bond yields have supported investment inflows into the US. This fundamental backdrop coupled with positive sentiment support ongoing strength in the USD.
Within the Americas, the Canadian dollar (CAD) is vulnerable to a broadly stronger USD and lower crude oil prices. Accordingly, we have revised our forecast, expecting the currency to trend lower in 2015 and 2016. From its lows, the CAD may recover some of the value lost as the Canadian economy will benefit from the structural dependence on the growing US economy. A similar trading pattern may occur with the Mexican peso (MXN), with an upside potential from sizable capital inflows associated with the process of structural reforms in CAPEX-sensitive economic sectors.
Post-election policy action in Brazil will dominate near-term investor attention in the universe of floating currencies in Latin America, and the Brazilian real (BRL) may regain a weakening bias. We expect a higher interest rate environment in Brazil in response to a central bank more concerned about the inflationary impact of potential capital outflows and normalization of administered prices. Energy-sensitive currencies in Latin America, the MXN and the Colombian peso (COP), may begin to feel the negative economic impact of declining oil-related fiscal revenue, to be somewhat compounded by the beginning of Fed tightening in 2015. Both the Peruvian (PEN) and Chilean (CLP) currencies will be impacted by global metal prices and US dollarization dynamics in the Americas.
The euro (EUR) will maintain a depreciating trend over the next six months. A slow and vulnerable economic recovery combined with disinflationary pressures is expected to see the European Central Bank (ECB) maintain an accommodative policy stance. The British pound (GBP), which steadily weakened on the back of broad-based USD strength and delays in the tightening cycle, may enter a stability phase in the near term. The Russian ruble (RUB) continues to weaken, adversely affected by escalating capital outflows which are estimated to reach US$130 billion in 2014. Deteriorating political, financial and economic conditions in Russia, despite ongoing efforts to liberalize exchange rate policies, may weigh on other top-tier emerging-market currencies in Latin America and Asia.
The Asian currency environment also reflects a less benign global economic and financial market context. The Japanese yen (JPY) is poised to extend its existing depreciating trend, injecting a competitive boost to its ailing economy. However, JPY depreciation risks triggering competitive currency re-alignments in the Asia/Pacific region, particularly affecting our view on the South Korean won (KRW) and the Taiwanese dollar (TWD). Recent action by the Bank of Japan, combined with Prime Minister Abe’s call for a snap election has forced a downward revision to our forecast. The Chinese yuan (CNY), which gained 2.4% versus the USD in the five months ending in October, entered a temporary weakening phase in November. China’s surprise interest-rate cut, pressure from depreciation in the EUR and JPY, coupled with persistent concerns regarding the level of indebtedness have triggered a more bearish tone regarding the country’s growth prospects. Finally, the Australian dollar (AUD), which regained a downward trend as a result of commodity price weakness and concerns about Chinese growth prospects, may also reach a stabilization plateau in the months to come.
Camilla Sutton (416) 866-5470 [email protected]
Pablo Bréard (416) 862-3876 [email protected]
FOREIGN EXCHANGE
Economics / Foreign Exchange Strategy
Economics
Global Views
December 5, 2014
7
Did Markets Misinterpret The Bank Of Canada?
The Canadian dollar briefly rallied and the front-end cheapened even though the Bank of Canada signaled perhaps greater downside risk to inflation. Much of this was due to US-centered developments, but the added risk is that the markets didn’t put enough emphasis upon the BoC’s incrementally more dovish bias.
The Bank of Canada issued a somewhat confusing policy statement that spent much of the time applauding how the economy got to where it is now and factors that may be good for global growth, and then took it back in what we think was greater conviction that inflation risks are pointed somewhat lower than previously forecast going forward. Markets at least temporarily weighted the first part of this argument by putting a bid to CAD and driving short-term interest rates a little higher but the more patient trade over time has this interpretation misplaced in our view. The key lies in how to interpret the last paragraph of the rate statement, and that risk is geared toward perhaps the BoC revising its inflation outlook downward even more than its prior forecast in October.
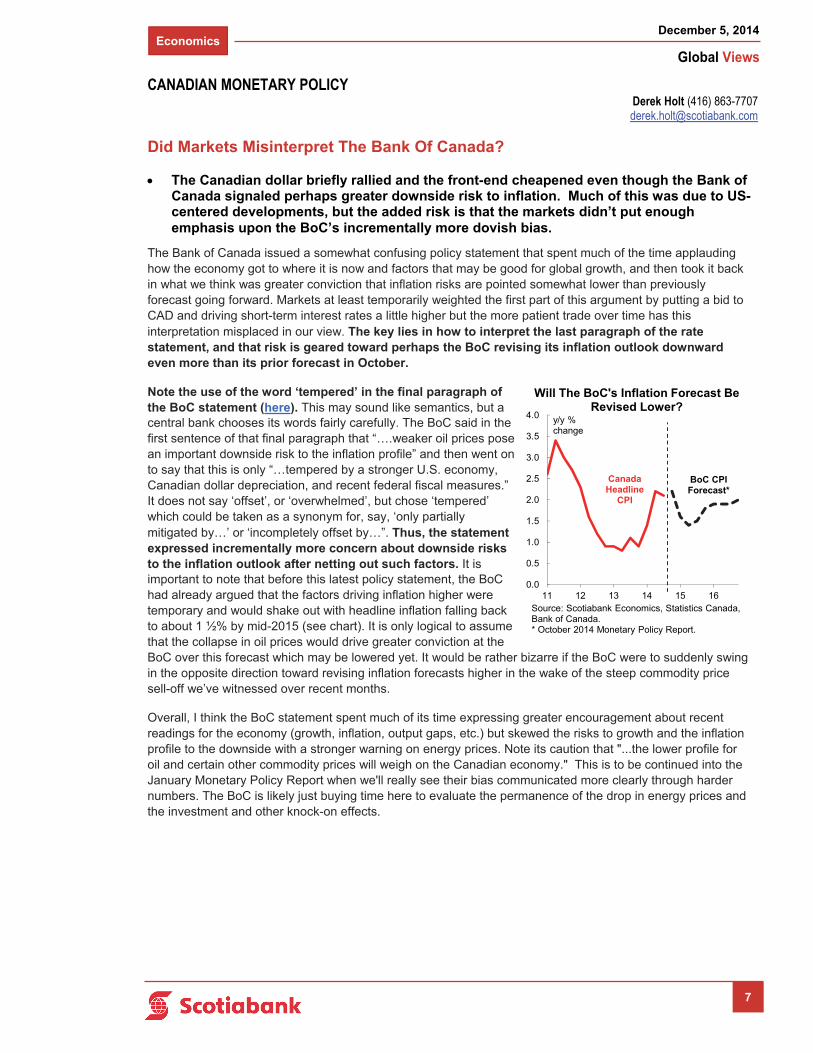
Note the use of the word ‘tempered’ in the final paragraph of the BoC statement (here). This may sound like semantics, but a central bank chooses its words fairly carefully. The BoC said in the first sentence of that final paragraph that “….weaker oil prices pose an important downside risk to the inflation profile” and then went on to say that this is only “…tempered by a stronger U.S. economy, Canadian dollar depreciation, and recent federal fiscal measures.” It does not say ‘offset’, or ‘overwhelmed’, but chose ‘tempered’ which could be taken as a synonym for, say, ‘only partially mitigated by…’ or ‘incompletely offset by…”. Thus, the statement expressed incrementally more concern about downside risks to the inflation outlook after netting out such factors. It is important to note that before this latest policy statement, the BoC had already argued that the factors driving inflation higher were temporary and would shake out with headline inflation falling back to about 1 ½% by mid-2015 (see chart). It is only logical to assume that the collapse in oil prices would drive greater conviction at the BoC over this forecast which may be lowered yet. It would be rather bizarre if the BoC were to suddenly swing in the opposite direction toward revising inflation forecasts higher in the wake of the steep commodity price sell-off we’ve witnessed over recent months.
Overall, I think the BoC statement spent much of its time expressing greater encouragement about recent readings for the economy (growth, inflation, output gaps, etc.) but skewed the risks to growth and the inflation profile to the downside with a stronger warning on energy prices. Note its caution that "...the lower profile for oil and certain other commodity prices will weigh on the Canadian economy." This is to be continued into the January Monetary Policy Report when we'll really see their bias communicated more clearly through harder numbers. The BoC is likely just buying time here to evaluate the permanence of the drop in energy prices and the investment and other knock-on effects.
Derek Holt (416) 863-7707 [email protected]
CANADIAN MONETARY POLICY
0.0
0.5
1.0
1.5
2.0
2.5
3.0
3.5
4.0
11 12 13 14 15 16
Will The BoC's Inflation Forecast Be Revised Lower?
y/y % change
CanadaHeadline
CPI
Source: Scotiabank Economics, Statistics Canada, Bank of Canada.* October 2014 Monetary Policy Report.
BoC CPI Forecast*
Economics
Global Views
December 5, 2014
8
Tempering The Optimism Around Chinese Policy Action
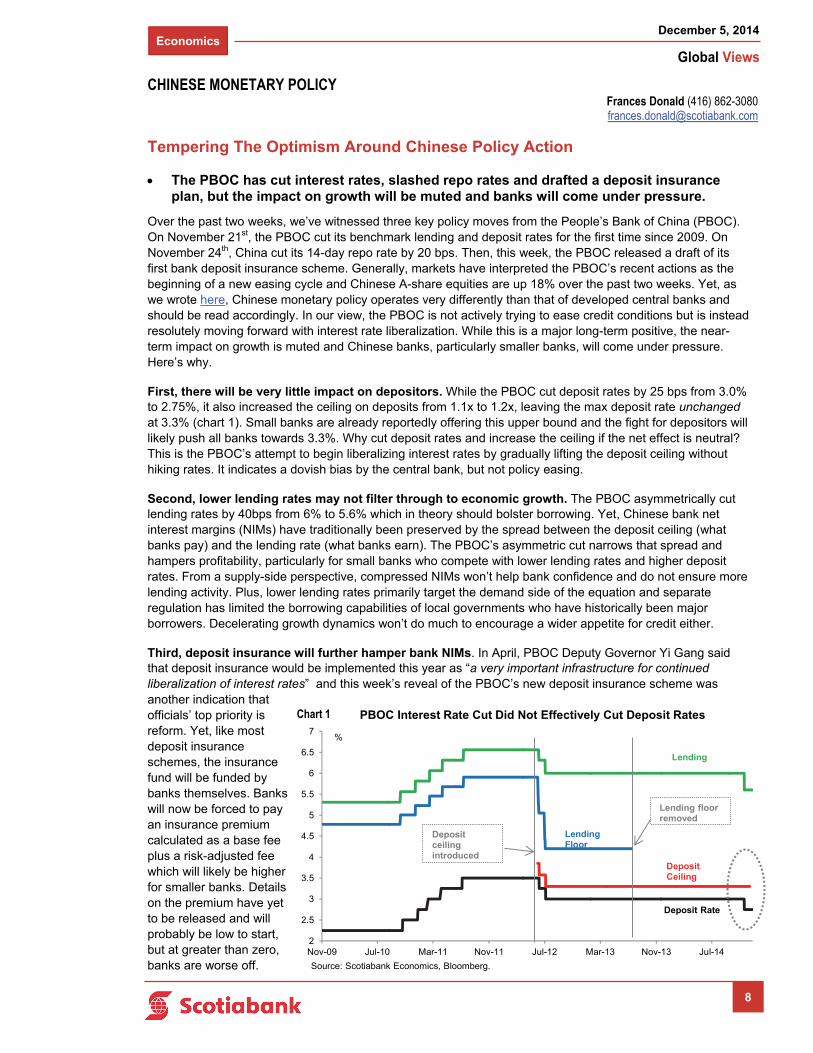
The PBOC has cut interest rates, slashed repo rates and drafted a deposit insurance plan, but the impact on growth will be muted and banks will come under pressure.
Over the past two weeks, we’ve witnessed three key policy moves from the People’s Bank of China (PBOC). On November 21st, the PBOC cut its benchmark lending and deposit rates for the first time since 2009. On November 24th, China cut its 14-day repo rate by 20 bps. Then, this week, the PBOC released a draft of its first bank deposit insurance scheme. Generally, markets have interpreted the PBOC’s recent actions as the beginning of a new easing cycle and Chinese A-share equities are up 18% over the past two weeks. Yet, as we wrote here, Chinese monetary policy operates very differently than that of developed central banks and should be read accordingly. In our view, the PBOC is not actively trying to ease credit conditions but is instead resolutely moving forward with interest rate liberalization. While this is a major long-term positive, the near-term impact on growth is muted and Chinese banks, particularly smaller banks, will come under pressure. Here’s why.
First, there will be very little impact on depositors. While the PBOC cut deposit rates by 25 bps from 3.0% to 2.75%, it also increased the ceiling on deposits from 1.1x to 1.2x, leaving the max deposit rate unchanged at 3.3% (chart 1). Small banks are already reportedly offering this upper bound and the fight for depositors will likely push all banks towards 3.3%. Why cut deposit rates and increase the ceiling if the net effect is neutral? This is the PBOC’s attempt to begin liberalizing interest rates by gradually lifting the deposit ceiling without hiking rates. It indicates a dovish bias by the central bank, but not policy easing.
Second, lower lending rates may not filter through to economic growth. The PBOC asymmetrically cut lending rates by 40bps from 6% to 5.6% which in theory should bolster borrowing. Yet, Chinese bank net interest margins (NIMs) have traditionally been preserved by the spread between the deposit ceiling (what banks pay) and the lending rate (what banks earn). The PBOC’s asymmetric cut narrows that spread and hampers profitability, particularly for small banks who compete with lower lending rates and higher deposit rates. From a supply-side perspective, compressed NIMs won’t help bank confidence and do not ensure more lending activity. Plus, lower lending rates primarily target the demand side of the equation and separate regulation has limited the borrowing capabilities of local governments who have historically been major borrowers. Decelerating growth dynamics won’t do much to encourage a wider appetite for credit either.
Third, deposit insurance will further hamper bank NIMs. In April, PBOC Deputy Governor Yi Gang said that deposit insurance would be implemented this year as “a very important infrastructure for continued liberalization of interest rates” and this week’s reveal of the PBOC’s new deposit insurance scheme was another indication that officials’ top priority is reform. Yet, like most deposit insurance schemes, the insurance fund will be funded by banks themselves. Banks will now be forced to pay an insurance premium calculated as a base fee plus a risk-adjusted fee which will likely be higher for smaller banks. Details on the premium have yet to be released and will probably be low to start, but at greater than zero, banks are worse off.
Frances Donald (416) 862-3080 [email protected]
CHINESE MONETARY POLICY
2
2.5
3
3.5
4
4.5
5
5.5
6
6.5
7
Nov-09 Jul-10 Mar-11 Nov-11 Jul-12 Mar-13 Nov-13 Jul-14
Source: Scotiabank Economics, Bloomberg.
Lending
Lending Floor
DepositCeiling
Deposit Rate
PBOC Interest Rate Cut Did Not Effectively Cut Deposit Rates
Depositceiling introduced
Lending floor removed
%
Chart 1
Economics
Global Views
December 5, 2014
9
… continued from previous page
Fourth, deposit insurance will hurt confidence in the banking system. In most countries, deposit insurance should instill faith in a banking system. Yet, in China, up until very recently, all financial products including shadow banking products, corporate bonds and bank deposits carried the same implicit guarantee. By implementing deposit insurance, officials are signaling that this implicit guarantee is weaker or no longer present and that some banks and/or products will be allowed to fail. Effectively, formal deposit insurance weakens assurances in the financial system. A flight to larger/safer banks is a high probability outcome, another strike against small banks.
Fifth, the shadow banking sector will be pressured. Deposit insurance will help to align risk-reward dynamics in China and help to unwind the shadow banking buildup. Previously, wealth management products carried as much as double-digit returns while deposits paid just 3.3% yet carried the same implicit guarantee. Naturally, money flowed towards higher-paying products which held equal (zero) risk. The implementation of deposit insurance concurrent with the beginning of permitted financial product failures should encourage funds to flow away from shadow banking and towards safer deposits. That’s a strong structural positive but it will also imply less liquidity within these products, potentially leading to accelerated defaults.
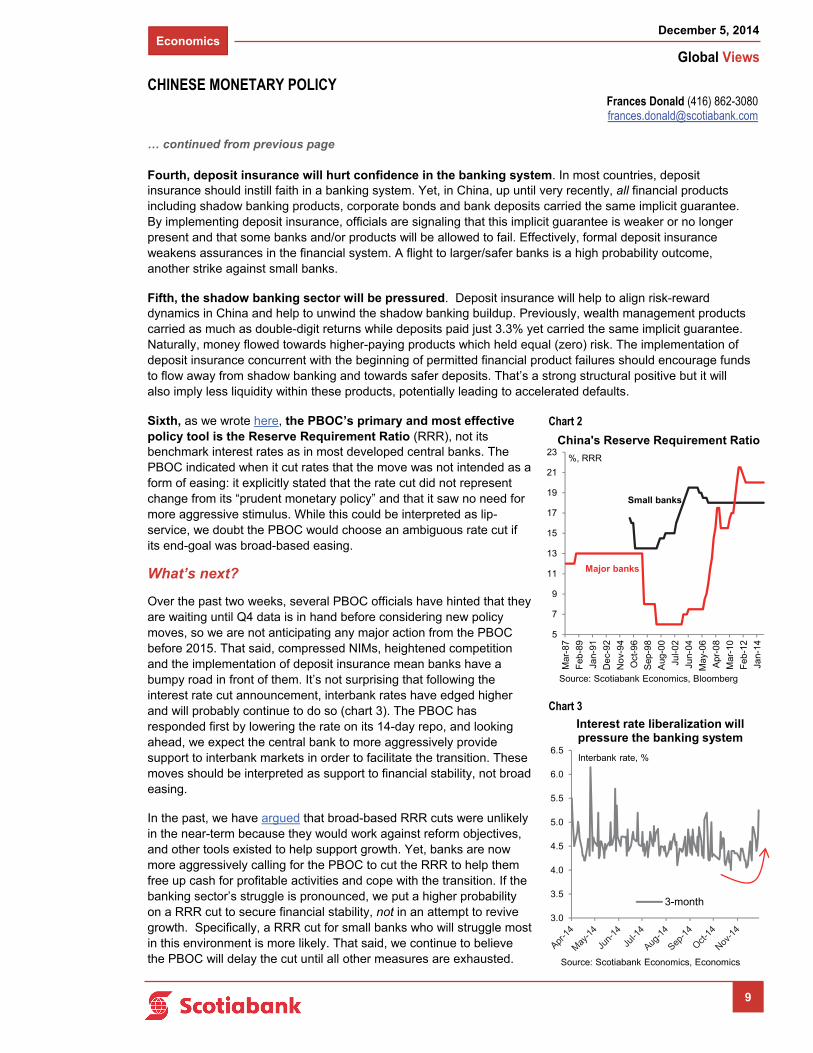
Sixth, as we wrote here, the PBOC’s primary and most effective policy tool is the Reserve Requirement Ratio (RRR), not its benchmark interest rates as in most developed central banks. The PBOC indicated when it cut rates that the move was not intended as a form of easing: it explicitly stated that the rate cut did not represent change from its “prudent monetary policy” and that it saw no need for more aggressive stimulus. While this could be interpreted as lip-service, we doubt the PBOC would choose an ambiguous rate cut if its end-goal was broad-based easing.
What’s next?
Over the past two weeks, several PBOC officials have hinted that they are waiting until Q4 data is in hand before considering new policy moves, so we are not anticipating any major action from the PBOC before 2015. That said, compressed NIMs, heightened competition and the implementation of deposit insurance mean banks have a bumpy road in front of them. It’s not surprising that following the interest rate cut announcement, interbank rates have edged higher and will probably continue to do so (chart 3). The PBOC has responded first by lowering the rate on its 14-day repo, and looking ahead, we expect the central bank to more aggressively provide support to interbank markets in order to facilitate the transition. These moves should be interpreted as support to financial stability, not broad easing.
In the past, we have argued that broad-based RRR cuts were unlikely in the near-term because they would work against reform objectives, and other tools existed to help support growth. Yet, banks are now more aggressively calling for the PBOC to cut the RRR to help them free up cash for profitable activities and cope with the transition. If the banking sector’s struggle is pronounced, we put a higher probability on a RRR cut to secure financial stability, not in an attempt to revive growth. Specifically, a RRR cut for small banks who will struggle most in this environment is more likely. That said, we continue to believe the PBOC will delay the cut until all other measures are exhausted.
Frances Donald (416) 862-3080 [email protected]
Chart 3
3.0
3.5
4.0
4.5
5.0
5.5
6.0
6.5
3-month
Source: Scotiabank Economics, Economics
Interbank rate, %
Interest rate liberalization will pressure the banking system
5
7
9
11
13
15
17
19
21
23
Mar
-87
Feb
-89
Jan-
91
De
c-9
2
No
v-9
4
Oct
-96
Sep
-98
Aug
-00
Jul-0
2
Jun-
04
May
-06
Apr
-08
Mar
-10
Feb
-12
Jan-
14
Source: Scotiabank Economics, Bloomberg
%, RRR
China's Reserve Requirement Ratio
Small banks
Major banks
CHINESE MONETARY POLICY
Chart 2
Chart 3

Economics
Global Views
December 5, 2014
10
South Korea — Economic Outlook 2015-16
South Korean economic prospects are supported by strong fundamentals.
South Korean economic momentum remains intact. Real GDP increased by 0.9% q/q in the third quarter of 2014 compared with a 0.5% q/q gain in the prior three months. We expect the nation’s annual output growth to average 3.5% in 2014-15, followed by a modest pickup to 3.8% in 2016. Net exports will underpin activity; indeed, external sector prospects are highly significant for South Korea as exports of goods and services are equivalent to almost 60% of GDP. China’s economic performance is particularly relevant since the country purchases a quarter of South Korean shipments abroad. The government’s fiscal stimulus measures will support domestic demand, particularly consumer and business spending. Meanwhile, improving employment conditions and solid consumer confidence will further buttress household spending prospects.
South Korean inflation remains low with consumer prices rising by 1.0% y/y in November — well below the Bank of Korea’s (BoK) target corridor of 2½-3½%. Negative producer price inflation together with low energy prices indicate that significant upside pressure on consumer prices will remain absent in the coming months. We expect prices to remain below the central bank’s target range through 2015, followed by a gradual pickup towards 3% y/y by the end of 2016 as the economy’s output gap diminishes. The BoK has lowered the benchmark interest rate by 50 basis points since August to 2.0% in order to support domestic demand. The central bank will likely refrain from easing monetary policy further in the coming months due to a relatively high household debt burden.
The South Korean won (KRW) is facing depreciating pressure vis-à-vis the US dollar, alongside the weakening Japanese yen (JPY). The recent substantial JPY depreciation makes competing Japanese products comparatively cheaper in world markets, but this co-movement is offsetting some of the adverse impact felt by South Korean exporters. The BoK will continue to monitor external risks, particularly the effect of Japanese monetary policy, and stands ready to manage the KRW accordingly. We expect the currency to close 2014 and 2015 at 1120 and 1170 per US dollar, respectively.
South Korea enjoys a solid twin-surplus position. Public sector finances remain healthy with small fiscal surpluses — based on the International Monetary Fund definition of a general government net lending ratio — likely to be recorded through 2016. To support growth domestically, the government maintains an expansionary fiscal policy stance. South Korea’s general government gross debt will hover around 35% of GDP through 2016, comparing favourably with an advanced economy average of 105%. Meanwhile, constructive trade dynamics are reflected in the country’s external accounts. Accordingly, South Korea will record sizeable current account surpluses through 2016, averaging 6% of GDP.
Tuuli McCully (416) 863-2859 [email protected]
ASIA
0.0
0.5
1.0
1.5
2.0
2.5
10 11 12 13 14
Real GDP Growth
% change, q/q s.a.
Source: Scotiabank Economics, Bank of Korea.* 2014 Q4 forecast
*
0
1
2
3
4
5
0
1
2
3
4
5
10 11 12 13 14
Inflation and Benchmark Interest Rate
Source: Scotiabank Economics, Korea National Statiscal Office.
% change, y/y
CPI(LHS)
Bank of Korea Policy Rate
(RHS)
%
0
1
2
3
4
5
6
7
10 11 12 13 14f 15f 16f
Current Account
Fiscal Account
Twin-Surplus Position
% of GDP
Source: Scotiabank Economics, IMF - WEO Oct2014.
Fixed Income Strategy
Global Views
December 5, 2014
11
UK Autumn Statement
Stamp of Approval
Chancellor George Osborne stuck to his tried and tested Budget speech format — leaving the best news until last. As ever, most of the key policy decisions were leaked or announced ahead of time. This included extra spending on roads, the National Health Service and for GPs. Funding for these will come from banks as well as the windfall from lower-than-expected inflation and lower interest on government borrowing. In his grand finale, Osborne announced a surprise boost for the vast majority of home movers by overhauling the stamp duty system. This is probably good for growth and is politically astute since it is a more populist alternative to the unpopular mansion tax proposal from the opposition Labour party. The Chancellor resisted a broader pre-election splurge; the overall stance of the policy measures was a slight tightening. Net borrowing was revised up, but by less than most had assumed.
If in doubt — give housing a shot of adrenaline
The biggest headline-grabbing measure was the reform of stamp duty. This was tactically astute on a number of levels. We believe that the biggest game-changer during this parliament was the Help to Buy Scheme. The boom in housing that resulted was a major catalyst for stronger consumer confidence and willingness to spend. In turn, the recovery in growth was undoubtedly heavily influenced by this policy.
However, the sugar rush is starting to wear off; there have been clear signs that the housing market is starting to top out. Given the rolling over in the RICS survey (the best upstream indicator of house prices), it was looking like the mood on the housing market may look somewhat downbeat by the time of next May’s General Election.
That was the case before the Chancellor injected the latest shot of adrenaline into the housing market via the reform of stamp duty. The Chancellor suggested that 98% of home movers will be better off under the new scheme. Meanwhile the top 2% of households will pay even more in tax. Our assumption is that this will, at the very least, give the housing market a softer landing, and more likely fuel a mini growth spurt through next year.
A first glance, someone will only benefit from this policy if they actually buy or sell a property. However, the experience of the last couple of years has shown that if households believe that their housing wealth has improved, then they will be more confident and more inclined to keep spending.
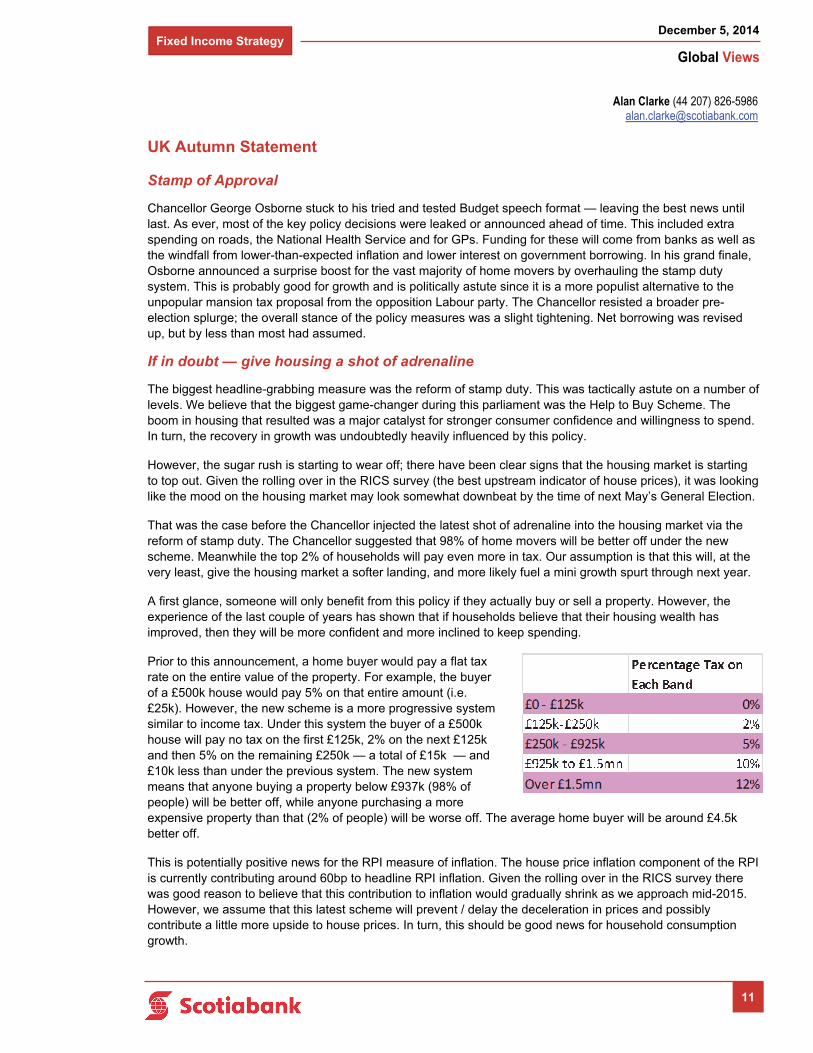
Prior to this announcement, a home buyer would pay a flat tax rate on the entire value of the property. For example, the buyer of a £500k house would pay 5% on that entire amount (i.e. £25k). However, the new scheme is a more progressive system similar to income tax. Under this system the buyer of a £500k house will pay no tax on the first £125k, 2% on the next £125k and then 5% on the remaining £250k — a total of £15k — and £10k less than under the previous system. The new system means that anyone buying a property below £937k (98% of people) will be better off, while anyone purchasing a more expensive property than that (2% of people) will be worse off. The average home buyer will be around £4.5k better off.
This is potentially positive news for the RPI measure of inflation. The house price inflation component of the RPI is currently contributing around 60bp to headline RPI inflation. Given the rolling over in the RICS survey there was good reason to believe that this contribution to inflation would gradually shrink as we approach mid-2015. However, we assume that this latest scheme will prevent / delay the deceleration in prices and possibly contribute a little more upside to house prices. In turn, this should be good news for household consumption growth.
Alan Clarke (44 207) 826-5986 [email protected]

Fixed Income Strategy
Global Views
December 5, 2014
12
… continued from previous page
Economic Projections
The Chancellor / Office for Budget Responsibility (OBR) revised up the growth projection for 2014 and 2015, but revised the profile down thereafter. Despite the upward revision to growth for 2015, the OBR’s growth projection for next year remains ½% lower than the Bank of England projection of 2.9% y/y (Table 1). The BoE forecasts seem to be outliers (partly because they assume upward revisions to the back-data), whereas the OBR forecasts were more in line with our own forecast and that of the consensus.
The OBR forecast for inflation during 2015 is particularly low, standing at 1.2% y/y on average (down from 2.0% y/y previously). Our own call is a touch higher than that at 1.4% y/y.
Updated Borrowing Projections
The Public Sector Net Borrowing (PSNB) estimate for the current fiscal year was revised up, though by less than most (including ourselves) had expected. The full year estimate was pushed up by GBP5bn to GBP91.3bn (Table 2). That was a smaller revision than the GBP10bn that had been expected. Given the dire start to the financial year, this estimate implies an abrupt improvement over the remainder of the year. In order to hit this target, the PSNB needs to go from an average GBP500mn per month deterioration over the first half of the year to a GBP2bn per month improvement over the remainder of the year. Part of that might be a last-minute flurry of income tax receipts when income tax self-assessments get filed early in the New Year. Nonetheless, the borrowing target looks ambitious.
Key Discretionary Measures
Stamp duty aside, the most substantial discretionary policy measures were:
A further increase in the personal income tax allowance from next year (to GBP10.6k)…
…with the threshold also raised for higher rate taxpayers.
Alan Clarke (44 207) 826-5986 [email protected]
Table 1: Updated GDP Growth Projections
Table 1a: Updated Inflation Projections
Table 2: Updated PSNB Projections

Fixed Income Strategy
Global Views
December 5, 2014
13
… continued from previous page
A new 25% tax on UK activity of international multinationals that have been avoiding tax by shifting profits outside of the UK.
Restricting the retrospective losses that banks can use to offset their future profits and hence their tax liability.
The proceeds of fines related to the foreign exchange market will be used to pay for investment in GP doctor services.
Gilt Remit
Another surprise outcome of the Autumn Statement was the reduction in the financing requirement — contrary to expectations of an increase. Rather like the PSNB, the CGNCR (the cash requirement) is running higher than expected so far this year. The updated remit implies a spectacular turnaround during the remainder of the fiscal year to hit a full year figure of GBP102.3bn down from GBP107.2bn. On top of this, there was a near GBP10bn financing adjustment which reduced the financing requirement. Last but not least, the redemption of War Loan pushes up the redemption figure by around GBP2bn.
The overall result is that gilt issuance is reduced by GBP1.3bn (via reduced mini tenders) during this financial year, with the remaining GBP5.5bn reduction being absorbed by lower T-bill issuance.
Further ahead, one striking aspect of the updated Debt Management Office (DMO) remit is the huge amount of gilt redemptions over the next 5 years or so. The level of redemptions rises from GBP70bn in 2015-16 up to GBP93bn in 2019-20. That is just the starting point for gauging the likely volume of gilt issuance and is pretty much set in stone. Indicatively, the cash requirement for that year, reflecting new funding not just refinancing, is roughly flat, but recent slippage suggests that this figure is more likely to be revised up rather than down (Table 3).
Alarmists might suggest that since the BoE may be unwinding QE at this stage, the mass of supply of gilts could lead to an almighty surge in yields. However, it would take a substantial overshoot in the cash requirement (a GBP50-70bn overshoot to be precise) just to get the overall financing requirement up to the levels that we will see in the next financial year. Our view is that this is an amber warning light rather than anything more sinister.
Conclusion
This was the unofficial start to the General Election campaign. Although he is still well and truly strapped into his financial straightjacket with limited room for manoeuvre, Osborne managed to tick all the boxes:
Addressing tax avoidance among multinational corporations;
Moderate restrictions on benefits to migrants;
A relatively inexpensive housing market package that helps the average household, but hurts the rich;
Moderate spending increases…
…partly paid for by a raid on banks.
All this with the added credibility that the projections are underwritten by the independent Office for Budget Responsibility. Much rests in the hands of the housing market now.
Alan Clarke (44 207) 826-5986 [email protected]
Table 3: Indicative Financing Requirement for Future Years

Fixed Income Strategy
Global Views
December 5, 2014
14
European Central Bank December Decision
No concrete action was announced by the European Central Bank (ECB) following its policy meeting on December 4th, which was somewhat disappointing for market participants, but not unexpected. Nevertheless, the tone of the press release was “meaningful” to paraphrase the ECB President, Mario Draghi. What did we learn?:
First: Early next year, the ECB will likely take further action. The ECB President hinted that this is unlikely to be as soon as its next meeting in January, which has bolstered expectations for further policy action, probably in March. Indeed, starting from next year, monetary policy decisions will now be made on a six-week cycle, with the next meeting scheduled on January 22nd followed by March 5th.
Second: The ECB President stated that the decision to embark on a full-scale quantitative easing (QE) program, which could include sovereign bonds, does not have to be unanimous. Mr. Draghi highlighted that he believes a program could be designed to have consensus, but that the ECB’s utmost priority is to pursue its mandate of price stability and won’t allow prolonged deviations to result in unwanted monetary tightening. In fact, he acknowledged that the change in the wording of the introductory statement was not a unified decision. The ECB’s now “intended” (and no longer “expected”) willingness to expand its balance sheet to early-2012 levels further emphasizes how determined Draghi is in employing the stimulus required to firmly anchor medium- to long-term inflation expectations in line with achieving below, but close to, 2% inflation despite any objections from, say, the Bundesbank.
So, the probability of a full-blown QE has, in our view, clearly increased. Both President Draghi and Vice-President, Vítor Constâncio, indicated that no decision has been made yet on the pace, size or composition of any additional asset-purchasing program, but will be announced in the coming months after a more careful assessment by ECB staff. Nonetheless, the tone suggested that the President has already made up his mind on buying sovereign bonds. Indeed, Mr. Draghi spent a significant proportion of the press conference justifying a possible move by, for example, disconnecting the OMT from QE. In particular, the former should be seen as a response to addressing the tail risk on the euro caused by the debt crisis, which justified some reciprocal action from the states affected (i.e. budget constraint). Meanwhile, the latter is linked to the need to meet the ECB’s price stability mandate. In this regard, the final words of the press conference were assertive; the ECB President indicated that “…we are convinced that a QE programme, which could include sovereign bonds, falls within our mandate, or better, is an eligible instrument that we could use in the pursuit of our mandate. Not to pursue our mandate would be illegal.”
So why wait? Particularly, given the fact that the ECB just “significantly” downgraded both its growth and inflation projections, and highlighted that these forecasts are at risk of further downward revisions! The ECB President pointed to two triggers:
First, the oil price shock clearly blurs the macroeconomic outlook. While Mr. Draghi pointed to these “significant” downward revisions, he also recognised that the full impact of the fall in oil prices was not fully reflected in its outlook — with the sharp decline over the past few weeks not incorporated due to the cut-off date for the projections.
So, in a way, he seemed to suggest that the new forecasts had already been overshadowed by recent events and that the March meeting would be more important.
Frédéric Prêtet (00 33) 17037-7705 [email protected]

Fixed Income Strategy
Global Views
December 5, 2014
15
… continued from previous page
Second, there is the willingness to wait until ECB staff can better assess how successful the current policy measures (TLTRO, and asset-backed securities and covered bond purchases) announced in June and September are in expanding the ECB’s balance sheet and easing financial market conditions. In that sense, next week’s second TLTRO allotment will be closely watched but, in view of the lower growth than expected, the ECB President seems to have already lowered his expectations on December’s take-up.
All in all, postponing a decision on full-blown QE until March came as a bit of a disappointment and pushed the EUR higher. A lot can change in three months’ time, especially oil prices which contributed to the “wait and see” approach of the ECB today. Our view is that upcoming data releases should be a mixed bag: we expect y/y inflation to be close to zero or in negative territory at the turn of the year while, on the other hand, business sentiment could start to gradually improve on the back of this drop in oil prices as well as the euro. At the end of the day, how inflation expectations (2Y in 2Y or 5Y in 5Y inflation swaps) react will be an important driver, however, the ECB President seems to have already prepared the groundwork for additional unconventional monetary accommodation in the coming months.
Frédéric Prêtet (00 33) 17037-7705 [email protected]
Foreign Exchange Strategy
Global Views
December 5, 2014
16
Latin America Week Ahead: For The Week Of December 8 - 12
Today’s non-farm payrolls data was interesting due to its implications for the outlook for US monetary policy, as will next week’s release of the US’ labour conditions index. In addition, next week is relatively shallow in terms of US data, but is packed with LATAM central bank tier-1 releases, including MPC meetings, and minutes releases. With LATAM central bank policy diverging (Brazil tightening, and debate ongoing about whether Peru, or Mexico have easing in the pipeline), it will be important to track next week’s releases. On the FX front, the widespread rise of the USD, and the sharp drop in oil prices remain major drivers, and our bias is that its prudent to expect continued weakness in LATAM currencies.
Week-ahead views:
Brazil: The BCB delivered the +50bps hike that the DI rates were pricing in, confirming the previously signaled bias towards front loading the tightening cycle in order to establish the credibility / orthodoxy of the new economic team early on, as well as seeking to reduce the overall size of the tightening needed. The statement said that taking into account the cumulative effects of monetary policy, among other factors (fiscal adjustments??), additional adjustments to monetary policy by the COPOM will be done “parsimoniously”. We thus take this statement as “dovish”, given the acceleration to +50bps was already fully priced, but the signal by the BCB that further rate hikes will be delivered cautiously suggests that the additional tightening markets had priced in may be overdone. This should put downward pressure on both the BRL, and DI rates. However, given the brief statement did not provide much additional colour, next week’s COPOM meeting minutes will be closely watched.
Chile: Today’s nominal wage data from Chile could make the BCCh’s job relatively more difficult, as the +6.9% increase in y/y terms showed a continued acceleration in wage increases (from +6.5% y/y last month), and could be a signal that expectations are being marginally contaminated. We think this means that the BCCh will likely remain somewhat cautious, which is likely to narrow the possibility of additional rate cuts in the near term, despite the faltering economy. This view seems to be fairly widely held, with the Bloomberg consensus not containing any analysts who look for a rate move next week, which is also our view. In terms of CLP, after having broken north of 600, the USD/CLP cross has stabilized in a 600– 620 range for now, which still put it at levels we had not seen since the 2009 crisis.
Colombia: Next week’s main event is likely to be the release of BanRep’s MPC meeting minutes. On the monetary policy front, our sense is that the central bank is now in “neutral territory”, and we expect the minutes to confirm this view. Down the line, we see risks that the drop in oil prices, as well as the weakening of COP, will dampen the country’s growth, and put the central bank back in easing mode later on, although the Fed’s policy stance shift is a risk that could derail this prospect. For the coming few months, we expect BanRep to signal a pause. What we will be more interested in, is the central bank’s views on the peso. FinMin Cardenas has signaled that he views the peso as fairly valued at this level, and seemed relatively comfortable with the depreciation. It will be interesting to see if that view is widely held by the central bank, as well as whether some concerns are present over the speed with which the adjustment has taken place.
Mexico: Today, Banxico left rates unchanged as was fairly widely expected by markets / analysts, although there were some calls for a cut. Some arguments for defending a cut down the line (as well as those who argued for a cut today) are:
The deflationary impact expected to come from the decline in oil prices giving the central bank room to ease in order to boost the speed of the still relatively hesitant economic rebound (particularly after the weakening of the latest IMEF manufacturing and non-manufacturing PMIs, although the HSBC manufacturing print was strong).
Offsetting the potential negative confidence impact that the ongoing bout of protests could have on both consumers and firms.
However, we also think there are compelling arguments for not expecting additional easing from Banxico down the line:
Eduardo Suárez (416) 945-4538 [email protected]

Foreign Exchange Strategy
Global Views
December 5, 2014
17
… continued from previous page
The ongoing weakening of MXN is already loosening domestic monetary conditions, and could also provide some upwards pressure to inflation (even with a relatively low FX-inflation pass-through of about 6% -10%).
The economy does seem to be rebounding relatively broadly, although the pace of the pace of the growth acceleration remains tentative. This would suggest that the output gap is gradually closing — which is the message that Banxico has been sending.
The US economy is performing very strongly, which seems to support the view that we are heading into the Fed’s start of the tightening cycle. The more Banxico cuts, the steeper the rate hike cycle will need to be in order to maintain the “relative monetary conditions” with regard to the US which the Board has continually referenced in recent statements.
Balancing between the arguments for a cut, or for a continued pause, based on the latest statement from Banxico is tough. On one hand the central bank argues that the balance of risks for growth has deteriorated, but on the other it also highlights a deteriorating picture on the inflation front. On balance, we believe that the argument that will tip the balance in favour of not cutting rates is the oft-cited “relative monetary conditions argument”, which is likely to keep the central bank on hold given we seem to be getting closer to the moment when the US is set to start hiking.
In terms of USD/MXN, the past week saw the peso become the worst performer among the majors (-2.4%), underperforming even the heavily oil linked Norwegian Krone (-2.3%). Our sense is that the move in the peso may be a positive for the Mexican economy for several reasons:
The oil price impact for Mexico’s 2015 public finances is hedged (thus the USD value of oil exports is fixed).
The budget assumes an average USD/MXN exchange rate of 13.40, which means that converting the above-mentioned USD into pesos should mean a windfall for the government (and could help accumulate assets in the sovereign wealth fund).
Lower oil prices have a positive impact on the US economy, which is by far the major external driver for the Mexican economy (see the gap in importance between oil & manufacturing exports in the chart below).
A weaker MXN also boosts tourism flows (although the behaviour of the currencies of competing destinations also matters).
The major risk we see from lower oil prices is the potential adverse impact this can have on next summer's oil block auctions although, given the oil projects are considered long-term, our sense is the impact is also contained.
Peru: Next week’s main event is likely to be the BCRP’s MPC meeting, where consensus looks for rates to be left unchanged, but there are some market players calling for a cut. Our sense is that a cut is a relatively strong possibility given that the economy remains sluggish, while inflation seems to be coming back under control (although it remains a little above the upper boundary of the central bank’s target), and falling energy prices could provide some further support for the central bank on this front, while the sol’s drop has been relatively modest and orderly.
Eduardo Suárez (416) 945-4538 [email protected]
Mexico’s manufacturing exports vastly outpace oil

Economics
Global Views
December 5, 2014
18
Key Data Preview
CANADA
Will Canadian housing starts soften in November after a strong Q3? October saw a drop in Canadian housing starts to 183k vs. 190k on average during Q3. We’re anticipating a modest increase to 190k on strength in building permits in September (+3.4% m/m for single family homes, +12.9% m/m for multi-family residences). One caveat here is that we have less data on building permits than usual when forecasting housing starts as October permits data will be released after November housing starts land.
UNITED STATES
Retail sales for November could be solid overall as: a) auto sales were quite strong on the month albeit after a soft spell in August and September (see chart), b) the ICSC survey of retail store sales was up solidly on average during November. Lower gasoline prices are a first-order risk to overall retail sales dollar levels, but consumers have now had a couple of months of savings on gasoline that they might start to spend elsewhere. On the pessimistic side of the ledger, yes, some of the Black Friday sales metrics were lower on the month, but, as we have written in the past, the surveys of shopper behavior on Black Friday don’t necessarily line up with consumer behavior registered in aggregated economic data like retail sales. On net, we’re looking for a +0.3% overall number and a +0.2% m/m print ex-autos.
U.S. consumer confidence has been trending positively of late, and we expect the University of Michigan confidence metric to tick up to a reading of 90 on a mix of a better consumer climate due to lower oil prices, favorable sentiment due to strong labor data of late, and some renewal in confidence as the stock market continues to climb to new highs.
Dov Zigler (212) 225-6631 [email protected]
Derek Holt (416) 863-7707 [email protected]
Frances Donald (416) 862-3080 [email protected]
A1
125
150
175
200
225
250
275
06 07 08 09 10 11 12 13 14
Housing Starts
12-Month Avg.
000's
Source: Statistics Canada, Scotiabank Economics
Will Housing Starts Bounce AfterSoft October?
8
10
12
14
16
18
20
22
Jun-06 Jun-11
Auto Sales
Vehicle Sales Bounced in November...But Are Still Below Summer Peaks
Millions
Source: Scotiabank Economics, Bloomberg
Economics
Global Views
December 5, 2014
19
… continued from previous page
EUROPE
The Russian Central Bank (CBR) will meet and announce a monetary policy decision on December 11th. Against a backdrop of high inflation and significant ruble (RUB) weakness, we expect the CBR will hike its benchmark one-week auction rate by 50 basis points to 10%. Heightened geopolitical tension and Western sanctions continue to weigh heavily on economic activity and sentiment in Russia, while rapid capital flight and declining oil prices have put further pressure on external accounts and the ruble. This, combined with rising food prices, has been responsible for the acceleration in consumer price inflation to 9.1% y/y in November, up from 8.3% in October and well above the Russian central bank’s 5% target for end-2014. Meanwhile, the RUB has depreciated by roughly 40% against the US dollar (USD) since the start of the year, with the recent weakness reflecting the fact that Russia is among the most exposed to falling oil prices and is particularly vulnerable to OPEC’s decision to maintain its supply target of 30-million-barrels per day. Despite domestic challenges, the CBR will likely maintain its tight monetary stance, with rate cuts unlikely until at least the final quarter of 2015.
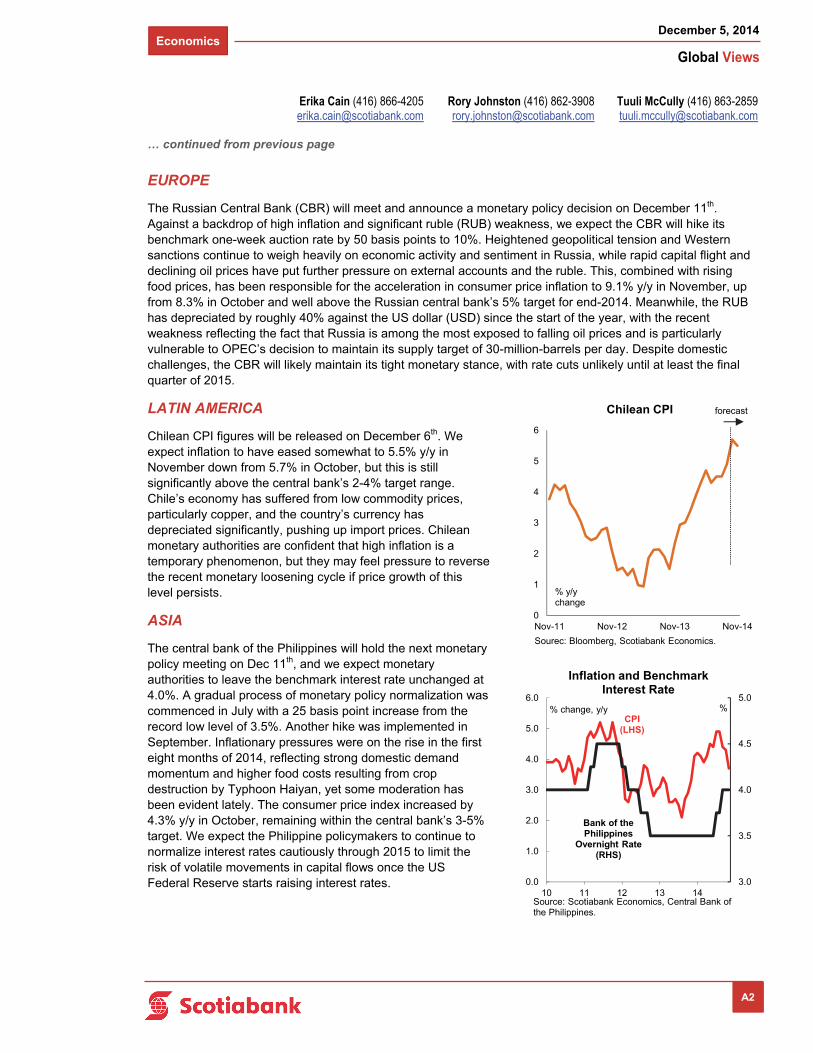
LATIN AMERICA
Chilean CPI figures will be released on December 6th. We expect inflation to have eased somewhat to 5.5% y/y in November down from 5.7% in October, but this is still significantly above the central bank’s 2-4% target range. Chile’s economy has suffered from low commodity prices, particularly copper, and the country’s currency has depreciated significantly, pushing up import prices. Chilean monetary authorities are confident that high inflation is a temporary phenomenon, but they may feel pressure to reverse the recent monetary loosening cycle if price growth of this level persists.
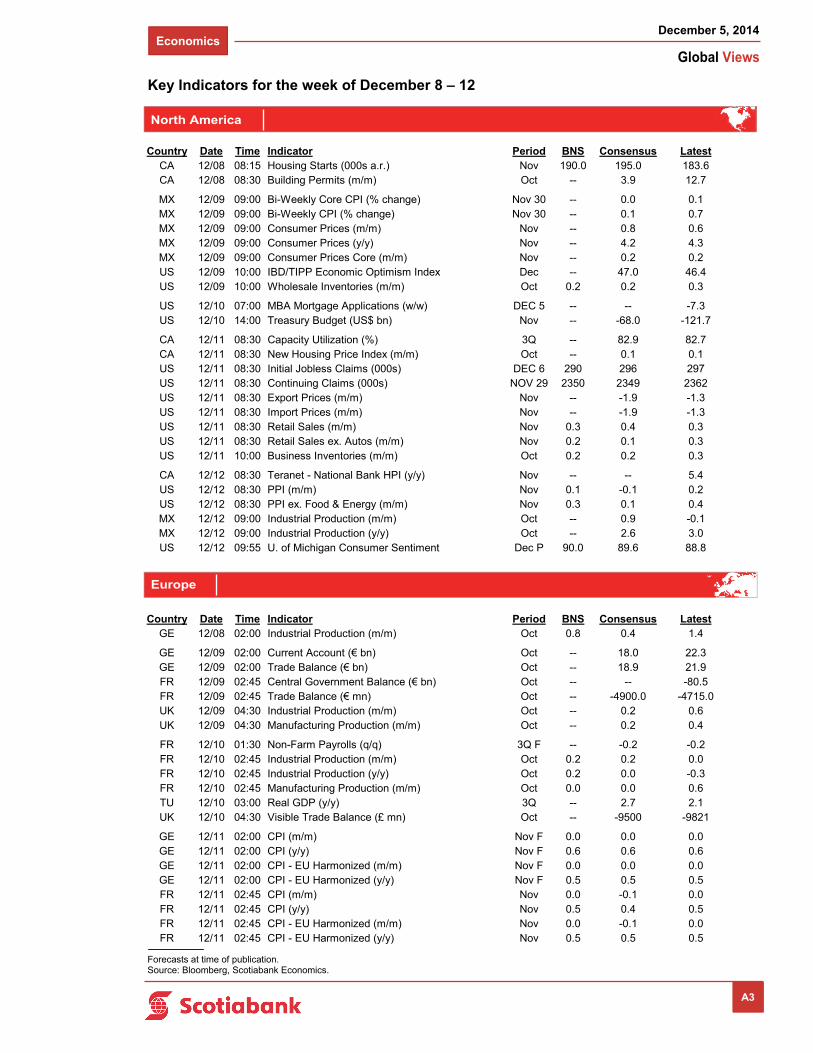
ASIA
The central bank of the Philippines will hold the next monetary policy meeting on Dec 11th, and we expect monetary authorities to leave the benchmark interest rate unchanged at 4.0%. A gradual process of monetary policy normalization was commenced in July with a 25 basis point increase from the record low level of 3.5%. Another hike was implemented in September. Inflationary pressures were on the rise in the first eight months of 2014, reflecting strong domestic demand momentum and higher food costs resulting from crop destruction by Typhoon Haiyan, yet some moderation has been evident lately. The consumer price index increased by 4.3% y/y in October, remaining within the central bank’s 3-5% target. We expect the Philippine policymakers to continue to normalize interest rates cautiously through 2015 to limit the risk of volatile movements in capital flows once the US Federal Reserve starts raising interest rates.
A2
Tuuli McCully (416) 863-2859 [email protected]
Rory Johnston (416) 862-3908 [email protected]
Erika Cain (416) 866-4205 [email protected]
3.0
3.5
4.0
4.5
5.0
0.0
1.0
2.0
3.0
4.0
5.0
6.0
10 11 12 13 14
Inflation and Benchmark Interest Rate
Source: Scotiabank Economics, Central Bank of the Philippines.
% change, y/yCPI
(LHS)
Bank of the Philippines
Overnight Rate (RHS)
%
0
1
2
3
4
5
6
Nov-11 Nov-12 Nov-13 Nov-14
Chilean CPI
% y/y change
Sourec: Bloomberg, Scotiabank Economics.
forecast
Economics
Global Views
December 5, 2014
1
Key Indicators for the week of December 8 – 12
Forecasts at time of publication. Source: Bloomberg, Scotiabank Economics.
North America
Europe
A3
Country Date Time Indicator Period BNS Consensus LatestCA 12/08 08:15 Housing Starts (000s a.r.) Nov 190.0 195.0 183.6CA 12/08 08:30 Building Permits (m/m) Oct -- 3.9 12.7
MX 12/09 09:00 Bi-Weekly Core CPI (% change) Nov 30 -- 0.0 0.1MX 12/09 09:00 Bi-Weekly CPI (% change) Nov 30 -- 0.1 0.7MX 12/09 09:00 Consumer Prices (m/m) Nov -- 0.8 0.6MX 12/09 09:00 Consumer Prices (y/y) Nov -- 4.2 4.3MX 12/09 09:00 Consumer Prices Core (m/m) Nov -- 0.2 0.2US 12/09 10:00 IBD/TIPP Economic Optimism Index Dec -- 47.0 46.4US 12/09 10:00 Wholesale Inventories (m/m) Oct 0.2 0.2 0.3
US 12/10 07:00 MBA Mortgage Applications (w/w) DEC 5 -- -- -7.3US 12/10 14:00 Treasury Budget (US$ bn) Nov -- -68.0 -121.7
CA 12/11 08:30 Capacity Utilization (%) 3Q -- 82.9 82.7CA 12/11 08:30 New Housing Price Index (m/m) Oct -- 0.1 0.1US 12/11 08:30 Initial Jobless Claims (000s) DEC 6 290 296 297US 12/11 08:30 Continuing Claims (000s) NOV 29 2350 2349 2362US 12/11 08:30 Export Prices (m/m) Nov -- -1.9 -1.3US 12/11 08:30 Import Prices (m/m) Nov -- -1.9 -1.3US 12/11 08:30 Retail Sales (m/m) Nov 0.3 0.4 0.3US 12/11 08:30 Retail Sales ex. Autos (m/m) Nov 0.2 0.1 0.3US 12/11 10:00 Business Inventories (m/m) Oct 0.2 0.2 0.3
CA 12/12 08:30 Teranet - National Bank HPI (y/y) Nov -- -- 5.4US 12/12 08:30 PPI (m/m) Nov 0.1 -0.1 0.2US 12/12 08:30 PPI ex. Food & Energy (m/m) Nov 0.3 0.1 0.4MX 12/12 09:00 Industrial Production (m/m) Oct -- 0.9 -0.1MX 12/12 09:00 Industrial Production (y/y) Oct -- 2.6 3.0US 12/12 09:55 U. of Michigan Consumer Sentiment Dec P 90.0 89.6 88.8
Country Date Time Indicator Period BNS Consensus LatestGE 12/08 02:00 Industrial Production (m/m) Oct 0.8 0.4 1.4
GE 12/09 02:00 Current Account (€ bn) Oct -- 18.0 22.3GE 12/09 02:00 Trade Balance (€ bn) Oct -- 18.9 21.9FR 12/09 02:45 Central Government Balance (€ bn) Oct -- -- -80.5FR 12/09 02:45 Trade Balance (€ mn) Oct -- -4900.0 -4715.0UK 12/09 04:30 Industrial Production (m/m) Oct -- 0.2 0.6UK 12/09 04:30 Manufacturing Production (m/m) Oct -- 0.2 0.4
FR 12/10 01:30 Non-Farm Payrolls (q/q) 3Q F -- -0.2 -0.2FR 12/10 02:45 Industrial Production (m/m) Oct 0.2 0.2 0.0FR 12/10 02:45 Industrial Production (y/y) Oct 0.2 0.0 -0.3FR 12/10 02:45 Manufacturing Production (m/m) Oct 0.0 0.0 0.6TU 12/10 03:00 Real GDP (y/y) 3Q -- 2.7 2.1UK 12/10 04:30 Visible Trade Balance (£ mn) Oct -- -9500 -9821
GE 12/11 02:00 CPI (m/m) Nov F 0.0 0.0 0.0GE 12/11 02:00 CPI (y/y) Nov F 0.6 0.6 0.6GE 12/11 02:00 CPI - EU Harmonized (m/m) Nov F 0.0 0.0 0.0GE 12/11 02:00 CPI - EU Harmonized (y/y) Nov F 0.5 0.5 0.5FR 12/11 02:45 CPI (m/m) Nov 0.0 -0.1 0.0FR 12/11 02:45 CPI (y/y) Nov 0.5 0.4 0.5FR 12/11 02:45 CPI - EU Harmonized (m/m) Nov 0.0 -0.1 0.0FR 12/11 02:45 CPI - EU Harmonized (y/y) Nov 0.5 0.5 0.5
Economics
Global Views
December 5, 2014
2
Key Indicators for the week of December 8 – 12
Forecasts at time of publication. Source: Bloomberg, Scotiabank Economics.
A4
Asia Pacific
Europe (continued from previous page)
Country Date Time Indicator Period BNS Consensus LatestNZ 12/07 16:45 Manufacturing Activity 3Q -- -- -1.9JN 12/07 18:50 Bank Lending (y/y) Nov -- -- 2.4JN 12/07 18:50 Current Account (¥ bn) Oct -- 370.1 963.0JN 12/07 18:50 GDP (q/q) 3Q F -0.20 -0.10 -0.40JN 12/07 18:50 Trade Balance - BOP Basis (¥ bn) Oct -- -569.6 -714.5CH DEC 07-08 Exports (y/y) Nov -- 8.0 11.6CH DEC 07-08 Imports (y/y) Nov -- 3.8 4.6CH DEC 07-08 Trade Balance (USD bn) Nov -- 44.0 45.4
JN 12/08 00:00 Eco Watchers Survey (current) Nov -- 45.8 44.0JN 12/08 00:00 Eco Watchers Survey (outlook) Nov -- 47.0 46.6TA 12/08 03:00 Exports (y/y) Nov -- 3.0 0.7TA 12/08 03:00 Imports (y/y) Nov -- 2.3 -1.4TA 12/08 03:00 Trade Balance (US$ bn) Nov -- 4.4 4.6JN 12/08 18:50 Japan Money Stock M2 (y/y) Nov -- 3.20 3.20JN 12/08 18:50 Japan Money Stock M3 (y/y) Nov -- 2.6 2.6
JN 12/09 01:00 Machine Tool Orders (y/y) Nov P -- -- 30.8SK 12/09 18:00 Unemployment Rate (%) Nov 3.5 3.5 3.5AU 12/09 19:30 Home Loans (%) Oct -- 0.1 -0.7PH 12/09 20:00 Exports (y/y) Oct -- 11.0 15.7PH 12/09 20:00 Unemployment Rate (%) Oct 6.7 -- 6.7CH 12/09 20:30 CPI (y/y) Nov 1.6 1.6 1.6CH 12/09 20:30 PPI (y/y) Nov -- -2.4 -2.2NZ DEC 09-13 REINZ House Sales (y/y) Nov -- -- -2.4NZ DEC 09-13 REINZ Housing Price Index (m/m) Nov -- -- 1.4CH DEC 09-15 Aggregate Financing (CNY bn) Nov -- 890.0 662.7CH DEC 09-15 New Yuan Loans (bn) Nov -- 660.0 548.3IN DEC 09-15 Exports (y/y) Nov -- -- -5.04IN DEC 09-15 Imports (y/y) Nov -- -- 3.62
JN 12/10 00:00 Consumer Confidence Nov -- 39.5 38.9NZ 12/10 15:00 RBNZ Official Cash Rate (%) Dec 11 3.50 3.50 3.50JN 12/10 18:50 Machine Orders (m/m) Oct -- -1.9 2.9JN 12/10 18:50 Tertiary Industry Index (m/m) Oct -- -0.2 1.0AU 12/10 19:30 Employment (000s) Nov -- 15.0 24.1AU 12/10 19:30 Unemployment Rate (%) Nov 6.2 6.3 6.2MA 12/10 23:00 Industrial Production (y/y) Oct -- 4.2 5.4
Country Date Time Indicator Period BNS Consensus LatestSZ 12/11 03:30 SNB Libor Target Rate (%) Dec 11 0.00 0.00 0.00IT 12/11 04:00 Industrial Production (m/m) Oct -- 0.3 -0.9
NO 12/11 04:00 Norwegian Deposit Rates (%) Dec 11 1.50 1.50 1.50RU 12/11 05:30 One-Week Auction Rate (%) Dec 11 10.00 9.63 9.50RU DEC 11-12 Real GDP (y/y) 3Q P -- 0.7 0.7
SP 12/12 03:00 CPI (m/m) Nov -- -0.1 0.5SP 12/12 03:00 CPI (y/y) Nov F -- -0.4 -0.4SP 12/12 03:00 CPI - EU Harmonized (m/m) Nov -0.3 -0.1 0.1SP 12/12 03:00 CPI - EU Harmonized (y/y) Nov F -0.5 -0.5 -0.5IT 12/12 04:00 CPI - EU Harmonized (y/y) Nov F -- 0.2 0.2EC 12/12 05:00 Employment (q/q) 3Q -- -- 0.2EC 12/12 05:00 Industrial Production (m/m) Oct -- 0.2 0.6EC 12/12 05:00 Industrial Production (y/y) Oct -- 0.7 0.6

Economics
Global Views
December 5, 2014
3
Key Indicators for the week of December 8 – 12
Forecasts at time of publication. Source: Bloomberg, Scotiabank Economics.
A5
Latin America
Asia Pacific (continued from previous page)
Country Date Time Indicator Period BNS Consensus LatestCL 12/06 06:00 CPI (y/y) Nov 5.5 5.5 5.7
PE 12/10 Trade Balance (USD mn) Oct -- -- -252.7
CL 12/11 16:00 Nominal Overnight Rate Target (%) Dec 11 3.00 3.00 3.00PE 12/11 18:00 Reference Rate (%) Dec 3.25 3.50 3.50
BZ 12/12 06:00 Retail Sales (y/y) Oct -- 0.6 0.5
Country Date Time Indicator Period BNS Consensus LatestID DEC 10-11 BI Reference Interest Rate (%) Dec 11 7.75 -- 7.75SK DEC 10-11 BoK Base Rate (%) Dec 11 2.00 2.00 2.00
PH 12/11 03:00 Overnight Borrowing Rate (%) Dec 11 4.00 4.00 4.00NZ 12/11 16:30 Business NZ PMI Nov -- -- 59.3NZ 12/11 19:00 ANZ Consumer Confidence Index Dec -- -- 121.8JN 12/11 23:30 Capacity Utilization (m/m) Oct -- -- 3.6JN 12/11 23:30 Industrial Production (y/y) Oct F -1.0 -- -1.0
CH 12/12 00:30 Fixed Asset Investment YTD (y/y) Nov 15.8 15.8 15.9CH 12/12 00:30 Industrial Production (y/y) Nov 7.6 7.5 7.7CH 12/12 00:30 Retail Sales (y/y) Nov 11.5 11.5 11.5HK 12/12 03:30 Industrial Production (y/y) 3Q -- -- 2.2IN 12/12 07:00 CPI (y/y) Nov 4.5 -- 5.5IN 12/12 07:00 Industrial Production (y/y) Oct -- -- 2.5
Economics
Global Views
December 5, 2014
4
Global Auctions for the week of December 8 – 12
North America
Europe
Source: Bloomberg, Scotiabank Economics.
A6
Asia Pacific
Latin America
Country Date Time EventUS 12/08 11:30 U.S. to Sell 3-Month BillsUS 12/08 11:30 U.S. to Sell 6-Month BillsUS 12/09 11:30 U.S. to Sell 52-Week BillsUS 12/09 11:30 U.S. to Sell 4-Week BillsUS 12/09 13:00 U.S. to Sell 3-Year NotesCA 12/10 12:00 Canada to Sell 30-Year Real Return BondsUS 12/10 13:00 U.S. to Sell 10-Year Notes ReopeningUS 12/11 13:00 U.S. to Sell 30-Year Bonds Reopening
Country Date Time EventJN 12/07 22:35 Japan to Sell 6-Month BillAU 12/08 19:00 Australia Plans to Sell Index linked BondsJN 12/08 22:45 Japan to Sell 30-Year BondsCH 12/09 22:00 China to Sell 1-Year BondsJN 12/09 22:35 Japan to Sell 2-Month BillJN 12/10 22:35 Japan to Sell 3-Month BillJN 12/11 03:00 Japan Auction for Enhanced-LiquidityNZ 12/11 20:05 New Zealand Plans to Sell NZD300 Mln Nominal Bonds
Country Date Time EventBZ 12/11 09:15 Brazil to Sell Bills due 04/01/2015 - LTNBZ 12/11 09:15 Brazil to Sell Bills due 10/01/2016 - LTNBZ 12/11 09:15 Brazil to Sell Bills due 07/01/2018 - LTNBZ 12/11 09:15 Brazil to Sell Fixed-rate bonds due 1/1/2021 - NTN-FBZ 12/11 09:15 Brazil to Sell Fixed-rate bonds due 1/1/2025 - NTN-F
Country Date Time EventNE 12/08 06:00 Netherlands Cancels Bills AuctionFR 12/08 08:50 France to Sell BillsSP 12/09 04:30 Spain to Sell 6-Month and 12-Month BillsMB 12/09 05:00 Malta to Sell BillsEC 12/09 05:10 ECB Main Refinancing Operation ResultAS 12/09 05:15 Austria to Sell EUR880 Mln 1.65% 2024 BondsSZ 12/09 05:15 Switzerland to Sell 91-Day BillsUK 12/09 05:30 U.K. to Sell 2045 BondsDE 12/10 04:30 Denmark to Sell BondsIT 12/10 05:00 Italy to Sell 367-Day Bills
SW 12/10 05:03 Sweden to Sell BondsSZ 12/10 05:15 Switzerland to Sell BondsGE 12/10 05:30 Germany to Sell EUR4 Bln 0.0% 2016 BondsIT 12/11 05:00 Italy Cancels Bonds AuctionEC 12/11 05:10 ECB Second Targeted Long-Term Refinancing Operation ResultUK 12/11 05:30 U.K. to Sell I/L 2034 BondsIC 12/11 06:00 Iceland to Sell BillsUK 12/12 06:00 U.K. to Sell 1-Month BillsUK 12/12 06:00 U.K. to Sell 3-Month BillsUK 12/12 06:00 U.K. to Sell 6-Month Bills

Economics
Global Views
December 5, 2014
5
Events for the week of December 8 – 12
North America
Europe
Source: Bloomberg, Scotiabank Economics.
A7
Country Date Time EventCA 12/08 11:45 Premier Christy Clark to Discuss British Columbia’s EconomyUS 12/08 12:30 Fed's Lockhart Speaks on Monetary Policy in Atlanta
CA 12/10 11:15 Carolyn Wilkins Hold a Press Conference
US 12/11 07:45 Stephen Poloz Gives a SpeechCA 12/11 15:00 Warren Jestin Speaks at Chief Economists' Forum
Latin America
Asia Pacific
Country Date Time EventNZ 12/09 16:00 N.Z. Government 4-Month Financial Statements
NZ 12/10 15:00 RBNZ Official Cash RateNZ 12/10 15:05 RBNZ Governor Wheeler News ConferenceSK DEC 10-11 BoK 7-Day Repo RateID DEC 10-11 Bank Indonesia Reference Rate
PH 12/11 03:00 BSP Overnight Borrowing RateHK 12/11 00:00 Hong Kong Monetary Research Instiute Director Speaks at OMFIF
Country Date Time EventPE DEC 01-12 UN Climate Change Conference
CL 12/11 16:00 Overnight Rate TargetPE 12/11 18:00 Reference Rate
Country Date Time EventEC 12/08 06:15 BOE's Gracie Speaks in AmsterdamEC 12/08 09:00 Euro-Area Finance Ministers Meet in BrusselsUK 12/08 13:30 BOE's Weale Speaks in LondonUK 12/08 13:30 ECB's Liikanen Speaks in Amsterdam
EC 12/09 03:00 EU Finance Ministers Hold Meeting in BrusselsIT 12/09 05:00 IMF's Lagarde Speaks at Milan's BocconiHU 12/09 06:30 Hungary's Central Bank President Matolcsy Speaks at ForumHU 12/09 07:000 ECB's Makuch Speaks in Bratislava
SW 12/10 02:00 Swedish FSA Publishes Stability ReportSP 12/10 03:30 Bank of Spain Governor Speaks at Madrid Banking SeminarHU 12/10 08:00 Hungarian Central Bank's MinutesEC 12/10 08:00 Juncker, European Commission to Be Sworn In in Luxembourg
EC 12/11 03:00 BOE's McCafferty Speaks in LiverpoolSZ 12/11 03:30 SNB 3-Month Libor Target RateNO 12/11 04:00 Deposit RatesEC 12/11 04:00 ECB Publishes Monthly ReportFI 12/11 04:00 ECB's Liikanen Speaks at Bank of Finland Briefing in HelsinkiRU 12/11 05:30 Central Bank Target Rate
EC 12/12 06:00 ECB Announces 3-Year LTRO RepaymentUK 12/12 U.K. Sovereign Debt Rating Published by S&P, FitchFR 12/12 France Sovereign Debt Rating Published by Fitch
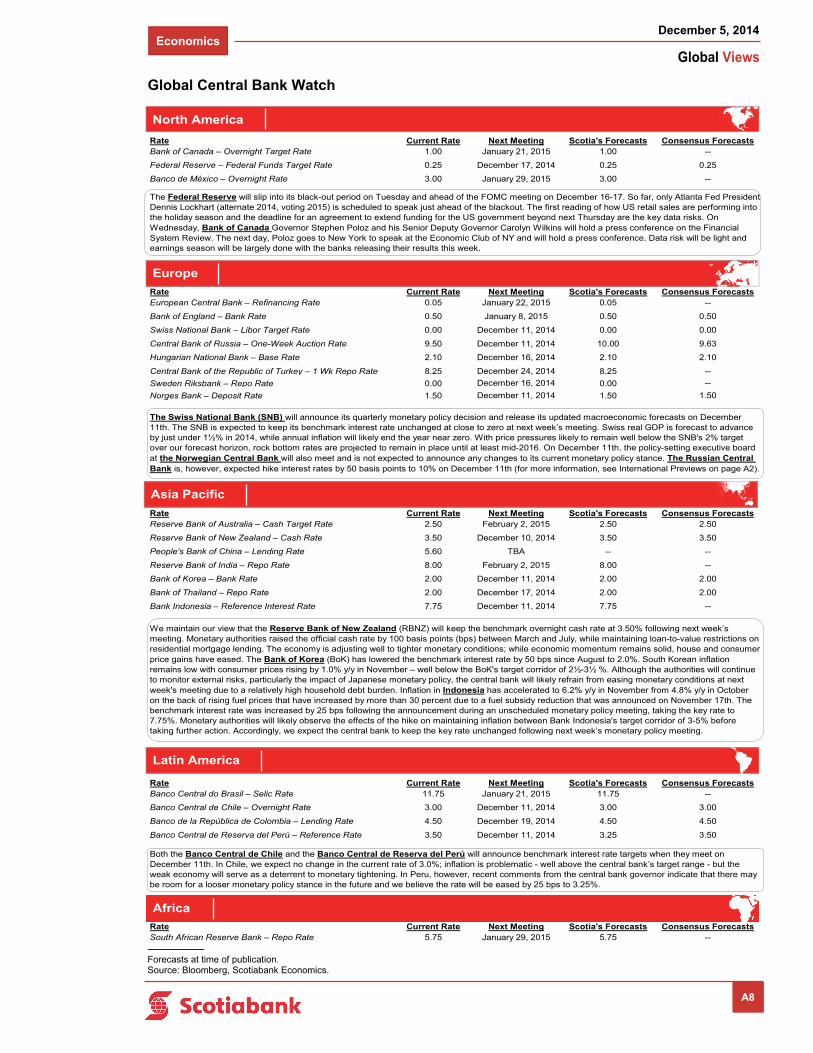
Economics
Global Views
December 5, 2014
6
Global Central Bank Watch
NORTH AMERICARate Current Rate Next Meeting Scotia's Forecasts Consensus ForecastsBank of Canada – Overnight Target Rate 1.00 January 21, 2015 1.00 --
Federal Reserve – Federal Funds Target Rate 0.25 December 17, 2014 0.25 0.25
Banco de México – Overnight Rate 3.00 January 29, 2015 3.00 --
EUROPERate Current Rate Next Meeting Scotia's Forecasts Consensus ForecastsEuropean Central Bank – Refinancing Rate 0.05 January 22, 2015 0.05 --
Bank of England – Bank Rate 0.50 January 8, 2015 0.50 0.50
Swiss National Bank – Libor Target Rate 0.00 December 11, 2014 0.00 0.00
Central Bank of Russia – One-Week Auction Rate 9.50 December 11, 2014 10.00 9.63
Hungarian National Bank – Base Rate 2.10 December 16, 2014 2.10 2.10
Central Bank of the Republic of Turkey – 1 Wk Repo Rate 8.25 December 24, 2014 8.25 --
Sweden Riksbank – Repo Rate 0.00 December 16, 2014 0.00 --
Norges Bank – Deposit Rate 1.50 December 11, 2014 1.50 1.50
ASIA PACIFICRate Current Rate Next Meeting Scotia's Forecasts Consensus ForecastsReserve Bank of Australia – Cash Target Rate 2.50 February 2, 2015 2.50 2.50
Reserve Bank of New Zealand – Cash Rate 3.50 December 10, 2014 3.50 3.50
People's Bank of China – Lending Rate 5.60 TBA -- --
Reserve Bank of India – Repo Rate 8.00 February 2, 2015 8.00 --
Bank of Korea – Bank Rate 2.00 December 11, 2014 2.00 2.00
Bank of Thailand – Repo Rate 2.00 December 17, 2014 2.00 2.00
Bank Indonesia – Reference Interest Rate 7.75 December 11, 2014 7.75 --
LATIN AMERICARate Current Rate Next Meeting Scotia's Forecasts Consensus ForecastsBanco Central do Brasil – Selic Rate 11.75 January 21, 2015 11.75 --
Banco Central de Chile – Overnight Rate 3.00 December 11, 2014 3.00 3.00
Banco de la República de Colombia – Lending Rate 4.50 December 19, 2014 4.50 4.50
Banco Central de Reserva del Perú – Reference Rate 3.50 December 11, 2014 3.25 3.50
AFRICA
Rate Current Rate Next Meeting Scotia's Forecasts Consensus ForecastsSouth African Reserve Bank – Repo Rate 5.75 January 29, 2015 5.75 --
The Federal Reserve will slip into its black-out period on Tuesday and ahead of the FOMC meeting on December 16-17. So far, only Atlanta Fed President Dennis Lockhart (alternate 2014, voting 2015) is scheduled to speak just ahead of the blackout. The first reading of how US retail sales are performing into the holiday season and the deadline for an agreement to extend funding for the US government beyond next Thursday are the key data risks. On Wednesday, Bank of Canada Governor Stephen Poloz and his Senior Deputy Governor Carolyn Wilkins will hold a press conference on the Financial System Review. The next day, Poloz goes to New York to speak at the Economic Club of NY and will hold a press conference. Data risk will be light and earnings season will be largely done with the banks releasing their results this week.
Both the Banco Central de Chile and the Banco Central de Reserva del Perú will announce benchmark interest rate targets when they meet on December 11th. In Chile, we expect no change in the current rate of 3.0%; inflation is problematic - well above the central bank’s target range - but the weak economy will serve as a deterrent to monetary tightening. In Peru, however, recent comments from the central bank governor indicate that there may be room for a looser monetary policy stance in the future and we believe the rate will be eased by 25 bps to 3.25%.
We maintain our view that the Reserve Bank of New Zealand (RBNZ) will keep the benchmark overnight cash rate at 3.50% following next week’s meeting. Monetary authorities raised the official cash rate by 100 basis points (bps) between March and July, while maintaining loan-to-value restrictions on residential mortgage lending. The economy is adjusting well to tighter monetary conditions; while economic momentum remains solid, house and consumer price gains have eased. The Bank of Korea (BoK) has lowered the benchmark interest rate by 50 bps since August to 2.0%. South Korean inflation remains low with consumer prices rising by 1.0% y/y in November – well below the BoK's target corridor of 2½-3½ %. Although the authorities will continue to monitor external risks, particularly the impact of Japanese monetary policy, the central bank will likely refrain from easing monetary conditions at next week's meeting due to a relatively high household debt burden. Inflation in Indonesia has accelerated to 6.2% y/y in November from 4.8% y/y in October on the back of rising fuel prices that have increased by more than 30 percent due to a fuel subsidy reduction that was announced on November 17th. The benchmark interest rate was increased by 25 bps following the announcement during an unscheduled monetary policy meeting, taking the key rate to 7.75%. Monetary authorities will likely observe the effects of the hike on maintaining inflation between Bank Indonesia's target corridor of 3-5% before taking further action. Accordingly, we expect the central bank to keep the key rate unchanged following next week’s monetary policy meeting.
The Swiss National Bank (SNB) will announce its quarterly monetary policy decision and release its updated macroeconomic forecasts on December 11th. The SNB is expected to keep its benchmark interest rate unchanged at close to zero at next week’s meeting. Swiss real GDP is forecast to advance by just under 1½% in 2014, while annual inflation will likely end the year near zero. With price pressures likely to remain well below the SNB's 2% target over our forecast horizon, rock bottom rates are projected to remain in place until at least mid-2016. On December 11th, the policy-setting executive board at the Norwegian Central Bank will also meet and is not expected to announce any changes to its current monetary policy stance. The Russian Central Bank is, however, expected hike interest rates by 50 basis points to 10% on December 11th (for more information, see International Previews on page A2).
North America
Europe
Asia Pacific
Latin America
Africa
Forecasts at time of publication. Source: Bloomberg, Scotiabank Economics.
A8
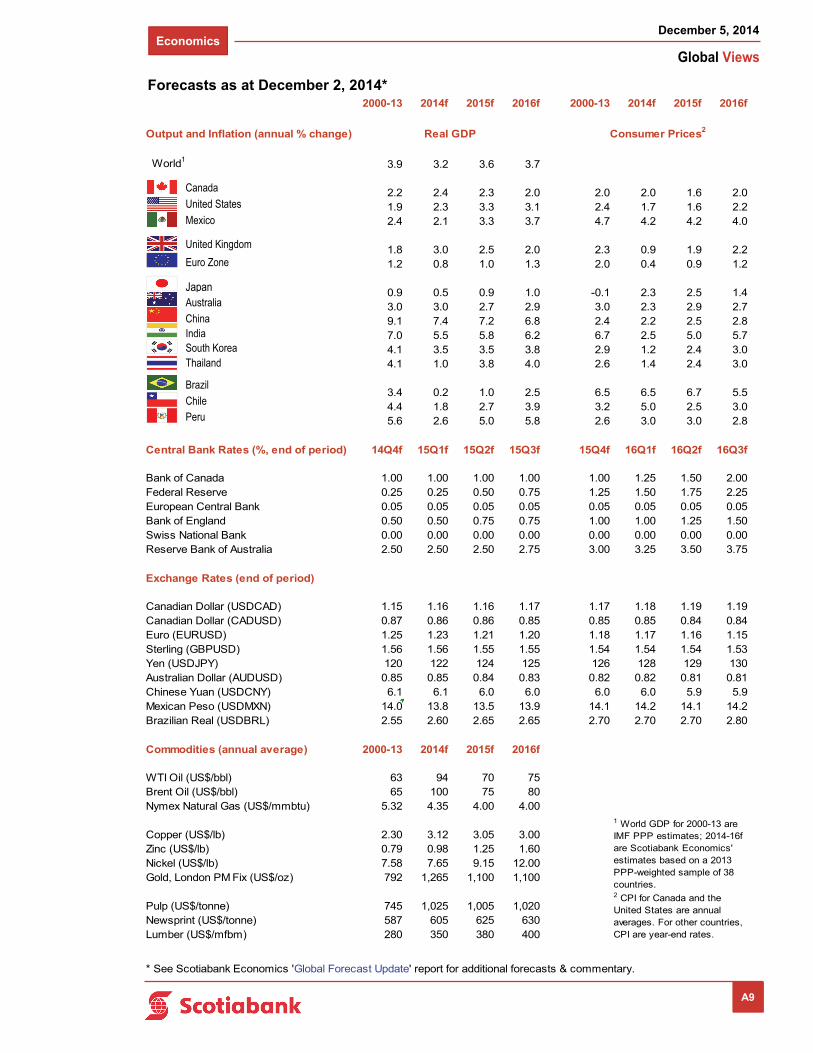
Economics
Global Views
December 5, 2014
7
Forecasts as at December 2, 2014* 2000-13 2014f 2015f 2016f 2000-13 2014f 2015f 2016f
Output and Inflation (annual % change) Real GDP Consumer Prices2
World13.9 3.2 3.6 3.7
Canada 2.2 2.4 2.3 2.0 2.0 2.0 1.6 2.0 United States 1.9 2.3 3.3 3.1 2.4 1.7 1.6 2.2 Mexico 2.4 2.1 3.3 3.7 4.7 4.2 4.2 4.0
United Kingdom 1.8 3.0 2.5 2.0 2.3 0.9 1.9 2.2 Euro zone 1.2 0.8 1.0 1.3 2.0 0.4 0.9 1.2
Japan 0.9 0.5 0.9 1.0 -0.1 2.3 2.5 1.4 Australia 3.0 3.0 2.7 2.9 3.0 2.3 2.9 2.7 China 9.1 7.4 7.2 6.8 2.4 2.2 2.5 2.8 India 7.0 5.5 5.8 6.2 6.7 2.5 5.0 5.7 Korea 4.1 3.5 3.5 3.8 2.9 1.2 2.4 3.0 Thailand 4.1 1.0 3.8 4.0 2.6 1.4 2.4 3.0
Brazil 3.4 0.2 1.0 2.5 6.5 6.5 6.7 5.5 Chile 4.4 1.8 2.7 3.9 3.2 5.0 2.5 3.0 Peru 5.6 2.6 5.0 5.8 2.6 3.0 3.0 2.8
Central Bank Rates (%, end of period) 14Q4f 15Q1f 15Q2f 15Q3f 15Q4f 16Q1f 16Q2f 16Q3f
Bank of Canada 1.00 1.00 1.00 1.00 1.00 1.25 1.50 2.00Federal Reserve 0.25 0.25 0.50 0.75 1.25 1.50 1.75 2.25European Central Bank 0.05 0.05 0.05 0.05 0.05 0.05 0.05 0.05Bank of England 0.50 0.50 0.75 0.75 1.00 1.00 1.25 1.50Swiss National Bank 0.00 0.00 0.00 0.00 0.00 0.00 0.00 0.00Reserve Bank of Australia 2.50 2.50 2.50 2.75 3.00 3.25 3.50 3.75
Exchange Rates (end of period)
Canadian Dollar (USDCAD) 1.15 1.16 1.16 1.17 1.17 1.18 1.19 1.19Canadian Dollar (CADUSD) 0.87 0.86 0.86 0.85 0.85 0.85 0.84 0.84Euro (EURUSD) 1.25 1.23 1.21 1.20 1.18 1.17 1.16 1.15Sterling (GBPUSD) 1.56 1.56 1.55 1.55 1.54 1.54 1.54 1.53Yen (USDJPY) 120 122 124 125 126 128 129 130Australian Dollar (AUDUSD) 0.85 0.85 0.84 0.83 0.82 0.82 0.81 0.81Chinese Yuan (USDCNY) 6.1 6.1 6.0 6.0 6.0 6.0 5.9 5.9Mexican Peso (USDMXN) 14.0 13.8 13.5 13.9 14.1 14.2 14.1 14.2Brazilian Real (USDBRL) 2.55 2.60 2.65 2.65 2.70 2.70 2.70 2.80
Commodities (annual average) 2000-13 2014f 2015f 2016f
WTI Oil (US$/bbl) 63 94 70 75Brent Oil (US$/bbl) 65 100 75 80Nymex Natural Gas (US$/mmbtu) 5.32 4.35 4.00 4.00
Copper (US$/lb) 2.30 3.12 3.05 3.00Zinc (US$/lb) 0.79 0.98 1.25 1.60Nickel (US$/lb) 7.58 7.65 9.15 12.00Gold, London PM Fix (US$/oz) 792 1,265 1,100 1,100
Pulp (US$/tonne) 745 1,025 1,005 1,020Newsprint (US$/tonne) 587 605 625 630Lumber (US$/mfbm) 280 350 380 400
1 World GDP for 2000-13 are IMF PPP estimates; 2014-16f are Scotiabank Economics' estimates based on a 2013 PPP-weighted sample of 38 countries. 2 CPI for Canada and the United States are annual averages. For other countries, CPI are year-end rates.
* See Scotiabank Economics 'Global Forecast Update' report for additional forecasts & commentary.
Brazil
India South Korea Thailand
Chile Peru
Japan
Canada
United States
Mexico
United Kingdom
Australia China
Euro Zone
A9
Forecasts as at December 2, 2014*

Economics
Global Views
December 5, 2014
8
North America
Canada 2013 14Q2 14Q3 Latest United States 2013 14Q2 14Q3 Latest Real GDP (annual rates) 2.0 3.6 2.8 Real GDP (annual rates) 2.2 4.6 3.9 Current Acc. Bal. (C$B, ar) -56.3 -39.6 -33.6 Current Acc. Bal. (US$B, ar) -400 -394 Merch. Trade Bal. (C$B, ar) -7.2 9.0 11.4 1.2 (Oct) Merch. Trade Bal. (US$B, ar) -702 -757 -728 -752 (Oct) Industrial Production 0.4 3.4 2.7 2.5 (Oct) Industrial Production 2.9 4.1 4.1 4.0 (Oct) Housing Starts (000s) 188 197 199 184 (Oct) Housing Starts (millions) 0.93 0.99 1.03 1.01 (Oct) Employment 1.3 0.6 0.7 0.9 (Nov) Employment 1.7 1.8 1.9 2.0 (Nov) Unemployment Rate (%) 7.1 7.0 6.9 6.6 (Nov) Unemployment Rate (%) 7.4 6.2 6.1 5.8 (Nov) Retail Sales 3.2 5.2 4.8 4.5 (Sep) Retail Sales 4.3 4.5 4.2 3.8 (Oct) Auto Sales (000s) 1744 1816 1958 1987 (Sep) Auto Sales (millions) 15.5 16.5 16.7 17.1 (Nov) CPI 0.9 2.2 2.1 2.4 (Oct) CPI 1.5 2.1 1.8 1.7 (Oct) IPPI 0.4 3.4 2.7 -2.5 (Oct) PPI 1.2 2.8 2.4 1.7 (Oct) Pre-tax Corp. Profits -0.6 12.0 10.3 Pre-tax Corp. Profits 4.6 10.4 9.0
Mexico Real GDP 1.4 1.6 2.2 Current Acc. Bal. (US$B, ar) -26.5 -30.6 -10.8 Merch. Trade Bal. (US$B, ar) -1.2 4.3 -6.1 1.7 (Oct) Industrial Production -0.5 1.1 2.0 3.0 (Sep) CPI 3.8 3.6 4.1 4.3 (Oct)
Euro Zone 2013 14Q2 14Q3 Latest Germany 2013 14Q2 14Q3 Latest Real GDP -0.4 0.7 Real GDP 0.2 1.4 1.2 Current Acc. Bal. (US$B, ar) 263 245 430 480 (Sep) Current Acc. Bal. (US$B, ar) 189.2 280.7 308.5 344.6 (Sep) Merch. Trade Bal. (US$B, ar) 274.2 331.1 285.6 317.4 (Sep) Merch. Trade Bal. (US$B, ar) 278.9 287.3 321.6 301.0 (Sep) Industrial Production -0.7 0.8 0.4 0.1 (Sep) Industrial Production 0.1 1.1 0.1 -0.2 (Sep) Unemployment Rate (%) 11.9 11.6 11.5 11.5 (Oct) Unemployment Rate (%) 6.9 6.7 6.7 6.6 (Nov) CPI 1.4 0.6 0.4 0.4 (Oct) CPI 1.5 1.1 0.8 1.6 (Nov)
France United Kingdom Real GDP 0.4 0.0 0.4 Real GDP 1.7 3.2 3.0 Current Acc. Bal. (US$B, ar) -40.3 -62.7 -2.0 46.7 (Sep) Current Acc. Bal. (US$B, ar) -72.4 -92.4 Merch. Trade Bal. (US$B, ar) -46.5 -41.4 -46.4 -43.9 (Sep) Merch. Trade Bal. (US$B, ar) -172.3 -189.2 -194.0 -192.1 (Sep) Industrial Production -0.6 -2.1 -0.1 -0.3 (Sep) Industrial Production -0.1 2.4 1.9 1.4 (Sep) Unemployment Rate (%) 10.3 10.2 10.5 10.5 (Oct) Unemployment Rate (%) 7.6 6.3 6.0 (Aug) CPI 0.9 0.6 0.4 0.5 (Oct) CPI 2.6 1.7 1.5 1.3 (Oct)
Italy Russia Real GDP -1.9 -0.4 -0.5 Real GDP 1.3 0.8 0.7 Current Acc. Bal. (US$B, ar) 16.6 24.6 40.1 7.6 (Sep) Current Acc. Bal. (US$B, ar) 34.1 14.1 11.4 Merch. Trade Bal. (US$B, ar) 38.8 57.4 58.9 31.2 (Sep) Merch. Trade Bal. (US$B, ar) 15.2 17.3 15.3 13.0 (Sep) Industrial Production -3.1 -0.2 -1.3 -2.3 (Sep) Industrial Production 0.4 1.9 1.4 2.9 (Oct) CPI 1.2 0.3 0.0 0.1 (Oct) CPI 6.8 7.6 7.7 9.1 (Nov)
Europe
All data expressed as year-over-year % change unless otherwise noted.
Economic Statistics
Source: Bloomberg, Global Insight, Scotiabank Economics.
A10
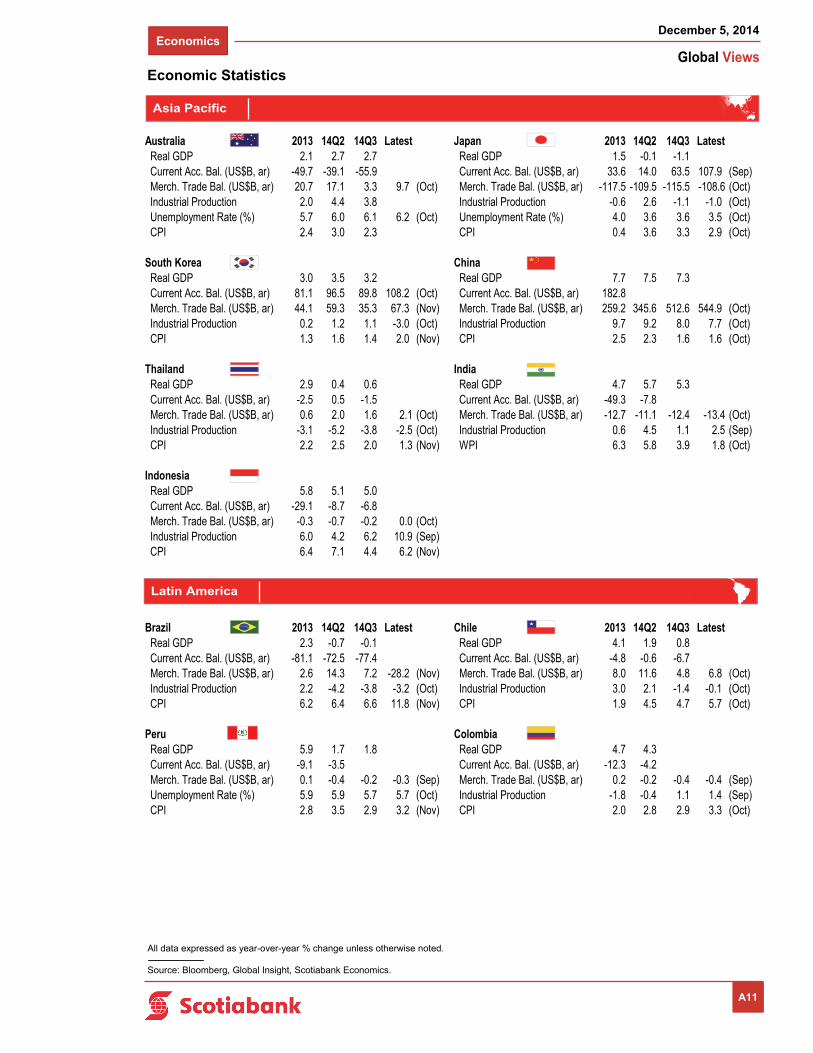
Economics
Global Views
December 5, 2014
9
Asia Pacific
Australia 2013 14Q2 14Q3 Latest Japan 2013 14Q2 14Q3 Latest Real GDP 2.1 2.7 2.7 Real GDP 1.5 -0.1 -1.1 Current Acc. Bal. (US$B, ar) -49.7 -39.1 -55.9 Current Acc. Bal. (US$B, ar) 33.6 14.0 63.5 107.9 (Sep) Merch. Trade Bal. (US$B, ar) 20.7 17.1 3.3 9.7 (Oct) Merch. Trade Bal. (US$B, ar) -117.5 -109.5 -115.5 -108.6 (Oct) Industrial Production 2.0 4.4 3.8 Industrial Production -0.6 2.6 -1.1 -1.0 (Oct) Unemployment Rate (%) 5.7 6.0 6.1 6.2 (Oct) Unemployment Rate (%) 4.0 3.6 3.6 3.5 (Oct) CPI 2.4 3.0 2.3 CPI 0.4 3.6 3.3 2.9 (Oct)
South Korea China Real GDP 3.0 3.5 3.2 Real GDP 7.7 7.5 7.3 Current Acc. Bal. (US$B, ar) 81.1 96.5 89.8 108.2 (Oct) Current Acc. Bal. (US$B, ar) 182.8 Merch. Trade Bal. (US$B, ar) 44.1 59.3 35.3 67.3 (Nov) Merch. Trade Bal. (US$B, ar) 259.2 345.6 512.6 544.9 (Oct) Industrial Production 0.2 1.2 1.1 -3.0 (Oct) Industrial Production 9.7 9.2 8.0 7.7 (Oct) CPI 1.3 1.6 1.4 2.0 (Nov) CPI 2.5 2.3 1.6 1.6 (Oct)
Thailand India Real GDP 2.9 0.4 0.6 Real GDP 4.7 5.7 5.3 Current Acc. Bal. (US$B, ar) -2.5 0.5 -1.5 Current Acc. Bal. (US$B, ar) -49.3 -7.8 Merch. Trade Bal. (US$B, ar) 0.6 2.0 1.6 2.1 (Oct) Merch. Trade Bal. (US$B, ar) -12.7 -11.1 -12.4 -13.4 (Oct) Industrial Production -3.1 -5.2 -3.8 -2.5 (Oct) Industrial Production 0.6 4.5 1.1 2.5 (Sep) CPI 2.2 2.5 2.0 1.3 (Nov) WPI 6.3 5.8 3.9 1.8 (Oct)
Indonesia Real GDP 5.8 5.1 5.0 Current Acc. Bal. (US$B, ar) -29.1 -8.7 -6.8 Merch. Trade Bal. (US$B, ar) -0.3 -0.7 -0.2 0.0 (Oct) Industrial Production 6.0 4.2 6.2 10.9 (Sep) CPI 6.4 7.1 4.4 6.2 (Nov)
Brazil 2013 14Q2 14Q3 Latest Chile 2013 14Q2 14Q3 Latest Real GDP 2.3 -0.7 -0.1 Real GDP 4.1 1.9 0.8 Current Acc. Bal. (US$B, ar) -81.1 -72.5 -77.4 Current Acc. Bal. (US$B, ar) -4.8 -0.6 -6.7 Merch. Trade Bal. (US$B, ar) 2.6 14.3 7.2 -28.2 (Nov) Merch. Trade Bal. (US$B, ar) 8.0 11.6 4.8 6.8 (Oct) Industrial Production 2.2 -4.2 -3.8 -3.2 (Oct) Industrial Production 3.0 2.1 -1.4 -0.1 (Oct) CPI 6.2 6.4 6.6 11.8 (Nov) CPI 1.9 4.5 4.7 5.7 (Oct)
Peru Colombia Real GDP 5.9 1.7 1.8 Real GDP 4.7 4.3 Current Acc. Bal. (US$B, ar) -9.1 -3.5 Current Acc. Bal. (US$B, ar) -12.3 -4.2 Merch. Trade Bal. (US$B, ar) 0.1 -0.4 -0.2 -0.3 (Sep) Merch. Trade Bal. (US$B, ar) 0.2 -0.2 -0.4 -0.4 (Sep) Unemployment Rate (%) 5.9 5.9 5.7 5.7 (Oct) Industrial Production -1.8 -0.4 1.1 1.4 (Sep) CPI 2.8 3.5 2.9 3.2 (Nov) CPI 2.0 2.8 2.9 3.3 (Oct)
Latin America
Economic Statistics
All data expressed as year-over-year % change unless otherwise noted.
Source: Bloomberg, Global Insight, Scotiabank Economics.
A11

Economics
Global Views
December 5, 2014
10
Financial Statistics
A12
Interest Rates (%, end of period)
Canada 14Q2 14Q3 Nov/28 Dec/05* United States 14Q2 14Q3 Nov/28 Dec/05*BoC Overnight Rate 1.00 1.00 1.00 1.00 Fed Funds Target Rate 0.25 0.25 0.25 0.25 3-mo. T-bill 0.95 0.92 0.91 0.90 3-mo. T-bill 0.02 0.02 0.01 0.02 10-yr Gov’t Bond 2.24 2.15 1.86 1.96 10-yr Gov’t Bond 2.53 2.49 2.16 2.31 30-yr Gov’t Bond 2.78 2.67 2.42 2.49 30-yr Gov’t Bond 3.36 3.20 2.89 2.98 Prime 3.00 3.00 3.00 3.00 Prime 3.25 3.25 3.25 3.25 FX Reserves (US$B) 75.7 73.6 73.8 (Oct) FX Reserves (US$B) 134.1 126.0 125.2 (Oct)
Germany France 3-mo. Interbank 0.15 0.04 0.04 0.04 3-mo. T-bill 0.02 -0.03 -0.03 -0.02 10-yr Gov’t Bond 1.25 0.95 0.70 0.78 10-yr Gov’t Bond 1.70 1.29 0.97 1.03 FX Reserves (US$B) 66.1 65.1 65.4 (Oct) FX Reserves (US$B) 55.2 50.6 52.2 (Oct)
Euro Zone United Kingdom Refinancing Rate 0.15 0.05 0.05 0.05 Repo Rate 0.50 0.50 0.50 0.50 Overnight Rate 0.34 0.20 0.13 -0.02 3-mo. T-bill 0.44 0.51 0.47 0.47 FX Reserves (US$B) 340.3 329.4 330.1 (Oct) 10-yr Gov’t Bond 2.67 2.43 1.93 2.02
FX Reserves (US$B) 99.4 94.4 95.7 (Oct)
Japan Australia Discount Rate 0.30 0.30 0.30 0.30 Cash Rate 2.50 2.50 2.50 2.50 3-mo. Libor 0.07 0.05 0.04 0.04 10-yr Gov’t Bond 3.54 3.48 3.03 3.04 10-yr Gov’t Bond 0.57 0.53 0.42 0.42 FX Reserves (US$B) 55.9 50.1 44.2 (Oct) FX Reserves (US$B) 1251.5 1234.4 1237.2 (Oct)
Exchange Rates (end of period)
USDCAD 1.07 1.12 1.14 1.14 ¥/US$ 101.33 109.65 118.63 121.45CADUSD 0.94 0.89 0.88 0.87 US¢/Australian$ 0.94 0.87 0.85 0.83GBPUSD 1.711 1.621 1.565 1.559 Chinese Yuan/US$ 6.20 6.14 6.15 6.15EURUSD 1.369 1.263 1.245 1.229 South Korean Won/US$ 1012 1055 1108 1114JPYEUR 0.72 0.72 0.68 0.67 Mexican Peso/US$ 12.968 13.429 13.929 14.291USDCHF 0.89 0.96 0.97 0.98 Brazilian Real/US$ 2.214 2.447 2.565 2.605
Equity Markets (index, end of period)
United States (DJIA) 16827 17043 17828 17952 U.K. (FT100) 6744 6623 6723 6745 United States (S&P500) 1960 1972 2068 2074 Germany (Dax) 9833 9474 9981 10050 Canada (S&P/TSX) 15146 14961 14745 14481 France (CAC40) 4423 4416 4390 4412 Mexico (IPC) 42737 44986 44190 43039 Japan (Nikkei) 15162 16174 17460 17920 Brazil (Bovespa) 53168 54116 54724 51440 Hong Kong (Hang Seng) 23191 22933 23987 24003 Italy (BCI) 1155 1119 1081 1068 South Korea (Composite) 2002 2020 1981 1987
Commodity Prices (end of period)
Pulp (US$/tonne) 1030 1030 1025 1025 Copper (US$/lb) 3.15 3.06 2.96 2.96 Newsprint (US$/tonne) 605 605 600 600 Zinc (US$/lb) 1.00 1.04 1.01 1.01 Lumber (US$/mfbm) 346 340 334 332 Gold (US$/oz) 1315.00 1216.50 1182.75 1194.00 WTI Oil (US$/bbl) 105.37 91.16 66.15 65.57 Silver (US$/oz) 20.87 17.11 15.97 16.33 Natural Gas (US$/mmbtu) 4.46 4.12 4.09 3.73 CRB (index) 308.22 278.55 254.37 252.05
* Latest observation taken at time of writing. Source: Bloomberg, Scotiabank Economics.
A12

Global Views
December 5, 2014
Fixed Income Strategy (London) www.gbm.scotiabank.com © 2012, The Bank of Nova Scotia This material, its content, or any copy of it, may not be altered in any way, transmitted to, copied or distributed to any other party without the prior express written consent of ScotiabankTM. This material has not been prepared by a member of the research department of Scotiabank, it is solely for the use of sophisticated institutional investors, and this material does not constitute investment advice or any personal recommendation to invest in a financial instrument or “investment research” as defined by the Financial Services Authority. This material is provided for information and discussion purposes only. An investment decision should not be made solely on the basis of the contents of this publication. It is not to be construed as a solicitation or an offer to buy or sell any financial instruments and has no regard to the specific investment objectives, financial situation or particular needs of any recipient. It is not intended to provide legal, tax, accounting or other advice and recipients should obtain specific professional advice from their own legal, tax, accounting or other appropriate professional advisers before embarking on any course of action. The information in this material is based on publicly available information and although it has been compiled or obtained from sources believed to be reliable, such information has not been independently verified and no guarantee, representation or warranty, express or implied, is made as to its accuracy, completeness or correctness. Information included in this material related to comparison performance (whether past or future) or simulated performance (whether past or future) is not a reliable indicator of future returns. This presentation is not directed to or intended for use by any person resident or located in any country where the distribution of such information is contrary to the laws of such country. Scotiabank its directors, officers, employees or clients may currently or from time to time own or hold interests in long or short positions in any securities referred to herein, and may at any time make purchases or sales of these securities as principal or agent. Scotiabank may also have provided or may provide investment banking, capital markets or other services to the companies referred to in this communication.
TM Trademark of The Bank of Nova Scotia. Used under license, where applicable. Scotiabank, together with "Global Banking and Markets", is a marketing name for the global corporate and investment banking and capital markets businesses of The Bank of Nova Scotia and certain of its affiliates in the countries where they operate, including Scotia Capital Inc., Scotia Capital (USA) Inc., Scotiabanc Inc.; Citadel Hill Advisors L.L.C.; The Bank of Nova Scotia Trust Company of New York; Scotiabank Europe plc; Scotia Capital (Europe) Limited; Scotiabank (Ireland) Limited; Scotiabank Inverlat S.A., Institución de Banca Múltiple, Scotia Inverlat Casa de Bolsa S.A. de C.V., Scotia Inverlat Derivados S.A. de C.V. – all members of the Scotiabank Group and authorized users of the mark. The Bank of Nova Scotia is incorporated in Canada with limited liability. Scotia Capital Inc. is a member of CIPF. Scotia Capital (USA) Inc. is a registered broker-dealer with the SEC and is a member of the NASD and SIPC. The Bank of Nova Scotia, Scotiabank Europe plc, Scotia Capital (Europe) Limited and Scotia Capital Inc. are each authorised and regulated by the Financial Services Authority (FSA) in the U.K. Scotiabank Inverlat, S.A., Scotia Inverlat Casa de Bolsa, S.A. de C.V., and Scotia Derivados, S.A. de C.V., are each authorized and regulated by the Mexican financial authorities. Fixed Income Strategy (Paris) Disclaimer © 2011, The Bank of Nova Scotia This material, its content, or any copy of it, may not be altered in any way, transmitted to, copied or distributed to any other party without the prior express written consent of Scotiabank™. This material has not been prepared by a member of the research department of Scotiabank, it is solely for the use of sophisticated institutional investors, and this material does not constitute investment advice or any personal recommendation to invest in a financial instrument or “investment research” as defined by the Financial Services Authority. This material is provided for information and discussion purposes only. An investment decision should not be made solely on the basis of the contents of this publication. It is not to be construed as a solicitation or an offer to buy or sell any financial instruments and has no regard to the specific investment objectives, financial situation or particular needs of any recipient. It is not intended to provide legal, tax, accounting or other advice and recipients should obtain specific professional advice from their own legal, tax, accounting or other appropriate professional advisers before embarking on any course of action. The information in this material is based on publicly available information and although it has been compiled or obtained from sources believed to be reliable, such information has not been independently verified and no guarantee, representation or warranty, express or implied, is made as to its accuracy, completeness or correctness. Information included in this material related to comparison performance (whether past or future) or simulated performance (whether past or future) is not a reliable indicator of future returns. This presentation is not directed to or intended for use by any person resident or located in any country where the distribution of such information is contrary to the laws of such country. Scotiabank its directors, officers, employees or clients may currently or from time to time own or hold interests in long or short positions in any securities referred to herein, and may at any time make purchases or sales of these securities as principal or agent. Scotiabank may also have provided or may provide investment banking, capital markets or other services to the companies referred to in this communication.
Disclaimer

Global Views
December 5, 2014
Foreign Exchange Strategy This publication has been prepared by The Bank of Nova Scotia (Scotiabank) for informational and marketing purposes only. Opinions, estimates and projections contained herein are our own as of the date hereof and are subject to change without notice. The information and opinions contained herein have been compiled or arrived at from sources believed reliable, but no representation or warranty, express or implied, is made as to their accuracy or completeness and neither the information nor the forecast shall be taken as a representation for which Scotiabank, its affiliates or any of their employees incur any responsibility. Neither Scotiabank nor its affiliates accept any liability whatsoever for any loss arising from any use of this information. This publication is not, and is not constructed as, an offer to sell or solicitation of any offer to buy any of the currencies referred to herein, nor shall this publication be construed as an opinion as to whether you should enter into any swap or trading strategy involving a swap or any other transaction. The general transaction, financial, educational and market information contained herein is not intended to be, and does not constitute, a recommendation of a swap or trading strategy involving a swap within the meaning of U.S. Commodity Futures Trading Commission Regulation 23.434 and Appendix A thereto. This material is not intended to be individually tailored to your needs or characteristics and should not be viewed as a “call to action” or suggestion that you enter into a swap or trading strategy involving a swap or any other transaction. You should note that the manner in which you implement any of the strategies set out in this publication may expose you to significant risk and you should carefully consider your ability to bear such risks through consultation with your own independent financial, legal, accounting, tax and other professional advisors. Scotiabank, its affiliates and/or their respective officers, directors or employees may from time to time take positions in the currencies mentioned herein as principal or agent, and may have received remuneration as financial advisor and/or underwriter for certain of the corporations mentioned herein. Directors, officers or employees of Scotiabank and its affiliates may serve as directors of corporations referred to herein. All Scotiabank products and services are subject to the terms of applicable agreements and local regulations. This publication and all information, opinions and conclusions contained in it are protected by copyright. This information may not be reproduced in whole or in part, or referred to in any manner whatsoever nor may the information, opinions and conclusions contained in it be referred to without the prior express written consent of Scotiabank. ™Trademark of The Bank of Nova Scotia. Used under license, where applicable. Scotiabank, together with “Global Banking and Markets”, is a marketing name for the global corporate and investment banking and capital markets businesses of The Bank of Nova Scotia and certain of its affiliates in the countries where they operate, all members of the Scotiabank group and authorized users of the mark. The Bank of Nova Scotia is incorporated in Canada with limited liability and is authorised and regulated by the Office of the Superintendent of Financial Institutions Canada. The Bank of Nova Scotia and Scotiabank Europe plc are authorised by the UK Prudential Regulation Authority. The Bank of Nova Scotia is subject to regulation by the UK Financial Conduct Authority and limited regulation by the UK Prudential Regulation Authority. Scotiabank Europe plc is authorised by the UK Prudential Regulation Authority and regulated by the UK Financial Conduct Authority and the UK Prudential Regulation Authority. Details about the extent of The Bank of Nova Scotia's regulation by the UK Prudential Regulation Authority are available on request. Scotiabank Inverlat, S.A., Scotia Inverlat Casa de Bolsa, S.A. de C.V., and Scotia Inverlat Derivados, S.A. de C.V., are each authorized and regulated by the Mexican financial authorities.Not all products and services are offered in all jurisdictions. Services described are available in jurisdictions where permitted by law.
Disclaimer
Scotiabank Economics
Scotia Plaza 40 King Street West, 63rd Floor
Toronto, Ontario Canada M5H 1H1
Tel: (416) 866-6253 Fax: (416) 866-2829
Email: [email protected]
For general and publication-related inquiries, contact
us by telephone, email and/or fax.
Scotiabank Economics
This report has been prepared by Scotiabank Economics as a resource for the clients of Scotiabank. Opinions, estimates and projections contained herein are our own as of the date hereof and are subject to change without notice. The information and opinions contained herein have been compiled or arrived at from sources believed reliable but no representation or warranty, express or implied, is made as to their accuracy or completeness. Neither Scotiabank nor its affiliates accepts any liability whatsoever for any loss arising from any use of this report or its contents. TM Trademark of The Bank of Nova Scotia. Used under license, where applicable.
Disclaimer
Global Views
December 5, 2014