global warming and local air pollution have reduced wheat yields...
TRANSCRIPT
Global warming and local air pollution have reducedwheat yields in India
Ridhima Gupta1 & E. Somanathan2 & Sagnik Dey3
Received: 4 May 2016 /Accepted: 11 December 2016# Springer Science+Business Media Dordrecht 2016
Abstract We use regression analysis on data from 208 districts over the period 1981–2009 toexamine the impact of temperature and solar radiation (affected by pollution from aerosols) onwheatyields in India. We find that a 1 °C increase in average daily maximum and minimum temperaturestends to lower yields by 2–4% each. A 1% increase in solar radiation increases yields by nearly 1%.Yields are estimated to be about 5.2% lower than they would have been if temperatures had notincreased during the study period. We combine the estimated impacts of weather on yield with theestimated impacts of aerosol pollution (measured bymoderate resolution imaging spectroradiometersensor in terms of aerosol optical depth, aerosol optical depth (AOD) in 2001–2013) on weather tocompute the net impact of reducing aerosol pollution on wheat yields. A one-standard-deviationdecrease in AOD is estimated to increase yields by about 4.8%. Our results imply reducing regionalpollution and curbing global warming in the coming decades can counter wheat yield losses.
1 Introduction
With annual production in 2013 greater than 93 million tonnes, India is the second largestproducer of wheat in the world and accounts for 13% of global wheat supply (FAO, n.d.a).
Climatic ChangeDOI 10.1007/s10584-016-1878-8
Electronic supplementary material The online version of this article (doi:10.1007/s10584-016-1878-8)contains supplementary material, which is available to authorized users.
* Ridhima [email protected]
Sagnik [email protected]
1 Indian School of Business, Hyderabad, India2 Economics and Planning Unit, Indian Statistical Institute, Delhi, India3 Centre for Atmospheric Sciences, Indian Institute of Technology, Delhi, India
While adverse temperature effects on wheat yields have been found using observational data atthe cross-country level (Lobell et al. 2011), Indian wheat is exceptional in being largelyirrigated, so the question is better examined using data from India. Also, this study does notcontrol for solar radiation. Since solar radiation and temperature are correlated and are notexpected to change in the same way as the climate changes, this omission is relevant.
Another study used state-level data from the nine wheat-growing states in India to estimatethe effect of average temperature and pollution variables on wheat yields (Burney andRamanathan 2014) and found a combined yield loss from climate change and pollution of37%, but with a large uncertainty (95% confidence interval from 12 to 65%).
A better understanding of the relative impacts of maximum temperature and minimumtemperature is important as minimum temperature has been rising faster than maximumtemperature in India (Padma Kumari et al. 2007). Further, minimum temperature is projectedto increase at a much faster rate than maximum temperature during winter in north India(Rathore et al. 2013), the predominant wheat growing region of the country. Understanding therelative impact of radiation is also important in view of the projected decline in solar radiationin winter globally probably due to increased cloudiness caused by global warming and aerosolpollution (Ruosteenoja and Ra¨isa¨nen 2009).
Using simulation-based methods, Chameides et al. (1999) examined the impact of aerosolpollution on wheat yields in China. Aerosols affect crop growth by reducing the amount ofsolar radiation passing through the atmosphere by scattering or absorbing it. Thus, a decreasein aerosol pollution may lead to an increase in yields. However, the increase in solar radiationreaching the ground during the day would increase maximum temperature that could loweryields. Aerosols do not have a significant impact on minimum temperature directly as they donot interact with long wave radiation unless a large fraction of dust is present. However, theyhave the potential to modulate minimum temperature indirectly through increased cloudiness(Huang et al. 2006). Thus, in order to estimate the impact of aerosol pollution on yields, theseindirect influences need to be taken into account.
In this paper, we use data from 208 districts over the period 1981–2009 to examine theeffect of maximum temperature, minimum temperature and solar radiation on wheat yields inIndia. These districts account for over 90% of Indian wheat production. We report the effect ofthe rise in maximum and minimum temperatures between 1981 and 2009 on the wheat yield.
We use a separate satellite dataset on daily 1° × 1° gridded aerosol optical depth (AOD)over the period 2001–2013 to estimate the effect of AOD on daily gridded maximumtemperature, log solar radiation and minimum temperature. AOD is a quantitative measureof the extinction of solar radiation by aerosol scattering and absorption. It is a dimensionlessnumber that is related to the amount of aerosol in the vertical column of atmosphere over theobservation location with larger numbers indicating higher concentrations and hence moreaerosol pollution. An AOD value of 0.4 indicates very hazy conditions (Ocean andAdministration, n.d.). The mean value in our data is 0.35, so our study area is, in fact, highlypolluted in winter when wheat is grown. We combine the estimated impacts of annual weathervariables on annual yield from the 1981 to 2009 data with the estimated impacts of dailyaerosol pollution on daily weather from the 2001 to 2013 satellite data to compute the netimpact of reducing aerosol pollution on wheat yields. We cannot directly examine the effect ofAOD on yields in a single regression due to the small number of years for which AOD data areavailable.
The following section describes the data sources. Results of the effects of weather on wheatyields are presented in Section 3. Section 4 discusses the impact of past temperature trend on
Climatic Change
wheat yields. The effect of aerosol pollution on yields is explored in Section 5 and Section 6concludes with implications and limitations of our findings.
2 Data used in yield regressions
We collect data from 208 districts over the period 1981–2009 to examine the effect oftemperature and solar radiation on wheat yields in India. The years here refer to theyears in which the wheat crop was harvested. Indian district boundaries changeperiodically as larger districts have been split into smaller ones. We have dealt withthis by merging new districts into their ‘parent’ (1981) districts in order to have abalanced panel so that within-district variation is preserved. Variables are area-weighted averages of the new districts comprising a parent district. The details ofdata are as follows:
2.1 Agricultural data
We use district-level data on agricultural outcomes primarily from two sources, theIndian Harvest database from the Centre for Monitoring the Indian Economy (CMIE)and the statistics released by the Directorate of Economics, Ministry of Agriculture(MOA) (http://eands.dacnet.nic.in/LUS_1999_2004.htm). The MOA reports district-level area, production and yield and irrigated area for all major crops beginning fromthe year 1999. Hence, prior to 1999, the observations are from the CMIE database.These data are a compilation of the official statistics published by the state govern-ments and the Ministry of Agriculture. Other data sources are the ICRISAT VDSA(Village Dynamics in South Asia) unapportioned Meso database (http://www.icrisat.org/vdsa/vdsa-index.htm) and the statistics complied by the Fertiliser Association ofIndia. These data are from the same original state government sources. Thus, missingdata from either MOA or the CMIE were replaced by data from these sources.
The states of Punjab, Haryana, Uttar Pradesh, Uttarakhand, Bihar, Rajasthan,Madhya Pradesh, Maharashtra and Gujarat comprise the study area. We excludedistricts from the newly created states of Chattisgarh and Jharkhand because data onthe area of the wheat crop that is irrigated was largely missing for these states. Thegrowing season of wheat varies across the states, being slightly longer in the west(about 145 days in Punjab and Haryana) than in the east (about 120 days in Bihar).Wheat is planted about a month earlier in the west. Information on sowing dates andthe length of the growing season was obtained from the crop calendars published bythe Agricultural Meteorological Division of the IMD and data provided by theregional centres of the Indian Agricultural Research Institute.
2.2 Weather data
Daily gridded (1° × 1°) resolution data on temperature and rainfall were obtained fromthe Indian Meteorological Department (IMD). To create daily district-level data, weconstruct the area-weighted average temperature and rainfall of all the grid cellsintersecting a 1981 district.
Climatic Change
Reliable data on surface solar radiation for most of India is not available. Ground-basedmeasurements of solar radiation are available from as few as 12 weather stations across thecountry. We collected daily-level reanalysis data on surface solar radiation from the MERRA(Modern Era-Retrospective Analysis for Research and Applications) database at the (2/3° × 1/2°) resolution (http://disc.sci.gsfc.nasa.gov/mdisc/). For details on how this data is generated,please see Supporting Information (SI). District-level solar radiation was generated in the sameway as temperature and rainfall.
The daily temperature and solar radiation variables were averaged over the growingseason in each year and the rainfall summed over the growing season in each year.The upper panel of Table S1 in SI provides summary statistics of this data.
3 Data used in regressions of weather variables on AOD
For the regressions of weather variables on AOD, we use daily gridded data over theperiod 2001–2013, where these refer to years in which the wheat crop was harvested.Sowing is always in the previous calendar year. Data on AOD is not available beforethe year 2000.
Daily 1° × 1° gridded data on aerosol optical depth at 550 nm was obtained from theGIOVANNI database (Goddard Earth Sciences Data and Information Services Center (GESDISC) http://disc.sci.gsfc.nasa.gov/mdisc/).
Daily gridded (1° × 1°) resolution data on temperature and rainfall were taken from theIndian Meteorological Department (IMD). The 2/3° × 1/2° resolution data on surface solarradiation from the MERRA database was aggregated to the 1° × 1° level. The lower panel ofTable S1 in SI provides summary statistics of this data.
4 Correlations among the variables
As explained in Section 1, the presence of aerosols and clouds ensures that maximumand minimum temperature will not be perfectly correlated. The correlation betweenthe two is only 0.26 (Table 1) and hence we can disentangle the effects of maximumtemperature and minimum temperature on yields. Log solar radiation’s correlation withmaximum temperature was 0.38 and with minimum temperature was −0.39. Thesecorrelations suggest that a failure to account for solar radiation could bias theestimates on the temperature variables.
Table 1 Correlations among the variables
Variable log_SR MinT Rain
MaxT 0.38 (0.00) 0.26 (0.00) −0.42 (0.00)log_SR – −0.39 (0.00) −0.50 (0.00)MinT −0.39 (0.00) – 0.15 (0.00)Rain −0.50 (0.00) 0.15 (0.00) –
Correlations were calculated using residual variation in the variables after removing the influence of district fixedeffects and overall linear time trend. Number of observations = 5920. p values are listed below the correlationcoefficients in parenthesis
Climatic Change
5 Temperature effects on yield
5.1 Linear modelling of temperature
The logged wheat yield was regressed on average daily maximum and minimum temperatures,solar radiation and rainfall. The model is of the form
log Y itð Þ ¼ ci þ γt þ β1MaxTit þ β2MinTit þ β3 log SRitð Þ þ β4Rainit þþuit ð1Þwhere i and t refer to districts and years, respectively, MaxT and MinT are daily maximum
and minimum temperatures averaged over the growing season, log(SR) is average log solarradiation, rain is the total rainfall in a growing season and u is the error term. ci is a district-specific intercept that controls for all district-specific time-invariant factors. The linear trendcoefficient γ captures the effects of capital investment and technical progress. The βs,therefore, capture the effects of deviations from the trend in the weather variables on yields.Table S1 in Supporting Information (SI) reports summary statistics of the key variables ofinterest.
Residuals in the model may be spatially correlated across districts within a state in a yearbecause yields may be spatially correlated. Geographic regions may also have similar errors innearby years. Therefore, we adjust the standard errors to allow for both the spatial and time-series dependence (Conley 2008), (Hsiang 2010).
5.2 Results of the linear model
Coefficient estimates from this model are shown in column 1 of Table 2. A 1 °C increase inmaximum temperature tends to lower yields by 2.3% while the same increase in minimumtemperature lowers yields by 3.6%. There is a near one-to-one relation between solar radiationand yields, which is consistent with evidence from crop simulation models (Chameides et al.1999). The cross-country study (Lobell et al. 2011) found negative yield effects of maximumand minimum temperature of 9 and 4%, respectively, thus over-estimating the temperature-sensitivity of Indian wheat. (Their model is non-linear in temperatures allowing them to reportimpacts for countries in particular temperature ranges.) As mentioned above, this could bebecause Indian wheat is exceptional in being largely irrigated. Irrigation has been found toprotect against yield loss from high temperatures in maize (Schlenker and Roberts 2009), andwe find some (weak) evidence that it may do so in wheat (SI Table S3).
Column 2 of Table 2 shows the estimates from a model controlling for mean temperatureinstead of maximum and minimum temperature. The estimated marginal effect of a 1 degreeincrease in mean temperature is approximately equal to the sum of the marginal effects ofmaximum and minimum temperature reported earlier while the marginal effect of solarradiation is slightly higher. So if maximum and minimum temperatures were to rise by thesame amount, the model with mean temperature would give equivalent results. However,given that minimum temperature is projected to increase by a much faster rate than maximumtemperature (Rathore et al. 2013), our preferred model is the one that controls for maximumtemperature and minimum temperature separately.
Estimates of the model that excluded solar radiation are shown in column 2 of Table 3.Comparing the estimated coefficients on maximum and minimum temperature in columns 2and 3 of this table shows that the omission of solar radiation indeed biases these coefficients.
Climatic Change
Omitting solar radiation halves the magnitude of the marginal effect of maximum temperatureon the yield and considerably exaggerates the marginal effect of minimum temperature. This isimportant for two reasons. First, global warming is likely to raise temperatures but not viaincreased solar radiation. So the omission of solar radiation from estimates will give amisleading picture of the effects of maximum and minimum temperatures on yields. Second,solar radiation reaching the ground is decreased by aerosol pollution suggesting a possible rolefor pollution reduction in raising wheat yields. We explore this effect in detail in the nextsection. Column 5 of Table 3 shows that the estimates on the weather variables are stable afterincluding the share of the wheat crop that is irrigated in each district.
All models so far controlled for an overall linear time trend. Multiple regression estimatesfor specifications with a quadratic trend or state trends are given in the SI, Table S2. Theestimated parameters vary by less than a third when the linear trend is replaced by a quadratictrend or state trends.
Table 2 Weather variable effect on wheat yields
Dependent variable-log of yield of wheat in tonnes per hectare
(1) (2)
MaxT −0.02332b (0.009)MinT −0.03550c (0.013)MeanT −0.05688c (0.013)log_SR 0.921b (0.444) 1.05306b (0.412)Rain 0.001 (0.001) 0.001 (0.001)Linear trend Yes YesDistrict fixed effects Yes YesObservations 5920 5920R-squared 0.945 0.945
Computed standard errors are robust to spatial and serial correlations. Figures in parentheses are standard errorsa Significance at the 10% levelb Significance at the 5% levelc Significance at the 1% level
Table 3 Effect of excluding solar radiation
Dependent variable-log of yield of wheat in tonnes per hectare
MaxT only add MinT add log_SR add Rain
MaxT −0.02346b (0.009) −0.01376 (0.009) −0.02516c (0.009) −0.02332b (0.009)MinT −0.04999c (0.013) −0.03480c (0.013) −0.03550c (0.013)log_SR 0.84227a (0.433) 0.92101b (0.433)Rain 0.00113 (0.001)Linear trend Yes Yes Yes YesDistrict fixed effects Yes Yes Yes YesObservations 5920 5920 5920 5920R-squared 0.944 0.945 0.945 0.945
Standard errors have been corrected for spatial and auto-correlation. Figures in parentheses are standard errorsa Significance at the 10% levelb Significance at the 5% levelc Significance at the 1% level
Climatic Change
We have also assumed that the weather effects are time separable. For checking thevalidity of this assumption, we divide the growing season into three growth phases.We allowed for the weather estimates to vary across each of the three growth phases(Welch et al. 2010; Wardlaw and Moncur 1995). The results in SI Table S4 lendsupport to the assumption of time separability.
5.3 Non-linear modelling of temperature
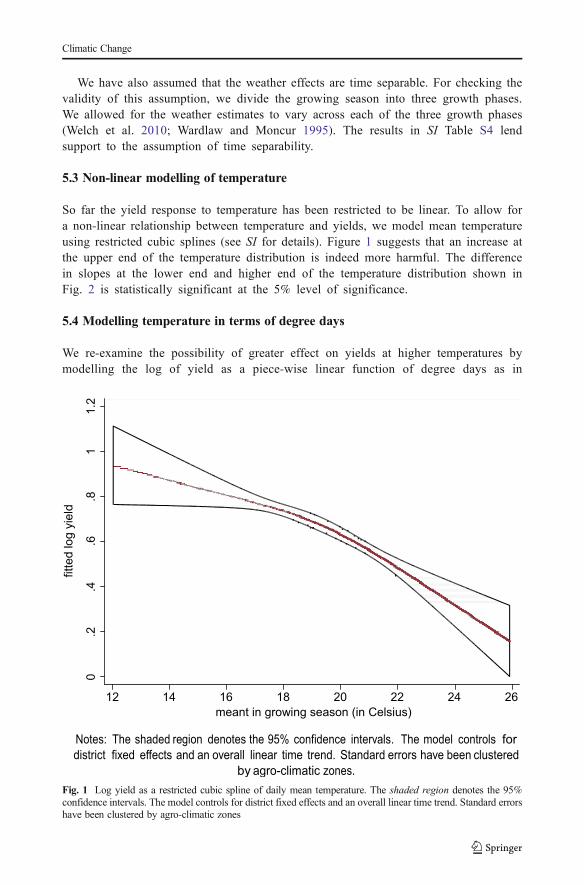
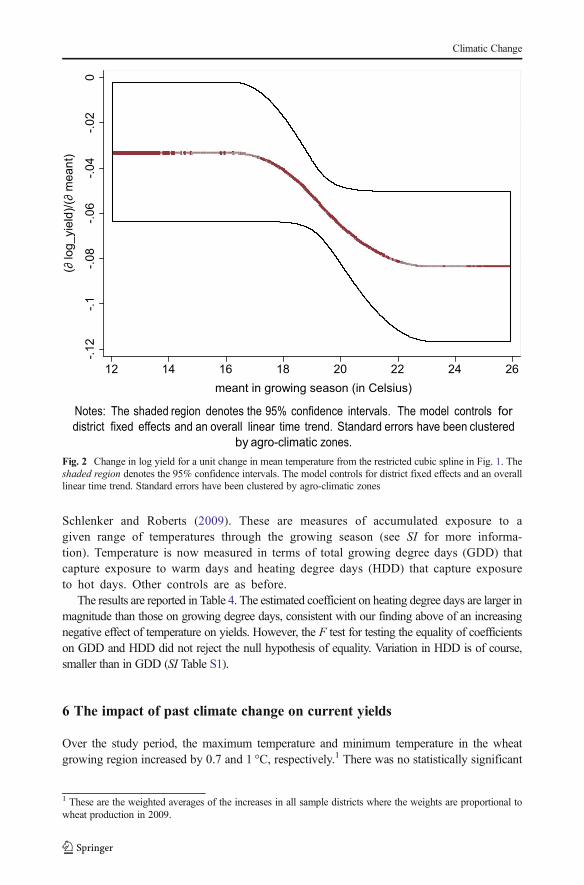
So far the yield response to temperature has been restricted to be linear. To allow fora non-linear relationship between temperature and yields, we model mean temperatureusing restricted cubic splines (see SI for details). Figure 1 suggests that an increase atthe upper end of the temperature distribution is indeed more harmful. The differencein slopes at the lower end and higher end of the temperature distribution shown inFig. 2 is statistically significant at the 5% level of significance.
5.4 Modelling temperature in terms of degree days
We re-examine the possibility of greater effect on yields at higher temperatures bymodelling the log of yield as a piece-wise linear function of degree days as in
fitt
ed
lo
g y
ield
.6
14.
2.0
12 14 16 18 20 22 24 26
meant in growing season (in Celsius)
Notes: The shaded region denotes the 95% confidence intervals. The model controls for
district fixed effects and an overall linear time trend. Standard errors have been clustered
by agro-climatic zones.
1.2
.8
Fig. 1 Log yield as a restricted cubic spline of daily mean temperature. The shaded region denotes the 95%confidence intervals. The model controls for district fixed effects and an overall linear time trend. Standard errorshave been clustered by agro-climatic zones
Climatic Change
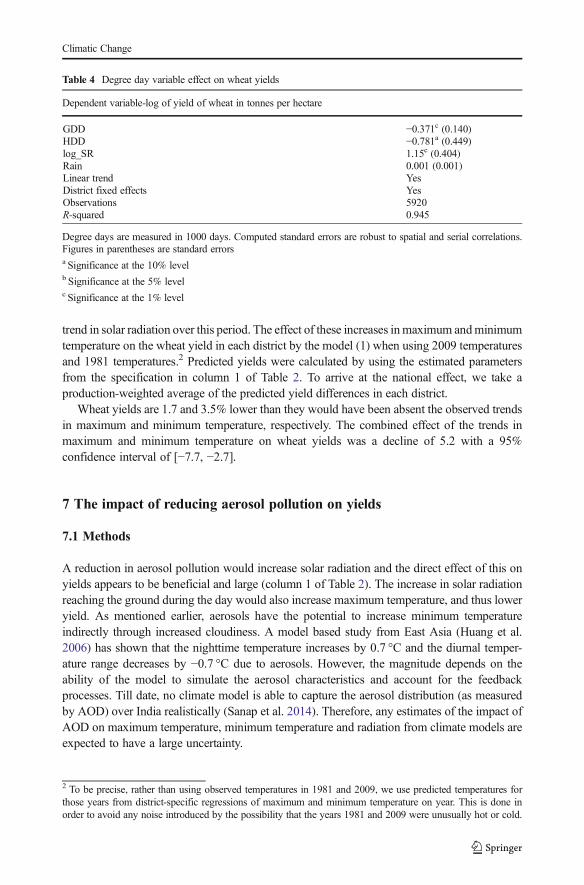
Schlenker and Roberts (2009). These are measures of accumulated exposure to agiven range of temperatures through the growing season (see SI for more informa-tion). Temperature is now measured in terms of total growing degree days (GDD) thatcapture exposure to warm days and heating degree days (HDD) that capture exposureto hot days. Other controls are as before.
The results are reported in Table 4. The estimated coefficient on heating degree days are larger inmagnitude than those on growing degree days, consistent with our finding above of an increasingnegative effect of temperature on yields. However, the F test for testing the equality of coefficientson GDD and HDD did not reject the null hypothesis of equality. Variation in HDD is of course,smaller than in GDD (SI Table S1).
6 The impact of past climate change on current yields
Over the study period, the maximum temperature and minimum temperature in the wheatgrowing region increased by 0.7 and 1 °C, respectively.1 There was no statistically significant
1 These are the weighted averages of the increases in all sample districts where the weights are proportional towheat production in 2009.
(∂ log
_yie
ld)/(
∂ m
ean
t)
0
12 14 16 18 20 22 24 26
meant in growing season (in Celsius)
Notes: The shaded region denotes the 95% confidence intervals. The model controls for
district fixed effects and an overall linear time trend. Standard errors have been clustered
by agro-climatic zones.
-.0
2-.0
4-.0
6-.0
8-.1
2-.1
Fig. 2 Change in log yield for a unit change in mean temperature from the restricted cubic spline in Fig. 1. Theshaded region denotes the 95% confidence intervals. The model controls for district fixed effects and an overalllinear time trend. Standard errors have been clustered by agro-climatic zones
Climatic Change
trend in solar radiation over this period. The effect of these increases inmaximum andminimumtemperature on the wheat yield in each district by the model (1) when using 2009 temperaturesand 1981 temperatures.2 Predicted yields were calculated by using the estimated parametersfrom the specification in column 1 of Table 2. To arrive at the national effect, we take aproduction-weighted average of the predicted yield differences in each district.
Wheat yields are 1.7 and 3.5% lower than they would have been absent the observed trendsin maximum and minimum temperature, respectively. The combined effect of the trends inmaximum and minimum temperature on wheat yields was a decline of 5.2 with a 95%confidence interval of [−7.7, −2.7].
7 The impact of reducing aerosol pollution on yields
7.1 Methods
A reduction in aerosol pollution would increase solar radiation and the direct effect of this onyields appears to be beneficial and large (column 1 of Table 2). The increase in solar radiationreaching the ground during the day would also increase maximum temperature, and thus loweryield. As mentioned earlier, aerosols have the potential to increase minimum temperatureindirectly through increased cloudiness. A model based study from East Asia (Huang et al.2006) has shown that the nighttime temperature increases by 0.7 °C and the diurnal temper-ature range decreases by −0.7 °C due to aerosols. However, the magnitude depends on theability of the model to simulate the aerosol characteristics and account for the feedbackprocesses. Till date, no climate model is able to capture the aerosol distribution (as measuredby AOD) over India realistically (Sanap et al. 2014). Therefore, any estimates of the impact ofAOD on maximum temperature, minimum temperature and radiation from climate models areexpected to have a large uncertainty.
2 To be precise, rather than using observed temperatures in 1981 and 2009, we use predicted temperatures forthose years from district-specific regressions of maximum and minimum temperature on year. This is done inorder to avoid any noise introduced by the possibility that the years 1981 and 2009 were unusually hot or cold.
Table 4 Degree day variable effect on wheat yields
Dependent variable-log of yield of wheat in tonnes per hectare
GDD −0.371c (0.140)HDD −0.781a (0.449)log_SR 1.15c (0.404)Rain 0.001 (0.001)Linear trend YesDistrict fixed effects YesObservations 5920R-squared 0.945
Degree days are measured in 1000 days. Computed standard errors are robust to spatial and serial correlations.Figures in parentheses are standard errorsa Significance at the 10% levelb Significance at the 5% levelc Significance at the 1% level
Climatic Change
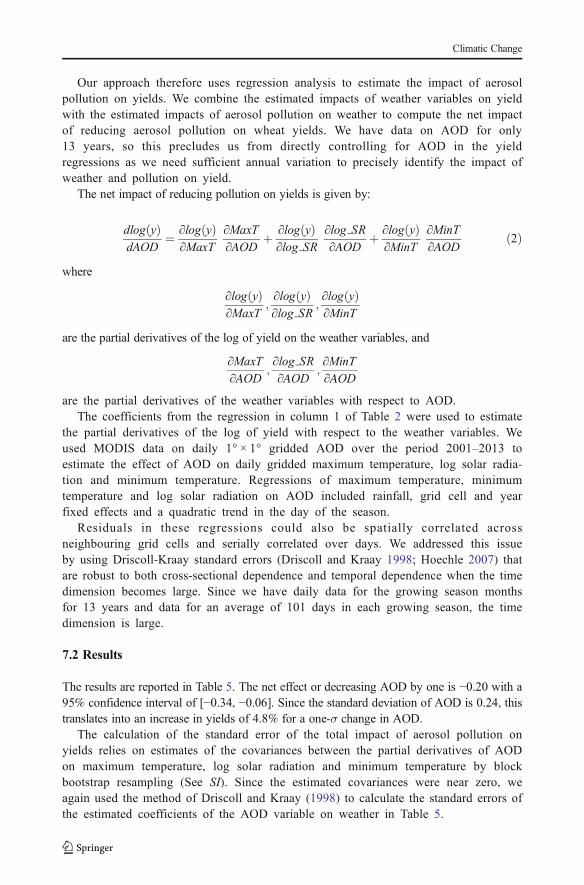
Our approach therefore uses regression analysis to estimate the impact of aerosolpollution on yields. We combine the estimated impacts of weather variables on yieldwith the estimated impacts of aerosol pollution on weather to compute the net impactof reducing aerosol pollution on wheat yields. We have data on AOD for only13 years, so this precludes us from directly controlling for AOD in the yieldregressions as we need sufficient annual variation to precisely identify the impact ofweather and pollution on yield.
The net impact of reducing pollution on yields is given by:
dlog yð ÞdAOD
¼ ∂log yð Þ∂MaxT
∂MaxT∂AOD
þ ∂log yð Þ∂log SR
∂log SR∂AOD
þ ∂log yð Þ∂MinT
∂MinT∂AOD
ð2Þ
where
∂log yð Þ∂MaxT
;∂log yð Þ∂log SR
;∂log yð Þ∂MinT
are the partial derivatives of the log of yield on the weather variables, and
∂MaxT∂AOD
;∂log SR∂AOD
;∂MinT∂AOD
are the partial derivatives of the weather variables with respect to AOD.The coefficients from the regression in column 1 of Table 2 were used to estimate
the partial derivatives of the log of yield with respect to the weather variables. Weused MODIS data on daily 1° × 1° gridded AOD over the period 2001–2013 toestimate the effect of AOD on daily gridded maximum temperature, log solar radia-tion and minimum temperature. Regressions of maximum temperature, minimumtemperature and log solar radiation on AOD included rainfall, grid cell and yearfixed effects and a quadratic trend in the day of the season.
Residuals in these regressions could also be spatially correlated acrossneighbouring grid cells and serially correlated over days. We addressed this issueby using Driscoll-Kraay standard errors (Driscoll and Kraay 1998; Hoechle 2007) thatare robust to both cross-sectional dependence and temporal dependence when the timedimension becomes large. Since we have daily data for the growing season monthsfor 13 years and data for an average of 101 days in each growing season, the timedimension is large.
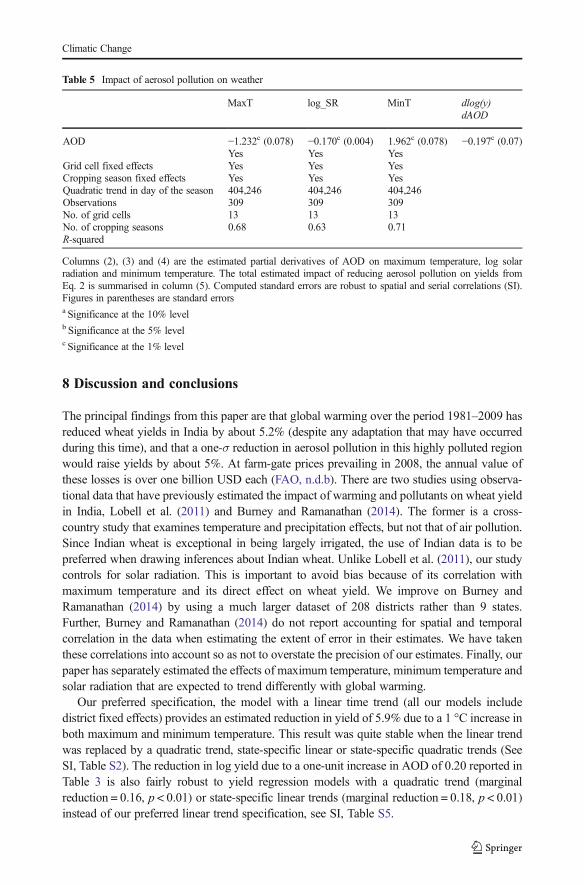
7.2 Results
The results are reported in Table 5. The net effect or decreasing AOD by one is −0.20 with a95% confidence interval of [−0.34, −0.06]. Since the standard deviation of AOD is 0.24, thistranslates into an increase in yields of 4.8% for a one-σ change in AOD.
The calculation of the standard error of the total impact of aerosol pollution onyields relies on estimates of the covariances between the partial derivatives of AODon maximum temperature, log solar radiation and minimum temperature by blockbootstrap resampling (See SI). Since the estimated covariances were near zero, weagain used the method of Driscoll and Kraay (1998) to calculate the standard errors ofthe estimated coefficients of the AOD variable on weather in Table 5.
Climatic Change
8 Discussion and conclusions
The principal findings from this paper are that global warming over the period 1981–2009 hasreduced wheat yields in India by about 5.2% (despite any adaptation that may have occurredduring this time), and that a one-σ reduction in aerosol pollution in this highly polluted regionwould raise yields by about 5%. At farm-gate prices prevailing in 2008, the annual value ofthese losses is over one billion USD each (FAO, n.d.b). There are two studies using observa-tional data that have previously estimated the impact of warming and pollutants on wheat yieldin India, Lobell et al. (2011) and Burney and Ramanathan (2014). The former is a cross-country study that examines temperature and precipitation effects, but not that of air pollution.Since Indian wheat is exceptional in being largely irrigated, the use of Indian data is to bepreferred when drawing inferences about Indian wheat. Unlike Lobell et al. (2011), our studycontrols for solar radiation. This is important to avoid bias because of its correlation withmaximum temperature and its direct effect on wheat yield. We improve on Burney andRamanathan (2014) by using a much larger dataset of 208 districts rather than 9 states.Further, Burney and Ramanathan (2014) do not report accounting for spatial and temporalcorrelation in the data when estimating the extent of error in their estimates. We have takenthese correlations into account so as not to overstate the precision of our estimates. Finally, ourpaper has separately estimated the effects of maximum temperature, minimum temperature andsolar radiation that are expected to trend differently with global warming.
Our preferred specification, the model with a linear time trend (all our models includedistrict fixed effects) provides an estimated reduction in yield of 5.9% due to a 1 °C increase inboth maximum and minimum temperature. This result was quite stable when the linear trendwas replaced by a quadratic trend, state-specific linear or state-specific quadratic trends (SeeSI, Table S2). The reduction in log yield due to a one-unit increase in AOD of 0.20 reported inTable 3 is also fairly robust to yield regression models with a quadratic trend (marginalreduction = 0.16, p < 0.01) or state-specific linear trends (marginal reduction = 0.18, p < 0.01)instead of our preferred linear trend specification, see SI, Table S5.
Table 5 Impact of aerosol pollution on weather
MaxT log_SR MinT dlog(y)dAOD
AOD −1.232c (0.078) −0.170c (0.004) 1.962c (0.078) −0.197c (0.07)Yes Yes Yes
Grid cell fixed effects Yes Yes YesCropping season fixed effects Yes Yes YesQuadratic trend in day of the season 404,246 404,246 404,246Observations 309 309 309No. of grid cells 13 13 13No. of cropping seasons 0.68 0.63 0.71R-squared
Columns (2), (3) and (4) are the estimated partial derivatives of AOD on maximum temperature, log solarradiation and minimum temperature. The total estimated impact of reducing aerosol pollution on yields fromEq. 2 is summarised in column (5). Computed standard errors are robust to spatial and serial correlations (SI).Figures in parentheses are standard errorsa Significance at the 10% levelb Significance at the 5% levelc Significance at the 1% level
Climatic Change
When making inferences about the effects of coming climate change, it should be noted thatif farmers are able to switch to heat resistant varieties in the future, then damages would be lessthan those found here. On the other hand, yield losses may be higher due to the increasedoccurrence of extreme temperature events that is expected to occur with climate change.Although we found some evidence that yield losses per degree increase in temperature aregreater at higher temperatures, the fact that very hot days are not yet frequent means that wecould not reliably estimate their impact on wheat yields.
Acknowledgments Sagnik Dey acknowledges funding from the Department of Science and Technology, Govt.of India (DST/CCP/PR/11/2011) through a research project operational at IIT Delhi (IITD/IRD/RP2580).
References
Burney J, Ramanathan V (2014) Recent climate and air pollution impacts on Indian agriculture. Proc Natl AcadSci U S A 111(46):16319–16324
Chameides W, Yu H, Liu S, Bergin M, Zhou X, Mearns L, Wang G, Kiang C, Saylor R, Luo C et al (1999) Casestudy of the effects of atmospheric aerosols and regional haze on agriculture: an opportunity to enhance cropyields in China through emission controls? Proc Natl Acad Sci U S A 96(24):13626–13633
Conley TG (2008) Spatial econometrics. In: Durlauf SN, Blume LE (eds) The new palgrave dictionary ofeconomics. Palgrave Macmillan, Basingstoke
Driscoll JC, Kraay AC (1998) Consistent covariance matrix estimation with spatially dependent panel data. RevEcon Stat 80(4):549–560
FAO (n.d.a). FAO, Food and Agriculture Organisation. URL: http://faostat3.fao.org/browse/Q/QC/EFAO (n.d.b). FAO, Food and Agriculture Organisation. URL: http://faostat3.fao.org/download/P/PP/EHoechle D (2007) Robust standard errors for panel regressions with cross-sectional dependence. Stata J 7(3):281Hsiang SM (2010) Temperatures and cyclones strongly associated with economic production in the Caribbean
and Central America. Proc Natl Acad Sci U S A 107(35):15367–15372Huang Y, Dickinson RE, Chameides WL (2006) Impact of aerosol indirect effect on surface temperature over
East Asia. Proc Natl Acad Sci U S A 103(12):4371–4376Lobell DB, Schlenker W, Costa-Roberts J (2011) Climate trends and global crop production since 1980. Science
333(6042):616–620Ocean, N. and Administration, A. (n.d.). NOAA. URL: http://www.esrl.noaa.gov/gmd/grad/surfrad/aod/Padma Kumari, B., Londhe, A., Daniel, S. and Jadhav, D. (2007). Observational evidence of solar dimming:
offsetting surface warming over India, Geophysical Research Letters 34(21)Rathore, L., Attri, S. and Jaswal, A (2013) State level climate change trends in India, Technical Report
ESSO/IMD/EMRC/02/2013, Indian Meteorological De- partmentRuosteenoja, K. and Ra¨isa¨nen, J (2009) Solar radiation projections derived from global climate models (part of
ces deliverable d2. 4)Sanap S, Ayantika D, Pandithurai G, Niranjan K (2014) Assessment of the aerosol distribution over Indian
subcontinent in CMIP5 models. Atmos Environ 87:123–137Schlenker W, Roberts MJ (2009) Nonlinear temperature effects indicate severe damages to US crop yields under
climate change. Proc Natl Acad Sci U S A 106(37):15594–15598Wardlaw I, Moncur L (1995) The response of wheat to high temperature following anthesis. I. The rate and
duration of kernel filling. Funct Plant Biol 22(3):391–397Welch JR, Vincent JR, Auffhammer M, Moya PF, Dobermann A, Dawe D (2010) Rice yields in tropical/
subtropical Asia exhibit large but opposing sensitivities to minimum and maximum temperatures. Proc NatlAcad Sci U S A 107(33):14562–14567
Climatic Change