global warming benefits the small in aquatic ecosystems
TRANSCRIPT

Global warming benefits the smallin aquatic ecosystemsMartin Daufresnea,b,1, Kathrin Lengfellnera, and Ulrich Sommera
aFB3–Marine Okologie, Leibniz-Institut fur Meereswissenschaften (IFM-GEOMAR), 24105 Kiel, Germany; and bHYAX–Lake Ecosystems Laboratory,Cemagref, 13182 Aix-en-Provence, France
Edited by Stephen R. Carpenter, University of Wisconsin, Madison, WI, and approved June 3, 2009 (received for review February 25, 2009)
Understanding the ecological impacts of climate change is a crucialchallenge of the twenty-first century. There is a clear lack ofgeneral rules regarding the impacts of global warming on biota.Here, we present a metaanalysis of the effect of climate change onbody size of ectothermic aquatic organisms (bacteria, phyto- andzooplankton, and fish) from the community to the individual level.Using long-term surveys, experimental data and published results,we show a significant increase in the proportion of small-sizedspecies and young age classes and a decrease in size-at-age. Theseresults are in accordance with the ecological rules dealing with thetemperature–size relationships (i.e., Bergmann’s rule, James’ ruleand Temperature–Size Rule). Our study provides evidence thatreduced body size is the third universal ecological response toglobal warming in aquatic systems besides the shift of speciesranges toward higher altitudes and latitudes and the seasonalshifts in life cycle events.
biological scale � body size � climate change � ectotherms � metaanalysis
A t the biogeographical scale, the most noticeable ecologicalimpact of global warming is a shift of species’ ranges toward
higher altitudes and latitudes in accordance with their thermalpreferences (1–3). This observation has been used extensively toforecast the effect of climate change on biota by modeling futurespecies distributions according to climate-change scenarios (4).However, such patterns and pattern-related predictions do notelaborate specific underlying ecological mechanisms. As a con-sequence, our understanding and, in turn, our ability to forecastthe impacts of climate change on biota remains limited (e.g., itseems possible to forecast species’ ranges, but it remains difficultto predict the relative abundances of species within a commu-nity). Besides the shifts in species’ ranges, the second well-knownecological response to global warming is a change in phenology(3). Such patterns could lead to a decoupling of the dynamics ofpredators and prey (5). This mechanism-oriented hypothesis,generally referred to as the match–mismatch hypothesis (6),offers perspectives in forecasting the ecological impacts ofclimate change (5, 7, 8). Nevertheless, all of the components ofthe food web can be affected by dissimilar changes in phenology,leading to complex dynamics that are difficult to predict (5). Thematch–mismatch hypothesis and the shifts of species’ ranges arekey tools when evaluating the ecological consequences of globalwarming, but they are thus far insufficient to provide clear viewson future ecological changes. Further general rules dealing withthe impacts of a global rise in temperature on biota are needed.
Body size is a fundamental biological characteristic that scaleswith many ecological properties (e.g., fecundity, populationgrowth rate, competitive interactions) (9, 10). Surprisingly, fewstudies have dealt with changes in body size with global warming(10), especially for ectotherms, although they represent �99.9%of species on Earth (11). Furthermore, the biological scales(individual, population, community) at which global warmingshould act on body size have not been studied. Three rulesconcerning ecogeographical and ecothermal gradients (10) arerelevant in this context. First, Bergmann’s rule (12), states thatwarm regions tend to be inhabited by small-sized species.
Second, James’ rule (13) states that, within a species, populationswith smaller body size are generally found in warmer environ-ments. Third, the temperature–size rule (TSR) states that theindividual body size of ectotherms tends to decrease withincreasing temperature (14). Combining these rules, we canbuild a set of 5 hierarchical and nonmutually exclusive hypoth-eses concerning the potential effect of climate change on sizestructures from the individual to the community scales (Fig. 1).The first hypothesis predicts a decrease in mean body size at thecommunity scale under warming whatever the underlying mech-anisms (community body size shift hypothesis). If there is adecrease in the mean body size at the community scale underwarming, there are 4 subsequent hypotheses that could explainthis decrease. According to Bergmann’s rule, the first mecha-nism acts at the community scale is an increase in the proportionof small size species (species shift hypothesis) in terms ofabundances of individuals and/or number of species. Second,according to James’ rule, the decrease in size at the communityscale could also be due to a decrease in mean body size at thepopulation scale (population body size shift hypothesis). In turn,such a size decrease at the population scale could be due to 2mechanisms. First, according to the TSR, the size-at-age (orsize-at-stage; individual scale) should decrease with increasingtemperature (size-at-age shift hypothesis). Note, however, thatthis decrease should not be observed for early ages or stagesbecause the TSR predict a higher growth rate but a lower finalsize at higher temperature. In addition to this decrease insize-at-age/stage, an increase in the proportion of juveniles(population age-structure shift hypothesis) could also be ex-pected at the population scale. The latter hypothesis does notcorrespond to the above-cited ecogeographical or ecothermalrules, but it is the default explanation if the population body sizeshift hypothesis applies whereas the size-at-age shift hypothesisdoes not apply. Note that, due to compensatory effects, theinvalidation of a hypothesis does not imply that both subsequenthypotheses do not apply. For instance, no changes in mean sizeat the community scale can be due to a decrease in mean bodysize at the population scale and an increase in proportion of largespecies.
In this article, we studied changes in body size from individualsto communities under climate warming by testing the 5 hypoth-eses described above. The tests of the hypotheses were based on(i) the analysis of the effects of increasing temperature onlong-term fish data sampled in French rivers and in the BalticSea, (ii) the analysis of experimental plankton data (bacteria,phyto- and zooplankton) collected in light- and temperature-controlled mesocosms (15), and (iii) on a review of relatedpublished work based on data collected in mesocosms and in the
Author contributions: M.D. and U.S. designed research; M.D., K.L., and U.S. performedresearch; M.D. analyzed data; and M.D. wrote the article.
The authors declare no conflict of interest.
This article is a PNAS Direct Submission.
1To whom correspondence should be addressed. E-mail: [email protected].
This article contains supporting information online at www.pnas.org/cgi/content/full/0902080106/DCSupplemental.
12788–12793 � PNAS � August 4, 2009 � vol. 106 � no. 31 www.pnas.org�cgi�doi�10.1073�pnas.0902080106

North Sea (Fig. 2). Impacts of potential confounding factors, andespecially of fisheries, were considered. Our results support thehypothesis that reduced body size is a third universal or verygeneral ecological response to global warming among ecto-therms in aquatic systems, besides the shift of species rangestoward higher altitudes and latitudes and the seasonal shifts inlife-cycle events.
ResultsWe found that increased temperature acts on communities,populations and individuals through changes in species compo-sition, growth and reproduction.
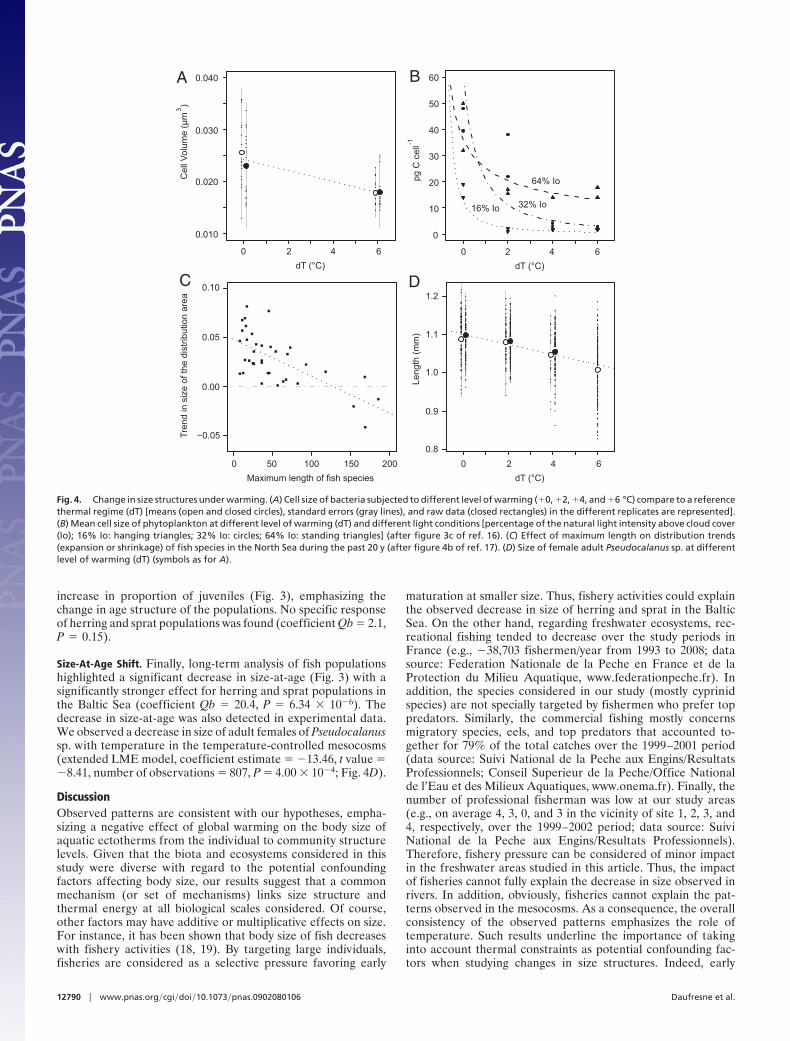
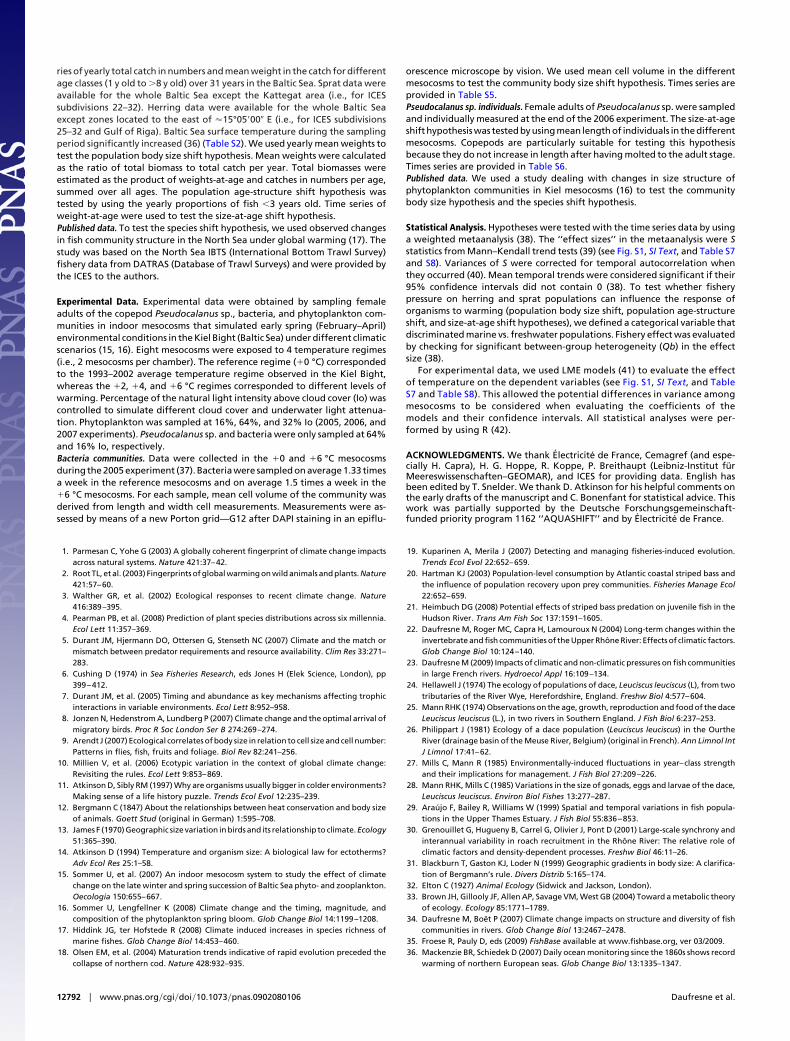
Community Body Size Shift. A metaanalysis revealed that the meantemporal trend (S) of mean body size of fish in large Frenchrivers was significantly negative during the last 2–3 decadesunder gradual warming (Fig. 3). A decrease in mean body sizewith increasing temperature was also observed for bacteria intemperature-controlled mesocosms [extended linear mixed-effect (LME) model, coefficient estimate � �1.06 � 10�3, tvalue � �5.51, number of observations � 68, P � 3.1 � 10�2;
Fig. 4A]. The mean cell size of phytoplankton also tended todecrease with increasing temperature in the same mesocosms(16) (Fig. 4B).
Species Shift. Supporting the species-shift hypothesis, the pro-portion of small-sized species significantly increased in commu-nities of large French rivers (Fig. 3) both in terms of speciesrichness and abundance. Similar patterns were also observed forthe fish community of the North Sea where the geographicalranges of small species expanded, whereas those of large speciesshrank due to warming (17) (Fig. 4C). In this way, the more evendistribution of small species and the patchier distribution of largespecies should result locally in an average temporal increase inthe number of small species and an average decrease in thenumber of large species. Finally, because the same size si wasattributed to all individuals from a given phytoplankton taxon iin ref. 16, the observed decrease in mean size described above(community body size shift; Fig. 4B) is entirely due to an increasein proportion of abundances of small-sized taxa.
Population Body Size Shift. Besides interspecific patterns, ourmetaanalysis revealed a negative temporal trend in the meanbody size of individual fish populations under global warming(Fig. 3). Herring and sprat populations in the Baltic Sea showedmerely significant stronger decrease in mean size than freshwa-ter species populations (coefficient Qb � 2.67, P � 0.10),underlining the potential additive effect of fisheries.
Population Age-Structure Shift. The decrease in fish mean bodysize at the population scale was partially due to a significant
Community Population Individual
Community bodysize shift hypothesis
Species shifthypothesis
Population bodysize shift hypothesis
Decrease in meanbody size
Decrease in mean body size
Increase in proportionof small species
Decrease in individualbody sizes
Increase in proportionof juveniles
Size-at-age shifthypothesis
Population age-structureshift hypothesis
Fig. 1. The tested hypotheses regarding the impact of warming on body sizeat different biological scales.
...
..
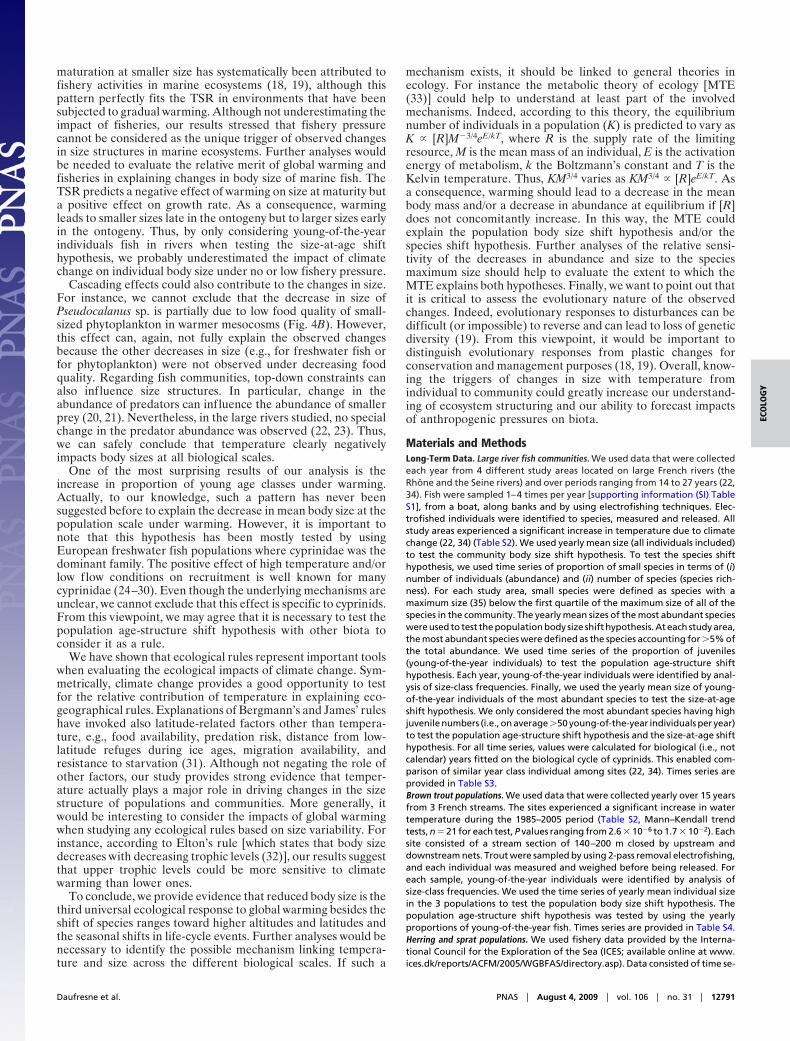
Fig. 2. Location of the study areas. 1–4: Long-term survey of freshwater fishcommunities in large rivers. 5–7: Long-term survey of brown trout popula-tions. 8: Long term survey of North Sea fish community. 9–10: Long termsurvey of herring and sprat populations in the Baltic Sea. 11–13: Sampling ofbacteria and phytoplankton communities and of Pseudocalanus sp. (zoo-plankton) in temperature-controlled mesocosms. Numbers in brackets refer topublished climate–size relationships reviewed in this article (16, 17).
0
-100
-200
-300
100
200
-50
-150
-250
50
150
Tren
d st
atis
tic S
Community body sizeshift hyp.
Populationbody sizeshift hyp.
Speciesshift hyp.
Size-at-ageshift hyp.
Populationage-struct.shift hyp.
F
M
Meansize at age
Prop.juveniles
Meansp. size
Prop.small sp.
Meansize
F
M (/2)
SR
Ab.
300
Fig. 3. Mean effect sizes (i.e., mean weighted temporal trend statistic S;�95% confidence intervals). Negative or positive trend values indicate tem-poral decrease or increase, respectively. Mean temporal trends are significantif their 95% confidence intervals did not contain 0. Community body size shiftand species shift hypotheses were tested by using 4 freshwater fish commu-nities. To test the species shift hypothesis, small species were defined as specieswith a maximum size below the first quartile of the maximum size of all of thespecies in the community. Proportions of small species are calculated in termsof species richness (SR) and abundances (Ab.). Population body size shift andpopulation age-structure shift hypotheses were tested by using 28 and 18 fishpopulations, respectively. Size-at-age shift hypothesis was tested by using 28age classes. Significantly different means for marine (M) vs. freshwater (F)populations are represented. To increase readability some effect sizes aredivided by a factor x (indicated in the figure as /x).
Daufresne et al. PNAS � August 4, 2009 � vol. 106 � no. 31 � 12789
ECO
LOG
Y
increase in proportion of juveniles (Fig. 3), emphasizing thechange in age structure of the populations. No specific responseof herring and sprat populations was found (coefficient Qb � 2.1,P � 0.15).
Size-At-Age Shift. Finally, long-term analysis of fish populationshighlighted a significant decrease in size-at-age (Fig. 3) with asignificantly stronger effect for herring and sprat populations inthe Baltic Sea (coefficient Qb � 20.4, P � 6.34 � 10�6). Thedecrease in size-at-age was also detected in experimental data.We observed a decrease in size of adult females of Pseudocalanussp. with temperature in the temperature-controlled mesocosms(extended LME model, coefficient estimate � �13.46, t value ��8.41, number of observations � 807, P � 4.00 � 10�4; Fig. 4D).
DiscussionObserved patterns are consistent with our hypotheses, empha-sizing a negative effect of global warming on the body size ofaquatic ectotherms from the individual to community structurelevels. Given that the biota and ecosystems considered in thisstudy were diverse with regard to the potential confoundingfactors affecting body size, our results suggest that a commonmechanism (or set of mechanisms) links size structure andthermal energy at all biological scales considered. Of course,other factors may have additive or multiplicative effects on size.For instance, it has been shown that body size of fish decreaseswith fishery activities (18, 19). By targeting large individuals,fisheries are considered as a selective pressure favoring early
maturation at smaller size. Thus, fishery activities could explainthe observed decrease in size of herring and sprat in the BalticSea. On the other hand, regarding freshwater ecosystems, rec-reational fishing tended to decrease over the study periods inFrance (e.g., �38,703 fishermen/year from 1993 to 2008; datasource: Federation Nationale de la Peche en France et de laProtection du Milieu Aquatique, www.federationpeche.fr). Inaddition, the species considered in our study (mostly cyprinidspecies) are not specially targeted by fishermen who prefer toppredators. Similarly, the commercial fishing mostly concernsmigratory species, eels, and top predators that accounted to-gether for 79% of the total catches over the 1999–2001 period(data source: Suivi National de la Peche aux Engins/ResultatsProfessionnels; Conseil Superieur de la Peche/Office Nationalde l’Eau et des Milieux Aquatiques, www.onema.fr). Finally, thenumber of professional fisherman was low at our study areas(e.g., on average 4, 3, 0, and 3 in the vicinity of site 1, 2, 3, and4, respectively, over the 1999–2002 period; data source: SuiviNational de la Peche aux Engins/Resultats Professionnels).Therefore, fishery pressure can be considered of minor impactin the freshwater areas studied in this article. Thus, the impactof fisheries cannot fully explain the decrease in size observed inrivers. In addition, obviously, fisheries cannot explain the pat-terns observed in the mesocosms. As a consequence, the overallconsistency of the observed patterns emphasizes the role oftemperature. Such results underline the importance of takinginto account thermal constraints as potential confounding fac-tors when studying changes in size structures. Indeed, early
0.010
0.020
0.030
0.040
Cel
l Vol
ume
(µm
)3
−0.05
0.00
0.05
0.10
0 100 150 200
Tren
d in
siz
e of
the
dist
ribut
ion
area
Maximum length of fish species50
0
10
20
30
40
50
60
pg C
cel
l-1Le
ngth
(mm
)
A
dT (°C)0 2 4 6
0.8
0.9
1.0
1.1
1.2
16% Io 32% Io
64% Io
dT (°C)0 2 4 6
dT (°C)0 2 4 6
B
C D
Fig. 4. Change in size structures under warming. (A) Cell size of bacteria subjected to different level of warming (�0, �2, �4, and �6 °C) compare to a referencethermal regime (dT) [means (open and closed circles), standard errors (gray lines), and raw data (closed rectangles) in the different replicates are represented].(B) Mean cell size of phytoplankton at different level of warming (dT) and different light conditions [percentage of the natural light intensity above cloud cover(Io); 16% Io: hanging triangles; 32% Io: circles; 64% Io: standing triangles] (after figure 3c of ref. 16). (C) Effect of maximum length on distribution trends(expansion or shrinkage) of fish species in the North Sea during the past 20 y (after figure 4b of ref. 17). (D) Size of female adult Pseudocalanus sp. at differentlevel of warming (dT) (symbols as for A).
12790 � www.pnas.org�cgi�doi�10.1073�pnas.0902080106 Daufresne et al.
maturation at smaller size has systematically been attributed tofishery activities in marine ecosystems (18, 19), although thispattern perfectly fits the TSR in environments that have beensubjected to gradual warming. Although not underestimating theimpact of fisheries, our results stressed that fishery pressurecannot be considered as the unique trigger of observed changesin size structures in marine ecosystems. Further analyses wouldbe needed to evaluate the relative merit of global warming andfisheries in explaining changes in body size of marine fish. TheTSR predicts a negative effect of warming on size at maturity buta positive effect on growth rate. As a consequence, warmingleads to smaller sizes late in the ontogeny but to larger sizes earlyin the ontogeny. Thus, by only considering young-of-the-yearindividuals fish in rivers when testing the size-at-age shifthypothesis, we probably underestimated the impact of climatechange on individual body size under no or low fishery pressure.
Cascading effects could also contribute to the changes in size.For instance, we cannot exclude that the decrease in size ofPseudocalanus sp. is partially due to low food quality of small-sized phytoplankton in warmer mesocosms (Fig. 4B). However,this effect can, again, not fully explain the observed changesbecause the other decreases in size (e.g., for freshwater fish orfor phytoplankton) were not observed under decreasing foodquality. Regarding fish communities, top-down constraints canalso influence size structures. In particular, change in theabundance of predators can influence the abundance of smallerprey (20, 21). Nevertheless, in the large rivers studied, no specialchange in the predator abundance was observed (22, 23). Thus,we can safely conclude that temperature clearly negativelyimpacts body sizes at all biological scales.
One of the most surprising results of our analysis is theincrease in proportion of young age classes under warming.Actually, to our knowledge, such a pattern has never beensuggested before to explain the decrease in mean body size at thepopulation scale under warming. However, it is important tonote that this hypothesis has been mostly tested by usingEuropean freshwater fish populations where cyprinidae was thedominant family. The positive effect of high temperature and/orlow flow conditions on recruitment is well known for manycyprinidae (24–30). Even though the underlying mechanisms areunclear, we cannot exclude that this effect is specific to cyprinids.From this viewpoint, we may agree that it is necessary to test thepopulation age-structure shift hypothesis with other biota toconsider it as a rule.
We have shown that ecological rules represent important toolswhen evaluating the ecological impacts of climate change. Sym-metrically, climate change provides a good opportunity to testfor the relative contribution of temperature in explaining eco-geographical rules. Explanations of Bergmann’s and James’ ruleshave invoked also latitude-related factors other than tempera-ture, e.g., food availability, predation risk, distance from low-latitude refuges during ice ages, migration availability, andresistance to starvation (31). Although not negating the role ofother factors, our study provides strong evidence that temper-ature actually plays a major role in driving changes in the sizestructure of populations and communities. More generally, itwould be interesting to consider the impacts of global warmingwhen studying any ecological rules based on size variability. Forinstance, according to Elton’s rule [which states that body sizedecreases with decreasing trophic levels (32)], our results suggestthat upper trophic levels could be more sensitive to climatewarming than lower ones.
To conclude, we provide evidence that reduced body size is thethird universal ecological response to global warming besides theshift of species ranges toward higher altitudes and latitudes andthe seasonal shifts in life-cycle events. Further analyses would benecessary to identify the possible mechanism linking tempera-ture and size across the different biological scales. If such a
mechanism exists, it should be linked to general theories inecology. For instance the metabolic theory of ecology [MTE(33)] could help to understand at least part of the involvedmechanisms. Indeed, according to this theory, the equilibriumnumber of individuals in a population (K) is predicted to vary asK � [R]M�3/4eE/kT, where R is the supply rate of the limitingresource, M is the mean mass of an individual, E is the activationenergy of metabolism, k the Boltzmann’s constant and T is theKelvin temperature. Thus, KM3/4 varies as KM3/4 � [R]eE/kT. Asa consequence, warming should lead to a decrease in the meanbody mass and/or a decrease in abundance at equilibrium if [R]does not concomitantly increase. In this way, the MTE couldexplain the population body size shift hypothesis and/or thespecies shift hypothesis. Further analyses of the relative sensi-tivity of the decreases in abundance and size to the speciesmaximum size should help to evaluate the extent to which theMTE explains both hypotheses. Finally, we want to point out thatit is critical to assess the evolutionary nature of the observedchanges. Indeed, evolutionary responses to disturbances can bedifficult (or impossible) to reverse and can lead to loss of geneticdiversity (19). From this viewpoint, it would be important todistinguish evolutionary responses from plastic changes forconservation and management purposes (18, 19). Overall, know-ing the triggers of changes in size with temperature fromindividual to community could greatly increase our understand-ing of ecosystem structuring and our ability to forecast impactsof anthropogenic pressures on biota.
Materials and MethodsLong-Term Data. Large river fish communities. We used data that were collectedeach year from 4 different study areas located on large French rivers (theRhone and the Seine rivers) and over periods ranging from 14 to 27 years (22,34). Fish were sampled 1–4 times per year [supporting information (SI) TableS1], from a boat, along banks and by using electrofishing techniques. Elec-trofished individuals were identified to species, measured and released. Allstudy areas experienced a significant increase in temperature due to climatechange (22, 34) (Table S2). We used yearly mean size (all individuals included)to test the community body size shift hypothesis. To test the species shifthypothesis, we used time series of proportion of small species in terms of (i)number of individuals (abundance) and (ii) number of species (species rich-ness). For each study area, small species were defined as species with amaximum size (35) below the first quartile of the maximum size of all of thespecies in the community. The yearly mean sizes of the most abundant specieswere used to test the population body size shift hypothesis. At each study area,the most abundant species were defined as the species accounting for �5% ofthe total abundance. We used time series of the proportion of juveniles(young-of-the-year individuals) to test the population age-structure shifthypothesis. Each year, young-of-the-year individuals were identified by anal-ysis of size-class frequencies. Finally, we used the yearly mean size of young-of-the-year individuals of the most abundant species to test the size-at-ageshift hypothesis. We only considered the most abundant species having highjuvenile numbers (i.e., on average �50 young-of-the-year individuals per year)to test the population age-structure shift hypothesis and the size-at-age shifthypothesis. For all time series, values were calculated for biological (i.e., notcalendar) years fitted on the biological cycle of cyprinids. This enabled com-parison of similar year class individual among sites (22, 34). Times series areprovided in Table S3.Brown trout populations. We used data that were collected yearly over 15 yearsfrom 3 French streams. The sites experienced a significant increase in watertemperature during the 1985–2005 period (Table S2, Mann–Kendall trendtests, n � 21 for each test, P values ranging from 2.6 � 10�6 to 1.7 � 10�2). Eachsite consisted of a stream section of 140–200 m closed by upstream anddownstream nets. Trout were sampled by using 2-pass removal electrofishing,and each individual was measured and weighed before being released. Foreach sample, young-of-the-year individuals were identified by analysis ofsize-class frequencies. We used the time series of yearly mean individual sizein the 3 populations to test the population body size shift hypothesis. Thepopulation age-structure shift hypothesis was tested by using the yearlyproportions of young-of-the-year fish. Times series are provided in Table S4.Herring and sprat populations. We used fishery data provided by the Interna-tional Council for the Exploration of the Sea (ICES; available online at www.ices.dk/reports/ACFM/2005/WGBFAS/directory.asp). Data consisted of time se-
Daufresne et al. PNAS � August 4, 2009 � vol. 106 � no. 31 � 12791
ECO
LOG
Y
ries of yearly total catch in numbers and mean weight in the catch for differentage classes (1 y old to �8 y old) over 31 years in the Baltic Sea. Sprat data wereavailable for the whole Baltic Sea except the Kattegat area (i.e., for ICESsubdivisions 22–32). Herring data were available for the whole Baltic Seaexcept zones located to the east of �15°0500 E (i.e., for ICES subdivisions25–32 and Gulf of Riga). Baltic Sea surface temperature during the samplingperiod significantly increased (36) (Table S2). We used yearly mean weights totest the population body size shift hypothesis. Mean weights were calculatedas the ratio of total biomass to total catch per year. Total biomasses wereestimated as the product of weights-at-age and catches in numbers per age,summed over all ages. The population age-structure shift hypothesis wastested by using the yearly proportions of fish �3 years old. Time series ofweight-at-age were used to test the size-at-age shift hypothesis.Published data. To test the species shift hypothesis, we used observed changesin fish community structure in the North Sea under global warming (17). Thestudy was based on the North Sea IBTS (International Bottom Trawl Survey)fishery data from DATRAS (Database of Trawl Surveys) and were provided bythe ICES to the authors.
Experimental Data. Experimental data were obtained by sampling femaleadults of the copepod Pseudocalanus sp., bacteria, and phytoplankton com-munities in indoor mesocosms that simulated early spring (February–April)environmental conditions in the Kiel Bight (Baltic Sea) under different climaticscenarios (15, 16). Eight mesocosms were exposed to 4 temperature regimes(i.e., 2 mesocosms per chamber). The reference regime (�0 °C) correspondedto the 1993–2002 average temperature regime observed in the Kiel Bight,whereas the �2, �4, and �6 °C regimes corresponded to different levels ofwarming. Percentage of the natural light intensity above cloud cover (Io) wascontrolled to simulate different cloud cover and underwater light attenua-tion. Phytoplankton was sampled at 16%, 64%, and 32% Io (2005, 2006, and2007 experiments). Pseudocalanus sp. and bacteria were only sampled at 64%and 16% Io, respectively.Bacteria communities. Data were collected in the �0 and �6 °C mesocosmsduring the 2005 experiment (37). Bacteria were sampled on average 1.33 timesa week in the reference mesocosms and on average 1.5 times a week in the�6 °C mesocosms. For each sample, mean cell volume of the community wasderived from length and width cell measurements. Measurements were as-sessed by means of a new Porton grid—G12 after DAPI staining in an epiflu-
orescence microscope by vision. We used mean cell volume in the differentmesocosms to test the community body size shift hypothesis. Times series areprovided in Table S5.Pseudocalanus sp. individuals. Female adults of Pseudocalanus sp. were sampledand individually measured at the end of the 2006 experiment. The size-at-ageshift hypothesis was tested by using mean length of individuals in the differentmesocosms. Copepods are particularly suitable for testing this hypothesisbecause they do not increase in length after having molted to the adult stage.Times series are provided in Table S6.Published data. We used a study dealing with changes in size structure ofphytoplankton communities in Kiel mesocosms (16) to test the communitybody size hypothesis and the species shift hypothesis.
Statistical Analysis. Hypotheses were tested with the time series data by usinga weighted metaanalysis (38). The ‘‘effect sizes’’ in the metaanalysis were Sstatistics from Mann–Kendall trend tests (39) (see Fig. S1, SI Text, and Table S7and S8). Variances of S were corrected for temporal autocorrelation whenthey occurred (40). Mean temporal trends were considered significant if their95% confidence intervals did not contain 0 (38). To test whether fisherypressure on herring and sprat populations can influence the response oforganisms to warming (population body size shift, population age-structureshift, and size-at-age shift hypotheses), we defined a categorical variable thatdiscriminated marine vs. freshwater populations. Fishery effect was evaluatedby checking for significant between-group heterogeneity (Qb) in the effectsize (38).
For experimental data, we used LME models (41) to evaluate the effectof temperature on the dependent variables (see Fig. S1, SI Text, and TableS7 and Table S8). This allowed the potential differences in variance amongmesocosms to be considered when evaluating the coefficients of themodels and their confidence intervals. All statistical analyses were per-formed by using R (42).
ACKNOWLEDGMENTS. We thank Electricite de France, Cemagref (and espe-cially H. Capra), H. G. Hoppe, R. Koppe, P. Breithaupt (Leibniz-Institut furMeereswissenschaften–GEOMAR), and ICES for providing data. English hasbeen edited by T. Snelder. We thank D. Atkinson for his helpful comments onthe early drafts of the manuscript and C. Bonenfant for statistical advice. Thiswork was partially supported by the Deutsche Forschungsgemeinschaft-funded priority program 1162 ‘‘AQUASHIFT’’ and by Electricite de France.
1. Parmesan C, Yohe G (2003) A globally coherent fingerprint of climate change impactsacross natural systems. Nature 421:37–42.
2. Root TL, et al. (2003) Fingerprints of global warming on wild animals and plants. Nature421:57–60.
3. Walther GR, et al. (2002) Ecological responses to recent climate change. Nature416:389–395.
4. Pearman PB, et al. (2008) Prediction of plant species distributions across six millennia.Ecol Lett 11:357–369.
5. Durant JM, Hjermann DO, Ottersen G, Stenseth NC (2007) Climate and the match ormismatch between predator requirements and resource availability. Clim Res 33:271–283.
6. Cushing D (1974) in Sea Fisheries Research, eds Jones H (Elek Science, London), pp399–412.
7. Durant JM, et al. (2005) Timing and abundance as key mechanisms affecting trophicinteractions in variable environments. Ecol Lett 8:952–958.
8. Jonzen N, Hedenstrom A, Lundberg P (2007) Climate change and the optimal arrival ofmigratory birds. Proc R Soc London Ser B 274:269–274.
9. Arendt J (2007) Ecological correlates of body size in relation to cell size and cell number:Patterns in flies, fish, fruits and foliage. Biol Rev 82:241–256.
10. Millien V, et al. (2006) Ecotypic variation in the context of global climate change:Revisiting the rules. Ecol Lett 9:853–869.
11. Atkinson D, Sibly RM (1997) Why are organisms usually bigger in colder environments?Making sense of a life history puzzle. Trends Ecol Evol 12:235–239.
12. Bergmann C (1847) About the relationships between heat conservation and body sizeof animals. Goett Stud (original in German) 1:595–708.
13. James F (1970) Geographic size variation in birds and its relationship to climate. Ecology51:365–390.
14. Atkinson D (1994) Temperature and organism size: A biological law for ectotherms?Adv Ecol Res 25:1–58.
15. Sommer U, et al. (2007) An indoor mesocosm system to study the effect of climatechange on the late winter and spring succession of Baltic Sea phyto- and zooplankton.Oecologia 150:655–667.
16. Sommer U, Lengfellner K (2008) Climate change and the timing, magnitude, andcomposition of the phytoplankton spring bloom. Glob Change Biol 14:1199–1208.
17. Hiddink JG, ter Hofstede R (2008) Climate induced increases in species richness ofmarine fishes. Glob Change Biol 14:453–460.
18. Olsen EM, et al. (2004) Maturation trends indicative of rapid evolution preceded thecollapse of northern cod. Nature 428:932–935.
19. Kuparinen A, Merila J (2007) Detecting and managing fisheries-induced evolution.Trends Ecol Evol 22:652–659.
20. Hartman KJ (2003) Population-level consumption by Atlantic coastal striped bass andthe influence of population recovery upon prey communities. Fisheries Manage Ecol22:652–659.
21. Heimbuch DG (2008) Potential effects of striped bass predation on juvenile fish in theHudson River. Trans Am Fish Soc 137:1591–1605.
22. Daufresne M, Roger MC, Capra H, Lamouroux N (2004) Long-term changes within theinvertebrate and fish communities of the Upper Rhone River: Effects of climatic factors.Glob Change Biol 10:124–140.
23. Daufresne M (2009) Impacts of climatic and non-climatic pressures on fish communitiesin large French rivers. Hydroecol Appl 16:109–134.
24. Hellawell J (1974) The ecology of populations of dace, Leuciscus leuciscus (L), from twotributaries of the River Wye, Herefordshire, England. Freshw Biol 4:577–604.
25. Mann RHK (1974) Observations on the age, growth, reproduction and food of the daceLeuciscus leuciscus (L.), in two rivers in Southern England. J Fish Biol 6:237–253.
26. Philippart J (1981) Ecology of a dace population (Leuciscus leuciscus) in the OurtheRiver (drainage basin of the Meuse River, Belgium) (original in French). Ann Limnol IntJ Limnol 17:41–62.
27. Mills C, Mann R (1985) Environmentally-induced fluctuations in year–class strengthand their implications for management. J Fish Biol 27:209–226.
28. Mann RHK, Mills C (1985) Variations in the size of gonads, eggs and larvae of the dace,Leuciscus leuciscus. Environ Biol Fishes 13:277–287.
29. Araujo F, Bailey R, Williams W (1999) Spatial and temporal variations in fish popula-tions in the Upper Thames Estuary. J Fish Biol 55:836–853.
30. Grenouillet G, Hugueny B, Carrel G, Olivier J, Pont D (2001) Large-scale synchrony andinterannual variability in roach recruitment in the Rhone River: The relative role ofclimatic factors and density-dependent processes. Freshw Biol 46:11–26.
31. Blackburn T, Gaston KJ, Loder N (1999) Geographic gradients in body size: A clarifica-tion of Bergmann’s rule. Divers Distrib 5:165–174.
32. Elton C (1927) Animal Ecology (Sidwick and Jackson, London).33. Brown JH, Gillooly JF, Allen AP, Savage VM, West GB (2004) Toward a metabolic theory
of ecology. Ecology 85:1771–1789.34. Daufresne M, Boet P (2007) Climate change impacts on structure and diversity of fish
communities in rivers. Glob Change Biol 13:2467–2478.35. Froese R, Pauly D, eds (2009) FishBase available at www.fishbase.org, ver 03/2009.36. Mackenzie BR, Schiedek D (2007) Daily ocean monitoring since the 1860s shows record
warming of northern European seas. Glob Change Biol 13:1335–1347.
12792 � www.pnas.org�cgi�doi�10.1073�pnas.0902080106 Daufresne et al.

37. Hoppe HG, et al. (2008) Climate warming in winter affects the coupling betweenphytoplankton and bacteria during the spring bloom: A mesocosm study. AquatMicrob Ecol 51:105–115.
38. Gurevitch J, Hedges V (1993) in Design and Analysis of Ecological Experiments, edsScheiner M, Gurevitch J (Chapman and Hall, New York), pp 378–398.
39. Kendall M (1955) Rank Correlation Methods (Griffin, London), 2nd Ed.
40. Hamed K, Rao A (1998) A modified Mann–Kendall trend test for autocorrelated data.J Hydrol 204:182–196.
41. Pinheiro J, Bates D (2004) Mixed-Effects Models in S and S-PLUS (Springer, NewYork).
42. R Development Core Team (2008) R: A Language and Environment for StatisticalComputing (R Foundation for Statistical Computing, Vienna, Austria).
Daufresne et al. PNAS � August 4, 2009 � vol. 106 � no. 31 � 12793
ECO
LOG
Y