globalisation and governance - united...
TRANSCRIPT

Globalisation Globalisation and and
GovernanceGovernance
Sir Paul JudgeSir Paul Judge
UNPANUNPAN
3030thth November 2007November 2007


Digital Links InternationalDigital Links International


AgendaAgenda
Case StudyCase Study
GlobalisationGlobalisation
DevelopmentDevelopment
Future GrowthFuture Growth
ManagementManagement

The Country With PotentialThe Country With PotentialForeign AffairsForeign Affairs•• Increasing Increasing
intercontinental intercontinental agreementsagreements
•• Five neighbouring Five neighbouring countries with historic countries with historic border disputesborder disputes
CultureCulture•• Strong indigenous Strong indigenous
historyhistory•• Famous musical and Famous musical and
dance traditiondance tradition•• Many local art collectorsMany local art collectors
GeographyGeography•• Area: 2.8 million sq kmArea: 2.8 million sq km•• Coastline: 5,000 km Coastline: 5,000 km •• Highest point: 7,000 mHighest point: 7,000 m
EconomyEconomy
•• Growing faster than Growing faster than EuropeEurope
•• One of the world's 10 One of the world's 10 wealthiest nationswealthiest nations
•• Technology has Technology has transformed the economytransformed the economy
•• Rapid expansion of Rapid expansion of agricultureagriculture
•• Huge foreign investment Huge foreign investment in infrastructurein infrastructure
•• 6% of global central bank 6% of global central bank gold reservesgold reserves
•• Exports per head 9 times Exports per head 9 times global averageglobal average
Spanish is the main language

1907 1907

Growth Rates in GDP/CapitaGrowth Rates in GDP/Capita
1913-29 0.9 1.3 -0.4
1929-50 0.6 1.3 -0.7
1950-73 2.1 3.5 -1.4
1973-89 -1.3 2.1 -3.4
1989-00 2.6 1.6 1.0
Argentina OECD 16 Difference
1900-13 2.6 1.6 1.0
GDP dropped 10.9% in 2002

0
100
200
300
400
500
600
700
800
1900 1913 1929 1950 1973 1989 2000
Argentina
OECD 16
GDP/CapitaGDP/Capita
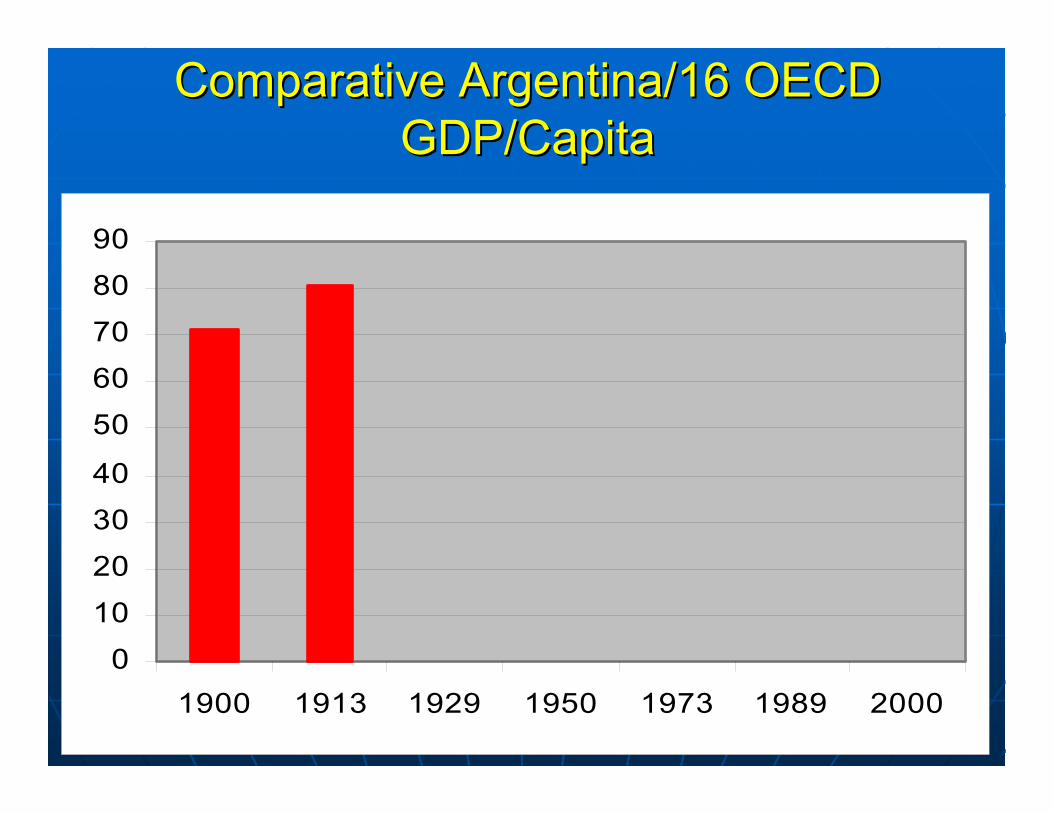
Comparative Argentina/16 OECD Comparative Argentina/16 OECD GDP/CapitaGDP/Capita
0
10
20
30
40
50
60
70
80
90
1900 1913 1929 1950 1973 1989 2000
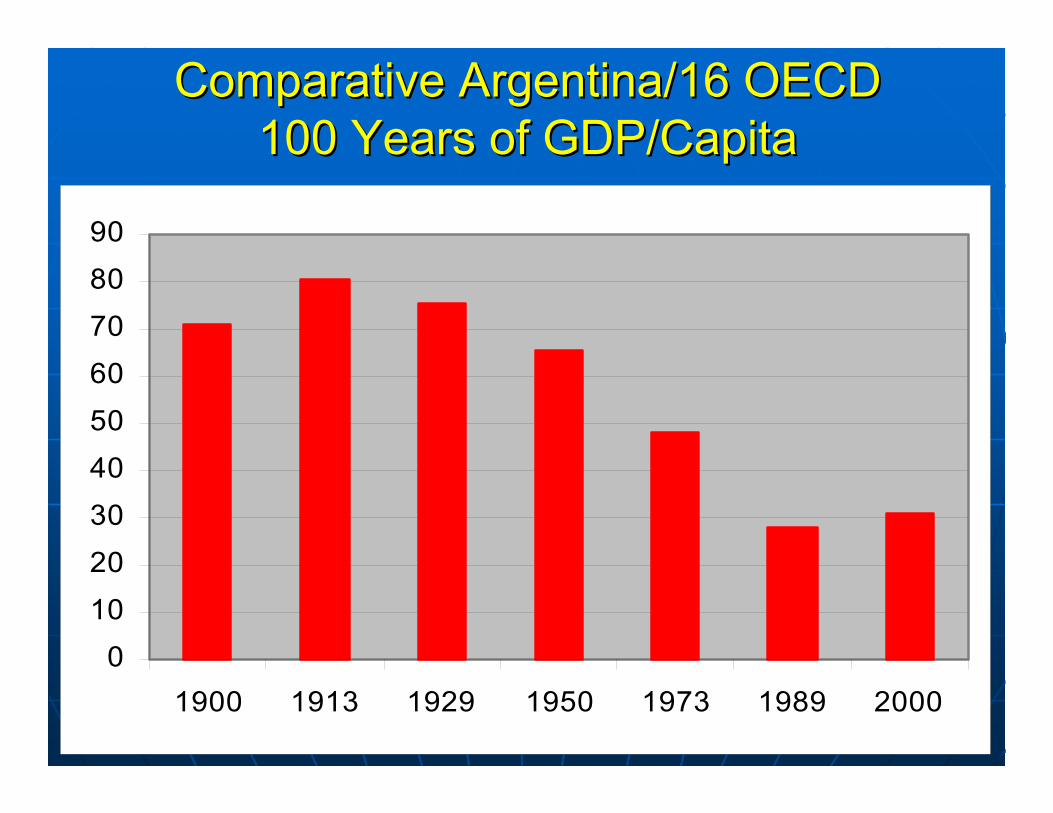
Comparative Argentina/16 OECD Comparative Argentina/16 OECD 100 Years of GDP/Capita100 Years of GDP/Capita
0
10
20
30
40
50
60
70
80
90
1900 1913 1929 1950 1973 1989 2000


2020thth Century Argentine GovernmentCentury Argentine Government1906: Strong government in place1906: Strong government in place1914: Exports cut by World War 11914: Exports cut by World War 11916: Radicals gain power against previous regime1916: Radicals gain power against previous regime1919: General strike1919: General strike1930: Global depression led to army coup1930: Global depression led to army coup1943: President overthrown1943: President overthrown1945: Peron comes to power with union support1945: Peron comes to power with union support19461946--52: 52: EvitaEvita in power alongside husbandin power alongside husband1955: Peron overthrown1955: Peron overthrown1958: New leader liberalises but brings inflation1958: New leader liberalises but brings inflation1966: Peronist coup1966: Peronist coup1970: Army coup1970: Army coup1973: Peron returns as President, dies in 19741973: Peron returns as President, dies in 19741976: Army coup1976: Army coup

GlobalisationGlobalisation
••Greater InterconnectivityGreater Interconnectivity
••Action:Action: Increase in the significance Increase in the significance
and volume of flows across countries and volume of flows across countries
and culturesand cultures
••Reaction:Reaction: Increasing impact of Increasing impact of
global forces on local lifeglobal forces on local life

Early GlobalisationEarly Globalisation3.5m BC:3.5m BC: Hominids walk uprightHominids walk upright
•• Footprints in the sandFootprints in the sand
1.6m BC:1.6m BC: Homo ErectusHomo Erectus
•• Much easier to walkMuch easier to walk
0.9m BC:0.9m BC: Humans in ChinaHumans in China
•• Invent fire so can move NorthInvent fire so can move North
10,000 BC:10,000 BC: South AmericaSouth America
•• Earth inhabitedEarth inhabited
3,000 BC: Agriculture developsAgriculture develops
•• Babylonian, Egyptian, Greek and Babylonian, Egyptian, Greek and
Roman empiresRoman empires

World Population 0World Population 0--1750 AD (m)1750 AD (m)
0
100200
300
400500
600
700800
900
0 200 400 600 800 1000 1200 1400 1600 1800

1750 World Population (bn)1750 World Population (bn)
0.2, 21%
0.0, 1%
0.1, 15%0.5, 63%
Europe
Western Offshoots
L.Am/Africa
Asia

European Dark AgesEuropean Dark AgesMexico
Persia
Cambodia
Java
China

Proportion of Global GDPProportion of Global GDP
0%10%20%30%40%50%60%70%80%90%
0 1000 1500 1600 1700 1820
AsiaEuropeWesternL. Am/Africa

ChinaChina

European ExplorationEuropean Exploration
Prince HenryChristopherColumbus
Vasco de Gama
Francis Drake
Magellan

Proportion of Global GDPProportion of Global GDP
0%
10%
20%
30%
40%50%
60%
70%
80%
90%
0 1000 1500 1600 1700 1820
AsiaEuropeWesternL. Am/Africa

1750 GDP/Capita ($)1750 GDP/Capita ($)
0
200
400
600
800
1000
1200
Europe L. Am/Africa Asia

England in the 1750England in the 1750’’ssPopulation of 6 million doubled since 1700Population of 6 million doubled since 1700•• Trade increasingTrade increasing•• Enclosures and cottage industriesEnclosures and cottage industries•• Steam power beginningSteam power beginning
George II on throneGeorge II on thronePrime MinistersPrime Ministers•• Henry Pelham, Duke of Newcastle, Duke of Henry Pelham, Duke of Newcastle, Duke of
Devonshire and Earl Waldegrave Devonshire and Earl Waldegrave
The Age of EnlightenmentThe Age of Enlightenment•• Samuel Johnson, Edward Gibbon, Thomas Samuel Johnson, Edward Gibbon, Thomas
Chippendale, David Garrick, Thomas Sheridan, Chippendale, David Garrick, Thomas Sheridan, George StubbsGeorge Stubbs

Through Westminster Bridge 1746Through Westminster Bridge 1746

Whitehall from Richmond House 1747Whitehall from Richmond House 1747
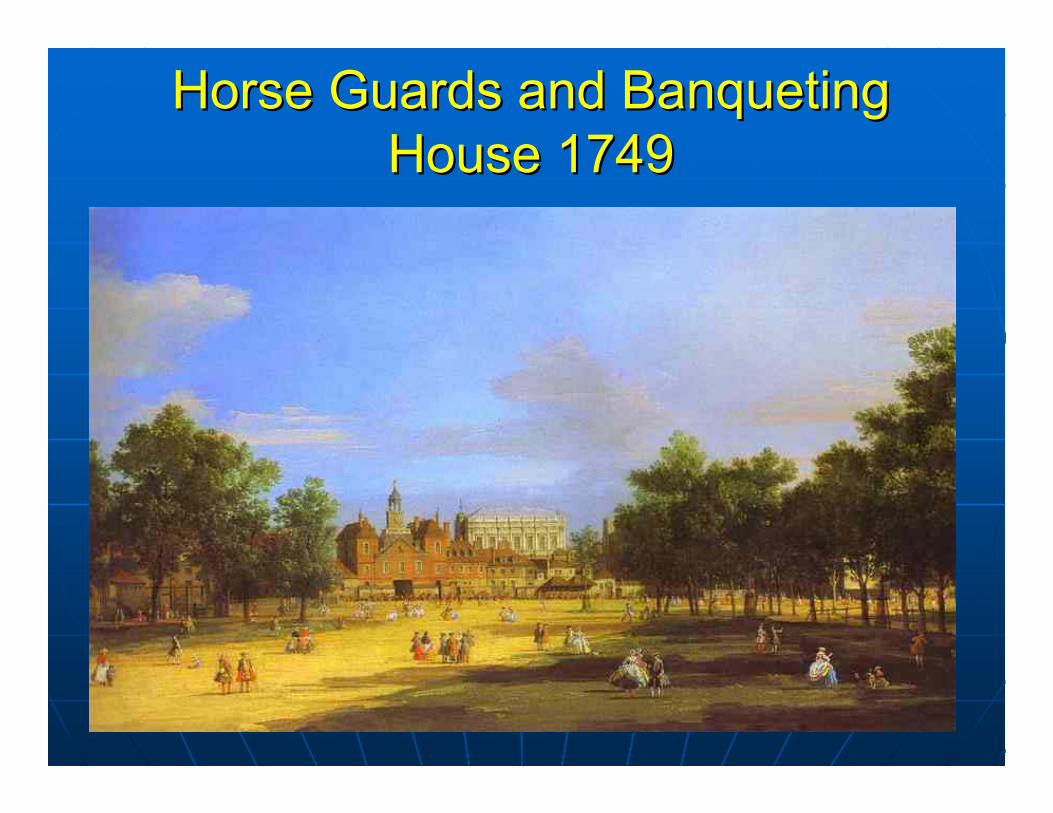
Horse Guards and Banqueting Horse Guards and Banqueting House 1749House 1749

Northumberland House 1752Northumberland House 1752

St PaulSt Paul’’s Cathedral 1754s Cathedral 1754

The RichThe Rich-Servants and carriages
-Large houses
-Country visits
-Clubs
-Controlled Parliament
-Purchased positions
-Protected by law

HogarthHogarth
Gin Lane Beer Street

The PoorThe PoorComparative affluence Comparative affluence brings people to the citybrings people to the city
Half the population on Half the population on less than $3,700 per yearless than $3,700 per year
Family lived together in Family lived together in one roomone room
Shared a standpipe, no Shared a standpipe, no seweragesewerage
No medicineNo medicine
Imprisonment for debtImprisonment for debt
Parish welfareParish welfare•• Apprentices: from 7 Apprentices: from 7
•• WorkhousesWorkhouses

Bills of Mortality 1750Bills of Mortality 1750--7474Age % % Cum0-1 33.6 33.62-4 9.1 42.75-9 3.6 46.3
10-19 3.4 49.720-29 8.0 57.730-39 9.3 67.040-49 9.7 76.750-59 7.9 84.660-69 8.1 92.7
70+ 7.3 100.0
-33.6% died in their first year
-A further 9.1 % by the age of 4
-49.7% by the age of 20
-Only 50% chance of reaching your 20th
birthday
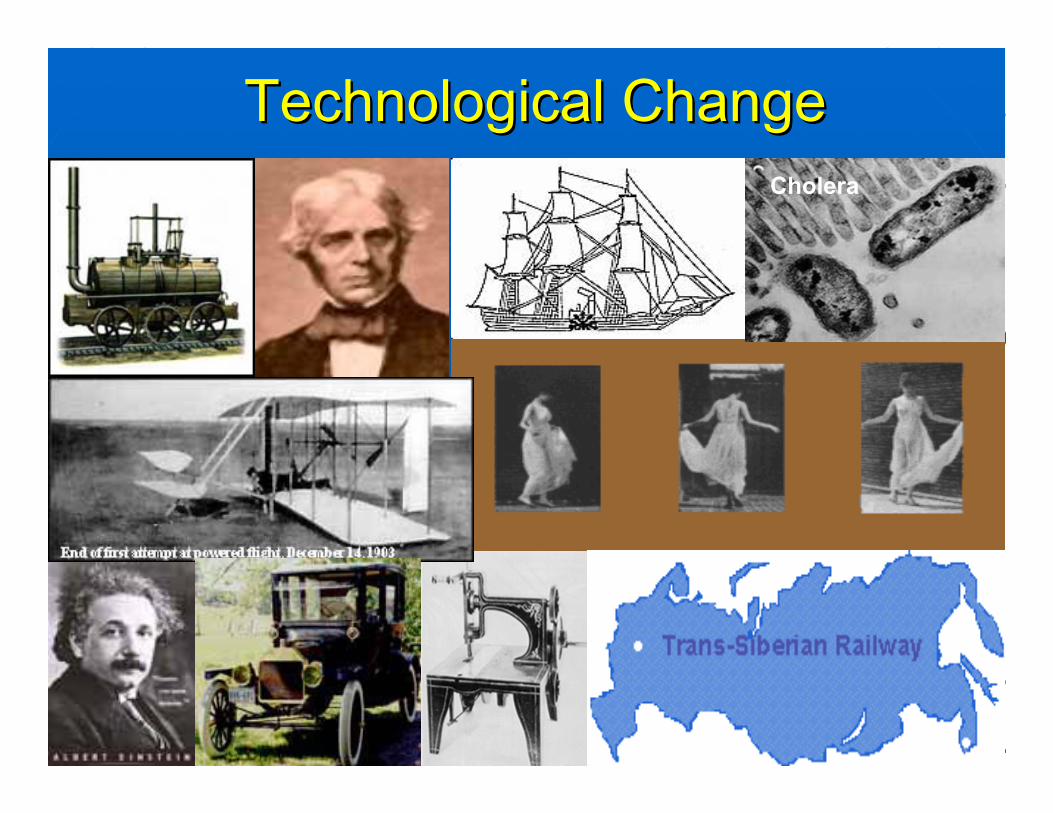
Technological ChangeTechnological ChangeCholera

World Population (bn)World Population (bn)
0
1000
2000
3000
4000
5000
6000
7000
1750 1800 1850 1900 1950 2000

2000 World Population (bn)2000 World Population (bn)
0.8, 13%
0.3, 6%
1.3, 21%3.6, 60%
Europe/ex-USSR
Western Offshoots
L. Am/Africa
Asia
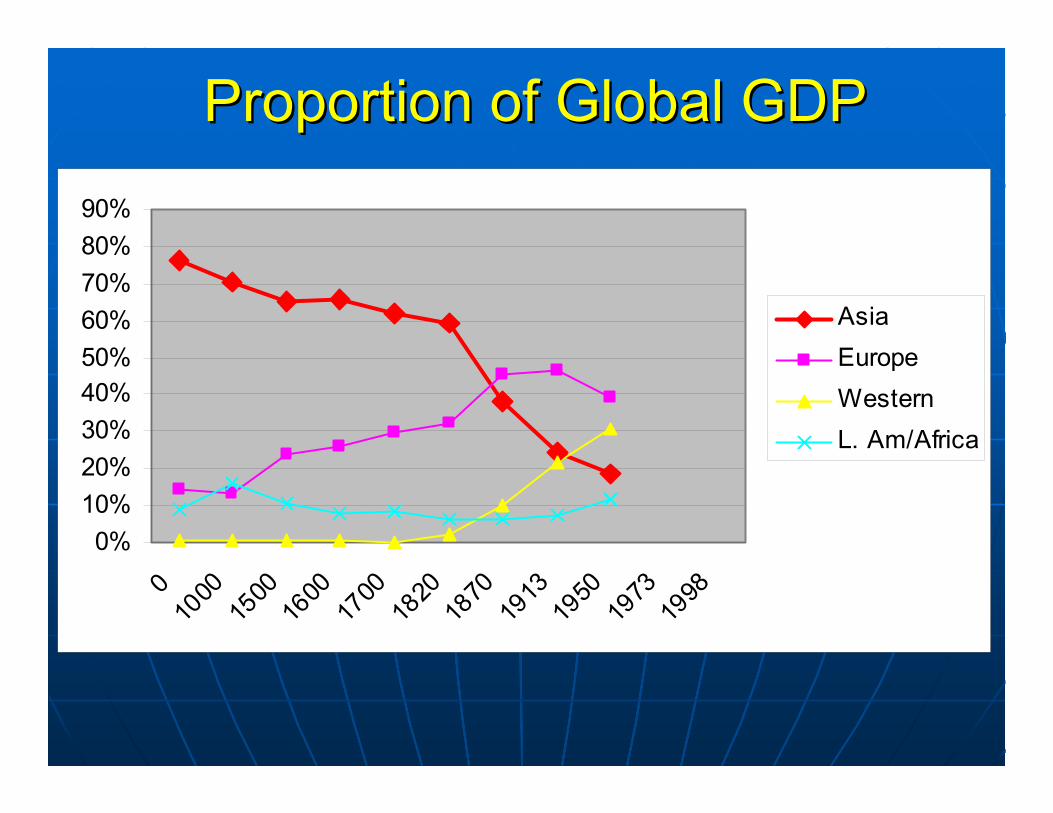
Proportion of Global GDPProportion of Global GDP
0%10%20%30%40%50%60%70%80%90%
010
0015
0016
0017
0018
2018
7019
1319
5019
7319
98AsiaEuropeWesternL. Am/Africa
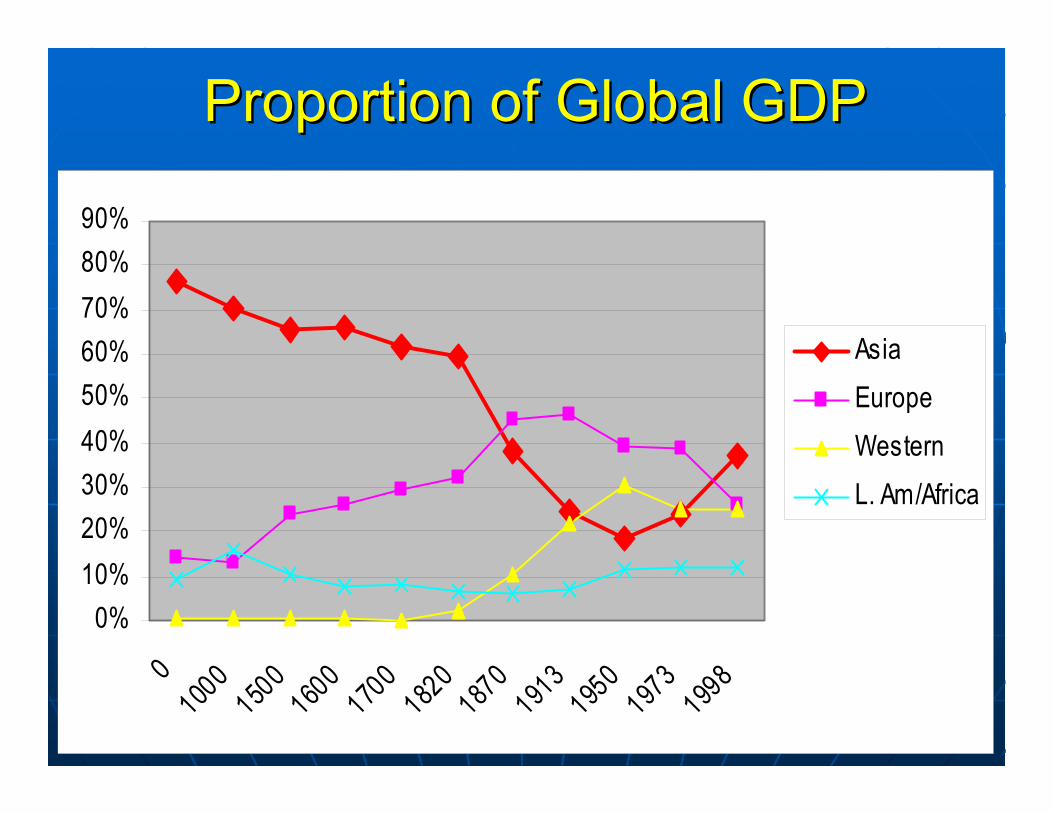
Proportion of Global GDPProportion of Global GDP
0%10%20%30%40%50%60%70%80%90%
0100
0150
0160
0170
0182
0187
0191
3195
0197
3199
8Asia
Europe
Western
L. Am/Africa

2000 GDP/Capita ($)2000 GDP/Capita ($)
0
5,000
10,000
15,000
20,000
25,000
30,000
Europe/ex-USSR Western L. Am/Africa Asia

The Rich The Rich -- 17501750-Servants and carriages
-Large houses
-Country visits
-Clubs
-Controlled Parliament
-Purchased positions
-Protected by law

The West The West -- 20072007••Appliances and carsAppliances and cars••Large housesLarge houses••International travelInternational travel••Clubs and hobbiesClubs and hobbies••Dominates global Dominates global organisationsorganisations••Buys influenceBuys influence••Controls immigrationControls immigration

The Poor The Poor -- 17501750Comparative affluence Comparative affluence brings people to the citybrings people to the city
Half the population on Half the population on less than $3,700 per yearless than $3,700 per year
Family lived together in Family lived together in one roomone room
Shared a standpipe, no Shared a standpipe, no seweragesewerage
No medicineNo medicine
Imprisonment for debtImprisonment for debt
Parish welfareParish welfare•• Apprentices: from 7 Apprentices: from 7
•• WorkhousesWorkhouses

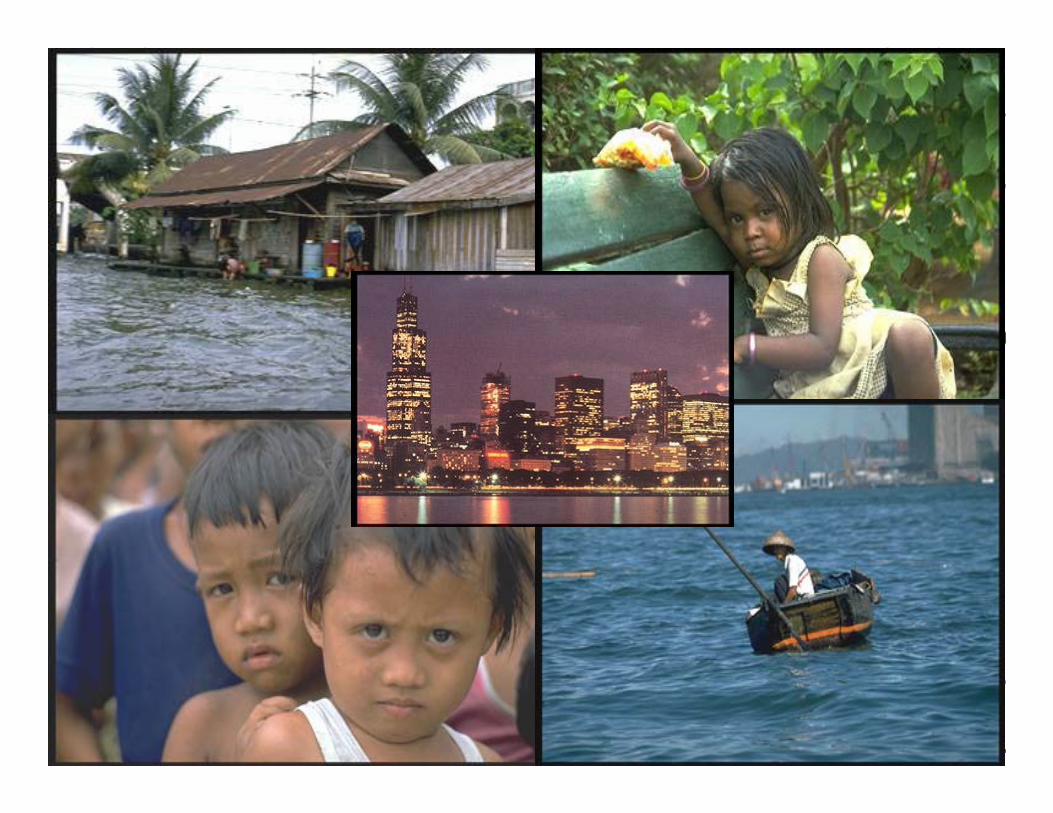
The Poor The Poor -- 20072007Movement to the Movement to the townstowns
2 billion people have 2 billion people have no water or sanitationno water or sanitation
11 million children die 11 million children die annually from annually from treatable diseasestreatable diseases
Fluctuating commodity Fluctuating commodity pricesprices
CorruptionCorruption
Harsh lawsHarsh laws
Cultural changeCultural change

Annual Health Expenditure ($)Annual Health Expenditure ($)
2,735
710
500
1,000
1,500
2,000
2,500
3,000
High Income Low/Medium Income

Developed Country Education Developed Country Education Expenditure ($PPP/Pupil)Expenditure ($PPP/Pupil)
02,0004,0006,0008,000
10,00012,00014,000
Norway
Austria
Switzerla
ndUnite
d StatesCanada
France Italy
Germany
JapanNew
Zealand
Israel
Australia
Average

Developing Country Education Developing Country Education Expenditure ($PPP/Pupil)Expenditure ($PPP/Pupil)
0
500
1,000
1,500
2,000
2,500
Russia
BrazilMexic
oThailand
Turkey
Morocco Peru
China
Kenya IndiaIndonesia
Bangladesh
Average

Developed/ing Country Education Developed/ing Country Education Expenditure ($PPP/Pupil)Expenditure ($PPP/Pupil)
0
2,000
4,000
6,000
8,000
10,000
12,000
14,000

Developed/ing Country Education Developed/ing Country Education Expenditure ($PPP/Pupil)Expenditure ($PPP/Pupil)
01,0002,0003,0004,0005,0006,0007,0008,0009,000
10,000
Developed Developing

Ways to DevelopWays to DevelopCharity (Private Giving)Charity (Private Giving)•• US $15 bn, UK $US $15 bn, UK $11 bn, Total $20 bnbn, Total $20 bn
AidAid•• Government redistribution: Total $Government redistribution: Total $8080 bnbn
TradeTrade•• Invisible handInvisible hand•• Merchandise Exports ($bn):Merchandise Exports ($bn):
AsiaAsia 1,9011,901Latin AmericaLatin America 378378AfricaAfrica 171171
2,4502,450

CharityCharity

2004 Government Aid2004 Government AidCountry $ Million % GNP
United States 18,999 0.16
Japan 8,859 0.19
France 8,475 0.42
United Kingdom 7,836 0.36
Germany 7,497 0.28
Netherlands 4,235 0.74
Sweden 2,704 0.77
Spain 2,547 0.26
Canada 2,537 0.26
Italy 2,484 0.15
Other 14,400
Total 80,573

Aid Per Capita (Current $)Aid Per Capita (Current $)
0
2
4
6
8
10
12
14
16
1960 1965 1970 1975 1980 1985 1990 1995 2000

Trade Trade –– The PotentialThe Potential
Oxfam: Oxfam: ““If Africa, East Asia, South Asia, If Africa, East Asia, South Asia,
and Latin America were each to increase and Latin America were each to increase
their share of world exports by one per their share of world exports by one per
cent, the resulting gains in income could cent, the resulting gains in income could
lift 128 million people out of poverty. In lift 128 million people out of poverty. In
Africa alone, this would generate $70bnAfrica alone, this would generate $70bn --
approximately five times what the approximately five times what the
continent receives in aid.continent receives in aid.””

Trade Trade –– Not a Level Playing FieldNot a Level Playing FieldAgricultural SubsidiesAgricultural Subsidies•• Rich countries spend $1bn every day on Rich countries spend $1bn every day on
agricultural subsidies: agricultural subsidies: $350 bn per year$350 bn per year•• 800 million people live on less than a dollar a 800 million people live on less than a dollar a
dayday
Tariff barriers Tariff barriers •• Imports of commodities, textiles and other Imports of commodities, textiles and other
exportable items are restricted or surchargedexportable items are restricted or surcharged•• These barriers cost developing countries These barriers cost developing countries
$100bn a year$100bn a year -- more than they receive in more than they receive in aid. aid.
Intellectual propertyIntellectual property•• Drugs, seeds, geneticsDrugs, seeds, genetics•• Charges do not reflect ability to payCharges do not reflect ability to pay

Possible Average Growth Rates Possible Average Growth Rates 20002000--5050
PopulationPopulation GDP/CapitaGDP/Capita GDPGDP
Europe+ExUSSREurope+ExUSSR (0.2)(0.2) 1.51.5 1.31.3
Western OffshootsWestern Offshoots 0.50.5 2.02.0 2.52.5
Latin America/AfricaLatin America/Africa 1.41.4 3.03.0 4.54.5
AsiaAsia 0.70.7 5.05.0 5.85.8

World Population (bn)World Population (bn)
0123456789
10
2000 2025 2050
Asia
L. Am/Africa
Western Offshoots
Europe/ex-USSR
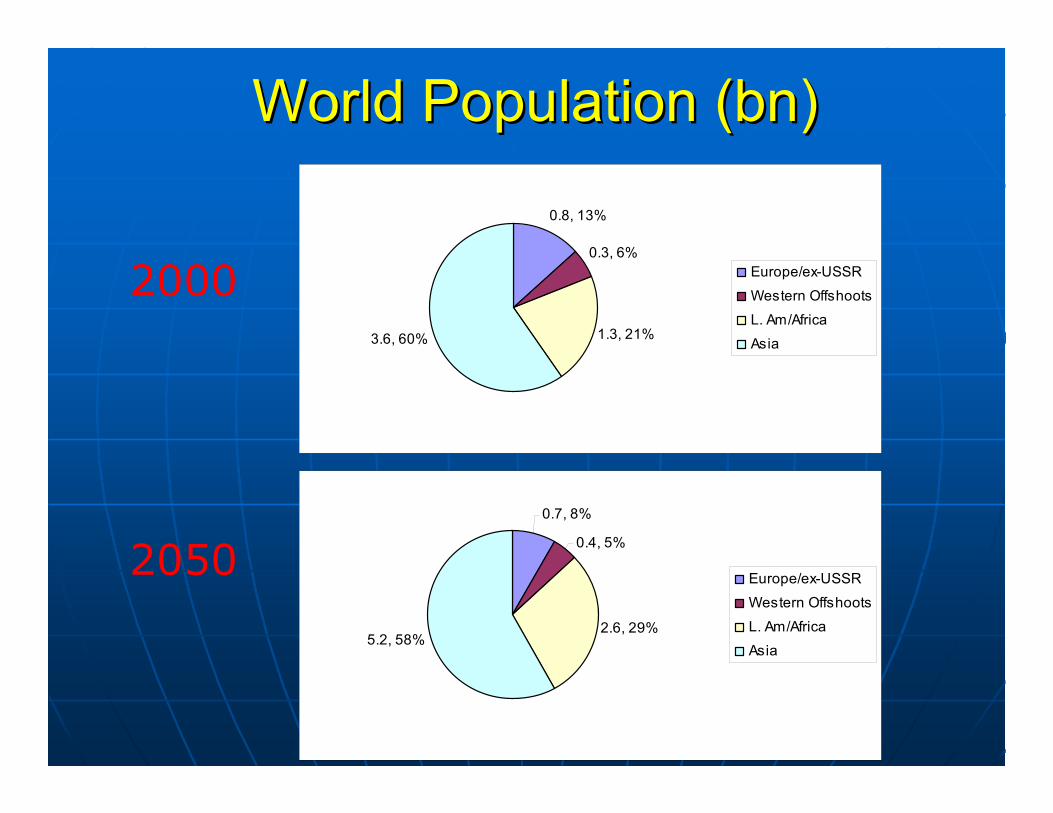
World Population (bn)World Population (bn)
0.8, 13%
0.3, 6%
1.3, 21%3.6, 60%
Europe/ex-USSR
Western Offshoots
L. Am/AfricaAsia
0.7, 8%
0.4, 5%
2.6, 29%5.2, 58%
Europe/ex-USSR
Western Offshoots
L. Am/AfricaAsia
2000
2050

Possible Average Growth Rates Possible Average Growth Rates 20002000--5050
PopulationPopulation GDP/CapitaGDP/Capita GDPGDP
Europe+ExUSSREurope+ExUSSR (0.2)(0.2) 1.51.5 1.31.3
Western OffshootsWestern Offshoots 0.50.5 2.02.0 2.52.5
Latin America/AfricaLatin America/Africa 1.41.4 3.03.0 4.54.5
AsiaAsia 0.70.7 5.05.0 5.85.8
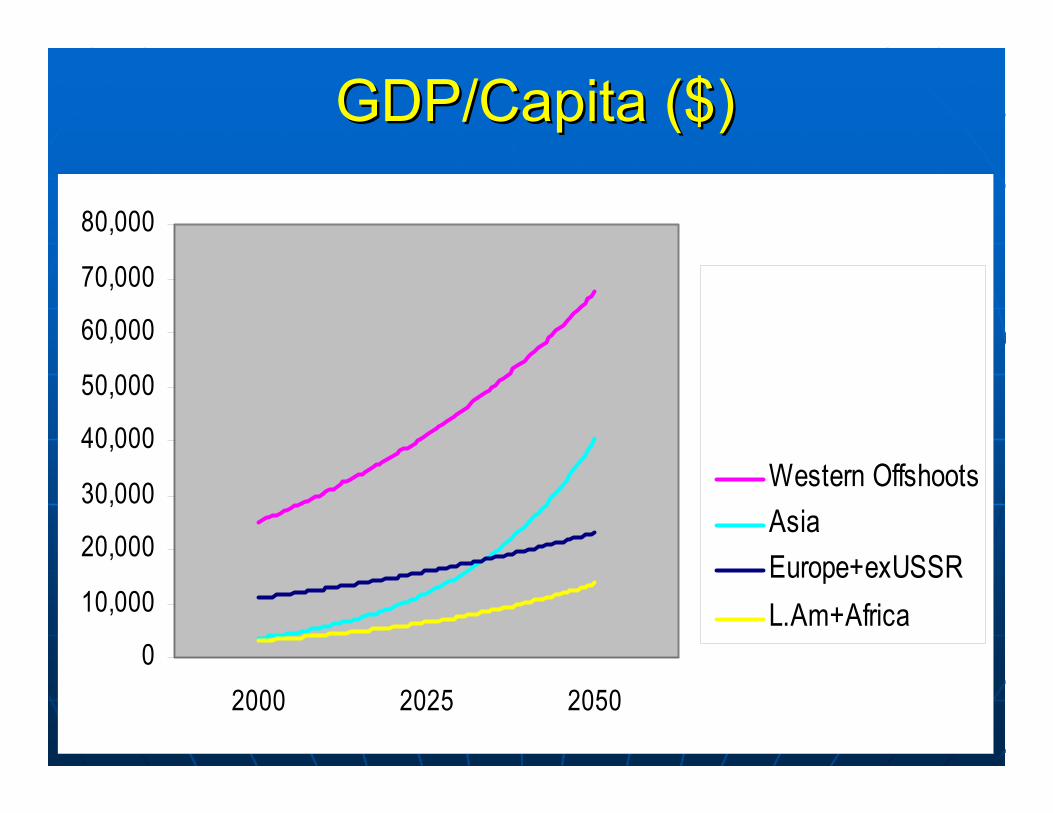
GDP/Capita ($)GDP/Capita ($)
0
10,000
20,000
30,000
40,000
50,000
60,000
70,000
80,000
2000 2025 2050
Western OffshootsAsiaEurope+exUSSRL.Am+Africa
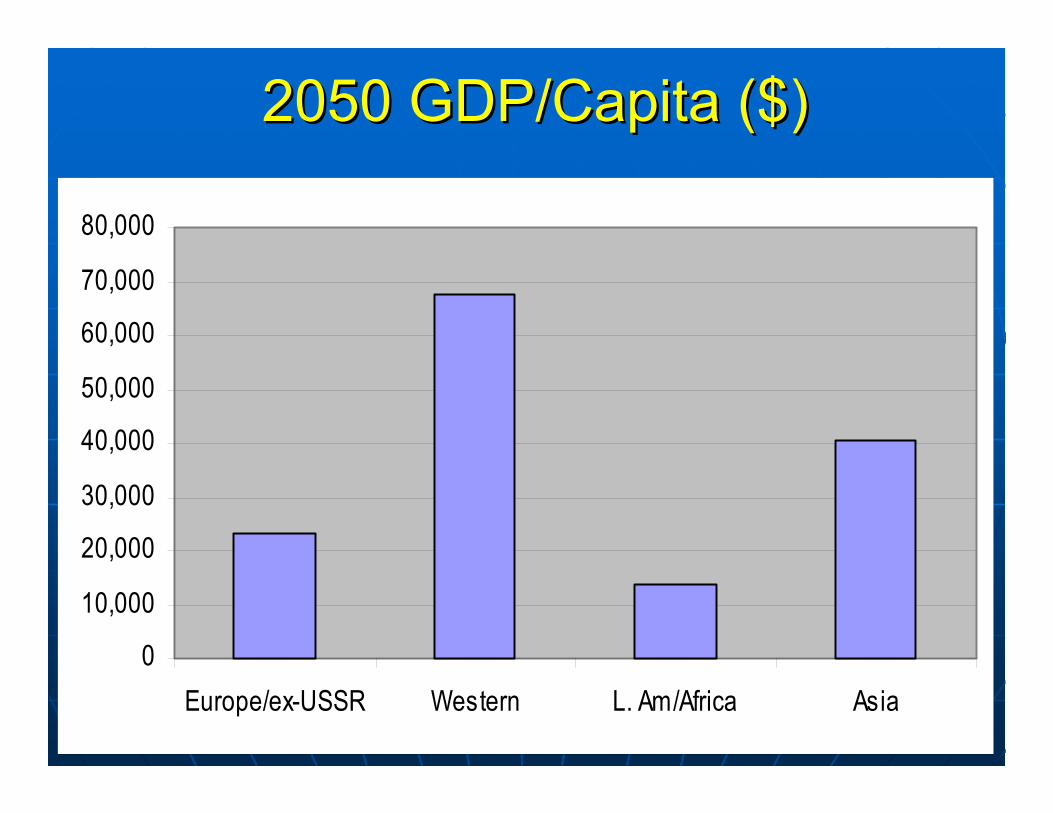
2050 GDP/Capita ($)2050 GDP/Capita ($)
0
10,000
20,000
30,000
40,000
50,000
60,000
70,000
80,000
Europe/ex-USSR Western L. Am/Africa Asia

Possible Average Growth Rates Possible Average Growth Rates 20002000--5050
PopulationPopulation GDP/CapitaGDP/Capita GDPGDP
Europe+ExUSSREurope+ExUSSR (0.2)(0.2) 1.51.5 1.31.3
Western OffshootsWestern Offshoots 0.50.5 2.02.0 2.52.5
Latin America/AfricaLatin America/Africa 1.41.4 3.03.0 4.54.5
AsiaAsia 0.70.7 5.05.0 5.85.8

Proportion of Global GDPProportion of Global GDP
0%10%20%30%40%50%60%70%80%90%
010
0015
0016
0017
0018
2018
7019
1319
5019
7319
9820
2520
50
AsiaEuropeWesternL. Am/Africa

Three Aspects of GovernanceThree Aspects of GovernanceObjective administrationObjective administrationAdam Smith accepted that his Adam Smith accepted that his invisible hand could not operate invisible hand could not operate unless the state providedunless the state provided•• SecuritySecurity•• JusticeJustice•• Infrastructure Infrastructure
Forms of PowerForms of Power•• HardHard•• EconomicEconomic•• SoftSoft
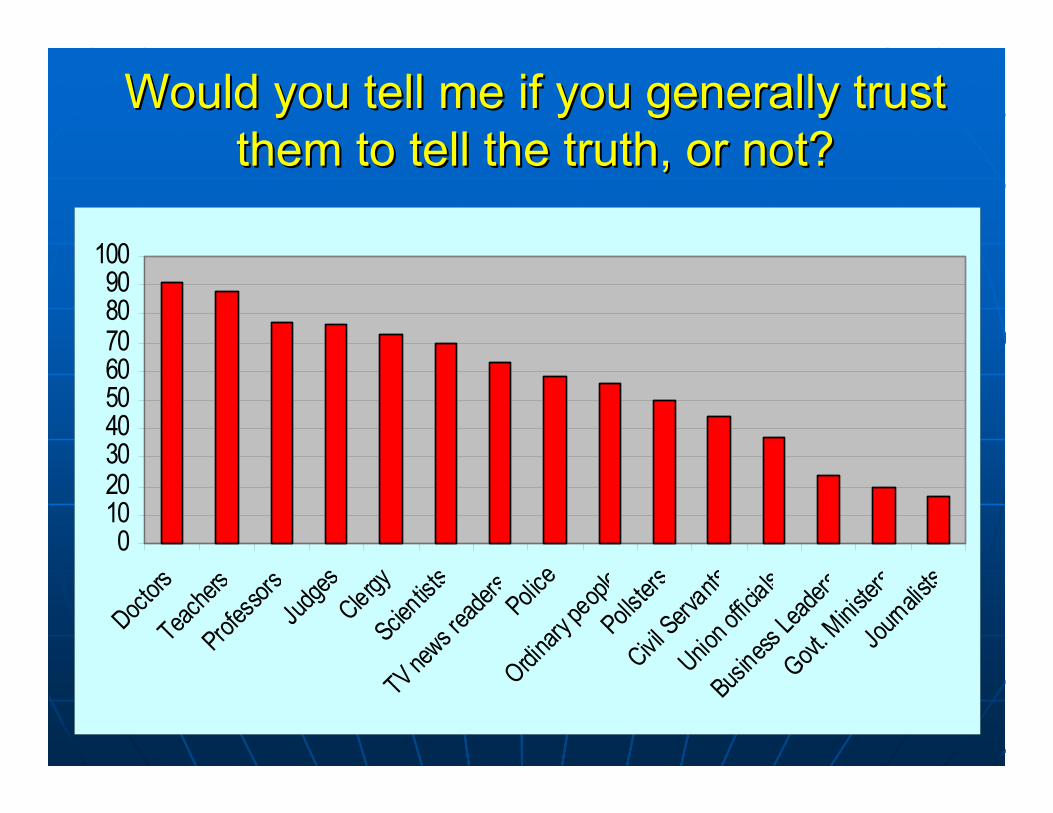
Would you tell me if you generally trust Would you tell me if you generally trust them to tell the truth, or not?them to tell the truth, or not?
0102030405060708090
100
Doctors
Teacher
sProf
essors
Judges
ClergyScie
ntists
TV news r
eaders Polic
eOrdin
ary pe
ople
Pollster
sCivil
Servants
Union o
fficials
Business
Leade
rsGovt
. Minis
ters
Journalis
ts

Objective Administration Objective Administration -- T.I.M.E. T.I.M.E. TTransparencyransparency•• Reasons given for decisionsReasons given for decisions
IIntegrityntegrity•• No financial or similar obligations to No financial or similar obligations to
others that might influence official duties others that might influence official duties
MMeritocracyeritocracy•• Choices on appointments or contracts Choices on appointments or contracts
should be made on meritshould be made on merit
EEfficiencyfficiency•• World class methods and standards World class methods and standards
should be usedshould be used

Adam SmithAdam Smith’’s 3 Duties of Governments 3 Duties of Government
The first duty:The first duty: securitysecurity: protecting the : protecting the society by means of a military forcesociety by means of a military force
The second duty:The second duty: justicejustice: establishing an : establishing an exact administration of justiceexact administration of justice
The third and last duty:The third and last duty: infrastructure infrastructure erecting and maintaining those public erecting and maintaining those public institutions and public worksinstitutions and public works•• facilitating the commerce of the society facilitating the commerce of the society such as such as
good roads, bridges, navigable canals, etcgood roads, bridges, navigable canals, etc
•• promoting the instruction of the peoplepromoting the instruction of the people

Europe vs AsiaEurope vs AsiaSmithSmith’’s three government duties in Europes three government duties in Europe•• Security:Security: weak armies and little popular supportweak armies and little popular support•• Justice:Justice: good but often slow/expensivegood but often slow/expensive•• Infrastructure:Infrastructure: nimbys and priority to shortnimbys and priority to short--
term social expenditureterm social expenditure
Pay people more not to work than Pay people more not to work than China/India pay people to workChina/India pay people to workTrying to require a 35 hour week while Trying to require a 35 hour week while Asian businessmen are trying to work out Asian businessmen are trying to work out how to achieve a 35 hour dayhow to achieve a 35 hour day““Needs to get worse before it gets betterNeeds to get worse before it gets better””Can 1.5% GDP/capita growth be achieved?Can 1.5% GDP/capita growth be achieved?

EducationEducation

Types of PowerTypes of PowerHistorically: HardHistorically: Hard•• Military: China and India have massive armiesMilitary: China and India have massive armies•• Modern history shows limits of forceModern history shows limits of force
Currently: EconomicCurrently: Economic•• Growth in GDP/Capita: China and India Growth in GDP/Capita: China and India
achieving 8+%achieving 8+%•• Needs continuing Security, Justice, Needs continuing Security, Justice,
Infrastructure improvementInfrastructure improvement
With convergence: Soft (cultural and With convergence: Soft (cultural and persuasive)persuasive)•• Internationally, greater interconnectivity needs Internationally, greater interconnectivity needs
greater compatibility and diplomacygreater compatibility and diplomacy•• Internally, with economic growth, softer Internally, with economic growth, softer
benefits become more importantbenefits become more important

ManagementManagement
A ProfessionA Profession
•• Major Effect on CommunitiesMajor Effect on Communities
•• Theoretical Framework and Useful Theoretical Framework and Useful TechniquesTechniques
•• Ethics and Continuing EducationEthics and Continuing Education
Rate of ChangeRate of Change
•• IncreasingIncreasing
•• Technological ChangeTechnological Change
•• GlobalisationGlobalisation

Achieving Management Achieving Management Excellence Excellence -- Key SkillsKey Skills
1 Managing People2 Leadership3 Team Working4 Customer Focus5 Managing Operations6 Verbal Communications7 Time Management8= Coaching & Counselling8= Functional/Technical Skills

Leadership Leadership -- Challenge For AllChallenge For All% Preferred Characteristic
55 Inspiring - Acting as role model41 Strategic Thinker - Articulating a clear vision36 Forward looking - Interpreting the future26 Honesty - Strong ethical values and integrity23 Fair-minded - Consistent and unbiased21 Courageous - Energy creating and risk taking20 Supportive - Engaging and supporting others19 Knowledgable13 Ambitious10 Imaginative5 Loyal4 Self-controlled

Leadership Leadership -- Challenge For AllChallenge For AllCharacteristic Preferred Actual Difference
Ambitious 13 38 25Knowledgeable 19 39 20Self Controlled 4 14 10Loyal 5 14 9Fair-minded 23 25 2Supportive 20 21 1Imaginative 10 11 1Forward looking 36 31 (5)Honesty 26 21 (5)Courageous 21 8 (13)Strategic Thinker 41 21 (20)Inspiring 55 11 (44)

Leadership Leadership -- Challenge For AllChallenge For AllQuality Of LeadershipQuality Of Leadership
0%
20%
40%
60%
80%
100%
Chairm
anCEO/M
DDire
ctors
Senior
Man
agers
Middle
Manag
ersJu
nior M
anag
ersLow / QuiteLow
High/ QuiteHigh


ConclusionConclusionHistoricalHistorical•• Increased interconnectivity is a longIncreased interconnectivity is a long--term trendterm trend•• Asia has usually been most advancedAsia has usually been most advanced
SocialSocial•• Early societies had major inequalitiesEarly societies had major inequalities•• Current world like 18Current world like 18thth Century LondonCentury London
EconomicEconomic•• Trade is main generator of wealthTrade is main generator of wealth•• Interconnectivity brings income convergenceInterconnectivity brings income convergence
GovernmentalGovernmental•• Key security, justice and infrastructure roleKey security, justice and infrastructure role•• Good management is essentialGood management is essential
Don’t cry for me, Argentina
