globalisation, inequality and institutions in west sumatra
TRANSCRIPT
Full Terms & Conditions of access and use can be found athttps://www.tandfonline.com/action/journalInformation?journalCode=rjoc20
Journal of Contemporary Asia
ISSN: (Print) (Online) Journal homepage: https://www.tandfonline.com/loi/rjoc20
Globalisation, Inequality and Institutions in WestSumatra and West Java, 1800–1940
Pim de Zwart
To cite this article: Pim de Zwart (2020): Globalisation, Inequality and Institutions in West Sumatraand West Java, 1800–1940, Journal of Contemporary Asia, DOI: 10.1080/00472336.2020.1765189
To link to this article: https://doi.org/10.1080/00472336.2020.1765189
© 2020 The Author(s). Published by InformaUK Limited, trading as Taylor & FrancisGroup.
Published online: 05 Jun 2020.
Submit your article to this journal
Article views: 469
View related articles
View Crossmark data

Globalisation, Inequality and Institutions in West Sumatraand West Java, 1800–1940Pim de Zwart
Rural and Environmental History Group, Wageningen University, Netherlands
ABSTRACTHow did globalisation affect living standards and inequality incolonies relying on exports? This question is investigated througha comparison of social and economic developments in two regionsof the Dutch East Indies (colonial Indonesia): Minangkabau in WestSumatra and Priangan in West Java, looking at the period between1800 and 1940. These two regions were remarkably similar in termsof export crops grown and factor endowments and the Dutchcolonial government implemented a comparable system of forcedcoffee cultivation in both these areas in the nineteenth century.Outcomes in terms of levels of income and economic inequality inthese areas differed markedly, mainly as a result of different indi-genous property rights regarding land and the power of local elites.This article highlights the interaction between indigenous andcolonial institutions and the importance of this interaction for socialand economic development in an age of rising global trade.
KEY WORDScolonialism; Indonesia;inequality; property rights;living standards; trade
Exports from tropical countries increased 12-fold between 1830 and the start of WorldWar I (Federico and Tena-Junguito 2017, 1244). This growth was even faster in colonialIndonesia: in per capita terms the increase was over 13-fold between 1830 and 1928(Booth 1998, 204–206). As a share of total gross domestic product (GDP), trade increasedfrom about 10% in the 1830s to almost 40% in the 1920s (van Zanden and Marks 2012,22). That this rising trade generated large profits for the Dutch government and manyprivate Dutch entrepreneurs has been examined in a series of recent articles (Gordon2010, 2012, 2018). The effects of rising global trade during the nineteenth and twentiethcenturies on economic growth, living standards and inequality in the colonised countries,however, are still not well understood. This article examines these relationships forcolonial Indonesia in the nineteenth and early twentieth centuries.
Following the literature, the relationship between globalisation and inequality incolonial economies is influenced by: (i) the commodity produced for export; (ii) factorendowments – the availability of land, labour and capital; and (iii) institutions – theformal and informal rules that shape social interaction, such as laws and customs – thatorganise trade and production. These three contextual factors are expected to influencethe relation between globalisation and inequality as follows. First, those regions specialis-ing in cash crops like sugar and tobacco became more unequal over time as these are
CONTACT Pim de Zwart [email protected] Rural and Environmental History Group, Wageningen University,Hollandseweg 1, 6706 KN Wageningen, Netherlands.
JOURNAL OF CONTEMPORARY ASIAhttps://doi.org/10.1080/00472336.2020.1765189
© 2020 The Author(s). Published by Informa UK Limited, trading as Taylor & Francis Group.This is an Open Access article distributed under the terms of the Creative Commons Attribution-NonCommercial-NoDerivatives License(http://creativecommons.org/licenses/by-nc-nd/4.0/), which permits non-commercial re-use, distribution, and reproduction in any med-ium, provided the original work is properly cited, and is not altered, transformed, or built upon in any way.
most efficiently produced on large plantations (Sokoloff and Engerman 2000). As planta-tion owners were the main beneficiaries of export growth, they were able to defend theirinterests better, which led to the development of institutions that entrenched inequality.Food crops like rice and wheat, on the other hand, are well-suited to smallholderproduction, leading to institutions causing equalisation. Second, trade theory as postu-lated by Heckscher (1949) and Ohlin (1935) suggests that in land-abundant tropicalcountries, globalisation increases inequality as countries specialise in land-intensive cashcrops, thereby increasing land rents (benefitting large landholders) vis-à-vis wages forlabourers (Williamson 2011, 156–159). Third, it matters how export production wasorganised by colonial governments; whether it was organised under an extractive regimeof forced cultivation benefitting only the colonisers and local elites or via more benign, or“inclusive,” institutions that allowed local producers to reap more of the profits fromtheir labour (see, for example, Acemoglu and Robinson 2012, 73–76).
In this article, the role of indigenous institutions regarding property rights and localpower relations will be emphasised in determining the consequences of globalisation. Inorder to do so, as much as possible the effects of other factors, like crops grown and factorendowments, are excluded to isolate the effects of indigenous institutions. Two regions inthe Dutch East Indies (colonial Indonesia) are compared. West Sumatra and West Javawere remarkably similar in terms of climate, geography and population densities. Overmost of the nineteenth century export agriculture was dominated by the forced produc-tion of coffee under the Cultivation System implemented by the Dutch in both theseregions. Despite these similarities, by the early twentieth century, after the abolition ofthe Cultivation System, export production in West Sumatra (also known asMinangkabau) was overwhelmingly in the hands of indigenous smallholders (about90% of total exports in the 1920s), while in West Java (Priangan) plantation producehad become dominant (about 80% of exports).1 Levels of inequality were substantiallyhigher in Priangan, while average incomes were lower.
Factor Endowments
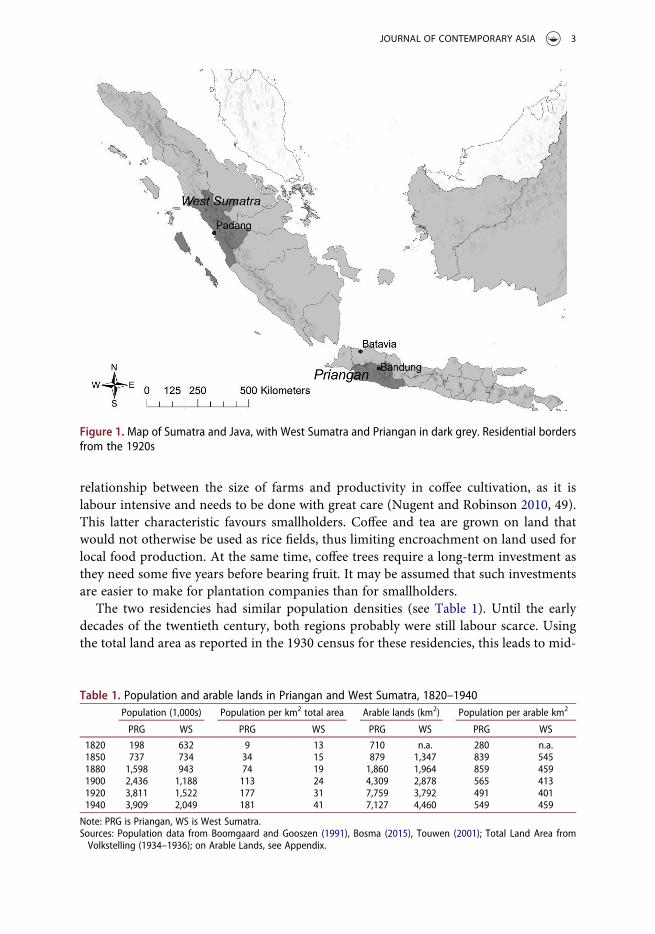
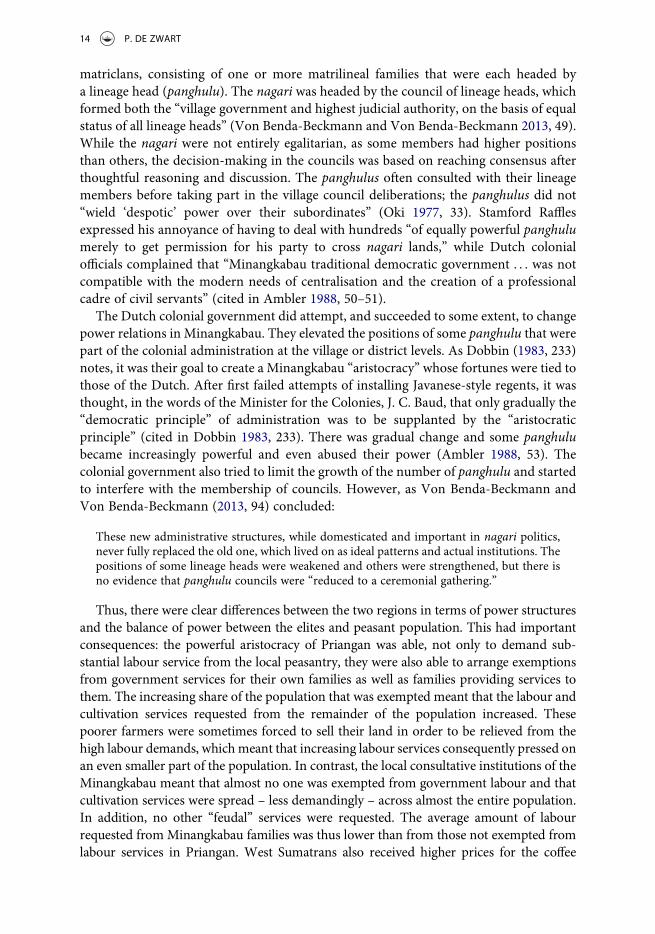
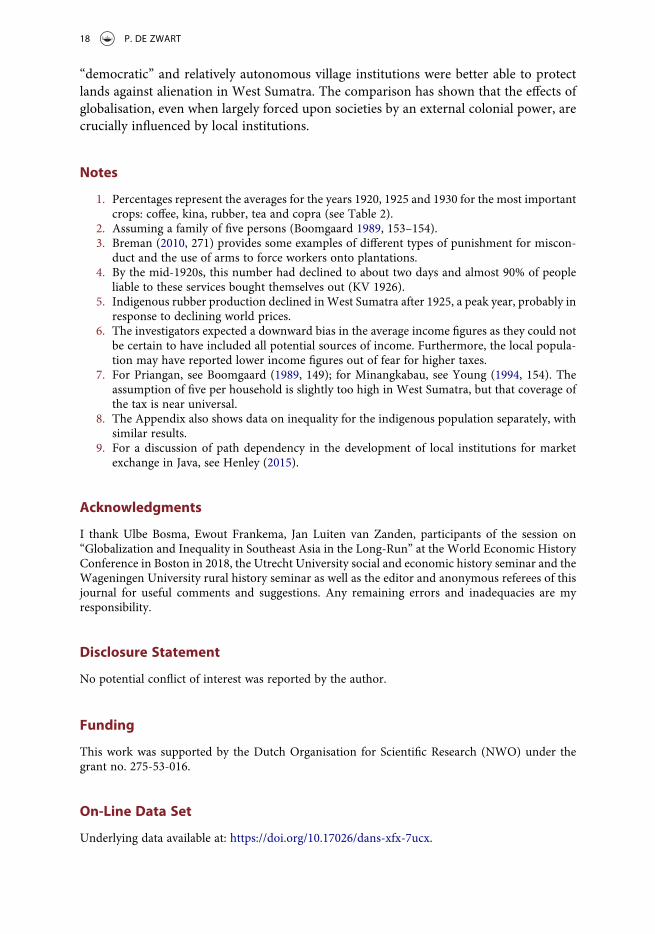
Exogenous variables, such as geography and climate, exert a strong influence over socialeconomic outcomes. The comparison between Minangkabau and Priangan was selectedas these regions are similar in terms of geography, climate and population densities.Minangkabau and Priangan have the same equatorial climate with equal amounts ofannual rainfall and a rainy season between October and March and a dry season fromMay/June to September. In addition, both places have long, swampy, coastal areas as wellas mountainous inland areas with active volcanoes (Figure 1). Furthermore, in WestSumatra, as in Java, most rice comes from irrigated wet fields (sawah), rather than dryfields (ladang) (Geertz 1963, 116). The residencies – the largest of the colonial adminis-trative units – had similar numbers of livestock in the 1850s at about two per arablehectare (KV 1851–1860). By the late twentieth century, West Java had more fertile soilthan West Sumatra, but this difference was likely smaller in the colonial era (Lindert2000, 182–186, 200–201).
In the mid-nineteenth century, both areas specialised in the production of coffee and,later, other crops that can grow in more mountainous areas like coconuts, tea and rubber.These crops have limited returns to scale, with many studies showing an inverse
2 P. DE ZWART
relationship between the size of farms and productivity in coffee cultivation, as it islabour intensive and needs to be done with great care (Nugent and Robinson 2010, 49).This latter characteristic favours smallholders. Coffee and tea are grown on land thatwould not otherwise be used as rice fields, thus limiting encroachment on land used forlocal food production. At the same time, coffee trees require a long-term investment asthey need some five years before bearing fruit. It may be assumed that such investmentsare easier to make for plantation companies than for smallholders.
The two residencies had similar population densities (see Table 1). Until the earlydecades of the twentieth century, both regions probably were still labour scarce. Usingthe total land area as reported in the 1930 census for these residencies, this leads to mid-
Figure 1. Map of Sumatra and Java, with West Sumatra and Priangan in dark grey. Residential bordersfrom the 1920s
Table 1. Population and arable lands in Priangan and West Sumatra, 1820–1940Population (1,000s) Population per km2 total area Arable lands (km2) Population per arable km2
PRG WS PRG WS PRG WS PRG WS
1820 198 632 9 13 710 n.a. 280 n.a.1850 737 734 34 15 879 1,347 839 5451880 1,598 943 74 19 1,860 1,964 859 4591900 2,436 1,188 113 24 4,309 2,878 565 4131920 3,811 1,522 177 31 7,759 3,792 491 4011940 3,909 2,049 181 41 7,127 4,460 549 459
Note: PRG is Priangan, WS is West Sumatra.Sources: Population data from Boomgaard and Gooszen (1991), Bosma (2015), Touwen (2001); Total Land Area fromVolkstelling (1934–1936); on Arable Lands, see Appendix.
JOURNAL OF CONTEMPORARY ASIA 3
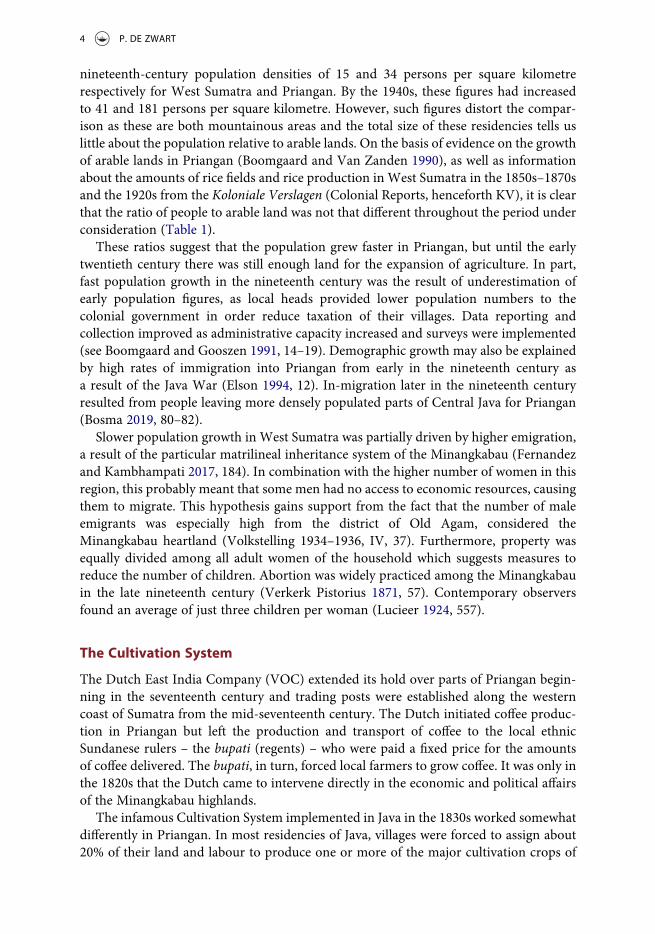
nineteenth-century population densities of 15 and 34 persons per square kilometrerespectively for West Sumatra and Priangan. By the 1940s, these figures had increasedto 41 and 181 persons per square kilometre. However, such figures distort the compar-ison as these are both mountainous areas and the total size of these residencies tells uslittle about the population relative to arable lands. On the basis of evidence on the growthof arable lands in Priangan (Boomgaard and Van Zanden 1990), as well as informationabout the amounts of rice fields and rice production in West Sumatra in the 1850s–1870sand the 1920s from the Koloniale Verslagen (Colonial Reports, henceforth KV), it is clearthat the ratio of people to arable land was not that different throughout the period underconsideration (Table 1).
These ratios suggest that the population grew faster in Priangan, but until the earlytwentieth century there was still enough land for the expansion of agriculture. In part,fast population growth in the nineteenth century was the result of underestimation ofearly population figures, as local heads provided lower population numbers to thecolonial government in order reduce taxation of their villages. Data reporting andcollection improved as administrative capacity increased and surveys were implemented(see Boomgaard and Gooszen 1991, 14–19). Demographic growth may also be explainedby high rates of immigration into Priangan from early in the nineteenth century asa result of the Java War (Elson 1994, 12). In-migration later in the nineteenth centuryresulted from people leaving more densely populated parts of Central Java for Priangan(Bosma 2019, 80–82).
Slower population growth in West Sumatra was partially driven by higher emigration,a result of the particular matrilineal inheritance system of the Minangkabau (Fernandezand Kambhampati 2017, 184). In combination with the higher number of women in thisregion, this probably meant that some men had no access to economic resources, causingthem to migrate. This hypothesis gains support from the fact that the number of maleemigrants was especially high from the district of Old Agam, considered theMinangkabau heartland (Volkstelling 1934–1936, IV, 37). Furthermore, property wasequally divided among all adult women of the household which suggests measures toreduce the number of children. Abortion was widely practiced among the Minangkabauin the late nineteenth century (Verkerk Pistorius 1871, 57). Contemporary observersfound an average of just three children per woman (Lucieer 1924, 557).
The Cultivation System
The Dutch East India Company (VOC) extended its hold over parts of Priangan begin-ning in the seventeenth century and trading posts were established along the westerncoast of Sumatra from the mid-seventeenth century. The Dutch initiated coffee produc-tion in Priangan but left the production and transport of coffee to the local ethnicSundanese rulers – the bupati (regents) – who were paid a fixed price for the amountsof coffee delivered. The bupati, in turn, forced local farmers to grow coffee. It was only inthe 1820s that the Dutch came to intervene directly in the economic and political affairsof the Minangkabau highlands.
The infamous Cultivation System implemented in Java in the 1830s worked somewhatdifferently in Priangan. In most residencies of Java, villages were forced to assign about20% of their land and labour to produce one or more of the major cultivation crops of
4 P. DE ZWART
sugar, coffee and tea (van Baardewijk 1994). In return for the delivery of these crops tothe colonial government, peasants received a certain amount of cash for their produce,which was to be used to pay the land tax. In Priangan, no land tax was levied until 1872,but instead farmers had to pay local taxes to their bupati. Furthermore, peasants wereexpected to establish andmaintain coffee gardens and sell it to the colonial government atlow prices (only half the price paid in other parts of Java). In 1840, Priangan producedalmost 30% of all coffee from Java (Elson 1994, 69). In Minangkabau, the Dutchimplemented a similar system of coerced coffee cultivation in 1847, in which thepopulation had to deliver a specified amount of coffee to the government at fixed prices.The system was a success initially for the Dutch and the amount of coffee exported rose inthe 1850s and 1860s.
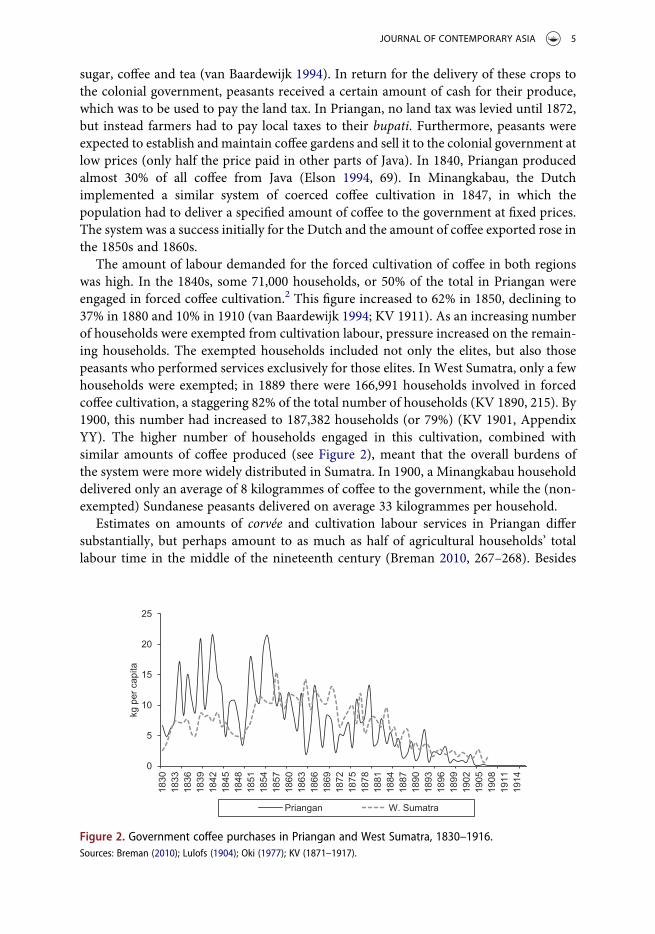
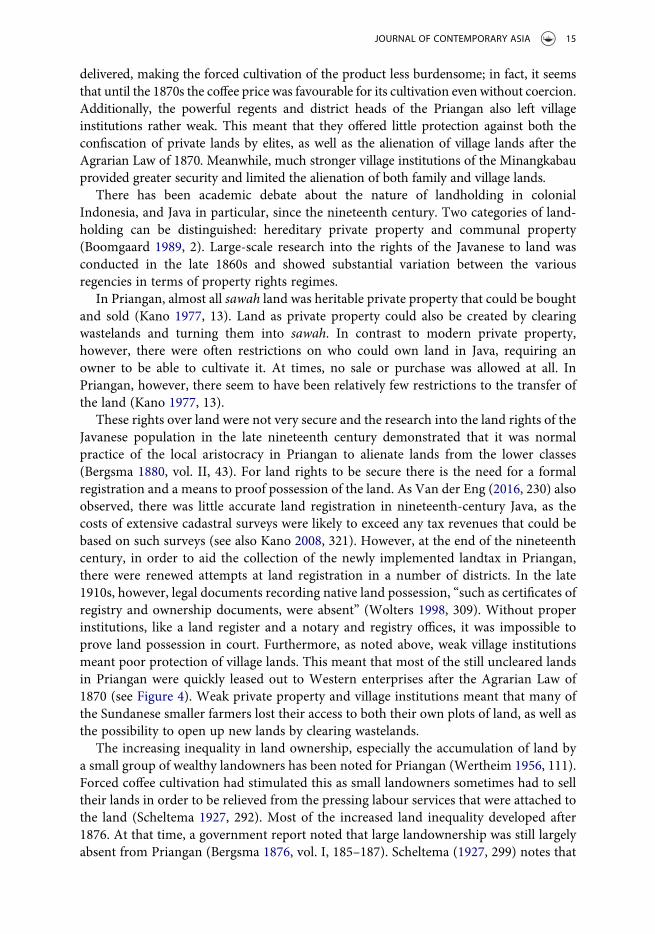
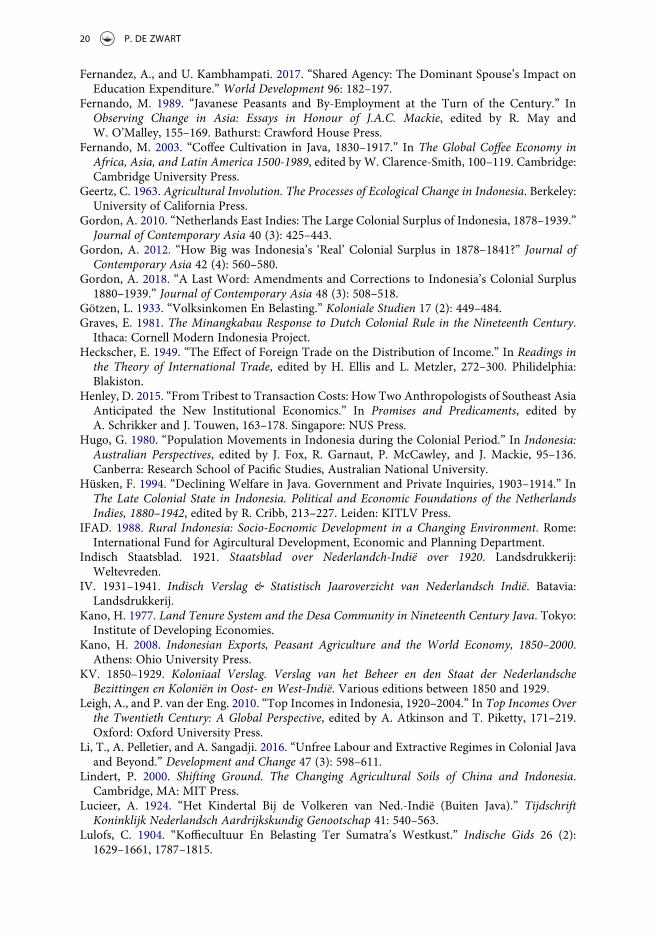
The amount of labour demanded for the forced cultivation of coffee in both regionswas high. In the 1840s, some 71,000 households, or 50% of the total in Priangan wereengaged in forced coffee cultivation.2 This figure increased to 62% in 1850, declining to37% in 1880 and 10% in 1910 (van Baardewijk 1994; KV 1911). As an increasing numberof households were exempted from cultivation labour, pressure increased on the remain-ing households. The exempted households included not only the elites, but also thosepeasants who performed services exclusively for those elites. In West Sumatra, only a fewhouseholds were exempted; in 1889 there were 166,991 households involved in forcedcoffee cultivation, a staggering 82% of the total number of households (KV 1890, 215). By1900, this number had increased to 187,382 households (or 79%) (KV 1901, AppendixYY). The higher number of households engaged in this cultivation, combined withsimilar amounts of coffee produced (see Figure 2), meant that the overall burdens ofthe system were more widely distributed in Sumatra. In 1900, a Minangkabau householddelivered only an average of 8 kilogrammes of coffee to the government, while the (non-exempted) Sundanese peasants delivered on average 33 kilogrammes per household.
Estimates on amounts of corvée and cultivation labour services in Priangan differsubstantially, but perhaps amount to as much as half of agricultural households’ totallabour time in the middle of the nineteenth century (Breman 2010, 267–268). Besides
0
5
10
15
20
25
1830
1833
1836
1839
1842
1845
1848
1851
1854
1857
1860
1863
1866
1869
1872
1875
1878
1881
1884
1887
1890
1893
1896
1899
1902
1905
1908
1911
1914
kg p
er c
apita
Priangan W. Sumatra
Figure 2. Government coffee purchases in Priangan and West Sumatra, 1830–1916.Sources: Breman (2010); Lulofs (1904); Oki (1977); KV (1871–1917).
JOURNAL OF CONTEMPORARY ASIA 5
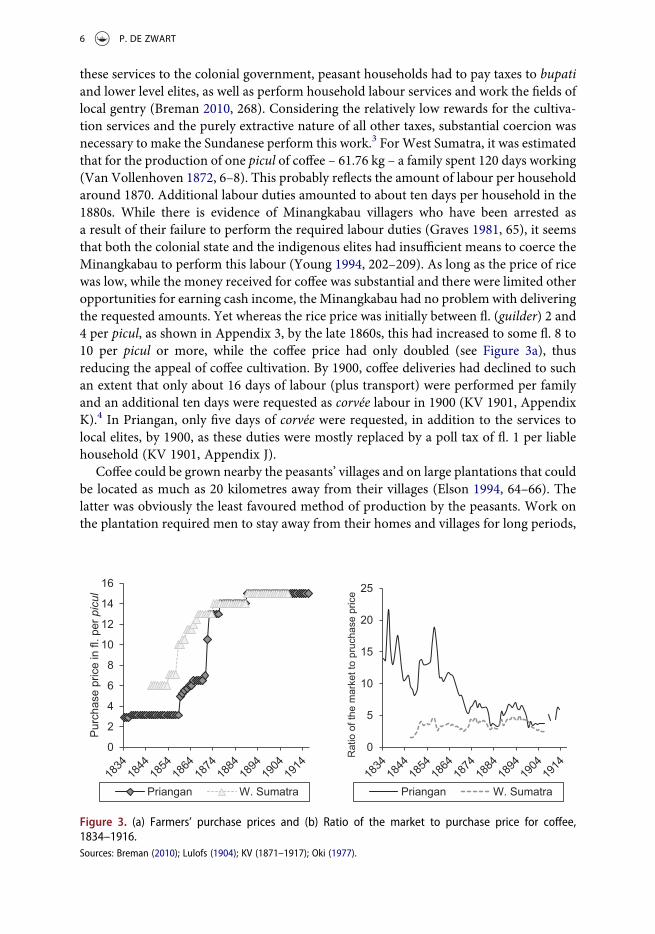
these services to the colonial government, peasant households had to pay taxes to bupatiand lower level elites, as well as perform household labour services and work the fields oflocal gentry (Breman 2010, 268). Considering the relatively low rewards for the cultiva-tion services and the purely extractive nature of all other taxes, substantial coercion wasnecessary to make the Sundanese perform this work.3 For West Sumatra, it was estimatedthat for the production of one picul of coffee – 61.76 kg – a family spent 120 days working(Van Vollenhoven 1872, 6–8). This probably reflects the amount of labour per householdaround 1870. Additional labour duties amounted to about ten days per household in the1880s. While there is evidence of Minangkabau villagers who have been arrested asa result of their failure to perform the required labour duties (Graves 1981, 65), it seemsthat both the colonial state and the indigenous elites had insufficient means to coerce theMinangkabau to perform this labour (Young 1994, 202–209). As long as the price of ricewas low, while the money received for coffee was substantial and there were limited otheropportunities for earning cash income, the Minangkabau had no problem with deliveringthe requested amounts. Yet whereas the rice price was initially between fl. (guilder) 2 and4 per picul, as shown in Appendix 3, by the late 1860s, this had increased to some fl. 8 to10 per picul or more, while the coffee price had only doubled (see Figure 3a), thusreducing the appeal of coffee cultivation. By 1900, coffee deliveries had declined to suchan extent that only about 16 days of labour (plus transport) were performed per familyand an additional ten days were requested as corvée labour in 1900 (KV 1901, AppendixK).4 In Priangan, only five days of corvée were requested, in addition to the services tolocal elites, by 1900, as these duties were mostly replaced by a poll tax of fl. 1 per liablehousehold (KV 1901, Appendix J).
Coffee could be grown nearby the peasants’ villages and on large plantations that couldbe located as much as 20 kilometres away from their villages (Elson 1994, 64–66). Thelatter was obviously the least favoured method of production by the peasants. Work onthe plantation required men to stay away from their homes and villages for long periods,
0
2
4
6
8
10
12
14
16
Pur
chas
e pr
ice
in fl
. per
picul
Priangan W. Sumatra
0
5
10
15
20
25
Rat
io o
f the
mar
ket t
o pr
ucha
se p
rice
Priangan W. Sumatra
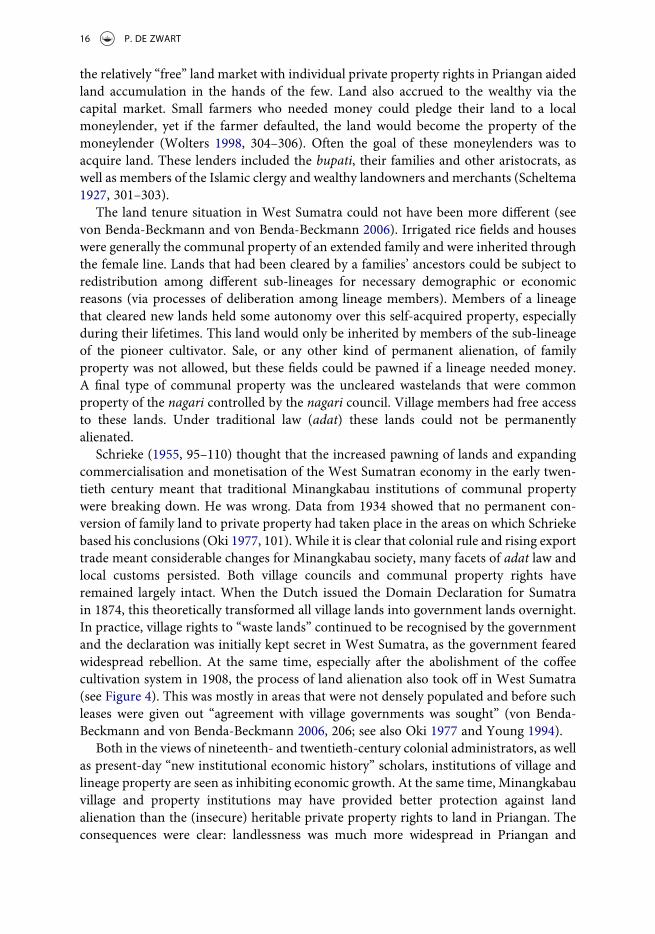
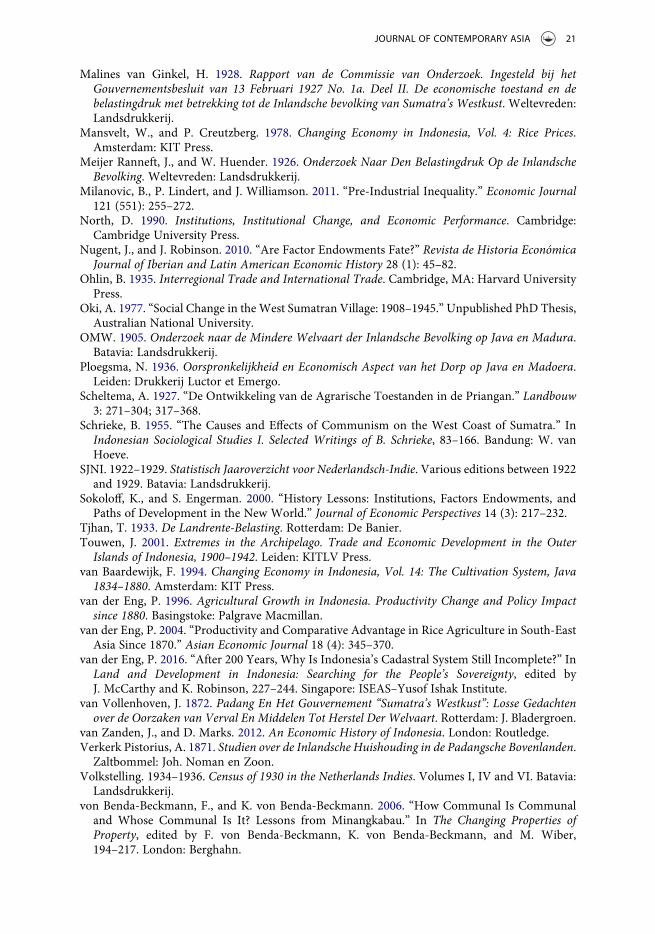
Figure 3. (a) Farmers’ purchase prices and (b) Ratio of the market to purchase price for coffee,1834–1916.Sources: Breman (2010); Lulofs (1904); KV (1871–1917); Oki (1977).
6 P. DE ZWART
during which they could not engage in subsistence production. Locally produced coffeecould be cultivated next to their other work, thus being less burdensome. The colonialauthorities preferred plantations as it was easier to monitor production and trade whilelimiting trade outside the colonial system.
Comparing the methods of production between the two regions reveals considerabledifferences. Figures for Priangan suggest that 69% of all coffee was grown on plantationsin 1853, increasing to 84% in 1864 (Breman 2010, 275). It later declined in percentageterms, to 60% in 1882 (KV 1883, Appendix CCC). In West Sumatra, of the coffee treesnewly planted in 1853, only 11% were on plantations and the rest near the villages (KV1853, 159). The following year, newly planted coffee trees in plantations constituted only2% of the total (Couperus 1856, 301). It may be assumed that this is indicative of thegenerally smaller share of total coffee production on plantations, as the colonial report of1855, and an article from 1856, also noted the far greater share of production near villagesinWest Sumatra (KV 1855, 136; Couperus 1856, 298–300). Another important differencebetween compulsory coffee cultivation in the two regions was the money received by thepeasants (Figure 3a), and the difference between that payment and the market prices forcoffee in Padang and Batavia (Figure 3b). The price per picul received by growers wasonly 3 guilders in Priangan until the 1850s, while it was 6 guilders in West Sumatra, andwhen the price in Priangan was raised to 6 guilders in the 1860s, it was again double thatnumber in West Sumatra. It was only in the 1870s that prices received by farmers fortheir coffee were similar in both areas. Until then, the Priangan system was clearly moreextractive than that of West Sumatra, especially since there was hardly any difference inrice prices in both regions (see Appendix A3).
In the early twentieth century, compulsory coffee cultivation was abolished in bothareas; in West Sumatra it ended in 1908 while in Priangan it ended nine years after that(Oki 1977, 139; Li, Pelletier, and Sangadji 2016, 599). By that time, however, forced coffeecultivation had been in long decline (Figure 2). One reason for the decline in both areaswas the leaf blight that struck in the 1880s (Fernando 2003, 164). More important for thedecline, however, was expanded commercialisation, creating other, more attractiveopportunities, such as wage labour and the cultivation of other cash crops. Neither thecolonial government nor local elites retained sufficient power to force the peasantry towork in Sumatra (Young 1994, 180).
Thus, while there were similarities in these exporting coffee regimes in the nineteenthcentury, with comparable amounts and trends in the export of coffee, there were threeimportant differences. First, the Priangan system was more “extractive” in terms of themoney received by the peasants until the 1880s and the consequent profits reaped by thecolonial government. Second, plantation production was much more important inPriangan. Third, the burden of forced coffee cultivation was more equally distributedin West Sumatra as there were a greater number of households that each delivereda smaller amount of coffee to the colonial authorities.
Colonial Policies in the Twentieth Century
Until the 1870s, agricultural production in both areas had been narrowly focussed oncoffee for export and rice for subsistence needs. The implementation of the AgriculturalLaw in 1870 allowed Western capitalist enterprises to lease still uncultivated lands, or
JOURNAL OF CONTEMPORARY ASIA 7
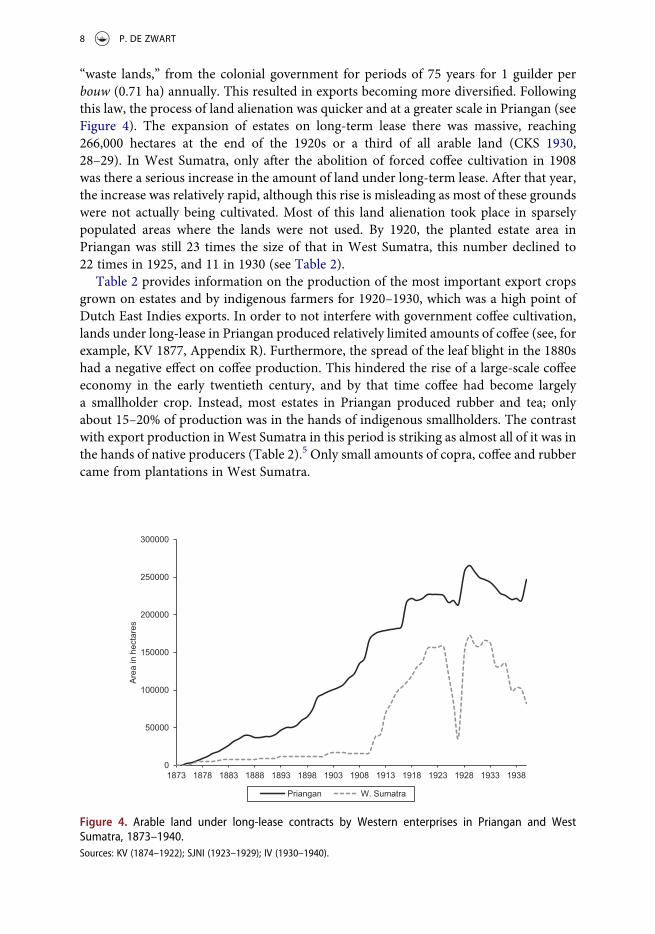
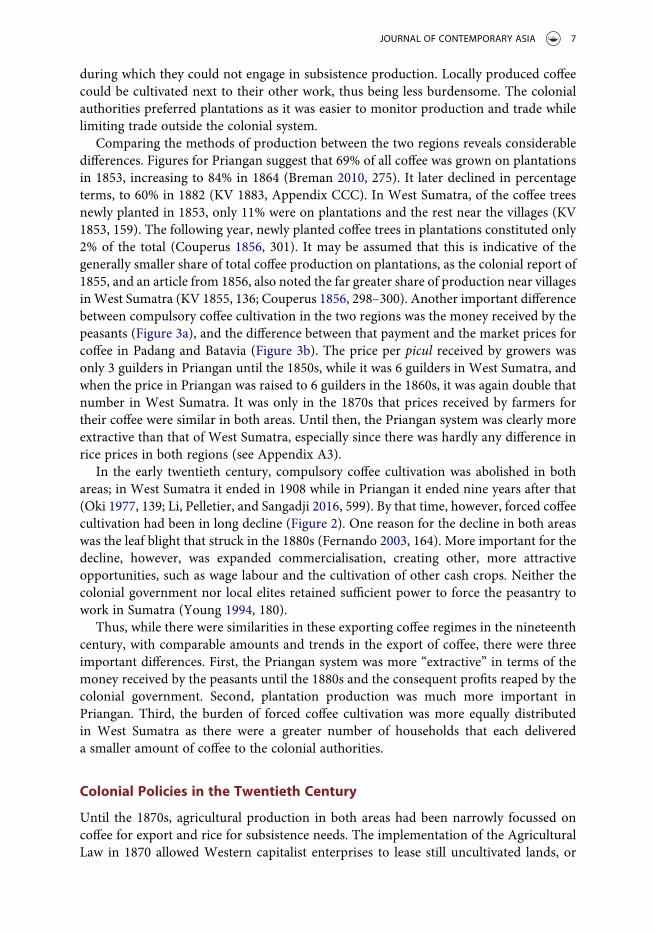
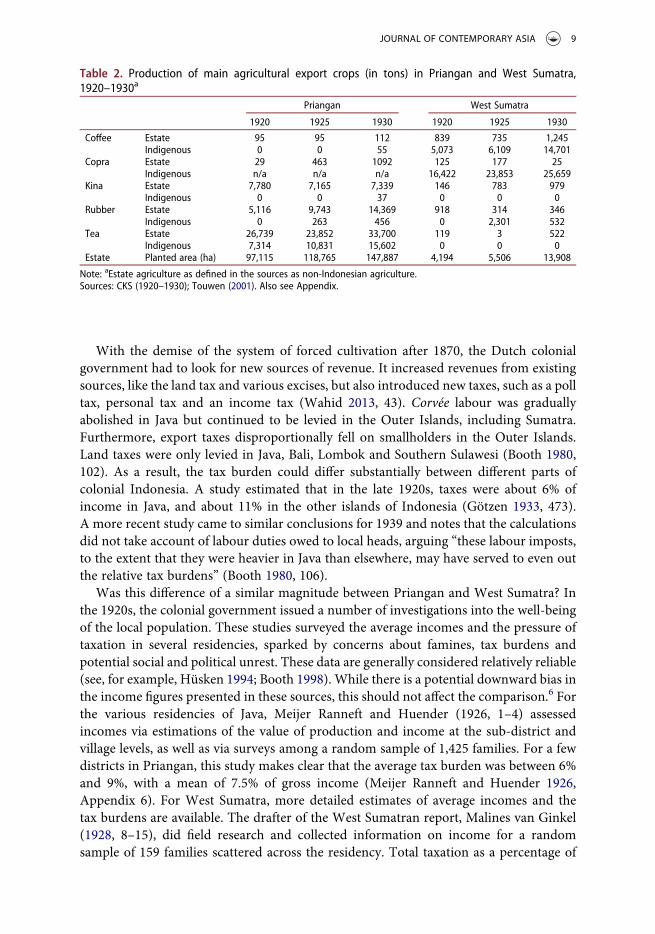
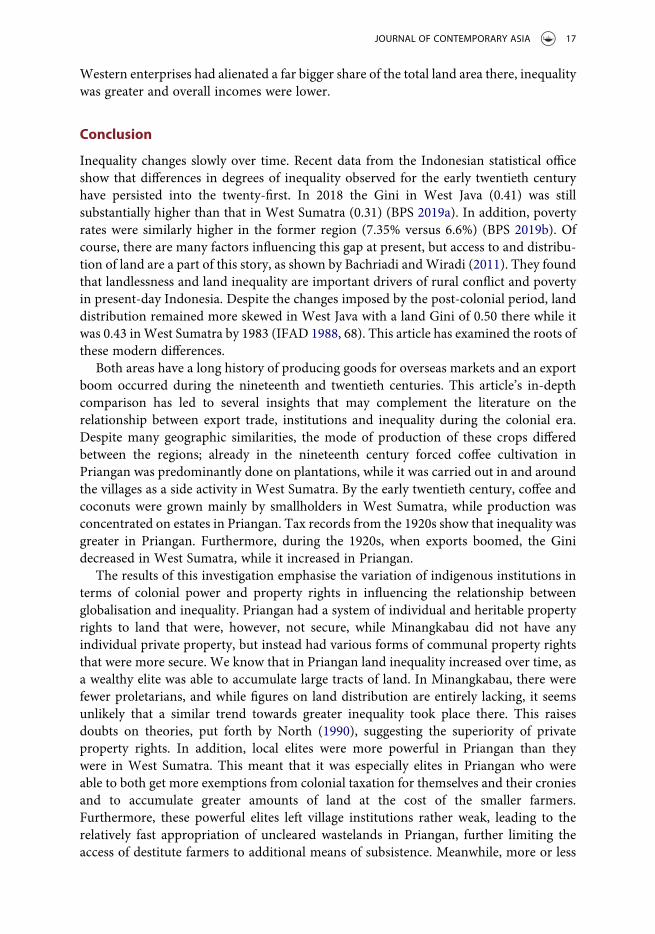
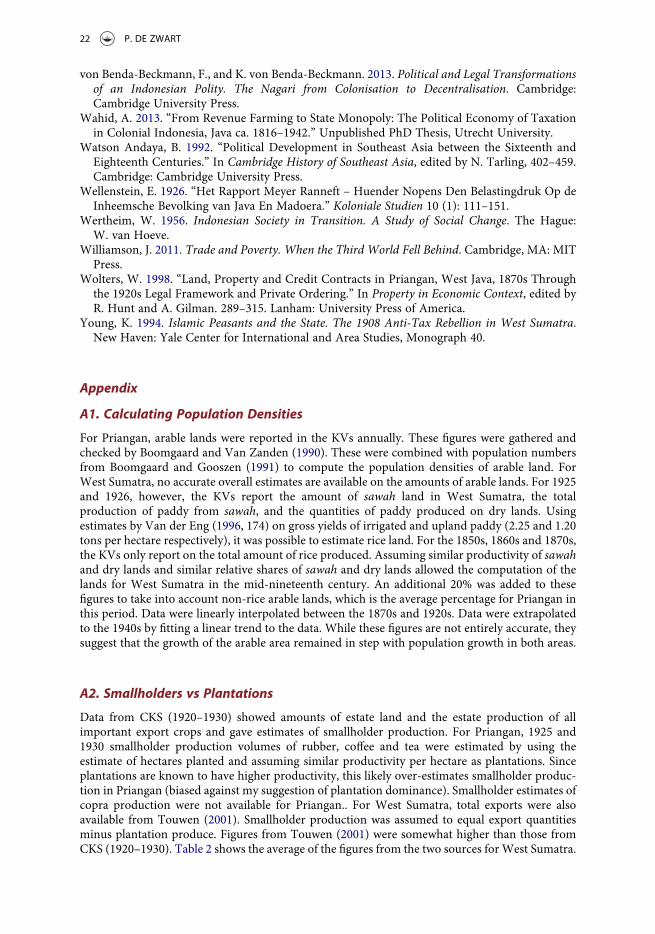
“waste lands,” from the colonial government for periods of 75 years for 1 guilder perbouw (0.71 ha) annually. This resulted in exports becoming more diversified. Followingthis law, the process of land alienation was quicker and at a greater scale in Priangan (seeFigure 4). The expansion of estates on long-term lease there was massive, reaching266,000 hectares at the end of the 1920s or a third of all arable land (CKS 1930,28–29). In West Sumatra, only after the abolition of forced coffee cultivation in 1908was there a serious increase in the amount of land under long-term lease. After that year,the increase was relatively rapid, although this rise is misleading as most of these groundswere not actually being cultivated. Most of this land alienation took place in sparselypopulated areas where the lands were not used. By 1920, the planted estate area inPriangan was still 23 times the size of that in West Sumatra, this number declined to22 times in 1925, and 11 in 1930 (see Table 2).
Table 2 provides information on the production of the most important export cropsgrown on estates and by indigenous farmers for 1920–1930, which was a high point ofDutch East Indies exports. In order to not interfere with government coffee cultivation,lands under long-lease in Priangan produced relatively limited amounts of coffee (see, forexample, KV 1877, Appendix R). Furthermore, the spread of the leaf blight in the 1880shad a negative effect on coffee production. This hindered the rise of a large-scale coffeeeconomy in the early twentieth century, and by that time coffee had become largelya smallholder crop. Instead, most estates in Priangan produced rubber and tea; onlyabout 15–20% of production was in the hands of indigenous smallholders. The contrastwith export production inWest Sumatra in this period is striking as almost all of it was inthe hands of native producers (Table 2).5 Only small amounts of copra, coffee and rubbercame from plantations in West Sumatra.
0
50000
100000
150000
200000
250000
300000
1873 1878 1883 1888 1893 1898 1903 1908 1913 1918 1923 1928 1933 1938
Are
a in
hec
tare
s
Priangan W. Sumatra
Figure 4. Arable land under long-lease contracts by Western enterprises in Priangan and WestSumatra, 1873–1940.Sources: KV (1874–1922); SJNI (1923–1929); IV (1930–1940).
8 P. DE ZWART
With the demise of the system of forced cultivation after 1870, the Dutch colonialgovernment had to look for new sources of revenue. It increased revenues from existingsources, like the land tax and various excises, but also introduced new taxes, such as a polltax, personal tax and an income tax (Wahid 2013, 43). Corvée labour was graduallyabolished in Java but continued to be levied in the Outer Islands, including Sumatra.Furthermore, export taxes disproportionally fell on smallholders in the Outer Islands.Land taxes were only levied in Java, Bali, Lombok and Southern Sulawesi (Booth 1980,102). As a result, the tax burden could differ substantially between different parts ofcolonial Indonesia. A study estimated that in the late 1920s, taxes were about 6% ofincome in Java, and about 11% in the other islands of Indonesia (Götzen 1933, 473).A more recent study came to similar conclusions for 1939 and notes that the calculationsdid not take account of labour duties owed to local heads, arguing “these labour imposts,to the extent that they were heavier in Java than elsewhere, may have served to even outthe relative tax burdens” (Booth 1980, 106).
Was this difference of a similar magnitude between Priangan and West Sumatra? Inthe 1920s, the colonial government issued a number of investigations into the well-beingof the local population. These studies surveyed the average incomes and the pressure oftaxation in several residencies, sparked by concerns about famines, tax burdens andpotential social and political unrest. These data are generally considered relatively reliable(see, for example, Hüsken 1994; Booth 1998). While there is a potential downward bias inthe income figures presented in these sources, this should not affect the comparison.6 Forthe various residencies of Java, Meijer Ranneft and Huender (1926, 1–4) assessedincomes via estimations of the value of production and income at the sub-district andvillage levels, as well as via surveys among a random sample of 1,425 families. For a fewdistricts in Priangan, this study makes clear that the average tax burden was between 6%and 9%, with a mean of 7.5% of gross income (Meijer Ranneft and Huender 1926,Appendix 6). For West Sumatra, more detailed estimates of average incomes and thetax burdens are available. The drafter of the West Sumatran report, Malines van Ginkel(1928, 8–15), did field research and collected information on income for a randomsample of 159 families scattered across the residency. Total taxation as a percentage of
Table 2. Production of main agricultural export crops (in tons) in Priangan and West Sumatra,1920–1930a
Priangan West Sumatra
1920 1925 1930 1920 1925 1930
Coffee Estate 95 95 112 839 735 1,245Indigenous 0 0 55 5,073 6,109 14,701
Copra Estate 29 463 1092 125 177 25Indigenous n/a n/a n/a 16,422 23,853 25,659
Kina Estate 7,780 7,165 7,339 146 783 979Indigenous 0 0 37 0 0 0
Rubber Estate 5,116 9,743 14,369 918 314 346Indigenous 0 263 456 0 2,301 532
Tea Estate 26,739 23,852 33,700 119 3 522Indigenous 7,314 10,831 15,602 0 0 0
Estate Planted area (ha) 97,115 118,765 147,887 4,194 5,506 13,908
Note: aEstate agriculture as defined in the sources as non-Indonesian agriculture.Sources: CKS (1920–1930); Touwen (2001). Also see Appendix.
JOURNAL OF CONTEMPORARY ASIA 9
gross income in West Sumatra lies between 4% and 10%, with a mean of 6.3% for eightdistricts.
Living Standards and Inequality
The investigations on average incomes and the tax burden introduced in the previoussection provide information about living standards and inequality in these regions. Theaverage annual gross income per person found for Priangan ranged between fl. 27 and 37,depending on district and method of estimation (Meijer Ranneft and Huender 1926,Appendix 6). In West Sumatra, reported gross incomes per person were between fl. 55and fl. 66 in the main towns of Padang and Pariaman. These estimates were mainly basedon the incomes of craftsmen and wage labourers. Outside of the towns, rural familiescould have substantially higher incomes, reaching fl. 132–fl. 167 in areas that wereimportant centres of smallholder coffee, copra and rubber production. Even in thepoorest and least commercialised region of West Sumatra average income was estimatedto be over fl. 51 per person – a full 14 guilders higher than the maximum estimate forPriangan (Malines van Ginkel 1928, 14). After taxes, the gap remains of a similar size: netannual incomes in Priangan lie between fl. 24 and fl. 34 (Meijer Ranneft and Huender1926, Appendix 6), while the lowest net income in West Sumatra was almost fl. 48 perperson (Malines van Ginkel 1928, 14). Since rice prices were more or less equal in the twoareas in these years this meant that the average Minangkabau inhabitant was substantiallybetter off than its Sundanese counterpart.
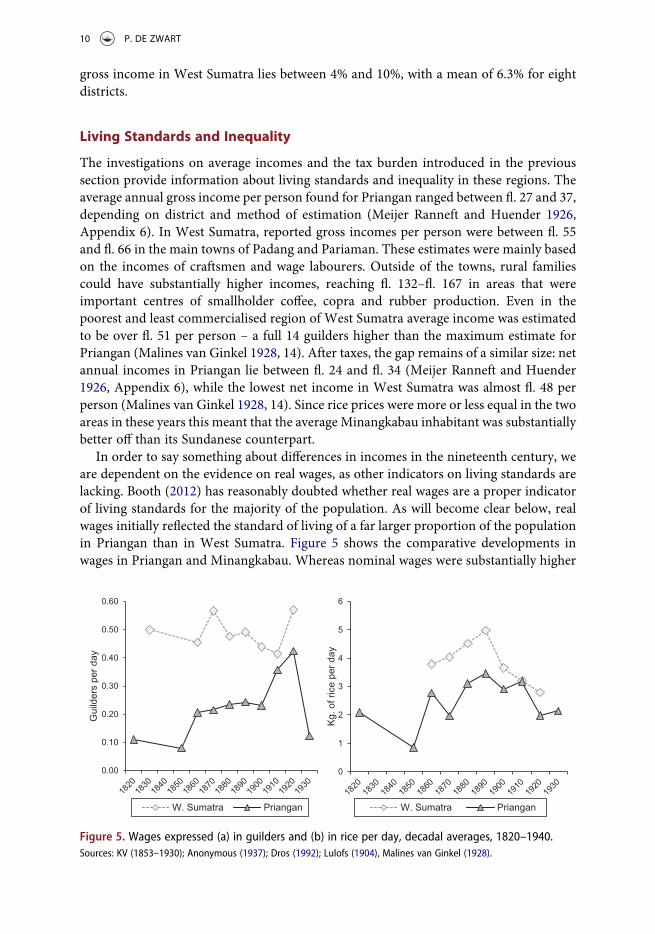
In order to say something about differences in incomes in the nineteenth century, weare dependent on the evidence on real wages, as other indicators on living standards arelacking. Booth (2012) has reasonably doubted whether real wages are a proper indicatorof living standards for the majority of the population. As will become clear below, realwages initially reflected the standard of living of a far larger proportion of the populationin Priangan than in West Sumatra. Figure 5 shows the comparative developments inwages in Priangan and Minangkabau. Whereas nominal wages were substantially higher
0.00
0.10
0.20
0.30
0.40
0.50
0.60
Gui
lder
s pe
r day
W. Sumatra Priangan
0
1
2
3
4
5
6
Kg.
of r
ice
per d
ay
W. Sumatra Priangan
Figure 5. Wages expressed (a) in guilders and (b) in rice per day, decadal averages, 1820–1940.Sources: KV (1853–1930); Anonymous (1937); Dros (1992); Lulofs (1904), Malines van Ginkel (1928).
10 P. DE ZWART
in West Sumatra over most of the nineteenth century, there is wage convergence up tothe early twentieth century. Real wages (expressed in kilogrammes of rice per day) showa somewhat different picture. We can again see a gap in the nineteenth century, withWest Sumatra having higher real wages than workers in Priangan, but there is somedivergence up to the 1890s and then clear convergence in the first decades of thetwentieth century. In the 1910s, real incomes of wage labourers are on the same level.This wage convergence may in part be the result of increased migration between Java andSumatra from the late nineteenth century (Hugo 1980, 106–110). These graphs show thatwage labourers were noticeably more affluent in West Sumatra until the early twentiethcentury.
How many people in these regions were dependant on wages? Breman (2010, 284)notes that already in the 1860s, 30–50% (depending on the source) of the households inPriangan engaged in agriculture did not own any rice fields. Data on the distribution ofland in Java in 1903 suggests that over 50% of the total adult male population did nothave their own lands in Priangan and that even 63% of the adult male population wereengaged in by-employment such as wage labour, suggesting that for a certain group oflandholding peasants, incomes from their land were too small to make ends meet(Fernando 1989, 157). Landownership in Priangan had declined to about 40% by thelate 1920s (Ploegsma 1936, 52). For West Sumatra, in 1905, only 4.5% of the agriculturalpopulation did not own land (KV 1907). By the 1920s the number of people engaged inwage labour in West Sumatra had increased to almost 20% of the total adult malepopulation (Malines van Ginkel 1928, 20–21).
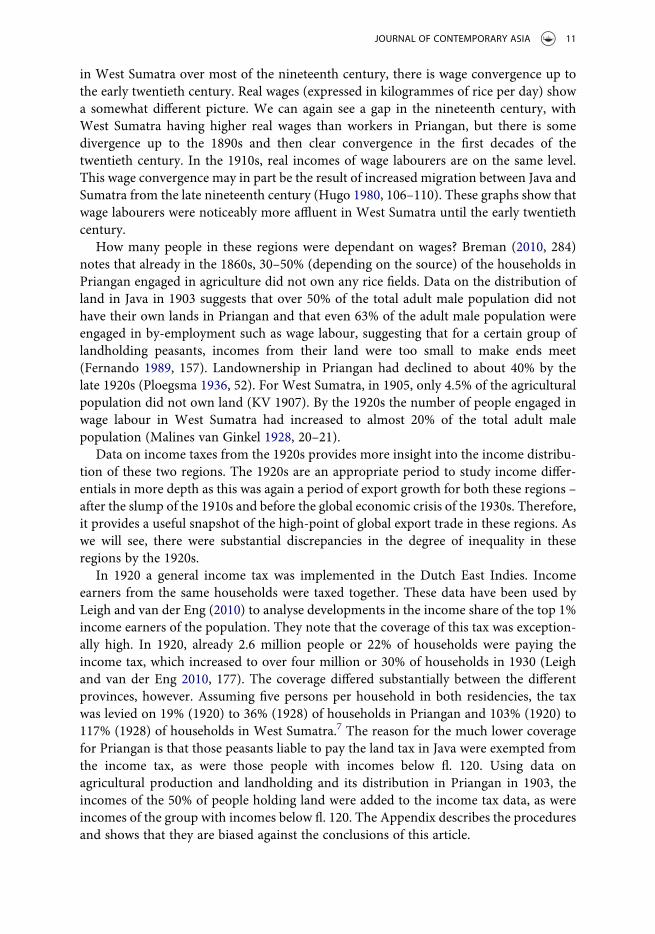
Data on income taxes from the 1920s provides more insight into the income distribu-tion of these two regions. The 1920s are an appropriate period to study income differ-entials in more depth as this was again a period of export growth for both these regions –after the slump of the 1910s and before the global economic crisis of the 1930s. Therefore,it provides a useful snapshot of the high-point of global export trade in these regions. Aswe will see, there were substantial discrepancies in the degree of inequality in theseregions by the 1920s.
In 1920 a general income tax was implemented in the Dutch East Indies. Incomeearners from the same households were taxed together. These data have been used byLeigh and van der Eng (2010) to analyse developments in the income share of the top 1%income earners of the population. They note that the coverage of this tax was exception-ally high. In 1920, already 2.6 million people or 22% of households were paying theincome tax, which increased to over four million or 30% of households in 1930 (Leighand van der Eng 2010, 177). The coverage differed substantially between the differentprovinces, however. Assuming five persons per household in both residencies, the taxwas levied on 19% (1920) to 36% (1928) of households in Priangan and 103% (1920) to117% (1928) of households in West Sumatra.7 The reason for the much lower coveragefor Priangan is that those peasants liable to pay the land tax in Java were exempted fromthe income tax, as were those people with incomes below fl. 120. Using data onagricultural production and landholding and its distribution in Priangan in 1903, theincomes of the 50% of people holding land were added to the income tax data, as wereincomes of the group with incomes below fl. 120. The Appendix describes the proceduresand shows that they are biased against the conclusions of this article.
JOURNAL OF CONTEMPORARY ASIA 11

In addition, the tax assessments showed figures separately for different ethnic groups:“Europeans,” “Foreign Asiatics” and “Indigenous.” Leigh and Van der Eng (2010, 177)note that these categories are misleading, as Chinese, for example, could be noted as“Foreign Asiatics” or as “Europeans.” Therefore, these distinctions are not used in thearticle and instead inequality is calculated for the population at large.8 Finally, assess-ments for the income tax were made by village heads rather than by the colonial officialsand it is likely that these heads may have under-reported the actual incomes to beassessed (Leigh and van der Eng 2010, 177). Especially among the lower income brackets,under-reporting means that the figures shown in Table 3 may understate the true level ofinequality. In this article, only figures for 1920 and 1928 from KV 1922 and 1930 are usedas after 1930 the data on the income tax that appeared in the Indian Reports (IndischeVerslagen) reported only information for Java and the Outer Islands as a whole and donot allow a calculation of inequality for separate residencies.
Both the land tax and the income tax were, to an extent, progressive taxes, so after-taxinequality figures can differ from pre-tax figures. Tax rates for incomes above theminimum of fl. 120 increased from 1% plus a lump sum of fl. 1.20 on the lowest taxableincomes to 25% plus a lump sum of fl. 29,566.80 for incomes above 180,000. The land taxwas levied on both sawah and dry lands and took into account information about theproductivity of the fields as well as the average price for rice in a region. In the Appendixthe procedures to arrive at pre- and post-tax estimates of inequality are detailed. Table 3shows the after-tax figures, while Table A2 in the Appendix includes pre- and post-taxnumbers (the differences are negligible).
Table 3 first shows the Gini – the most commonly used measure of inequality – in bothareas. In both 1920 and 1928 the Gini was much larger in Priangan and the gap increasedsubstantially during this period, Following the methodology used by Milanovic, Lindert,and Williamson (2011), an estimate of the “inequality extraction ratio” (IER) can bemade. This considers there is a maximum amount of inequality in pre-industrial societiessince incomes of the poorest parts of society cannot drop below subsistence level. Theydefine an inequality possibility frontier where the maximum Gini is 0 in a society withincomes at subsistence level, but rises to about 60 when average incomes are 2.5 timessubsistence level. Table 3 shows that the IER was also higher in Priangan and the gapagain increasing over the 1920s. In both Sumatra and Priangan there is a decline in theIER over the 1920s, driven by an increase in average assessed incomes and a large declinein prices – pushing up the maximum feasible inequality. Larger inequality, and a growingdifference in the degree of inequality, when incomes were going up resulting from thetrade boom of the 1920s clearly suggests that the gains from trade were distributeddifferently in these areas, benefitting the wealthy in Priangan, while in West Sumatra thegains were more widely enjoyed.
While the evidence presented here is not without problems, it is difficult to escape theconclusion that inequality and poverty were greater in Priangan than in West Sumatra. Itis likely that more complete information would only strengthen the picture sketchedhere, as the procedures followed were biased against the conclusions developed in thisarticle.
12 P. DE ZWART
Indigenous Institutions
Why did areas that were so similar in terms of geography, climate and factor endow-ments develop differently in terms of income and inequality outcomes? In seeking toanswer this question, the argument is that different indigenous institutions play animportant role in the divergence. The focus here is on: (i) the power of local elites; and(ii) different property rights regimes that were related to family systems. These institu-tions were the result of a long-run path-dependent process, as the discussion belowdemonstrates.9 Especially because pre-colonial Indonesia has a long history of politicalfragmentation, the position and power of local elites differed greatly across the archipe-lago (Watson Andaya 1992).
The VOC in the eighteenth century did not establish direct rule over the Prianganregion. Instead the regents remained in charge of the administration. They had torecognise VOC sovereignty and were put in charge of the forced deliveries of coffee,for which they were paid by the VOC. The Priangan regents in this system wieldedsubstantial power, as evidenced by their success in delivering large amounts of coffee atlow prices. Meanwhile, village institutions and the village head were “not very powerful”(Wolters 1998, 297). The power of the local aristocracy across Java was diminished underthe nineteenth-century Cultivation System, as the heads were in principle placed underthe supervision of European superiors. This was not the case in Priangan, however, asthere the regents continued to be the most important authority. Because of the regents’success in obtaining large amounts of coffee from a Sundanese population that wasapparently obedient to them, the colonial government thought that maintaining thesystem (with substantial power for the regents and district heads) would be the mosteffective way of reaping economic benefit from the area (Breman 2010, 193). The regentsin Priangan thus held much more autonomy than in other parts of Java, village (desa)institutions were significantly weaker than elsewhere and European supervision of thedelivery system was more limited. By the middle of the nineteenth century, the extra-ordinary wealth of the Sundanese aristocracy had become a nuisance to the colonialgovernment as it implied smaller profits for the colonial government and greaterexploitation of peasants (Breman 2010, 290).
Only after a re-organisation of the coffee cultivation system of the early 1870s didvillage institutions, the village headman and administrators, in Priangan become moresignificant with the regents and supra-village elites losing some of their power to colonialofficials. The number of European officials in the residency doubled to 38 (Breman 2010,314). Some district heads were incorporated in the colonial bureaucracy, while other localelites, whose function was unclear to the colonial authorities, lost their position. Anotherelite group, the Islamic clergy, despite efforts of the colonial government, continued tohave substantial influence; they played a role in education and the village administrationbecause they were the most literate group. While there were thus some changes takingplace over time, compared with other areas in Java, the desa remained a weak institution:the village head continued to have little power and, as will be discussed below, villageauthorities were unable to protect uncleared waste lands against alienation by outsiders(Wolters 1998, 298).
In contrast, West Sumatran villages (nagari) traditionally were highly independentunits of governance. Sometimes called “village republics,” nagari were associations of
JOURNAL OF CONTEMPORARY ASIA 13
matriclans, consisting of one or more matrilineal families that were each headed bya lineage head (panghulu). The nagari was headed by the council of lineage heads, whichformed both the “village government and highest judicial authority, on the basis of equalstatus of all lineage heads” (Von Benda-Beckmann and Von Benda-Beckmann 2013, 49).While the nagari were not entirely egalitarian, as some members had higher positionsthan others, the decision-making in the councils was based on reaching consensus afterthoughtful reasoning and discussion. The panghulus often consulted with their lineagemembers before taking part in the village council deliberations; the panghulus did not“wield ‘despotic’ power over their subordinates” (Oki 1977, 33). Stamford Rafflesexpressed his annoyance of having to deal with hundreds “of equally powerful panghulumerely to get permission for his party to cross nagari lands,” while Dutch colonialofficials complained that “Minangkabau traditional democratic government . . . was notcompatible with the modern needs of centralisation and the creation of a professionalcadre of civil servants” (cited in Ambler 1988, 50–51).
The Dutch colonial government did attempt, and succeeded to some extent, to changepower relations in Minangkabau. They elevated the positions of some panghulu that werepart of the colonial administration at the village or district levels. As Dobbin (1983, 233)notes, it was their goal to create a Minangkabau “aristocracy” whose fortunes were tied tothose of the Dutch. After first failed attempts of installing Javanese-style regents, it wasthought, in the words of the Minister for the Colonies, J. C. Baud, that only gradually the“democratic principle” of administration was to be supplanted by the “aristocraticprinciple” (cited in Dobbin 1983, 233). There was gradual change and some panghulubecame increasingly powerful and even abused their power (Ambler 1988, 53). Thecolonial government also tried to limit the growth of the number of panghulu and startedto interfere with the membership of councils. However, as Von Benda-Beckmann andVon Benda-Beckmann (2013, 94) concluded:
These new administrative structures, while domesticated and important in nagari politics,never fully replaced the old one, which lived on as ideal patterns and actual institutions. Thepositions of some lineage heads were weakened and others were strengthened, but there isno evidence that panghulu councils were “reduced to a ceremonial gathering.”
Thus, there were clear differences between the two regions in terms of power structuresand the balance of power between the elites and peasant population. This had importantconsequences: the powerful aristocracy of Priangan was able, not only to demand sub-stantial labour service from the local peasantry, they were also able to arrange exemptionsfrom government services for their own families as well as families providing services tothem. The increasing share of the population that was exempted meant that the labour andcultivation services requested from the remainder of the population increased. Thesepoorer farmers were sometimes forced to sell their land in order to be relieved from thehigh labour demands, whichmeant that increasing labour services consequently pressed onan even smaller part of the population. In contrast, the local consultative institutions of theMinangkabau meant that almost no one was exempted from government labour and thatcultivation services were spread – less demandingly – across almost the entire population.In addition, no other “feudal” services were requested. The average amount of labourrequested fromMinangkabau families was thus lower than from those not exempted fromlabour services in Priangan. West Sumatrans also received higher prices for the coffee
14 P. DE ZWART
delivered, making the forced cultivation of the product less burdensome; in fact, it seemsthat until the 1870s the coffee price was favourable for its cultivation even without coercion.Additionally, the powerful regents and district heads of the Priangan also left villageinstitutions rather weak. This meant that they offered little protection against both theconfiscation of private lands by elites, as well as the alienation of village lands after theAgrarian Law of 1870. Meanwhile, much stronger village institutions of the Minangkabauprovided greater security and limited the alienation of both family and village lands.
There has been academic debate about the nature of landholding in colonialIndonesia, and Java in particular, since the nineteenth century. Two categories of land-holding can be distinguished: hereditary private property and communal property(Boomgaard 1989, 2). Large-scale research into the rights of the Javanese to land wasconducted in the late 1860s and showed substantial variation between the variousregencies in terms of property rights regimes.
In Priangan, almost all sawah land was heritable private property that could be boughtand sold (Kano 1977, 13). Land as private property could also be created by clearingwastelands and turning them into sawah. In contrast to modern private property,however, there were often restrictions on who could own land in Java, requiring anowner to be able to cultivate it. At times, no sale or purchase was allowed at all. InPriangan, however, there seem to have been relatively few restrictions to the transfer ofthe land (Kano 1977, 13).
These rights over land were not very secure and the research into the land rights of theJavanese population in the late nineteenth century demonstrated that it was normalpractice of the local aristocracy in Priangan to alienate lands from the lower classes(Bergsma 1880, vol. II, 43). For land rights to be secure there is the need for a formalregistration and a means to proof possession of the land. As Van der Eng (2016, 230) alsoobserved, there was little accurate land registration in nineteenth-century Java, as thecosts of extensive cadastral surveys were likely to exceed any tax revenues that could bebased on such surveys (see also Kano 2008, 321). However, at the end of the nineteenthcentury, in order to aid the collection of the newly implemented landtax in Priangan,there were renewed attempts at land registration in a number of districts. In the late1910s, however, legal documents recording native land possession, “such as certificates ofregistry and ownership documents, were absent” (Wolters 1998, 309). Without properinstitutions, like a land register and a notary and registry offices, it was impossible toprove land possession in court. Furthermore, as noted above, weak village institutionsmeant poor protection of village lands. This meant that most of the still uncleared landsin Priangan were quickly leased out to Western enterprises after the Agrarian Law of1870 (see Figure 4). Weak private property and village institutions meant that many ofthe Sundanese smaller farmers lost their access to both their own plots of land, as well asthe possibility to open up new lands by clearing wastelands.
The increasing inequality in land ownership, especially the accumulation of land bya small group of wealthy landowners has been noted for Priangan (Wertheim 1956, 111).Forced coffee cultivation had stimulated this as small landowners sometimes had to selltheir lands in order to be relieved from the pressing labour services that were attached tothe land (Scheltema 1927, 292). Most of the increased land inequality developed after1876. At that time, a government report noted that large landownership was still largelyabsent from Priangan (Bergsma 1876, vol. I, 185–187). Scheltema (1927, 299) notes that
JOURNAL OF CONTEMPORARY ASIA 15
the relatively “free” land market with individual private property rights in Priangan aidedland accumulation in the hands of the few. Land also accrued to the wealthy via thecapital market. Small farmers who needed money could pledge their land to a localmoneylender, yet if the farmer defaulted, the land would become the property of themoneylender (Wolters 1998, 304–306). Often the goal of these moneylenders was toacquire land. These lenders included the bupati, their families and other aristocrats, aswell as members of the Islamic clergy and wealthy landowners and merchants (Scheltema1927, 301–303).
The land tenure situation in West Sumatra could not have been more different (seevon Benda-Beckmann and von Benda-Beckmann 2006). Irrigated rice fields and houseswere generally the communal property of an extended family and were inherited throughthe female line. Lands that had been cleared by a families’ ancestors could be subject toredistribution among different sub-lineages for necessary demographic or economicreasons (via processes of deliberation among lineage members). Members of a lineagethat cleared new lands held some autonomy over this self-acquired property, especiallyduring their lifetimes. This land would only be inherited by members of the sub-lineageof the pioneer cultivator. Sale, or any other kind of permanent alienation, of familyproperty was not allowed, but these fields could be pawned if a lineage needed money.A final type of communal property was the uncleared wastelands that were commonproperty of the nagari controlled by the nagari council. Village members had free accessto these lands. Under traditional law (adat) these lands could not be permanentlyalienated.
Schrieke (1955, 95–110) thought that the increased pawning of lands and expandingcommercialisation and monetisation of the West Sumatran economy in the early twen-tieth century meant that traditional Minangkabau institutions of communal propertywere breaking down. He was wrong. Data from 1934 showed that no permanent con-version of family land to private property had taken place in the areas on which Schriekebased his conclusions (Oki 1977, 101). While it is clear that colonial rule and rising exporttrade meant considerable changes for Minangkabau society, many facets of adat law andlocal customs persisted. Both village councils and communal property rights haveremained largely intact. When the Dutch issued the Domain Declaration for Sumatrain 1874, this theoretically transformed all village lands into government lands overnight.In practice, village rights to “waste lands” continued to be recognised by the governmentand the declaration was initially kept secret in West Sumatra, as the government fearedwidespread rebellion. At the same time, especially after the abolishment of the coffeecultivation system in 1908, the process of land alienation also took off in West Sumatra(see Figure 4). This was mostly in areas that were not densely populated and before suchleases were given out “agreement with village governments was sought” (von Benda-Beckmann and von Benda-Beckmann 2006, 206; see also Oki 1977 and Young 1994).
Both in the views of nineteenth- and twentieth-century colonial administrators, as wellas present-day “new institutional economic history” scholars, institutions of village andlineage property are seen as inhibiting economic growth. At the same time, Minangkabauvillage and property institutions may have provided better protection against landalienation than the (insecure) heritable private property rights to land in Priangan. Theconsequences were clear: landlessness was much more widespread in Priangan and
16 P. DE ZWART
Western enterprises had alienated a far bigger share of the total land area there, inequalitywas greater and overall incomes were lower.
Conclusion
Inequality changes slowly over time. Recent data from the Indonesian statistical officeshow that differences in degrees of inequality observed for the early twentieth centuryhave persisted into the twenty-first. In 2018 the Gini in West Java (0.41) was stillsubstantially higher than that in West Sumatra (0.31) (BPS 2019a). In addition, povertyrates were similarly higher in the former region (7.35% versus 6.6%) (BPS 2019b). Ofcourse, there are many factors influencing this gap at present, but access to and distribu-tion of land are a part of this story, as shown by Bachriadi andWiradi (2011). They foundthat landlessness and land inequality are important drivers of rural conflict and povertyin present-day Indonesia. Despite the changes imposed by the post-colonial period, landdistribution remained more skewed in West Java with a land Gini of 0.50 there while itwas 0.43 inWest Sumatra by 1983 (IFAD 1988, 68). This article has examined the roots ofthese modern differences.
Both areas have a long history of producing goods for overseas markets and an exportboom occurred during the nineteenth and twentieth centuries. This article’s in-depthcomparison has led to several insights that may complement the literature on therelationship between export trade, institutions and inequality during the colonial era.Despite many geographic similarities, the mode of production of these crops differedbetween the regions; already in the nineteenth century forced coffee cultivation inPriangan was predominantly done on plantations, while it was carried out in and aroundthe villages as a side activity in West Sumatra. By the early twentieth century, coffee andcoconuts were grown mainly by smallholders in West Sumatra, while production wasconcentrated on estates in Priangan. Tax records from the 1920s show that inequality wasgreater in Priangan. Furthermore, during the 1920s, when exports boomed, the Ginidecreased in West Sumatra, while it increased in Priangan.
The results of this investigation emphasise the variation of indigenous institutions interms of colonial power and property rights in influencing the relationship betweenglobalisation and inequality. Priangan had a system of individual and heritable propertyrights to land that were, however, not secure, while Minangkabau did not have anyindividual private property, but instead had various forms of communal property rightsthat were more secure. We know that in Priangan land inequality increased over time, asa wealthy elite was able to accumulate large tracts of land. In Minangkabau, there werefewer proletarians, and while figures on land distribution are entirely lacking, it seemsunlikely that a similar trend towards greater inequality took place there. This raisesdoubts on theories, put forth by North (1990), suggesting the superiority of privateproperty rights. In addition, local elites were more powerful in Priangan than theywere in West Sumatra. This meant that it was especially elites in Priangan who wereable to both get more exemptions from colonial taxation for themselves and their croniesand to accumulate greater amounts of land at the cost of the smaller farmers.Furthermore, these powerful elites left village institutions rather weak, leading to therelatively fast appropriation of uncleared wastelands in Priangan, further limiting theaccess of destitute farmers to additional means of subsistence. Meanwhile, more or less
JOURNAL OF CONTEMPORARY ASIA 17
“democratic” and relatively autonomous village institutions were better able to protectlands against alienation in West Sumatra. The comparison has shown that the effects ofglobalisation, even when largely forced upon societies by an external colonial power, arecrucially influenced by local institutions.
Notes
1. Percentages represent the averages for the years 1920, 1925 and 1930 for the most importantcrops: coffee, kina, rubber, tea and copra (see Table 2).
2. Assuming a family of five persons (Boomgaard 1989, 153–154).3. Breman (2010, 271) provides some examples of different types of punishment for miscon-
duct and the use of arms to force workers onto plantations.4. By the mid-1920s, this number had declined to about two days and almost 90% of people
liable to these services bought themselves out (KV 1926).5. Indigenous rubber production declined inWest Sumatra after 1925, a peak year, probably in
response to declining world prices.6. The investigators expected a downward bias in the average income figures as they could not
be certain to have included all potential sources of income. Furthermore, the local popula-tion may have reported lower income figures out of fear for higher taxes.
7. For Priangan, see Boomgaard (1989, 149); for Minangkabau, see Young (1994, 154). Theassumption of five per household is slightly too high in West Sumatra, but that coverage ofthe tax is near universal.
8. The Appendix also shows data on inequality for the indigenous population separately, withsimilar results.
9. For a discussion of path dependency in the development of local institutions for marketexchange in Java, see Henley (2015).
Acknowledgments
I thank Ulbe Bosma, Ewout Frankema, Jan Luiten van Zanden, participants of the session on“Globalization and Inequality in Southeast Asia in the Long-Run” at the World Economic HistoryConference in Boston in 2018, the Utrecht University social and economic history seminar and theWageningen University rural history seminar as well as the editor and anonymous referees of thisjournal for useful comments and suggestions. Any remaining errors and inadequacies are myresponsibility.
Disclosure Statement
No potential conflict of interest was reported by the author.
Funding
This work was supported by the Dutch Organisation for Scientific Research (NWO) under thegrant no. 275-53-016.
On-Line Data Set
Underlying data available at: https://doi.org/10.17026/dans-xfx-7ucx.
18 P. DE ZWART

References
Acemoglu, D., and J. Robinson. 2012. Why Nations Fail. The Origins of Power, Poverty andProsperity. New York: Crown Business.
Allen, R. 2015. “The High Wage Economy and the Industrial Revolution: A Restatement.” TheEconomic History Review 68 (1): 1–22.
Ambler, J. 1988. “Historical Perspectives on Sawah Cultivaiton and the Political and EconomicContext for Irrigation in West Sumatra.” Indonesia 46: 39–77.
Anonymous. 1937. “Theepluksters Werkend Voor 4½ Cent per Dag.” Indische Gids 59 (1):531–532.
Bachriadi, D., and G. Wiradi. 2011. Six Decades of Inequality. Land Tenure Problems in Indonesia.Agrarian Resource Centre. Bandung.
Bergsma, W. 1876. Eindresumé van het bij Goevernements besluit d.d. 10 Juni 1867 no. 2 bevolenonderzoek naar de rechten van den Inlander op den grond op Java en Madoera. Vol. I. Batavia:Ernst & Co.
Bergsma, W. 1880. Eindresumé van het bij Goevernements besluit d.d. 10 Juni 1867 no. 2 bevolenonderzoek naar de rechten van den Inlander op den grond op Java en Madoera. Vol. II. Batavia:Ernst & Co.
Boeke, J. 1926. “Inlandse Budgetten.” Koloniale Studien 10: 229–334.Boomgaard, P. 1989. Children of the Colonial State. Population Growth and Economie Development
in Java, 1795–1885. Amsterdam: VU Press.Boomgaard, P., and A. Gooszen. 1991. Changing Economy in Indonesia 11: Population Trends
1795–1942. Amsterdam: KIT Press.Boomgaard, P., and J. van Zanden. 1990. Changing Economy in Indonesia 10: Foodcrops and Arable
Lands, Java 1815–1942. Amsterdam: KIT Press.Booth, A. 1980. “The Burden of Taxation in Colonial Indonesia.” Journal of Southeast Asian
Studies 11 (1): 91–109.Booth, A. 1998. The Indonesian Economy in the Nineteenth and Twentieth Centuries. A History of
Missed Opportunities. Bastingstoke: Macmillan.Booth, A. 2012. “Measuring Living Standards in Different Colonial Systems: Some Evidence from
South East Asia, 1900–1942.” Modern Asian Studies 46 (5): 1145–1181.Bosma, U. 2015. “Smallpox, Vaccinations, and Demographic Divergences in Nineteenth-Century
Colonial Indonesia.” Bijdragen Tot de Taal-, Land- En Volkenkunde 171: 69–96.Bosma, U. 2019. The Making of a Periphery: How Island Southeast Asia Became a Mass Exporter of
Labor. New York: Columbia University Press.BPS. 2019a. “Gini Ratio Provinsi 2002–2018.” Badan Pusat Statistik. Accessed September 30, 2019.
https://www.bps.go.id/dynamictable/2017/04/26/1116/gini-ratio-provinsi-2002–2018.html.BPS. 2019b. “Percentage of Poor People 2007–2018.” Badan Pusat Statistik. Accessed
September 30, 2019. https://www.bps.go.id/dynamictable/2016/08/18/1219/persentase-penduduk-miskin-menurut-provinsi-2007—2018.html.
Breman, J. 2010. Koloniaal Profijt van Onvrije Arbeid. Het Preanger Stelsel van GedwongenKoffieteelt Op Java. Amsterdam: Amsterdam University Press.
CKS. 1920, 1925, 1930. Mededeelingen van het Centraal Kantoor voor de Statistiek: DeLandbouwexportgewassen van Nederlandsch-Indie. Batavia G. Kolff & Co.
CKS. 1933. Prijzen, indexcijfers en wisselkoersen op Java, 1913–1929. Batavia: Landsdrukkerij,Mededeelingen van het Centraal Kantoor voor de Statistiek te Batavia Centrum No. 88.
Couperus, P. 1856. “Aantekeningen omtrent de Landbouwkundige Nijverheid in de ResidentiePadangsche Bovenlanden.” Tijdschrift voor Indische Taal- Land- en Volkenkunde 5: 285–312.
Dobbin, C. 1983. Islamic Revivalism in a Changing Peasant Economy. Central Sumatra, 1784–1947.London: Curzon Press.
Dros, N. 1992. Changing Economy of Indonesia 13: Wages 1820–1940. Amsterdam: KIT Press.Elson, R. 1994. Village Java under the Cultivation System, 1830–1870. Sydney: Allen & Unwin.Federico, G., and A. Tena-Junguito. 2017. “Lewis Revisited: Tropical Polities Competing on the
World Market, 1830–1938.” Economic History Review 70 (4): 1244–1267.
JOURNAL OF CONTEMPORARY ASIA 19
Fernandez, A., and U. Kambhampati. 2017. “Shared Agency: The Dominant Spouse’s Impact onEducation Expenditure.” World Development 96: 182–197.
Fernando, M. 1989. “Javanese Peasants and By-Employment at the Turn of the Century.” InObserving Change in Asia: Essays in Honour of J.A.C. Mackie, edited by R. May andW. O’Malley, 155–169. Bathurst: Crawford House Press.
Fernando, M. 2003. “Coffee Cultivation in Java, 1830–1917.” In The Global Coffee Economy inAfrica, Asia, and Latin America 1500-1989, edited by W. Clarence-Smith, 100–119. Cambridge:Cambridge University Press.
Geertz, C. 1963. Agricultural Involution. The Processes of Ecological Change in Indonesia. Berkeley:University of California Press.
Gordon, A. 2010. “Netherlands East Indies: The Large Colonial Surplus of Indonesia, 1878–1939.”Journal of Contemporary Asia 40 (3): 425–443.
Gordon, A. 2012. “How Big was Indonesia’s ‘Real’ Colonial Surplus in 1878–1841?” Journal ofContemporary Asia 42 (4): 560–580.
Gordon, A. 2018. “A Last Word: Amendments and Corrections to Indonesia’s Colonial Surplus1880–1939.” Journal of Contemporary Asia 48 (3): 508–518.
Götzen, L. 1933. “Volksinkomen En Belasting.” Koloniale Studien 17 (2): 449–484.Graves, E. 1981. The Minangkabau Response to Dutch Colonial Rule in the Nineteenth Century.
Ithaca: Cornell Modern Indonesia Project.Heckscher, E. 1949. “The Effect of Foreign Trade on the Distribution of Income.” In Readings in
the Theory of International Trade, edited by H. Ellis and L. Metzler, 272–300. Philidelphia:Blakiston.
Henley, D. 2015. “From Tribest to Transaction Costs: How Two Anthropologists of Southeast AsiaAnticipated the New Institutional Economics.” In Promises and Predicaments, edited byA. Schrikker and J. Touwen, 163–178. Singapore: NUS Press.
Hugo, G. 1980. “Population Movements in Indonesia during the Colonial Period.” In Indonesia:Australian Perspectives, edited by J. Fox, R. Garnaut, P. McCawley, and J. Mackie, 95–136.Canberra: Research School of Pacific Studies, Australian National University.
Hüsken, F. 1994. “Declining Welfare in Java. Government and Private Inquiries, 1903–1914.” InThe Late Colonial State in Indonesia. Political and Economic Foundations of the NetherlandsIndies, 1880–1942, edited by R. Cribb, 213–227. Leiden: KITLV Press.
IFAD. 1988. Rural Indonesia: Socio-Eocnomic Development in a Changing Environment. Rome:International Fund for Agircultural Development, Economic and Planning Department.
Indisch Staatsblad. 1921. Staatsblad over Nederlandch-Indië over 1920. Landsdrukkerij:Weltevreden.
IV. 1931–1941. Indisch Verslag & Statistisch Jaaroverzicht van Nederlandsch Indië. Batavia:Landsdrukkerij.
Kano, H. 1977. Land Tenure System and the Desa Community in Nineteenth Century Java. Tokyo:Institute of Developing Economies.
Kano, H. 2008. Indonesian Exports, Peasant Agriculture and the World Economy, 1850–2000.Athens: Ohio University Press.
KV. 1850–1929. Koloniaal Verslag. Verslag van het Beheer en den Staat der NederlandscheBezittingen en Koloniën in Oost- en West-Indië. Various editions between 1850 and 1929.
Leigh, A., and P. van der Eng. 2010. “Top Incomes in Indonesia, 1920–2004.” In Top Incomes Overthe Twentieth Century: A Global Perspective, edited by A. Atkinson and T. Piketty, 171–219.Oxford: Oxford University Press.
Li, T., A. Pelletier, and A. Sangadji. 2016. “Unfree Labour and Extractive Regimes in Colonial Javaand Beyond.” Development and Change 47 (3): 598–611.
Lindert, P. 2000. Shifting Ground. The Changing Agricultural Soils of China and Indonesia.Cambridge, MA: MIT Press.
Lucieer, A. 1924. “Het Kindertal Bij de Volkeren van Ned.-Indië (Buiten Java).” TijdschriftKoninklijk Nederlandsch Aardrijkskundig Genootschap 41: 540–563.
Lulofs, C. 1904. “Koffiecultuur En Belasting Ter Sumatra’s Westkust.” Indische Gids 26 (2):1629–1661, 1787–1815.
20 P. DE ZWART
Malines van Ginkel, H. 1928. Rapport van de Commissie van Onderzoek. Ingesteld bij hetGouvernementsbesluit van 13 Februari 1927 No. 1a. Deel II. De economische toestand en debelastingdruk met betrekking tot de Inlandsche bevolking van Sumatra’s Westkust. Weltevreden:Landsdrukkerij.
Mansvelt, W., and P. Creutzberg. 1978. Changing Economy in Indonesia, Vol. 4: Rice Prices.Amsterdam: KIT Press.
Meijer Ranneft, J., and W. Huender. 1926. Onderzoek Naar Den Belastingdruk Op de InlandscheBevolking. Weltevreden: Landsdrukkerij.
Milanovic, B., P. Lindert, and J. Williamson. 2011. “Pre-Industrial Inequality.” Economic Journal121 (551): 255–272.
North, D. 1990. Institutions, Institutional Change, and Economic Performance. Cambridge:Cambridge University Press.
Nugent, J., and J. Robinson. 2010. “Are Factor Endowments Fate?” Revista de Historia EconómicaJournal of Iberian and Latin American Economic History 28 (1): 45–82.
Ohlin, B. 1935. Interregional Trade and International Trade. Cambridge, MA: Harvard UniversityPress.
Oki, A. 1977. “Social Change in theWest Sumatran Village: 1908–1945.”Unpublished PhD Thesis,Australian National University.
OMW. 1905. Onderzoek naar de Mindere Welvaart der Inlandsche Bevolking op Java en Madura.Batavia: Landsdrukkerij.
Ploegsma, N. 1936. Oorspronkelijkheid en Economisch Aspect van het Dorp op Java en Madoera.Leiden: Drukkerij Luctor et Emergo.
Scheltema, A. 1927. “De Ontwikkeling van de Agrarische Toestanden in de Priangan.” Landbouw3: 271–304; 317–368.
Schrieke, B. 1955. “The Causes and Effects of Communism on the West Coast of Sumatra.” InIndonesian Sociological Studies I. Selected Writings of B. Schrieke, 83–166. Bandung: W. vanHoeve.
SJNI. 1922–1929. Statistisch Jaaroverzicht voor Nederlandsch-Indie. Various editions between 1922and 1929. Batavia: Landsdrukkerij.
Sokoloff, K., and S. Engerman. 2000. “History Lessons: Institutions, Factors Endowments, andPaths of Development in the New World.” Journal of Economic Perspectives 14 (3): 217–232.
Tjhan, T. 1933. De Landrente-Belasting. Rotterdam: De Banier.Touwen, J. 2001. Extremes in the Archipelago. Trade and Economic Development in the Outer
Islands of Indonesia, 1900–1942. Leiden: KITLV Press.van Baardewijk, F. 1994. Changing Economy in Indonesia, Vol. 14: The Cultivation System, Java
1834–1880. Amsterdam: KIT Press.van der Eng, P. 1996. Agricultural Growth in Indonesia. Productivity Change and Policy Impact
since 1880. Basingstoke: Palgrave Macmillan.van der Eng, P. 2004. “Productivity and Comparative Advantage in Rice Agriculture in South-East
Asia Since 1870.” Asian Economic Journal 18 (4): 345–370.van der Eng, P. 2016. “After 200 Years, Why Is Indonesia’s Cadastral System Still Incomplete?” In
Land and Development in Indonesia: Searching for the People’s Sovereignty, edited byJ. McCarthy and K. Robinson, 227–244. Singapore: ISEAS–Yusof Ishak Institute.
van Vollenhoven, J. 1872. Padang En Het Gouvernement “Sumatra’s Westkust”: Losse Gedachtenover de Oorzaken van Verval En Middelen Tot Herstel Der Welvaart. Rotterdam: J. Bladergroen.
van Zanden, J., and D. Marks. 2012. An Economic History of Indonesia. London: Routledge.Verkerk Pistorius, A. 1871. Studien over de Inlandsche Huishouding in de Padangsche Bovenlanden.
Zaltbommel: Joh. Noman en Zoon.Volkstelling. 1934–1936. Census of 1930 in the Netherlands Indies. Volumes I, IV and VI. Batavia:
Landsdrukkerij.von Benda-Beckmann, F., and K. von Benda-Beckmann. 2006. “How Communal Is Communal
and Whose Communal Is It? Lessons from Minangkabau.” In The Changing Properties ofProperty, edited by F. von Benda-Beckmann, K. von Benda-Beckmann, and M. Wiber,194–217. London: Berghahn.
JOURNAL OF CONTEMPORARY ASIA 21
von Benda-Beckmann, F., and K. von Benda-Beckmann. 2013. Political and Legal Transformationsof an Indonesian Polity. The Nagari from Colonisation to Decentralisation. Cambridge:Cambridge University Press.
Wahid, A. 2013. “From Revenue Farming to State Monopoly: The Political Economy of Taxationin Colonial Indonesia, Java ca. 1816–1942.” Unpublished PhD Thesis, Utrecht University.
Watson Andaya, B. 1992. “Political Development in Southeast Asia between the Sixteenth andEighteenth Centuries.” In Cambridge History of Southeast Asia, edited by N. Tarling, 402–459.Cambridge: Cambridge University Press.
Wellenstein, E. 1926. “Het Rapport Meyer Ranneft – Huender Nopens Den Belastingdruk Op deInheemsche Bevolking van Java En Madoera.” Koloniale Studien 10 (1): 111–151.
Wertheim, W. 1956. Indonesian Society in Transition. A Study of Social Change. The Hague:W. van Hoeve.
Williamson, J. 2011. Trade and Poverty. When the Third World Fell Behind. Cambridge, MA: MITPress.
Wolters, W. 1998. “Land, Property and Credit Contracts in Priangan, West Java, 1870s Throughthe 1920s Legal Framework and Private Ordering.” In Property in Economic Context, edited byR. Hunt and A. Gilman. 289–315. Lanham: University Press of America.
Young, K. 1994. Islamic Peasants and the State. The 1908 Anti-Tax Rebellion in West Sumatra.New Haven: Yale Center for International and Area Studies, Monograph 40.
Appendix
A1. Calculating Population Densities
For Priangan, arable lands were reported in the KVs annually. These figures were gathered andchecked by Boomgaard and Van Zanden (1990). These were combined with population numbersfrom Boomgaard and Gooszen (1991) to compute the population densities of arable land. ForWest Sumatra, no accurate overall estimates are available on the amounts of arable lands. For 1925and 1926, however, the KVs report the amount of sawah land in West Sumatra, the totalproduction of paddy from sawah, and the quantities of paddy produced on dry lands. Usingestimates by Van der Eng (1996, 174) on gross yields of irrigated and upland paddy (2.25 and 1.20tons per hectare respectively), it was possible to estimate rice land. For the 1850s, 1860s and 1870s,the KVs only report on the total amount of rice produced. Assuming similar productivity of sawahand dry lands and similar relative shares of sawah and dry lands allowed the computation of thelands for West Sumatra in the mid-nineteenth century. An additional 20% was added to thesefigures to take into account non-rice arable lands, which is the average percentage for Priangan inthis period. Data were linearly interpolated between the 1870s and 1920s. Data were extrapolatedto the 1940s by fitting a linear trend to the data. While these figures are not entirely accurate, theysuggest that the growth of the arable area remained in step with population growth in both areas.
A2. Smallholders vs Plantations
Data from CKS (1920–1930) showed amounts of estate land and the estate production of allimportant export crops and gave estimates of smallholder production. For Priangan, 1925 and1930 smallholder production volumes of rubber, coffee and tea were estimated by using theestimate of hectares planted and assuming similar productivity per hectare as plantations. Sinceplantations are known to have higher productivity, this likely over-estimates smallholder produc-tion in Priangan (biased against my suggestion of plantation dominance). Smallholder estimates ofcopra production were not available for Priangan.. For West Sumatra, total exports were alsoavailable from Touwen (2001). Smallholder production was assumed to equal export quantitiesminus plantation produce. Figures from Touwen (2001) were somewhat higher than those fromCKS (1920–1930). Table 2 shows the average of the figures from the two sources for West Sumatra.
22 P. DE ZWART

A3. Rice Prices
For Sumatra’s west coast, rice prices were reported for the period 1856–1938 in the KVs, with somegaps at the end of the period. For Priangan, market prices for white rice were reported consistently inthe KVs between 1878 and 1897. To create a continuous price series for the entire period discussed(Figure A1), the remaining price series was extrapolated on the basis of the correlation betweenPriangan and Batavia prices (R2 = 0.78, suggesting a strong correlation), using Batavia prices for theperiod 1848–1938 from Mansvelt and Creutzberg (1978) using the following equationFigure A1:
PPriangan = 1.16 PBatavia – 2.46.
A4. Inequality and the Land Tax
As noted above, the coverage of the tax in Priangan among all households was low, because thosepeople already paying land taxes were exempted from having to pay income taxes. Also exemptedwere those at the bottom end of the income scale: those with total household incomes below fl.120 per annum.
The first step in computing inequality including those households is to add incomes from thosepeople holding lands. The amount of land held by peasants could differ significantly and peasantincomes can be differentiated by using the data on land holding from a large-scale research into thewelfare of the Javanese population conducted at the beginning of the twentieth century, known asthe Declining Welfare Study (“Onderzoek Mindere Welvaart”: OMW 1905). These reports showthe number of people holding land of varying sizes in Java in 1903. In order to translate thisinformation on landholding into monetary incomes, we add to this information on averageproduction and estimate the costs of labour inputs. For this exercise, it was assumed that onlyrice was being produced on these lands. While other crops were also being produced, most of theland was devoted to rice and this seems a safe assumption to get an indication of the income thatcould be derived from such lands.
Average production of paddy per hectare was calculated for Priangan in the 1920s using datafrom Boomgaard and Van Zanden (1990). For 1920, one hectare yielded 1,846 kg paddy perhectare, while for 1928 it was 2,081 kg. A milling rate of 0.65 kg of rice per paddy is used tocalculate the output of rice per hectare at 1,200 kg in 1920 and 1,353 kg in 1928 (van der Eng 2004,348). These figures are roughly in line with the 1.1 ton rice per hectare estimated for Java in the1920s by Van der Eng (2004, 355). Using the average retail price of Cianjur rice for 1920 and 1928from official publications, being fl. 0.18 and fl. 0.16 respectively (CKS 1933), it is possible to
0
0.05
0.1
0.15
0.2
0.25
0.3
0.35
0.4
1848 1858 1868 1878 1888 1898 1908 1918 1928 1938
Fl. p
er k
g.
W.Sumatra Priangan
Figure A1. Rice prices in West Sumatra and Priangan.Sources: Koloniale Verslagen and Mansvelt and Creutzberg (1978).
JOURNAL OF CONTEMPORARY ASIA 23

estimate the gross income per hectare of land in the Priangan as 219 and 221 guilders per hectarerespectively.
In order the produce these quantities of rice, it is assumed that this required substantial inputs oflabour, but no capital. For Java in the 1920s it was estimated that 1 hectare of land requireda labour input of 210 working days (Van der Eng 2004, 355). The 1930 census provides figures onlabour market participation rate: 0.3 for West Java (Volkstelling 1934–1936). Assuming a full yearof work consists of 250 working days, this leads to 375 working days per household of five persons.In order to estimate household incomes it is therefore assumed that households can work 1.75hectares of land themselves without having to hire additional labour. Households with plots ofland less than 1.75 hectares can use their remaining days to work for wages. This wage income thenaugments the income from the land. Households with greater plots, on the other hand, would haveto hire workers to work their fields. The wage in the 1920s was on average fl. 0.40 per day.Combining this information with the figures on the sizes of plots allows for the calculation ofhousehold incomes derived from land.
Data from 1903 suggest that almost 50% of households held land. Combining this with thecoverage of 20–30% of the income tax, that leaves another 20–30% of households who held no landnor payed the income tax; that is, households with combined incomes lower than fl. 120. Thesewere undoubtedly the poorest strata of society. In order to take this group into account, we can addan income group of about 20% of the total population – 105,000 households in 1920 and 130,000 in1928 – that earned fl. 115. This is a conservative estimate, close to the fl. 120 benchmark, biasedagainst my results of high inequality in the Priangan. Combining this information with data on thesizes of the various income classes from the taxation records, Ginis can be estimated. Table A1shows the computed Ginis with and without corrections for landholders in the Priangan. Themethod of correction clearly decreases the Gini coefficient. In this article, corrected Ginis areshown, which are thus biased against the conclusion drawn. Finally, it should be noted that thefigures on land inequality used stem from 1903, rather than the 1920s. Unfortunately, such data arecurrently unavailable. Land inequality probably increased towards the 1920s as Meijer Ranneft andHuender (1926, 11 and Appendix 8) note a substantial growth in large landholding in the Prianganbetween 1905 and 1925 as the number of landholders with over 25 bouw of land increased from556 in 1905 to 1,226 in 1925. We would prefer to have better data – such as data on the distributionof land in the 1920s – but in the absence of such figures, the procedures followed here to take themissing information into account were biased against the conclusion of high inequality inPriangan in the 1920s. More complete information would increase the observed level of inequality.
A5. Pre- and Post-Tax Ginis
Land taxes. Land taxes differed according to location. Based on data about location and climateconditions as well as other factors, districts were classified in three groups based on the “state ofeconomic development.” For districts classified as “low development,” the tax rate was 8–11%, for“average development” tax rates of between 12% and 16% applied, and for districts with “highdevelopment” rates were between 17% and 20% – although in practice a maximum of 18% applied.These percentages were then levied on the total paddy produced per bouwminus 10 picul of paddy,but with a minimum of the monetary value of 2 picul paddy per bouw. So on a field of 1 bouw
Table A1. Pre-tax Ginis, corrected pre-tax Ginis and coverage, Priangan, 1920, 1928Income tax data With corrections
1920 1928 1920 1928
Gini 62 63 48 53Avg. household income assessed (fl.) 419 425 331 347% of households covereda 19 36 83 85
Note: aCalculations are based on five persons per household.Sources: See text.
24 P. DE ZWART
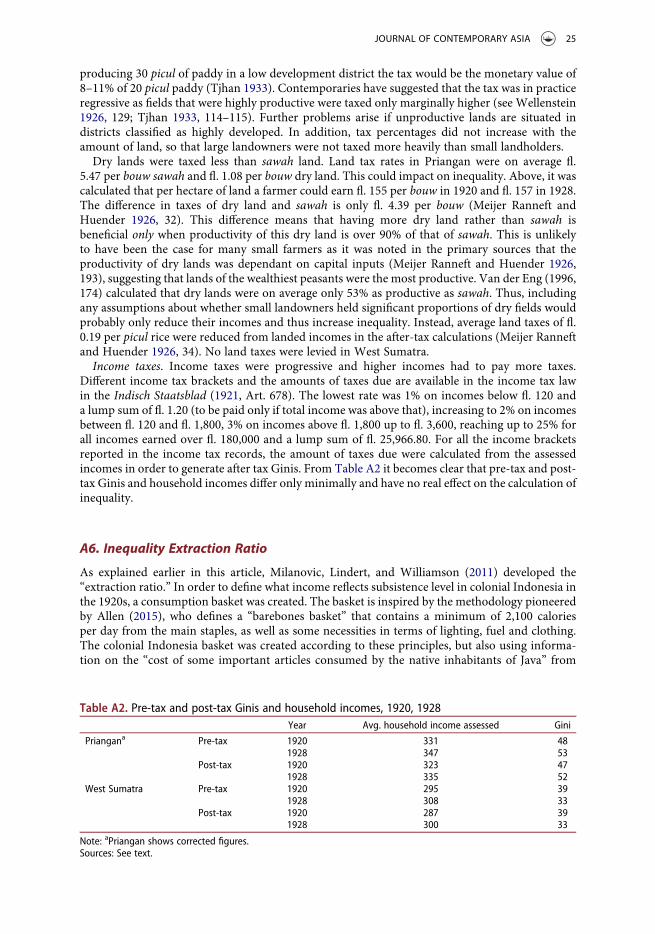
producing 30 picul of paddy in a low development district the tax would be the monetary value of8–11% of 20 picul paddy (Tjhan 1933). Contemporaries have suggested that the tax was in practiceregressive as fields that were highly productive were taxed only marginally higher (see Wellenstein1926, 129; Tjhan 1933, 114–115). Further problems arise if unproductive lands are situated indistricts classified as highly developed. In addition, tax percentages did not increase with theamount of land, so that large landowners were not taxed more heavily than small landholders.
Dry lands were taxed less than sawah land. Land tax rates in Priangan were on average fl.5.47 per bouw sawah and fl. 1.08 per bouw dry land. This could impact on inequality. Above, it wascalculated that per hectare of land a farmer could earn fl. 155 per bouw in 1920 and fl. 157 in 1928.The difference in taxes of dry land and sawah is only fl. 4.39 per bouw (Meijer Ranneft andHuender 1926, 32). This difference means that having more dry land rather than sawah isbeneficial only when productivity of this dry land is over 90% of that of sawah. This is unlikelyto have been the case for many small farmers as it was noted in the primary sources that theproductivity of dry lands was dependant on capital inputs (Meijer Ranneft and Huender 1926,193), suggesting that lands of the wealthiest peasants were the most productive. Van der Eng (1996,174) calculated that dry lands were on average only 53% as productive as sawah. Thus, includingany assumptions about whether small landowners held significant proportions of dry fields wouldprobably only reduce their incomes and thus increase inequality. Instead, average land taxes of fl.0.19 per picul rice were reduced from landed incomes in the after-tax calculations (Meijer Ranneftand Huender 1926, 34). No land taxes were levied in West Sumatra.
Income taxes. Income taxes were progressive and higher incomes had to pay more taxes.Different income tax brackets and the amounts of taxes due are available in the income tax lawin the Indisch Staatsblad (1921, Art. 678). The lowest rate was 1% on incomes below fl. 120 anda lump sum of fl. 1.20 (to be paid only if total income was above that), increasing to 2% on incomesbetween fl. 120 and fl. 1,800, 3% on incomes above fl. 1,800 up to fl. 3,600, reaching up to 25% forall incomes earned over fl. 180,000 and a lump sum of fl. 25,966.80. For all the income bracketsreported in the income tax records, the amount of taxes due were calculated from the assessedincomes in order to generate after tax Ginis. From Table A2 it becomes clear that pre-tax and post-tax Ginis and household incomes differ only minimally and have no real effect on the calculation ofinequality.
A6. Inequality Extraction Ratio
As explained earlier in this article, Milanovic, Lindert, and Williamson (2011) developed the“extraction ratio.” In order to define what income reflects subsistence level in colonial Indonesia inthe 1920s, a consumption basket was created. The basket is inspired by the methodology pioneeredby Allen (2015), who defines a “barebones basket” that contains a minimum of 2,100 caloriesper day from the main staples, as well as some necessities in terms of lighting, fuel and clothing.The colonial Indonesia basket was created according to these principles, but also using informa-tion on the “cost of some important articles consumed by the native inhabitants of Java” from
Table A2. Pre-tax and post-tax Ginis and household incomes, 1920, 1928Year Avg. household income assessed Gini
Priangana Pre-tax 1920 331 481928 347 53
Post-tax 1920 323 471928 335 52
West Sumatra Pre-tax 1920 295 391928 308 33
Post-tax 1920 287 391928 300 33
Note: aPriangan shows corrected figures.Sources: See text.
JOURNAL OF CONTEMPORARY ASIA 25
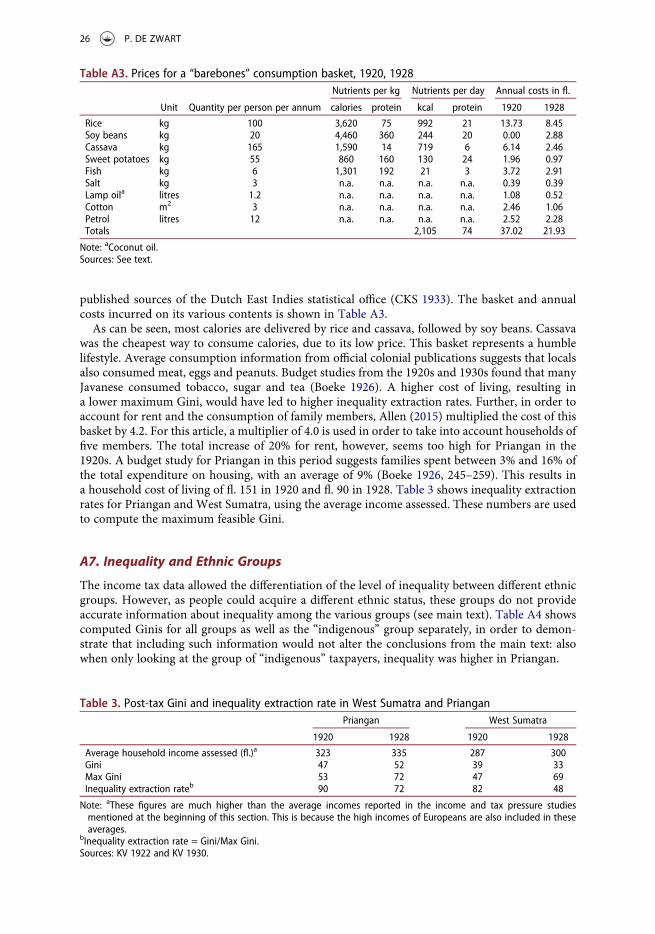
published sources of the Dutch East Indies statistical office (CKS 1933). The basket and annualcosts incurred on its various contents is shown in Table A3.
As can be seen, most calories are delivered by rice and cassava, followed by soy beans. Cassavawas the cheapest way to consume calories, due to its low price. This basket represents a humblelifestyle. Average consumption information from official colonial publications suggests that localsalso consumed meat, eggs and peanuts. Budget studies from the 1920s and 1930s found that manyJavanese consumed tobacco, sugar and tea (Boeke 1926). A higher cost of living, resulting ina lower maximum Gini, would have led to higher inequality extraction rates. Further, in order toaccount for rent and the consumption of family members, Allen (2015) multiplied the cost of thisbasket by 4.2. For this article, a multiplier of 4.0 is used in order to take into account households offive members. The total increase of 20% for rent, however, seems too high for Priangan in the1920s. A budget study for Priangan in this period suggests families spent between 3% and 16% ofthe total expenditure on housing, with an average of 9% (Boeke 1926, 245–259). This results ina household cost of living of fl. 151 in 1920 and fl. 90 in 1928. Table 3 shows inequality extractionrates for Priangan and West Sumatra, using the average income assessed. These numbers are usedto compute the maximum feasible Gini.
A7. Inequality and Ethnic Groups
The income tax data allowed the differentiation of the level of inequality between different ethnicgroups. However, as people could acquire a different ethnic status, these groups do not provideaccurate information about inequality among the various groups (see main text). Table A4 showscomputed Ginis for all groups as well as the “indigenous” group separately, in order to demon-strate that including such information would not alter the conclusions from the main text: alsowhen only looking at the group of “indigenous” taxpayers, inequality was higher in Priangan.
Table A3. Prices for a “barebones” consumption basket, 1920, 1928Nutrients per kg Nutrients per day Annual costs in fl.
Unit Quantity per person per annum calories protein kcal protein 1920 1928
Rice kg 100 3,620 75 992 21 13.73 8.45Soy beans kg 20 4,460 360 244 20 0.00 2.88Cassava kg 165 1,590 14 719 6 6.14 2.46Sweet potatoes kg 55 860 160 130 24 1.96 0.97Fish kg 6 1,301 192 21 3 3.72 2.91Salt kg 3 n.a. n.a. n.a. n.a. 0.39 0.39Lamp oila litres 1.2 n.a. n.a. n.a. n.a. 1.08 0.52Cotton m2 3 n.a. n.a. n.a. n.a. 2.46 1.06Petrol litres 12 n.a. n.a. n.a. n.a. 2.52 2.28Totals 2,105 74 37.02 21.93
Note: aCoconut oil.Sources: See text.
Table 3. Post-tax Gini and inequality extraction rate in West Sumatra and PrianganPriangan West Sumatra
1920 1928 1920 1928
Average household income assessed (fl.)a 323 335 287 300Gini 47 52 39 33Max Gini 53 72 47 69Inequality extraction rateb 90 72 82 48
Note: aThese figures are much higher than the average incomes reported in the income and tax pressure studiesmentioned at the beginning of this section. This is because the high incomes of Europeans are also included in theseaverages.
bInequality extraction rate = Gini/Max Gini.Sources: KV 1922 and KV 1930.
26 P. DE ZWART

Table A4. Post-tax Ginis for ethnic groups, Priangan and West Sumatra, 1920, 1928Year Avg. household income assessed Gini Inequality extraction rate
Priangana All taxpayers 1920 323 47 901928 335 52 72
Indigenous taxpayers 1920 274 39 891928 252 39 61
West Sumatra All taxpayers 1920 287 39 821928 300 33 48
Indigenous taxpayers 1920 264 34 801928 274 27 41
Note: aPriangan shows corrected figures.Source: See text.
JOURNAL OF CONTEMPORARY ASIA 27