globalization and higher education lecture for a class in ppg 2008 - globalization,...
TRANSCRIPT

Globalization and Higher EducationLecture for a class in PPG 2008 - Globalization,
Internationalization and Public Policy
Ian D. ClarkSchool of Public Policy and Governance
University of TorontoFebruary 15, 2012
1

2
Readings for the classMargaret Wente, February 4, 2012, “We’re ripe for a great disruption in higher education,” Globe and Mail, http://www.theglobeandmail.com/news/opinions/margaret-wente/were-ripe-for-a-great-disruption-in-higher-education/article2325979/ Margaret Cappa and Phil Donelson, October 3, 2011, “In Conversation with the Authors of Academic Reform,” YouTube, http://www.youtube.com/watch?feature=player_embedded&v=imhJMSTSJl0 Ian Clark, “A taxpayer view of university funding, or Steve and Di's evening on the Internet,” University Affairs (Online Edition), March 8, 2010. http://www.universityaffairs.ca/a-taxpayers-view-of-university-funding.aspx Ian Clark, November 21, 2011, “Improving undergraduate education in Canada – the good and not so good news,” The University Commons, http://www.aucc.ca/future-avenir/improving-undergraduate-education-in-canada-the-good-and-not-so-good-news/ Ian Clark, November 11, 2011, “What can fiscally constrained governments do to improve undergraduate education?” Mowat Centre Opinions, http://www.mowatcentre.ca/opinions.php?opinionID=82 John Blattler, April 2011 “A Brief History of Everything You Wanted to Know(About Professors and University Students)” PP+G Review, Vol. 2, No. 2 Spring 2011 http://ppgr.files.wordpress.com/2011/05/blattler-universities.pdf Brent Barron, November 10, 2010, “The Academy and the Training Centre” PP+G Review Blog http://ppgreview.ca/2010/11/10/the-academy-and-the-training-centre/ Ian Clark and Ben Eisen, October 2010, “Frugal Public Management Principles for an Era of Restraint,” Policy Options, Vol. 31, No. 9, pp. 67-71, http://www.irpp.org/po/archive/oct10/clark.pdf

Outline
• Learning objectives• Cognitive performance and economic benefits• Sorting and status• International forces• International comparisons of university systemsBREAK• Concerns about quality and cost-effectiveness• Policy options for reform in Ontario• The new undergraduate university option for Ontario• Policy entrepreneurship• CBC The Sunday Edition
with Michael Enright
3

Learning objectives
• Look at Ontario higher education policy through the lens of the PPG2008 syllabus:– What is the nature of the global and international forces and
dynamics impacting domestic public policies and governance?– How are states’ policy structures, systems and processes
changing, or how ought they to change, in relation to these international forces and dynamics?
• Think hard about:– selectivity and elites– higher education, social mobility and the poor– cognitive skills and value added at university– policy uniformity versus policy differentiation– higher education reforms in Ontario in 2012
4

5
Learning objectives: concepts to conger with
BEFORE BREAK• Education as consumption• Returns to education, private
and public• Labour-market sorting
function of credentials• Meritocracy and elites• Selective admissions• Accreditation• International culture norms• International markets for
faculty and students• Mission (mandate) creep• Differentiation• Disruptive innovation
AFTER BREAK• Policy uniformity• Policy differentiation• Universality and universal
programs• Targeted programs• Needs-based funding• Performance-based funding• Equity principle vs equality
principle• Equality of opportunity vs
equality of outcome• Division of labour and
specialization• Market-based compensation
6
COGNITIVE PERFORMANCE
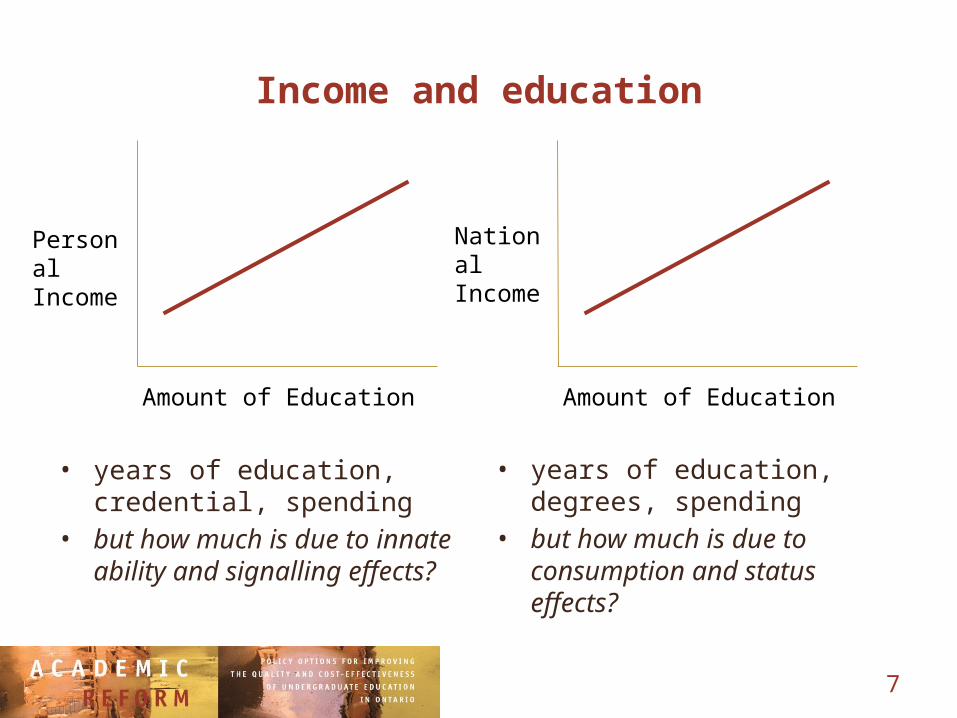
Income and education
• years of education, credential, spending
• but how much is due to innate ability and signalling effects?
• years of education, degrees, spending
• but how much is due to consumption and status effects?
Amount of Education
PersonalIncome
Amount of Education
NationalIncome
7

8
Cognitive skills and economic growth
ISBN 978-92-64-07748-5 (PDF)© OECD 2010The report was written by Prof. Eric. A. Hanushek from the Hoover Institution at Stanford University andCES ifo and by Prof. Ludger Woessmann from the Ifo Institute for Economic Research, CES ifo, and theUniversity of Munich, in consultation with members of the PISA Governing Board as well as AndreasSchleicher, Romain Duval and Maciej Jakubowski from the OECD Secretariat. The report was producedby the Indicators and Analysis Division of the OECD Directorate for Education and is published on theresponsibility of the Secretary-General of the OECD.

9
Cognitive skills and economic growth

10
Cognitive skills and economic growth

11
Measuring cognitive performance at university
http://www.cae.org/content/pdf/CLA.in.Context.pdf
The Collegiate Learning Assessment– critical thinking
– complex reasoning– written communication

12
Cognitive performance and economic outcomes
Richard Arum, Esther Cho, Jeannie Kim, Josipa Roksa, Documenting Uncertain Times: Post-graduate Transitions of the Academically Adrift Cohort. SSRC 2012

13
SORTING AND STATUS

14
Attributes that make universities attractive
... but aren’t necessarily related to learning
• Sorting: the challenge of being admitted to a university and surviving to graduation performs a sorting function that employers and others use as a convenient signal of innate ability and future potential
• Credentialing: near-monopoly providers of credentials that are either absolutely required or strongly recommended for entrance into a variety of professions and careers
• Networking: relationships made during these formative years often last a lifetime, and become the basis of valuable professional and social networks
• Branding: continued reputation associated with the credential

Selectivity, elites and two MPP 1972 classmates
• The most important thing Harvard does to maximize success of graduates– select great
students
• Concepts of quality in higher education– value added– input/selectivity
• Reputation and rankings to enable selectivity in students and faculty
15Karen Arenson, MPP 1972NYT Higher Ed reporter

16
Elite education and the poor
“Poor people are an endangered species in elite universities not because the universities put quotas on them … and not even because they can’t afford to go to them (Harvard will lend you or even give you the money you need to go there) but because they can’t get into them. Hence the irrelevance of most of the proposed solutions to the systematic exclusion of poor people from elite universities, which involve ideas like increased financial aid for students who can’t afford the high tuition, support systems for the few poor students who manage to end up there anyway, and, in general, an effort to increase the “cultural capital” of the poor.“The entire U.S. school system, from pre-K up, is structured from the very start to enable the rich to out-compete the poor, which is to say, the race is fixed. And the kinds of solutions that might actually make a difference – financing every school district equally, abolishing private schools, making high-quality child care available to every family – are treated as if they were positively un-American.”
“Today, the rich don’t exploit the poor, they just out-compete them.” David Brooks, New York Times, October 6, 2005
Walter Benn Michaels, The American Prospect, August 13, 2006

International university rankings
17

International university rankings on research
18
from George Fallis, Benchmarking Canada’s University-based Research, submitted for publication, October 2010
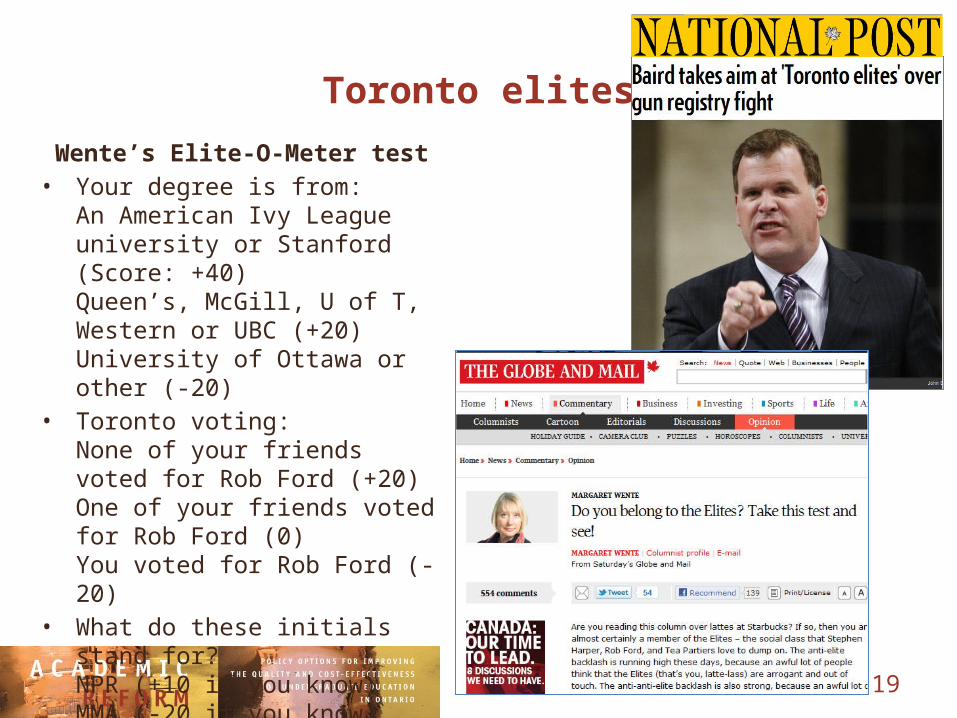
Toronto elites
Wente’s Elite-O-Meter test• Your degree is from:
An American Ivy League university or Stanford (Score: +40)Queen’s, McGill, U of T, Western or UBC (+20)University of Ottawa or other (-20)
• Toronto voting:None of your friends voted for Rob Ford (+20)One of your friends voted for Rob Ford (0)You voted for Rob Ford (-20)
• What do these initials stand for?NPR (+10 if you know)MMA (-20 if you know)
•
19
20
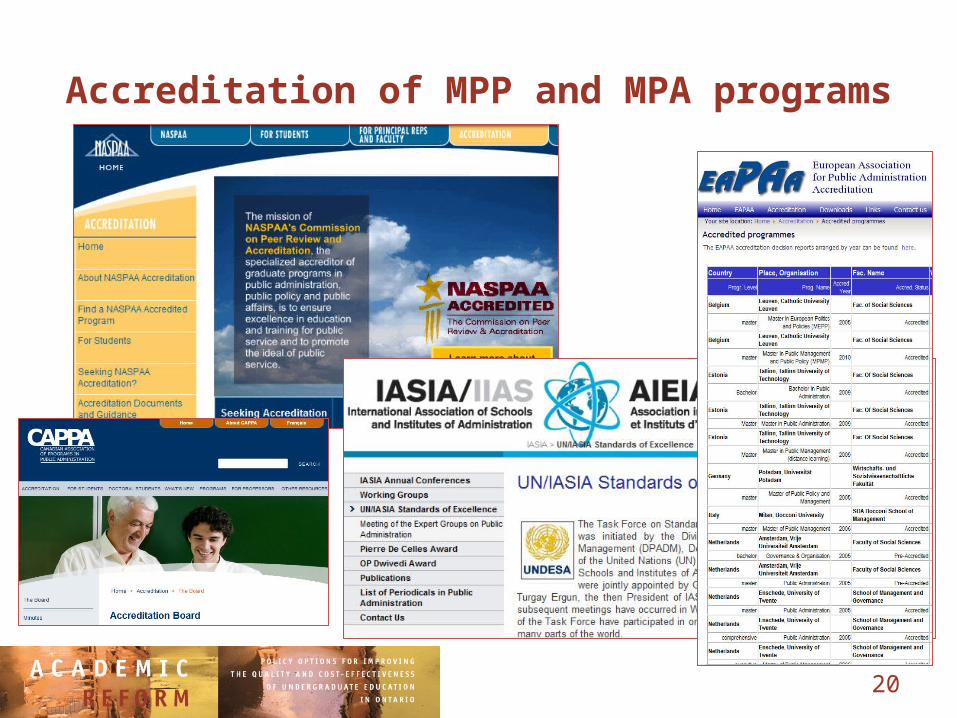
Accreditation of MPP and MPA programs
21
INTERNATIONAL COMPARISONS OF UNIVERSITY SYSTEMS

Global forces and international trends
• Globalization forces government focus on competitiveness (and fiscal sustainability)
• Universities seen as instruments of state economic development– “knowledge society”– “innovation agenda”– “brain gain”
• Instrumentalism: “useful” training and “useful” research– privileging STEM disciplines (science, technology,
engineering, mathematics)
• Competition for the best faculty and best students• Rankings and performance measurement • Quality assurance and curriculum standardization
– Bologna process in Europe
• International education as a market opportunity
elite to mass education emphasis on research rankings and
resources
22

University systems
Country Public Universities
Privates
Tuition
KeyGovernment
StructuralChange
Canada 90+(130+ colleges)
very few
40-50%
regional(province)
low
United States
4000+ postsecondary
40% 0-100%
regional(state)
low
Germany 121 (plus 197 Fachhochschulen)
very few
very low
regional(Lander)
high
Australia 37 2 ICLRP system
central high
United Kingdom
116 very few
ICLRP system
central high
23

from George Fallis, Benchmarking Canada’s University-based Research, submitted for publication, October 2010
GERD: Gross expenditure on R&D
BERD: Business Enterprise expenditure on R&D
HERD: Higher Education expenditure on R&D
University research and competitiveness
24

25
CONCERNS ABOUT QUALITY AND COST EFFECTIVENESS

Academically adrift?“Growing numbers of students are sent to college at increasingly higher costs, but for a large proportion of them the gains in critical thinking, complex reasoning, and written communication are either exceedingly small or empirically nonexistent.
“At least 45 percent of students in our sample did not demonstrate any statistically significant improvement in Collegiate Learning Assessment [CLA] performance during the first two years of college. [Further study has indicated that 36 percent of students did not show any significant improvement over four years.]
“While these students may have developed subject-specific skills that were not tested for by the CLA, in terms of general analytical competencies assessed, large numbers of U.S. college students can be accurately described as academically adrift. They might graduate, but they are failing to develop the higher-order cognitive skills that it is widely assumed college students should master.”
24 universities2,322 studentsCLA fall 2005, spring 2007, spring 200926

Whose fault?
1950s 1990s
hoursperweekstudying
1950s 1990s
hoursperweekteaching
Students Faculty
George Kuh, 2003 AD (Change, 35, p 28)
Students and faculty have struck a Disengagement Pact “I’ll leave you alone if you leave me alone ... I won’t make you work too hard (read a lot, write a lot) so that I won’t have to grade as many papers or explain why you are not performing well.”
Saint Augustine, 397 AD (The Confessions)
“I set about diligently to practice what I came to Rome to do - the teaching of rhetoric. Yet, the Roman students - breakers of faith, who, for the love of money, set a small value on justice - would conspire together and suddenly transfer to another teacher, to evade paying their master’s fees.” 27

The coming fiscal crunch• Although better positioned than
many others, Canadian fiscal environment in next decade will be similar to 1990s
• Ontario and several other provinces in much worse shape than others
-5.0%
-4.0%
-3.0%
-2.0%
-1.0%
0.0%
1.0%
1989
-90
1990
-91
1991
-92
1992
-93
1993
-94
1994
-95
1995
-96
1996
-97
1997
-98
1998
-99
1999
-200
0
2000
-01
2001
-02
2002
-03
2003
-04
2004
-05
2005
-06
2006
-07
2007
-08
2008
-09
2009
-10
2010
-11
2011
-12
2012
-13
2013
-14
2014
-15
2015
-16
2016
-17
2017
-18
Ontario surplus (deficit) as share of GDP,1989-90 to 2017-18
SOURCE: Ontario Ministry of Finance. GDP for 2014 - 2018 estimated by the author.
Assumption: Average program spending growth will be 1.9% after 2012-13
28

29
Research universities and undergraduate teaching

30
Globe and Mail, October 12, 2011

31
End of American pre-eminence in higher ed?
• Fees rising faster than ability to pay– Median household income has grown by
a factor of 6.5 in the past 40 years– Cost of attending a state college has
increased by a factor of 15 for in-statestudents and 24 for out-of-state
• Productivity declining– In 1961 full-time students spent
24 hours a week studying; that has fallen to 14– In US, only 40% of students graduate in 4 years
• Professors not particularly interested in students’ welfare– Advancement depends on published research, not teaching
• Administrative bloat– Spending on university bureaucrats rose much faster than on
faculty

The “enduring myth”...that teaching effectivenessneeds research productivity
...need to focus on each, butalmost independently
Conclusion
32

33
1 2 3 4 5 6 7 8 9 100
0.1
0.2
0.3
0.4
0.5
0.6
Research Output
Teaching Output
Specialization and system productivity• Imagine that research productivity follows something like a “70-30 rule”• 70 percent of total research done by top three deciles (each successive
decile of professors produce 0.68 as much research)
Scenario A: All faculty spend same amount oftime on research and teaching (40-40-20)
Scenario B: The 30 percent most research productive faculty shift 50 percent of teaching time to research (20-60-20) and remaining faculty shift 50 percent of research time to teaching (60-20-20)
Suggestive factoid: Vedder et al (2011) estimate that at University of Texas - Austin, the most productive decile earned 91 percent of research dollars and the next decile virtually all the rest in 2010-11
Teaching output assumed equal for all deciles because teaching performance not correlated with research performance
1 2 3 4 5 6 7 8 9 100
0.1
0.2
0.3
0.4
0.5
0.6
Research Teaching0
0.2
0.4
0.6
0.8
1
1.2
1.4Total Output
0
0.2
0.4
0.6
0.8
1
1.2
1.4Total Output
70 percentScenario B delivers20 percent more research & 20 percent more teaching than Scenario A

34
International labour market for professors
A frequently heard assertion“Universities exist in a global labour market, competing for the best scientists, medical researchers, mathematicians, engineers, economists, IT experts, psychologists or urban planners their budgets can afford. The standard teaching load in many Canadian and nearly all American research universities is two courses per semester. No decent academic, never mind a high-flyer, will take a job here to see his teaching load doubled and research time reduced to 10 per cent. Similarly, marketable faculty now teaching here will exit the province faster than a captain can desert a listing ship.”
Michael Herren, Distinguished Research Professor
Emeritus, York University, February 11, 2012Demand trends

35
Challenges of increasing system differentiation
• University funding forces uniformity– expand undergraduate
enrolments– raise the proportion of students
who are in graduate and professional programs
– pursue competitive research grants
• Uniformity– Raises costs of serving larger
numbers– Reduces flexibility to respond to
students with diverse needs
• International experience is clear: if a differentiated system is desired, deliberate and sustained government action is necessary
The Contradictions of Isomorphism (Trends in Global Higher Education: Tracking an Academic Revolution, Altbach et al., UNESCO, 2009, p 19)
In the 21st century, the trend toward isomorphism can still be observed and tends to restrict the development of differentiated academic systems. Public authorities need to ensure diverse academic models to serve varied societal needs, while many academic institutions still tend to emulate the research universities at the top of the system. Academic staff often press the university to emphasize research as its key mission, knowing that a research orientation and productivity in this area promise the highest prestige and (often) the best salaries for academics.
If the universities remain the sole decision makers, many more academic institutions would seek to improve their status by becoming research intensive. In most cases, this strategy does not serve the interests of academe in general nor is it widely achievable.
Often, it takes governmental "steering" to keep the academic system diversified and institutions within the system serving larger national goals...The essential problem of isomorphism involves unbridled competition among academic institutions pursuing the same goals. This trend may undermine efforts to develop a system of institutions that is appropriately differentiated, based on the specific needs of a given system-with different goals and responsibilities, patterns of funding, admissions policies, and other characteristics.

36
• WGU Model: competency-basedassessment and self-directedlearning with course requirementstailored to each student and coursescontracted to best providers– Western Governors
University (1997)
• Free, open courseware– MIT OpenCourseWare (2002) – Khan Academy (2006)– The Faculty Project (2012)
• Free (almost) credential– University of the People (2009)– MITx (2012)
Will on-line innovations become disruptive?
“not your parents’ online learning, nor your grandparents’ correspondence courses.” Fiona Deller, HEQCO (February, 2012)

37
BREAK
• Education as consumption• Returns to education, private
and public• Labour-market sorting
function of credentials• Meritocracy and elites• Selective admissions• Accreditation• International culture norms• International markets for
faculty and students• Mission (mandate) creep• Differentiation• Disruptive innovation

38
POLICY OPTIONS FOR REFORM IN ONTARIO
39
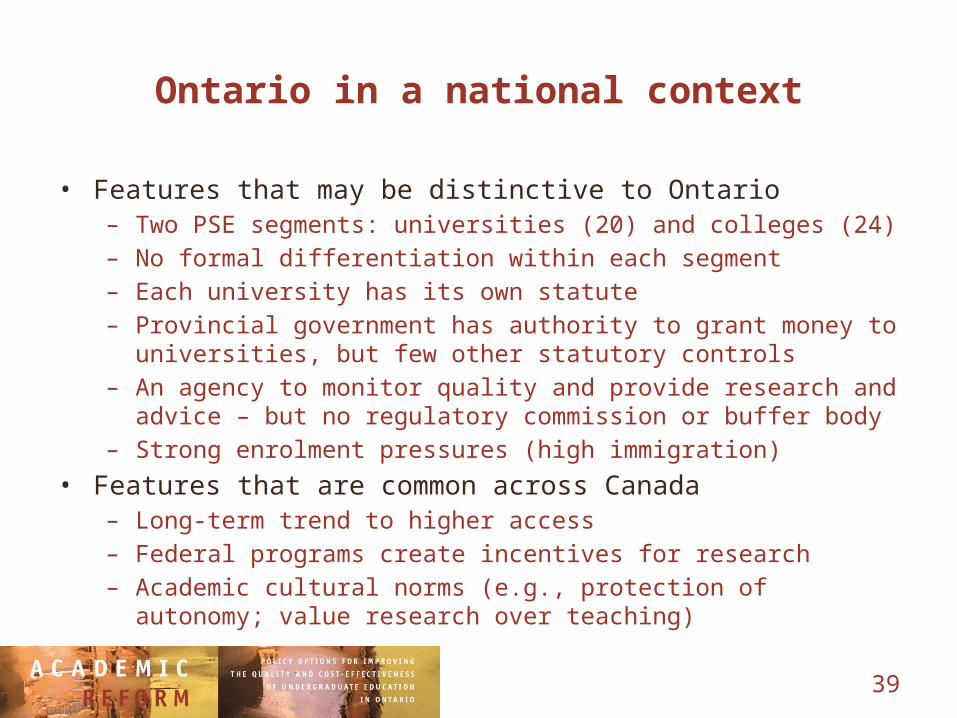
Ontario in a national context
• Features that may be distinctive to Ontario– Two PSE segments: universities (20) and colleges (24)– No formal differentiation within each segment– Each university has its own statute– Provincial government has authority to grant money to
universities, but few other statutory controls– An agency to monitor quality and provide research and advice
– but no regulatory commission or buffer body– Strong enrolment pressures (high immigration)
• Features that are common across Canada– Long-term trend to higher access– Federal programs create incentives for research– Academic cultural norms (e.g., protection of autonomy; value
research over teaching)
40
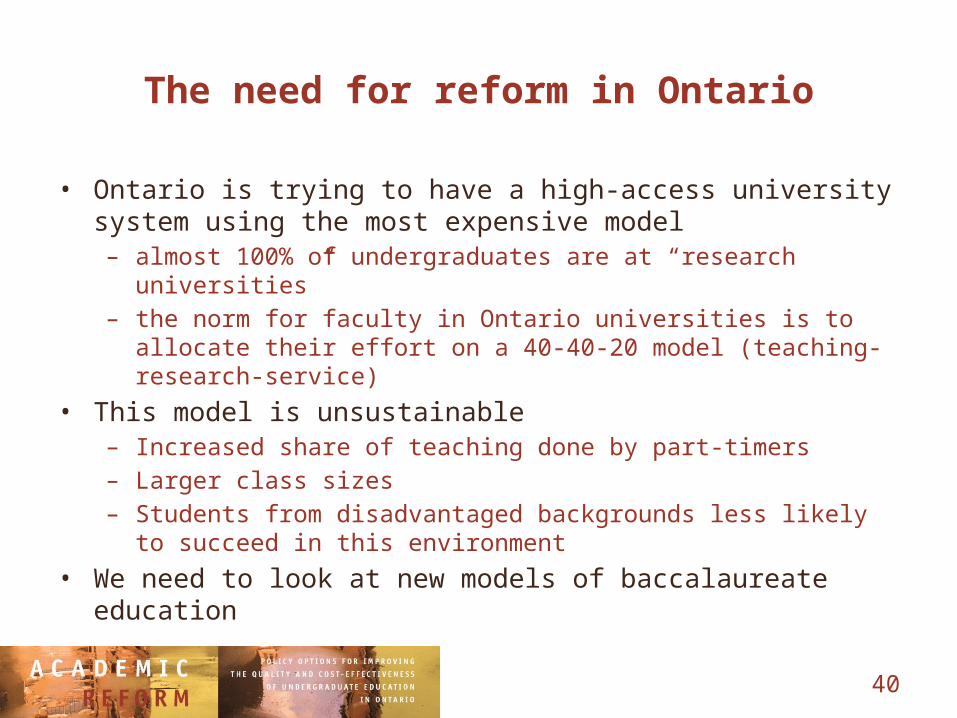
The need for reform in Ontario
• Ontario is trying to have a high-access university system using the most expensive model– almost 100% of undergraduates are at “research universities”– the norm for faculty in Ontario universities is to allocate their
effort on a 40-40-20 model (teaching-research-service)
• This model is unsustainable– Increased share of teaching done by part-timers– Larger class sizes– Students from disadvantaged backgrounds less likely to
succeed in this environment
• We need to look at new models of baccalaureate education

41
What makes the Ontario model expensive?
• Teaching loads are necessarily low– Typically 2+2 for full-time faculty
• Expanding teaching outputs always means expanding research outputs
• As a condition of expanding undergraduate enrolments, every university expects funding for higher graduate/professional enrolments– Graduate/professional spaces are the most expensive
• All universities devote resources to seeking competitive research grants– Costs of competition (VP-R offices)– Research overhead is underfunded, resources diverted from
teaching
• High barriers-to-entry prevent the emergence of lower-cost models

42
Paradox of stable revenues and financial crunch
Ontario universities’ CPI-adjusted annual $ per student has been relatively stable at about $13,000 ($2007) since the 1980s
$-
$2,000
$4,000
$6,000
$8,000
$10,000
$12,000
$14,000
$16,000
Universities: Total operating revenue from MTCU operating grants, tuition and mandatory fees, per FTE
student, 1987-88 to 2008-09 (constant 2007 dollars)
Operating grants Tuition Mandatory fees

43
Why?
• University inflation widely estimated at 4-5% (long-term)– faculty compensation: across-the-board increases, progress
through the ranks, market adjustments, benefits– administrative compensation and non-salary costs (e.g.,
energy)– cost pressures arising from competition: fundraising,
research, student recruitment
• Teaching loads for full-time faculty have declined over the long term– across-the-board, and through special arrangements for
research and administrative responsibilities– 4 one-semester courses per year is most common; exceptions
up and down
44
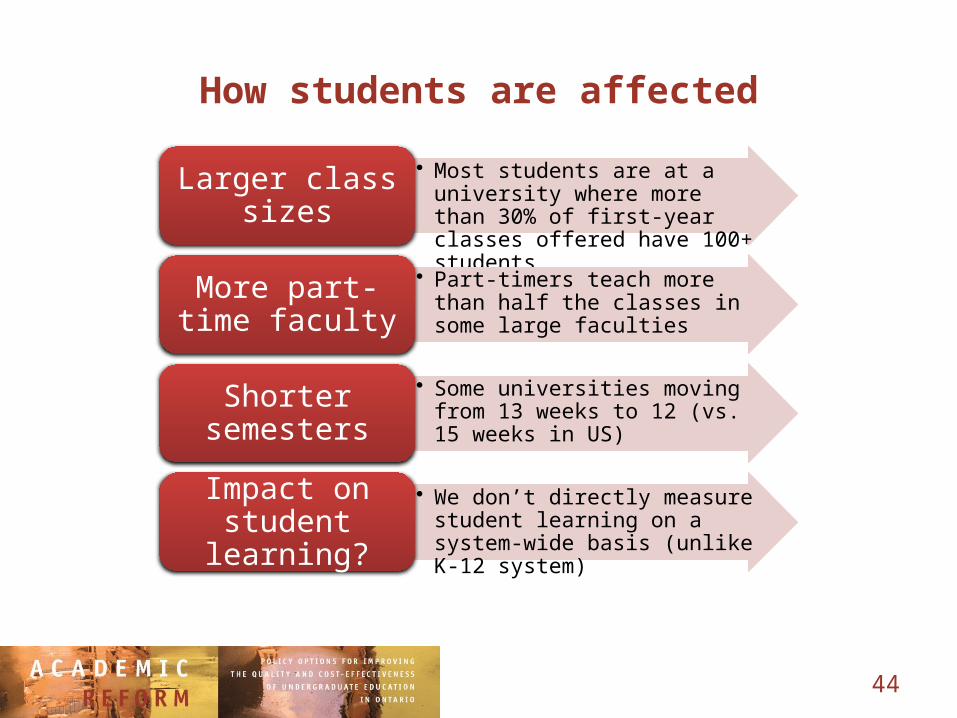
How students are affected
• Most students are at a university where more than 30% of first-year classes offered have 100+ studentsLarger class sizes
• Part-timers teach more than half the classes in some large facultiesMore part-time
faculty
• Some universities moving from 13 weeks to 12 (vs. 15 weeks in US)Shorter semesters
• We don’t directly measure student learning on a system-wide basis (unlike K-12 system)
Impact on student learning?

45
MPP student contributions to Academic Reform
• MPP 2009• MPP 2010• MPP 2011• MPP 2012• MPP 2013

46
Vass, Kelsey and Simon’s presentation
• Presented in Washington at APSA conference, October 2010
• Compares impact of great recession on Ontario and California higher education systems

47
Research university model under strain

48
Principles of frugal public management
• Results-oriented measures and objectives– State objectives in ways that make it possible
to construct performance measures that canform the basis for appropriate incentives andfunding mechanisms
• Performance-related incentives forindividuals and institutions – Think through what behaviour you want
from individuals and institutions andcreate funding and regulatory environments that encourage that behaviour
• Efficiency-related concentration and specialization – Centralize processes where average cost falls as scale is
increased; concentrate where efficiencies are gained through specialization

49
MORE DATA, MORE TRANSPARENCY

50
If the Australians can publish crucial data...

51
…so could Ontario

52
Unistats in the UK – direct comparisons
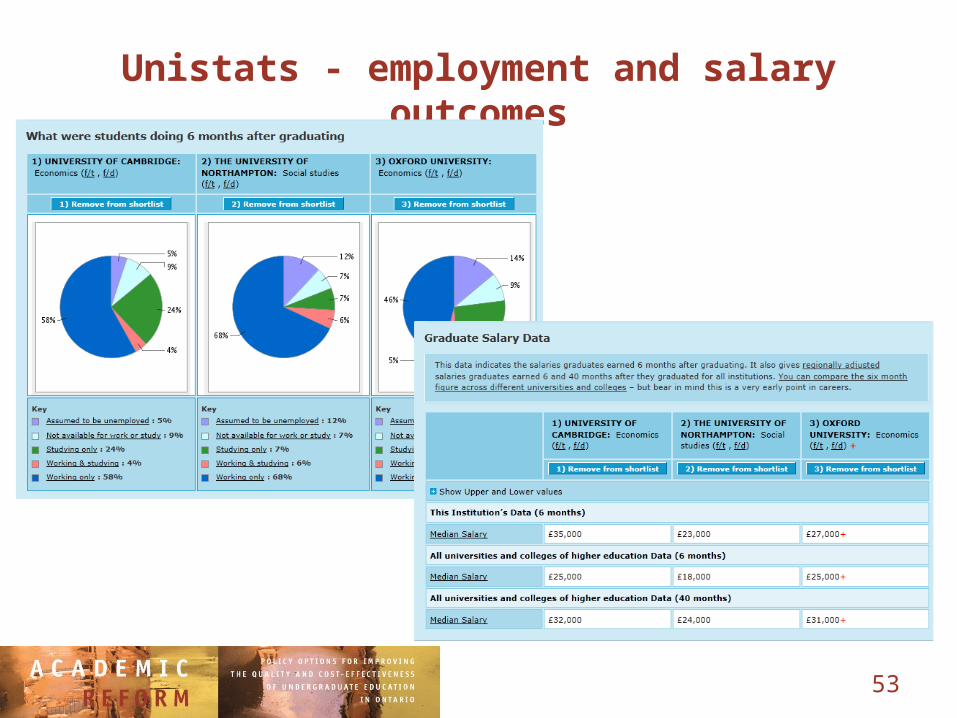
53
Unistats - employment and salary outcomes

54
VSA and College Portrait in the United States

55
Undergraduate success and learning outcomes

56
28 recommendations in Academic Reform
Strengthen learning at existing universities
• Fund teaching and research separately
• Encourage faculty differentiation (teaching, research)
• Teaching Enhancement Fund
• Accountability for what students actually learn
• Better data so students can compare institutions, programs, courses
Accommodate growth
• Agree on long-term targets for enrolment growth (universities, colleges, apprenticeship)
• Create a 2-year college credential that prepares students to enter 3rd-year university
• Create up to 5 new teach-ing-oriented universities
• Create high-quality 3-year baccalaureates
• Selective expansion of existing universities
Maintain affordability for students and government
• Provide funding for inflation and enrolment growth through government operating grants and regulated tuition
• Reduce overall cost inflation
• Fund an agreed level of inflation universities should not grow simply to cover the cost of inflation

57
THE NEW UNDERGRADUATE UNIVERSITY OPTION FOR ONTARIO

58
Toronto has two of the largest campuses Largest public university campuses in US and Canada, Fall 2010
Rank University LocationEnrollme
nt (headcount)
1 Université de Montréal* Montréal, Québec 58,4452 Arizona State University Tempe, Arizona 58,3713 University of Central Florida** Orlando, Florida 56,2354 Ohio State University Columbus, Ohio 56,0645 York University – Keele campus*** Toronto, Ontario 55,049
6 University of Toronto – St. George campus Toronto, Ontario 54,701
7 University of Minnesota Minneapolis/St Paul, MN 51,721
8 University of Texas at Austin** Austin, Texas 51,1959 University of Florida** Gainesville, Florida 49,827
10 Texas A&M University** College Station, Texas 49,129
11 University of South Florida** Tampa, Florida 47,576
12 Michigan State University East Lansing, Michigan 47,131
13 Univ. of British Columbia – Vancouver campus Vancouver, BC 47,095
14 Pennsylvania State University University Park, PA 44,832* Includes Hautes études commerciales and École polytechnique. ** Includes students enrolled in relatively small regional campuses.*** Includes 4,553 Seneca College students.

59
Enrolment growth in graduate andprofessional programs
• Doctoral programs– No general shortage
of PhDs– Watch for shortages
in selected disciplines
• Need to focus on– Quality– Completion rates
(withhold last year of operating grant until student actual graduates)
– Professionally-oriented masters degrees
0.00%
0.20%
0.40%
0.60%
0.80%
1.00%
1.20%
1986 1991 1996 2001 2006
Ontario residents aged 25–64 holding an earned doctorate (as a share of the population aged 25–64)

60
Students at small universities tend to be more engaged in their own learning
• Small institutions experience higher average scores for – Supportive Campus
Environment (SCE)– Student-Faculty
Interaction (SFI) – Active and Collaborative
Learning (ACL)
• No difference for– Level of Academic
Challenge (LAC)– Enriching Educational
Experiences (EEE)
• “Highly similar results hold for senior-year students.”
Source: Conway, C., Zhao, H., & Montgomery, S. (2011). The NSSE National Data Project Report. Higher Education Quality Council of Ontario.

61
The financial case for teaching-oriented universities
Teaching-oriented
university
Traditional university
Teaching and related(including academic administration, classroom support, clerical support, curriculum development, distance education)
$5,500 $9,100
Academic services(including library, student services, recruitment, bursaries, information technology)
$2,200 $2,200
Institutional services(including administration, facilities, capital equipment, renovation, debt interest, and contribution to capital costs)
$2,200 $3,000*
Total $9,800 $14,200Memoranda:Cumulative surplus/debt after seven years $27 m surplus $167 m debtAnnual undergraduate enrolments at maturity 10,000 10,000Student tuition per year $5,300 $5,300Average class size 44 44Share of teaching performed by full-time faculty 70 percent 70 percentTeaching load of full-time faculty (1-semester courses per year)
8 4Note: Numbers may not add due to rounding.*Includes debt interest of $600.
Operating costs per baccalaureate student, campus with 10,000 students (2011 $)

62
Smaller classes, lower tuition...
Teaching-oriented
university
Traditional university
Strategy for reaching a balanced budget
Offer small classes and
lower tuition
Increase class sizes
Cumulative surplus/debt after seven years none none
Annual undergrad enrolments at maturity 10,000 10,000
Student tuition per year $4,800 $5,300
Average class size 44 78
Share of teaching by full-time faculty 70 percent 70 percent
Teaching load of full-time faculty 8 4
Students per semester, per full-time faculty 176 156
(balanced budget scenarios)

63
An 80-10-10 faculty workload model
Weeks
Teaching and service
Classroom: Teaching, interaction with students, service, etc.
26
Non-classroom: Course preparation, marking exams, attending conferences, maintaining scholarly currency, service, etc.
15
Research 5
Vacation 4
Statutory holidays
2
52Plus 6 months
sabbatical after 6 years

64
Better teaching quality...
• Classes will be smaller• Curriculum will be designed around learning objectives
(not around areas of faculty research interest)• Faculty will be focussed on teaching and research on
teaching• Research linked to teaching
– research on teaching improvement– disciplinary research where it includes a direct and integral
contribution to the education of undergraduate students
• Administration will be focussed on undergraduate education– It’s not necessary to be a research powerhouse to be an
excellent undergraduate university

65
Recruiting great faculty...
• Campus in the GTA• Attractive working conditions
– Average faculty salary assumed to be $110,000 (2011$) plus benefits
• Supply and demand– 5 PhD holders in Ontario for every full-time faculty– 2,100 new PhD graduates and 1,400 PhDs coming to Ontario
every year (4.4 times the 800 full-time faculty reaching retirement age)
– Labour market for faculty in the US makes Ontario attractive
• Novelty and opportunity for innovation
AUCC membership criteria built into design

66
Recruiting great students...
• Campus in the GTA• Graduate/professional school entrance requirements built
into design• Attention to teaching, small size and high faculty-student
ratio are attractive to students and parents• NSSE and CLA results will soon demonstrate the
advantages• Lower tuition
67
Provide better undergraduate research experience
• These are teaching-oriented, not teaching-only universities and faculty are expected to be scholarly– The 80-10-10 allocation of time to teaching, research and
service provides more than one month a year for research– Research focused on teaching and learning can include
disciplinary research where it includes a direct and integral contribution to the education of undergraduate students
• Students in any field of study can benefit from working with professors engaged in research on teaching and learning– benefit of undergraduate research is largely in methods,
critical thinking and writing –independent of the subject of research
• Granting councils could change rules for support of undergraduate research

68
How to get started
• Government should invite proposals for new not-for-profit universities, based to specified criteria– Meeting student demand– High quality education– Graduates well prepared for careers or graduate school– More affordable than status quo
• Proposals might come from:– Faculty and administrators at existing universities– Not-for-profit universities and colleges from outside Ontario– Colleges that have a strong foundation in general arts and
strong academic self-governance– Colleges in partnership with a university

Is it possible to start a new university?
69
“The majority of young people who found a place in higher education in Ontario in the 1960s and 1970s did so because these leaders – John Robarts, Bill Davis, Ed Stewart, and the university presidents – identified the need and acted without delay. “As we have made clear in this book (with a half-century of hindsight), we do not think these leaders got everything right. “But they had the courage to begin.”
Murray Ross at his desk in the field that was to become York University, 1962

70
Concerns to be addressed along the way...

71
Thank you
Follow the discussion at:
www.academicreform.ca
Find this presentation at:
www.ian-clark.ca
72
Learning objectives: concepts to conger with
• Education as consumption• Returns to education, private
and public• Labour-market sorting
function of credentials• Meritocracy and elites• Selective admissions• Accreditation• International culture norms• International markets for
faculty and students• Mission (mandate) creep• Differentiation• Disruptive innovation
• Policy uniformity• Policy differentiation• Universality and universal
programs• Targeted programs• Needs-based funding• Performance-based funding• Equity principle vs equality
principle• Equality of opportunity vs
equality of outcome• Division of labour and
specialization• Market-based compensation