globalization, productivity and plant exit - evidence from ... · dp rieti discussion paper series...
TRANSCRIPT

DPRIETI Discussion Paper Series 09-E-048
Globalization, Productivity and Plant Exit- Evidence from Japan -
INUI TomohikoEconomic and Social Research Institute, Cabinet Office and Nihon University
Richard KNELLERNottingham University
MATSUURA ToshiyukiKeio University
Danny McGOWANNottingham University
The Research Institute of Economy, Trade and Industryhttp://www.rieti.go.jp/en/

1
RIETI Discussion Paper Series 09-E -048
Globalization, Productivity and Plant Exit - Evidence from Japan -*
September 2009
Tomohiko Inui (Economic and Social Research Institute, Cabinet Office and Nihon University)
Richard Kneller (Nottingham University) Toshiyuki Matsuura (Keio University)
Danny McGowan (Nottingham University)
Abstract
During the 1980s and 1990s, Japanese manufacturers began to relocate production from sites in
Japan to low-wage East Asian countries such as China, Malaysia and Thailand. Imports of
manufacturing goods increased substantially over the same period. This rapid rise in imports, and
proliferation of globalization, has led to concerns among policymakers that firms and plants may
close. The media portray foreign multinationals as closing down productive Japanese plants and
relocating them elsewhere in Asia. We find that this is not the case. Equally, the plants that are closed
are below average productivity and the exit component contributes a very small fraction to
productivity growth (using both the GR and FHK methods). In short, plant exit has not been the
reason for Japan's low productivity growth in the 1990s. Instead a lack of productivity growth within
plants is identified as being the main cause.
Keywords: Industry Dynamics, Productivity, Exit, Multinational Firms, International Trade
JEL classification: D21, D24, F15, F23, L20, L6
RIETI Discussion Papers Series aims at widely disseminating research results in the form of professional papers, thereby stimulating lively discussion. The views expressed in the papers are solely those of the author(s), and do not present those of the Research Institute of Economy, Trade and Industry.
* We would like to thank Dr. Masahisa Fujita (President and CRO of the Research Institute of Economy, Trade and Industry), Professor Kyoji Fukao (RIETI Faculty Fellow, and Hitotsubashi University), Professor Sadao Nagaoka (RIETI Counselor, and Hitotsubashi University) and participants of the workshop held at RIETI, and at Western Economic Association International conference at Vancouver for helpful comments and suggestions on earlier versions of this paper. This research was partially supported by the Ministry of Education, Science, Sports and Culture, Grant-in Aid for Scientific Research (A), No. 20243021. The views expressed in this paper are those of the authors and should not be attributed to both RIETI and the Economic and Social Research Institute.

2
1. Introduction
The recent empirical studies1, using establishment or firm level data, confirm that
aggregate productivity growth at national level or industry level depends not only on the
productivity gains within the establishments, but also on the shift in the output shares
between the establishments or firms in the different level of productivities (see
Bartelsman and Doms, 2000, Forster et al. 2001 and Hayakawa, Kimura, and Machikita
2009). If the output of the establishments with higher productivities can expand their
production and that of the lower productivity establishments contracts, this change in
the market share also brings improvements in aggregate productivity in the economy.
The productivity improvement through market selection is examined by Disney, Haskel
and Heden (2003) by using UK manufacturing data set. They find the market selection
(entry, exit and the reallocation of market share) accounts for 80-90% of establishment
TFP growth for 1982-92 period in UK. Criscuolo, Haskel and Martin (2004) use more
recent data on UK manufacturing plants and find that the share of productivity growth
accounted for by entry and exit increased from 25 per cent in the 1980s to 50 per cent in
the 1990s.
Increased import penetration may lead to higher domestic market competition and
higher aggregate productivity by forcing the least productive establishments to exit from
the market, as described in the Melitz and Ottaviano (2005) model. Lileeva (2007)
examines the effect of US-Canada Free Trade agreement on the productivity of the
Canadian manufacturing sector. This study finds that the lower tariff rate in Canada
increased exit rates among moderately productive non-exporting plants and lead to the
1 The recent studies on Japanese productivity dynamics using micro data, such as Nishimura, Nakajima and Kiyota (2005) and Fukao and Kwon (2006) confirm the role of “between” effects on the industrial productivity growth.

3
reallocation of the market share to the higher productivity plants in Canadian
manufacturing plants.
Bernard, Jensen and Schott (2006a) find that the probabilities of shut downs are
higher in industries facing increased import competition from low-wage countries,
especially for low-wage and labor-intensive plants within the industries. Bernard,
Jensen and Schott (2006b) examine the effect of the trade cost reduction, such as tariff
and transportation rates, on the reallocation in the US manufacturing sector and find that
low productivity plants in the industry that have relative larger decline in the trade costs
are more likely to die. Bernard and Jensen (2007) show empirical results about the US
manufacturing death that the probability of death is substantially lower for those plants
that are part of multi plant firm and also domestic plants that are owned by US
multinationals. Greenaway, Gullstrand and Kneller (2008) find that the effect of trade
on exit of Swedish firms being strongest when trading partners are other than OECD
countries.
This paper adds to the growing evidence on plant exit and the survival chances of
multinational owned enterprises. Görg and Strobl (2003) address the probability of exit
of majority owned plants in Ireland, and Gibson and Harris (1996), Bernard and Jensen
(2002), Bernard and Sjöholm (2003) look at evidence from New Zealand, the United
States and Indonesia, respectively. The results differ depending upon the country under
inspection. For example, Alvarez and Görg (2009) find that multinationals are more
likely to shut plants in Chile, but only during downturns, while Mata and Portugal
(2004) find that survival probabilities are higher among Portuguese plants when they
are foreign owned.
The reminder of the paper is organized as follows. In the next section, we give a

4
overview of the data and describes the construction of the plant-level, firm-level and
industry-level characteristics. Section 3 investigates differences between plants
depending on their ownership structure by controlling other firm, plat and industry
characteristics. Section 4 investigates whether plant exit has an effect upon Japanese
productivity growth in the recent years. Section 5 concludes.
2. Data
Our primary data sources are the linked longitudinal data sets of the Census of
Manufactures (hereafter called COM) and the Basic Survey of Japanese Business
Structure and Activities (BSJBSA) for the period 1994-2005. The COM data is an
establishment-level data conducted by the Ministry of Economy, Trade and Industry
(METI). The COM data covers all plants located in Japan and it include the information
on plant characteristics, such as, their location, number of employees, tangible assets,
and value of shipments. On the other hand, the BSJBSA is a firm-level survey
conducted by METI. The survey includes all firms with more than 50 employees or over
and with capital of 30 million yen or over. It provides data on corporate characteristics
such as R&D activity, export, import, foreign ownership ratio, foreign direct investment,
and fanatical details. For our analysis, we linked a plant-level data, the COM to a
firm-level survey, the BSJBSA. At first, we constructed a plan-level panel data set,
which covers all the manufacturing plants with more than 3 employees. Since BSJBSA
dose not include firms with less than 50 employees or less than 30 million capital
amounts, we have to exclude small single plants with less than 50 employees in our
sample. In addition, even if plants belong to firms in the BSJBSA, due to the viability of
data on tangible asset, which is indispensable to estimate TFP, those plants with less
than 10 employees are excluded. Information on capital data is also not available for

5
2001, 2002 and 2004 for establishments with less than 29 employees. Therefore, our
linked panel data set covers the years from 1994 to 2000, 2003, and 2005.
For an identification of plant entry and exit, we used using a unique identification
number. An entering plant is deemed to have entered where it is observed at time t but
was not observed in the dataset in previous period, t-1. Equivalently, an exiting plant is
one that was observed at t-1 but not at time t. In this framework, since our plant-level
panel data set is restricted to plants with more than 3 employees, it is not possible to say
whether this is caused by plant death or exit from the sample2. Exit is deemed to refer
specifically to plant closure; industry switching and mergers are not considered within
this framework3.
The percentage of plants which either enter or exit is low, a feature which holds
across industries. Throughout the sample, there are 2,330 instances of entry and 3,392
observations of exit. The exit rate may be affected by the size cut-offs. Throughout the
dataset there are approximately 86,000 observations of single-plant firms. These plants
have at least 50 employees meaning that they are fairly large, and less likely to exit. If
the data permitted inspection of small plants, the exit rate may be higher since such
establishments traditionally face higher probabilities of death.
2 Industry switching is not regarded as plant exit. However, those plants whose industry switches from manufacturing sector to other sector at between t-1 and t, are not observed in our plant-level panel data set at t. Thus these plants are regarded as exiting plants. 3 Switching and M&A activity are found to play an important role in other studies. In Swedish manufacturing industries over the period 1982-1995, Greenaway et al. (2008) find 2.9 percent of exit occurs through switching and 3.9 percent through mergers and acquisitions. Bernard et al. (2006a) find for the United States that in the face of competition from low-wage imports, firms switch towards more capital intensive sectors.

6
Table 1: Annual Rate of Entry and Exit
Percentage of FirmsYear Entering Exiting
Sample Average .01 .02
1994 .01 .011995 .01 .011996 .01 .011997 .01 .021998 .03 .031999 .01 .032000 .01 .032001 .01 .032002 .01 .032003 .01 .022004 .01 .022005 .02 .00
Over the sample, the entry and exit rates are approximately 1 and 2 percent,
respectively. There are some fluctuations around this, notably for the entry rate which
‘spikes’ to 3 percent in 1998. Overall, however, there is little variation with entry and
exit remaining concentrated around the mean. While this may seem to be a fairly low
rate of exit, it is comparable with that of Swedish manufacturers over the period 1982 to
1995 used by Greenaway et al. (2008).
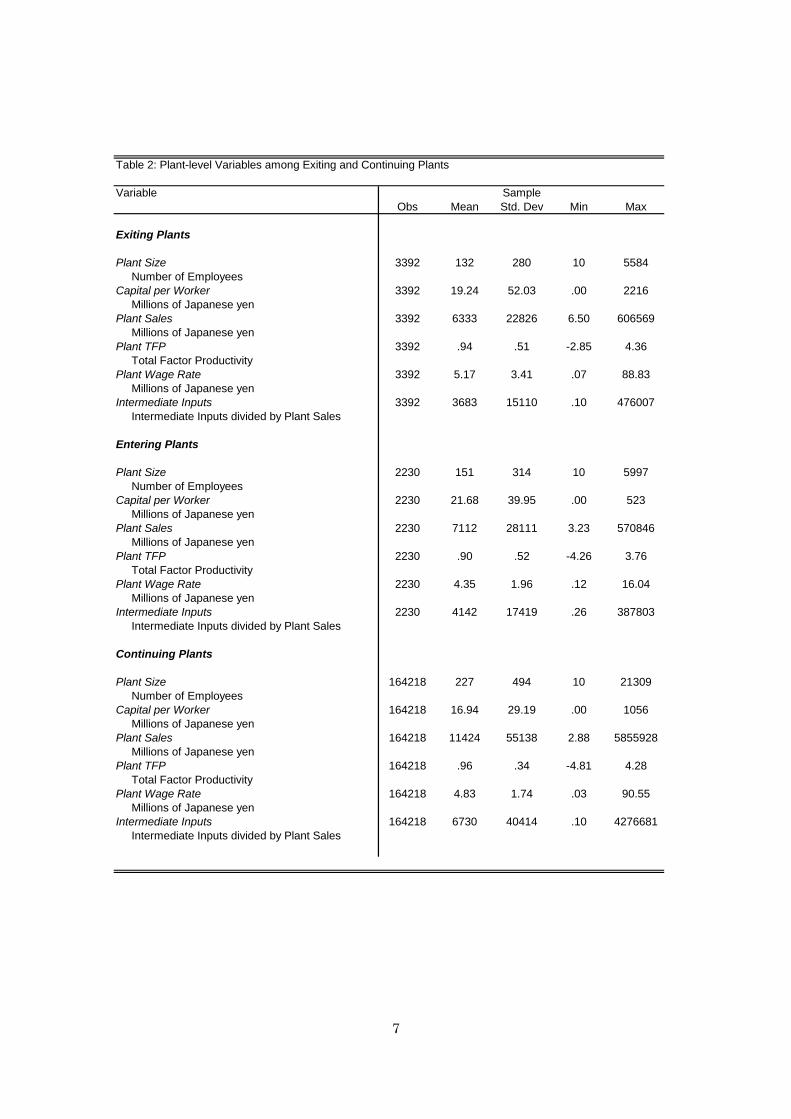
Table 2 shows that the plant variables differ considerably across entering, exiting
and continuing firms. For example, entering and exiting plants tend to be smaller and
have lower sales, productivity and intermediate inputs than continuing plants. On
average, continuing firms have a lower capital-labor ratio relative to entrants and exiting
plants, and, despite paying higher wages than entrants, their wage rate is lower than
what is paid by exiting plants.
7
Table 2: Plant-level Variables among Exiting and Continuing Plants
Variable SampleObs Mean Std. Dev Min Max
Exiting Plants
Plant Size 3392 132 280 10 5584 Number of EmployeesCapital per Worker 3392 19.24 52.03 .00 2216 Millions of Japanese yenPlant Sales 3392 6333 22826 6.50 606569 Millions of Japanese yenPlant TFP 3392 .94 .51 -2.85 4.36 Total Factor ProductivityPlant Wage Rate 3392 5.17 3.41 .07 88.83 Millions of Japanese yenIntermediate Inputs 3392 3683 15110 .10 476007 Intermediate Inputs divided by Plant Sales
Entering Plants
Plant Size 2230 151 314 10 5997 Number of EmployeesCapital per Worker 2230 21.68 39.95 .00 523 Millions of Japanese yenPlant Sales 2230 7112 28111 3.23 570846 Millions of Japanese yenPlant TFP 2230 .90 .52 -4.26 3.76 Total Factor ProductivityPlant Wage Rate 2230 4.35 1.96 .12 16.04 Millions of Japanese yenIntermediate Inputs 2230 4142 17419 .26 387803 Intermediate Inputs divided by Plant Sales
Continuing Plants
Plant Size 164218 227 494 10 21309 Number of EmployeesCapital per Worker 164218 16.94 29.19 .00 1056 Millions of Japanese yenPlant Sales 164218 11424 55138 2.88 5855928 Millions of Japanese yenPlant TFP 164218 .96 .34 -4.81 4.28 Total Factor ProductivityPlant Wage Rate 164218 4.83 1.74 .03 90.55 Millions of Japanese yenIntermediate Inputs 164218 6730 40414 .10 4276681 Intermediate Inputs divided by Plant Sales

8
2.1. Plant-Level Variables
Information is provided on the three-digit industry in which a plant operates4. The
plant-level variables include plant size (measured by the number of employees), capital
per worker, plant sales, plant TFP (measured relative to the industry and in logs), plant
wage rate and the volume of intermediate inputs used by the plant.
Table 3: Plant-level Variables
Variable SampleObs Mean Std. Dev Min Max
Plant Size Number of Employees 169590 225 489 10 21309Capital per Worker Millions of Japanese yen 169590 5119 23240 .07 1052705Plant Sales Millions of Japanese yen 169590 11321.71 54454 2.88 5855928Plant TFP Total Factor Productivity 169590 .96 .35 -4.81 4.36Plant Wage Rate Millions of Japanese yen 169590 4.84 1.79 .03 40.5Intermediate Inputs Intermediate Inputs divided by Plant Sales 169590 6669 39879 .10 4276681
The manufacturing establishments are split into 48 industries and TFP is calculated
for each plant relative to the industry average. Following Caves, Christensen and
Diewert (1982), Caves, Christensen and Tretheway (1983), and Good, Nadiri, Roeller
and Sickles (1983), we define the TFP level of establishment p in year t in a certain
industry in comparison with the TFP level of a hypothetical representative establishment
in year 0 in that industry as follows
4 A list of industries is included in Appendix Table 1

9
( ) ( )( )
( ) ( )( )∑∑∑
∑
= =−−
=−
=
−+−−+
−+−−=
t
s
n
iisisisis
t
sss
itift
n
iitifttftpt
XXSSQQ
XXSSQQTFP
1 111
11
1
lnlnlnln
lnln21lnlnln
where Qft, Sift and Xift denote the gross output of plant f in year t, the cost share of factor
i for establishment p’s input of factor i in year t. Variables with an upper bar denote the
industry average of that variable. We use 1994 as the base year. Capital, labor and real
intermediate inputs are used as factor inputs.
The representative establishment for each industry is defined as a hypothetical
establishment whose gross output as well as input and cost share of all production
factors are identical with the industry average. The first two terms on the right hand side
of the equation denote the gap between plant f’s TFP level in year t and the
representative establishment’s TFP level in year t and the representative establishment’s
TFP level in the base year. lnTFPft in the equation constitutes the gap between
establishment f’s TFP level in year t and the representative establishment’s TFP level in
the base year.
2.2. Firm-Level Variables
In addition to information on each plant, our dataset also includes specific
information on firms. This includes firm age, size, capital-labor ratios, a multi-plant
dummy and information on whether the firm conducts FDI. In the empirical section we
use this to study firm-level variables, such as ownership and exporting status, affect

10
plant exit. Summary statistics of the firm-level variables are shown in Table 4.
Table 4: Firm-level Variables
Variable
Obs Mean Std. Dev Min Max
Age 14033 37.64 15.53 0 150 In monthsSize 14033 459 1918 50 77185 Number of WorkersCapital per Worker 14033 12.79 20.74 .00 1275 Millions of Japanese yenFirm TFP 14033 .93 .15 -3.53 2.39 Total Factor ProductivityForeign Ownership Dummy 14033 .01 .12 0 1 1 if Foreign Firm holds more than 50% of capitalR&D Complexity 6815 -4.94 1.54 -10.71 1.92 log R&D divided by Firm SalesExport Dummy 14033 .26 .44 0 1 1 if the firm exportsImport Dummy 14033 .20 .40 0 1 1 if the firm importsFDI 14033 .15 .36 0 1 1 if outward loans and investment > 0Intermediate Inputs 14033 16208 110875 1 7177500 Millions of Japanese yenMulti-plant Dummy 14033 .23 .42 0 1 1 if the firm has more than one plant
It is apparent from Table 4 that the incidence of foreign ownership in Japanese
firms is low. A firm is adjudged to be foreign owned if a foreign firm holds more than
50 percent of the capital5. Many firms appear to be globally engaged with 26 percent
exporting, 20 percent importing and 15 percent of firms investing abroad. Almost half
of firms own more than one plant.
5 Görg and Strobl (2005) use the same criteria. The International Monetary Fund classifies a firm as being foreign owned if a foreigner holds in excess of 25 percent of the firm’s equity.

11
2.3. Industry-Level Variables
The importance of industry-level variables in determining exit has been firmly
established with Roberts and Tybout (1997) finding sunk costs to be important and
Bernard et al. (2006a) highlighting how import penetration from different regions can
affect exit. With these ideas in mind, we include industry-level variables that capture the
effect globalization may impact on plant exit.
Intra-industry trade is often found to have a positive effect upon firm exit. As
international trade grows firms diversify their product range which may lead them to
enter new industries and exit ones they were once involved in. It has also been
established by Greenaway et al. (2008) that firms do not just closedown their operations,
they switch to new industries too. This is also found by Bernard et al. (2006a) who find
that in the United States, firms which are confronted by low-wage import competition
sometimes switch to more capital intensive sectors.
Our measure of intra-industry trade is constructed using the Grubel-Lloyd (1975)
index.
( )[ ]( )ititititititit MX
MXMXGL+
−−+=100
where GLit is the Grubel-Lloyd index of intra-industry trade in industry i in year t, Xi are
exports in industry i during year t and Mit are imports in industry i during year t.
12
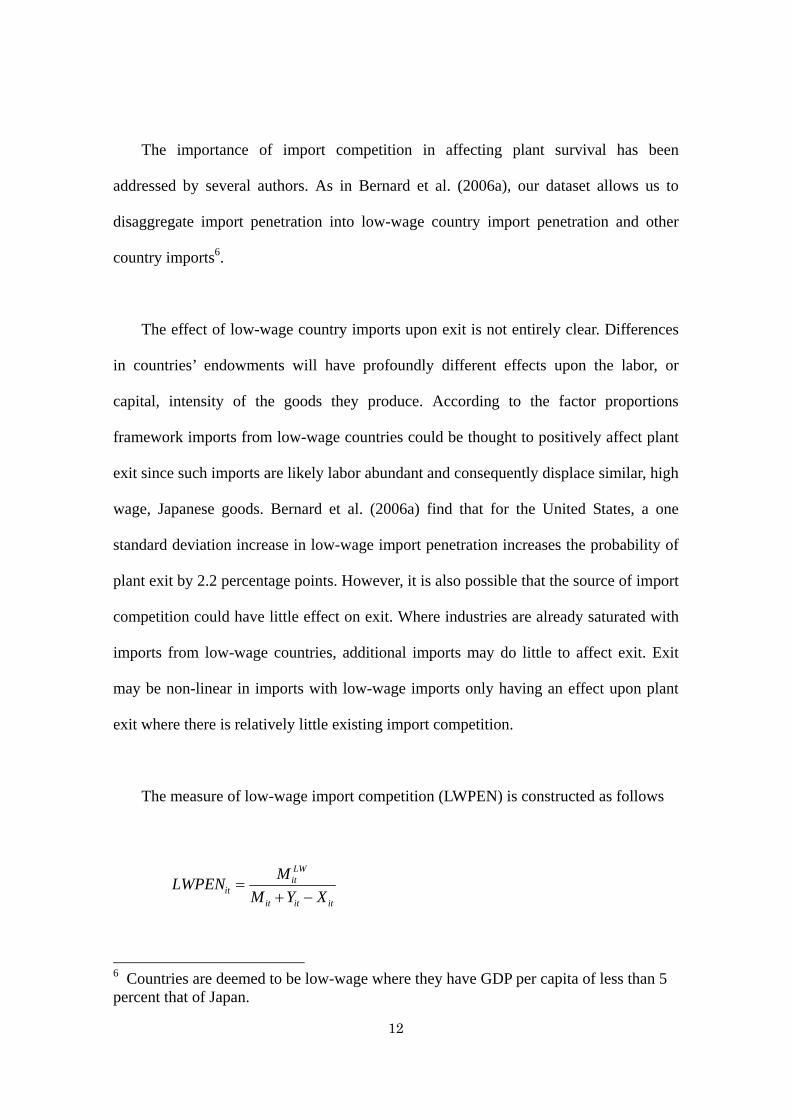
The importance of import competition in affecting plant survival has been
addressed by several authors. As in Bernard et al. (2006a), our dataset allows us to
disaggregate import penetration into low-wage country import penetration and other
country imports6.
The effect of low-wage country imports upon exit is not entirely clear. Differences
in countries’ endowments will have profoundly different effects upon the labor, or
capital, intensity of the goods they produce. According to the factor proportions
framework imports from low-wage countries could be thought to positively affect plant
exit since such imports are likely labor abundant and consequently displace similar, high
wage, Japanese goods. Bernard et al. (2006a) find that for the United States, a one
standard deviation increase in low-wage import penetration increases the probability of
plant exit by 2.2 percentage points. However, it is also possible that the source of import
competition could have little effect on exit. Where industries are already saturated with
imports from low-wage countries, additional imports may do little to affect exit. Exit
may be non-linear in imports with low-wage imports only having an effect upon plant
exit where there is relatively little existing import competition.
The measure of low-wage import competition (LWPEN) is constructed as follows
ititit
LWit
it XYMMLWPEN
−+=
6 Countries are deemed to be low-wage where they have GDP per capita of less than 5 percent that of Japan.

13
where LWPENit represents low-wage country import competition in industry i at time t,
MitLW is the value of imports from low-wage countries in industry i at time t, Mit and Xit
represents the value of total imports and exports in industry i at time t and Yit denotes
output in industry i during year t.
Our second measure of import competition is similar to that used to construct
LWPEN. It embodies imports from all countries that are not deemed to be “low-wage”.
ititit
LWitit
it XYMMMOTHPEN−+
−=
where OTHPENit denotes imports from all countries except low-wage economies.
The industry variables mentioned so far capture the influence of globalization upon
plant exit. We also include a measure of sunk entry costs. The empirical literature has
identified sunk entry costs as being an important factor in shaping exit. For example,
Aw et al. (2002) finds that the nature of sunk costs result in very different productivity
distributions in South Korea and Taiwan. Sunk costs also play a key role in determining
death rates of plants (Dunne, Roberts, and Samuelson, 1988, 1989)
Since exit rates tend to be highly correlated with the sunk costs of entry and exit we
use the same measure as Bernard and Jensen (2002) and Greenaway et al. (2008). For
each industry and year, sunk costs are deemed to be the minimum of either the entry or
exit rate. In steady-state equilibrium, entry and exit rates should be equal. Entry and exit
rates should vary with sunk costs. An increase in sunk costs would mean that the entry

14
rate should fall, in equilibrium. However, to focus solely on entry rates could be
misleading as an industry characterized by high sunk costs could experience a high
entry rate due to high expected profits. By using the minimum of entry or exit, we
circumvent this problem.
Summary statistics for the industry-level variables are provided in Table 5.
Intra-industry trade accounts for approximately half of all trade over the sample. Sunk
costs have an average value of 1 percent, that is, the average of the minimum of the
entry and exit rates in an industry is 1 percent of the total number of operating plants.
The share of low-wage imports accounts for a third of Japanese imports.
Table 5: Industry Variables
Variable Obs Mean Std. Dev Min Max
Grubel-Lloyd Index 157273 .50 .26 .01 1.00 Trade that is Intra-IndustrySunk Costs 169590 .01 .01 0 .05 Minimum of entry and exit rateImport Penetration 131669 .09 .09 .00 .67 Imports divided by apparent consumptionLWPEN 131669 .03 .05 .00 .28 Low wage importsOTHPEN 131669 .06 .06 .00 .55 Imports from all other countries
2.4. Plant Features
2.4.1. Multinational Enterprises
Using the information on foreign direct investment we construct a multinational

15
enterprise (MNE) dummy. A firm is assumed to be a multinational where the outward
loans and investment variable has a positive value. Recently the international trade
literature has found multinational owned plants differ from purely domestic ones.
Japanese plants appear to conform to many of the findings reported elsewhere in the
literature. For example, in Table 6 we observe MNE owned plants (where MNEs are
deemed to include domestic- and foreign-owned multinational plants) to be larger, more
capital intensive, more productive, have higher sales, pay higher wages and use more
intermediate inputs when compared with plants which are non-MNE owned.
Table 6: Differences between MNE and non-MNE Owned Plants
OwnershipVariable MNE non-MNE
Observations 53328 116262
Plant Size 415 138 Number of EmployeesCapital per Worker 25.73 13.07 Millions of Japanese yenPlant Sales 25782 4689 Millions of Japanese yenPlant TFP 1.03 .93 Total Factor ProductivityPlant Wage Rate 5.57 4.51 Millions of Japanese yenIntermediate Inputs 15259 2728 Intermediate Inputs divided by Plant Sales
Simple T-tests reveal that non-MNE owned plants are significantly smaller, less
capital intensive and have lower TFP and wages than MNE owned plants7. Exit rates are
significantly higher among non-MNE owned plants although the difference between the
7 T-tests are computed by subtracting the mean of group j from the mean value of group i to find the difference. A t-test is then run where the null hypothesis is that the differences between the means are zero.

16
mean exit rate of MNE and non-MNE plants is small8. These results are shown in Table
7.
Table 7: T-tests on the differences between MNE and non-MNE Owned Plants
Variable Difference
Exit Rate .00**
Size -.72***
Capital Intensity -.68***
TFP -.10***
Wages -1.07***
The richness of the dataset also permits investigation of how, within firms, exiting
MNE plants differ from those which continue. In Table 8 it is shown that, within firms,
MNE exiting plants are significantly smaller, less capital intensive and pay higher
wages when compared with plants which continue in the same firm. When compared to
continuing plants in the same firm, exiting plants do not appear to have significantly
different productivity.
8 When we compare the differences between the plant-level variables across MNE and non-MNE exiting plants, these features remain.

17
Table 8: Within MNE T-tests
Variable Difference
Size .79***
Capital Intensity .20***
TFP .02
Wages -.61***
2.4.2. Foreign Ownership
As with MNEs, the role of foreign ownership in determining plant exit has been
much discussed with Mata and Portugal (2004), Bernard and Sjöholm (2003) and Girma
and Görg (2004) all touching on the subject. Foreign firms may be more footloose
relative to domestic firms since they can relocate production across countries. However,
it is possible that they may be less likely to close plants because they have incurred sunk
costs to operating abroad which leads to entrenchment and a reduction in the probability
of plant exit. As in the previous section, we use T-tests to examine whether there are
significant differences in exit rates and the plant-level variables between domestic and
foreign owned plants.
In Table 9 we report results of t-tests that deal with differences between domestic
and foreign owned plants. “Domestic plants” refer to all Japanese plants, that is,
irrespective of whether they belong to a multinational or not. The same is true of foreign
owned plants. We find that foreign plants are significantly larger, more capital intensive,

18
productive and pay significantly higher wages than domestic plants. These results
accord with what many other authors, such as Bernard and Sjöholm (2003), have found.
The wage premium paid by foreign plants may be a means of incentivizing workers if
foreign plants are more likely to exit
Table 9: T-tests on the differences between Domestic and Foreign Owned Plants
Variable Difference
Exit Rate .00***
Size -.58***
Capital Intensity -.73***
TFP -.16***
Wages -1.44***
3 Empirical Model and Results of plant shutdowns
In the previous section we observed that plants which exit have, on average,
different attributes compared with continuing firms. Multinational and foreign owned
plants also appeared to differ from domestically owned plants. In this section we
investigate how the plant-, firm- and industry-level variables affect the probability of
plant exit. We address several hypotheses which include whether ownership, export
orientation, and MNE concentration affect plant exit. Regressions are also conducted to
see how plant characteristics within firms affect exit.
The focus of the research is purely upon the determinants of plant exit, that is,
19
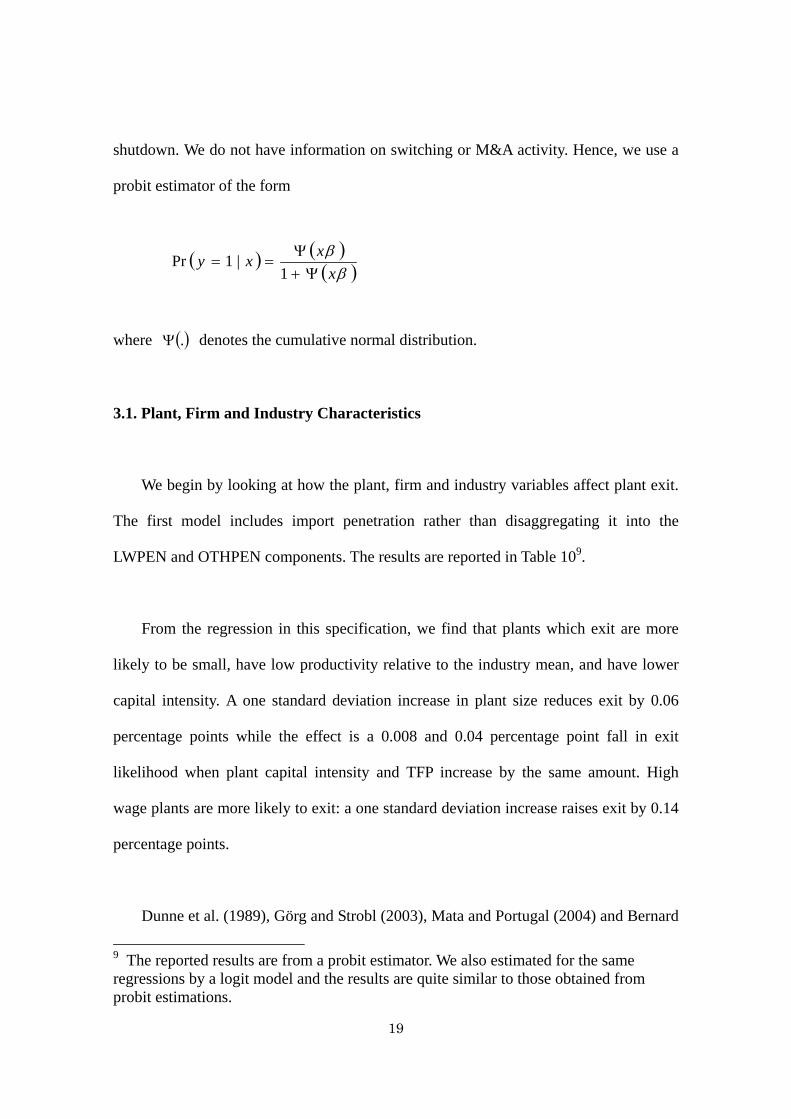
shutdown. We do not have information on switching or M&A activity. Hence, we use a
probit estimator of the form
( ) ( )( )ββx
xxyΨ+
Ψ==
1|1Pr
where ( ).Ψ denotes the cumulative normal distribution.
3.1. Plant, Firm and Industry Characteristics
We begin by looking at how the plant, firm and industry variables affect plant exit.
The first model includes import penetration rather than disaggregating it into the
LWPEN and OTHPEN components. The results are reported in Table 109.
From the regression in this specification, we find that plants which exit are more
likely to be small, have low productivity relative to the industry mean, and have lower
capital intensity. A one standard deviation increase in plant size reduces exit by 0.06
percentage points while the effect is a 0.008 and 0.04 percentage point fall in exit
likelihood when plant capital intensity and TFP increase by the same amount. High
wage plants are more likely to exit: a one standard deviation increase raises exit by 0.14
percentage points.
Dunne et al. (1989), Görg and Strobl (2003), Mata and Portugal (2004) and Bernard
9 The reported results are from a probit estimator. We also estimated for the same regressions by a logit model and the results are quite similar to those obtained from probit estimations.

20
and Sjoholm (2003) also find the probability of exit to be decreasing in plant size.
Bernard and Jensen (2007) observe that surviving plants are larger, more productive
than the average plant and are more capital intensive. Bernard and Jensen (2007) also
find that exiting plants pay significantly lower wages than survivors. This is in contrast
to our findings for Japan.
We split the sample into single- and multi-plant firms and run the regressions again
to see whether the probability of exit differs according to whether the plant is part of a
multi-plant firm or not10. The results show that high wage plants are more likely to exit,
regardless of whether the firm is a single-plant or multi-plant business. In addition, it
does not matter whether we split the sample according to whether firms are
multinationals or not, higher wage plants have a greater probability of exit. However,
high wage plants are more likely to exit if they are part of a multi-plant (0.018 versus
0.005) or multinational firm (0.019 versus 0.006). It could be that we are observing the
influence of off shoring, but the positive sign on wages among single-plant and
non-MNE plants may be due to the effect of import competition or the declining
competitiveness of such establishments in the export market. While plants are more
likely to exit if they are high wage and belong to a multinational, the t-tests in Table 8
showed that within multinational firms, exiting plants had significantly lower wages
than continuing plants.
The firm-level exporter and importer dummies are found to significantly increase
the probability of plant exit. A one standard deviation increase causes a 0.02 percentage
10 Results are not reported here.

21
point increase in exit for both variables. This goes against what other scholars have
found. For example, Bernard and Jensen (2007) find that even after controlling for plant
size, productivity, factor intensity and ownership structure, export status reduces the
probability of exit by 15%. Compared with non-exporters, and conditional on plant
variables, they find exporting firms are 6.8 percentage points less likely to close.
However, as we shall see in later regressions, the exporter and importer dummies are
capturing the influence of MNE status.
Theoretically, it could be the case that multi-plant firms could increase the
probability of exit of their plants by relocating production to another subsidiary plant.
Equally, headquarter services, finance and the industry experience of other
establishments within the group may ameliorate the chance of exit for a plant belonging
to a multi-plant firm. While we find a one standard deviation increase in the multi-plant
variable leads to a 0.10 percentage point increase in exit, the results from other studies
often depend on the country under inspection. After controlling for plant features,
Bernard and Jensen (2007) find that there is no difference in the likelihood of exit for
plants owned by a multi-plant firm in the United States. On the other hand, Mata and
Portugal (2004), and Bandick (2007) find the contrary.

22
Table 10: Plant, Firm and Industry Determinants of Exit
Specification1 2 3
Plant-level Variables
Size -.058*** -.058*** -.057***(-23.22) (-23.03) (-23.21)
Capital Intensity -.008*** -.008*** -.008***(-5.90) (-5.81) (-5.75)
TFP -.041*** -.041*** -.040***(-4.65) (-4.63) (-4.57)
Wages .144*** .145*** .146***(8.82) (8.83) (8.91)
Firm-level Variables
Export Dummy .021** .026***(2.47) (4.08)
Import Dummy .017** .022***(2.15) (3.78)
Multi Plant Dummy .100*** .101*** .101***(16.19) (16.34) (16.62)
R&D Intensity .002*** .002*** .003***(2.70) (2.82) (3.18)
Industry-level Variables
Grubel-Lloyd Index .012 .013 .012(.27) (.28) (.26)
Import Penetration -.137 -.136 -.132(-1.51) (-1.51) (-1.46)
Sunk Costs -.001* -.001* -.001*(-1.80) (-1.80) (-1.80)
Industry Dummies Yes Yes YesTime Dummies Yes Yes Yes
Number of Observations 78315 78315 78315Pseudo R2 .14 .13 .13
Standardised coefficients. z-statistics reported in parentheses***, ** and * indicate significance at at least the 1 percent, 5 percent and 10 percent levels
Firm R&D intensity is found to positively affect plant exit, a finding which runs
contrary to other results reported in the literature (Perez at al., 2004). However, the
effect is conditional on plant-level variables. When these are excluded, plants belonging
to firms with high R&D intensities are less likely to exit, although the standardized

23
coefficient is small.
The Grubel-Lloyd index of intra-industry trade and import penetration are both
found to be insignificant. However, industry sunk costs have a negative effect on plant
exit. This arises because in industries with high sunk costs potential entrants must draw
a high productivity so that they may profitably produce (Melitz, 2003). Consequently
there are fewer successful entrants and competition for market share is diminished. The
reduction in competition means that incumbent firms face a lower chance of exit.
Greenaway et al. (2008) find industry sunk costs to be negatively related with plant exit
among Swedish manufacturers (using the same measure of sunk costs). Using an
industry entry cost measure, Bernard and Jensen (2007) find higher industry sunk costs
reduce exit.
The magnitude of the marginal effects is small. This is in part due to the low exit
rate in the sample (2% of firms). Despite this, the marginal effects for closedown
reported by Greenaway et al. (2008) are similar in magnitude. In this context, the
relative size of each variable becomes important. For example, being a large plant is a
more effective means of survival than being capital intensive. Multi-plant ownership
and high plant wages have the same effect upon exit. Plant- and firm-level variables are
considerably more important in the determination of exit than are industry variables.
3.2. Disaggregating Import Penetration
Previously we saw that industry import penetration did not have a significant effect

24
on plant exit. A potential explanation could be that by aggregating together low-wage
and all other country imports, we were obscuring the effect that each component has on
exit. Low-wage country imports may increase the likelihood of exit since these are
goods which tend to be labor intensive and have a competitive advantage when
competing with the same type of (higher wage) products produced in Japan. In contrast,
OTHPEN may represent goods which are complementary to the production process and
hence reduce the chance of exit.
Disaggregating import penetration into LWPEN and OTHPEN does little to affect
the other variables. All variables remain signed as in Table 10 and they are still
significant. Imports from low-wage countries are not found to significantly affect exit,
nor does import competition from all other countries. It could be that exit is non-linear
in import competition. Imports would then only have an impact on plant survival once
they have captured a significant market share. Across all industries and years, imports
from low-wage countries have a market share of just 3 percent while the figure for
OTHPEN is 8 percent. Although there are some instances where the import penetration
measures account for half of production, the statistics suggest that the fairly low level of
competition from abroad is the reason why Japanese manufacturers are less susceptible
to import competition compared with the United States (Bernard et al., 2007).

25
Table 11: Disaggregating Import Penetration
Specification1 2 3
Plant-level Variables
Size -.057*** -.057*** -.057***(-23.30) (-23.31) (-23.27)
Capital Intensity -.008*** -.008*** -.008***(-5.90) (-5.90) (-5.91)
TFP -.041*** -.041*** -.041***(-4.67) (-4.67) (-4.67)
Wages .144*** .143*** .144***(8.81) (8.79) (8.83)
Firm-level Variables
Export Dummy .020** .020** .021**(2.45) (2.43) (2.46)
Import Dummy .017** .017** .016**(2.21) (2.14) (2.13)
Multi Plant Dummy .100*** .100*** .100***(16.21) (16.21) (16.22)
R&D Intensity .002*** .002*** .002***(2.71) (2.71) (2.70)
Industry-level Variables
Grubel-Lloyd Index .005 .002 .009(.12) (.04) (.20)
LWPEN .022 .009(.87) (.37)
OTHPEN -.123 -.095(-1.61) (-1.32)
Sunk Costs -.001* -.001* -.001*(-1.84) (-1.85) (-1.83)
Industry Dummies Yes Yes YesTime Dummies Yes Yes Yes
Number of Observations 78315 78315 78315Pseudo R2 .14 .13 .13
Standardised coefficients.z-statistics reported in parentheses***, ** and * indicate significance at at least the 1 percent, 5 percent and 10 percent levels
3.3. Foreign Ownership
The issue of ownership often been raised as a potential cause of plant and firm exit.
The issue is important since exit and the loss of jobs impacts upon welfare. Foreign, or
26
multinational, owned plants may be less integrated in the local domestic economy
(because of their vertical or horizontal linkages) so may be more likely to exit when
business conditions deteriorate (Flamm, 1984). They are not as familiar with the
domestic market and its modus operandi as domestic firms are which results in foreign
firms incurring greater sunk costs when entering a new market. Negative shocks may
then have less of an impact on the exit decision since the large costs of entry provide an
incentive to remain active and recoup as much of the fixed costs as possible. Girma and
Görg (2004), Taymaz and Ozler (2007) and Bernard and Sjöholm (2003) all address
whether foreign ownership affects establishment survival and growth, while Mata and
Portugal (2004) look at whether new domestic and foreign owned firms differ in their
chances of survival. We investigate whether foreign ownership, as well as multinational
ownership, affects exit in Japan.
Multinational ownership has also been the centre of empirical and theoretical work.
On the empirical side, Alvarez and Görg (2005) look at whether Chilean multinational
owned plants are more likely to exit relative to domestic plants while Görg and Strobl
(2002) examine whether multinationals are more “footloose” than domestic firms in
Irish manufacturing industries. Theoretically, it is difficult to conclusively state whether
multinationals are more or less likely to shut down plants. While it is conceivable that
multinationals could rapidly relocate production across borders, they may not do so
given the large sunk costs they bear from setting up a new plant. The direction of
causality could go either way depending on the nature of foreign direct investment
(FDI). If FDI is horizontal (as in Helpman, Melitz and Yeaple, 2004), then
multinationals may be less likely to close plants since they serve a target market and
27
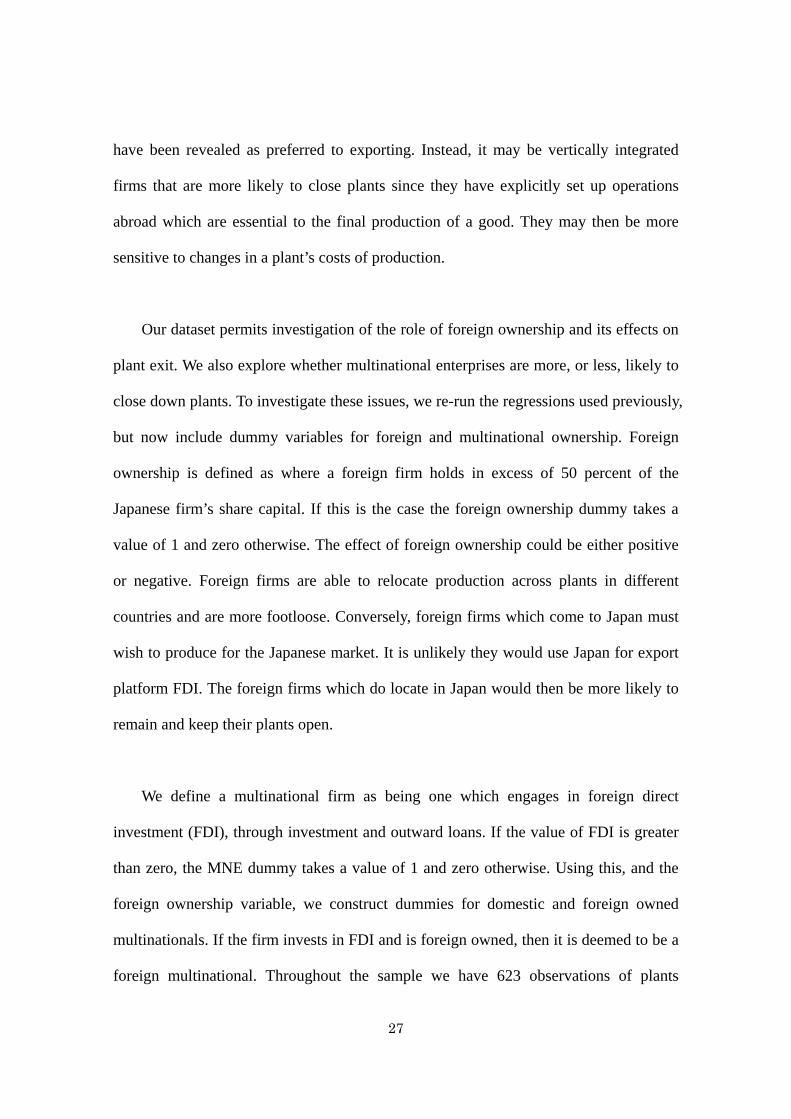
have been revealed as preferred to exporting. Instead, it may be vertically integrated
firms that are more likely to close plants since they have explicitly set up operations
abroad which are essential to the final production of a good. They may then be more
sensitive to changes in a plant’s costs of production.
Our dataset permits investigation of the role of foreign ownership and its effects on
plant exit. We also explore whether multinational enterprises are more, or less, likely to
close down plants. To investigate these issues, we re-run the regressions used previously,
but now include dummy variables for foreign and multinational ownership. Foreign
ownership is defined as where a foreign firm holds in excess of 50 percent of the
Japanese firm’s share capital. If this is the case the foreign ownership dummy takes a
value of 1 and zero otherwise. The effect of foreign ownership could be either positive
or negative. Foreign firms are able to relocate production across plants in different
countries and are more footloose. Conversely, foreign firms which come to Japan must
wish to produce for the Japanese market. It is unlikely they would use Japan for export
platform FDI. The foreign firms which do locate in Japan would then be more likely to
remain and keep their plants open.
We define a multinational firm as being one which engages in foreign direct
investment (FDI), through investment and outward loans. If the value of FDI is greater
than zero, the MNE dummy takes a value of 1 and zero otherwise. Using this, and the
foreign ownership variable, we construct dummies for domestic and foreign owned
multinationals. If the firm invests in FDI and is foreign owned, then it is deemed to be a
foreign multinational. Throughout the sample we have 623 observations of plants

28
owned by a foreign firm and 53,328 instances of plants being owned by a multinational.
Of the latter, there are only 74 observations where a plant is part of a foreign MNE.
These figures reconcile with anecdotal evidence of low levels of FDI into Japan.
The first column of Table 12 shows the results of the regression when we include
the foreign ownership dummy in the original model. The plant, firm and industry
variables remain identically signed and significant at the same levels as in Table 10.
Foreign ownership is found to be insignificant. This implies that plants with foreign
owners are not footloose and adds weight to the hypothesis that the sunk costs of
entering a foreign market provide an incentive to remain in the face of negative shocks.
29
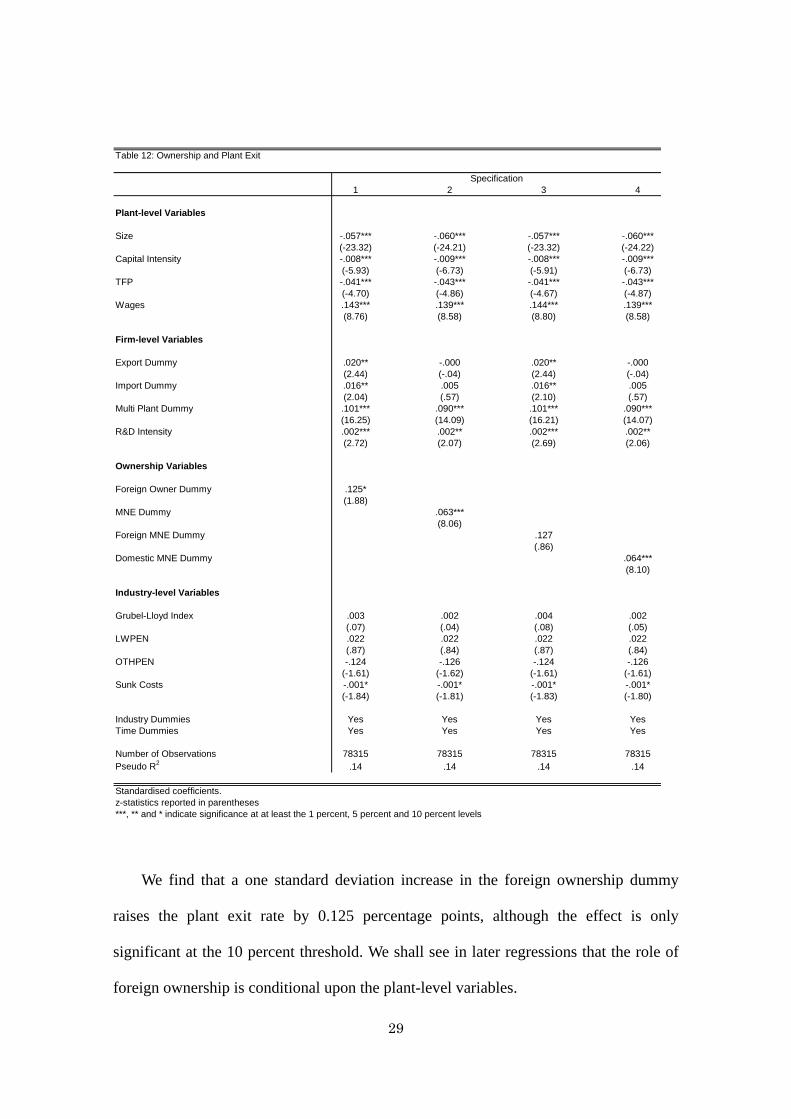
Table 12: Ownership and Plant Exit
Specification1 2 3 4
Plant-level Variables
Size -.057*** -.060*** -.057*** -.060***(-23.32) (-24.21) (-23.32) (-24.22)
Capital Intensity -.008*** -.009*** -.008*** -.009***(-5.93) (-6.73) (-5.91) (-6.73)
TFP -.041*** -.043*** -.041*** -.043***(-4.70) (-4.86) (-4.67) (-4.87)
Wages .143*** .139*** .144*** .139***(8.76) (8.58) (8.80) (8.58)
Firm-level Variables
Export Dummy .020** -.000 .020** -.000(2.44) (-.04) (2.44) (-.04)
Import Dummy .016** .005 .016** .005(2.04) (.57) (2.10) (.57)
Multi Plant Dummy .101*** .090*** .101*** .090***(16.25) (14.09) (16.21) (14.07)
R&D Intensity .002*** .002** .002*** .002**(2.72) (2.07) (2.69) (2.06)
Ownership Variables
Foreign Owner Dummy .125*(1.88)
MNE Dummy .063***(8.06)
Foreign MNE Dummy .127(.86)
Domestic MNE Dummy .064***(8.10)
Industry-level Variables
Grubel-Lloyd Index .003 .002 .004 .002(.07) (.04) (.08) (.05)
LWPEN .022 .022 .022 .022(.87) (.84) (.87) (.84)
OTHPEN -.124 -.126 -.124 -.126(-1.61) (-1.62) (-1.61) (-1.61)
Sunk Costs -.001* -.001* -.001* -.001*(-1.84) (-1.81) (-1.83) (-1.80)
Industry Dummies Yes Yes Yes YesTime Dummies Yes Yes Yes Yes
Number of Observations 78315 78315 78315 78315Pseudo R2 .14 .14 .14 .14
Standardised coefficients.z-statistics reported in parentheses***, ** and * indicate significance at at least the 1 percent, 5 percent and 10 percent levels
We find that a one standard deviation increase in the foreign ownership dummy
raises the plant exit rate by 0.125 percentage points, although the effect is only
significant at the 10 percent threshold. We shall see in later regressions that the role of
foreign ownership is conditional upon the plant-level variables.

30
Our findings for foreign ownership differ from what has been found in some other
studies. Mata and Portugal (2004) find that once firm characteristics are controlled for,
being foreign does not reduce the chances of exit in Portugal. Taymaz and Ozler (2007)
find that domestic firms have the same survival probability as foreign firms in Turkish
manufacturing industries once establishment characteristics are controlled for (as we
have done through the inclusion of the plant-level variables). Using data on Chilean
manufacturing plants, Alvarez and Görg (2009) find that foreign ownership only has a
positive effect upon plant exit during a significant downturn (the recession in the late
1990s in Chile). On average, they find that foreign ownership does not have a
significant impact upon plant exit.
However, Bernard and Sjohölm (2003) find, for Indonesia, that once the greater
size and labor productivity of foreign plants are controlled for, foreign plants are more
likely to exit. Even when a battery of other variables (such as inputs per employee) is
added to the specification, foreign firms remain 22 to 31 percent more likely to fail than
comparable domestic establishments.
In the specifications of Table 12 we investigate whether multinationals are more
likely to shut down plants. The MNE dummy enters significantly with a one standard
deviation increase raising exit by 0.063 percentage points. That is, if the exit rate was
initially 2 percent, such a change would raise it to 2.063 percent. Our finding indicates
that, in Japan, multinationals are more likely to close plants, even when we condition on
a raft of plant, firm and industry characteristics. Indeed, when we split the MNE dummy
31
into foreign and domestically owned multinationals, we do not find a significant effect
of foreign multinational ownership on plant exit. Rather, it is domestic MNEs which are
more likely to shut down plants with a one standard deviation increase in the domestic
MNE dummy causing 0.064 percentage points more exit.
The results are indicative of foreign MNEs setting up in Japan so they can access
the domestic market. A confounding reason could be that the rules and regulations laid
down by the Japanese government on the production of pharmaceutical products could
be driving the results11. However, the results remain robust to the exclusion of the
pharmaceutical industry from the regression.
Domestic multinationals are significantly more likely to close their Japanese plants.
A potential explanation could be that we are observing off shoring. We shall return to
this hypothesis in a later section when we look at the characteristics of the plants which
multinational-, and domestic-multi-plant, firms shut down.
It has been common throughout the literature to look at the unconditional
probability of exit. That is, are plants more likely to survive, or die, if they belong to a
certain type of firm, regardless of their plant characteristics? We employ two methods to
address this question. We first calculate the probability of exit, depending on ownership
type while holding the plant variables at their means. The figures in Table 13 show that,
for the average plant, which is foreign owned, the probability of exit is 0.0186. Plants
11 In order that a company can sell pharmaceutical goods in Japan, it must produce the drugs within Japan. Foreign firms must then set up production sites in Japan and cannot relocate their operations unless they wish to exit the Japanese market entirely.

32
with multinational owners are relatively more likely to exit than foreign owned plants
with a probability of 0.024. However, since the majority of multinationals in the sample
are Japanese, it is these that drive the result. Domestic multinationals’ plants face an exit
likelihood of 0.024 while for foreign-owned multinational plants the value is lower at
0.014.
The results in Table 13 highlight that once we control for plant characteristics,
domestic multinationals are more likely to close down their plants than foreign
multinationals or foreign owners. However, we are unable to say whether a specific
form of ownership significantly affects exit. To address this we drop the plant-level
variables and run the probit regressions including the ownership dummies. We can then
assess the determinants of exit without conditioning on plant characteristics. Results are
reported in Table 14.
Table 13: Plant Exit Probability and Ownership
Ownership Type
Foreign Owner Probability 95% Conf. Interval
Pr(Exit=1|x) .0186 [0.0100 , 0.0272]Pr(Exit=0|x) .9814 [0.9728 , 0.9900]
Multinational Owner
Pr(Exit=1|x) .0240 [0.0100 , 0.0272]Pr(Exit=0|x) .9760 [0.9728 , 0.9900]
Foreign Multinational Owner
Pr(Exit=1|x) .0140 [0.0038 , 0.0242]Pr(Exit=0|x) .9860 [0.9758 , 0.9962]
Domestic Multinational Owner
Pr(Exit=1|x) .0240 [0.0213 , 0.0267]Pr(Exit=0|x) .9760 [0.9733 , 0.9787]

33
When we omit the plant-level variables, we observe that multi-plant and domestic
MNE firms are more likely to close down their plants, regardless of the characteristics
of their plants. The multi-plant dummy remains positive and significant with a beta
coefficient of 0.091. Unlike in previous regressions, R&D intensity is now negatively
signed which aligns with Perez et al.’s (2004) findings for Spain which shows firms
engaged in R&D to be 57% less likely to fail. Our results point towards R&D playing a
role in attaining, or maintaining, a plant’s competitive edge. Of the ownership variables,
only the domestic multinational dummy has a significant influence on plant survival.
Foreign ownership and the foreign MNE dummy are both found to be insignificant.

34
Table 14: Unconditional Regressions of Ownership on Plant Exit
Specification1 2 3 4
Firm-level Variables
Export Dummy .005 .000 .005 .001(.70) (.03) (.72) (.06)
Import Dummy .002 -.000 .003 .000(.38) (-.01) (.43) (.02)
Multi Plant Dummy .091*** .090*** .090*** .090***(16.77) (15.71) (16.74) (15.76)
R&D Intensity -.001** -.002*** -.002** -.002***(-2.46) (-2.77) (-2.46) (-2.74)
Ownership Variables
Foreign Owner Dummy .082(1.51)
MNE Dummy .014**(2.19)
Foreign MNE Dummy .046(.41)
Domestic MNE Dummy .014**(2.10)
Industry-level Variables
Grubel-Lloyd Index -.006 -.007 -.005 -.006(-.15) (-.16) (-.13) (-.15)
LWPEN .023 .023 .023 .023(1.10) (1.10) (1.11) (1.10)
OTHPEN -.108 -.108 -.108 -.108(-1.56) (-1.56) (-1.56) (-1.55)
Sunk Costs -.001 -.001 -.001 -.001(-1.56) (-1.55) (-1.55) (-1.55)
Industry Dummies Yes Yes Yes YesTime Dummies Yes Yes Yes Yes
Number of Observations 78315 78315 78315 78315Pseudo R2 .06 .06 .06 .06
Standardised coefficients.z-statistics reported in parentheses***, ** and * indicate significance at at least the 1 percent, 5 percent and 10 percent levels
3.4. Firm's Export Orientation
Firms which engage in international trade are perceived to have traits that enable
them to overcome the fixed costs associated with entering a foreign market. Bernard and
Jensen (1995) established that exporting firms in the United States tended to be larger,
more productive and more capital intensive than non-exporters (further evidence is
surveyed in Greenaway and Kneller 2007). In light of these insights we incorporate
35
export status into our regressions since firms which export have ‘better’ characteristics
and may be less likely to close down their plants. We also consider whether plants
belonging to firms that import are less likely to exit. One could imagine that, like
exporting, importing carries sunk costs since a company must make contact with a
supplier abroad, then arrange for the possible customization and transportation of goods.
Importing firms would then be required to have higher productivity, or superior
characteristics, than a domestic firm that does not import.
Given the data available, we are restricted to looking at importing and exporting at
the firm level. We then construct four dummy variables: two-way trader, which takes a
value of 1 if the firm imports and exports, and zero otherwise, export only, which takes
a value of 1 if the firm only exports, import only, which is equal to 1 if the firm only
imports and domestic only which has a value of 1 if the firm neither imports nor exports.
Depending on the type of international trade a firm engages in, its plants are also
assumed to be of that type. We have 44,070 observations of two-way traders, 21580 of
plants which only export, 10,317 for plants that only import and 96,956 observations of
plants which do not trade internationally.
The results in Table 15 show that two-way traders, exporting only and importing
only plants are no less likely to exit than plants which exclusively serve the domestic
market. The plant and firm variables remain the most powerful determinants of exit.
Plants which belong to a multinational, or foreign, owned firm are more likely to exit
but importers or exporters see no difference in exit rates among their plants. The effect
of the firm being an importer, exporter or two-way trader, does not impact on exit above
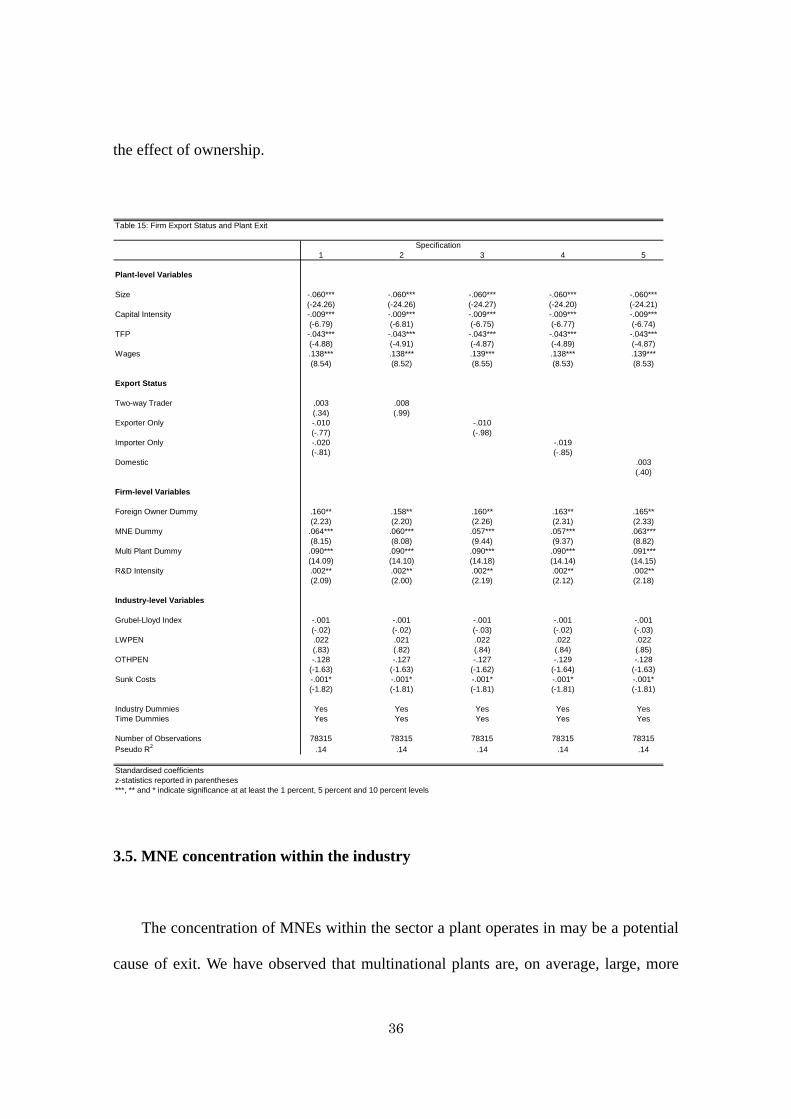
36
the effect of ownership.
Table 15: Firm Export Status and Plant Exit
Specification1 2 3 4 5
Plant-level Variables
Size -.060*** -.060*** -.060*** -.060*** -.060***(-24.26) (-24.26) (-24.27) (-24.20) (-24.21)
Capital Intensity -.009*** -.009*** -.009*** -.009*** -.009***(-6.79) (-6.81) (-6.75) (-6.77) (-6.74)
TFP -.043*** -.043*** -.043*** -.043*** -.043***(-4.88) (-4.91) (-4.87) (-4.89) (-4.87)
Wages .138*** .138*** .139*** .138*** .139***(8.54) (8.52) (8.55) (8.53) (8.53)
Export Status
Two-way Trader .003 .008(.34) (.99)
Exporter Only -.010 -.010(-.77) (-.98)
Importer Only -.020 -.019(-.81) (-.85)
Domestic .003(.40)
Firm-level Variables
Foreign Owner Dummy .160** .158** .160** .163** .165**(2.23) (2.20) (2.26) (2.31) (2.33)
MNE Dummy .064*** .060*** .057*** .057*** .063***(8.15) (8.08) (9.44) (9.37) (8.82)
Multi Plant Dummy .090*** .090*** .090*** .090*** .091***(14.09) (14.10) (14.18) (14.14) (14.15)
R&D Intensity .002** .002** .002** .002** .002**(2.09) (2.00) (2.19) (2.12) (2.18)
Industry-level Variables
Grubel-Lloyd Index -.001 -.001 -.001 -.001 -.001(-.02) (-.02) (-.03) (-.02) (-.03)
LWPEN .022 .021 .022 .022 .022(.83) (.82) (.84) (.84) (.85)
OTHPEN -.128 -.127 -.127 -.129 -.128(-1.63) (-1.63) (-1.62) (-1.64) (-1.63)
Sunk Costs -.001* -.001* -.001* -.001* -.001*(-1.82) (-1.81) (-1.81) (-1.81) (-1.81)
Industry Dummies Yes Yes Yes Yes YesTime Dummies Yes Yes Yes Yes Yes
Number of Observations 78315 78315 78315 78315 78315Pseudo R2 .14 .14 .14 .14 .14
Standardised coefficientsz-statistics reported in parentheses***, ** and * indicate significance at at least the 1 percent, 5 percent and 10 percent levels
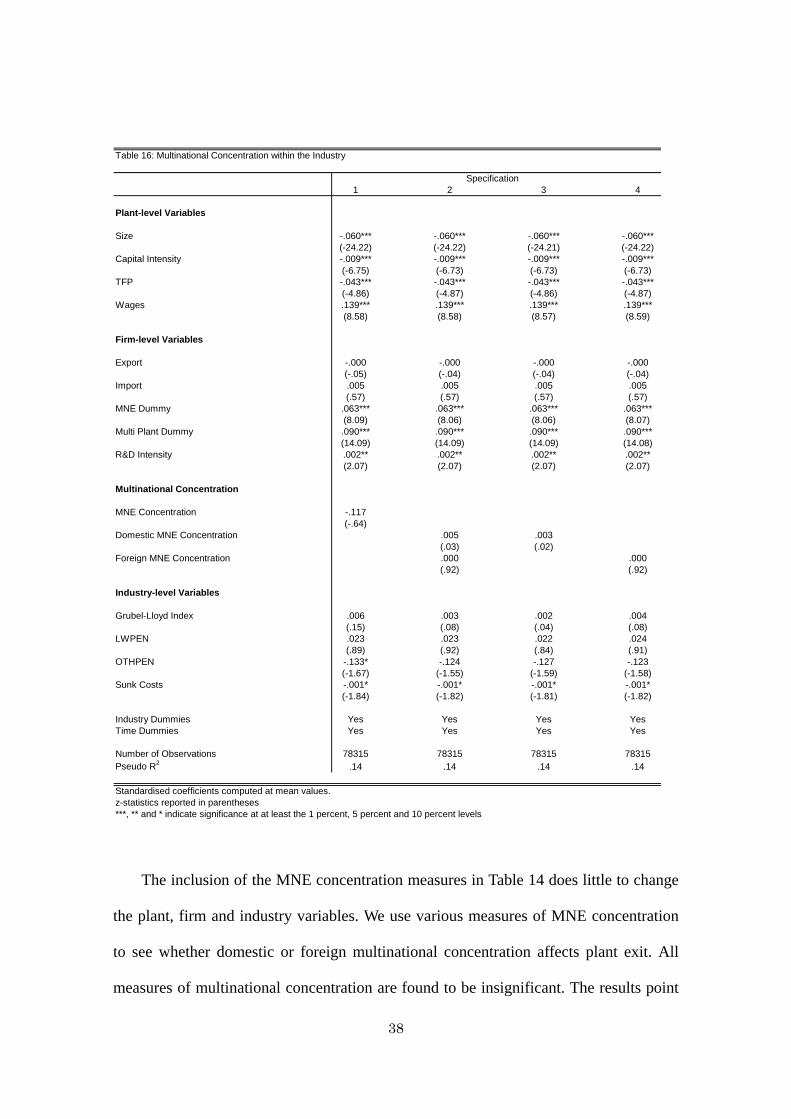
3.5. MNE concentration within the industry
The concentration of MNEs within the sector a plant operates in may be a potential
cause of exit. We have observed that multinational plants are, on average, large, more

37
capital intensive and more productive than domestic plants. They are also backed by a
firm infrastructure which may open new markets and opportunities. Single plant firms
and other non-MNE plants may struggle to survive when confronted by such
competition. To investigate this we include MNE concentration in our regressions using
the following measure
⎟⎟⎠
⎞⎜⎜⎝
⎛=
it
itit EmployeesTotal
EmployeesMNETotalionConcentratMNE_
__log_
where MNE_Concentrationit is the concentration of MNEs in industry i at time t,
Total_MNE_Employeesit denotes the total number of workers employed by
multinationals in industry i at time t and Total_Employeesit denotes the total number of
people employed in industry i at time t.
38
Table 16: Multinational Concentration within the Industry
Specification1 2 3 4
Plant-level Variables
Size -.060*** -.060*** -.060*** -.060***(-24.22) (-24.22) (-24.21) (-24.22)
Capital Intensity -.009*** -.009*** -.009*** -.009***(-6.75) (-6.73) (-6.73) (-6.73)
TFP -.043*** -.043*** -.043*** -.043***(-4.86) (-4.87) (-4.86) (-4.87)
Wages .139*** .139*** .139*** .139***(8.58) (8.58) (8.57) (8.59)
Firm-level Variables
Export -.000 -.000 -.000 -.000(-.05) (-.04) (-.04) (-.04)
Import .005 .005 .005 .005(.57) (.57) (.57) (.57)
MNE Dummy .063*** .063*** .063*** .063***(8.09) (8.06) (8.06) (8.07)
Multi Plant Dummy .090*** .090*** .090*** .090***(14.09) (14.09) (14.09) (14.08)
R&D Intensity .002** .002** .002** .002**(2.07) (2.07) (2.07) (2.07)
Multinational Concentration
MNE Concentration -.117(-.64)
Domestic MNE Concentration .005 .003(.03) (.02)
Foreign MNE Concentration .000 .000(.92) (.92)
Industry-level Variables
Grubel-Lloyd Index .006 .003 .002 .004(.15) (.08) (.04) (.08)
LWPEN .023 .023 .022 .024(.89) (.92) (.84) (.91)
OTHPEN -.133* -.124 -.127 -.123(-1.67) (-1.55) (-1.59) (-1.58)
Sunk Costs -.001* -.001* -.001* -.001*(-1.84) (-1.82) (-1.81) (-1.82)
Industry Dummies Yes Yes Yes YesTime Dummies Yes Yes Yes Yes
Number of Observations 78315 78315 78315 78315Pseudo R2 .14 .14 .14 .14
Standardised coefficients computed at mean values.z-statistics reported in parentheses***, ** and * indicate significance at at least the 1 percent, 5 percent and 10 percent levels
The inclusion of the MNE concentration measures in Table 14 does little to change
the plant, firm and industry variables. We use various measures of MNE concentration
to see whether domestic or foreign multinational concentration affects plant exit. All
measures of multinational concentration are found to be insignificant. The results point

39
towards MNE ownership, and specifically domestic MNE ownership, rather than the
influence of MNEs within the industry being responsible for plant exit.
Non-multinational plants are no more likely to exit when there is an increase in the
concentration of multinationals within the sector they operate.
3.6. Plant Characteristics Relative to the Firm Average
Our dataset matches plant-level information to firm-level data. This allows us to
look within the firm and compare the features of the plants which exit with those that
the firm maintains operational. Specifically, we restrict the sample to multi-plant firms.
We then look at how the plant variables relative to the firm variables differ between
multi-plant MNE and non-MNE firms. Since the plant TFP variable is measured relative
to the sector in which it operates, and firms may have plants in different sectors, we
drop plant TFP from the regressions. The results are reported in Table 17.
Plants that are large relative to the rest of the firm are less likely to exit. The effect
is more pronounced for non-multinational plants. A one standard deviation increase in
the size ratio reduces the likelihood of exit by 0.44 and 0.61 percentage points for MNE
and non-MNE owned plants. In the earlier regressions, plant capital intensity was found
to be a negative determinant of exit. Within multi-plant firms this ceases to be the case.
Relatively more capital intensive plants are less likely to exit, regardless of
multinational status. However, MNE plants that are more capital intensive relative to the
firm are 0.033 percentage points less likely to exit following a standard deviation
increase in the plant-firm capital intensity variable. For non-MNEs the effect is more

40
muted, with a beta coefficient of -0.023.
Previously we had seen that high wage plants were more likely to exit. This
remains true, but only among MNE plants. For a one standard deviation increase in
wages at MNE owned plants relative to the firm, exit rises by 0.12 percentage points.
The same effect is not found among non-MNE multi-plant firms. Plants which pay
relatively higher wages in these businesses are no more likely to exit. The reason for the
differences may be that MNEs can relocate production to low-wage sites abroad and
close their high-wage Japanese plants. Domestic multi-plant firms may relocate workers,
or output, between their plants rather than close them.

41
Table 17: Within Multiplant Firm Exit Regressions
Firm TypeMultinational Non-Multinational
Plant-level Variables
Sizeplant/Sizefirm -.044*** -.061***(-16.53) (-12.32)
Cap Intensityplant/Cap Intensityfirm -.033*** -.023***(8.09) (6.35)
Wagesplant/Wagesfirm .120*** -.026(4.26) (-1.21)
Firm-level Variables
Export Dummy .041 -.051**(1.12) (-2.03)
Import Dummy -.016 -.003(-.80) (-.13)
R&D Intensity -.011*** -.000(-4.05) (-.12)
Industry-level Variables
Grubel-Lloyd Index .021 .112(.18) (.75)
LWPEN .044 .074(.85) (1.07)
OTHPEN -.068 -.781**(-.46) (-2.48)
Sunk Costs -.002* .001(-1.80) (.42)
Industry Dummies Yes YesTime Dummies Yes Yes
Number of Observations 28463 19840Pseudo R2 .12 .11
Standardised coefficients.z-statistics reported in parentheses***, ** and * indicate significance at at least the 1 percent, 5 percent and 10 percent levels
The firm-level variables also reveal that within multi-plant firms, MNE status can
have differing impacts on plant exit. Plants belonging to multi-plant MNE firms which
engage in R&D are less likely to exit. A standard deviation increase in R&D intensity at
the average multi-plant multinational reduces the exit risk by 0.011 percentage points.
R&D intensity does not have a significant effect on plants belonging to

42
non-multinational multi-plant firms.
In earlier regressions we found that the exporter dummy was only ever significant
when the MNE dummy was excluded. Here we find that among non-MNE multi-plant
firms, plant exit is less likely when the firm is an exporter. The result is consistent with
other findings in the literature. Since exporting constitutes domestic firm’s route to the
foreign market, those that export benefit from operating in more markets. They are also
likely more productive relative to firms that only serve the domestic market.
High sunk costs help ameliorate the chance of exit only among MNE plants. This
suggests that MNE plants are established primarily in sectors with higher barriers to
entry, although the effect is only significant at 10 percent. Among domestic multi-plant
firms OTHPEN reduces exit. The same is not true for MNE plants which are unaffected
by this kind of import penetration. Perhaps this is because domestic plants are more
reliant upon imported components while MNE plants can buy components from other
MNE plants within the firm which are located abroad.
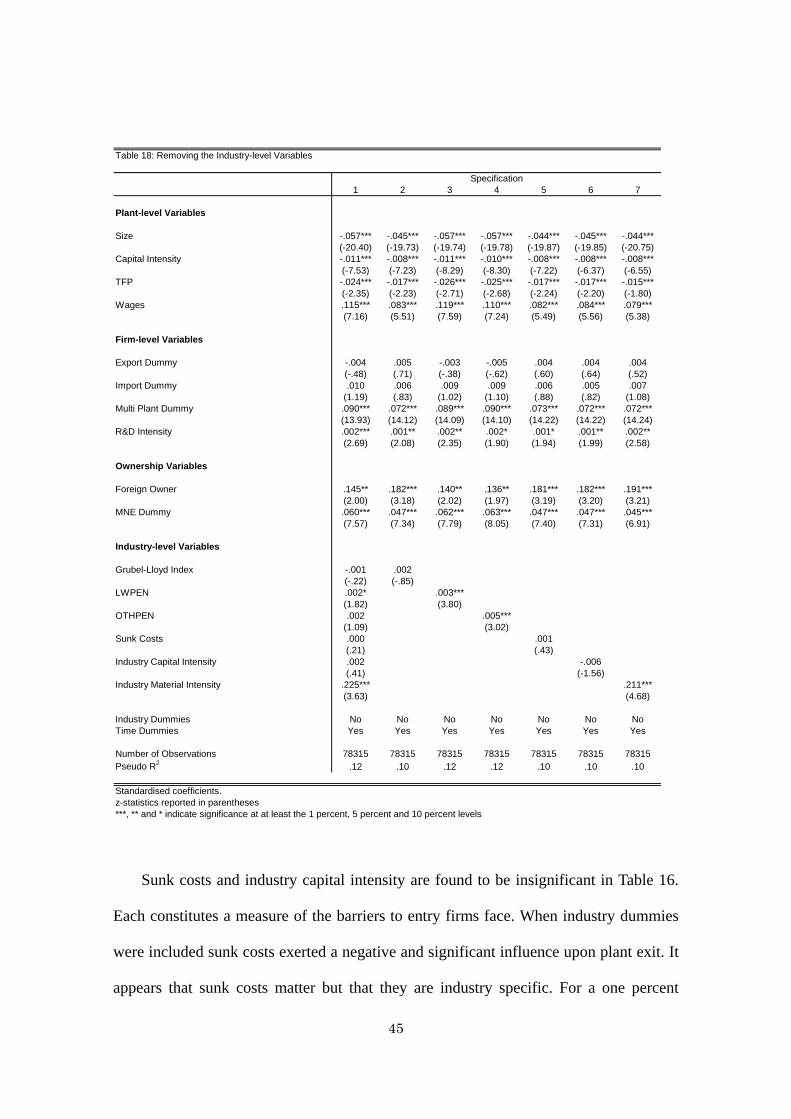
3.7. Modeling the Industry Dummies with Industry Variables
So far the industry variables have been picking up within industry variation in
intra-industry trade, import penetration and sunk costs. We now remove the industry
dummies and attempt to model them using industry-level variables. This allows us to
look at how cross-industry variation in the industry variables affects them. In addition to
the four industry variables used previously, we introduce two more: industry capital

43
intensity and industry material intensity.
Industry capital intensity is defined as
( )
( ) ⎟⎟⎟⎟⎟
⎠
⎞
⎜⎜⎜⎜⎜
⎝
⎛
=
∑
∑
=
=N
jijt
N
jijt
it
LabourPlant
CapitalPlantIntensityCapital
1
1
_
_log_
where Capital_Intensityit is the capital intensity of industry i at time t which is
calculated by summing the capital of all plants in industry i during time t divided by the
sum of labor in all plants of industry i during period t.
A measure of industry material (or input) intensity is also included. Material
intensity is defined as
( )
( ) ⎟⎟⎟⎟⎟
⎠
⎞
⎜⎜⎜⎜⎜
⎝
⎛
=
∑
∑
=
=N
jijt
N
jijt
it
SalesPlant
InputsPlantIntensityMaterial
1
1
_
_log_
where Material_Intensityit denotes the input intensity of industry i during time t,
Plant_Inputsijt represents plant j’s inputs at time t in industry i and Plant_Salesijt denotes
plant j’s sales at time t in industry i.
Again we use a probit model and include the plant, firm and all the industry
variables. Seven specifications are run. The first includes all the industry variables while

44
the remaining six include the industry variables one at a time. The plant variables
remain essentially the same as before:
Unlike previously, we now observe that low-wage import penetration has a positive
effect upon exit. This arises from the cross industry variation in LWPEN. The impact is
small with a standard deviation increase raising exit by 0.002 percentage points,
equivalent to about 0.1 percent of the average exit rate. The variable is also only
significant at the 10 percent level when we condition upon the other industry variables.
When LWPEN is included as the sole industry variable in column 3 it becomes highly
significant, but the estimated coefficient remains small at 0.003. In column 4 we see that
across sectors, OTHPEN positively affects exit. Again the effect is due to cross-industry
variation. The result without industry dummies may suggest that exit rises due to the
switching of plants between industries as international trade increases.
45
Table 18: Removing the Industry-level Variables
Specification1 2 3 4 5 6 7
Plant-level Variables
Size -.057*** -.045*** -.057*** -.057*** -.044*** -.045*** -.044***(-20.40) (-19.73) (-19.74) (-19.78) (-19.87) (-19.85) (-20.75)
Capital Intensity -.011*** -.008*** -.011*** -.010*** -.008*** -.008*** -.008***(-7.53) (-7.23) (-8.29) (-8.30) (-7.22) (-6.37) (-6.55)
TFP -.024*** -.017*** -.026*** -.025*** -.017*** -.017*** -.015***(-2.35) (-2.23) (-2.71) (-2.68) (-2.24) (-2.20) (-1.80)
Wages .115*** .083*** .119*** .110*** .082*** .084*** .079***(7.16) (5.51) (7.59) (7.24) (5.49) (5.56) (5.38)
Firm-level Variables
Export Dummy -.004 .005 -.003 -.005 .004 .004 .004(-.48) (.71) (-.38) (-.62) (.60) (.64) (.52)
Import Dummy .010 .006 .009 .009 .006 .005 .007(1.19) (.83) (1.02) (1.10) (.88) (.82) (1.08)
Multi Plant Dummy .090*** .072*** .089*** .090*** .073*** .072*** .072***(13.93) (14.12) (14.09) (14.10) (14.22) (14.22) (14.24)
R&D Intensity .002*** .001** .002** .002* .001* .001** .002**(2.69) (2.08) (2.35) (1.90) (1.94) (1.99) (2.58)
Ownership Variables
Foreign Owner .145** .182*** .140** .136** .181*** .182*** .191***(2.00) (3.18) (2.02) (1.97) (3.19) (3.20) (3.21)
MNE Dummy .060*** .047*** .062*** .063*** .047*** .047*** .045***(7.57) (7.34) (7.79) (8.05) (7.40) (7.31) (6.91)
Industry-level Variables
Grubel-Lloyd Index -.001 .002(-.22) (-.85)
LWPEN .002* .003***(1.82) (3.80)
OTHPEN .002 .005***(1.09) (3.02)
Sunk Costs .000 .001(.21) (.43)
Industry Capital Intensity .002 -.006(.41) (-1.56)
Industry Material Intensity .225*** .211***(3.63) (4.68)
Industry Dummies No No No No No No NoTime Dummies Yes Yes Yes Yes Yes Yes Yes
Number of Observations 78315 78315 78315 78315 78315 78315 78315Pseudo R2 .12 .10 .12 .12 .10 .10 .10
Standardised coefficients.z-statistics reported in parentheses***, ** and * indicate significance at at least the 1 percent, 5 percent and 10 percent levels
Sunk costs and industry capital intensity are found to be insignificant in Table 16.
Each constitutes a measure of the barriers to entry firms face. When industry dummies
were included sunk costs exerted a negative and significant influence upon plant exit. It
appears that sunk costs matter but that they are industry specific. For a one percent

46
increase in industry material intensity exit increases 0.011 percent. Material intensity is
taken to be a proxy for industry profitability. Where more inputs are required in the
production process, the profits firms can make are reduced. The positive coefficient
implies that industries with low profitability see more plants exiting. If we include the
industry dummies, industry material intensity ceases to be significant meaning that the
effect is a cross-, rather than, within-industry result.
4. Productivity Decompositions
So far the analysis has centered upon the determinants of plant exit. We have
established how plant-, firm- and industry-variables affect plant exit. The next step is to
investigate whether plant exit has an effect upon Japanese productivity growth in the
recent years. We specifically ask whether multinational plant exit affects productivity
differently to non-MNE plant exit.
Japanese productivity growth has been notoriously slow in the 1990s. In our sample
we estimate productivity growth across the 51 industries to be 6 percent over the years
1994-2005. A potential explanation of the sluggish productivity growth could be that
firms are off shoring the most productive plants to China and other low-wage East
Asian countries.
To tackle the issue we decompose productivity into four components: within firm
productivity growth, between firm reallocations of market share, entry of new plants
and the exit of existing ones using a modification of the Griliches and Regev (1995)

47
approach. We amend the Griliches and Regev methodology to split the exit component
into MNE and non-MNE parts. The MNE component includes domestic, and foreign,
multinationals. We subsequently decompose the MNE exit component into domestic
and foreign shares. This permits inspection of whether multinationals have been off
shoring their most productive Japanese plants.
Productivity is decomposed using the following method
( ) ( ) ( )
( )∑
∑∑∑∑−−
−−−+−Δ+Δ=Δ
−−
−−
exitMNEnonkitkit
exitMNEkitkit
enrtyitit
betweeniit
withinitit
Pp
PpPpPppP
__
_
θ
θθθθ
where Δ denotes changes over k years interval between the first year (t-k) and the last
year t, itθ is plant i's market share in the given industry at time t, ip is the
productivity of plant i, P is aggregated productivity of the industry and a bar denotes
averaging between (t-k) and t.
The within component represents productivity growth within plants, the between
component constitutes the reallocation of market share across plants in the industry and
the entry component denotes the productivity effect of new plants in the industry. The
exit component is split in two so that we may disentangle the impact of MNE and
non-MNE plant exit on aggregate productivity. Results of the decomposition are
reported in Table 19.

48
Table 19: Griliches and Regev (1995) Productivity Decomposition
Productivity Component Obs Mean
Within Plant 143725 .14
Between Plant 143725 .82
Entry 143725 .01
MNE Plant Exit 143725 .01
Non-MNE Plant Exit 143725 .01
The bulk of productivity growth arose from reallocations of market share from less
productive, to more productive firms. Between firm reallocations of market share
accounted for 82 percent of productivity growth. Productivity growth within plants
accounted for 14 percent of aggregate productivity growth. The entry and exit
components are more modest with values of 1 percent for entry and both forms of plant
exit. The result shows that entering plants enter with above average industry
productivity while exiting plants tend to have below average industry productivity
which points to multinationals closing down less productive plants. This may provide
some evidence that MNEs choose to keep their most efficient Japanese plants open,
rather than move them abroad. Less productive plants are more likely to exit, although
due to the nature of the available data, we cannot say whether they are off shored. Given
that exiting MNE plants account for approximately one third of all exit, we can say that
multinational plant exit has a greater influence on aggregate productivity than non-MNE
exit.
When we classify multinationals as being “domestic” or “foreign” owned, where a

49
plant is deemed to be foreign owned if more than 50 percent of the firm that owns it is
held by foreigners. The results in Table 20 show that it is the exit of Japanese (domestic)
plants which contributes positively to productivity. The exit of foreign plants has
essentially no impact on productivity.
Table 20: Domestic and Foreign MNE Exit
Productivity Component Obs Mean
Within Plant 143725 .14
Between Plant 143725 .82
Entry 143725 .01
Domestic MNE Plant Exit 143725 .01
Foreign MNE Plant Exit 143725 .00
Non-MNE Plant Exit 143725 .01
We elaborate the productivity decompositions in Table 21 and split the within,
between and entry components into MNE and non-MNE parts (the MNE component
again includes all multinationals, domestic and foreign). In general, it is the non-MNE
component of each element of productivity that has a greater bearing on aggregate
productivity. Plant productivity within multinationals is estimated to contribute 4
percent of the growth in productivity while in non-MNEs the contribution is 10 percent.
Likewise, the non-MNE part of the between plant variable accounts for 56 percent of
aggregate productivity growth which is almost double the contribution of the
multinational part.

50
Table 21: Multinational / Non-Multinational Productivity Decomposition
Productivity Component Obs Mean
MNE W ithin Plant 143725 .04
Non-MNE W ithin Plant 143725 .10
MNE Between Plant 143725 .27
Non-MNE Between Plant 143725 .56
MNE Plant Entry 143725 .00
Non-MNE Plant Entry 143725 .01
MNE Plant Exit 143725 .01
Non-MNE Plant Exit 143725 .01
These findings suggest that multinationals may already be more productive than
non-multinational plants (a fact confirmed by t-tests later in the chapter) and that
subsequently, the rate of productivity growth in such plants is slower. It is also evident
from the magnitude of the between plant productivity component that reallocations of
market share across establishments are the prime mechanism which drive productivity
in Japan over the period. However, while reallocations of output towards MNEs are
found to be important, the key effect stems from reallocations of output from less- to
more-productive non-multinational plants. Since multinational plants are, on average,
more productive than non-MNEs, reallocations of market share have a less pronounced
impact than reallocations away from the least productive non-MNE plants. Plants whose
operations are solely domestic tend to be the least productive establishments meaning
that displacement of their market share has the largest bearing on productivity12.
12 The results of the Griliches and Regev decomposition are broadly the same when only multi-plant firms are considered. The within- and between-plant components, together, account for 95 percent of productivity growth. Exit is found to account for approximately 3 percent of productivity growth among multi-plant firms.

51
Another technique which may be used to decompose productivity is the Foster,
Haltiwanger and Krizan (1998) (FHK) methodology. There are slight, yet significant,
differences between this and the Griliches and Regev (1995) formulation. The formula
is as follows
( )
( ) ( )∑∑
∑∑∑
−−−−
−−−
−−−+
ΔΔ+−Δ+Δ=Δ
Exitktkitkit
Entryktitit
Continueitit
Continuektkitit
Continueitkitt
PpPp
pPppP
θθ
θθθ
The Foster et al. methodology contains three “continue” terms which broadly
correspond to the within and between components of the Griliches and Regev
formulation. However, base-year market shares are used as weights for each term, and
an additional term, that combines changes in market shares and changes in productivity,
is also included. A downside to the FHK formulation is that in the presence of
measurement error, in market shares and productivity, the cross-product term will tend
to exacerbate the effect. Owing to the correlation between productivity and market share,
this may affect the within- and between-plant effects. This problem is partially dealt
with in the Griliches and Regev framework through the averaging of market shares
across periods.
Table 22 chronicles the results of the FHK decomposition. As in the Griliches and
Regev decomposition, the two continuing terms and the cross-product variable (which
correspond to the within- and between-plant components) account for the bulk of the

52
growth in productivity. Plant entry again contributes positively to aggregate productivity
growth, as does non-MNE plant exit. However, MNE plant exit is found to lower
aggregate productivity which could hint at off shoring.
Table 22: Foster, Haltiwanger and Krizan (1998) Productivity Decomposition
Productivity Component Obs Mean
Continue 1 144204 -.15
Continue 2 144204 .95
Cross-Product Term 144204 .19
Plant Entry 144204 .02
MNE Plant Exit 144204 -.01
Non-MNE Plant Exit 144204 .01
Despite the effect of multinational plant exit having a rather muted effect on
aggregate productivity in both the Griliches and Regev and FHK frameworks, each
methodology produces an answer with a different sign. The FHK result suggests that
while multinationals may not offshore their most productive units, they might choose to
relocate relatively less productive units abroad, or simply close them down. We build
upon these insights by first establishing what the determinants of plant exit are and then
direct our attention towards off shoring through the use of input-output tables. However,
first we offer a description of the unique dataset we use and some of its features.

53
5. Conclusion
The paper debases some of the myths about Globalization. For example, the media
portray foreign multinationals as closing down productive Japanese plants and
relocating them elsewhere in Asia. We find that this is not the case. Our results confirm
that plants which are large, capital intensive and productive relative to the industry are,
on average, less likely to exit.
We find that high wage plants more likely to exit. The plants which are owned by
firms engaged in international trade no less likely to exit than plants which exclusively
serve the domestic market. Multi-plant firms and those with high R&D expenditure are
also more likely to shut down plants. However, our results also indicate that R&D plays
a role in maintaining plants in competitive edge.
We also find that Japanese multinationals more likely to close plants, even when we
condition on a raft of plant, firm and industry characteristics.
The plants that are closed are below average productivity and the exit component
contributes a very small fraction to productivity growth (using both the GR and FHK
methods). In short, plant exit has not been the reason for Japan's poor productivity
growth. Instead a lack of productivity growth within plants is identified as being the
main cause.
Although we present new evidence on the impact of Globalization on the domestic
economy, there is much that can be done to improve upon our finding. Two avenues of
research come into mind. The first issue that needs to be taken up in future research is
the differences in technological advancement by industries. Since our research
perspective is the macro-level impact of Globalization based on micro data, our
empirical investigation is conducted by pooling whole manufacturing plants. However,

54
the impact might differ from industry to industry. Therefore, further investigation by
industry might be helpful for the understanding of the nature of the impact of
Globalization. The second avenue is to examine the impact of multinationals’ activity on
the changes in production and employment of non-multinationals. We demonstrate by
productivity decomposition that entry and exit are not the primary contributors of
macro-level productivity growth, but rather changes in the share of each plant play an
important role in aggregate productivity enhancement. Thus, the impact of
Globalization on the changes in production and employment at plant –level might be
another avenue for future research.
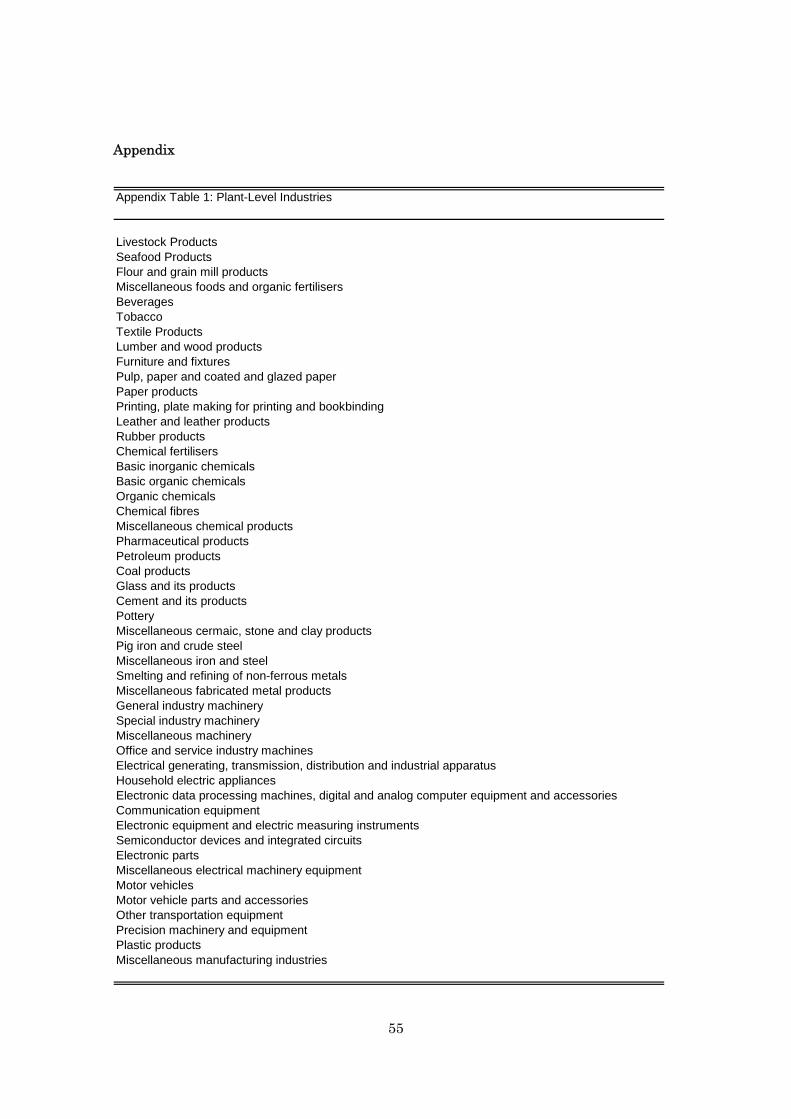
55
Appendix
Appendix Table 1: Plant-Level Industries
Livestock ProductsSeafood ProductsFlour and grain mill products Miscellaneous foods and organic fertilisersBeveragesTobaccoTextile ProductsLumber and wood productsFurniture and fixturesPulp, paper and coated and glazed paperPaper productsPrinting, plate making for printing and bookbindingLeather and leather productsRubber productsChemical fertilisersBasic inorganic chemicalsBasic organic chemicalsOrganic chemicalsChemical fibresMiscellaneous chemical productsPharmaceutical productsPetroleum productsCoal productsGlass and its productsCement and its productsPotteryMiscellaneous cermaic, stone and clay productsPig iron and crude steelMiscellaneous iron and steelSmelting and refining of non-ferrous metalsMiscellaneous fabricated metal productsGeneral industry machinerySpecial industry machineryMiscellaneous machineryOffice and service industry machinesElectrical generating, transmission, distribution and industrial apparatusHousehold electric appliancesElectronic data processing machines, digital and analog computer equipment and accessoriesCommunication equipmentElectronic equipment and electric measuring instrumentsSemiconductor devices and integrated circuitsElectronic partsMiscellaneous electrical machinery equipmentMotor vehiclesMotor vehicle parts and accessoriesOther transportation equipmentPrecision machinery and equipmentPlastic productsMiscellaneous manufacturing industries

56
Reference
Alvarez, R., and H. Görg, (2009) “Multinationals and plant exit: Evidence from Chile,”
International Review of Economics and Finance, 18(1), pp.45-51
Aw, B. Y., S. Chung, and M. J. Robers, (2002) "Productivity, Output, and Failure: A
Comparison Of Taiwanese And Korean Manufactures," Economic Journal, 113,
pp.F485-510
Bandick, R., (2007) " Multinationals and Plant Survival in Swedish manufacturing,"
The University of Nottingham Research Paper, 2007/31
Bernard, A. B, and J. B. Jensen, (1995) “Exporters, Jobs, and Wages in US
Manufacturing, 1976-1987,” Brookings Papers on Economic Activity,
Microeconomics, pp.67-119
Bernard, A. B, and J. B. Jensen, (2002) “The Deaths of Manufacturing Plants,” NBER
Working Paper, No.9026
Bernard, A. B, and J. B. Jensen, (2007) “Firm Structure, Multinationals and
Manufacturing Plant Death,” Review of Economics and Statistics, 89(2), pp.193-204
Bernard, A. B., J. B. Jensen, and P. K. Schott, (2006a) “Survival of the best fit:
Exposure to low-wage countries and the (uneven) growth of U.S. manufacturing
plants,” Journal of International Economics, 68(1), pp.219-237
Bernard, A. B., J. B. Jensen, and P. K. Schott, (2006b) “Trade Cost, Firms and
Productivity,” Journal of Monetary Economics, 53, pp.917-937

57
Bernard, A. B., and F. Sjӧholm, (2003) “Foreign Owners and Plant Survival,” NBER
Working Paper, No.10039
Bartelsman, E., and M. Doms, (2000) “Understanding Productivity: Lessons from
Longitudinal Microdata,” Journal of Economic Literature, 38(2), 569-594
Caves, D., L. Christensen, and M. Tretheway, (1983) “Productivity Performance of U.S.
Trunk and Local Service Airline in the Era of Deregulation,” Economic Inquire.
21, pp.312-324
Caves, D., L. Christensen, and W. Diewert, (1982) “Output, Input and Productivity
Using Superlative Index Numbers,” Economic Journal, 92, pp.96
Crisculo, P., J. Haskel, and R. Martin, (2004) “Import Competition, Productivity, and
Restructuring in UK Manufacturing,” Oxford Economic Policy Review, 20(3),
pp.93-408
Disney, R., J. Haskel, and Y. Heden, (2003) “Restructuring and Productivity Growth in
UK Manufacturing,” Economic Journal, 113, pp.666-694
Dunne, T. M. J. Roberts, and L. Samuelson, (1988) “Patterns and Firm Entry and Exit in
US Manufacturing Industries,” Rand Journal of Economics, 19(4), pp.495-515
Dunne, T. M. J. Roberts, and L. Samuelson, (1989) “The Growth and Failure of US
Manufacturing Plants,” Quarterly Journal of Economics, 104(4), pp.671-698
Flamm, K., (1984) “The volatility of offshore investment,” Journal of Development
Economics, 16(3), pp.231-248
Fukao, K., and H. U. Kwon, (2006) “Why Did Japan’s TFP Growth Slow Down in the
Lost Decade? An Empirical Analysis Based on Firm-Level Data of
Manufacturing Firms,” The Japanese Economic Review, 57(2), 195-227.
Foster, L., J. Haltiwanger and C.J. Krizan, (1998) "Aggregate Productivity Growth:
58
Lessons from Microeconomic Evidence," NBER working paper, No.6803
Gibson, J. K., and, R. I. D. Harris, (1996), "Trade Liberalisation and Plant Exit in New
Zealand Manufacturing," The Review of Economics and Statistics, 78(3),
pp.521-529
Girma, S., and H. Görg, (2004), "Outsourcing, Foreign Ownership, and Productivity:
Evidence from UK Establishment-level Data," Review of International Economics,
12(5), pp.817-832,
Good, D., I. Nadri, L. Roeller and R. Sickles, (1983) “Efficiency and Productivity
Growth comparisons of European and U.S/ Air Carriers: A First Look at the Data,”
Journal of Productivity analysis, 4(1_2), pp.115-125
Gӧrg, H. and E. Strobl, (2003) “Footloose Multinationals?” The Manchester School,
71(1), pp.1-19
Greenaway, D., J. Gullstrand, and R. Kneller, (2008) “Surviving Globalization,”
Journal of International Economics, 74(2), pp.264-277
Greenaway, D., and R. Kneller, (2007) “Firm Heterogeneity, Exporting and Foreign
Direct Investment,“ Economic Journal, 117, pp.F134-F161
Griliches, Z., and H. Regev, (1995) “Firm Productivity in Israeli Industry: 1979-1988,”
Journal of Econometrics, 65(1), pp.175-203
Grubel, H. G., and Lloyd, P. J., (1975), Intra-Industry Trade: The Theory and
Measurement of International Trade in Differential Products. London, Macmillan
Hayakawa, K., F. Kimura and T. Machikita, (2009) “Firm-level Analysis of
Globalization: A Survey,” ERIA Discussion Paper, 2009-05
Helpman, E., M. Melitz, and S. Yeaple, (2004) “Export versus FDI with Heterogeneous
Fimrs,” American Economic Review, 94(1), pp.300-316

59
Lileeva, A., (2008) “Trade Liberalization and Productivity Dynamics: Evidence from
Canada,” Canadian Journal of Economics, 41(2), pp.360-390
Mata, J and P. Portugal, (2004) “Patterns of Entry, Post-Entry Growth and Survival: A
Comparison between Domestic and Foreign Owned Firms,” Small Business
Economics, 22(3_4), pp.283-298
Melitz, M., (2003) “The Impact of Trade on Intra-Industry Reallocations and Aggregate
Industry Productivity,” Econometrica, 71(6), 1695-1725
Melitz, M., and G. I. P. Ottaviano, (2005) “Market Size, Trade and Productivity,” NBER
Working Paper, No.11393.
Nishimura, K. , T. Nakajima and K. Kiyota (2005) “Does the Natural Selection
Mechanism Still Work in Severe Recessions? Examination of the Japanese
Economy in the 1990s,” Journal of Economic Behavior and Organization, 58(1),
pp.53-78.
Perez, S. E., A. S. Llopis, and J. A. S. Llopis, (2004) " The Determinants of Survival of
Spanish Manufacturing Firms," Review of Industrial Organization, 25(3),
pp.251–273
Roberts, M. J., and J. R. Tybout, (1997) "The Decision to Export in Colombia: An
Empirical Model of Entry with Sunk Cost," American Economic Review, 87(4), pp.
545-564
Taymaz, E., and S. Özler, (2007) “Foreign Ownership, Competition, and Survival
Dynamics,” Review of Industrial Organization, 31(1), pp.23-42