globally confronting the challenge of governance and corruption: an empirical framework with...
Post on 21-Dec-2015
217 views
TRANSCRIPT
Globally Confronting the Challenge of Governance and Corruption:
An Empirical Framework with Practical
Applications
1

A ‘Live’ Test: ‘Cultural Determinism’ or A ‘Live’ Test: ‘Cultural Determinism’ or Information and Incentives...Information and Incentives...
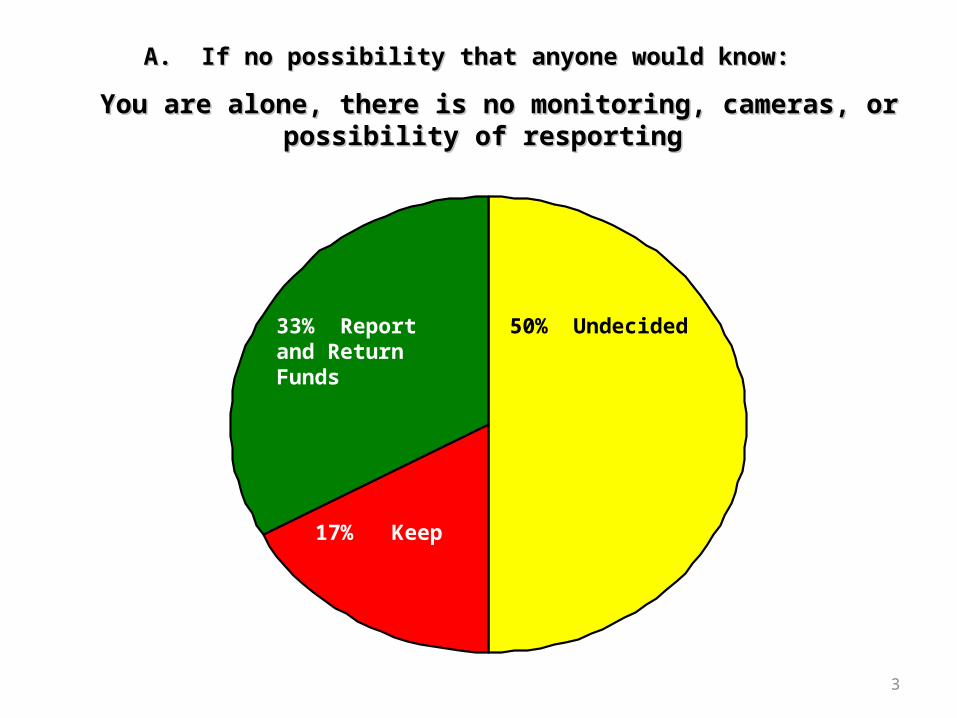
• You are approaching your car in the empty and You are approaching your car in the empty and unattended garage late at night unattended garage late at night
• You see an envelope on the floor, and you pick it upYou see an envelope on the floor, and you pick it up
• It contains 20 bills of US $100 each. It contains 20 bills of US $100 each.
• If no possibility that anyone would know: No cameras, If no possibility that anyone would know: No cameras, no monitoring, no reportingno monitoring, no reporting
• What would you do with such envelope full of What would you do with such envelope full of cash?cash?
2
3
50% Undecided 33% Report and Return Funds
17% Keep
A. If no possibility that anyone would know:A. If no possibility that anyone would know:
You are alone, there is no monitoring, cameras, or possibility of resportingYou are alone, there is no monitoring, cameras, or possibility of resporting
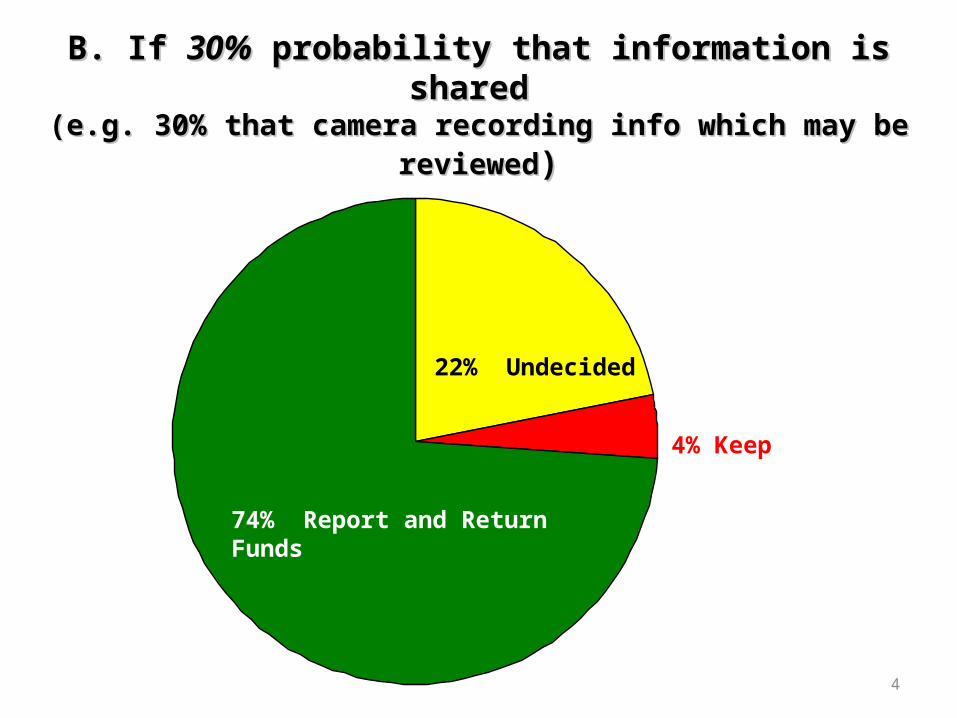
B. If B. If 30%30% probability that information is shared probability that information is shared (e.g. 30% that camera recording info which may be reviewed(e.g. 30% that camera recording info which may be reviewed))
4
74% Report and Return Funds
22% Undecided
4% Keep
1. Governance: Missing in the Washington Consensus
2. Governance can be measured, analyzed, & monitored
3. Governance Matters for Development and Security
4. Learn from Variation across countries & Institutions
5. Learning from in-depth work within a country
6. Does corruption necessarily imply illegality?
7. Some Key Findings – and Addressing Misconceptions
8. Salient Policy Implications and Challenges ahead5
Key Themes
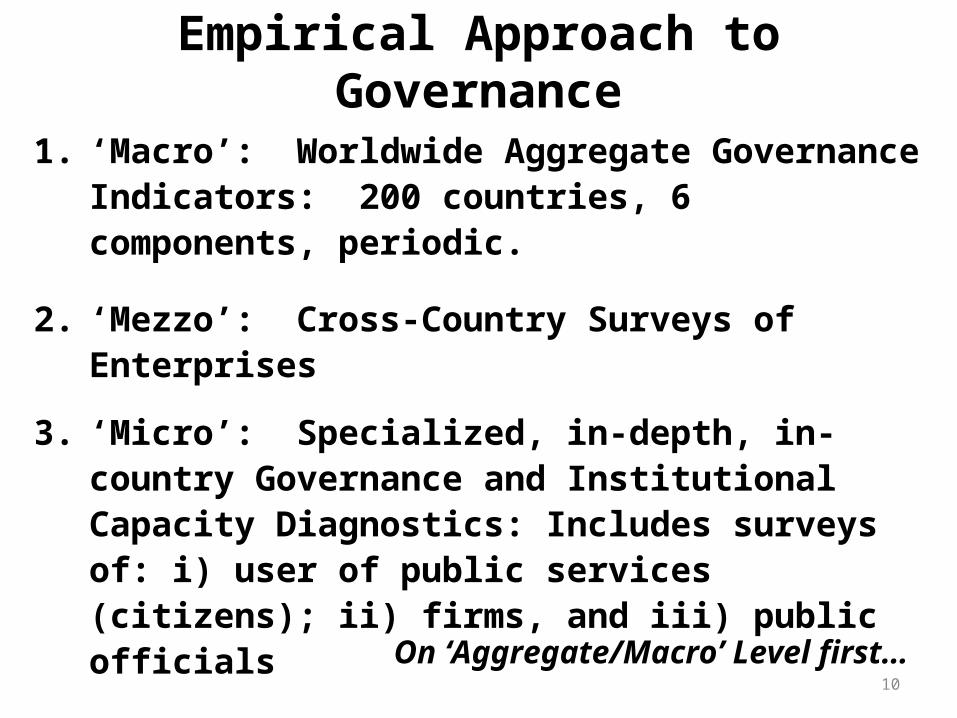
Empirical Approach to Governance
1. ‘Macro’: Worldwide Aggregate Governance Indicators: 200 countries, 6 components, periodic.
2. ‘Mezzo’: Cross-Country Surveys of Enterprises
3. ‘Micro’: Specialized, in-depth, in-country Governance and Institutional Capacity Diagnostics: Includes surveys of: i) user of public services (citizens); ii) firms, and iii) public officials
10
On ‘Aggregate/Macro’ Level first…

The Governance ‘Macro’ Level
• Defining and unbundling succintly
• The 6 dimensions of Governance: how conceptually derived, how measured
• The governance worldmap, & web interactivity
• What the ‘Macro’ can and cannot do…
11
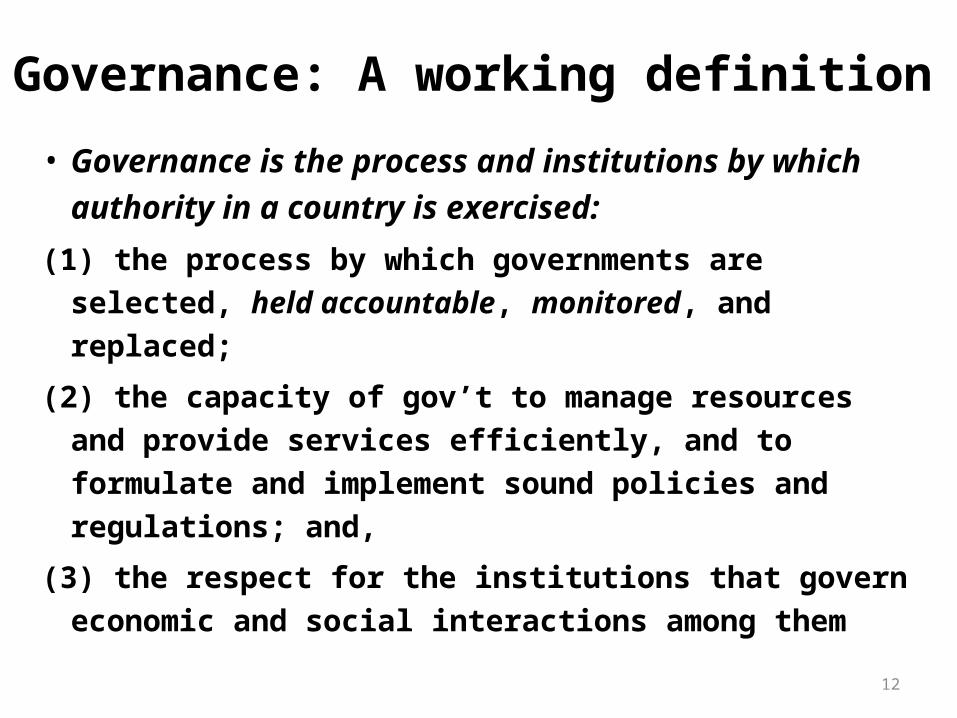
Governance: A working definition
• Governance is the process and institutions by which authority in a country is exercised:
(1) the process by which governments are selected, held accountable, monitored, and replaced;
(2) the capacity of gov’t to manage resources and provide services efficiently, and to formulate and implement sound policies and regulations; and,
(3) the respect for the institutions that govern economic and social interactions among them
12
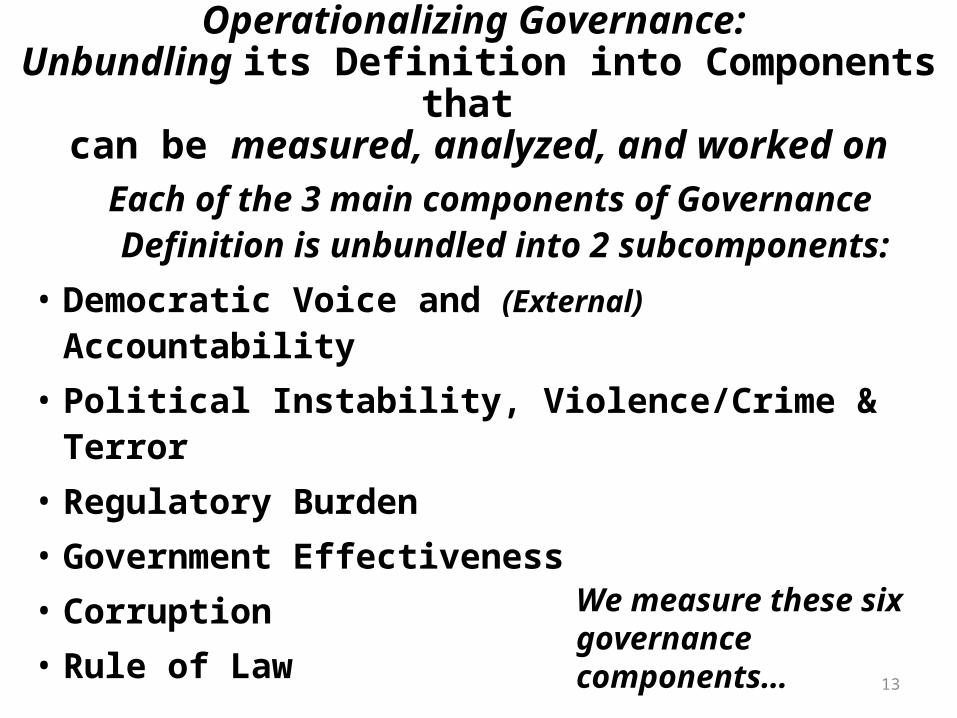
Operationalizing Governance: Unbundling its Definition into Components that
can be measured, analyzed, and worked on
Each of the 3 main components of Governance Definition is unbundled into 2 subcomponents:
• Democratic Voice and (External) Accountability• Political Instability, Violence/Crime & Terror• Regulatory Burden• Government Effectiveness• Corruption• Rule of Law
13
We measure these six governance components…
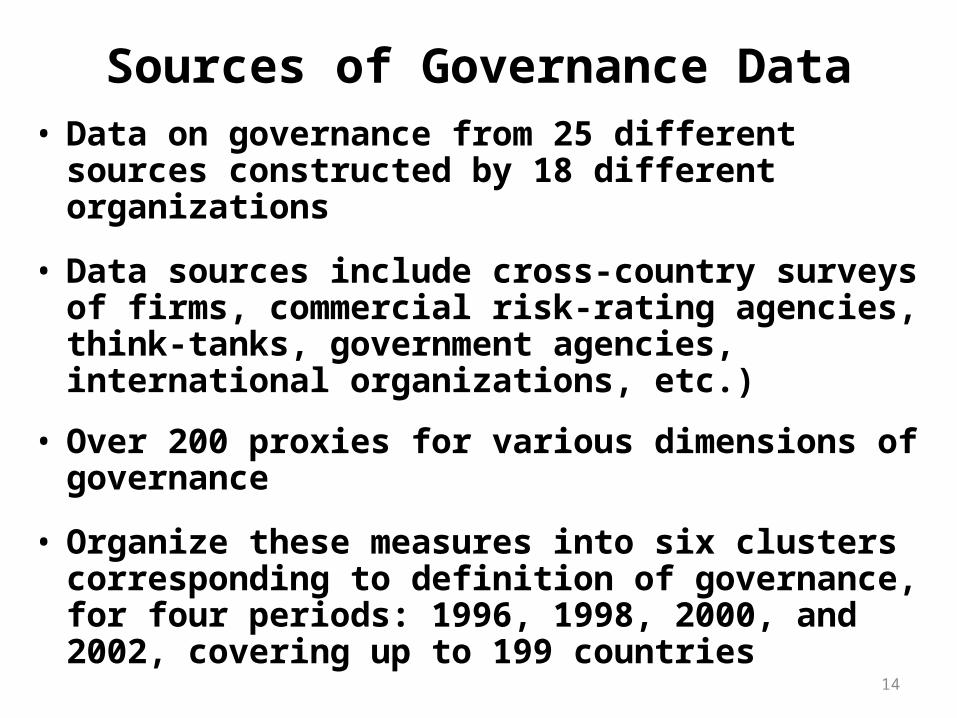
Sources of Governance Data• Data on governance from 25 different sources
constructed by 18 different organizations
• Data sources include cross-country surveys of firms, commercial risk-rating agencies, think-tanks, government agencies, international organizations, etc.)
• Over 200 proxies for various dimensions of governance
• Organize these measures into six clusters corresponding to definition of governance, for four periods: 1996, 1998, 2000, and 2002, covering up to 199 countries
14
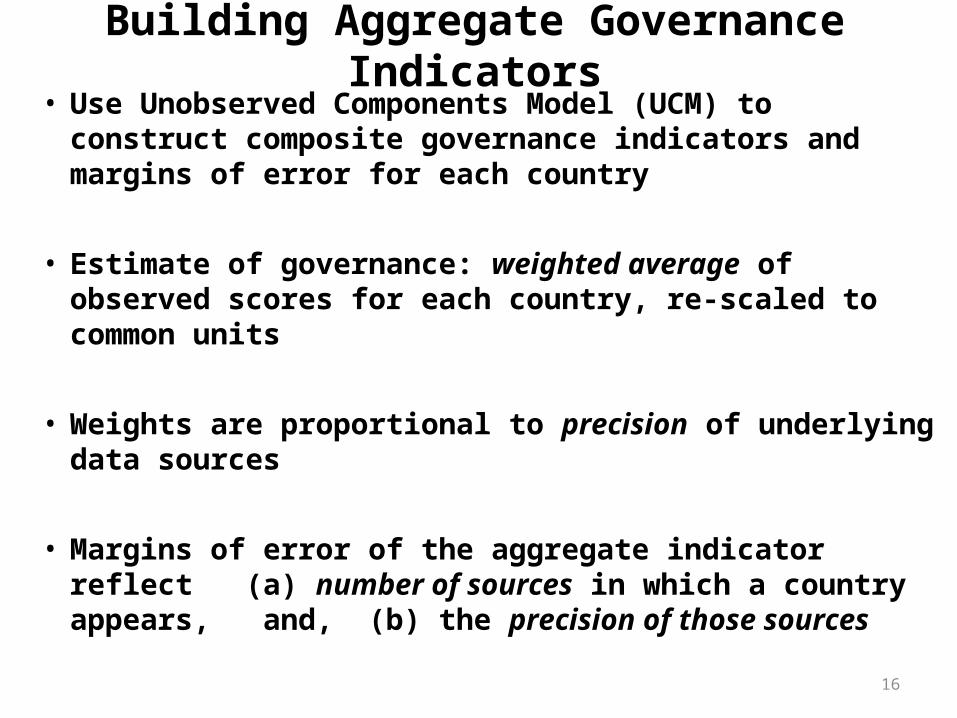
Building Aggregate Governance Indicators• Use Unobserved Components Model (UCM) to construct
composite governance indicators and margins of error for each country
• Estimate of governance: weighted average of observed scores for each country, re-scaled to common units
• Weights are proportional to precision of underlying data sources
• Margins of error of the aggregate indicator reflect (a) number of sources in which a country appears, and, (b) the precision of those sources
16

Precision vs. Number of Sources, KKZ Governance Estimates, 2000/01
17
0
0.1
0.2
0.3
0.4
0.5
0.6
0.7
0 2 4 6 8 10 12 14
Number of Sources Per Country
Ma
rgin
of
Err
or
Note: See explanatory details in this slide’s note
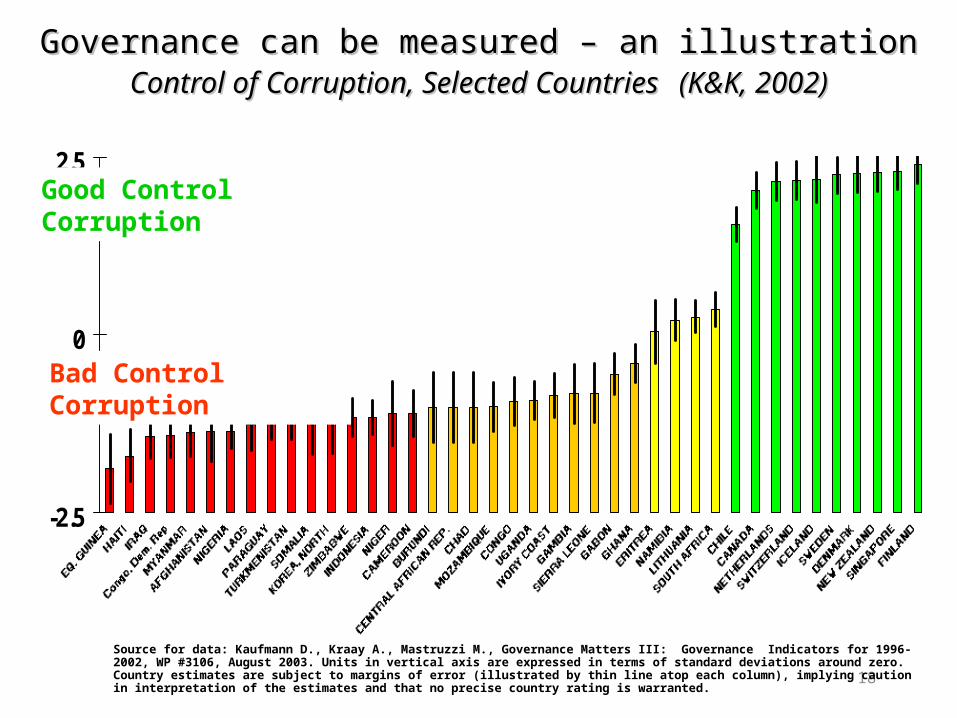
Governance can be measured – an illustrationGovernance can be measured – an illustrationControl of Corruption, Selected CountriesControl of Corruption, Selected Countries (K&K, 2002)(K&K, 2002)
18
Source for data: Kaufmann D., Kraay A., Mastruzzi M., Governance Matters III: Governance Indicators for 1996-2002, WP #3106, August 2003. Units in vertical axis are expressed in terms of standard deviations around zero. Country estimates are subject to margins of error (illustrated by thin line atop each column), implying caution in interpretation of the estimates and that no precise country rating is warranted.
-2.5
0
2.5Good Control Corruption
Bad Control Corruption
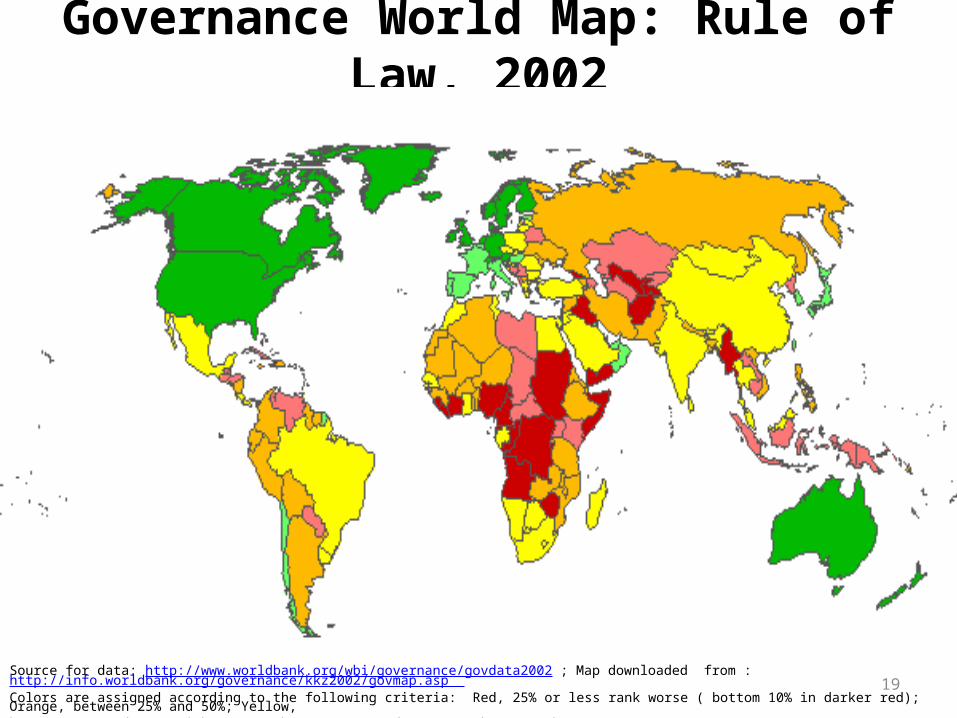
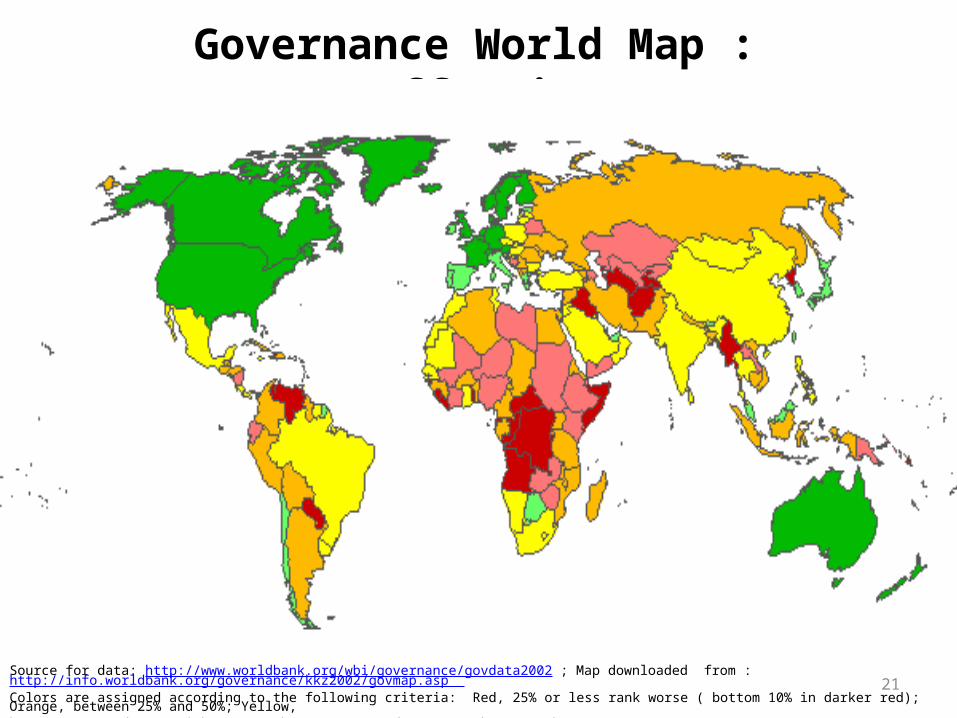
Governance World Map: Rule of Law, 2002
19Source for data: http://www.worldbank.org/wbi/governance/govdata2002 ; Map downloaded from : http://info.worldbank.org/governance/kkz2002/govmap.asp Colors are assigned according to the following criteria: Red, 25% or less rank worse ( bottom 10% in darker red); Orange, between 25% and 50%; Yellow, between 50% and 75%; Light Green between 75% and 90% ; Dark Green above 90%
20
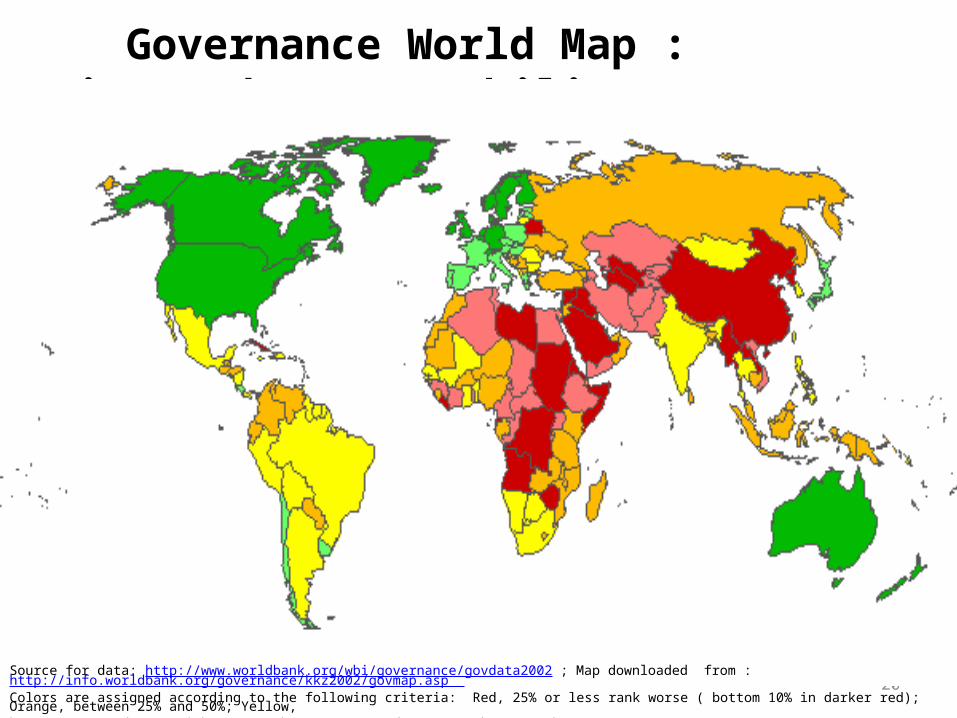
Governance World Map :Voice and Accountability, 2002
Source for data: http://www.worldbank.org/wbi/governance/govdata2002 ; Map downloaded from : http://info.worldbank.org/governance/kkz2002/govmap.asp Colors are assigned according to the following criteria: Red, 25% or less rank worse ( bottom 10% in darker red); Orange, between 25% and 50%; Yellow, between 50% and 75%; Light Green between 75% and 90% ; Dark Green above 90%
Governance World Map :Government Effectiveness, 2002
21Source for data: http://www.worldbank.org/wbi/governance/govdata2002 ; Map downloaded from : http://info.worldbank.org/governance/kkz2002/govmap.asp Colors are assigned according to the following criteria: Red, 25% or less rank worse ( bottom 10% in darker red); Orange, between 25% and 50%; Yellow, between 50% and 75%; Light Green between 75% and 90% ; Dark Green above 90%
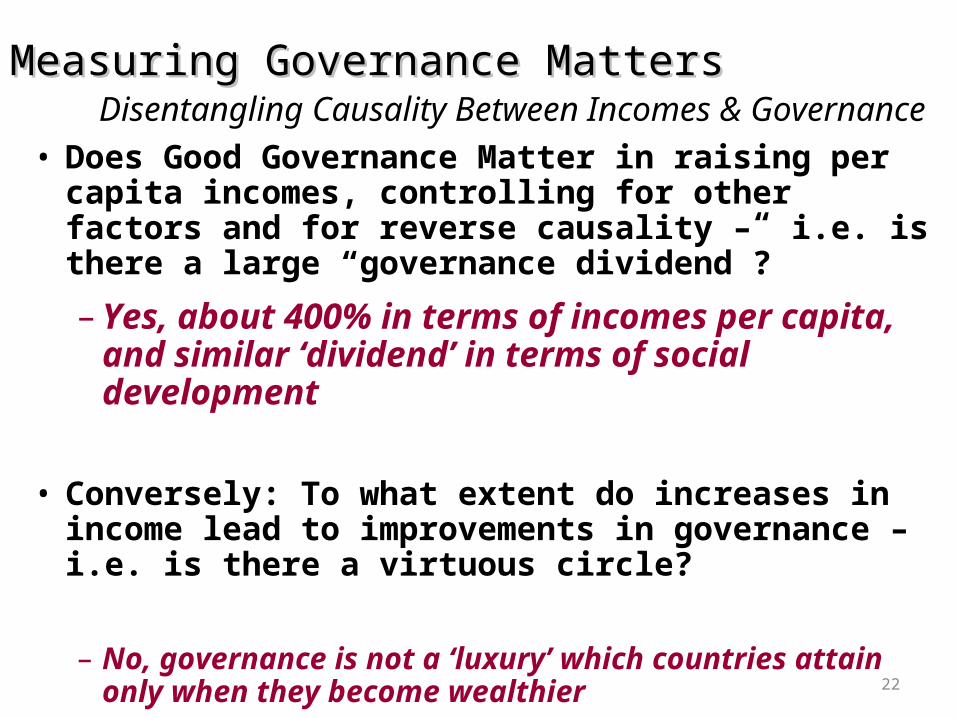
Measuring Governance MattersMeasuring Governance Matters Disentangling Causality Between Incomes & Governance
• Does Good Governance Matter in raising per capita incomes, controlling for other factors and for reverse causality – i.e. is there a large “governance dividend”?
– Yes, about 400% in terms of incomes per capita, and similar ‘dividend’ in terms of social development
• Conversely: To what extent do increases in income lead to improvements in governance – i.e. is there a virtuous circle?
– No, governance is not a ‘luxury’ which countries attain only when they become wealthier
22

Dividend of Good Governance
23
Infant Mortality and Corruption
0
10
20
30
40
50
60
70
80
90
Weak Average Good
Control of Corruption x Development Dividend
0
2,000
4,000
6,000
8,000
10,000
12,000
Weak Average Good
Regulatory Burdenx Development Dividend
Per Capita Income and Regulatory Burden
Literacy and Rule of Law
0
25
50
75
100
Weak Average Good
Rule of Law xDevelopment
Dividend
Per Capita Income and
Voice and Accountability
0
1000
2000
3000
4000
5000
6000
7000
8000
9000
10000
Weak Average Strong
Voice and Accountabilityx Development
Dividend
Note: The bars depict the simple correlation between good governance and development outcomes. The line depicts thepredicted value when taking into account the causality effects (“Development Dividend”) from improved governance to betterdevelopment outcomes. For data and methodological details visit http://www.worldbank.org/wbi/governance.
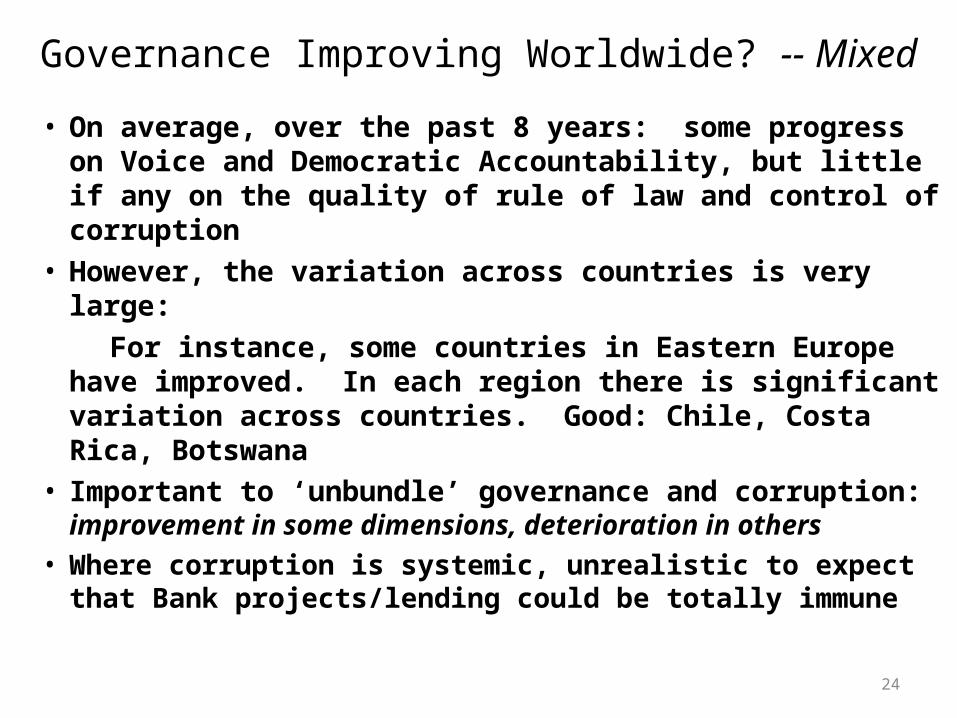
Governance Improving Worldwide? -- Mixed
• On average, over the past 8 years: some progress on Voice and Democratic Accountability, but little if any on the quality of rule of law and control of corruption
• However, the variation across countries is very large: For instance, some countries in Eastern Europe have
improved. In each region there is significant variation across countries. Good: Chile, Costa Rica, Botswana
• Important to ‘unbundle’ governance and corruption: improvement in some dimensions, deterioration in others
• Where corruption is systemic, unrealistic to expect that Bank projects/lending could be totally immune
24

The ‘Mezzo’ Level of Governance Measurement
• Based on cross-country surveys, mainly of enterprises – such as the EOS of the WEF, BEEPS and WBES of the WB, etc.
• Thousands of firms interviewed on a range of issues; typically significant prominence on governance
• More detailed unbundling of governance and corruption phenomena than aggregate indicators
• Relatively broad country coverage, but less than aggregate governance indicators
26

Judiciary Independence (EOS survey resuls 1998-2004)
1
4
7
1998 1999 2000 2001 2002 2003 2004
Inde
pend
enci
a de
la J
udic
atur
a
OECD
East Asian NICs
Latin America
NON OECD
27
High Independence
No Independence
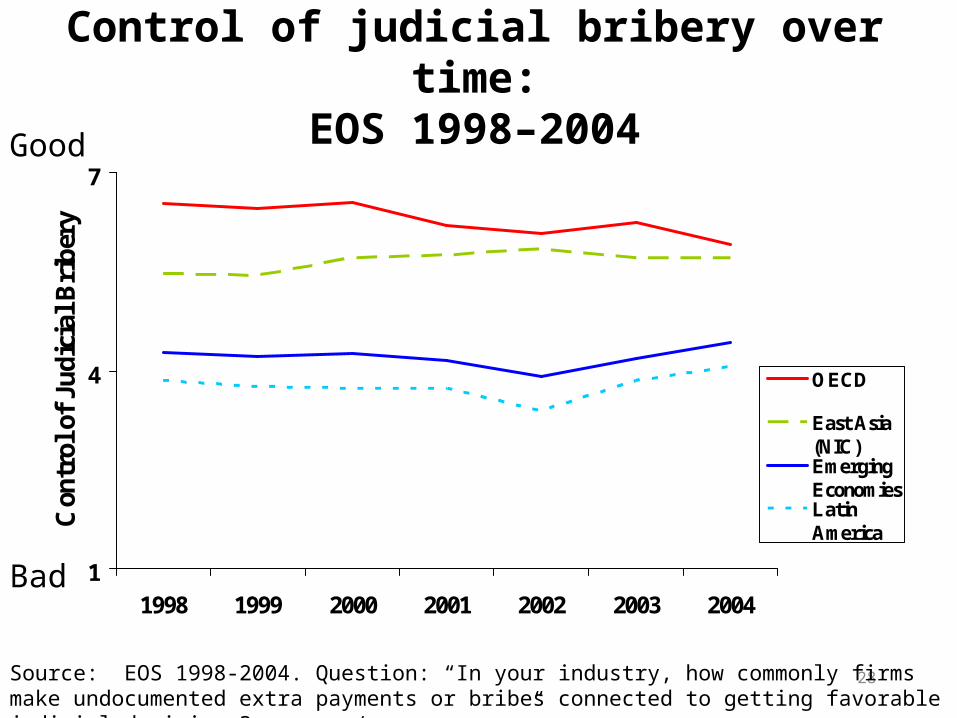
Control of judicial bribery over time:EOS 1998–2004
1
4
7
1998 1999 2000 2001 2002 2003 2004
Con
trol
of
Jud
icia
l B
rib
ery
OECD
East Asia(NIC)EmergingEconomiesLatinAmerica
28
Good
Bad
Source: EOS 1998-2004. Question: “In your industry, how commonly firms make undocumented extra payments or bribes connected to getting favorable judicial decisions? common / never occur”.
30
0
5
10
15
20
25
30
Co
mp
etit
iven
ess
Ga
in i
n N
um
ber
of
Ran
kin
gs
(Ch
an
ge
in R
an
k P
osi
tion
s)
Constraint
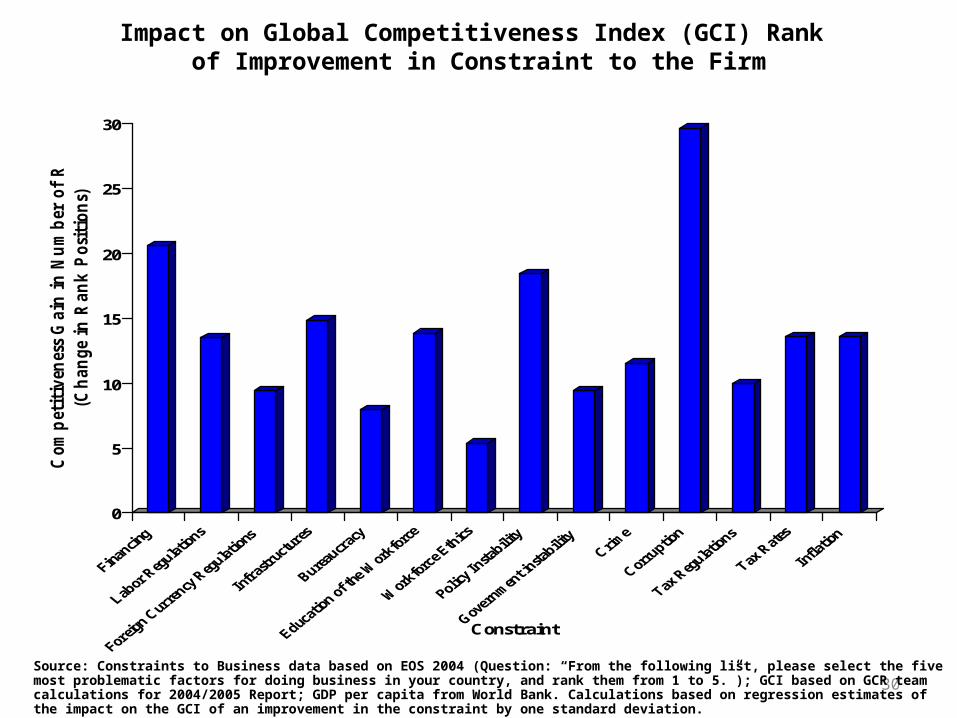
Source: Constraints to Business data based on EOS 2004 (Question: “From the following list, please select the five most problematic factors for doing business in your country, and rank them from 1 to 5.”); GCI based on GCR team calculations for 2004/2005 Report; GDP per capita from World Bank. Calculations based on regression estimates of the impact on the GCI of an improvement in the constraint by one standard deviation.
Impact on Global Competitiveness Index (GCI) Rank of Improvement in Constraint to the Firm
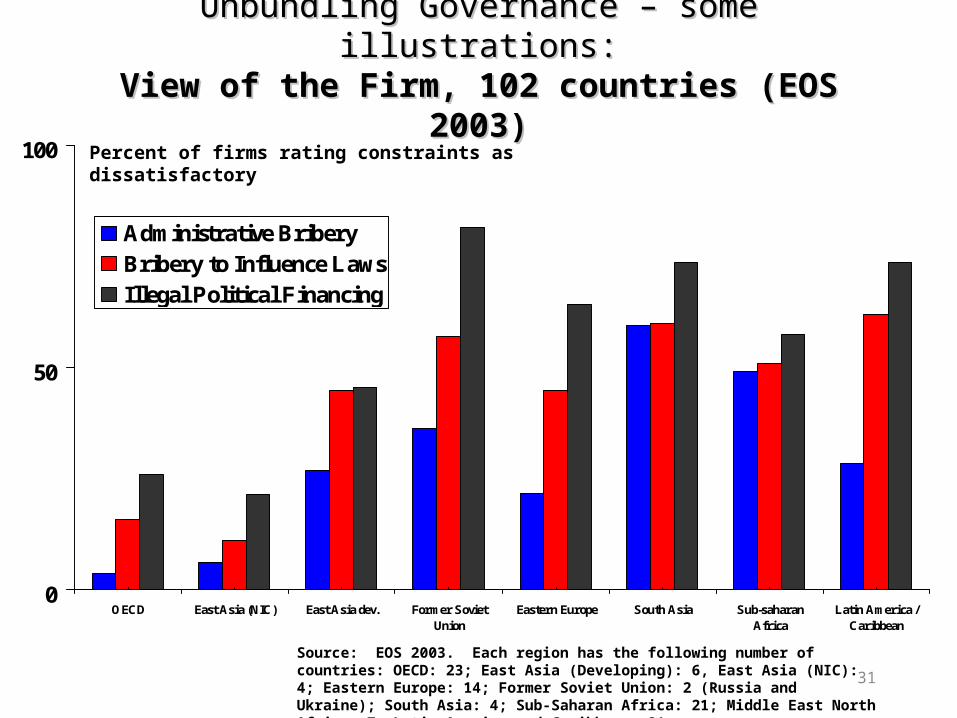
Unbundling Governance – some illustrations:Unbundling Governance – some illustrations:View of the Firm, 102 countries (EOS 2003)View of the Firm, 102 countries (EOS 2003)
0
50
100
OECD East Asia (NIC) East Asia dev. Former SovietUnion
Eastern Europe South Asia Sub-saharanAfrica
Latin America /Caribbean
Administrative BriberyBribery to Influence LawsIllegal Political Financing
31
Percent of firms rating constraints as dissatisfactory
Source: EOS 2003. Each region has the following number of countries: OECD: 23; East Asia (Developing): 6, East Asia (NIC): 4; Eastern Europe: 14; Former Soviet Union: 2 (Russia and Ukraine); South Asia: 4; Sub-Saharan Africa: 21; Middle East North Africa: 7; Latin America and Caribbean: 21.
Defining, Measuring and Analyzing Legal Corruption
• Old, traditional definition of corruption: ‘Abuse of public office for private gain’
• Problems – i) interpreted in terms of legality of act (illegal = corrupt; legal = non-corrupt?); ii) onus is on the public official (asymmetry), and, iii) measurement bias towards ‘petty corruption’
• Alternative: ‘Privatization of public policy’ (e.g. ‘undue influence by private interests on public policy actions’)
• This implies that some actions may be legal strictly speaking, but illegitimate, inconsistent with standards and/or corrupt
• These legal forms of corruption can be measured
32
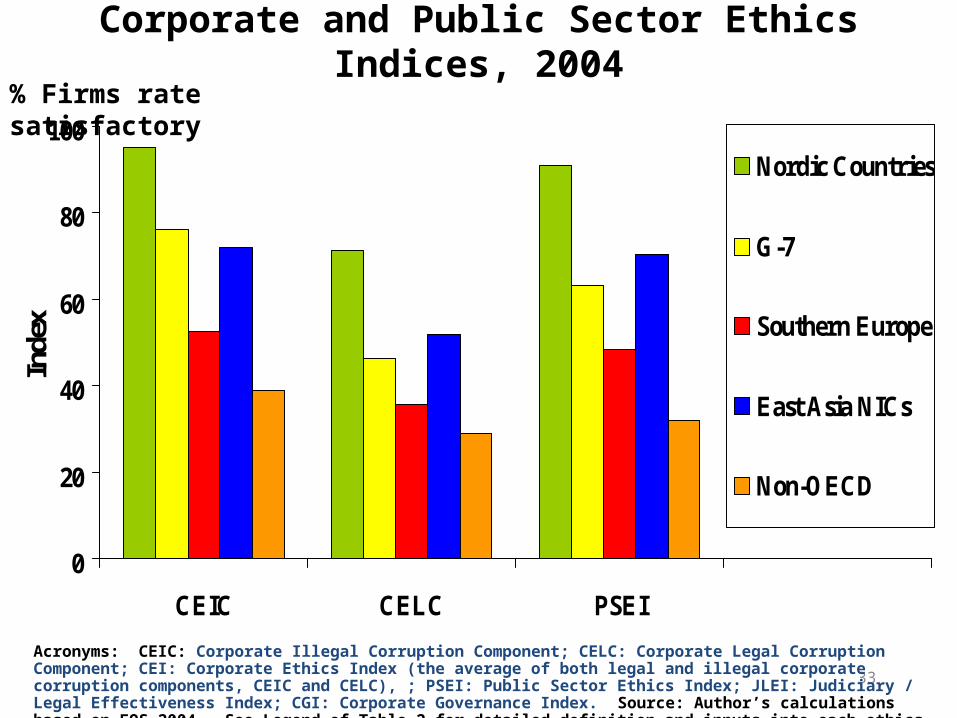
Corporate and Public Sector Ethics Indices, 2004
0
20
40
60
80
100
CEIC CELC PSEI
Inde
x
Nordic Countries
G-7
Southern Europe
East Asia NICs
Non-OECD
33
Acronyms: CEIC: Corporate Illegal Corruption Component; CELC: Corporate Legal Corruption Component; CEI: Corporate Ethics Index (the average of both legal and illegal corporate corruption components, CEIC and CELC), ; PSEI: Public Sector Ethics Index; JLEI: Judiciary / Legal Effectiveness Index; CGI: Corporate Governance Index. Source: Author’s calculations based on EOS 2004. See Legend of Table 2 for detailed definition and inputs into each ethics index.
% Firms rate satisfactory
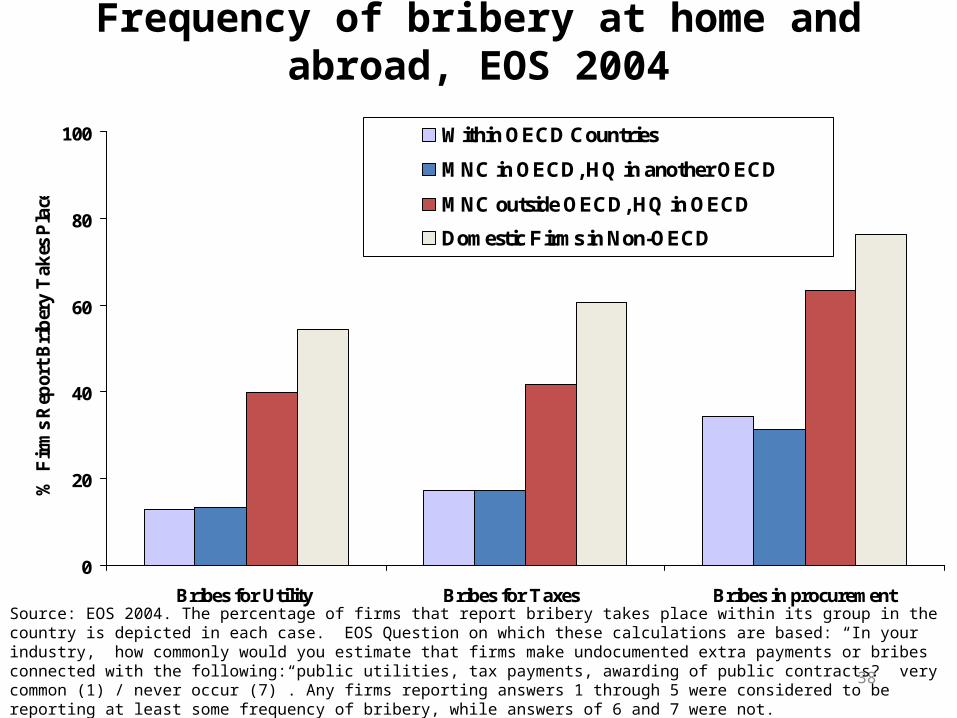
Frequency of bribery at home and abroad, EOS 2004
0
20
40
60
80
100
Bribes for Utility Bribes for Taxes Bribes in procurement
% F
irm
s R
epor
t B
rib
ery
Tak
es P
lace
Within OECD Countries
MNC in OECD, HQ in another OECD
MNC outside OECD, HQ in OECD
Domestic Firms in Non-OECD
38
Source: EOS 2004. The percentage of firms that report bribery takes place within its group in the country is depicted in each case. EOS Question on which these calculations are based: “In your industry, how commonly would you estimate that firms make undocumented extra payments or bribes connected with the following: public utilities, tax payments, awarding of public contracts? very common (1) / never occur (7)”. Any firms reporting answers 1 through 5 were considered to be reporting at least some frequency of bribery, while answers of 6 and 7 were not.
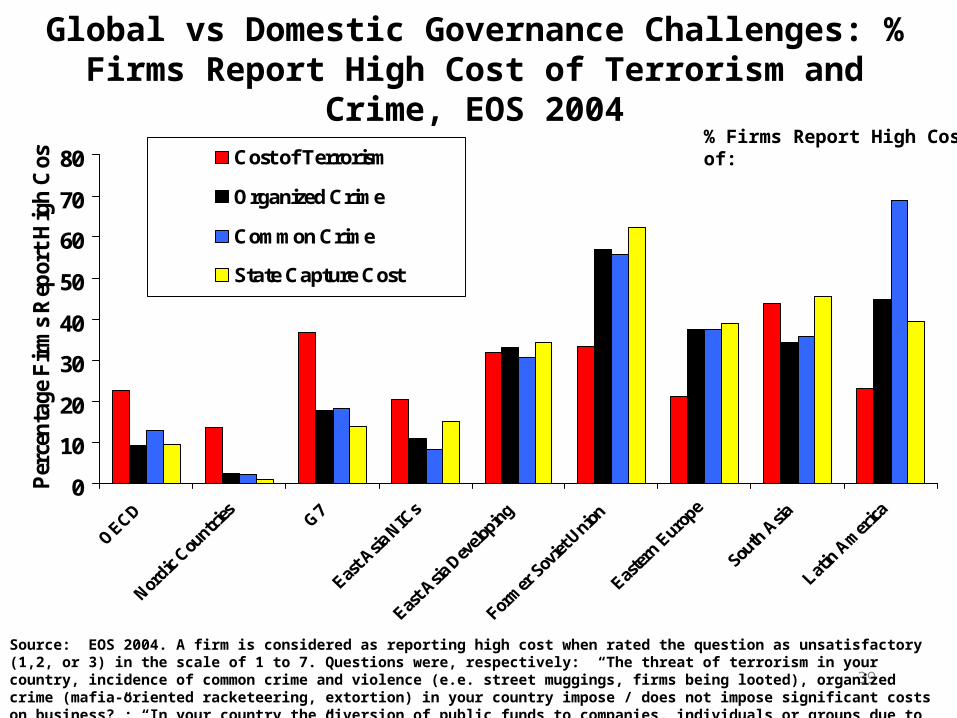
Global vs Domestic Governance Challenges: % Firms Report High Cost of Terrorism and Crime, EOS 2004
0
10
20
30
40
50
60
70
80
Per
cen
tage
Fir
ms
Rep
ort
Hig
h C
ost
Cost of Terrorism
Organized Crime
Common Crime
State Capture Cost
39
Source: EOS 2004. A firm is considered as reporting high cost when rated the question as unsatisfactory (1,2, or 3) in the scale of 1 to 7. Questions were, respectively: “The threat of terrorism in your country, incidence of common crime and violence (e.e. street muggings, firms being looted), organized crime (mafia-oriented racketeering, extortion) in your country impose / does not impose significant costs on business?”; “In your country the diversion of public funds to companies, individuals or groups due to corruption is common / never occurs”.
% Firms Report High Cost of:
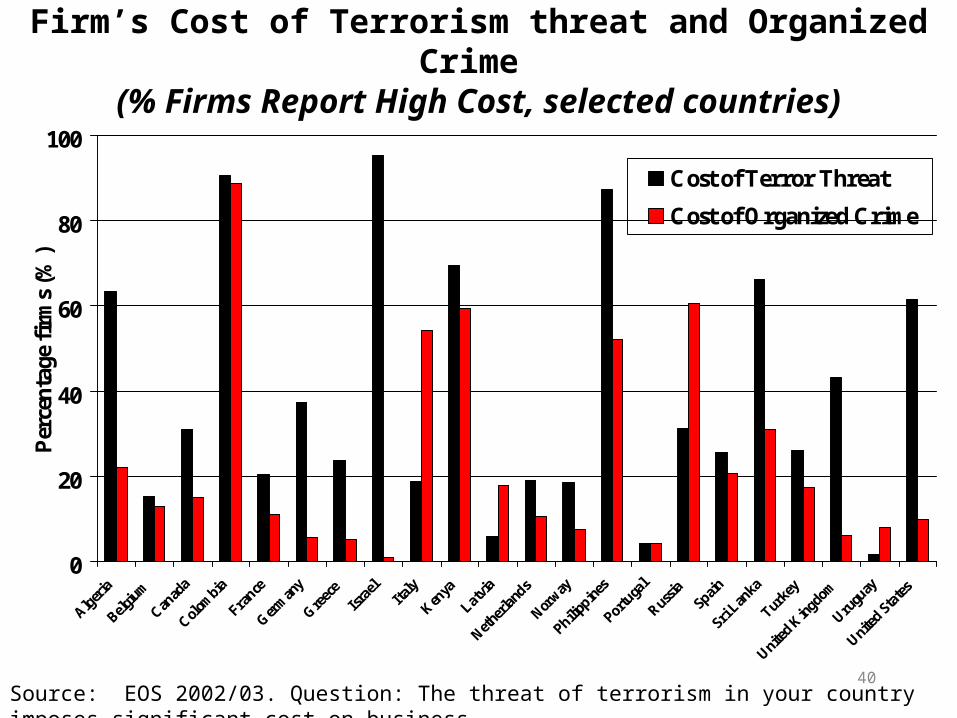
Firm’s Cost of Terrorism threat and Organized Crime (% Firms Report High Cost, selected countries)
0
20
40
60
80
100
Alger
ia
Belgiu
m
Canad
a
Colom
bia
France
Ger
man
y
Gre
ece
Isra
elIta
ly
Ken
ya
Latvia
Nether
lands
Norway
Philippin
es
Portuga
l
Russia
Spain
Sri Lan
ka
Turkey
United K
ingdom
Urugu
ay
United S
tate
s
Per
cen
tage
fir
ms
(%)
Cost of Terror Threat
Cost of Organized Crime
40Source: EOS 2002/03. Question: The threat of terrorism in your country imposes significant cost on business
41
ARG
AUS
AUT
BGD
BEL
BOL
BWA
BRA
BGR
CAN
CHL
CHN
COL
CRI
HRV
CZE
DNK
DOM
ECU
SLV
EST
FIN
FRADEU
GRC
GTM
HTI
HND
HKGHUN
ISL
IND
IDN
IRL
ISRITA
JAM
JPN
JOR
KOR
LVA
LTU
MYS
MUS
MEX
MAR
NAMNLD
NZL
NIC
NGA
NOR
PAN
PRY
PER
PHL
POL
PRT
ROM
RUS
SGP
SVK
SVN
ZAFESP
LKA
SWE
CHE
TWN
THA
TTO
TUN
TUR
UKR
GBR
USA
URY
VEN
VNM
ZWE
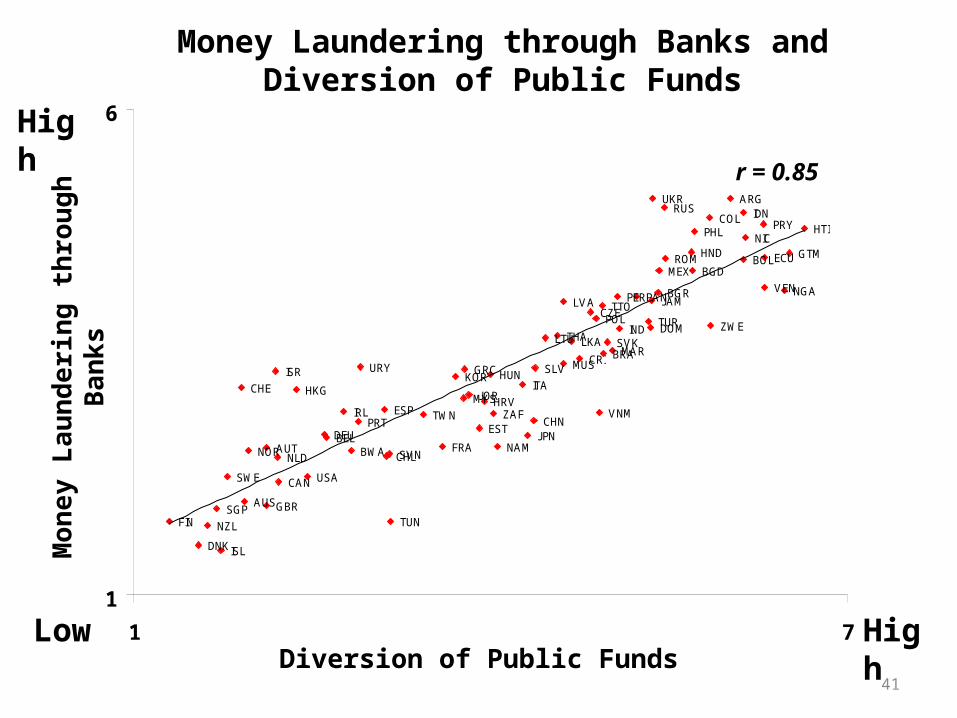
1
6
1 7Low
High
High
Mon
ey L
aund
erin
g th
roug
h Ba
nks
Diversion of Public Funds
Money Laundering through Banks and Diversion of Public Funds
r = 0.85
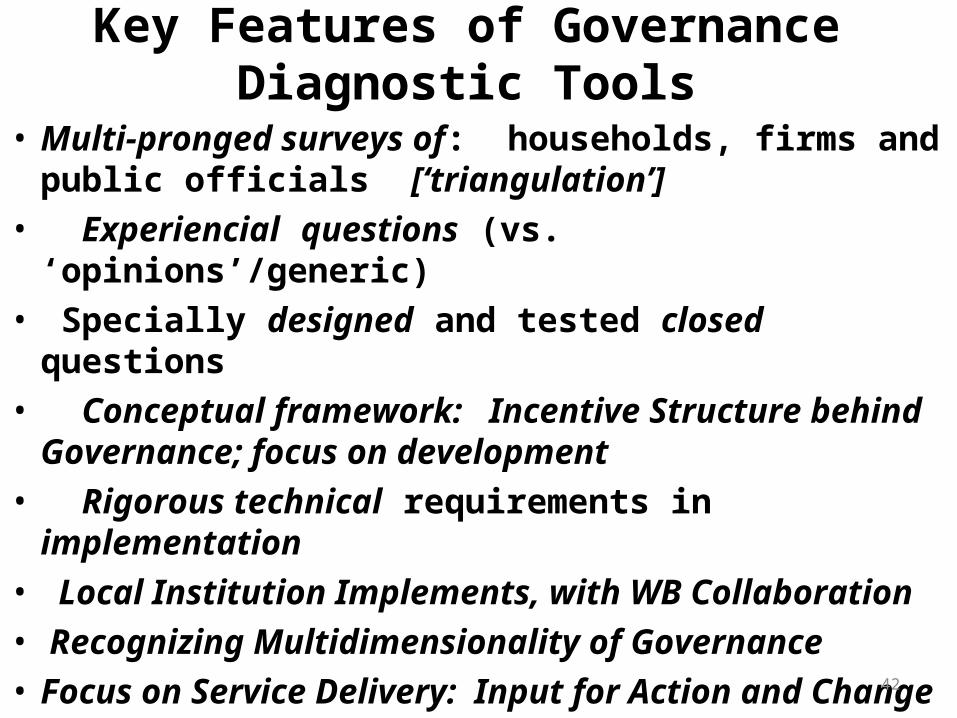
Key Features of Governance Diagnostic Tools
• Multi-pronged surveys of: households, firms and public officials [‘triangulation’]
• Experiencial questions (vs. ‘opinions’/generic) • Specially designed and tested closed questions• Conceptual framework: Incentive Structure behind
Governance; focus on development • Rigorous technical requirements in implementation• Local Institution Implements, with WB Collaboration• Recognizing Multidimensionality of Governance• Focus on Service Delivery: Input for Action and
Change 42

43
Challenge: poor governance and corruption
1. Establishment of Steering Committee
2. Diagnostic surveys + analysis
3. Draft of the NAS
4. Public dissemination + discussion
5. Revision of the NAS
6. Implementation by Government
7. Monitoring and Evaluation of NAS
WBI
Tec
hnic
al A
ssis
tanc
e
Key Partnership: Government + Civil Society
Country Implemented
A few Illustrations
GuatemalaHighly fragmented civil societyJoint effort (CMU, SDV, WBI) to build consensus
Sierra LeoneStrong commitment (civil society, state, donors) => surveys and report within a year. Results will be used for Institutional Reform Project
HondurasCNA: report and strategy to newly elected gov (January 2001); integration of strategy in the 2002-2006 government plan

44
Stages for Development of the National Anti-Corruption Strategy
1. Establishment of Steering Committee
2. Diagnostic surveys + analysis
3. Draft of the NAS
4. Public dissemination + discussion
5. Revision of the NAS
6. Implementation by Government
7. Monitoring and Evaluation of NAS
WBI
Tec
hnic
al A
ssis
tanc
e
Key Partnership: Government + Civil Society
Country Implemented
Alternative pathsPeru
Lack of political will => strategy never implementedSubsequent entry point: capacity building for monitoring with CMU and SDV
IndonesiaWeak demand for reform and damaged reputation => work with local partners + donors; support A-C diagnostics by local NGO; involvement of locals in design and implementation of projects
San PauloDifferent unit of observation: city. Partnership with TI to adapt tools and compile report
EcuadorLack of political will (2000) => report never releasedNew government (2003) => A-C and governance key issues in the new CAS
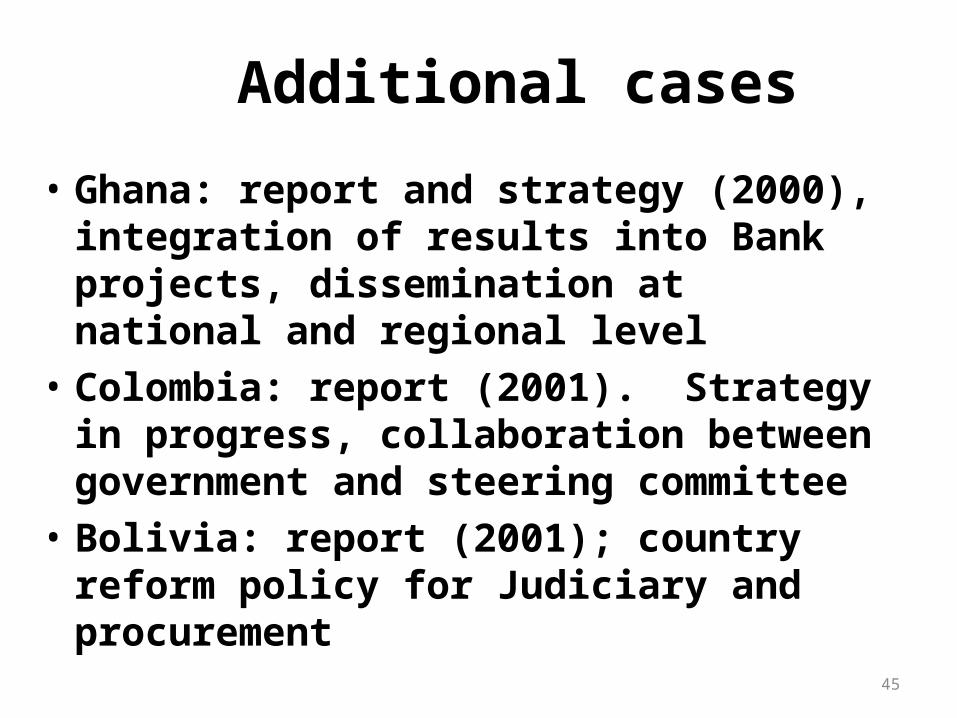
Additional cases
• Ghana: report and strategy (2000), integration of results into Bank projects, dissemination at national and regional level
• Colombia: report (2001). Strategy in progress, collaboration between government and steering committee
• Bolivia: report (2001); country reform policy for Judiciary and procurement
45
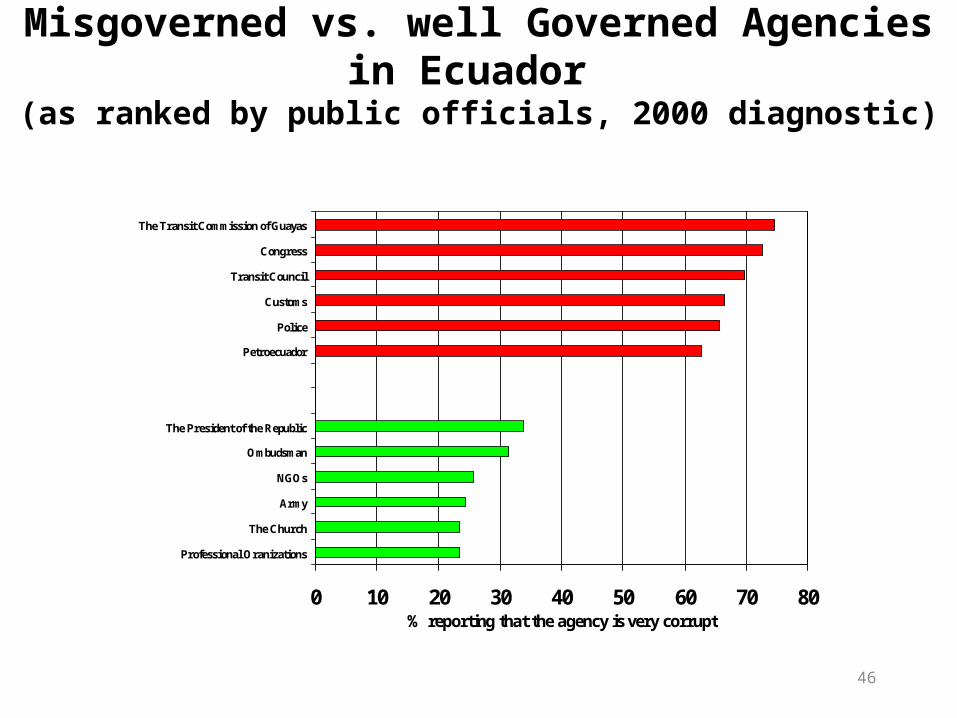
Misgoverned vs. well Governed Agencies in Ecuador (as ranked by public officials, 2000 diagnostic)
0 10 20 30 40 50 60 70 80
Professional Oranizations
The Church
Army
NGOs
Ombudsman
The President of the Republic
Petroecuador
Police
Customs
Transit Council
Congress
The Transit Commission of Guayas
% reporting that the agency is very corrupt
46
47
4.2
2.11.4
0
1
2
3
4
LowIncome
MiddleIncome
HighIncome
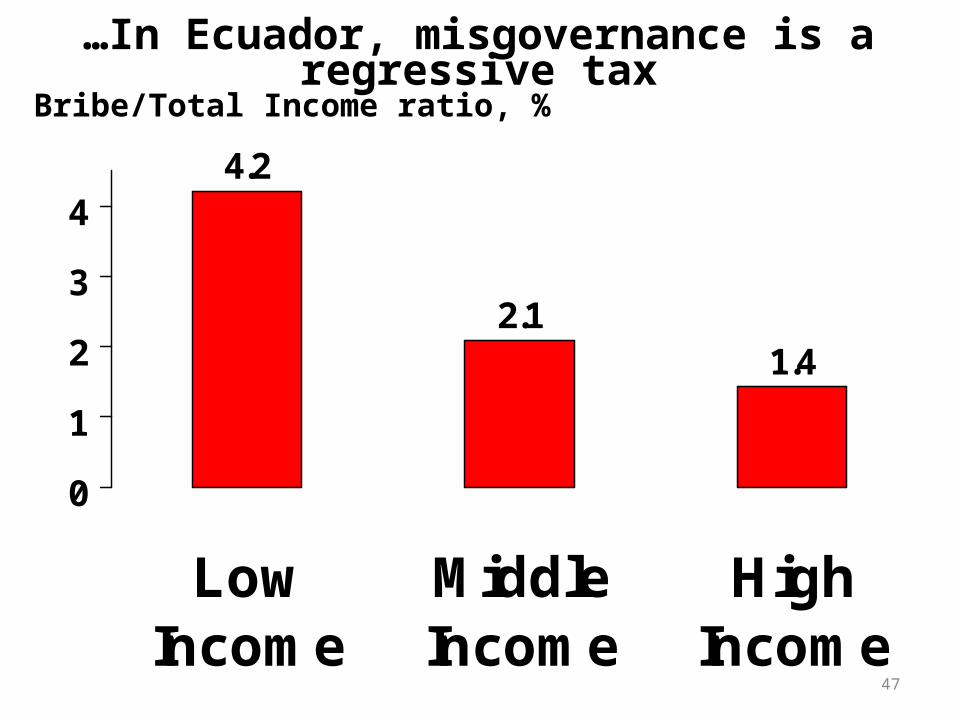
…In Ecuador, misgovernance is a regressive tax
Bribe/Total Income ratio, %
48
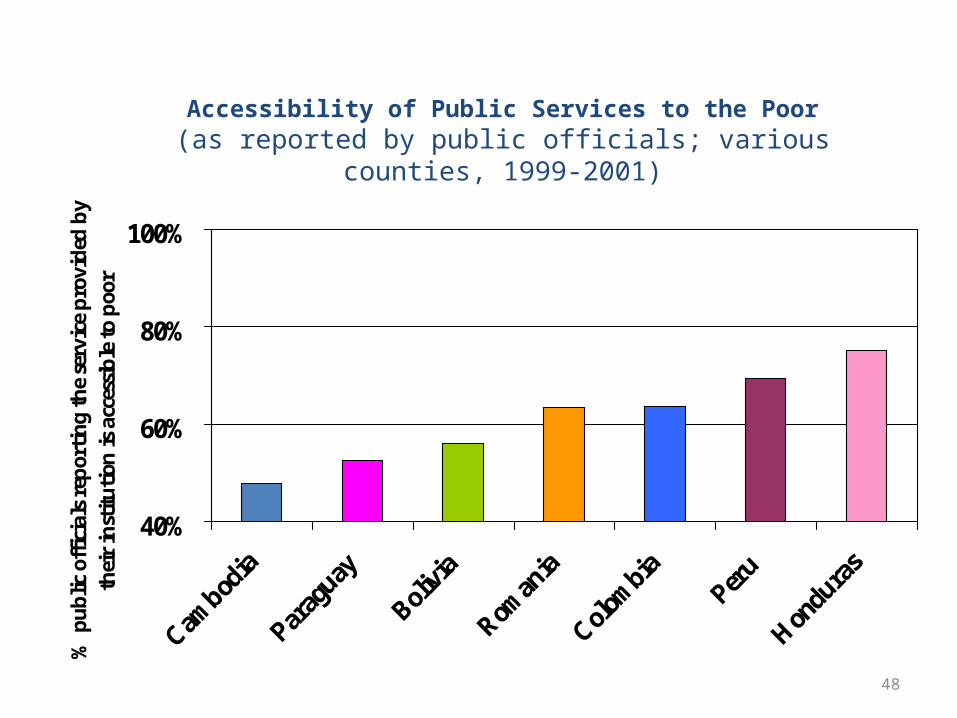
Accessibility of Public Services to the Poor(as reported by public officials; various counties, 1999-2001)
40%
60%
80%
100%
% p
ub
lic o
ffic
ials
rep
orti
ng
the
serv
ice
pro
vid
ed b
y th
eir
inst
itu
tion
is a
cces
sib
le t
o p
oor

49
Public Prosecutor
Electricicy company
Cent. BankM of Fin - Income
National Fin. Corp.
MunicipalityPresidency
M of Fin - Treasury
Attorney General
Congress
Undersec. Of Gov't
Electoral Supreme TribunalCourts
Universities and schools
M of Energy and MinesM of Fin - Budget
Undersec. Of Social Welfare
Telephone company
National Council of TransitProv. Council
Comptroller
Real Estate Bank
y = -0.05x + 6.05
R2 = 0.50
r=-0.71
1
2
3
4
5
40 50 60 70 80 90 100
Meritocracy in Hiring and Promotion
Public Officials Survey: Meritocracy in the Public Service Can Help Reduce Corruption
High
Low
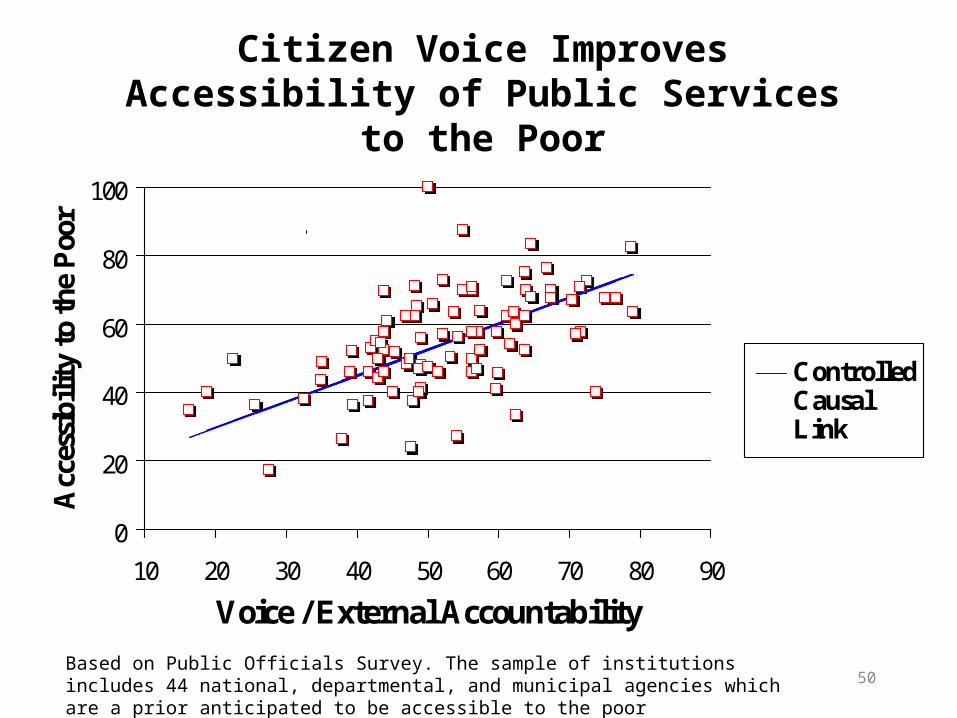
Citizen Voice Improves Accessibility of Public Services to the Poor
0
20
40
60
80
100
10 20 30 40 50 60 70 80 90
Voice / External Accountability
Acc
essi
bilit
y to
the
Poo
r
ControlledCausalLink
r = 0.54
50Based on Public Officials Survey. The sample of institutions includes 44 national, departmental, and municipal agencies which are a prior anticipated to be accessible to the poor
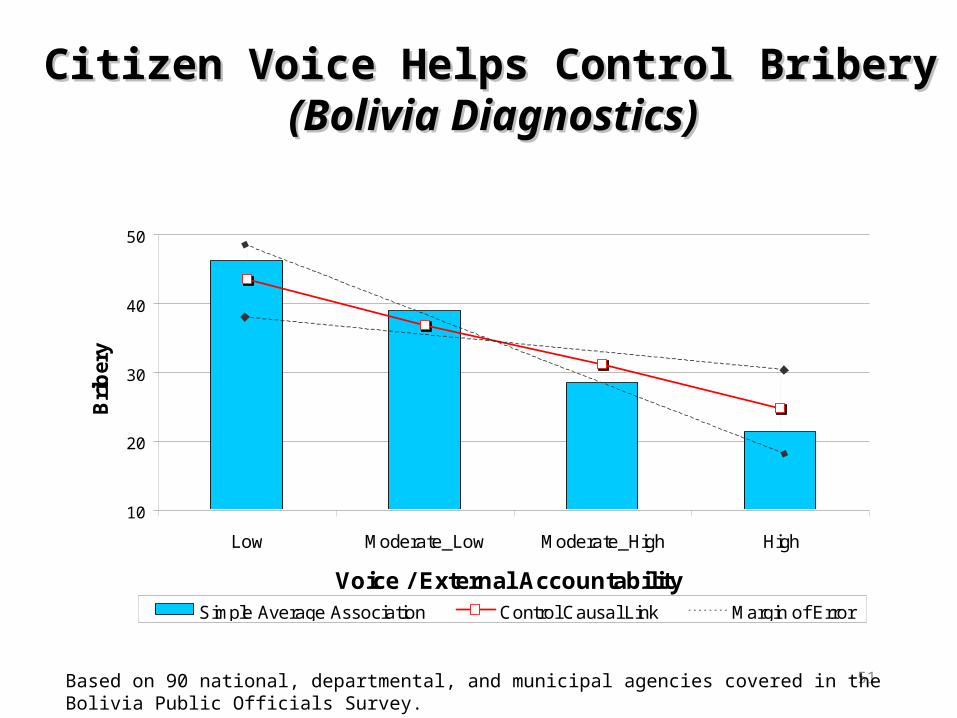
Citizen Voice Helps Control Bribery Citizen Voice Helps Control Bribery (Bolivia (Bolivia Diagnostics)Diagnostics)
10
20
30
40
50
Low Moderate_Low Moderate_High High
Voice / External Accountability
Bri
ber
y
Simple Average Association Control Causal Link Margin of Error
51Based on 90 national, departmental, and municipal agencies covered in the Bolivia Public Officials Survey.

Transparency within Government Agencies Prevents Purchase of Public Positions
3
6
9
12
15
18
Low Moderately Low Moderately High High
Internal Transparency
Job
Pu
rch
ase
Simple Average Association Control Causal Link Margin of Error
52
Based on 90 national, departmental, and municipal agencies covered in the Public Officials Survey.
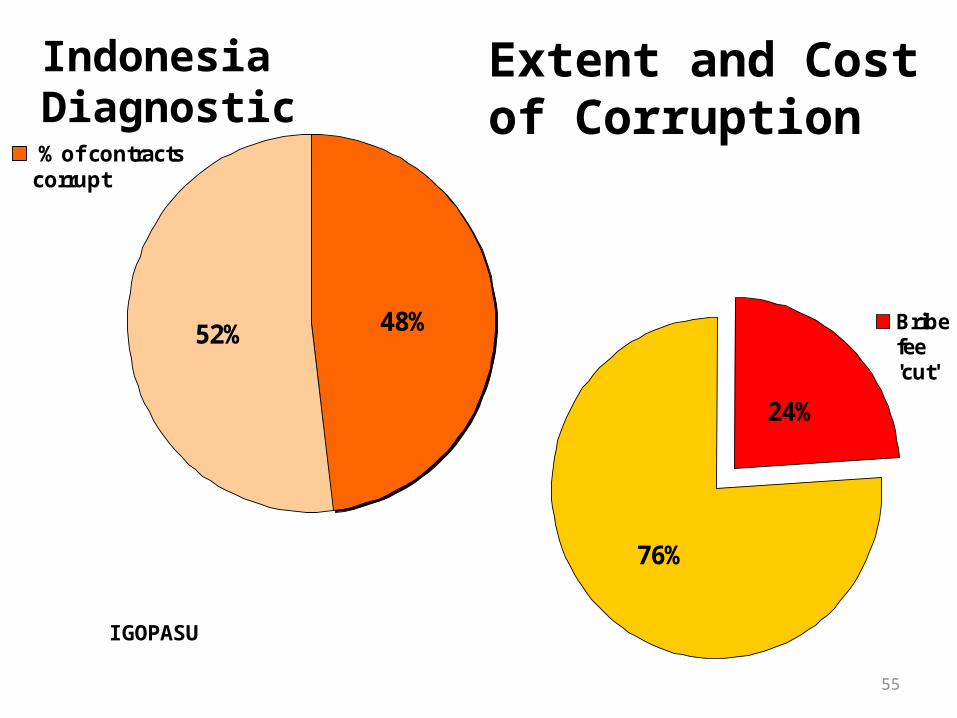
55
48%52%
% of contractscorrupt
24%
76%
Bribefee'cut'
Extent and Cost of Corruption
IGOPASU
Indonesia Diagnostic
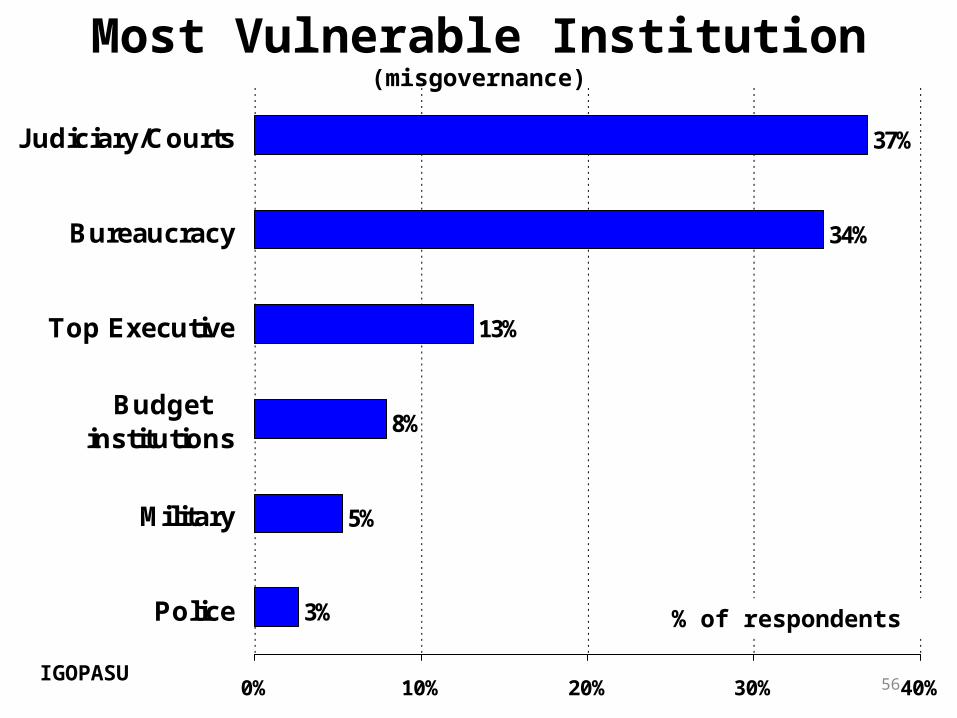
56
3%
5%
8%
13%
34%
37%
0% 10% 20% 30% 40%
Police
Military
Budgetinstitutions
Top Executive
Bureaucracy
Judiciary/Courts
Most Vulnerable Institution (misgovernance)
% of respondents
IGOPASU

57
15%
23%
30%
33%
10% 20% 30%
Lack ofMeritocracy
Low Salaries
PoliticalInterference
EconomicVested Interests
Main Obstacle to Transparent Justice
% of respondents
Note: no respondent chose lack of training or job security
IGOPASU
IGOPASU
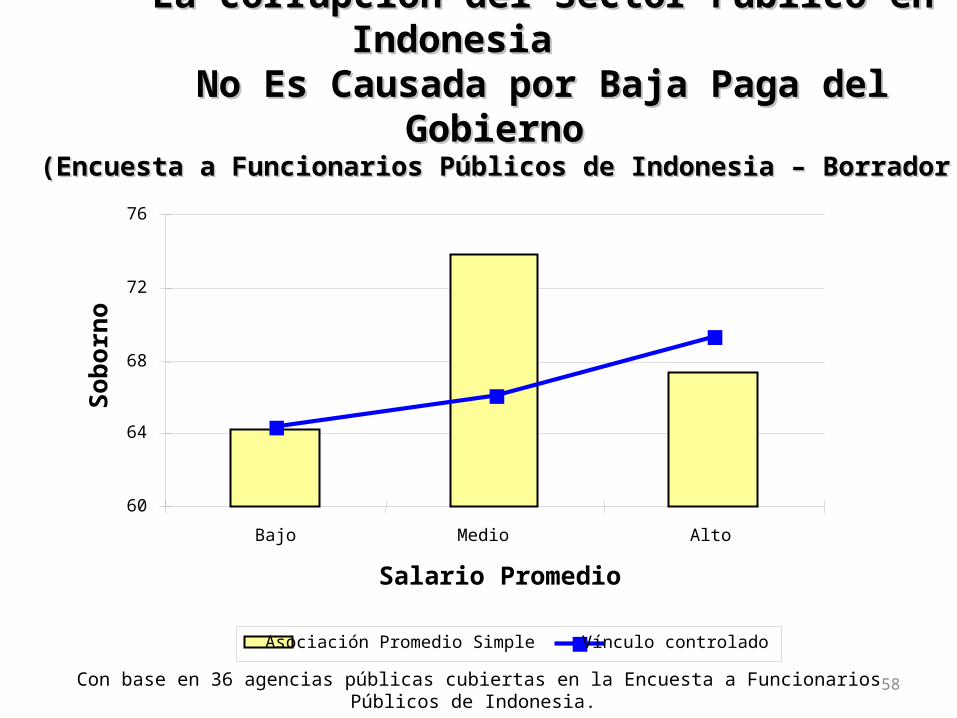
La corrupción del Sector Público en Indonesia La corrupción del Sector Público en Indonesia No Es Causada por Baja Paga del GobiernoNo Es Causada por Baja Paga del Gobierno
(Encuesta a Funcionarios Públicos de Indonesia – Borrador Muy Preliminar)(Encuesta a Funcionarios Públicos de Indonesia – Borrador Muy Preliminar)
58Con base en 36 agencias públicas cubiertas en la Encuesta a Funcionarios Públicos de Indonesia.
60
64
68
72
76
Bajo Medio Alto
Salario Promedio
So
bo
rno
Asociación Promedio Simple Vínculo controlado
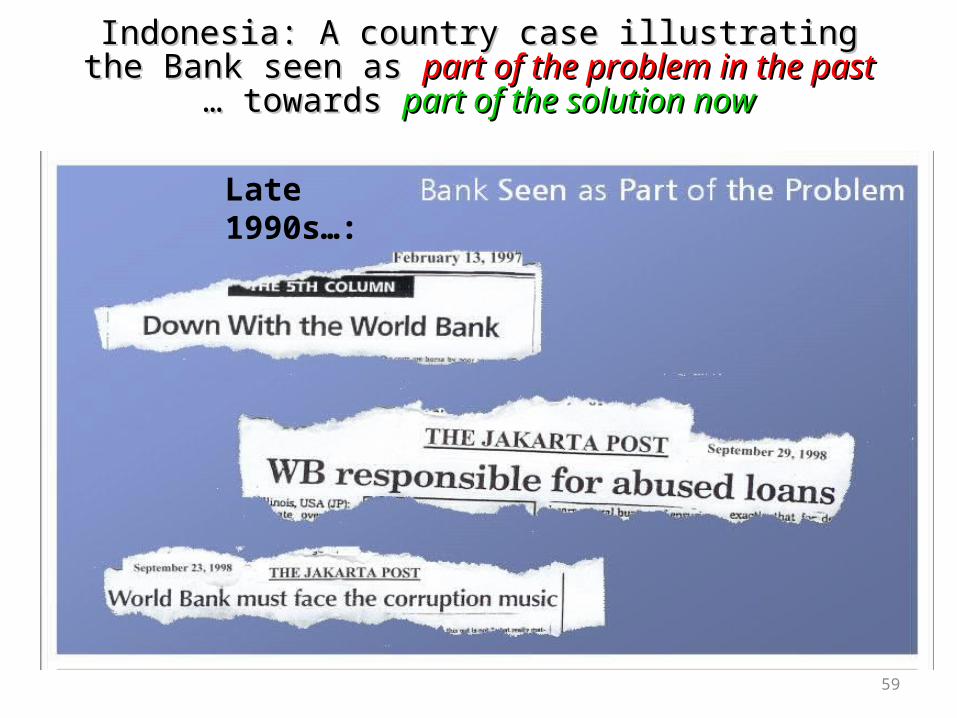
Indonesia: A country case illustrating the Bank seen as Indonesia: A country case illustrating the Bank seen as part part of the problem in the pastof the problem in the past … towards … towards part of the solution part of the solution
nownow
59
Late 1990s…:

2004: Indonesia’s Country Assistance Strategy (CAS) is on 2004: Indonesia’s Country Assistance Strategy (CAS) is on Governance – Harnessing thGovernance – Harnessing the entire Bank portfolio on e entire Bank portfolio on
Anti-Corruption (A-C)Anti-Corruption (A-C)Strategy: Fully Mainstreaming Governance/A-C in the CAS
Process—specifics:
• Lending volumes linked to governance/A-C progress
• Anti-corruption plans for all projects
• Selecting projects linked to governance challenges (saying No...)
• Picking winners at the local level—decentralized strategy
Staffing
• Resident Governance Leader/Advisor
• Anti-Corruption Committee; collaboration w/ civil society
• In-house: Fiduciary team; Investigators & Project advisors
60
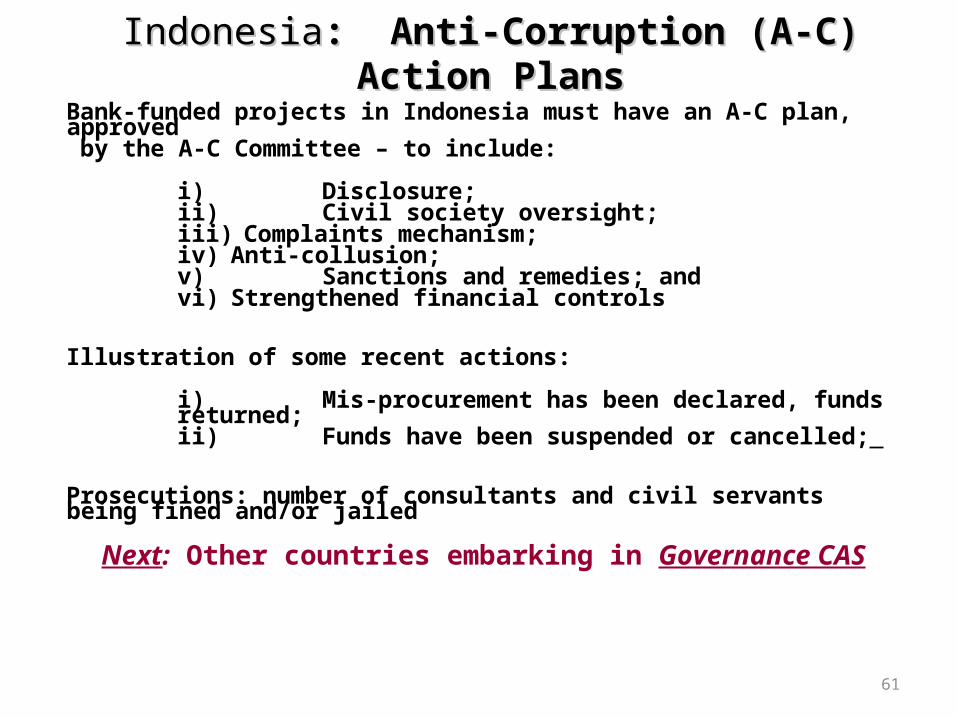
IndonesiaIndonesia: Anti-Corruption (A-C) Action Plans: Anti-Corruption (A-C) Action PlansBank-funded projects in Indonesia must have an A-C plan, approved by the A-C Committee – to include:
i) Disclosure;ii) Civil society oversight; iii) Complaints mechanism; iv) Anti-collusion; v) Sanctions and remedies; and vi) Strengthened financial controls
Illustration of some recent actions:
i) Mis-procurement has been declared, funds returned; ii) Funds have been suspended or cancelled;
Prosecutions: number of consultants and civil servants being fined and/or jailed
Next: Other countries embarking in Governance CAS
61
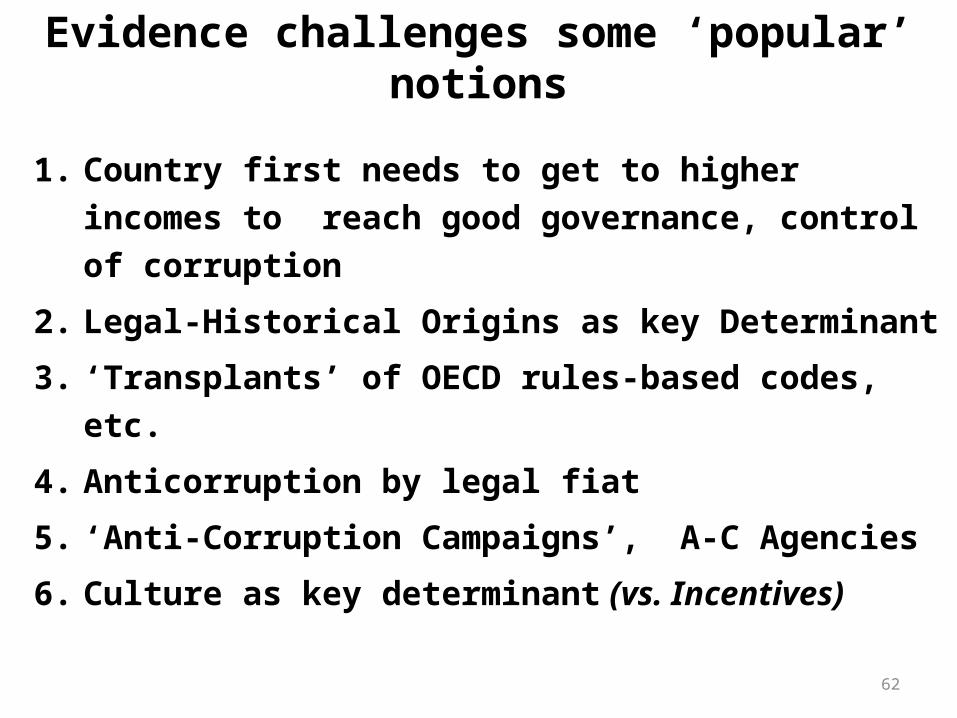
Evidence challenges some ‘popular’ notions
1. Country first needs to get to higher incomes to reach good governance, control of corruption
2. Legal-Historical Origins as key Determinant
3. ‘Transplants’ of OECD rules-based codes, etc.
4. Anticorruption by legal fiat
5. ‘Anti-Corruption Campaigns’, A-C Agencies
6. Culture as key determinant (vs. Incentives)
62

63
10%
40%
70%
LeadershipExample
EconomicDeregulation
TransparentBudget
Public SectorReform
Civil Liberties/Voice
PrivatizationAnti-CorruptionCommissions
% o
f re
sp
on
de
nts
th
at
ma
rk 'h
igh
'
Source: D. Kaufmann, ‘Corruption: The Facts’, Foreign Policy, Summer, 1997
Most effective Anticorruption Measures?Responses from Officials and Leaders in 62 countries
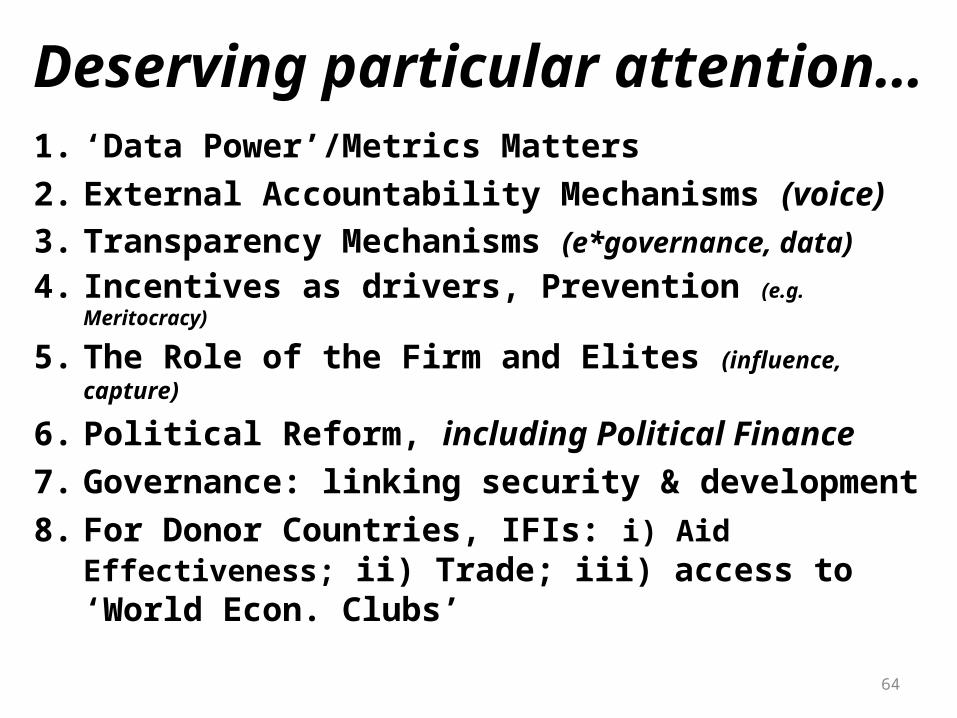
Deserving particular attention…1. ‘Data Power’/Metrics Matters2. External Accountability Mechanisms (voice)3. Transparency Mechanisms (e*governance, data)
4. Incentives as drivers, Prevention (e.g. Meritocracy)
5. The Role of the Firm and Elites (influence, capture)
6. Political Reform, including Political Finance7. Governance: linking security & development8. For Donor Countries, IFIs: i) Aid Effectiveness; ii)
Trade; iii) access to ‘World Econ. Clubs’ 64
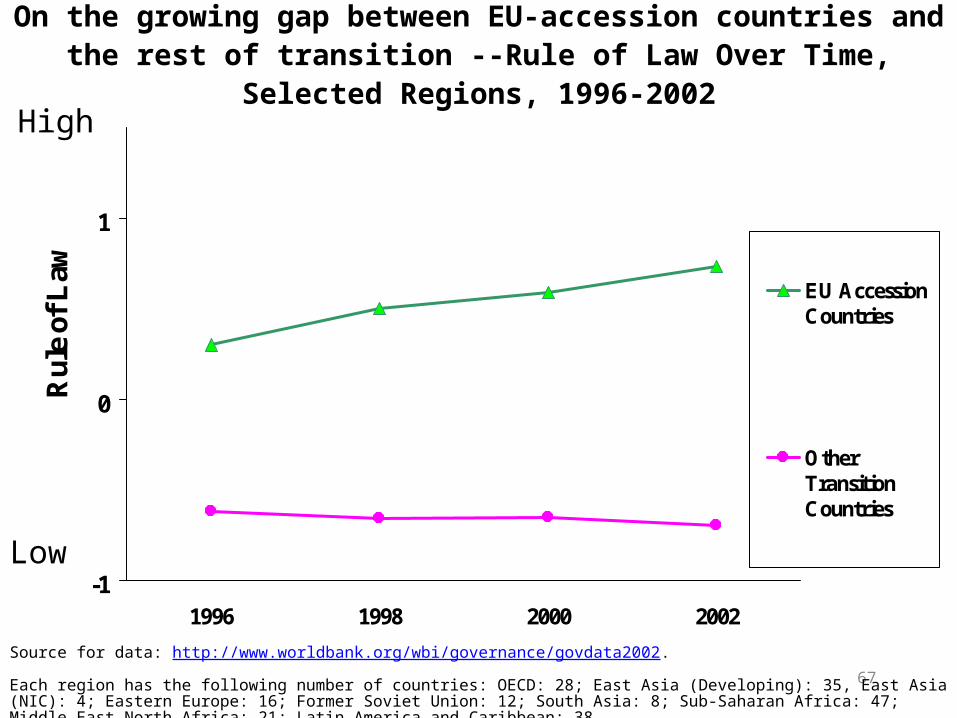
On the growing gap between EU-accession countries and the rest of transition --Rule of Law Over Time, Selected Regions, 1996-2002
-1
0
1
1996 1998 2000 2002
Rul
e of
Law
EU AccessionCountries
OtherTransitionCountries
67
Source for data: http://www.worldbank.org/wbi/governance/govdata2002.
Each region has the following number of countries: OECD: 28; East Asia (Developing): 35, East Asia (NIC): 4; Eastern Europe: 16; Former Soviet Union: 12; South Asia: 8; Sub-Saharan Africa: 47; Middle East North Africa: 21; Latin America and Caribbean: 38.
High
Low
68
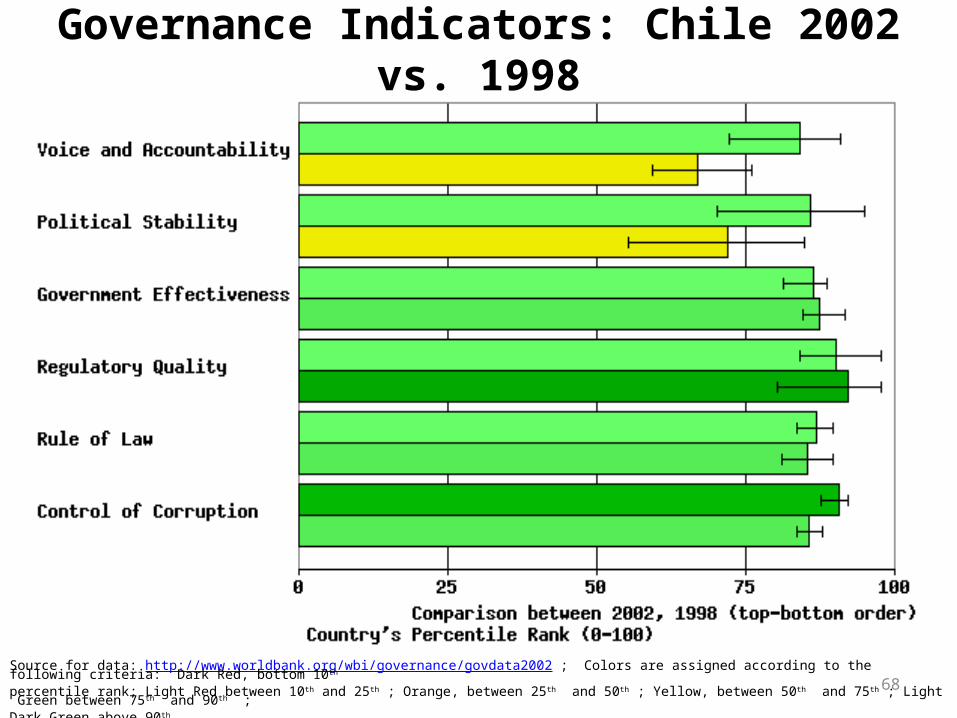
Governance Indicators: Chile 2002 vs. 1998
Source for data: http://www.worldbank.org/wbi/governance/govdata2002 ; Colors are assigned according to the following criteria: Dark Red, bottom 10th percentile rank; Light Red between 10th and 25th ; Orange, between 25th and 50th ; Yellow, between 50th and 75th ; Light Green between 75th and 90th ; Dark Green above 90th.