gloucestershire hospitals nhs foundation trust · 2018-04-17 · 4.3 the organisation uses the...
TRANSCRIPT


2
Gloucestershire Hospitals NHS Foundation Trust Annual Equality Report
2015/16
3
Contents
1. Introduction
2. Equality Act 2010 and the Public Sector Equality Duty (PSED)
3. Equality Delivery System
4. What are our 2016/17 equality objectives
5. The Population of Gloucestershire
6. Our patients/service users
7. Our Trust staff
8. Conclusion
4
1. Introduction Over the last year the Equality and Diversity Steering Committee has continued to bring this topic to the forefront of all policy decisions and service changes within our Trust. The focus remains on adhering to and delivering against the 2010 Equalities Act by ensuring we have visible leadership on equality issues. This is achieved by the high level attendance within the committee of a Non-Executive Director (as Chair), Director of Human Resources and Organisational Development, Director of Clinical Strategy, Joint Staff Side Chair and the Head of Patient Experience to name a few. To ensure compliance with the Public Sector Equality Duty, our Trust adopted the Equality Delivery System (EDS) commissioned by the Equality and Diversity Council. In November 2013, following evaluation and consultation by NHS England, ‘EDS2’ was launched, which contains 18 outcomes grouped into 4 goals – 2 for patient/service users and 2 for staff. Gloucestershire Hospitals NHS Foundation Trust (GHNHSFT) has a drive and passion to build on our relations with our diverse local population and identifying any health inequalities amongst our patient and service user groups. Equality is about creating a fairer society where everyone is encouraged to participate and has the opportunity to fulfil their potential. Diversity is about recognising and valuing difference for the benefit of the patient, carer, staff and public. The aim of our Trust is to ensure that service users and staff receive equitable, fair and consistent treatment irrespective of their origin and background. The NHS should be a service for everyone with equity of access and equity of treatment at its core. Provision of healthcare should be person centred and individuals should receive adequate information about their health needs and choices available to them. These principles remain fundamental to the Health Service and to our Trust which we will continually strive towards for the benefit of our patients and staff alike.

5
2. Equality Act 2010 and the Public Sector Equality Duty (PSED)
The Equality Act 2010 (the Act) replaced previous anti-discrimination laws with a single Act. It simplified the law, removing inconsistencies and making it easier for people to understand and comply with. It also strengthened the law in important ways, to help tackle discrimination and inequality.
The Public Sector Equality Duty (section 149 of the Act) came into force on 5 April 2011. The Equality Duty applies to public bodies and others carrying out public functions. It supports good decision-making by ensuring public bodies consider how different people will be affected by their activities, helping them to deliver policies and services which are efficient and effective; accessible to all; and which meet different people’s needs.
The Equality Duty is supported by specific duties, set out in regulations which came into force on 10 September 2011. The specific duties require public bodies to publish relevant, proportionate information demonstrating their compliance with the Equality Duty; and to set themselves specific, measurable equality objectives.
Publishing relevant equality information will make public bodies transparent about their decision-making processes, and accountable to their service users. It will give the public the information they need to hold public bodies to account for their performance on equality. The specific duties require public bodies to:
• publish information to show their compliance with the Equality Duty, at least annually; and
• set and publish equality objectives, at least every four years.
All information must be published in a way which makes it easy for people to access it. Public bodies subject to the specific duties must publish information to show their compliance with the Equality Duty. This means that the information they publish must show that they had due regard to the need to:
• eliminate unlawful discrimination, harassment and victimisation and any other conduct prohibited by the Act; • advance equality of opportunity between people who share a protected characteristic and people who do not share it; and

6
• foster good relations between people who share a protected characteristic and people who do not share it.
These are described as the three aims of the Equality Duty.
The protected characteristics covered by the Equality Duty are: • age • disability • gender reassignment • marriage and civil partnership (but only in respect of eliminating unlawful discrimination) • pregnancy and maternity • race – this includes ethnic or national origins, colour or nationality • religion or belief – this includes lack of belief • sex • sexual orientation
Public bodies must publish information to show that they consciously thought about the three aims of the Equality Duty as part of the process of decision-making. The information published must include: • information relating to employees who share protected characteristics (for public bodies with 150 or more employees); and • information relating to people who are affected by the public body’s policies and practices who share protected characteristics (for example, service users).

7
3. Equality Delivery System The Equality Delivery System (EDS) is a tool kit designed to help the NHS improve the services they provide for their local communities, consider health inequalities in their locality and provide better working environments for those who work in the NHS. This system has been adopted by our Trust throughout the last 12 months and has helped us to:
• meet the public sector Equality Duty of the Equality Act 2010 • deliver on the NHS Outcomes Framework and the NHS Constitution • and, as a provider, meet the Care Quality Commission’s “Essential
Standards of Quality and Safety” Within EDS are four goals, with each goal having separate outcomes as shown below. Goal 1 - Better health outcomes for all Outcome 1.1 Services are commissioned, designed and procuredto meet the health
needs of local communities, promote well-being, and reduce health inequalities
1.2 Individual patients’ health needs are assessed, and resulting services provided, in appropriate and effective ways
1.3 Changes across services for individual patients are discussed with them, and transitions are made smoothly
1.4 The safety of patients is prioritised and assured. In particular, patients are free from abuse, harassment, bullying, violence from other patients and staff, with redress being open and fair to all
1.5 Public health, vaccination and screening programmes reach and benefit all local communities and groups
Goal 2 - Improved patient access and experience Outcome 2.1 Patients, carers and communities can readily access services, and should
not be denied access on unreasonable grounds 2.2 Patients are informed and supported to be as involved as they wish to be
in their diagnoses and decisions about their care, and to exercise choice about treatments and places of treatment

8
2.3 Patients and carers report positive experiences of their treatment and care outcomes and of being listened to and respected and of how their privacy and dignity is prioritised
2.4 Patients and carers complaints about services, and subsequent claims for redress, should be handled respectfully and efficiently
Goal 3 - Empowered, engaged and well-supported staff Outcome 3.1 Recruitment and selection processes are fair, inclusive and transparent
so that the workforce becomes as diverse as it can be within all occupations and grades
3.2 The NHS is committed to equal pay for work of equal value and expects employers to use equal pay audits to help fulfil their legal obligations
3.3 Through support, training, personal development and performance appraisal, staff are confident and competent to do their work, so that services are commissioned or provided appropriately
3.4 Staff are free from abuse, harassment, bullying, violence from both patients and their relatives and colleges, with redress being open and fair to all
3.5 Flexible working options are made available to all staff, consistent with the needs of the service, and the way that people lead their lives. (Flexible working may be a reasonable adjustment for disabled members of staff or carers.)
3.6 The workforce is supported to remain healthy, with a focus on addressing major health and lifestyle issues that affect individual staff and the wider population
Goal 4 - Inclusive leadership at all levels Outcome 4.1 Boards and senior leaders conduct and plan their business so that
equality is advanced, and good relations fostered, within their organisations and beyond
4.2 Middle managers and other line managers support and motivate their staff to work in culturally competent ways within a work environment free from discrimination
4.3 The organisation uses the ‘Competency Framework for Equality and Diversity Leadership’ to recruit, develop and support strategic leaders to advance equality outcomes

9
In November 2013 a refreshed and streamlined EDS – called EDS2, was launched following evaluation and consultation of the original system by NHS England. There is much in common with the original EDS but some important changes have been made. There are still 18 outcomes, two of the original EDS outcomes have been dropped and two new outcomes added, along with a simplified rewording of each EDS2 outcome. The assessment and grading component of EDS2 has been simplified with just one factor to focus on within the grading system. For most outcomes the key question is ‘How well do people from protected groups fare compared with people overall?’. The revised outcomes are: Goal 1 - Better health outcomes 1.1 Services are commissioned, procured, designed and delivered to meet
the health needs of local communities 1.2 Individual peoples health needs are assessed and met in appropriate and
effective ways 1.3 Transitions from one service to another, for people on care pathways, are
made smoothly with everyone well-informed 1.4 When people use NHS services their safety is prioritised and they are
free from mistakes, mistreatment and abuse 1.5 Screening, vaccination and other health promotions services reach and
benefit all local communities Goal 2 - Improved patient access and experience 2.1 People, carers and communities can readily access hospital, community
health or primary care services and should not be denied access on unreasonable grounds
2.2 People are informed and supported to be as involved as they wish to be in decisions about their care
2.3 People report positive experiences of the NHS 2.4 Peoples complaints about services are handled respectfully and efficiently Goal 3 – A representative and supported workforce 3.1 Fair NHS recruitment and selection processes lead to a more
representative workforce at all levels 3.2 The NHS is committed to equal pay for work of equal value and expects
employers to use equal pay audits to help fulfil their legal obligations 3.3 Training and development opportunities are taken up and positively
evaluated by all staff 3.4 When at work, staff are free from abuse, harassment, bullying and
violence from any source

10
3.5 Flexible working options are available to all staff consistent with the needs of the service and the way people lead their lives
3.6 Staff report positive experiences of their membership of the workforce Goal 4 – Inclusive leadership 4.1 Boards and senior leaders routinely demonstrate their commitment to
promoting equality within and beyond their organisations 4.2 Middle managers and other line managers support their staff to work in
culturally competent ways within a work environment free from discrimination
4.3 Papers that come before the Board and other major Committees identify equality-related impacts including risks, and say how these risks are to be managed
Our Trust agreed to make the transition from EDS to EDS2 in April 2014.
11
4. What are our 2015/16 equality objectives Our Trust Equality and Diversity Committee has set 2 objectives for 2015/16 ensuring there is a strong focus on current national issues. Limiting this focus will allow us to concentrate on each on in more detail to ensure we make a greater impact on these matters across our Trust. Each objective will be led and driven by senior members of the committee to ensure focus and drive for achieving these. The objectives are: Equality Objective 1 – BME Staff Engaging with this group of staff will support further development that is being built upon through the Workforce Race Equality Standards. We will look to set up a BME network within the Trust to provide a voice for this group of staff Equality Objective 2 – Working with staff who have a disability We will support staff into employment who have learning disabilities, where we have committed to support this through the national campaign

12
5. The Population of Gloucestershire
Publishing equality information about our population and Gloucestershire as a whole helps us to make informed decisions based on the needs of our communities and patients/service users. This will ensure that we deliver a local Health Service that meets these requirements and ensures we adapt to any changes. Appendix A – Gloucestershire County Council Population Profile (2016)

13
6. Our patients/service users Allowing us to view and compare our inpatient and outpatient data of that of the Gloucestershire population allows a more meaningful and tangible way of looking at our services to ensure development and redesign is focussed in the correct areas due to the ongoing change of the local residents. It is noted that users can be from outside of the county; however the main users will be those that reside within it. Inpatient Data The data provided below spans April 2015 to March 2016 for our Trust: Table 25: Inpatients by Gender
Table 26: Inpatients by Age
14
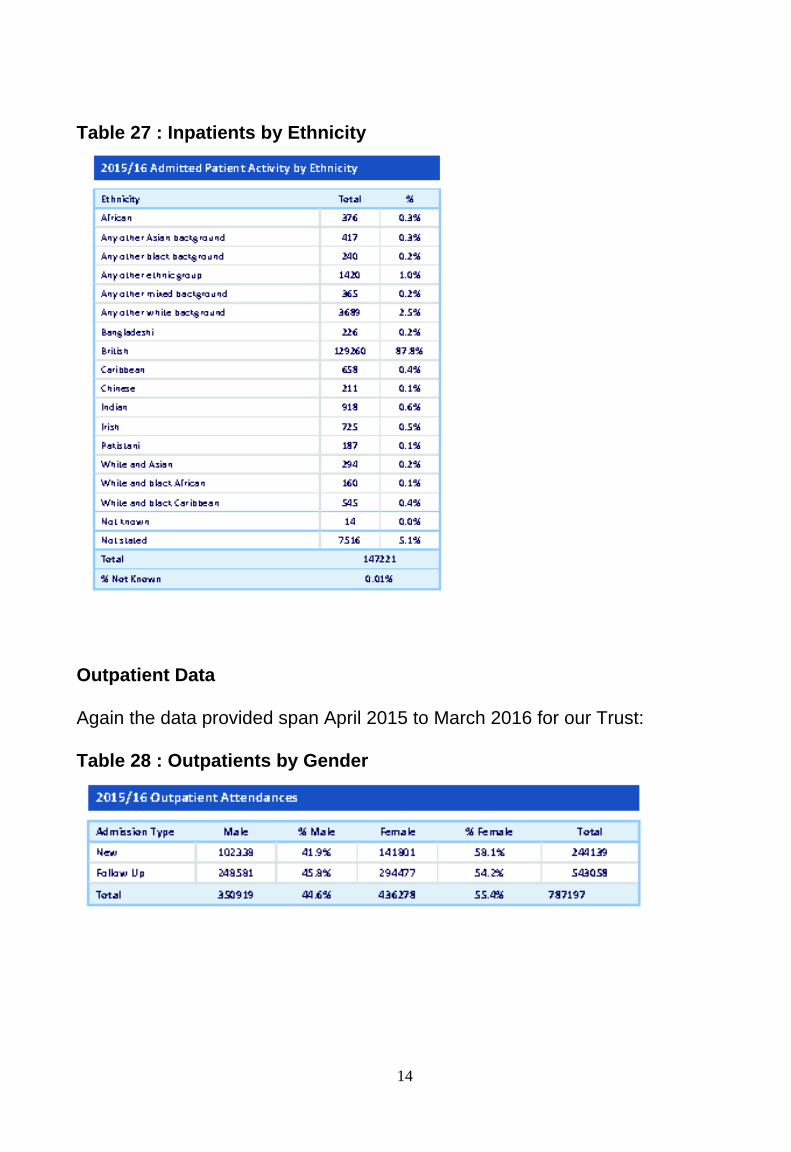
Table 27 : Inpatients by Ethnicity
Outpatient Data Again the data provided span April 2015 to March 2016 for our Trust: Table 28 : Outpatients by Gender
15
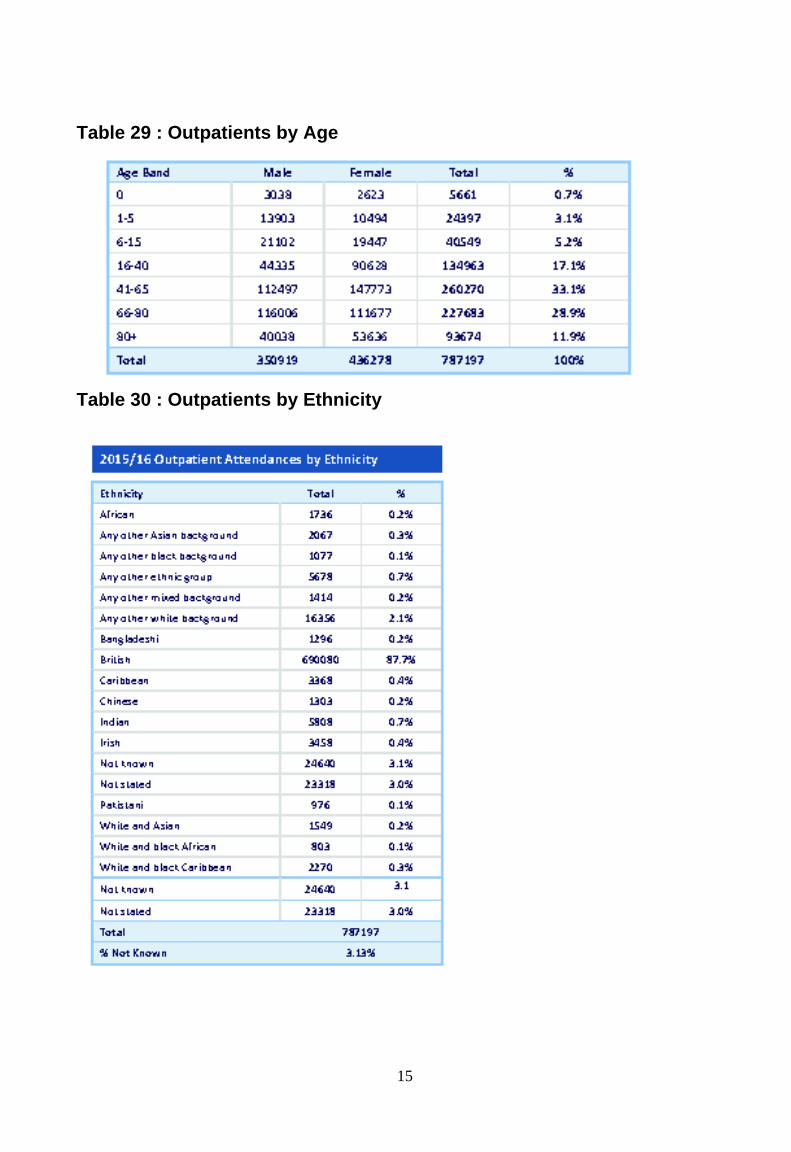
Table 29 : Outpatients by Age
Table 30 : Outpatients by Ethnicity

16
The data for both our inpatient and outpatient appointments are limited to three of the nine protected characteristics. It is anticipated that with the new clinical information system (Trakcare) being introduced from 2016, the quality of data will improve and reporting against the nine protected characteristics will be available.

17
7. Our Trust Staff With circa 8,000 employees, our Trust is the largest employer in the county. The majority of Trust staff live in the local communities so they and their families are also users of our services. The Trust has always been very clear on the link between a skilled, committed and engaged workforce and the delivery of high quality patient care and this underpins many of our plans for staff development and engagement. As an employer we are committed to equality and valuing diversity within our workforce and to ensure that these commitments, reinforced by our values, are embedded in our day-to-day working practices. We continue to operate to a set of values, developed in conjunction with staff and these are the values to which all staff have agreed to live by and which are reinforced through a number of Trust ‘institutions’, including both induction and appraisal. Setting this tone for all staff is crucial, but critical at the point of joining. Induction is mandatory for all staff to attend, from new Executive Directors down and this event firmly places patients and the Trust values at the heart of everything we do. It is reviewed frequently and has enabled us to reflect and reinforce important developments in our trust, most notably, the introduction of the NHS Constitution, the launch of our ‘Kindness and Respect’ behaviours, our focus on care and compassion through the ‘6 C’s’ (care, compassion, competence, communication, courage and commitment) and more recently our development of our procedures supporting ‘Raising Concerns’. Workforce Data The following tables provide information between April 2015 and March 2016 about our staff recruitment and the makeup of our full workforce, comparing it to the nine protected characteristics if available. Non Agenda for Change (National Terms and Conditions of Service) includes senior managers and apprentices. Due to the permanence of many of our staff, most of the data we hold historically on them will not include all of the 9 protected characteristics. As we see the turnover of these staff, the data overtime will become more meaningful for the purposes of this report. Whilst significantly more information is now gathered at recruitment stage, much of this is voluntary and must not be considered in recruitment decisions.

18
Table 31 : Recruitment by Gender Description Applications % Shortlisted % Short / Short Appointed % Apptd / Apptd Male 4,329 26.00% 1,188 20.40% 193 15.90% Female 12,307 73.80% 4,615 79.30% 1,017 83.80% Undisclosed 44 0.30% 14 0.20% 4 0.30%
Table 32 : Recruitment with a Disability
Description Applications % Shortlisted % Short / Short Appointed % Apptd / Apptd
Yes 560 3.40% 260 4.50% 35 2.90% No 15,945 95.60% 5,495 94.50% 1,163 95.80% Undisclosed 175 1.00% 62 1.10% 16 1.30%
Table 33 : Recruitment by Age Description Applications % Shortlisted % Short / Short Appointed % Apptd / Apptd Under 18 231 1.40% 63 1.10% 20 1.60% 18 to 19 748 4.50% 234 4.00% 63 5.20% 20 to 24 2,843 17.00% 989 17.00% 253 20.80% 25 to 29 3,414 20.50% 1,062 18.30% 239 19.70% 30 to 34 2,564 15.40% 866 14.90% 162 13.30% 35 to 39 1,611 9.70% 592 10.20% 111 9.10% 40 to 44 1,447 8.70% 595 10.20% 122 10.00% 45 to 49 1,359 8.10% 539 9.30% 100 8.20% 50 to 54 1,265 7.60% 497 8.50% 91 7.50% 55 to 59 856 5.10% 278 4.80% 41 3.40% 60 to 64 275 1.60% 78 1.30% 9 0.70% 65 to 69 22 0.10% 8 0.10% 1 0.10% 70 and over 21 0.10% 12 0.20% 2 0.20% Undisclosed 24 0.10% 4 0.10% 0 0.00%

19
Table 34 : Recruitment by Religion Description Applications % Shortlisted % Short / Short Appointed % Apptd / Apptd Atheism 2,307 13.80% 922 15.90% 236 19.40% Buddhism 123 0.70% 30 0.50% 5 0.40% Christianity 8,725 52.30% 3,230 55.50% 681 56.10% Hinduism 726 4.40% 167 2.90% 19 1.60% Islam 1198 7.20% 217 3.70% 15 1.20% Jainism 19 0.10% 4 0.10% 0 0.00% Judaism 13 0.10% 3 0.10% 0 0.00% Sikhism 83 0.50% 19 0.30% 3 0.20% Other 1,823 10.90% 614 10.60% 123 10.10% Undisclosed 1663 10.00% 611 10.50% 132 10.90% Table 35 : Recruitment by Sexual Orientation Description Applications % Shortlisted % Short / Short Appointed % Apptd / Apptd Lesbian 118 0.70% 51 0.90% 8 0.70% Gay 110 0.70% 37 0.60% 5 0.40% Bisexual 232 1.40% 66 1.10% 8 0.70% Heterosexual 14,978 89.80% 5,268 90.60% 1,114 91.80% Undisclosed 1242 7.40% 395 6.80% 79 6.50% Table 36 : Recruitment by Ethnicity Description Applications % Shortlisted % Short / Short Appointed % Apptd / Apptd
WHITE - British 10,046 60.20% 4,004 68.80% 959 79.00%
WHITE - Irish 156 0.90% 69 1.20% 15 1.20%
WHITE - Any other white background 1,404 8.40% 361 6.20% 66 5.40%
ASIAN or ASIAN BRITISH - Indian 2,010 12.10% 589 10.10% 58 4.80%
ASIAN or ASIAN BRITISH - Pakistani 460 2.80% 82 1.40% 2 0.20%
ASIAN or ASIAN BRITISH - Bangladeshi 148 0.90% 29 0.50% 3 0.20%
ASIAN or ASIAN BRITISH – Any other Asian background 499 3.00% 148 2.50% 28 2.30%
MIXED - White & Black Caribbean 142 0.90% 42 0.70% 13 1.10%
MIXED - White & Black African 71 0.40% 17 0.30% 2 0.20%
MIXED - White & Asian 66 0.40% 21 0.40% 2 0.20%
MIXED - any other mixed background 83 0.50% 26 0.40% 3 0.20%
BLACK or BLACK BRITISH - Caribbean 186 1.10% 63 1.10% 9 0.70%
BLACK or BLACK BRITISH - African 754 4.50% 184 3.20% 27 2.20%
BLACK or BLACK BRITISH - Any other black background 45 0.30% 13 0.20% 2 0.20%
OTHER ETHNIC GROUP - Chinese 83 0.50% 24 0.40% 3 0.20%
OTHER ETHNIC GROUP - Any other ethnic group 263 1.60% 71 1.20% 7 0.60%
Undisclosed 264 1.60% 74 1.30% 15 1.20%

20
Table 37 : Recruitment by Marital Status Description Applications % Shortlisted % Short / Short Appointed % Apptd / Apptd Married 6,296 37.70% 2,246 38.60% 418 34.40% Single 8,579 51.40% 2,883 49.60% 655 54.00% Civil partnership 336 2.00% 119 2.00% 27 2.20% Legally separated 122 0.70% 46 0.80% 15 1.20% Divorced 867 5.20% 331 5.70% 51 4.20% Widowed 91 0.50% 34 0.60% 8 0.70% Undisclosed 389 2.30% 158 2.70% 40 3.30% Table 38 : Total of Workforce - Pay band v Gender
Heads
Gender Female Male AfC Band
5,651 1,095 Band 1
194 100 Band 2
1,310 287 Band 3
601 92 Band 4
394 82 Band 5
1,478 198 Band 6
1,000 146 Band 7
440 89 Band 8a
82 31 Band 8b
39 22 Band 8c
13 6 Band 8d
22 6 Band 9
2 Non AFC
78 34
Heads Gender Female Male
Role 796 581 Associate Specialist (Closed) 6 14 Clinical Assistant 5 2 Consultant 124 249 Foundation Year 1 32 19 Foundation Year 2 32 19 Hospital Practitioner 2 3 Medical Director 2 1 Senior House Officer (Closed) 4 3 Specialty Doctor 38 31 Specialty Registrar 543 229 Trust Grade Doctor - Career Grade level 4 Trust Grade Doctor - Specialist Registrar Level (Closed) 1 Trust Grade Doctor - Specialty Registrar 8 6

21
Table 39 : Total Workforce – Pay Band/Staff Group v Age
Age Band
16 - 20 21 - 25
26 - 30
31 - 35
36 - 40
41 - 45
46 - 50
51 - 55
56 - 60
61 - 65
66 - 70
AfC Band Band 1 7 15 17 30 25 37 34 46 45 26 10 Band 2 68 198 195 128 132 143 190 218 187 95 35 Band 3 6 46 71 62 50 81 84 114 112 49 16 Band 4 1 20 57 59 39 57 66 90 58 26 2 Band 5 199 294 208 221 220 197 160 126 40 11 Band 6 37 111 163 145 175 155 184 129 44 3 Band 7 24 51 70 84 110 112 65 12 1 Band 8a 2 12 14 17 27 25 14 2 Band 8b 1 2 5 13 15 14 9 2 Band 8c 1 1 6 6 5 Band 8d 1 10 6 1 5 4 1 Band 9 1 1 Non AfC* 63 76 467 294 138 126 126 96 61 27 9
145 591 1,240 1,019 846 955 1,016 1,070 812 323 87
Age
Band 16 - 20 21 -
25 26 - 30
31 - 35
36 - 40
41 - 45
46 - 50
51 - 55
56 - 60
61 - 65
66 - 70
Staff Group Add Prof Scientific and Technic 11 33 58 35 33 34 32 14 9 2 Additional Clinical Services 98 195 210 147 128 148 147 160 127 66 17 Administrative and Clerical 43 92 142 120 128 192 238 287 244 94 24 Allied Health Professionals 64 62 56 50 29 41 40 34 8 Estates and Ancillary 3 23 22 41 39 50 62 96 91 54 23 Healthcare Scientists 15 30 26 28 36 42 33 34 17 1 Medical and Dental 55 173 134 98 110 118 86 55 26 9 Nursing and Midwifery Registered 125 273 268 295 344 325 333 213 49 11 Students 1 6 1 3 1
145 586 946 853 801 943 1,007 1,067 812 323 87

22
Table 40 : Total Workforce – Pay Band v Ethnicity
White Mixed Asian Black Chinese Other Not Stated
AfC Band
Band 1 214 5 11 38 1 13 12 Band 2 1,380 13 74 31 6 45 48 Band 3 645 4 13 12 2 7 10 Band 4 447 1 10 8 2 8 Band 5 1,312 16 159 37 6 119 27 Band 6 1,035 4 25 16 3 13 50 Band 7 499 3 7 5 2 4 9 Band 8a
108 0 3 0 1 0 1
Band 8b
57 0 3 1 0
Band 8c
19 0 0 0 0
Band 8d
28 0 0 0 0
Band 9 2 0 0 0 0 Non AfC*
84 1 3 0 0 6
5,830 47 308 148 21 203 171
White Mixed Asian Black Chinese Other Not
Stated
Role Associate Specialist (Closed) 10 7 1 2 Clinical Assistant 6 1 Consultant 297 2 47 2 8 9 Foundation Year 1 47 1 1 2 Foundation Year 2 40 1 1 9 Hospital Practitioner 3 2 Medical Director 3 Senior House Officer (Closed) 5 2 Specialty Doctor 39 1 21 1 6 1 Specialty Registrar 616 21 49 7 8 12 59 Trust Grade Doctor - Career Grade level 3 1 Trust Grade Doctor - Specialist Registrar Level (Closed) 1 Trust Grade Doctor - Specialty Registrar 8 2 1 2 1
1,078 26 134 17 11 30 81

23
Table 41 : Total Workforce - Full/Part Time v Gender
Full Time Part Time
Total 4,619 3,622 Female 3,212 3,343 Male 1,407 279
Table 42 : Total Workforce – Gender v Pay Band v Full/Part Time
Gender Female Male Female Male
AfC Band Total 2,622 872 3,136 231 Band 1 31 41 164 59 Band 2 488 202 862 86 Band 3 276 79 339 16 Band 4 194 74 203 8 Band 5 803 171 689 27 Band 6 411 130 602 16 Band 7 237 80 223 11 Band 8a 58 28 26 4 Band 8b 30 21 9 1 Band 8c 8 6 5 1 Band 8d 11 6 11 Band 9 2 Non AfC band
75 32 3 2
Full Time Part Time Female Male Female Male Assignment Count Assignment Count Assignment Count Assignment Count
Role Total 590 535 207 48 Associate Specialist (Closed) 3 12 4 2 Clinical Assistant 5 3 Consultant 75 230 49 20 Foundation Year 1 32 19 Foundation Year 2 32 19 Hospital Practitioner 2 3 Medical Director 1 1 1 Senior House Officer (Closed) 3 3 1 Specialty Doctor 12 23 26 8 Specialty Registrar 426 219 117 10 Trust Grade Doctor - Career Grade level 4 Trust Grade Doctor - Specialist Registrar Level (Closed) 1 Trust Grade Doctor - Specialty Registrar 6 5 2 1

24
Annual Staff Survey Between October and December 2015, the national NHS staff survey was undertaken, inviting staff to share their experiences of working in Gloucestershire Hospitals Foundation Trust (GHFT). The Board opted to undertake a full census of all staff across the Trust recognising that the link between employee engagement and patient experience is so fundamental that it is vital to give the opportunity for all of our workforce to have their say. Our response rate in the 2015 survey dropped to 51% in comparison to 54% last year. This remains a national trend, possibly attributable to the amount of surveys being requested and we remain in the highest 20% of response rates for ‘acute’ trusts in England. The results of the survey are received by the Trust in two ways. The main survey provider (Quality Health) reports the ‘raw data’ scores for every single question, including a comparison with the average score for other Trusts as well as progress over the prior year. The scores, which are not widely published, are broken down into 5 main areas – Your Job, Your Personal Development, Your Managers, Your Organisation and Your Health, Wellbeing and Safety at work. The survey went through something of an overhaul in 2015 and whilst the majority of questions remained the same, a number had subtle changes involving a single word (eg ‘care’ instead of ‘patient care’), or a reclassification of responses. Therefore, for a number of questions, there is not a precise comparison with the prior year. This report does not break the score down into staff groups or divisions and as a consequence allows for general conclusions rather than targeted actions. The main published report sees the findings of the questionnaires summarised by the national survey centre PickerEurope on behalf of the Department of Health and presented in the form of 32 key findings (KF) categorised to reflect the four NHS Constitution pledges to staff. Staff Pledge 1: To provide all staff with clear roles and responsibilities and rewarding jobs. Staff Pledge 2: To provide all staff with personal development, access to appropriate training for their jobs and line management support to enable them to fulfil their potential. Staff Pledge 3: To provide support and opportunities for staff to maintain their health, well-being and safety. Staff Pledge 4: To engage staff in decisions that affect them, the services they provide and empower them to put forward ways to deliver better and safer services.

25
The experiences of staff working in GHFT and the results of the survey are set in the context of ongoing challenges – both local and national. This year’s survey results suggest that the many targeted work streams being undertaken throughout the Trust are leading to some level of improvement, but not at the pace required. There is still significant work to be done in maintaining and accelerating progress and this will require sustained energy and commitment over several more years yet. Appendix 1, provides a full breakdown of Trust scores, however summarised scores are presented below in the following way;
• Staff Engagement • Progress against the rolling action plans • Top and Bottom Ranking Scores • Improvements and deterioration since last year • Key observations by Division and Staff Group
Appendix B – Gloucestershire Hospitals NHS Foundation Trust Main Board Paper February 2016 (Staff Survey Results)
26
8. Conclusion
In this report we have given an update on our progress to deliver against the Public Sector Equality Duty and some of the activities that are contributing towards reducing or minimising disadvantages suffered by people due to their protected characteristics. The patient data which we have at our disposal do not compare with what we know of the Gloucestershire community demographics; due to quantifying the number of individual patients that have used our services and who may have had repeat visits, which skews the results. Very little data are currently gathered on protected characteristics of sexual orientation, transgender, marital status or maternity and as such comparisons of how we are progressing in these areas can only be made by the positive feedback that we receive from these groups. Data gathering will always be problematic; however with the introduction of the new Clinical Information System (Smartcare), we will be able to tackle this issue and improve data recording, allowing us to have a better understanding of our service users to proactively change and develop the experiences that they have.