glycemic research institute® - graeter's ice … · glycemic research institute® u.s....
TRANSCRIPT
GLYCEMIC RESEARCH INSTITUTE®
GLYCEMIC RESEARCH LABORATORIES
BOARD APPROVED HUMAN IN VIVO CLINICAL TRIALS
U.S. Government Accredited Certification Organization
Glycemic.com
OFFICIAL CLINICAL TRIALS
GLYCEMIC RESEARCH INSTITUTE® LABORATORIES GLYCEMIC SOLUTIONS, LLC
111 2nd Avenue NE Suite 325
St. Petersburg, FL 33701 727.894.6900
OFFICIAL E MAIL TRANSMISSION
TO: Richard Graeter, CEO
Graeter’s Ice Cream FAX: [email protected]
FROM: Glycemic Research Institute®
Clinical Trials Laboratories Glycemic.com
RE: Official Report: Graeter’s Ice
Cream (3 Test Foods) DATE: JUNE 29, 2014 ENCLOSED: Page 1 of 22
GLYCEMIC RESEARCH INSTITUTE® U.S. Government Accredited Certification Organization
HUMAN NUTRITION & BIOCHEMISTRY DIVISION
Glycemic Index & Load Clinical Trials Obesity Research & Clinical Trials Diabetes Research & Clinical Trials
Adipose Tissue Fat-Storage Investigations & Trials
HUMAN IN VIVO CLINICAL TRIALS LABORATORY
OFFICIAL CLINICAL TRIALS LABORATORY
GLYCEMIC RESEARCH INSTITUTE® LABORATORIES GLYCEMIC SOLUTIONS 111 Second Avenue N.E.
Suite 325 St. Petersburg, FL 33701
BOARD CERTIFIFED HUMAN IN VIVO CLINICAL TRIALS
CLINICAL STUDY
STATEMENT OF INVESTIGATION GIC2-2014
TEST FOOD:
GRAETER’S ICE CREAM “A Little Less Indulgent” brand
TRIAL PERIOD: 2014
www.Glycemic.com
GLYCEMIC RESEARCH INSTITUTE® GLYCEMIC RESEARCH LABORATORIES
U.S. Government Accredited Certification Organization
Glycemic.com
CLINICAL ASSESSMENT of GLYCEMIC INDEX and LOAD
RESEARCH CONDUCTED FOR: GRAETER’S ICE CREAM GRAETER’S MANUFACTURING COMPANY Richard Graeter, President/CEO 1175 Regina Graeter Way Cincinnati, Ohio 45216 USA [email protected] Graeters.com Phone: 513.721.6610 Fax: 513.761.1909 REPORT: 2014 Trial Scope: Human Diabetic & Non-Diabetic Subjects orally ingesting selected Test Foods to determine Glycemic Perimeters & Diabetic Perimeters. Test Foods: Graeter’s Ice Cream (3 Test Products) Subjects: Pre-Screened Non-Diabetics & Diabetics Report ID: GIC2-2014 Pages 1-20
Page 2 of 20 Clinical Assessment/GIC2-2014/Glycemic Research Laboratories
CLINICAL PROTOCOL Human In Vivo Clinical Research trials were conducted by the Official Clinical Testing Laboratory of the Glycemic Research Institute® (GRI), Glycemic Research Laboratories (GRL), Glycemic Solutions, at their Certified Human In Vivo Testing Facility, to determine the metabolic response of selected products described as “Graeter’s Ice Cream” (herein the “Test Food”). The Test Foods were submitted by Richard Graeter/Graeter’s Manufacturing Company and arrived at the Official GRI Clinical Testing Facility (Glycemic Research Laboratories, Glycemic Solutions). The Test Food was identified, inventoried, and taken by the staff to the Clinical Trials facility. The clinical trials were conducted under Board Approval utilizing Diabetics and Non-Diabetic subjects. The Test Foods were orally given to human subjects, and cross analyzed. Bread Average Area Under the Curve (AUC) and Test Food AUC were analyzed from serum readings and converted to the Glucose Scale. OBJECTIVE: To determine the glycemic index and glycemic load, associated with human oral ingestion of the Test Food (s) appropriate for Low Glycemic for Non-Diabetics and Low Glycemic for Diabetics (type 2). DEFINITIONS According to the American Diabetes Association, the Glycemic Index (GI) is defined as “A scale that ranks carbohydrates by how much they raise blood glucose levels compared to a reference food.” According to the American Diabetes Association, Glycemic Load (GL) is defined as “The degree of glycemic response and insulin demand produced by a specific amount of a specific food.” Glycemic Load represents the quantity and the quality of a Test Food. GL can help predict the blood glucose response to a specific amount of a food or beverage.
Page 3 of 20 Clinical Assessment/GIC2-2014/Glycemic Research Laboratories
GLYCEMIC INDEX BENEFITS
• Low glycemic diets help lower blood glucose levels. High glycemic foods, beverages and diets are related to weight gain, obesity, type 2 diabetes, cholesterol levels, and heart disease risk.
• Low glycemic diets allow for improved weight control and lower BMI • Low glycemic diets decrease risk of type 2 diabetes • Low glycemic foods allow for larger portions while high glycemic
foods require smaller portion control to maintain healthy weight and blood glucose
GLYCEMIC INDEX & GLYCEMIC LOAD QUALIFICATIONS GLYCEMIC RESEARCH INSTITUTE® PROTOCOLS FOR LOW GLYCEMIC GLYCEMIC INDEX (GI) & GLYCEMIC LOAD (GL) Per accepted guidelines by the World Health Organization and the Glycemic Research Institute®, the following numbers represent Low GI and Low GL limits: • Low GI 55 or less • Low GL 10 or less
GLYCEMIC INDEX VS GLYCEMIC LOAD The Glycemic Index (GI) is more important than the Glycemic Load (GL). A product cannot be considered legally Low Glycemic unless the Glycemic Index is low and the Glycemic Load is low. Having a low Glycemic Load does not make a product Low Glycemic.
In clinical trials, the glycemic load (GL) relates to the impact of the Test Food consumed, taking the glycemic index into account, and provides a broader picture of the total impact of a Test Food.
Page 4 of 20 Clinical Assessment/GIC2-2014/Glycemic Research Laboratories The Glycemic Index (GI) provides clinical proof of the blood sugar response in humans, and how that Test Food elevates blood glucose levels (and ultimately Insulin levels and adipose tissue fat-storage). The Glycemic Load (GL) is the glycemic index divided by 100 multiplied by its available carbohydrate content (i.e. carbohydrates minus fiber) in grams. Both the GI and GL are required in order to determine the overall effect of a Test Food. EXAMPLE: Watermelon has a high Glycemic Index, but a fairly low Glycemic Load. In 120 grams of watermelon, there are six grams of available carbohydrate, making the GL lower than would be expected for a food with a high Glycemic Index. The lower GL of watermelon does not make it a Low Glycemic food, or an acceptable food for dieters or diabetics, as the overall impact of watermelon is contraindicated for weight loss or blood glucose balance. ANALYSIS DIRECTIVE OF THIS TRIAL The glycemic index, glycemic load, and glycemic response in humans were analyzed during this clinical study. The Test Foods are fed to human subjects comprised of diabetics and/or non-diabetics. Clinical testing is conducted under the direction of the Glycemic Research Laboratories Medical Advisory Board, M.D.’s, and statisticians. Testing methods were approved by the Institutional Review Boards for the State of Florida. Specific analytical testing methods are the property of the Glycemic Research Institute®. METHODS Utilizing standardized GS Board-Approved clinical protocols, accommodations are made for the low-end carbohydrate products tested. Ten human subjects are typically used in each product tested. White bread is used as the standard. Each subject is fed a minimum of three bread standards for comparison to the products tested. Calculations are made using the area under the curve (AUC) as compared to bread standards (converted to the glucose scale). AUC is calculated by GS statisticians using standard GS protocols.
Page 5 of 20 Clinical Assessment/GIC2-2014/Glycemic Research Laboratories
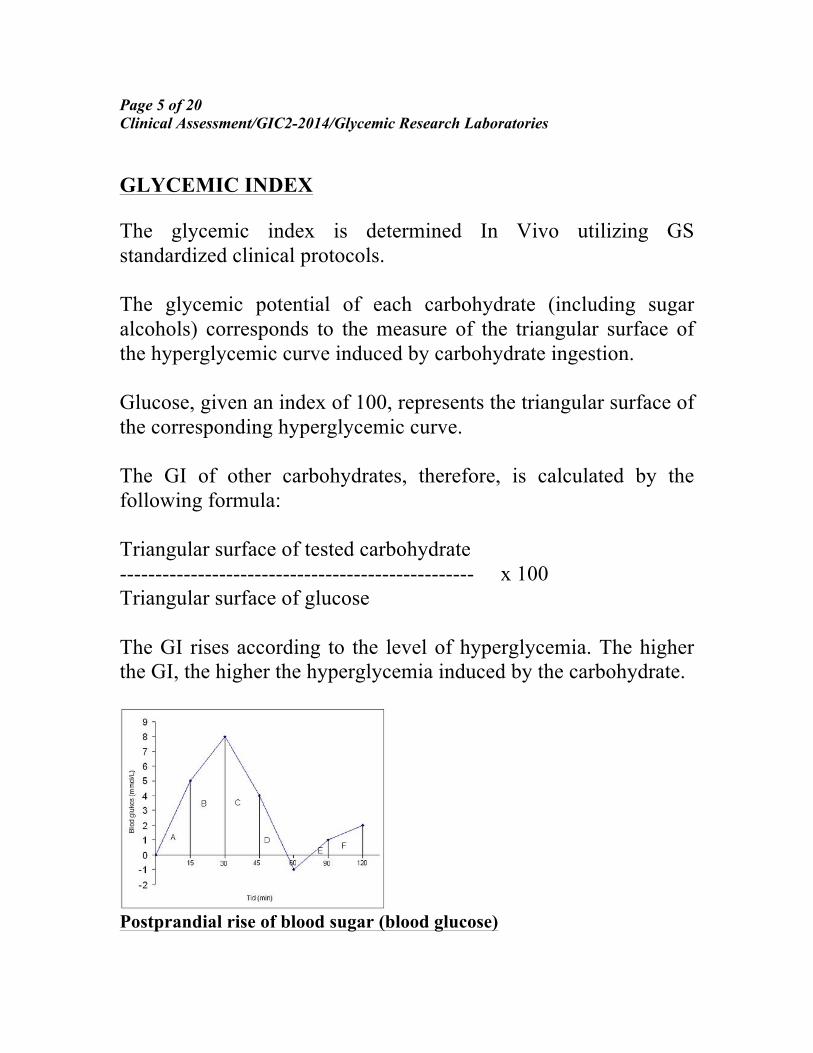
GLYCEMIC INDEX The glycemic index is determined In Vivo utilizing GS standardized clinical protocols. The glycemic potential of each carbohydrate (including sugar alcohols) corresponds to the measure of the triangular surface of the hyperglycemic curve induced by carbohydrate ingestion. Glucose, given an index of 100, represents the triangular surface of the corresponding hyperglycemic curve. The GI of other carbohydrates, therefore, is calculated by the following formula: Triangular surface of tested carbohydrate -------------------------------------------------- x 100 Triangular surface of glucose The GI rises according to the level of hyperglycemia. The higher the GI, the higher the hyperglycemia induced by the carbohydrate.
Postprandial rise of blood sugar (blood glucose)
Page 6 of 20 Clinical Assessment/GIC2-2014/Glycemic Research Laboratories REPORT ID: GIC2-2014 TEST FOODS SERVING SIZES** FEEDING PROTOCOLS Non-Diabetic and/or Diabetic subjects were used in this test. ISO methods were employed with subjects having 50 gram glucose meals in the form of a commercially available glucose testing drink as a reference standard. At least 2 standards were used to create an average. The Test Food serving size was determined by the Test Food Label/Serving Sizes as accepted by FDA 21 CFR. TEST FOODS SUBMITTED GRAETER’S ICE CREAM BRAND: “A LITTLE LESS INDULGENT” NUMBER OF PRODUCTS TESTED: 3 ** All Test Foods Serving Sizes are required to Meet United States Food & Drug Administration (FDA) 21 CFR Serving Sizes IDENTITY OF TEST FOODS The frozen Ice Cream Test Foods were duly submitted to the Glycemic Research Institute® - (GRI) Laboratories - for Board Approved Independent Clinical Trials. Human In Vivo Clinical Trials were conducted on the Test Foods per GRI Clinical Trial Protocols. THREE (3) TEST FOODS SUBMITTED: 3 FLAVORS Madagascar Bourbon Vanilla Bean Chocolate Chip Mint Chocolate Chip
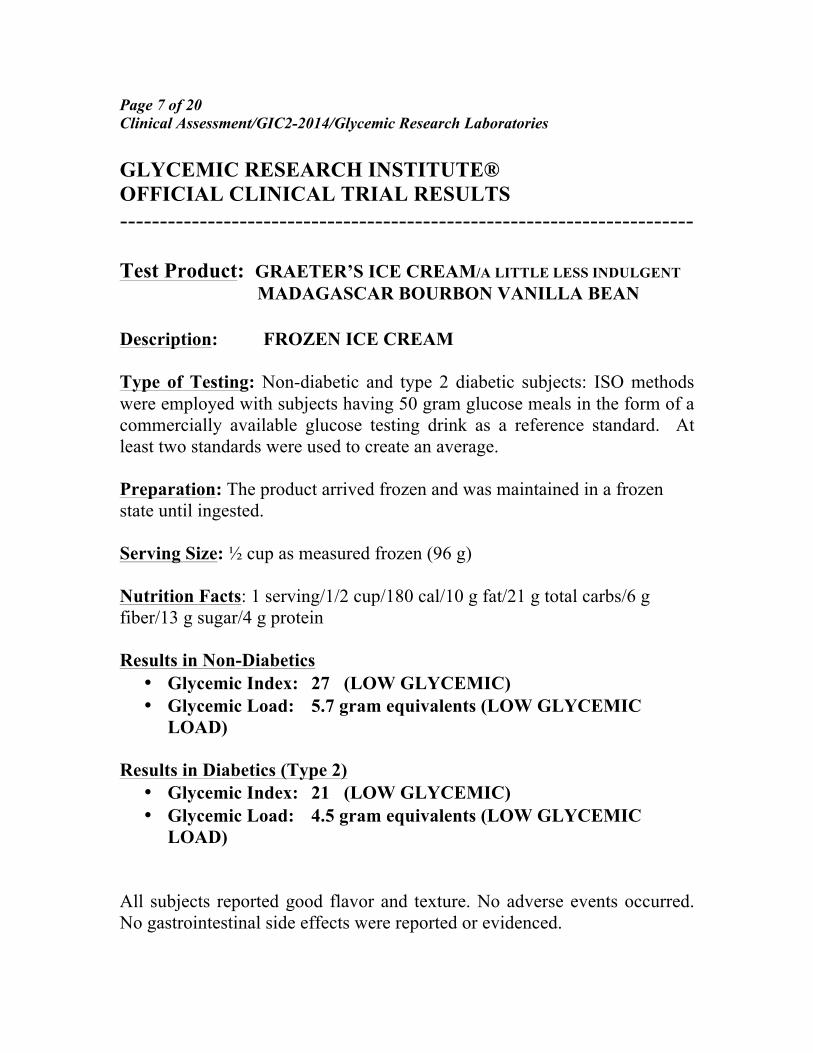
Page 7 of 20 Clinical Assessment/GIC2-2014/Glycemic Research Laboratories GLYCEMIC RESEARCH INSTITUTE® OFFICIAL CLINICAL TRIAL RESULTS ------------------------------------------------------------------------ Test Product: GRAETER’S ICE CREAM/A LITTLE LESS INDULGENT MADAGASCAR BOURBON VANILLA BEAN Description: FROZEN ICE CREAM Type of Testing: Non-diabetic and type 2 diabetic subjects: ISO methods were employed with subjects having 50 gram glucose meals in the form of a commercially available glucose testing drink as a reference standard. At least two standards were used to create an average. Preparation: The product arrived frozen and was maintained in a frozen state until ingested. Serving Size: ½ cup as measured frozen (96 g) Nutrition Facts: 1 serving/1/2 cup/180 cal/10 g fat/21 g total carbs/6 g fiber/13 g sugar/4 g protein Results in Non-Diabetics
• Glycemic Index: 27 (LOW GLYCEMIC) • Glycemic Load: 5.7 gram equivalents (LOW GLYCEMIC
LOAD) Results in Diabetics (Type 2)
• Glycemic Index: 21 (LOW GLYCEMIC) • Glycemic Load: 4.5 gram equivalents (LOW GLYCEMIC
LOAD)
All subjects reported good flavor and texture. No adverse events occurred. No gastrointestinal side effects were reported or evidenced.
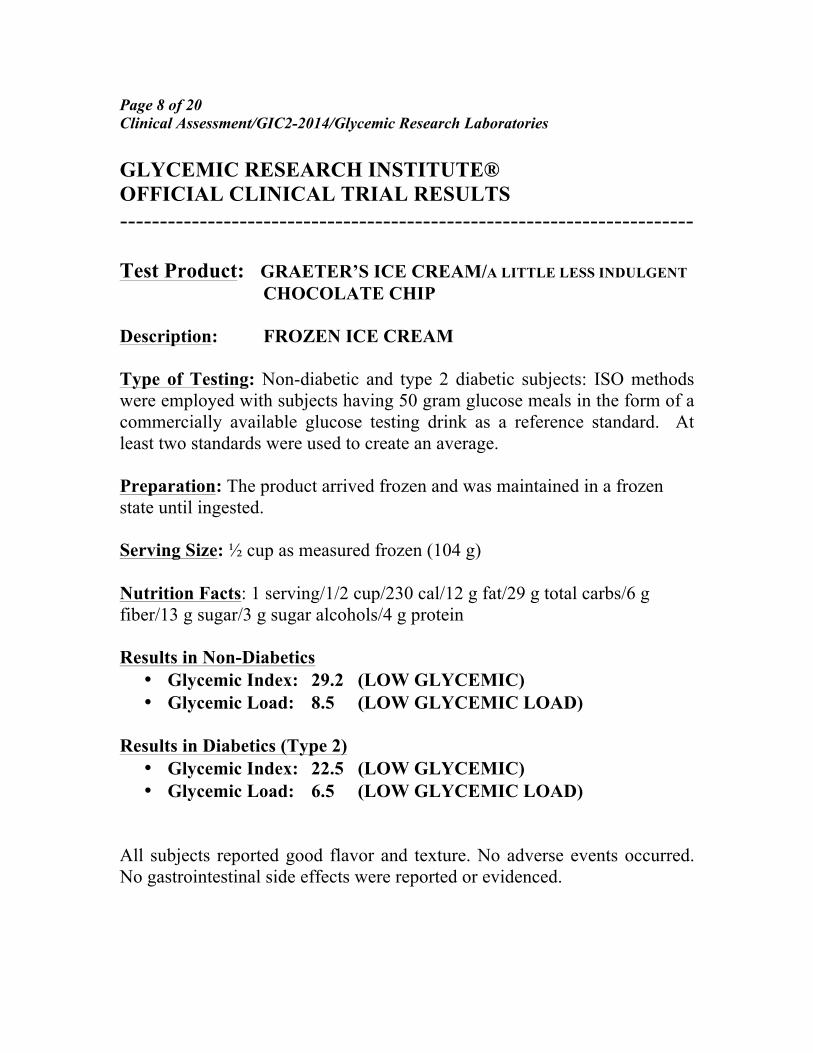
Page 8 of 20 Clinical Assessment/GIC2-2014/Glycemic Research Laboratories GLYCEMIC RESEARCH INSTITUTE® OFFICIAL CLINICAL TRIAL RESULTS ------------------------------------------------------------------------ Test Product: GRAETER’S ICE CREAM/A LITTLE LESS INDULGENT CHOCOLATE CHIP Description: FROZEN ICE CREAM Type of Testing: Non-diabetic and type 2 diabetic subjects: ISO methods were employed with subjects having 50 gram glucose meals in the form of a commercially available glucose testing drink as a reference standard. At least two standards were used to create an average. Preparation: The product arrived frozen and was maintained in a frozen state until ingested. Serving Size: ½ cup as measured frozen (104 g) Nutrition Facts: 1 serving/1/2 cup/230 cal/12 g fat/29 g total carbs/6 g fiber/13 g sugar/3 g sugar alcohols/4 g protein Results in Non-Diabetics
• Glycemic Index: 29.2 (LOW GLYCEMIC) • Glycemic Load: 8.5 (LOW GLYCEMIC LOAD)
Results in Diabetics (Type 2)
• Glycemic Index: 22.5 (LOW GLYCEMIC) • Glycemic Load: 6.5 (LOW GLYCEMIC LOAD)
All subjects reported good flavor and texture. No adverse events occurred. No gastrointestinal side effects were reported or evidenced.
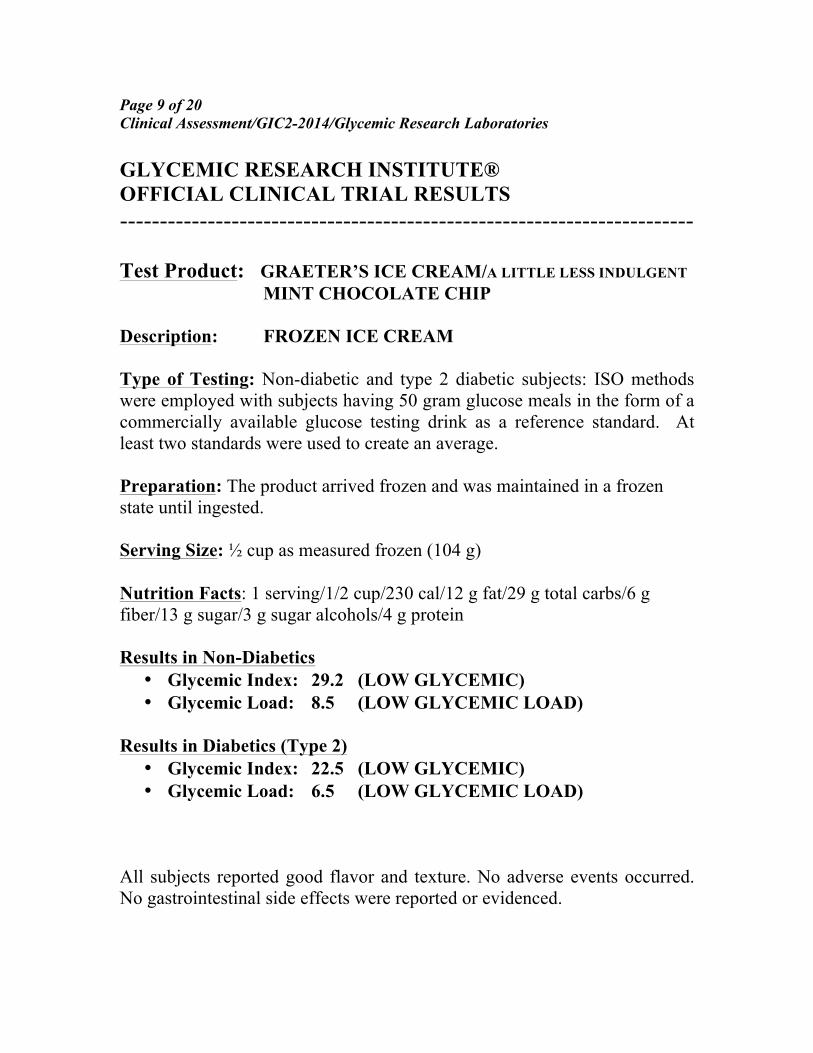
Page 9 of 20 Clinical Assessment/GIC2-2014/Glycemic Research Laboratories GLYCEMIC RESEARCH INSTITUTE® OFFICIAL CLINICAL TRIAL RESULTS ------------------------------------------------------------------------ Test Product: GRAETER’S ICE CREAM/A LITTLE LESS INDULGENT
MINT CHOCOLATE CHIP Description: FROZEN ICE CREAM Type of Testing: Non-diabetic and type 2 diabetic subjects: ISO methods were employed with subjects having 50 gram glucose meals in the form of a commercially available glucose testing drink as a reference standard. At least two standards were used to create an average. Preparation: The product arrived frozen and was maintained in a frozen state until ingested. Serving Size: ½ cup as measured frozen (104 g) Nutrition Facts: 1 serving/1/2 cup/230 cal/12 g fat/29 g total carbs/6 g fiber/13 g sugar/3 g sugar alcohols/4 g protein Results in Non-Diabetics
• Glycemic Index: 29.2 (LOW GLYCEMIC) • Glycemic Load: 8.5 (LOW GLYCEMIC LOAD)
Results in Diabetics (Type 2)
• Glycemic Index: 22.5 (LOW GLYCEMIC) • Glycemic Load: 6.5 (LOW GLYCEMIC LOAD)
All subjects reported good flavor and texture. No adverse events occurred. No gastrointestinal side effects were reported or evidenced.
Page 10 of 20 Clinical Assessment/GIC2-2014/Glycemic Research Laboratories
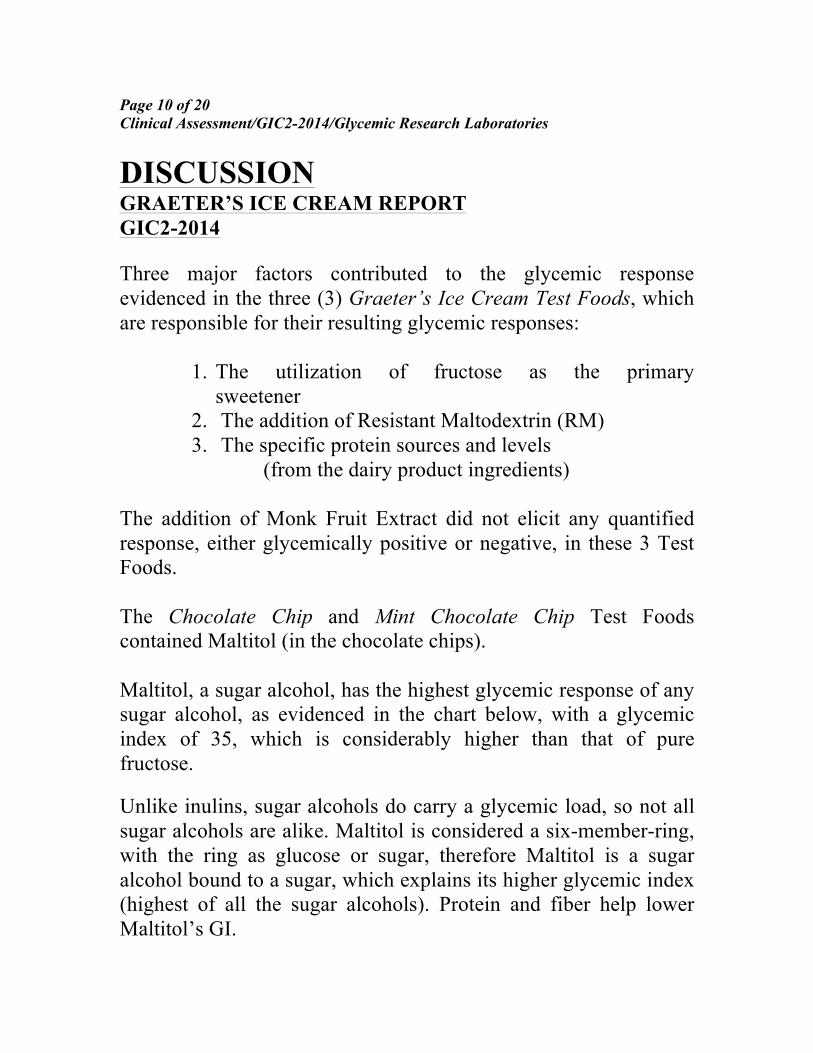
DISCUSSION GRAETER’S ICE CREAM REPORT GIC2-2014 Three major factors contributed to the glycemic response evidenced in the three (3) Graeter’s Ice Cream Test Foods, which are responsible for their resulting glycemic responses:
1. The utilization of fructose as the primary sweetener
2. The addition of Resistant Maltodextrin (RM) 3. The specific protein sources and levels
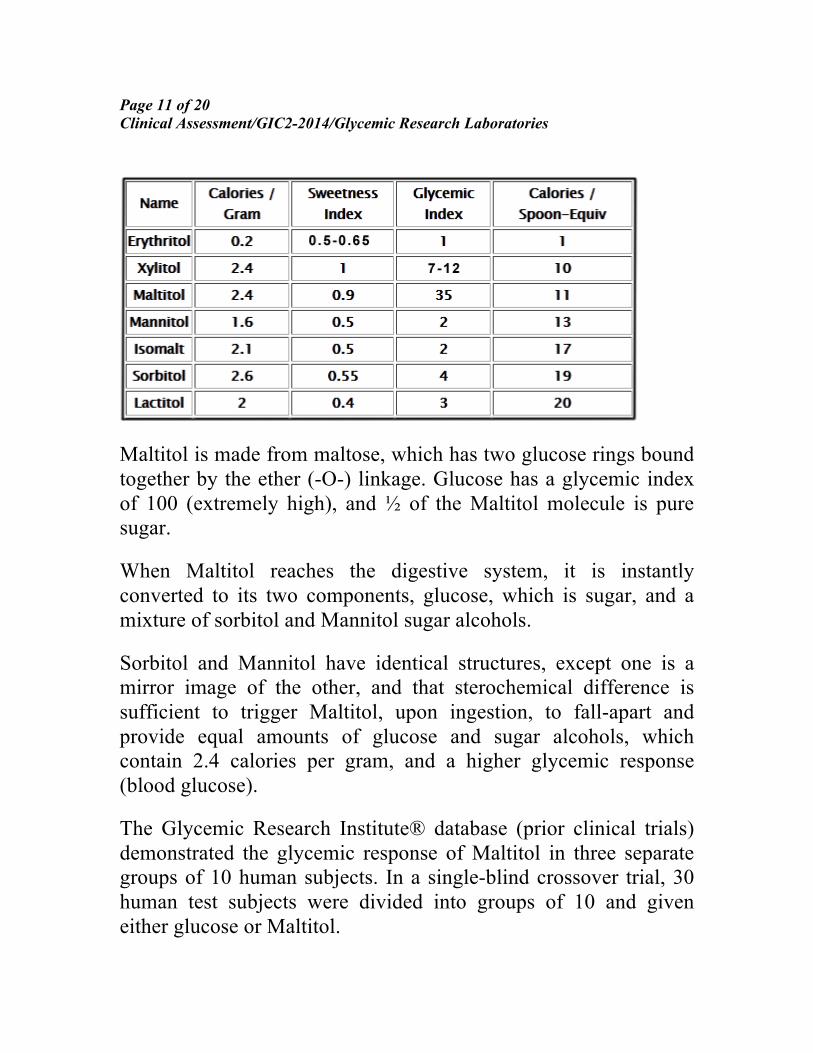
(from the dairy product ingredients) The addition of Monk Fruit Extract did not elicit any quantified response, either glycemically positive or negative, in these 3 Test Foods. The Chocolate Chip and Mint Chocolate Chip Test Foods contained Maltitol (in the chocolate chips). Maltitol, a sugar alcohol, has the highest glycemic response of any sugar alcohol, as evidenced in the chart below, with a glycemic index of 35, which is considerably higher than that of pure fructose.
Unlike inulins, sugar alcohols do carry a glycemic load, so not all sugar alcohols are alike. Maltitol is considered a six-member-ring, with the ring as glucose or sugar, therefore Maltitol is a sugar alcohol bound to a sugar, which explains its higher glycemic index (highest of all the sugar alcohols). Protein and fiber help lower Maltitol’s GI.
Page 11 of 20 Clinical Assessment/GIC2-2014/Glycemic Research Laboratories
Maltitol is made from maltose, which has two glucose rings bound together by the ether (-O-) linkage. Glucose has a glycemic index of 100 (extremely high), and ½ of the Maltitol molecule is pure sugar.
When Maltitol reaches the digestive system, it is instantly converted to its two components, glucose, which is sugar, and a mixture of sorbitol and Mannitol sugar alcohols.
Sorbitol and Mannitol have identical structures, except one is a mirror image of the other, and that sterochemical difference is sufficient to trigger Maltitol, upon ingestion, to fall-apart and provide equal amounts of glucose and sugar alcohols, which contain 2.4 calories per gram, and a higher glycemic response (blood glucose).
The Glycemic Research Institute® database (prior clinical trials) demonstrated the glycemic response of Maltitol in three separate groups of 10 human subjects. In a single-blind crossover trial, 30 human test subjects were divided into groups of 10 and given either glucose or Maltitol.
Page 12 of 20 Clinical Assessment/GIC2-2014/Glycemic Research Laboratories Capillary blood glucose samples were taken at 15 and 10 minutes before and 0, 15, 30, 45, 60, 90, 120, 150, and 180 minutes after consumption of the test drinks. Incremental area under the curve (AUC) of glucose and Maltitol matched crossover data. The mean Glycemic Response of Maltitol was 34-36 (+/- 3) (GI) points. Maltitol syrup has a glycemic index (GI) of 50 +, which is higher than spaghetti. When fructose is incorporated as a sweetener into a complex food product, such as ice cream, it is associated with lower serum glucose and insulin responses as compared to comparable sucrose sweetened foods. (Am J Clin Nutr 1982). The addition of fructose, as the primary sweetener in the three (3) Test Foods, contributed to the resulting glycemic responses (as the Monk Fruit Extract appeared at small levels in the Test Foods, and, additionally, did not contribute to the final glycemic responses), while the fructose greatly contributed to the final low glycemic response and lower Glycemic Load (GL). Contributions to the 3 Test Foods low glycemic responses, was the elimination of high-doses of known high glycemic sugars/sweeteners. Most common ice cream products contain either sucrose or corn syrup, or high-fructose corn syrup, or combinations of said sweeteners, while the 3 Test Foods did not contain these high glycemic ingredients. The Vanilla Bean elicited the lowest GI of the 3 Test Foods, as the Chocolate Chip and Mint Chocolate Chip (with nearly identical profiles) tested higher, probably due to the use of Maltitol, whose GI is considerably higher than that of pure crystalline fructose (19 vs 35/36), plus the higher Load due to increased carbohydrate serving size.
Page 13 of 20 Clinical Assessment/GIC2-2014/Glycemic Research Laboratories DISCUSSION CONTINUED Both Chocolate Chip and Mint Chocolate Chip flavors contained 29g of carbs (Vanilla Bean contained 21g), and chocolate chips, whose specific GI is unknown to GRI, but contributed to the overall glycemic response. The proteins and fiber evidenced in the 3 Test Foods contributed positively to final glycemic responses due to the high quality of digestible proteins utilized in the formulas. Clinical trials have demonstrated that when a sugar is ingested along with protein and fat, the absolute increase in plasma glucose concentration is lower than when an equivalent amount of carbohydrate is given alone. The Peppermint Oil utilized in the Mint Chocolate Chip Ice Cream did not appear to elevate or decrease glycemic responses, in relation to the regular Chocolate Chip Ice Cream. Many flavors alter glycemic responses to foods, as they often are bound to high glycemic carriers, such as regular Maltodextrins (non-RM) and Glucose Polymers, both known to be high glycemic carriers. Empirical data (placebo controlled, double-blind clinical trials) provided by the United States Department of Agriculture (USDA), established that Resistant Maltodextrin (RM) added to foods, increases fecal bulk by enhancing the excretion of nitrogen and carbohydrate and the growth of specific microbial populations, but does not induce fat excretion in humans.
Page 14 of 20 Clinical Assessment/GIC2-2014/Glycemic Research Laboratories DISCUSSION CONTINUED The dose-dependent Metabolizable Energy (ME) value of Resistant Maltodextrin (RM) is 8.2 and 10.4 kJ/g, and the Net Energy (NE) value of RM has been demonstrated (USDA) to be 8.2 and 2.0 kJ/g for a RM dose of 25 and 50 grams per day (g/d), respectively. A key component in determining accurate glycemic responses to a food/beverage requires accurate interpretation of the clinical data accumulated. This mandates accurate determination of all available carbohydrates in the Test Food, and includes an accurate determination of carbohydrate availability. These issues are crucial in assessing glycemic index and load. The term “Available Carbohydrates” refers to non-digestible carbohydrates, such as fiber. Available carbohydrate is the portion of carbohydrates that can be digested. It is also referred to as glycemic, net, nutritive, or usable carbs. In the United States and Canada, the amount of carbohydrate in foods is determined by difference, which is measuring the water, fat, protein and ash per 100 g and then subtracting the total sum from 100. Two components can undermine accuracy in glycemic index and load studies, which include (1) Label of the Test Food and (2) Determination of carbohydrate availability (prior to glycemic determination). If data in the Test Food Label is misrepresentative (such as grams of sugars, carbs, proteins, fiber), then the resulting methodologies and formulas used in calculating glycemic responses will be skewed.
Page 15 of 20 Clinical Assessment/GIC2-2014/Glycemic Research Laboratories DISCUSSION CONTINUED If the determination of carbohydrate availability is not accurate, then the end calculations are also skewed, and the resulting mathematical and formulaic data is not accurate, thus the resulting glycemic index, load, and overall glycemic response is indeed, not accurate. Carbohydrate availability is often times not accurate, as the testing methodologies differ and, as such, determination for available carbohydrate (g) can often vary by 40-50 percent. In Vivo results greatly differ from In Vitro results when determining carbohydrate availability in raw materials. This data is supplied by the manufacturer of the Test Food, and the manufacturer of the raw materials (ingredients) present in the Test Food. When the clinical data is reviewed (as related to the Test Food) and said data is indicative of skewed data, cross-validation is the preferred path, as prior similar statistical data will verify the similarity/accuracy of the results. In said cases, GRI protocols refer to Mathematical Modeling and cross-validation utilized in clinical studies. Statistical models involving differential equations are the standard tools utilized in identifying incorrect input data, including non-parametric statistics, which evaluate how well the data fit a known clinical outcome (as in available carbohydrates from a fiber product, a maltodextrin, a sugar alcohol, and variations in the available carbohydrates in Resistant Maltodextrins). The objective is to minimize assumptions in deducing the final glycemic perimeters of a Test Food.
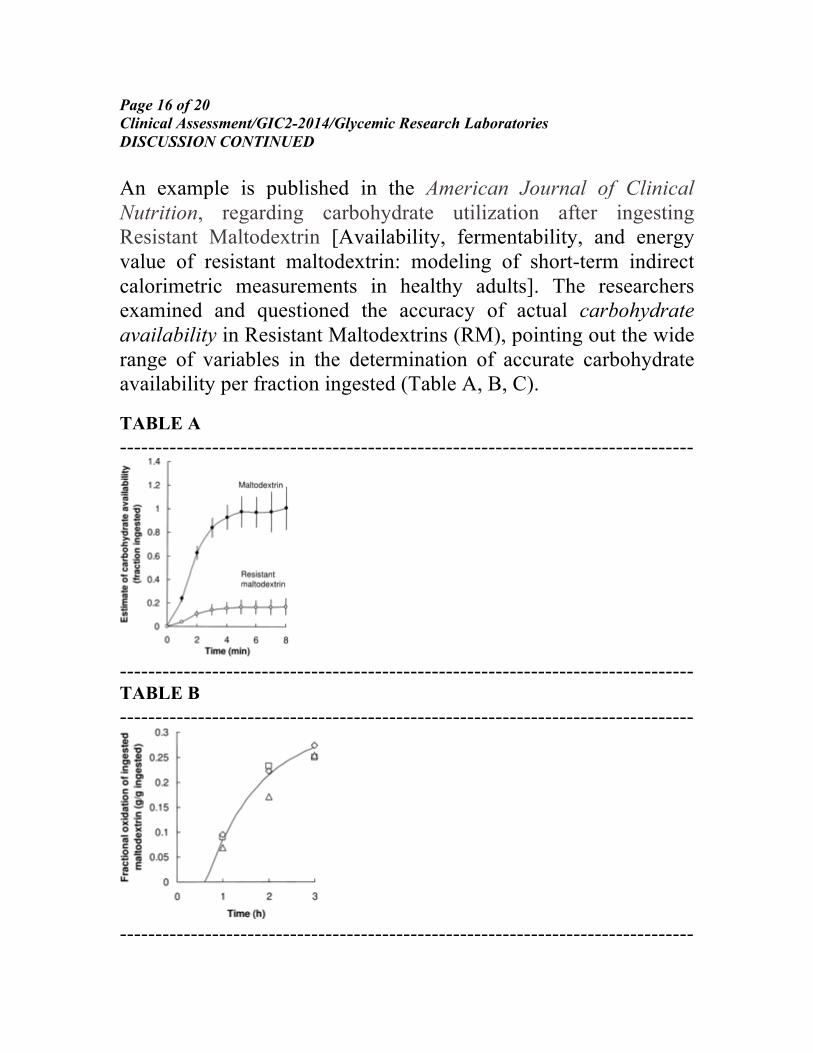
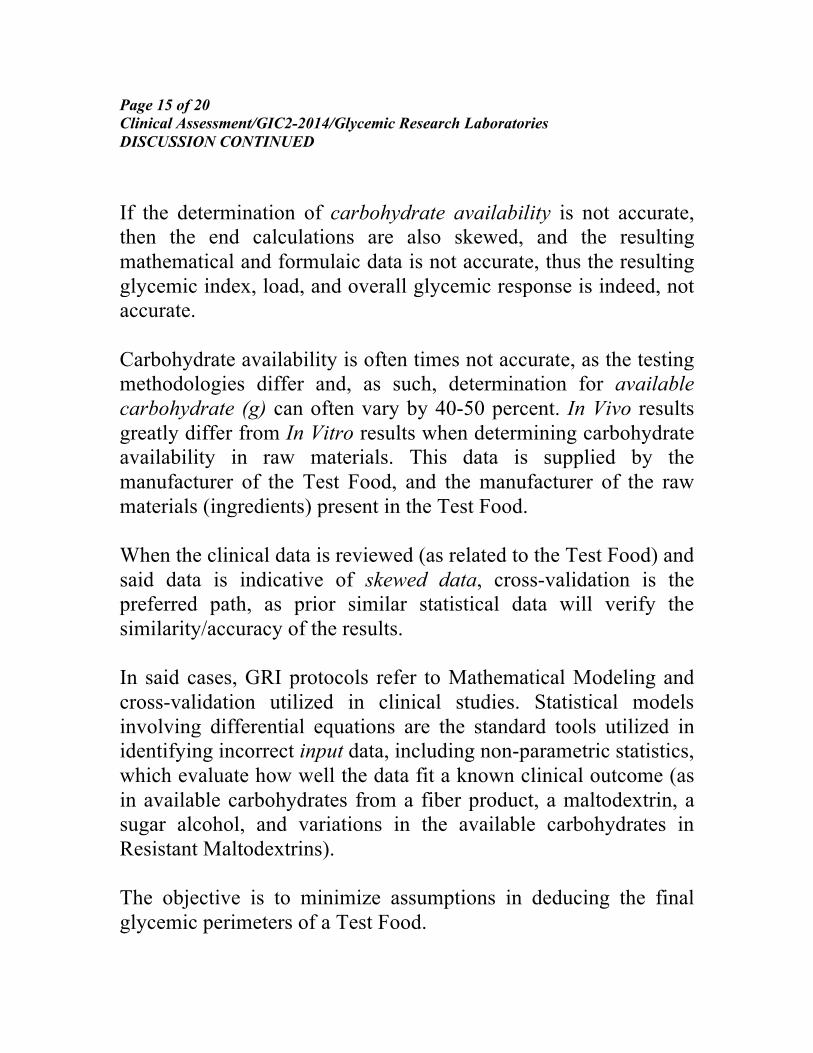
Page 16 of 20 Clinical Assessment/GIC2-2014/Glycemic Research Laboratories DISCUSSION CONTINUED An example is published in the American Journal of Clinical Nutrition, regarding carbohydrate utilization after ingesting Resistant Maltodextrin [Availability, fermentability, and energy value of resistant maltodextrin: modeling of short-term indirect calorimetric measurements in healthy adults]. The researchers examined and questioned the accuracy of actual carbohydrate availability in Resistant Maltodextrins (RM), pointing out the wide range of variables in the determination of accurate carbohydrate availability per fraction ingested (Table A, B, C). TABLE A ---------------------------------------------------------------------------------
--------------------------------------------------------------------------------- TABLE B ---------------------------------------------------------------------------------
---------------------------------------------------------------------------------
Page 17 of 20 Clinical Assessment/GIC2-2014/Glycemic Research Laboratories DISCUSSION CONTINUED TABLE C ---------------------------------------------------------------------------------
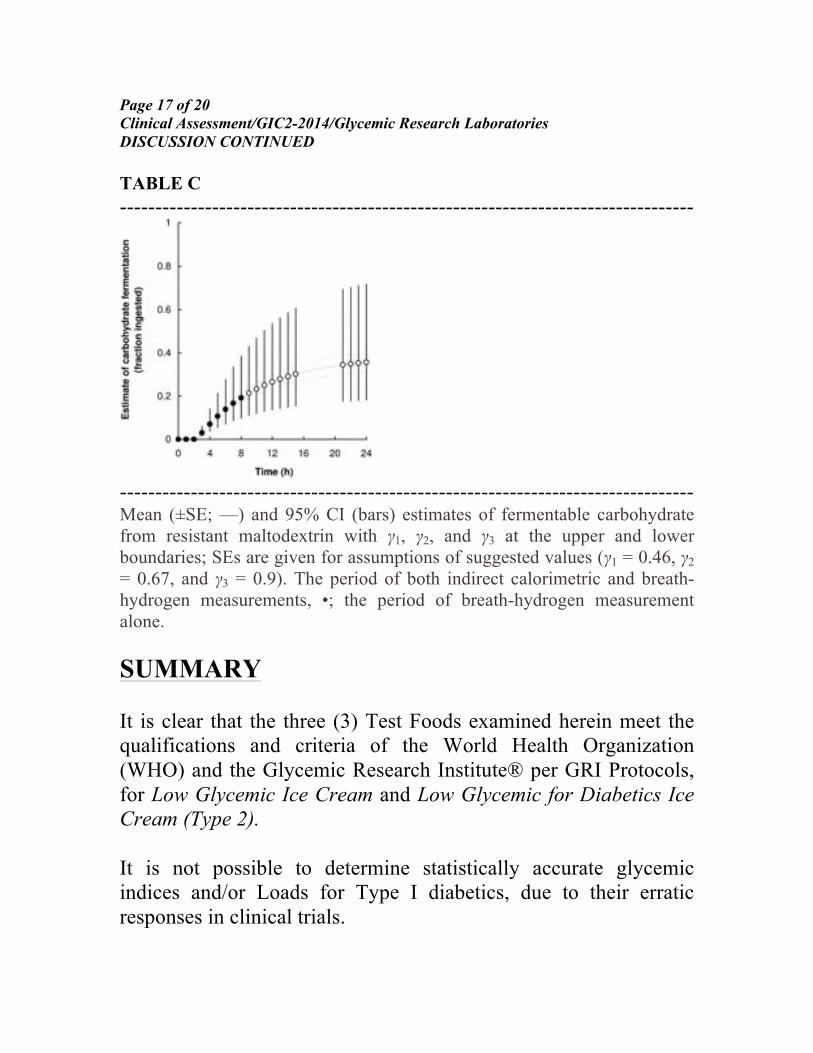
--------------------------------------------------------------------------------- Mean (±SE; —) and 95% CI (bars) estimates of fermentable carbohydrate from resistant maltodextrin with γ1, γ2, and γ3 at the upper and lower boundaries; SEs are given for assumptions of suggested values (γ1 = 0.46, γ2 = 0.67, and γ3 = 0.9). The period of both indirect calorimetric and breath-hydrogen measurements, •; the period of breath-hydrogen measurement alone. SUMMARY It is clear that the three (3) Test Foods examined herein meet the qualifications and criteria of the World Health Organization (WHO) and the Glycemic Research Institute® per GRI Protocols, for Low Glycemic Ice Cream and Low Glycemic for Diabetics Ice Cream (Type 2). It is not possible to determine statistically accurate glycemic indices and/or Loads for Type I diabetics, due to their erratic responses in clinical trials.
Page 18 of 20 Clinical Assessment/GIC2-2014/Glycemic Research Laboratories DISCUSSION CONTINUED Therefore, GRI does not endorse or certify specific foods or beverages for use in Type I diabetics, and the use of any statement or implication that the three (3) Graeter’s Ice Cream Test Foods are appropriate for Type I diabetics is in violation of FDA and FDC rules and regulations regarding claims on labels, websites, brochures, or any attendant material. Any statement to the contrary made by Graeter’s or its companies can result in government regulatory action and revocation of any Glycemic Research Institute® (GRI) Certification Mark(s). The following three (3) Graeter’s Ice Cream products qualify as Low Glycemic and Low Glycemic for Type 2 Diabetics (per the Serving Size recommended), and may utilize the appropriate Glycemic Research Institute® (GRI) Certification Mark(s), per GRI’s protocols for Certification Marks. GRAETER’S A Little Less Indulgent Ice Cream
• MADAGASCAR BOURBON VANILLA BEAN • CHOCOLATE CHIP • MINT CHOCOLATE CHIP
END OFFICIAL REPORT Clinical Assessment/GIC2-2014/ Glycemic Research Laboratories
SEE REFERENCES BELOW
Page 19 of 20 Clinical Assessment/GIC2-2014/Glycemic Research Laboratories REFERENCES American Journal of Clinical Nutrition. Availability, fermentability, and energy value of resistant maltodextrin: modeling of short-term indirect calorimetric measurements in healthy adults. 2006 American Society for Clinical Nutrition. Toshinao et al. Crapo PA, Kolterman OG, Olefsky JM. Effects of oral fructose in normal, diabetic, and impaired glucose tolerance subjects. Diabetes Care 1980;3:575- 82. Hardy SL, Brennand CP, Wyse BW. Fructose: comparison with sucrose as sweetener in four products. J Am Diet Assoc l979;74:41-6. Schauberger G, Brinck UC, Guldner G, Spaethe R, Niklas L, Otto H. Exchange of carbohydrates according to their effect on blood glucose. Diabetes l977;25(suppl 1):4 15. 9. McDonald I, Keyser A, Pacy D. Some effects, in man, ofvarying the load ofglucose, sucrose, fructose, or sorbitol on various metabolites in blood. Am J Clin Nutr l978;31:l305-ll. Peterson DI, Reaven GM. Evidence that glucose load is an important determinant of plasma insulin response in normal subjects. Diabetes 197 l;20:729- Akgun, Ertel NH. A comparison of carbohydrate metabolism after sucrose, sorbitol, and fructose meals in normal and diabetic subjects. Diabetes Care l980;3:583-5. Swan DC et al. Effect of simple and complex carbohydrates on plasma non-esterified fatty acids, plasma-sugar, and plasma-insulin during oral carbohydrate tolerance tests. Lancet 1966; 1:60- 3. Lamar CP. Comparative oral glucose and fructose tolerance tests in normal subjects and in diabetic patients. J Fla Med Assoc l959;46:I80-6. Reaven GM, Olefsky J, Farquhar JW. Does hyperglycemia or hyperinsulinaemia characterize the patient with chemical diabetes? Lancet l972;l:l247-9. Bohannon NV, Karam JH, Forsham PH. Endocrine responses to sugar ingestion in man. J Am Diet Assoc 1980;76:555-60 National Diabetes Data Group. Classification and diagnosis of diabetes mellitus and other categories of glucose intolerance. Diabetes l979;28:l039-57.
Page 20 of 20 Clinical Assessment/GIC2-2014/Glycemic Research Laboratories References Brinck UC, Wubbens D, Oelgeschlager W, Otto H. Blood glucose response to glucose, fructose, and sucrose in patients with subclinical diabetes mellitus. In: Otto H, Spaethe R, eds. Diatetik bei Diabetes Mellitus. Bern: Verlag Hans Huber, 1973:150-3. Crapo PA, Reaven G, Olefsky J. Plasma glucose and insulin responses to orally administered simple and complex carbohydrates. Diabetes l976;25:74l-7. Nilsson U, Jagerstad M. Hydrolysis of lactitol, maltitol and Palatinit by human intestinal biopsies. Br J Nutr 1987;58:199-206. Baugerie L, Flouri#{233}B, Marteau P, Pellier P. Franchisseur C, Rambaud i-C. Digestion and absorption in the human intestine of three sugar alcohols. Gastroenterology 1991 ;99:717-23. Ziesenitz SC, Sieber G. The metabolism and utilization of polyols and other sweeteners compared with sugar. In: Grenby TH, ed. Dc- velopment in sweeteners, vol 3. London: Elsevier Applied Science, 1987. Beaugerie L, Flouri#{233} B, Franchisseur C, Pelhier P, Dupas H, Rambaud JC. Absorption intestinale et tolerance chinique au sorbitol, maltitol, lactitol et isomalt. Gastroent#{233}rol Clin Biol 1989. Bar A. Factorial calculation model for the estimation of the physi- ological caloric value of polyols. In: Hosoya N, ed. Proceedings of the International Symposium on Caloric Evaluation of Carbohydrates. 1990;209-57.
GLYCEMIC RESEARCH INSTITUTE® LABORATORIES GLYCEMIC SOLUTIONS 111 Second Avenue N.E.
Suite 325 St. Petersburg, FL 33701