glycerin and the market - utc scholar
TRANSCRIPT

GLYCERIN AND THE MARKET
By
Valentine Chijioke Mbamalu
Approved:
Frank Jones Tricia Thomas Professor of Engineering Assistant Professor of Engineering (Chair) (Committee Member) Neslihan Alp William Sutton Professor of Engineering Dean of the College of Engineering and (Committee Member) Computer Science A. Jerald Ainsworth Dean of the Graduate School

ii
GLYCERIN AND THE MARKET
By
Valentine Chijioke Mbamalu
A Thesis Submitted to the Faculty of the University of Tennessee at Chattanooga in Partial Fulfillment of the Requirements of
the Degree of Master’s of Engineering
The University of Tennessee at Chattanooga Chattanooga, Tennessee
May 2013

iii
Copyright © 2013
Valentine Chijioke Mbamalu
All Rights Reserved

iv
ABSTRACT
Glycerin, a trihydric alcohol, had once enjoyed a good market value but, is now
faced with global oversupply and this makes the market volatile. It is a byproduct of
biodiesel production thought as an added value to biodiesel operations. It is now faced
with an unpredictable market and probably oversupply as an outcome of increased
biodiesel production.
There are two types of glycerin market; the refined glycerin with its solid price and
crude glycerin which is volatile. There are new applications for glycerin being developed or
being implemented and it will be a source of strength to the market. This thesis takes an
in-depth review of glycerol from its sources to refining and the market.

v
ACKNOWLEDGEMENTS First and foremost I thank the Almighty God for the strength and grace He has given
me, without which I could not have made it to this point.
I express my profound gratitude to my thesis advisor Dr. Frank Jones for his
patience, guidance and unfailing assistance which facilitated the completion of this thesis.
To other members of the thesis committee Dr. Tricia Thomas and Dr. Neslihan Alp, I
express my sincere appreciations for their contributions to completion of this thesis. I also
thank members of the engineering department, the graduate school and others who must
have assisted me.
Finally I thank Dr. Ifeyinwa Iwuchukwu for her contributions and most of all to all
members of my family for their understanding and support.
vi
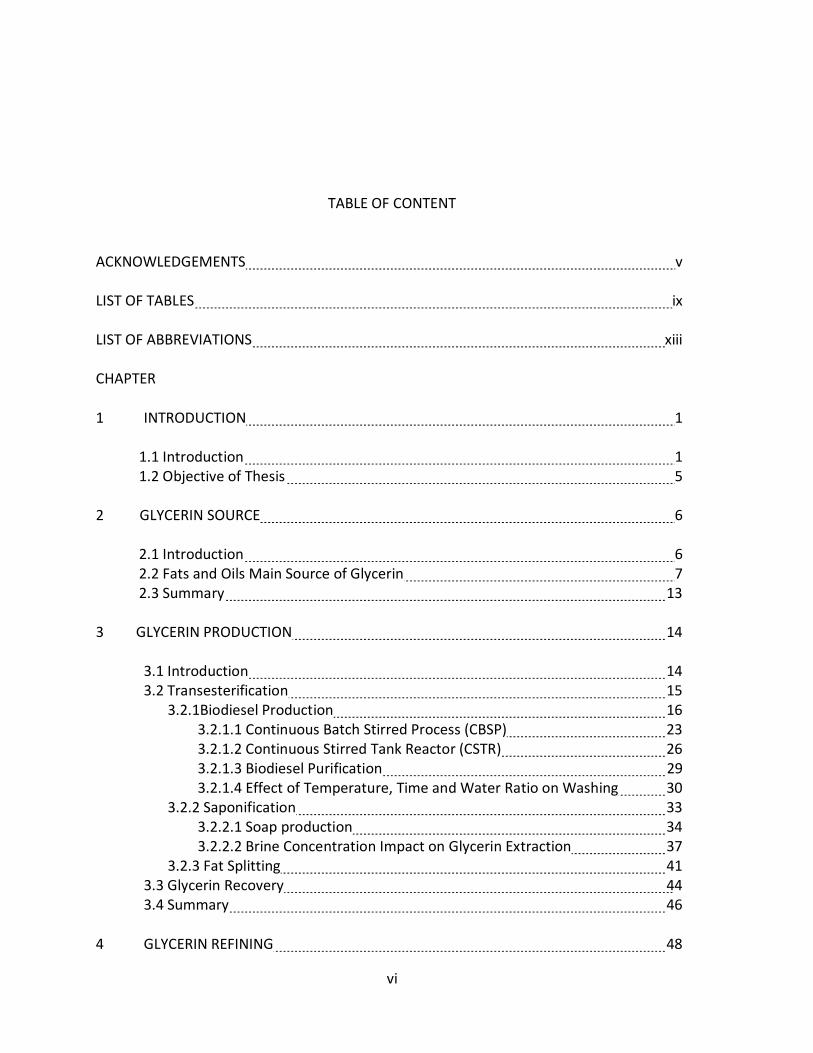
TABLE OF CONTENT
ACKNOWLEDGEMENTS v LIST OF TABLES ix LIST OF FIGURES x LIST OF ABBREVIATIONS xiii CHAPTER 1 INTRODUCTION 1 1.1 Introduction 1 1.2 Objective of Thesis 5 2 GLYCERIN SOURCE 6 2.1 Introduction 6 2.2 Fats and Oils Main Source of Glycerin 7 2.3 Summary 13 3 GLYCERIN PRODUCTION 14 3.1 Introduction 14 3.2 Transesterification 15 3.2.1Biodiesel Production 16 3.2.1.1 Continuous Batch Stirred Process (CBSP) 23 3.2.1.2 Continuous Stirred Tank Reactor (CSTR) 26 3.2.1.3 Biodiesel Purification 29 3.2.1.4 Effect of Temperature, Time and Water Ratio on Washing 30 3.2.2 Saponification 33 3.2.2.1 Soap production 34 3.2.2.2 Brine Concentration Impact on Glycerin Extraction 37 3.2.3 Fat Splitting 41 3.3 Glycerin Recovery 44 3.4 Summary 46 4 GLYCERIN REFINING 48

vii
4.1 Introduction 48 4.2 Vacuum Distillation 51 4.2.1 Effect of Activated Carbon Quality on Adsorption 56 4.2.2 Mass Balance on Glycerin Vacuum Distillation 58 4.3 Ion Exchange 61 4.4 Features of Refined Glycerin 65 4.4.1 Viscosity 65 4.4.2 Mass Spectrum 68 4.4.3 Color 71 4.4.4 Ash and Odor 71 4.5 Comparing Glycerin Refining Processes 72 4.6 Summary 73 5 GLYCERIN APPLICATION 75 5.1 Introduction 76 5.2 Food and Feed 77 5.3 Pharmaceuticals and Personal Care 78 5.4 Industrial Chemicals 78 5.4.1 Propylene Glycol 79 5.4.2 Epichlorohydrin 81 5.5 Summary 82 6 GLYCERIN MARKET AND ECONOMICS 83 6.1 Introduction 83 6.2 Glycerin Output 84 6.3 Glycerin Market 87 6.4 Glycerin Economics 92 6.4.1 Factors Behind the Market and How to Strengthen the Market 92 6.4.2 Projections 94 6.4.2.1 New Glycerin Applications 94 6.4.2.2 Growth in Asia Pacific 95 6.4.2.3 Increase in Glycerin Refining Capacity 97 6.4.2.4 Shale Gas Discovery 97 6.4.2.5 Projection Effects on the Market 99 6.5 Summary 104 7 CONCLUSION 106 REFERENCE 108 APPENDIX

viii
A. GLYCERIN PROPERTIES 112
VITA 115

ix
LIST OF TABLES
1.1 Crude Glycerin Composition 3
1.2 Refined Glycerin Composition 3
2.1 Fats and Oils Fatty Acids of Composition 10
2.2 Oil content for Seeds 11
3.1 ASTM Standards for Biodiesel and Diesel 18
3.2 Biodiesel raw materials composition 19
3.3 Equilibrium Concentration of Glycerol at Different Temperature 31
3.4 Equilibrium Concentration of Glycerol at Different Biodiesel and water Ratio 32
3.5 Saponfication Raw Material Composition 36
3.6 Approximate Utility Consumption per Ton of Crude Oil 42
3.7 Tallow Splitting Product Result 43
4.1 Glycerin Specification 49
4.2 Percentage Composition of Crude Glycerin 59
4.3 Mass Balance of Vacuum Distillation 60
4.4 Equilibrium Parameter at Different Water Level 63
6.1 World Glycerin Output 87
6.2 Glycerin Contract and Spot Prices 88
6.3 Chemicals with Possible Glycerin Base. 95
6.4 US. Projected glycerin output 101
6.5 US. Projected Demand 101
6.6 US. Projected Glycerin Output with Shale Gas Impact 103

x
LIST OF FIGURES 1.1 Molecular Structure of Glycerin 1
2.1 Molecular Structure of Fat and Oil 7
2.2 Palmitic Acid (a) and Linoleic Acid (b) 9
2.3 Hydrolysis Reaction 12
3.1 Glycerin Production Processes and Product Compositions 14
3.2 Transesterification reaction 15
3.3 Esterification Reaction 16
3.4 Impact of Alcohol to Oil ratio on the output of a Transesterification Reaction 20
3.5 Composition of Glycerol and Methyl Esters Formed During Transesterification 22
3.6 Triglyceride and Methanol Reaction Equation 23
3.7 Flow Diagram of Continuous Stirred Batch Biodiesel Production 24
3.8 Effect of Reaction Time on Bound Glycerin Yield 25
3.9 Sediment of Biodiesel and Glycerin 26
3.10 Flow Diagram of Continuous Stirred Tank Biodiesel Production 27
3.11 Effect of Number Reaction Stages on Bound Glycerol 28
3.12 Effect of Washing Time on Concentration of Glycerol 31
3.13 Effect on Washing Time for Different Biodiesel and Water Ratios 32
3.14 Saponification Reaction Equation 34
3.15 Process Flow Diagram of Soap Production 37
3.16 Glycerin Recovered Using 8% Brine solution 39
3.17 Glycerin Recovered Using 10% Brine Solution 39

xi
3.18 Glycerin Recovered Using 12% Brine Solution 39
3.19 Glycerin Recovered Using 15% Brine 40
3.20 Single Stage Countercurrent Fat Splitting Process 43
3.21 Spent Lye Treating Process Flow Diagram 45
3.22 Lye Treatment Reaction Equation 45
3.23 Process flow Diagram Lye Evaporation 46
4.1 Different Glycerin Grades 50
4.2 Process Flow Schematic of Glycerin Refining Plant 53
4.3 Distilled Glycerin Absorption Process Flow diagram 55
4.4 Effect of Activated Carbon on Color 57
4.5 Effect of Activated Carbon on Glycerin Content 59
4.6 Effect of Activated Carbon on Ash Content 58
4.7 Spherical Ion Exchange Material 61
4.8 Process Flow Schematic of Glycerin Ion Exchange Refining 62
4.9 Ion Exchange Isotherms of Sodium Ion on Amberlite 252 64
4.10 Viscosity Profile of Crude Glycerin 66
4.11 Velocity Profile of Partially Refined Glycerin 67
4.12 Viscosity Profile of Refined Glycerin 67
4.13 Mass Spectrum of Crude Glycerin 69
4.14 Mass Spectrum of Stage 1 Partial Refined Glycerin 70
4.15 Mass Spectrum of Stage 2 Partial Refined Glycerin 70
5.1 Glycerin Applications 76
5.2 1995 and 2006 Glycerin Application 76
5.3 Molecular Structure of Propylene Glycol 79
5.4 Glycerin Conversion to Acetol and Water 80
5.5 Conversion of Acetol to Propylene Glycol 80

xii
5.6 Hydrochlorination of Glycerin 81
6.1 Refined Glycerin Price 85
6.2 Rate of Glycerin Output from Different Sources 85
6.3 US Biodiesel Production 86
6.4 Biodiesel Oil Usage 89
6.5 European Union Refined Glycerin Production 90
6.6 Refined Glycerin Import and Export 91
6.7 Crude Glycerin Import and Export 92
6.8 China Glycerin Demand 96
6.9 Projected Glycerin Market 100
6.10 Relationship between Demand and Supply 102
6.11 US Projected Demand and Supply with Shale Gas Affect 104

xiii
LIST OF ABBREVIATIONS
ASTM American Society for Testing and Materials
CP Centipoises
EPA Environmental Protection Agency
EU European Union
FAME Fatty acid methyl ester
FDA Food and Drug Administration
FFA Free Fatty Acid
GC Gas Chromatography
HCL Hydrochloric acid
H20 Water
MEOH Methanol
mmHg Millimeter Mercury
MONG Matter Organic Non-Glycerol
NOAH Sodium Hydroxide
NACL Sodium Chloride
pH Potential of Hydrogen
PPM Part Per Million
USCBFTD U.S. Census Bureau Foreign Trade Division
USDA U.S. Department of Agriculture
RFS Renewable Fuel Standard

1
CHAPTER 1
INTRODUCTION
1.1 Introduction
Glycerin, also called glycerine, and glycerol is a trihydric alcohol with a molecular
formula C3H5(OH)3. Its IUPAC name is Propanol-1,2,3-triol. It is colorless, odorless, has sweet
taste, very viscous and hygroscopic. It easily dissolves in water because of its three hydroxyl
groups. It combines with three fatty acids to form what is called triglyceride. This is the main
constituent of fats and oils which is found naturally in plants and animals. Fig. 1.1 shows the
molecular structure of glycerin.
Fig. 1.1 Molecular Structure of Glycerin
Glycerin was accidentally discovered in 1779 by a Swedish chemist K. W. Scheele while
heating a mixture of olive oil and lead monoxide and he called it sweet principle of fat. Later in
about 1811 a French investigator of fats and oils M. E. Chevreul named this sweet principle of
fat Glycerine from Greek world glykys which means sweet (Glycerin an overview, n.d.). The
invention of dynamite in 1866 by Alfred Nobel was what revealed the industrial and economic
importance of glycerin (Glycerin an overview, n.d.).
The main sources of triglycerides are plants formed as a result of photosynthesis. The

2
animal’s triglyceride is possibly formed by assimilation of mostly carbohydrate and other
substances present in their food, this is a complex process and it is not understood fully.
The main processes that utilize triglycerides in production of glycerin as a byproduct are:
biodiesel, soap, fat splitting, fatty alcohol, etc.
There is also synthetic glycerin and this is obtained from propylene oxide a product of
petroleum. It is used mostly by the pharmaceutical sector for manufacturing drugs and other
pharmaceutical purposes (Glycerin methodology, n.d.). The only manufacturer of synthetic
glycerin in United States is Dow Chemical, but it closed its 309 metric kilo tons plant in Texas
because of surplus crude glycerin generated from natural processing of fats and oils (Glycerin
market analysis, n.d.). There are other synthetic glycerin manufacturers, mostly in Asia and
Europe.
Glycerin has about 2000 applications and it plays an important role in nature (Glycerine
and the market, n.d.). It is used in foods, pharmaceuticals, personal care products, industrial
chemicals, etc. Newly discovered applications of glycerin are generating a lot of interest of later
and this is due to its expected effects on the market. The glycerin surplus stock and at a cheap
price is being used as a substitute to some other chemicals.
There are three grades of glycerin; crude glycerin that is about 40% to 88% pure with
water and other impurities like methanol, sodium chloride, sodium hydroxide, matter organic
non glycerol (MONG), etc. This glycerin grade is obtained by recovery process from the waste
stream of the main product. Table 1.1 shows some common components of crude glycerin.

3
Table 1.1 Crude Glycerin Composition (SRS Eng. Corp. BioTech., n.d.)
Properties % Composition
Glycerol Content 40 - 88 Ash 2.0
Water 12.0 Max pH 4 -9
Organic Residue 2.0 Max
The technical grade is about 95% to 98% pure and contains water and other impurities.
It is used mostly for industrially manufacturing purposes. The third grade is 99.7% pure and this
grade is called U.S. Pharmacopeia or chemical pure glycerin. It is also referred to as
pharmaceutical or food grade and, as the name implies, it is used in pharmacy, food, etc. Table
1.2 shows composition for refined glycerin.
Table 1.2 Refined Glycerin Compositions (Shahidi, 2005)

4
There are many processes of producing glycerin, transesterification, saponification, fat
splitting, fermentation from sugar, hydrogenation from carbohydrate, algae processing, etc.
This thesis will focus mostly on three main processes; transesterification, saponification and fat
splitting with fats and oils as their primary raw material.
The glycerin market outlook was good in the 1990’s. The price was $1.00 plus for one
pound of glycerin. It also has experienced some occasional price fluctuations. There are
occasional price drops mostly in 1992, 2000, etc. The occasional fluctuations are mostly as a
result of surplus stock. The quest for a green energy has led to push for biodiesel obtained from
transesterification. This has led to production of excess glycerin more than market demand and
this has being having an adverse effect on glycerin market. The glycerin recovered from these
processes should have been an added value to the process but, in most cases have become a
liability to operators and this is because of poor market.
This thesis is made up of seven chapters:
Chapter one is the introduction of glycerin, its different names, properties, glycerin market, etc.
Chapters two is on fats and oils as natural sources of glycerin. Some impurities contained in the
fats and oils and their implication on glycerin quality is discussed.
Chapter three is about the production processes that yields glycerin as a byproduct. The three
processes are transesterification for biodiesel production, saponification for soap production
and fat splitting for fatty acid production. There are other methods but, this thesis will focus on
these three. The recovery and treatment of glycerin from waste streams will also be discussed.
In chapter four the refining of the recovered glycerin will be discussed. The two refining
processes to be discussed are vacuum distillation and ion exchange. The theory behind these

5
processes and the comparison between this two will be also discussed. Chapter five deals with
different applications of glycerin; its uses in foods, pharmaceuticals, industrial chemicals, etc.
Chapter six examines the glycerin market and economics, factors affecting it and how to put the
market on solid ground. Also discussed is supply and demand, and projections are made.
1.2 Objectives of the Thesis
The glycerin market has been volatile ever since the dawn of the 21th century. There have been
fluctuations in prices as a result of many factors. The strong showing of biodiesel has
complicated the market by significantly increasing the glycerin stock.
The objective of this thesis is to determine the effect of biodiesel glycerin on glycerin
market and identify other major contributors to the glycerin market and their effects. The
interactive effects are included in a projection of the glycerin market five years into the future.

6
CHAPTER 2
GLYCERINE SOURCE 2.1 Introduction
Any discussion on glycerin and its market has to start by taking a look at the sources.
This will help shed more light on processes involved such as the purification processes before
glycerin gets to the market. The primary sources of glycerin are fats and oils and looking into
their makeup will give a better understanding of glycerin as a whole. As mentioned earlier there
are other sources of glycerin such as synthetic glycerin which is glycerin manufactured from
non-triglyceride sources. But, this thesis will be mostly centered on natural glycerin from seed
triglycerides.
The glycerol molecule is attached to three fatty acids molecules in fat or oil forming
triglycerides. The glycerol molecule is liberated as byproduct during the breaking down of the
triglyceride molecule. The processes that make use of triglycerides as their primary raw
material includes: transesterification for the production of biodiesel, saponification for the
production of soap, fat splitting for the production of fatty acids, etc. In these processes the
triglycerides reacts with other components and in some instances a catalyst is needed to
expedite the reaction.
This chapter will focus more on glycerin sources fat and oil, the processing, how glycerin

7
is contaminated with impurities, the types of impurities, and possibly how best these impurities
could be avoided so as to save cost on glycerin purification.
2.2 Fats and Oils Main Source of Glycerin
Fats and Oils are triglycerides, triesters of glycerol that is three molecules of fatty acid
attached to one molecule of glycerol. They belong to a group called Lipids. Lipids are composite
molecules, and they are less dense than water and are insoluble in water and only soluble in
organic solvent. The insolubility in water is due to almost all the bonds being non-polar carbon
to hydrogen or carbon to carbon.
Fat and Oil are similar in that fat has long fatty acid chains and could be solid at room
temperature while oil have short fatty acid chains and are liquids at room temperature. Fig. 2.1
shows the molecular structure of triglyceride, the major component of fats and oils. The three
molecules of fatty acids have a common backbone which is glycerol molecule. Ra, Rb and Rc are
long fatty acid chains that contains carbon and hydrogen atoms. Soybeans oil is used mostly
often for production of biodiesel in US. It has five main fatty acids: linoleic, linolenic, oleic,
palmitic and stearic.
Fig.2.1 Molecular Structure of Fat and Oil

8
Triglycerides are made up of mostly carbon, hydrogen and only six atoms of oxygen. This
makes them good for reduction reactions. Just like other hydrocarbons they are good material
for fuel. The main biological function of fat and oil in the body is for energy – fuel. Humans,
animals, plants, etc. store fats and oil for survival. Seedlings like soybeans store mostly oil and
this helps during germination. It is this oil that is being exploited in transesterification,
saponification, fat splitting etc., reactions to produce fatty acids, soap, biodiesel and glycerin,
etc.
The structure of the fatty acid chain can also determine whether it is a fat or oil. Fatty
acids with single bonds only could be fat and those with more double bonds could be oil. Fatty
acid with no double bonds can hold more hydrogen and is termed saturated. While fatty acid
with double bonds can hold less hydrogen is termed polyunsaturated. Oil also has a low melting
point. Fig. 2.3a and 2.3b shows palmitic acid a saturated fatty acid and linoleic acid a
polyunsaturated fatty acid respectively. Most plant triglycerides fatty acids are
polyunsaturated, while animal fats are saturated and occur as hard fat.

9
(a) Palmitic Acid
(b) Linoleic Acid
Fig. 2.2 Palmitic Acid (a) and Linoleic Acid (b)
If living things want to store glucose molecules for a long time they usually store it as fat
instead of carbohydrates. Table 2.1 shows the fatty acids composition of different fats and oils.
Table 2.2 shows the percentage oil content of some common seeds.

10
Table 2.1 Fats and Oils Fatty Acids of Composition
Fat or Oil 14:0 16:0 18:0 18:1 18:2 18:3 20:0 22:1
Soybean 6-10 2-5 20-30 50-60 5-11
Corn 1-2 8-12 2-5 19-49 Trace
Peanut 8-9 2-3 50-65 20-30
Olive 9-10 2-3 73-84 10-12 Trace
Cottonseed 0-2 20-25 1-2 23-35 40-50 Trace
Hi Linoleic Safflower
5.9 1.5 8.8 83.8
Hi Oleic Safflower 4.8 1.4 74.1 19.7
Hi Oleic Rapeseed 4.3 1.3 59.9 21.1 13.2
Hi Erucic Rapeseed 3.0 0.8 13.1 14.1 9.7 7.4 50.7
Butter 7-10 24-26 10-13 28-31 1-2.5 0.2-0.5
Lard 1-2 28-30 12-18 40-50 7-13 0-1
Tallow 3-6 24-32 20-25 37-43 2-3
Linseed 4-7 2-4 25-40 35-40 25-60
Yellow grease 23.24 16:1=3.79
12.96 44.32 6.97 0.67
Source: Linstromberg, et al. Organic Chemistry. Lexington, MA. 1970

11
Table 2.2 Oil Content for Seeds
SEED FAT CONTENT (%)
SEED FAT CONTENT (%)
SEED FAT CONTENT (%)
Almond 54 Grape 20 Pumpkin 47
Avocado 12 Hemp 35 Rape (canola) 30
Beech 50 Hickory 69 Rice bran 10
Brazil 67 Kukui (candlenut) 30 safflower 60
Cashew 42 Macadamia 72 Sesame 49
Chia 30 Neem 40 Soybean 18
Coconut 35 Olive 20 Sunflower 47
Corn 4 Palm Kernel 3 Walnut 60
Cottonseed 40 Peanut 48 Wheat germ 11
Filbert 62 Pecan 71
Flax 35 Pistachio 54
Glycerol, which is the backbone of fat and oil structure is a trihydric alcohol, that is, it
contains three hydroxyl groups (-OH) and combines with fatty acids molecules to form
monoglycerides, diglycerides and triglycerides. Fats and oils have glycerol content of about 9%
to 12% with coconut having about 13.5% (Shahidi, 2005).
The hydrolysis of triglycerides produces glycerol and fatty acids which are carboxylic
acids. Acids and bases are used to further hydrolysis reaction. When a strong base like sodium
hydroxide is used the product is made up of salts of fatty acids. These are functional

12
components in soap. Fig. 2.3 show a reaction between triglyceride and water to produce
glycerol and fatty acids
Fig. 2.3 Hydrolysis Reaction
Apart from triglycerides which are major component of fats and oils there are minor
components like: Phosphatides, tocopherols, sterols, Chlorophyll and Carotenoids. The most
common forms of phosphatides are Lecithin and Cephalin and consists of alcohol usually
glycerol, phosphoric acids, fatty acids and compounds that contains nitrogen. In a study it was
found that phosphorus compounds was not carried over into methyl esters and this reduced
methyl esters output by 3 to 5% for phosphorus level above 50ppm (Van Garpen, 2005). Also
present as components of fats and oils are unattached fatty acids and some others components
that might not be of much interest in this work. As mentioned earlier both plants and animals
have either fat or oil but, the course of this thesis will be mostly on plant extracted oil.
13
2.3 Summary
The main sources of triglycerides are fats and oils which are obtained from plant seed. A
molecule of triglyceride is made up of three molecules of fatty acids, one molecule of glycerol,
etc. Animal’s fats and oils contain triglycerides but, this thesis will focus mostly on plant
triglycerides. Fats and Oils are somehow similar in some areas, one notable difference is that fat
is solid at room temperature while oil is not.
For better glycerin quality the extraction of oil from seeds should be done avoiding
contamination by impurities as much as possible. Any impurities associated with these oils end
up in the glycerin phase. Few impurities in fats and oils will be an added advantage to glycerin
refiner.

14
CHAPTER 3
GLYCERIN PRODUCTION 3.1 Introduction
Glycerin is produced as a byproduct of chemical reaction which separates the glycerol
molecule from attached fatty acids molecules. Some of these processes include:
transesterification, saponification and fat splitting. The main products of these processes are
biodiesel, soap and fatty acids respectively. Fig. 3.1 shows the three main production processes
of glycerin and the composition of the product stream.
TRIGLYCERIDES
SAPONIFICATION TRANSESTERIFICATION FAT SPLITTING
MEOH &Catalyst
Water
Soap Crude Glycerin (18-30%)
BiodieselCrude Glycerin (40-82%)
Fatty AcidsCrude Glycerin (12-30%)
NAOH
Fig. 3.1 Glycerin Production Processes and Product Compositions (Glycerin recovery, n.d.)
15
There are other processes for production of glycerin such as synthetic process, which
gained attention in the 1940’s and are mostly used for pharmaceutical purposes in the
production of drugs. The course of this thesis will look into the three mentioned processes. This
will help understand the processes involved, the end products, impurities and how impurities
get involved in the process and how best to avoid them.
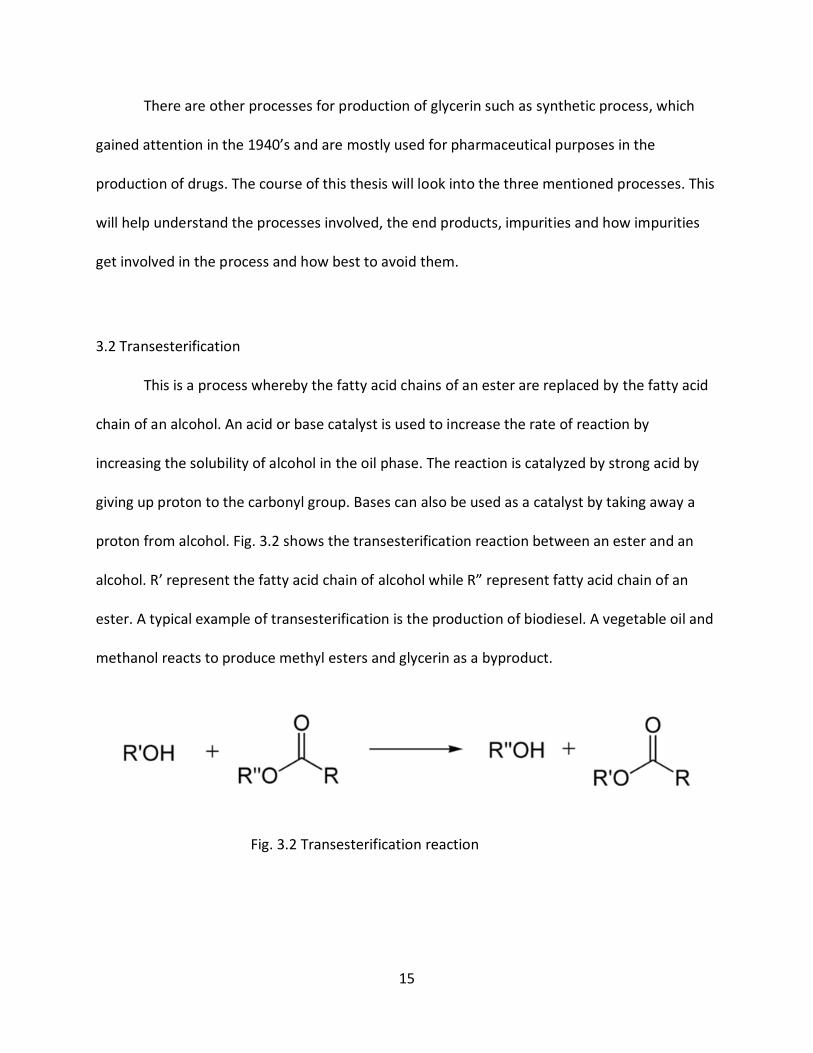
3.2 Transesterification
This is a process whereby the fatty acid chains of an ester are replaced by the fatty acid
chain of an alcohol. An acid or base catalyst is used to increase the rate of reaction by
increasing the solubility of alcohol in the oil phase. The reaction is catalyzed by strong acid by
giving up proton to the carbonyl group. Bases can also be used as a catalyst by taking away a
proton from alcohol. Fig. 3.2 shows the transesterification reaction between an ester and an
alcohol. R’ represent the fatty acid chain of alcohol while R” represent fatty acid chain of an
ester. A typical example of transesterification is the production of biodiesel. A vegetable oil and
methanol reacts to produce methyl esters and glycerin as a byproduct.
Fig. 3.2 Transesterification reaction

16
Esterification is used mostly for fats or oils that have high free fatty acid (FFA). Fig. 3.3
shows an esterification reaction of fatty acids and glycerol to produce triglyceride and water.
Fig. 3.3 Esterification Reaction
If fat or oil with high FFA undergoes a transesterification reaction it will form soap which
will find its way in glycerin and it will create problems during separation and purification. But, if
high FFA fat or oil undergoes an esterification reaction it will produce triglyceride which will
then undergo transesterification reaction for production of biodiesel and glycerin.
3.2.1 Biodiesel Production
The main feedstock used in biodiesel production is vegetable oil. The idea of running an
engine on vegetable oil has existed ever since the invention of diesel engine. In 1893, Rudolf
Diesel the inventor of the diesel engine showed that diesel engine could be operated on
vegetable oil by successfully using peanut oil (suwannakarn, 2008). But, the high viscosity of
vegetable oil over conventional diesel was a problem. The blending of vegetable oil with

17
conventional diesel was not an option because of decrease in power output and thermal
efficiency. To take care of this viscosity problem, transesterification which is the transformation
of an ester into another ester was a solution. This lowers the viscosity of vegetable oil derived
diesel called Biodiesel and make it is compatible in a modern engine.
Biodiesel is defined as a mono-alkyl ester fuel comprised of long chain fatty acids
obtained from triglycerides. B100 implies 100% biodiesel which could be used to run diesel
engine without making much alteration in the engine. It could be blended with conventional
diesel. B20 is a 20% biodiesel blend with 80% conventional diesel. Biodiesel has become more
attractive because of increase in cost of conventional diesel, renewable sources,
environmentally friendly, high performance, etc. Table 3.1 shows the American Society for
Testing and Materials (ASTM) standard for diesel and biodiesel.
In the production of biodiesel, the type of raw materials to be used is purely based on
chemistry and economic options. The primary reactants are fats or oils and alcohol, other
components are catalyst and neutralizer. Table 3.2 lists the typical composition of raw materials
used in making biodiesel.

18
Table 3.1 ASTM Standards for Biodiesel and Diesel (suwannakarn, 2008)
PROPERTY BIODIESEL DIESEL
Standard ASTM D6751 ASTM D975
Composition FAME ( C12 – C22) HC ( C10 – C21)
Kinetic Viscosity (mm2/s) at 400 c 1.9 – 6.0 1.9 – 4.1
Boiling Point ( 0c ) 182 – 338 188 - 343
Flash point ( 0c ) 100 – 170 60 - 80
Cloud point ( 0c ) -3 to 12 -15 to 5
Pour point ( 0c ) -15 to 16 -35 to -15
Water (vol. %) 0.05 0.05
Carbon (wt. %) 77 87
Hydrogen (wt. %) 12 13
Oxygen (wt. %) 11 0
Sulfur (wt. %) 0.05 0.05
Cetane number (ignition quality) 48 – 60 40 – 55
Stiochiometric air/fuel ratio 13.8 15
High Frequency Reciprocating Rig (µm) 314 685
Ball-on-Cylinder Lubricity Evaluator scuff (g) >7000 3600
Life-cycle energy balance (energy units produced
per unit energy consumed)
3.2/1 0.83/1

19
Table 3.2 Biodiesel raw materials composition (Van Gerpen, Shanks, Prusko, et al, 2004)
Primary reactant: Fat or Oil 100kg (e.g. Soybeans oil)
Alcohol 10kg (e.g. Methanol)
Catalyst: Mineral base 0.3kg (e.g. sodium hydroxide)
Neutralizer: Mineral acid 0.25kg (e.g. Sulfuric acid)
Oil preferably is used in biodiesel production, fats are made up of more saturated fatty
acids and this makes it to have higher viscosity and higher melting point. Biodiesel made from
fats have a higher gel and cloud point when compared to that produced from oil and this makes
it incompatible in cold climate (suwannakarn, 2008). Vegetable oil with lower free fatty acids
(FFA) is preferable used in commercial biodiesel production because high FFA oil will result in
production of more soap which will need to be separated at the end of the process.
Considering the economic options waste oil and greases could be used as well, yellow and
brown greases of 15% and 33% FFA respectively could be used because of low cost and high
availability when compared to fresh vegetable oil (suwannakarn, 2008).
Alcohol is another raw material used in biodiesel production, mostly methanol is used
but, other alcohols like ethanol, isopropanol and butyl can be used as well. Water content of
this alcohol is an important factor in determining the type of alcohol to be used. Fig. 3.4 shows
the impact of alcohol to oil ratio in a transesterification reaction.

20
Fig. 3.4 Impact of Alcohol to Oil ratio on the output of a Transesterification Reaction (Van Gerpen, 2005)
The use of methanol over ethanol (despite methanol being more toxic) is that methanol
is easier to separate and recycle back to the system. Ethanol forms an azoetrope with water
while methanol does not. Chemical ethanol is denatured to prevent its abuse but,
transesterification process needs an un-denatured and anhydrous alcohol. Also the cost is
another factor, methanol is cheaper than ethanol at any given time.
21
Catalyst is another component of a transesterification reaction, it does not take part in
the reaction but it is needed to speed up the reaction. As mentioned earlier, alcohol is slightly
soluble in oil and the reaction is slow, so a catalyst is needed to put it on fast track. An acid or
base catalyst can be used, based catalysts are mostly used over acid catalyst because it is faster
(Van Gerpen et al, 2004). The most commonly used base catalysts are sodium hydroxide,
potassium hydroxide and sodium methaoxide. Also, base catalyst is used because it will convert
any FFA in oil to soap which ends up in the glycerin mixture.
One flaw in base catalysts is that they are hygroscopic. Moisture is absorbed from the
environment and this affects reaction. Base catalysts are mostly used by most biodiesel
producers and have a residence time (depending on alcohol to oil ratio, concentration,
temperature, mixing, etc.) of about 5 minutes to 1 hour (Van Gerpen et al, 2004). Most
glycerin refiners prefer the use of sodium hydroxide but, potassium hydroxide (despite costing
more) has an advantage when the products are neutralized with phosphoric acid it forms a
precipitate of potassium phosphate (K3P04) which is used in fertilizer.
Acid catalyst can also be used in transesterification but, this makes the reaction proceed
relatively at slow pace. The esterification of FFA is where acid catalyst is mostly used and the
acids used are mostly phosphoric acid and sulfuric acid. The acid catalyzed system require high
alcohol to oil mole ratio of about 20: 1 and a residence time of about 10 minutes to 2 hours
(Van Gerpen et al, 2004).
Lipase can also be used as a catalyst and its catalytic action can take place at room
temperature without producing spent catalysts. The use of these enzymes is highly specific and
because alcohol can inhibit enzymes it is added in step by step procedure. The reaction is very

22
slow and takes about 4 to 40 hours but, it operates at relatively low temperature of about 35oC
– 45oC (Van Gerpen et al, 2004). The reaction is fast and the output is high for an esterification
reaction but, the rate is slow and output for transesterification reaction does not meet ASTM
standard.
During transesterification reaction the composition of three glycerol’s present;
triacylglycerol, diacylglycerol and monoacylglycerol and methyl ester formed change with time.
Fig. 3.5 below shows compositions of three glycerol and methyl ester formed. As the reaction
proceeds the glycerol stripping from triglyceride – triacylglycerol- takes place in stages from
triglyceride to diglyceride to monoglyceride and this depends on various factors including
catalyst, time and concentration.
Fig.3.5 Composition of Glycerol and Methyl Esters Formed During Transesterification (Van Gerpen, Knothe, 2005)

23
To produce biodiesel a batch or continuous process can be used but, the most common is the
continuous stirred batch process. Fig. 3.6 shows a transesterification reaction equation
between triglyceride and methanol with a base catalyst to produce glycerol and methyl esters –
biodiesel.
Triglyceride Methanol Glycerol Methyl esters Fig. 3.6 Triglyceride and Methanol Reaction Equation
3.2.1.1 Continuous Batch Stirred Process (CBSP)
Biodiesel production starts with the mixing of alcohol and triglyceride at a mole ratio of
6:1 which is common practice but, ratios of 4:1 to 20:1 have being reported (Van Gerpen et al,
2004). Catalyst is added at a range of 0.3% to 1.5% and the preferred catalyst is sodium
hydroxide but, potassium hydroxide is also used. The reactants are stirred so as to promote
proper contact between oil, alcohol and catalyst. The reactor could be sealed or equipped with
a reflux condenser and the operating temperature is about 650C. Fig. 3.7 shows process flow
diagram for continuous stirred batch biodiesel production. Towards the end of reaction less
stirring will help glycerin phase out from methyl ester phase and this could lead to about 85%
to 94% separation (Van Gerpen et al, 2004).

24
Fig. 3.7 Flow Diagram of Continuous Stirred Batch Biodiesel Production (Van Gerpen et al,
2004).
The production process begins by introducing oil to reactor tank followed by catalyst
and alcohol addition. These components are properly mixed using a stirrer for the reaction
duration time of about 20 minutes to over 1 hour (Van Gerpen et al, 2004). After which the
stirring is stopped and the mixture allowed to settle. The amount of time spent in mixing have a
part to play in reducing bounded glycerol - glycerin attached to biodiesel at end of production.
This could be reduced by allowing more time to be spent in the mixing but, this will add more to
time needed for complete reaction to take place. Fig. 3.8 shows a graph of the effect of reaction
time on bounded glycerol.

25
Fig. 3.8 Effect of Reaction Time on Bound Glycerin Yield (Mcfarlane, 2011)
The percentage amount of oil reacted is shown by (▲) and total bounded glycerin is
shown by (Δ) as a function of reaction time, condition of reaction is 800C, 2.6 bar and revolution
speed is 3600rpm.
The mixture is initially allowed to settle into methyl ester and glycerin or pumped to a
settling tank or separated with a centrifuge. The evaporator or a flash unit is used to separate
the alcohol from the methyl ester stream and glycerin stream. The glycerin is neutralized and
washed with soft water and sent to the refining section. The methyl ester is neutralized and
washed with warm slightly acid water to remove methanol and salt. It is then dried and stored
26
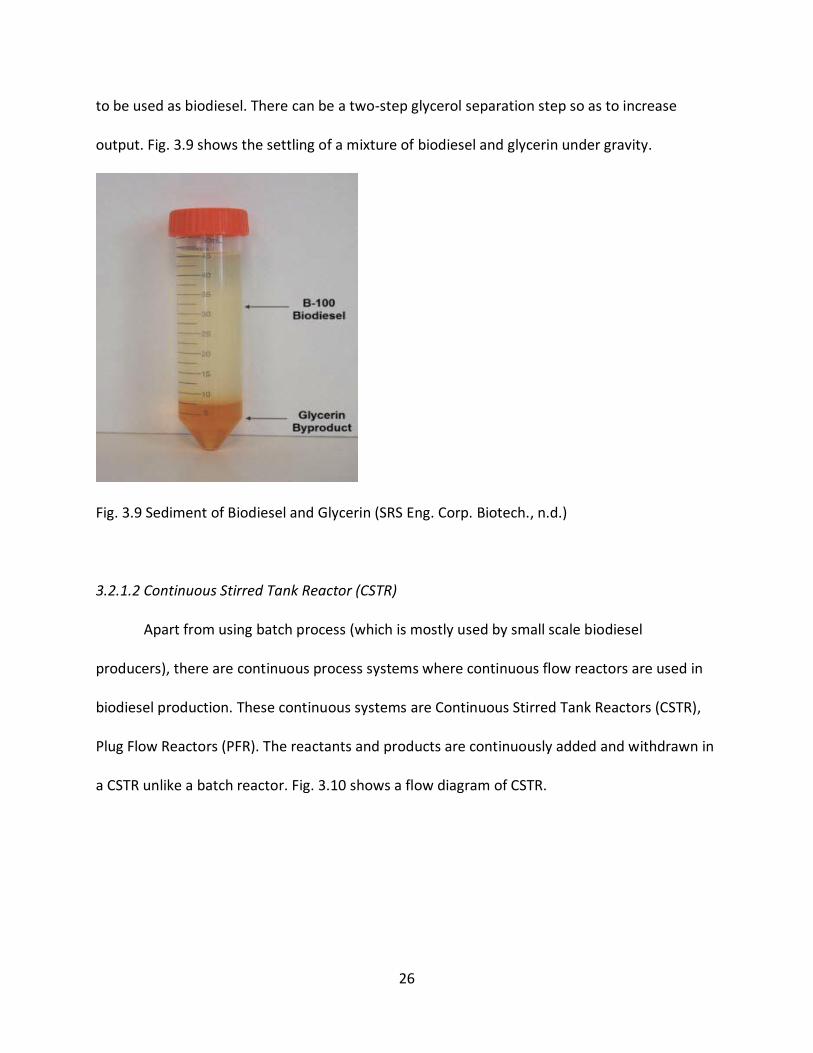
to be used as biodiesel. There can be a two-step glycerol separation step so as to increase
output. Fig. 3.9 shows the settling of a mixture of biodiesel and glycerin under gravity.
Fig. 3.9 Sediment of Biodiesel and Glycerin (SRS Eng. Corp. Biotech., n.d.)
3.2.1.2 Continuous Stirred Tank Reactor (CSTR)
Apart from using batch process (which is mostly used by small scale biodiesel
producers), there are continuous process systems where continuous flow reactors are used in
biodiesel production. These continuous systems are Continuous Stirred Tank Reactors (CSTR),
Plug Flow Reactors (PFR). The reactants and products are continuously added and withdrawn in
a CSTR unlike a batch reactor. Fig. 3.10 shows a flow diagram of CSTR.

27
Fig. 3.10 Flow Diagram of Continuous Stirred Tank Biodiesel Production (Van Gerpen et al,
2004).
For a continuous process to be effective there will be a uniformity of the chemical
compositions of the reactants and the products at any given time. The temperature, pressure,
flow rate, continuous stirring, etc. should be maintained for maximum result. For complete
conversion of about 99%, more than one reactor is needed. In the first reactor about 80% of the
alcohol and catalyst are added and the mixture is properly stirred and after the first stage
reaction glycerin is withdrawn. The product stream from the first stage reactor is moved to the

28
second reactor where the remaining 20% alcohol and catalyst are added. After proper stirring
and reaction takes place the final separation of biodiesel and glycerin will take place. Fig. 3.11
shows the effect of number stages and time on bounded glycerin.
In the system, the reaction temperature 80 0C for four stage process at 10 minutes
reaction time. The addition of methanol at stage two was 10%, which completes the required
methanol needed for the reaction. This leaves the bound glycerin at 0.24% slightly above ASTM
standard. The addition of an extra 5% methanol at stage three reduces the bound glycerol to
about 0.15% which is below the ASTM standard. At the fourth stage no methanol was added
because it will have no effect since the standard have been met at stage three. From the
analysis the third stage will meet the ASTM standard even better but, stage two will slightly
miss the ASTM standard. It is left for the operators to decide which one will be better taking it
to stage three or stopping at stage two and achieve the standard during purification.
Fig. 3.11 Effect of Number Reaction Stages on Bound Glycerol (Mcfarlane, 2011)

29
3.2.1.3 Biodiesel Purification
The methyl ester obtained is still impure and contains impurities like glycerides, glycerol,
methanol, water, soap, catalyst, etc. These impurities, if allowed to stay in biodiesel, will not
meet ASTM standard and will cause corrosion, low oxidative stability, high viscosity, injector
deposits, low flash point, and high sulfur emission.
To remove these impurities the biodiesel undergoes washing. Water washing of biodiesel is one
of the traditional ways of purifying biodiesel. To enhance the washing, ionized or acidified
water, membrane to prevent emulsion are used. The addition of acid aids in removal of soap
components. The use of water to extract impurities from biodiesel is termed liquid to liquid
extraction. The principle is this; material dissolved in one liquid phase is transferred to another
liquid phase. In the washing of biodiesel when the water and biodiesel are mixed and allowed
to settle, a two distinct phase will be seen; the water and biodiesel phase. The biodiesel phase
is the diluent because it contains the solute glycerol and other impurities and the water phase
is the solvent. In the washing process the impurities are extracted from the biodiesel phase and
absorbed into the water phase.
Temperature is also a factor here because an increase in temperature to a certain
degree will increase the mobility of the mixture particles and increase the movement of
impurities from biodiesel phase into water phase. Agitation will also help in proper dispersion
of water into the biodiesel and help in the mobility of the mixture.
Other methods of water washing are: (1) Mist washing in which the water is sprayed in
tiny droplets on the surface of the biodiesel in a tank. Since water is denser than biodiesel it
tends to move to the bottom and it will take with it some impurities. (2) Bubble washing makes

30
use of bubbler placed at the water phase of the mixture. Water bubbles are produced which
travels upwards and then downwards and as it does that it absorbs the impurities with it into
the water phase.
The biodiesel from the washing is dried and stored for use, the water with glycerin and
other impurities is treated and the glycerin is recovered and sent to refining. The catalyst,
glycerides, etc. are recovered and recycled for reuse.
3.2.1.4 Effect of Temperature, Time and Water Ratio on Washing
Temperature, time and the ratio of water to biodiesel play an important role in purifying
produced biodiesel. To understand the role played by these three factors a look at an
experiment conduct by Rahayu and Mindarayani, (2007) on washing of biodiesel produced
using castor oil, methanol and potassium hydroxide as catalyst. During the experiment proper
mixing of the mixture of biodiesel and water was achieved and this was done by stirring at 300
rpm.
To study the effect of temperature, four temperatures (301k, 308k, 318k and 328k)
were chosen and volume ratio of biodiesel and water was kept constant at 2:1. Table 3.3 and
fig. 3.12 show the equilibrium glycerol concentration at different temperature and the effect of
washing time on concentration respectively.
From the table 3.3 and fig. 3.12 it can be seen that temperature and time plays an
important role on the amount and rate of glycerin extracted. The amount of glycerin extracted
increased as the temperature and time increased. The rate of extraction of glycerol was high at
the being of the experiment because the difference in concentration was high and tends to

31
gradually reduce as the concentration reduces until it attends equilibrium. Also the time for
extraction was reduced as the temperature was increased.
Table 3.3 Equilibrium Concentration of Glycerol at Different Temperature (Rahayu and
Mindaryani, 2007)
NO Washing Temperature Equilibrium Concentration of
T (K) Glycerol , 10^2 (g/cm^2)
Biodiesel Phase Water Phase
1 301 0.088 0.8059
2 308 0.0838 0.8283
3 318 0.0802 0.9544
4 328 0.0698 0.9678
Fig. 3.12 Effect of Washing Time on Concentration of Glycerol (Rahayu and Mindaryani, 2007)

32
For the effect of the ratio of biodiesel to water, table 3.4 shows the equilibrium
concentration of glycerol at different biodiesel and water ratio. Fig. 3.13 shows the effect of
washing time on concentration of glycerol on different biodiesel to water ratio.
Table 3.4 Equilibrium Concentration of Glycerol at Different Biodiesel and water Ratio (Rahayu
and Mindaryani, 2007)
The ratio of components played a role on the amount of glycerol extracted. As the ratio
of biodiesel and water are altered it affected the rate and amount of glycerol extracted.
Fig. 3.13 Effect on Washing Time for Different Biodiesel and Water Ratios (Rahayu and
Mindaryani, 2007)

33
When there was more biodiesel to water, the rate and amount of glycerol extracted was
small compared to when the ratio of water was more than that of biodiesel. The amount of
glycerol extracted continued to increase for each change in ratio (with water been on the
greater side) until an equilibrium is reached at 20 minutes.
3.2.2 Saponification
This chemical synthesis that has been going on for a long time. It involves the hydrolysis
of triglycerides with a base (most likely sodium hydroxide (NAOH) or potassium hydroxide
(KOH)) to produce soap and glycerol as a byproduct. The saponification reaction yields glycerol
content of about 8% to 12% (Shahidi, 2005).
Triglycerides saponification with an alkali is a bimolecular nucleophilic substitution
reaction. The reaction is exothermic occurring at temperature in range of about 80 0C to 100 0C.
Temperature plays a very important role here as an increase in temperature and proper mixing
increases the rate of reaction. Also the reaction rate is increased by the formation of soap. The
two reactants involved in this process (triglyceride and alkali) are immiscible and the rate of
reaction at the beginning is slow but, the formation of soap increases the emulsification of the
two reactants thereby increasing the rate of reaction. Fig. 3.14 shows a chemical reaction
equation of triglyceride and sodium hydroxide to produce soap and glycerol.
The active ingredient in soap is surfactant which is ionic in nature and made up of long
hydrophobic (water insoluble) non-polar linear tail with anionic or cationic hydrophilic (water
soluble) head. The solubility difference makes the surfactant a wetting agent. The tails aligns to

34
water interface lowering surface tension so that it can penetrate objects to be washed. Also an
emulsion is formed between water and the oily dirt particles.
Fig. 3.14 Saponification Reaction Equation
3.2.2.1 Soap Production
Soap is a salt of fatty acids of sodium or potassium and contains 8 to 22 carbon atoms.
There are saturated, mono-unsaturated and poly-unsaturated soaps due to the type of fat or oil
used for saponfication process. The production of soap is either a continuous process where
reactants and products are added and removed respectively in a continuous processs or batch
process where reactants and products are added and removed in a batch wish process. The
process could also be cold or hot. In the course of this thesis the hot process will be discussed.
Soap production is a four step process:
1. Saponification- the reaction between triglycerides and alkali which results in the
formation of crude soap (soap, glycerol and other impurities).
2. Washing- Brine solution is added to the crude soap to grain and washout glycerol from
the rest of the saponified mixture. Wet soap is soluble in weak brine solution but,
insoluble in high concentrated brine solution. Glycerin is highly soluble in brine solution.

35
3. Glycerol Removal- the glycerol formed is removed and pumped to spent lye treatment
tank.
4. Soap Finishing- the soap curd formed undergoes processing emerging as a finished bar.
The removal of glycerol from the saponification product is important because it is an
added value to soap makers. The extraction of glycerin and its purification just as in biodiesel
production, will be an added profit to manufacturers but, the removal of glycerin will have an
effect on the soap finally produced. Pure soap is hard and easily undergoes oxidation and many
additives including glycerin are added to make the soap smooth and soft.
There was a case study in one of the companies that I worked for, in the 1990’s before the
flooding of glycerin market from glycerin produced from fat splitting and later biodiesel
production. The cost of glycerin was very high in world market, so in order to make more profit,
glycerin was almost striped from soap curd. This had a negative effect on soap produced. It was
discovered that the finished soap tablet produced for sale had cracks on the surface after a
period of time and this was not accepted by quality department. To remedy this more glycerin
was left in the soap tablet.
For the soap production, fat or oil are blended depending on the quality need. This is
because some oil (like tallow) produces a hard soap with less detergency, however coconut oil
produces soft soap and more detergency. A blend ratio of 80:20 of oil that produces hard and
soft soap respectively is common, table 3.5, show raw material composition used in a Colgate-
Palmolive continuous process.

36
Table 3.5 Saponification Raw Material Composition
Tallow 525.9kg/hr.
Coconut oil 131.5kg/hr.
Sodium Hydroxide solution (50%) 101kg/hr.
For a batch process production, the raw materials mentioned above are continuously
fed into saponification pan fitted with steam coils and steam is added to aid the reaction.
Fig.3.15 shows a flow diagram of soap production process. The raw materials are fed until a
required amount for a batch is achieved. The saponified component in the pan is mixed with
the help of steam to prevent excess sodium hydroxide or oil in the product. During the raw
material addition, water and brine solution are added in small proportion to aid mixing the
crude soap which will have about 10% glycerin and less water. The crude soap needs to be
about 30% water to be pumpable at about 70 0C (Soap and detergent Manufacture, n.d.). The
amount of sodium hydroxide added during saponification could be intentionally made less than
what is required in order to prevent excess caustic in the spent lye, which will be an add cost to
glycerin purification.

37
Saponification Vessel
Soap WashingSpent Lye
Treatment Tank
Soap CurdGlycerin Recovery
Brine Addition Spent Lye
Treated Lye
Oil
Naoh Sol.
Fig. 3.15 Process Flow Diagram of Soap Production
The next step is washing. The crude soap is mixed with brine solution to wash the crude
soap. This will grain the mixture and help the separation of spent lye (mixture of brine and
glycerin) from the rest of the mixture. As mentioned earlier wet soap is soluble to brine solution
but, as the concentration of the brine electrolyte is increased, the crude soap will grain thereby
separating and creating two mixtures; soap curd and spent lye.
The washed crude soap is allowed to settle for about 1 hour to 4 hours. This will create a
clear separated mass of soap curd and spent lye; soap curd being less dense will settle on top
while spent lye will settle below with other impurities. The spent lye is pumped to a lye
treatment tank where oil is added to neutralize it of excess caustic soda. The neat soap curd
containing about 0.5% Nacl, 0.3% Noah and 31% water undergoes more processing before
emerging as a finished soap bar.
3.2.2.2 Brine Concentration Impact on Glycerin Extraction
The glycerin that was released during the saponification process is still embedded in the
38
crude soap formed. To extract this glycerin, a brine solution is needed and the concentration of
brine solution is very important for maximum glycerin extraction during washing of crude soap.
As mentioned earlier, wet soap is soluble in weak brine solution and insoluble in high brine
concentration while glycerin is soluble in any concentration of brine solution. The addition of
high concentrated brine solution makes the crude soap to grain and precipitate. The soap curd
settles at the top and the spent lye solution, which contains glycerin and other impurities,
settles at the bottom.
To understand the effect of brine concentration on extraction of glycerin, an experiment
was conducted by Efeovbokhan, et al (2012), using palm kernel oil, palm oil, sodium hydroxide,
sodium chlorine and water. Brine solutions of 8%, 10%, 12% and 15% were prepared using
sodium chloride and water. The crude soap formed from cold process saponification reaction
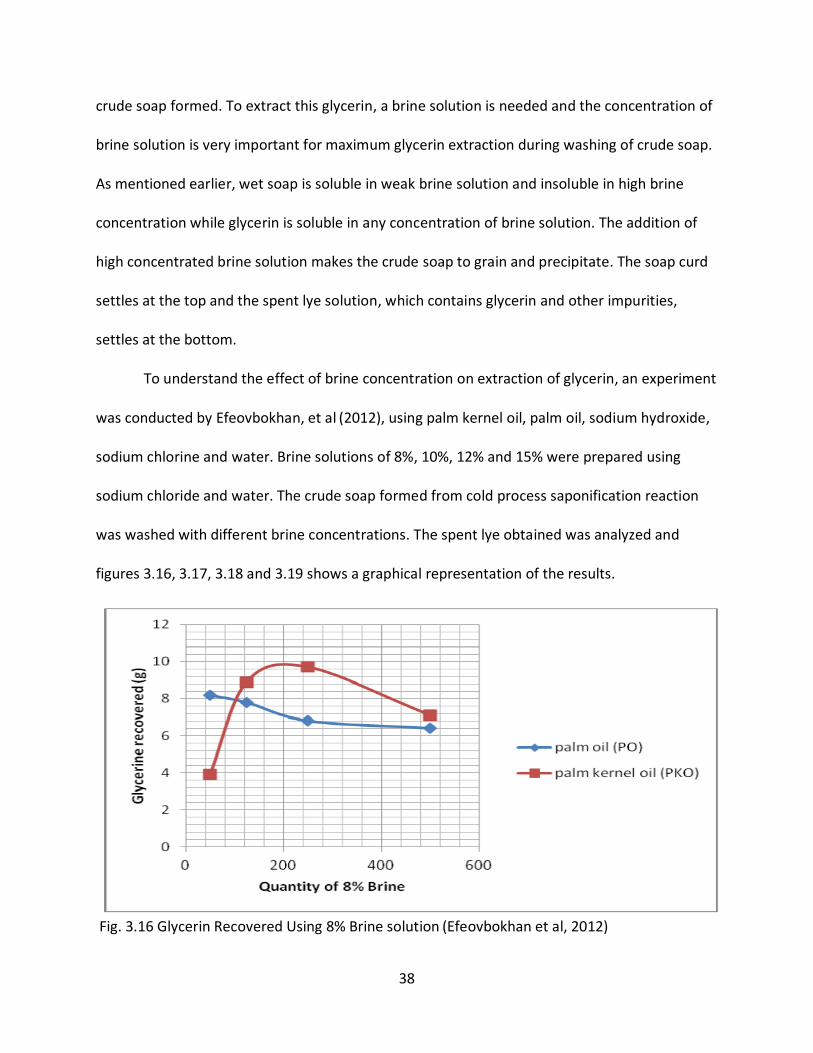
was washed with different brine concentrations. The spent lye obtained was analyzed and
figures 3.16, 3.17, 3.18 and 3.19 shows a graphical representation of the results.
Fig. 3.16 Glycerin Recovered Using 8% Brine solution (Efeovbokhan et al, 2012)

39
Fig. 3.17 Glycerin Recovered Using 10% Brine Solution (Efeovbokhan et al, 2012)
Fig. 3.18 Glycerin Recovered Using 12% Brine Solution (Efeovbokhan et al, 2012)
40
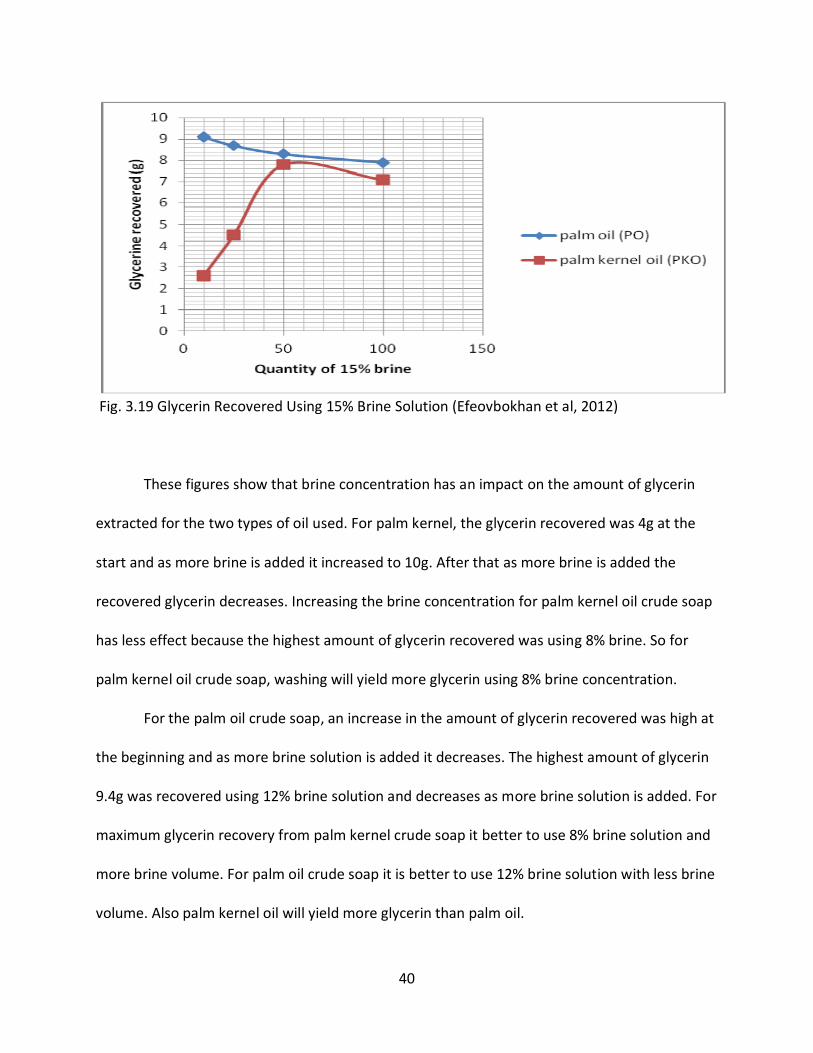
Fig. 3.19 Glycerin Recovered Using 15% Brine Solution (Efeovbokhan et al, 2012)
These figures show that brine concentration has an impact on the amount of glycerin
extracted for the two types of oil used. For palm kernel, the glycerin recovered was 4g at the
start and as more brine is added it increased to 10g. After that as more brine is added the
recovered glycerin decreases. Increasing the brine concentration for palm kernel oil crude soap
has less effect because the highest amount of glycerin recovered was using 8% brine. So for
palm kernel oil crude soap, washing will yield more glycerin using 8% brine concentration.
For the palm oil crude soap, an increase in the amount of glycerin recovered was high at
the beginning and as more brine solution is added it decreases. The highest amount of glycerin
9.4g was recovered using 12% brine solution and decreases as more brine solution is added. For
maximum glycerin recovery from palm kernel crude soap it better to use 8% brine solution and
more brine volume. For palm oil crude soap it is better to use 12% brine solution with less brine
volume. Also palm kernel oil will yield more glycerin than palm oil.

41
3.2.3 Fat Splitting
Fatty acids are olechemicals and are used in various products. As mentioned earlier,
fatty acids and glycerol are constituents of fats and oil. To separate these fatty acids from other
fat and oil components, a method called Fat Splitting is used. Fat splitting has being in existence
since about 1845. Oil is brought in contact with water at high pressure of about 5mpa to 6mpa
and high temperature of about 250 0C to 260 0C in a countercurrent flow method. The products
of the reaction are fatty acids and sweet water, which contains about 15% glycerin. This process
yields more glycerin than transesterification and saponification. Fat splitting and
transesterification are responsible for the flooding of glycerin market. The hydrolysis reaction
discussed above is fat splitting and the reaction is reversible. At the point of equilibrium
glycerin is withdrawn.
Hydrolysis is a homogeneous reaction that proceeds in stages at high temperature and
pressure. The use of sulfuric acid, magnesium oxide and zinc oxide in small amount acts as a
catalyst and boost the rate of reaction and the formation of emulsion.
The solubility of oil in water at low temperature and pressure is minimal but, increases with
increase in temperature and pressure. Water solubility increases by two to three times when
temperature is increased from 150 0C to 220 0C (Shahidi, 2005)
There are four major fat splitting methods: continuous, batch autoclave process,
Twitchell and enzymatic processes. Fig.3.17 shows a process flow schematic for Lurgi single
stage countercurrent fat splitting plant with glycerin water (sweet water) concentration. The
most widely used continuous fat splitting process is the Colgate-Emery process. This is due to its
efficiency. Table 3.6 show approximate utility consumption per ton of crude oil.

42
Table 3.6 Approximate Utility Consumption per Ton of Oil (Fatty acid Tech., 2005)
UTILITY AMOUNT
Heating Steam, 60bar 160Kg
Cooling Water, 200c 12m3
Electrical Energy 10Kwh
Process Water 0.6m3
The splitting process commences by introducing deaerated fat or oil into the splitting
tower from the bottom by a high pressure pump. It is sprayed upward. Water, at the ratio of 40
to 50% of amount of fat is introduced from the top and sprayed downwards
(countercurrent). The high temperatures of about 250 0C to 260 0C facilitate proper dissolution
of water into the fat or oil thereby causing the splitting of the fatty acids. The displacement of
the triglycerides fatty acid is done in stages, from triglycerides to diglycerides to monoglyceride
and improper splitting will result in more triglycerides, diglycerides and monoglyceride. In some
instances catalyst could be used but, this not necessary. The process takes about 2 hours to 3
hours to complete which makes it more efficient than any other process.
The splitting tower is made of corrosion resistant material like stainless steel 316 or an
alloy of steel that can withstand pressure of about 6mpa and depending on the capacity could
be 18m to 25m high and a diameter of 5.08m to 12.2m (Shahidi, 2005). Table 3.7 shows the
product range for a tallow fat splitting. There is a little discoloration of the fatty acids at the end
of the process. Fatty acids are refined further and sweet water is sent to glycerin recovery.

43
Fig. 3.20 Single Stage Countercurrent Fat Splitting Process (Fatty acid Tech., n.d.)
Table 3.7 Tallow Splitting Product Result (Fatty acid Tech., 2005)
Parameters Percent
Degree of splitting glycerin water ≥ 99% Concentrated glycerin water 12 to 16% By flashing vapors 20 to 35%
3.3 Glycerin Recovery
The spent lye from saponification reaction is made of glycerin, sodium chloride, sodium
hydroxide, water, etc. and the sweet water from fat splitting contains water, glycerin and some

44
other impurities if catalyst is used. Spent lye and sweet water will from now on be referred to
as spent lye. It undergoes processing to extract the glycerin and this process is called glycerin
recovery. The glycerin obtained is about 80% to 88% pure. Fig. 3.21 shows a process flow
diagram for treatment of spent lye before it undergoes evaporation.
The spent lye is pumped into a treatment tank where regents are added to remove soap
content. Ferrous chloride is used but, in order to prevent it from reacting with hydroxide ions,
the spent lye is first treated with hydrochloric acid. It reacts with sodium hydroxide forming
sodium chloride and water. It also reacts with some soap and releases it as fatty acid.
The mixture is filtered using a filter press. The ferrous chloride is added next and it reacts with
remaining soap forming a precipitate of insoluble ferrous soap. It also acts as a flocculants,
entrapping other impurities. With the aid of air and an agitator proper mixing is ensured. The
mixture is filtered again for the second time and excess ferrous chloride removed by adding
sodium hydroxide. The pH of soap free lye is adjusted to 6.5 before it is sent to the evaporator
for water and salt removal. Fig. 3.22 shows lye treatment reaction equations.

45
Spent Lye
Mixer 1 Mixer 2
Filter Press Filter Press
Treated Lye Tank
Ferrous ChlorideHydrochloric Acid
Fig. 3.21 Spent Lye Treating Process Flow Diagram
HCL + NAOH → NACL + H20
FECL2 + 2RCOONA → 2NACL + (RCOO)2FE
2NAOH + FECL2 → FE(OH)2 + 2NACL Fig. 3.22 Lye Treatment Reaction Equation
The evaporating process uses three evaporators. The heating effect is used to evaporate
water. Fig. 3.23 shows a process flow diagram of the evaporating unit.
The first two evaporating vessels are called 1st and 2nd effect and the third evaporator where
the final evaporation takes place is just called evaporator. The treated lye is first introduced
into the 2nd effect vessel where heat from 1st effect vessel is used in raising the lye to about

46
40% concentration. The lye is then sent to the 1st effect vessel where steam is added. The
concentration is raised to about 60% and at this point it is called semi crude.
2nd Effect 1st Effect Evaporator
Salt Box
Crude Glycerin
Spent Lye
Semi Crude Tank
Fig. 3.23 Process flow Diagram Lye Evaporation
The semi crude is the sent to the final evaporator where steam is added and increases
the concentration to about 82% to 88%. This makes the salt to crystallize out and fall into a salt
box that is under the evaporator. All this evaporators are operated under vacuum. The crude
glycerin formed is sent to the refining section for final purification process.
3.4 Summary
In this section the production of glycerin as a byproduct of the transesterification,
saponification and fat splitting was discussed. The processes glycerin passed through determine
the type of impurities associated with it. The impurities determine the type of refining process

47
for the glycerin produced. Fat splitting has more glycerin output and has less reactant (only
water and oil) except when there is need for catalyst. This reduces the amount of impurities
attached in glycerin obtained from this process.

48
CHAPTER 4
GLYCERIN REFINING
4.1 Introduction
The crude glycerin obtained from the recovery process still needs to undergo refining
processes to get a better market value. The impurities in glycerin come from the process that it
passed through during the production processes and the feed stock used. These impurities
include: salt, soap, matter organic non glycerin (MONG), water, color pigments, odor, etc. To
get a better value, glycerin undergoes further purification processes where impurities are
removed. The refining processes separate glycerin into three generally accepted grades crude,
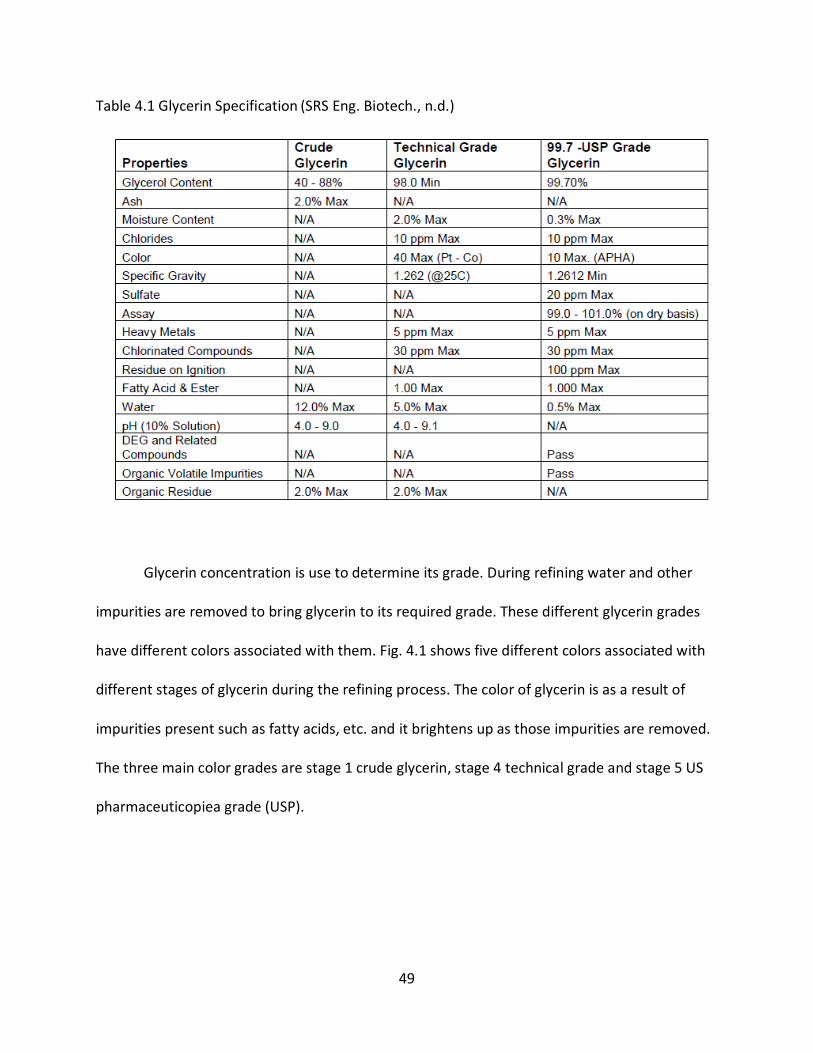
technical and US pharmacopeia or Chemical pure. Table 4.1 shows the specification for these
three grades of glycerin. The crude glycerin market is volatile because of large volume pumped
into the market by fat splitting and, of late, biodiesel production. The refined glycerin market is
stable, with even the United States importing refined glycerin to meet up with demand.
Glycerin refining is costly but, when refined the high market prices offset the production
and refining cost. There are many methods of refining glycerin including vacuum distillation, ion
exchange, electrolysis, ion exclusion, etc. In this chapter two refining processes will be
discussed: vacuum distillation and ion exchange. Comparisons will be made between the two so
as to determine better and cheaper refining methods.
49
Table 4.1 Glycerin Specification (SRS Eng. Biotech., n.d.)
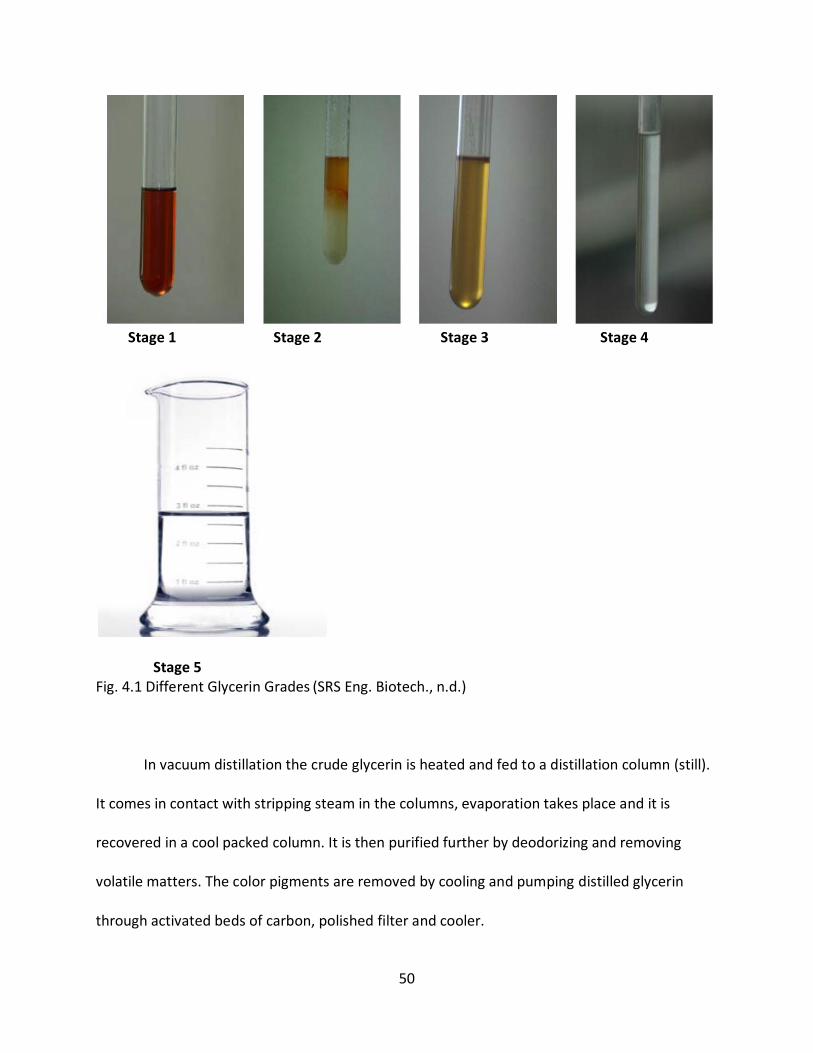
Glycerin concentration is use to determine its grade. During refining water and other
impurities are removed to bring glycerin to its required grade. These different glycerin grades
have different colors associated with them. Fig. 4.1 shows five different colors associated with
different stages of glycerin during the refining process. The color of glycerin is as a result of
impurities present such as fatty acids, etc. and it brightens up as those impurities are removed.
The three main color grades are stage 1 crude glycerin, stage 4 technical grade and stage 5 US
pharmaceuticopiea grade (USP).
50
Stage 1 Stage 2 Stage 3 Stage 4
Stage 5 Fig. 4.1 Different Glycerin Grades (SRS Eng. Biotech., n.d.)
In vacuum distillation the crude glycerin is heated and fed to a distillation column (still).
It comes in contact with stripping steam in the columns, evaporation takes place and it is
recovered in a cool packed column. It is then purified further by deodorizing and removing
volatile matters. The color pigments are removed by cooling and pumping distilled glycerin
through activated beds of carbon, polished filter and cooler.

51
In ion exchange, a two-step process of loading and regeneration is used. A glycerin stream is
passed through a resin (filled fixed beds) and an ion exchange occurs until capacity of the resin
is spent and regeneration takes place. Detailed process steps are discussed below.
The grades of glycerin produced determine its market value. As mentioned earlier and
shown in table 4.1 crude glycerin is the glycerin that is obtained from a glycerin recovery
process, its color is stage 1 from fig. 4.1 it is light brown and it looks like a honey. It contains
salt, water, Mong, and methanol and has a glycerin concentration of about 40% to 88%. The
next grade is the technical grade (stage 4 on fig. 4.1). It is partially refined glycerin with almost
all of its impurities removed, it is transparent like water and viscous and contains about 98%
glycerin. The third grade is (stage 5 on fig. 4.1) is the pharmaceutical grade which has reached
the highest state of purity. It contains about 99.5% to 99.7% glycerin depending on standard
(US. or British pharmacopeia standard). This grade is what is used in the manufacture of drugs,
foods, cosmetics, etc.
The two closely related grades, the technical and pharmaceutical have only minimal
differences. The pharmaceutical grade is closely regulated by Food and Drug Administration
(FDA) while the technical grade is not; it only has to meet the purchaser demand. To achieve
the grade mentioned above, glycerin is refined using vacuum distillation or ion exchange
method and this is discussed below.
4.2 Vacuum Distillation
The refining of glycerin using vacuum distillation is conventional. Steam is used to
elevate the temperature of crude glycerin causing water and some other impurities to acquire

52
thermal energy and evaporate. At atmospheric pressure of 1atm. the boiling temperature of
glycerin is 290 0C. However glycerin starts to polymerize at about 200 0C and in order to prevent
polymerization and save cost, distillation is performed at a reduced absolute pressure of 5 to
6mmHg by introducing vacuum at a corresponding temperature of 165 0C (Shahidi, 2005).
The volume of steam required for the stripping in the distillation process is about 20% of
amount of crude glycerin to be refined. Also, the water component of crude glycerin stream
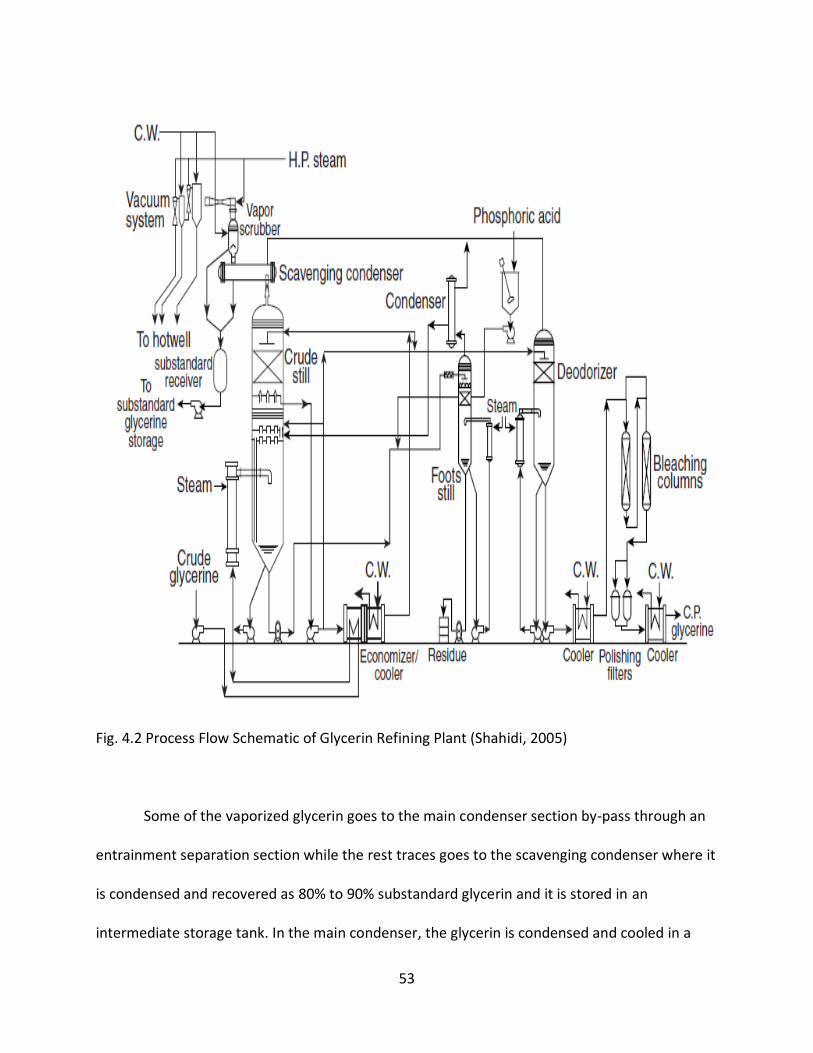
could be flashed, thereby providing more steam for the stripping process. Fig. 4.2 shows a
Wurster and Sanger continuous glycerin vacuum distillation process flow schematic. A single
vacuum system is used for the still, foot still and deodorizer. It is designed for 1 to 8mmHg so as
to meet required standard, it is also designed to take care of duct losses, leaks, equipment
pressure differentials, etc. It also has a barometric or surface condenser with booster jet or
vacuum pump.
Glycerin refining process begins by preheating the crude glycerin coming in by distilled
hot glycerin that is leaving the still. The temperature of the preheated crude glycerin is further
increased to 165 0C by heating it in the still heater and is been circulated using a circulation
pump. The high temperature crude glycerin is sent to the flash chamber where it is partially
vaporized with the aid of vacuum and steam.
53
Fig. 4.2 Process Flow Schematic of Glycerin Refining Plant (Shahidi, 2005)
Some of the vaporized glycerin goes to the main condenser section by-pass through an
entrainment separation section while the rest traces goes to the scavenging condenser where it
is condensed and recovered as 80% to 90% substandard glycerin and it is stored in an
intermediate storage tank. In the main condenser, the glycerin is condensed and cooled in a

54
layer of packing that is cooled by circulating cooled distilled glycerin. At high distillation
temperature, some unwanted reaction can also take place and forming: (1) in presence of
excess alkali, polyglycerol ; (2) Proteinous matter present can breakdown at high temperature
to form nitrogenous compounds; (3) Acrolein an odor constituent that is very difficult to
remove could be formed; (4) Left over Soap particles could form volatile glycerol.
The distilled glycerin undergoes evaporation again in the deodorizer to ensure complete
removal of residual water and odor causing material at about 130 0C to 140 0C and under
vacuum. A proper reflux rate is needed for maximum removal of close boiling impurities. The
incoming feed cools the vaporized glycerin as it is passed through packed section. To remove
any leftover color pigment and odor, the distilled glycerin undergoes a carbon absorption
process where activated carbon is used to remove these final impurities. Fig. 4.3 shows a
carbon absorption process flow diagram.
The use of activated carbon promotes stability and it is used at the range of 0.5 to 1.0%.
The carbon column is made of three operational columns in series and one standby and they
are filled with dry activated carbon. To saturate the carbon and displace air, water or heated
distilled glycerin at 75 0C to 85 0C is used to fill the column and this is allowed to settle and is
vented to atmosphere. This ensures proper saturation and all air is removed to prevent
channeling of glycerin through carbon beds; this will prevent poor glycerin output and excessive
use of carbon.

55
Fig. 4.3 Distilled Glycerin Absorption Process Flow diagram (Shahidi, 2005)
To prevent “bumping” when distilled glycerin is pumped through the carbon beds a
positive placement pump is used. At constant rate, distilled glycerin at 75 0C to 85 0C is pumped
through the carbon beds, and bag filter of 5 to 10 microns made of polypropylene or PTFE cloth
is used to filter off any carbon impurities. The final bleached and deodorized distilled glycerin is
stored in storage tank.
The substandard glycerin is refined after enough quantity is collected, it is processed
into lower glycerin grade such as dynamite or high gravity grade. During the distillation process
there is constant removal of residue from the bottom of the column. It contains glycerol,
polyglycerol, salt, aldehyde resins, organic products of decomposition, etc. These residues
should not be allowed to buildup in the column, because this will cause quality and capacity
56
problems by reducing the amount of crude glycerin entering the column. There are two
possible ways of removing the residue: (1) the residue is constantly removed and redistilled to
recover leftover glycerin and the remaining is deposed and sent to a land fill; (2) The residue is
constantly conveyed to a treated lye tank for reprocessing. For easy processing of residue
glycerin more than 25% should be kept at any time in the residue and about 0.5% to 1% of
phosphoric acid is added to keep it soft by lowering the pH to prevent polyglycerol formation.
4.2.1 Effect of Activated Carbon Quantity on Adsorption
The effect of amount of activated carbon used during adsorption process is of interest
because the use of activated carbon plays a very important role on the color of glycerin
obtained. To determine this effect an experiment was conducted by Manosak, Limpattayanate
and Hunson (2011), in which different ratios of activated carbon and glycerin were used.
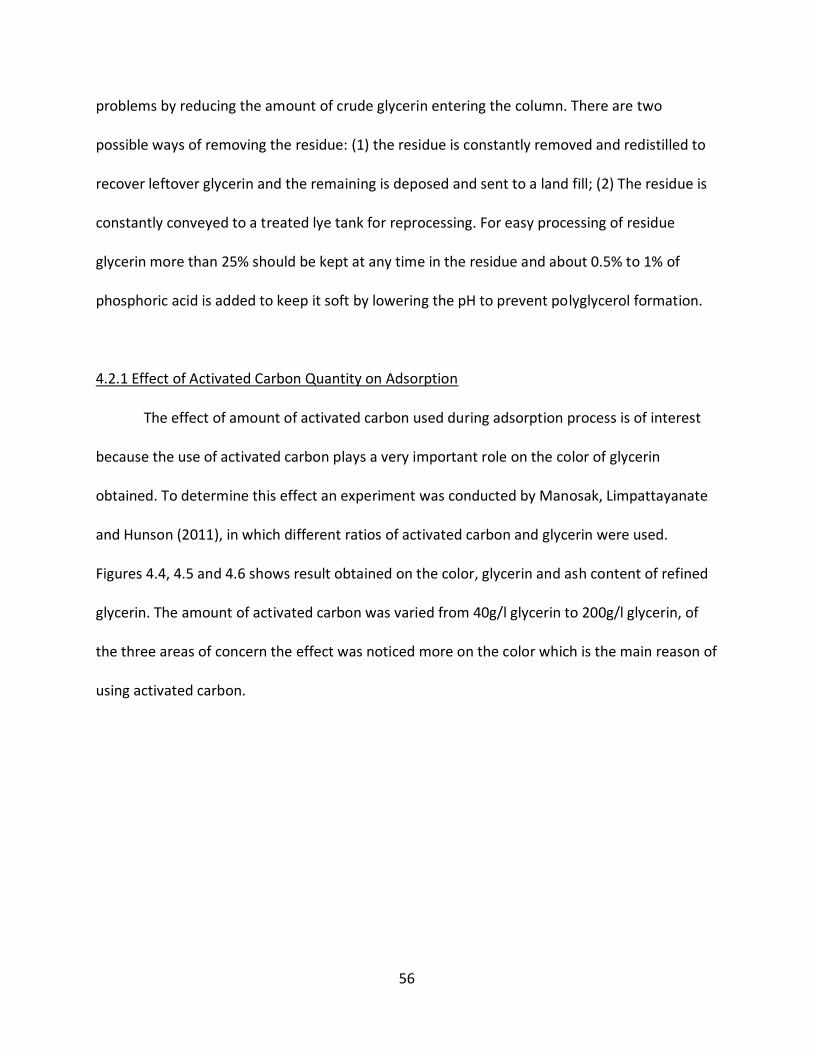
Figures 4.4, 4.5 and 4.6 shows result obtained on the color, glycerin and ash content of refined
glycerin. The amount of activated carbon was varied from 40g/l glycerin to 200g/l glycerin, of
the three areas of concern the effect was noticed more on the color which is the main reason of
using activated carbon.

57
Fig. 4.4 Effect of Activated Carbon on Color (Manosak et al. 2011)
From fig. 4.4 it could be seen clearly that as the activated carbon content is increased
from varied from 40g/l glycerin to 200g/l glycerin. There is a shape drop of color content from
12,000 units to almost 200units, there is about 98.3% reduction in color.
Fig. 4.5 Effect of Activated Carbon on Glycerin Content (Manosak et al. 2011)
0
2,000
4,000
6,000
8,000
10,000
12,000
40 50 65 100 200
Co
lor
Pt-
Co
Un
it
Activated Carbon (G/L glycerol)
0
20
40
60
80
100
40 50 65 100 200
Gly
cero
l Co
nte
nt
(Wt.
%)
Activated Carbon (G/L glycerol)

58
As can be seen from fig. 4.5 there was no change in glycerin level as the activated
carbon is varied. This could be because glycerin has larger molecular size than the pores of
activated carbon.
Fig. 4.6 Effect of Activated carbon on Ash Content (Manosak et al. 2011)
The varying of activated carbon had some slight effect on the reduction of ash content
in refined glycerin as can be seen from fig. 4.6. There is a reduction from 3.8 units to 2.0 units.
4.2.2 Mass Balance on Glycerin Vacuum Distillation
Three different vacuum distillation results were examined to determine the average
balance in typical refining operation. Table 4.2 and 4.3 shows the original sample used for the
experiment and results obtained from the operations respectively. The temperature of the
0
1
2
3
4
5
40 50 65 100 200
Ash
Co
nte
nt
(wt.
%)
Activated Carbon (G/L glycerol)

59
three operations is between 120 0C to 126 0C for top and bottom 165 0C to 190 0C and the
pressure is between 1.5 x 10⁻¹ mbar to 4.0 x 10⁻¹ mbar.
From the mass balance, 41.8% is the amount of possible distilled glycerin that can be obtained
from an average vacuum distillation operation.
Table 4.2 Percentage Composition of Crude Glycerin (Yong et al. 2001)
Operation Parameters
N0 Glycerin Ash Water Mong PH
% % % %
1 55.7 15.3 8.4 20.7 5.4
2 47.1 19.8 11.2 21.9 7
3 48.5 16 6.1 29.4 4.6
Average 50.4 17 8.6 24
The bottom is dark brown in color and is 41.8% crude glycerin. Of this 41.8%, 17.0% is
salt, 24.0% MONG which is made up of polyglycerol, sugar, FFA, etc. This still has to undergo
processing to recover distilled glycerin and it requires additional cost. There is also a 16.5% loss
which is made up of water, acrolein, etc.
The reduction in the amount of distilled glycerin obtained could be a result of three
possibilities: (1) the formation of acrolein due to lose of water from glycerin at low pH.
(2) The formation of polyglycerol as a result of polymerization of glycerol at high pH in presence
of high temperature and excess sodium hydroxide. This becomes part of bottom product. (3)
The oxidation of glycerol to form glycerose a mixture of dihydroxyactone and glyceraldehyde.

60
To curtail glycerin loss, the formation for these components should be prevented by operating
at the right temperature, pressure and pH.
Table 4.3 Mass Balance of Vacuum Distillation (Yong et al. 2001)
Crude Glycerin Used (g)
Distilled Fraction
Average (%)
Exp. Distilled Distilled Losses
Glycerin Bottom
Distilled Glycerin 41.8 41.8 16.5
Mass (g) 92.5
Weight (%) 44.8
Appearance Clear Liquid
Distilled Bottom
1 206.3 Mass (g) 71.7
Weight (%) 34.8
Appearance Dark brown solid
Losses
Mass (g) 42.1
Weight (%) 20.4
Distilled Glycerin
Mass (g) 57.8
Weight (%) 38.4
Appearance Clear Liquid
Distilled Bottom
2 150.6 Mass (g) 74.9
Weight (%) 49.7
Appearance Dark brown solid
Losses
Mass (g) 17.9
Weight (%) 11.9
Distilled Glycerin
Mass (g) 80
Weight (%) 42.1
Appearance Clear Liquid
Distilled Bottom
3 190.2 Mass (g) 77.6
Weight (%) 40.8
Appearance Dark brown solid
Losses
Mass (g) 32.6
Weight (%) 17.1

61
4.3 Ion Exchange
Another refining method for glycerin is ion exchange. This method is simple and energy
consumption is low causing it to gain attention. The process of ion exchange is the exchange of
ions between liquid crude glycerin mixture and solid ion exchange material. This process is
reversible and there is no permanent change in the solid receiving the unwanted ion.
Commonly used ion exchange resins are made of cross-linked polymer matrix with good ion
active sites. Ion exchange beads are mostly spherically shaped. Fig. 4.7 show a spherical ion
exchange material showing a negatively charged matrix and exchangeable positive ions.
Fig. 4.7 Spherical Ion Exchange Material (Dowex: Fundamental of ion exchange, n.d.)
The exchange of an ion between a mixture of crude glycerin and ion exchange material
involves the diffusion through the film of the solution that is attached to the resins and
diffusion within the resin particles. This method is more suitable for mostly low salt crude

62
glycerin obtained from fat splitting and transesterification. It could also be used for high salt
crude glycerin but, the crude glycerin must be treated to remove the high salt. Fig. 4.8 shows a
process flow schematic of refining of crude glycerin using ion exchange.
Dilution Vessel
Neutralizing Vessel
Filter Press
Cation Bed
Anion Bed Mixed Bed
Polished Filter
Evaportor Evaporator Activated Carbon
Bottom Bottom
Crude glycerin
Demineralized Water
Activated Carbon
Ca(oH)2
Refined Glycerin
Fig. 4.8 Process Flow Schematic of Glycerin Ion Exchange Refining (Shahidi, 2005)
There are suitable ion resins in the market today for crude refining. Lewatit S100, MP64
and MP500 resins are produced by Bayer of Germany. Rohm and Haas produces Duolite C20,
Amberlite 1R120 and 1RA900 as strong cation resins, Duolite A378 and IRA93SP as weak anion

63
and the mixed bed resins C20MB and A101D as strong anion – strong cation. The crude glycerin
to be refined should be 25% to 40% concentration, filtered and passed over resin beds of strong
cation, weak anion and a mixed bed of strong cation-strong anion. This removes color, traces of
fatty acids, odor, etc.
The refined glycerin that comes out of the beds is passed through a multi effect
evaporator to remove water and then it is passed through activated carbon to remove any
traces of color. The resin beds are regenerated for subsequent operations. Viscosity is a
concern when using ion exchange for glycerin refining. This problem could be tackled by either
adjusting temperature or concentration.
To determine what temperature and concentration will be appropriate, an experiment
was conducted by Carmona et al. (2008) to determine the effect of water composition and
temperature on the removal of sodium using Amberlite 252. Table 4.4 and fig. 4.9 shows a
graph the result that was obtained at different level of water content. From table 4.4 it is seen
that maximum ion exchange ability is independent of water content. This is to say that the
concentration of water in mixture with organic solvent encourages the counter ion to the active
sites of the resin but, increase in water content reduces the selectivity of sodium ion.
Table 4.4 Equilibrium Parameter at Different Water Level (Carmona et al., 2008)

64
Fig. 4.9 Ion Exchange Isotherms of Sodium Ion on Amberlite 252 (Carmona et al., 2008)
From fig. 4.9 it is seen that increase in water has a reduction effect on the amount of
sodium ion that is attracted to the resin. However, with less water content, glycerin interaction
to the active sites of the resin is increased and this increases the selectivity of sodium. So, for
maximum sodium ion removal in glycerin refining, the concentration of glycerin should be
increased when using macroporous resin Amberlite 252.
Another experiment was conducted by Carmona et al., (2008),varying temperatures
(303k, 318k and 333k) and keeping other parameters constant. It was found that there was
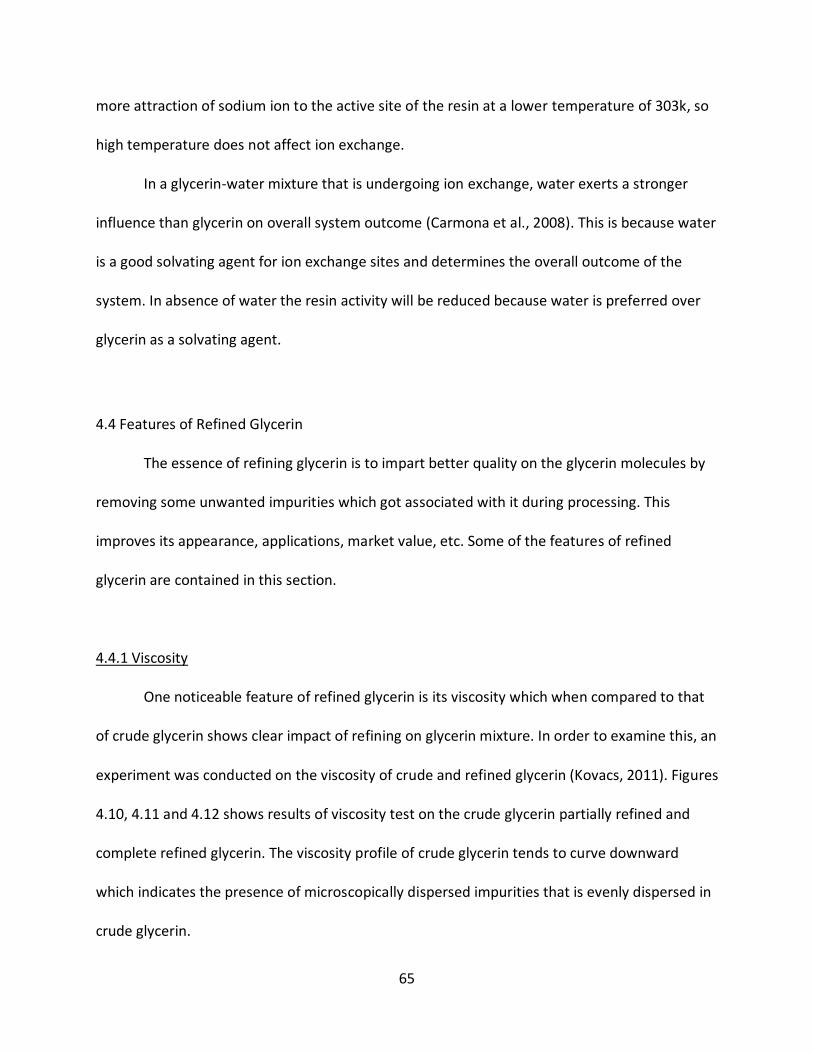
65
more attraction of sodium ion to the active site of the resin at a lower temperature of 303k, so
high temperature does not affect ion exchange.
In a glycerin-water mixture that is undergoing ion exchange, water exerts a stronger
influence than glycerin on overall system outcome (Carmona et al., 2008). This is because water
is a good solvating agent for ion exchange sites and determines the overall outcome of the
system. In absence of water the resin activity will be reduced because water is preferred over
glycerin as a solvating agent.
4.4 Features of Refined Glycerin
The essence of refining glycerin is to impart better quality on the glycerin molecules by
removing some unwanted impurities which got associated with it during processing. This
improves its appearance, applications, market value, etc. Some of the features of refined
glycerin are contained in this section.
4.4.1 Viscosity
One noticeable feature of refined glycerin is its viscosity which when compared to that
of crude glycerin shows clear impact of refining on glycerin mixture. In order to examine this, an
experiment was conducted on the viscosity of crude and refined glycerin (Kovacs, 2011). Figures
4.10, 4.11 and 4.12 shows results of viscosity test on the crude glycerin partially refined and
complete refined glycerin. The viscosity profile of crude glycerin tends to curve downward
which indicates the presence of microscopically dispersed impurities that is evenly dispersed in
crude glycerin.

66
Velocity gradient, 1/s
Fig. 4.10 viscosity Profile of Crude Glycerin (Kovacs, 2011)
The viscosity of crude glycerin is about 15 times more than that of refined glycerin even
with increase in temperature and velocity gradient (Kovacs, 2011).
The refining of crude glycerin tends to reduce high viscosity and the level of refining determines
the amount of resistance to flow that is obtained. From fig. 4.11, viscosity profile of partially
refined glycerin, the resistance to flow tends to increase at the beginning and tends to
normalize as the velocity gradient is increased. This reduction to resistance to flow results from
moving microscopic dispersed impurities thereby causing applied shear stress to meet with
lesser strain.

67
Fig. 4.11 Velocity Profile of Partially Refined Glycerin (Kovacs, 2011)
Velocity gradient, 1/s Fig. 4.12 Viscosity Profile of Refined Glycerin (Kovacs, 2011)

68
The reduction to resistance to flow is improved further by refining to approved
pharmaceutical grade this could be seen in viscosity profile of refined glycerin fig. 4.12. The
viscosity profile appears to be a horizontal straight line unlike the other previous two profiles.
This is mostly because at this stage glycerin composition is above 99.5% and impurities have
been reduced greatly, and this makes refined glycerin to flow at about 15% to 20% more than
partially refined glycerin. This makes refined glycerin to behave almost like a Newtonian fluid.
Also from Figure 4.12 it can be seen that viscosity of glycerin is a function of temperature
because as the temperature increase the resistance to flow tends to reduce.
4.4.2 Mass Spectrum
The spectrum of refined glycerin is slightly distinct from partially refined glycerin and
greatly distinct from that of crude glycerin. These distinct differences can be seen by a look at
the spectra of different grades of glycerin. Figures 4.13, 4.14 and 4.15 shows spectra of
different grades of glycerin from an experiment that was conducted by Manosak et al, (2011).
The crude glycerin that was used for this experiment was obtained from waste oil biodiesel
plant. A look at the spectrum shows glycerin at 42.879%, alcohol (methanol and isopropanol)
and fatty acids that are replica of fatty acids found in original triglyceride that was used for
biodiesel formation.

69
Fig. 4.13 Mass Spectrum of Crude Glycerin (Manosak, 2011)
A look at two partially refined glycerin shows a sharp contrast from crude glycerin and
the reason is not farfetched, it is because that its impurities have been removed by refining.
Figures 4.14 and 4.15 shows spectra of two partially refined glycerin.

70
Fig. 4.14 Mass Spectrum of Stage 1 Partial Refined Glycerin (Manosak, 2011)
Fig. 4.15 Mass Spectrum of Stage 2 Partial Refined Glycerin (Manosak, 2011)
From the spectra it is seen that there is an increase in glycerin content from 42.879% to
95.74% for 1st stage refining and to 96.11% for 2nd stage refining and a complete removal of
fatty acids expect for palmitic, oleic, stearic and two unknowns whose ratio is also reduced.

71
These leftover fatty acids and the unknowns could be the source of slight yellowish color of
incomplete refining but, with further refining the glycerin will attend standard color and
concentration.
4.4.3 Color
The color of a refined glycerin is clear water color. This is a sharp contrast from crude
glycerin which is light brown because of presence of the triglycerides color pigments. This color
can be removed completely during refining. Fig. 4.4 shows a chart to illustrate the change in
glycerin color after undergoing refining and the amount of activated carbon used during
glycerin refining.
From the chart it can be seen that there is reduction of color as the glycerin is passed
through activated carbon and there is almost complete elimination of color as activated carbon
dose is increased from 40units to 200 units.
4.4.4 Ash Content and Odor
The refining of glycerin reduces the ash content to a limited value as can be seen from
fig. 4.6 show the effect of refining on ash content at different stages. The ash content is mostly
leftover salts and inorganic components.
Refined glycerin is odorless because some of the odor causing impurities has been removed as
a result of refining.

72
4.5 Comparing Glycerin Refining Process
Vacuum distillation is the conventional way of glycerin refining but ion exchange offers
an alternative to distillation. There are some areas in which the two differ:
1) Vacuum distillation creates room for flexibility. It can be used for refining of any type of
crude glycerin. This makes it widely accepted in processing of high salt crude glycerin
which is mostly obtained from saponification reaction (soap making). The ion exchange
refining process is mostly suitable for low salt crude glycerin which is mostly obtained
from fat splitting and transesterification reaction (biodiesel production). This makes ion
exchange process selective of crude glycerin type because sodium chloride will foul the
ion exchange resins.
2) Vacuum distillation involves heating up the crude glycerin to high temperature so that
water, methanol and other lower boiling constituents of crude glycerin will evaporate. At
about 1600c glycerin will vaporize and collect in the condenser. This requires a lot of
energy. High energy use is one of the big flaws of distillation. Ion exchange on the other
hand does not require energy to operate. It operates at room temperature and increasing
the temperature has no effect on its operation. Ion exchange is seen as an alternative to
vacuum distillation in terms of cost saving.
3) The resins used in ion exchange are regenerated when is gets clogged up. The resins can
be expensive and should be handled with care. But vacuum distillation makes use of no
resins.
4) The operation of ion exchange is simple and straight forward process only requiring resin
beds and no recycling. Vacuum distillation is cumbersome, using a distillation column,

73
condenser, scavenging condenser, carbon absorber, etc. Glycerin coming out of
scavenging condenser undergoes another process steps or it is sent back to treatment
section to be processed before it is returned back for distillation. Connecting all these
process units are pipes, pumps, etc. This not so for ion exchange.
5) Operation in ion exchanger requires the reduction of the concentration of crude glycerin
to be between 25% to 40% for effective operation. The vacuum distillation operates at
any concentration. For ion exchange it will take about two times the flow rate of vacuum
distillation and this makes it time consuming.
6) There is more residue and losses in distillation but, there is minimal loss in ion exchange.
4.6 Summary
The best option to add value to crude glycerin is to refine it. This will help reduce the
stress associated with disposing crude glycerin obtained from producing biodiesel, fatty acids,
soap, etc. The demand for glycerin has been stable but, the market has witnessed oversupply
because of biodiesel production and this makes the market very volatile.
There are many applications of glycerin but, mostly these applications use technical
grade glycerin which has a concentration of 98% or more and the only way to achieve that is by
refining.
Many methods are used for the refining of crude glycerin but, vacuum distillation and
ion exchange are so far the best option. Vacuum distillation appears to be widely accepted but
the cost of operation is a huge minus and that has made ion exchange an option. Ion exchange
has its own flaws of being selective and requiring regeneration. Despite the shortcoming of

74
these processes the most important thing is that a byproduct was transformed into value
product. This will help biodiesel manufacturers who are struggling with production costs to
reduce the cost of their operation.

75
CHAPTER 5
GLYCERIN APPLICATION
5.1 Introduction
The application of glycerin is noticed in almost every aspect of life from pharmaceuticals
and foods to cosmetics and technical industries. There are about 2000 known applications of
glycerin (Glycerine and the market, n.d.). The Global Industrial Analyst Inc. (a market research
company) projected that global consumption of glycerin will reach 5.4 billion pounds by 2017
(Global glycerin market to reach 5.4b, 2012).
Glycerin is a very relevant olechemical and the abundant availability of this chemical in
crude form has attracted low price and has sparked the drive to discover more uses for it. Fig.
5.1 shows the present consumption rate of glycerin and fig. 5.2 shows what it was in 1999 and
2006. The wide applications of glycerin are due to a combination of factors like the physical and
chemical properties such as viscosity, high boiling point, hygroscopic nature, nontoxic, etc. The
compatibility of glycerin has made it a chemical of choice in many applications, in this chapter a
look at some areas of applications will help illustrate the importance of glycerin.
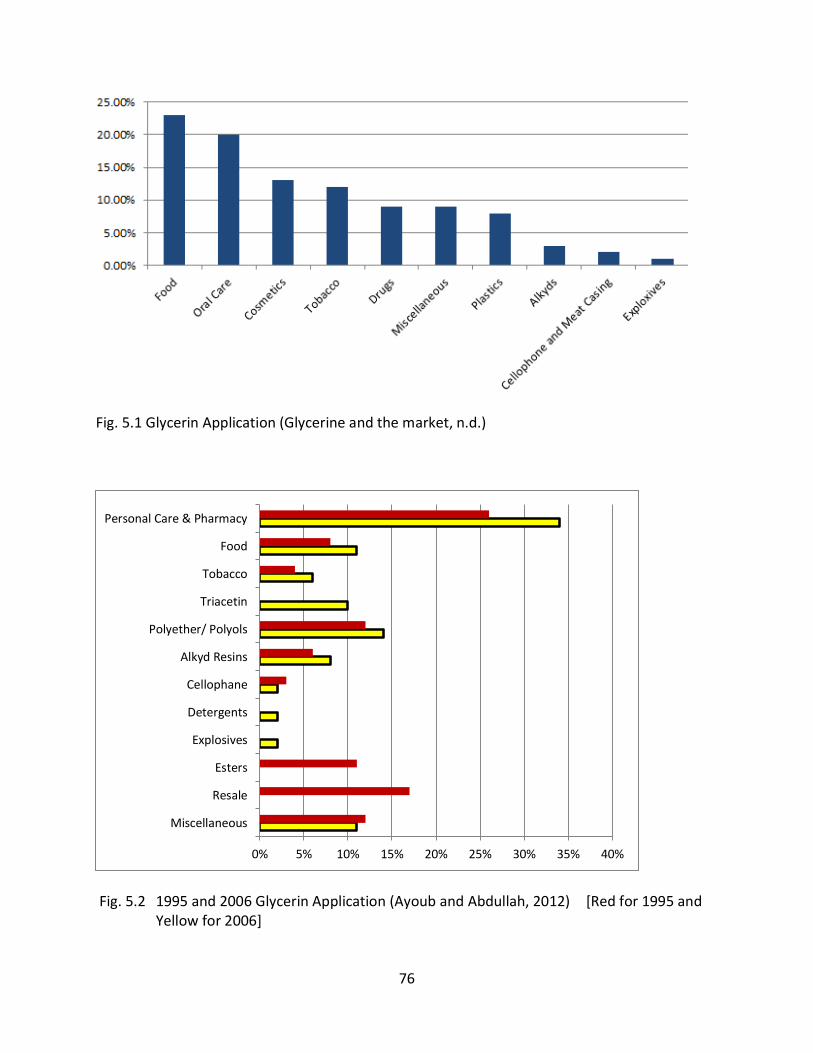
76
Fig. 5.1 Glycerin Application (Glycerine and the market, n.d.)
Fig. 5.2 1995 and 2006 Glycerin Application (Ayoub and Abdullah, 2012) [Red for 1995 and
Yellow for 2006]
0% 5% 10% 15% 20% 25% 30% 35% 40%
Miscellaneous
Resale
Esters
Explosives
Detergents
Cellophane
Alkyd Resins
Polyether/ Polyols
Triacetin
Tobacco
Food
Personal Care & Pharmacy

77
5.2 Food and Feed
Glycerin when used as food component is digested easily as a carbohydrate. It is found
as a component in foods, dessert, wine, milk, candies, gums, etc. It has a sweet taste as
mentioned earlier and used as a sugar substitute but contains no sugar. It is 60% as sweet
sucrose and a teaspoon serving contains 27 kilo calories (Refined glycerine, n.d.). One good
thing about glycerin is that it does not cause cavities, because the plaques that cause cavities
do not feed on it.
Glycerin is a source of lecithin, tocopherols, etc. and apart from being used as
carbohydrate or sweetener, it is used as a humectant, preservative, thickener, etc. It is used in
the manufacturing of polyglycerol ester for margarine production. It is also used in manufacture
of monoglycerol and diglycerol and in the manufacture of emulsifiers.
Another area of interest is using glycerin as a feed component for animals since cost of
feed is rising. Glycerin when consumed will elevate the blood glucose which causes the
secretion of insulin by the pancreas. This causes the liver to convert glucose to glycogen which
is stored and will be used by animals when need be as an energy. As a feed for animals, glycerin
is regarded as a carbohydrate but, to some experts they don’t see glycerin as carbohydrate
because it does not elevate the blood sugar or insulin as other carbohydrates. According to
FDA, glycerin is generally recognized as safe to be used as feed when used in accordance with
good manufacturing practice. The FDA regards glycerin as a carbohydrate.
In a study conducted by Iowa State University to determine if crude glycerin could be
used as supplement in feeds for broilers, laying hens and pig. They found that feeds containing
10% glycerin had little or no adverse effects on broiler body weight, amount of egg produced by

78
the hen and the weight of the pig. They also found that the amount of calorific energy value
supplied by crude glycerin equals or exceed that supplied by corn (Perry, 2007).
5.3 Pharmaceutical and Personal Care
Glycerin is used extensively in the manufacturing of drugs although in small amounts
and it is used to provide lubrication, smoothness and as humectants to improve moisture
retaining ability. In solid drugs it is used as a drug coating, it is used in laxatives, cough syrups,
expectorants, etc. Glycerin is used as a health supplement, this is because it regulates body
temperature by lowering core body temperature when hot. It delays dehydration in hot
environment by increasing the volume of blood.
In personal care products it is used in manufacturing of mouthwash, toothpaste,
creams, hair and skin care products, soap, etc. When used in these areas it used as an
emollient, solvent, lubricant, humectants, etc. Glycerin can be used in place of propylene glycol
or sorbitol.
5.4 Industrial Chemicals
The surplus availability of crude glycerin has made the conversion of crude glycerin into
any chemical of choice a common practice. Some factors considered in deciding which chemical
option are: cost of the conversion, price and demand of chemical of choice in the market.
Chemicals of options are for example propylene glycol, epichlorohydrin, propanol, isopropanol,
acrolein, acrylic acid and polyol. All have higher value than glycerin. Two chemicals will be
discussed which will likely have an impact on glycerin market.

79
5.4.1 Propylene Glycol
Propylene glycol is an organic compound with molecular formula C3 H8 O2, it is also
called propane-1,2-diol or 1,2-propanediol. At standard temperature and pressure it is
colorless, has a slightly sweet taste, almost odorless, hygroscopic and miscible with water and
acetone. It has wide range of uses from food, personal care, cooling to de-icing. Fig. 5.3 shows
molecular structure of propylene glycol.
Fig. 5.3 Molecular Structure of Propylene Glycol
Propylene glycol has a current worldwide output of about 1.5 million ton per annum
(Lawrence, n.d.) and has a market price of between $0.44 to $1.00 per pound (Johnson and
Taconi, 2007). The conventional production of propylene glycol is through petroleum product
propylene oxide but it can be made through glycerin.
The conversion of glycerin to propylene glycol is a two-step process. The glycerin is
dehydrated to acetol by removing a water molecule. Fig. 5.4 shows glycerin conversion to
acetol. The acetol formed is reacted with hydrogen molecule to form propylene glycol. Fig. 5.5
shows formation of propylene glycol by reacting acetol and hydrogen.
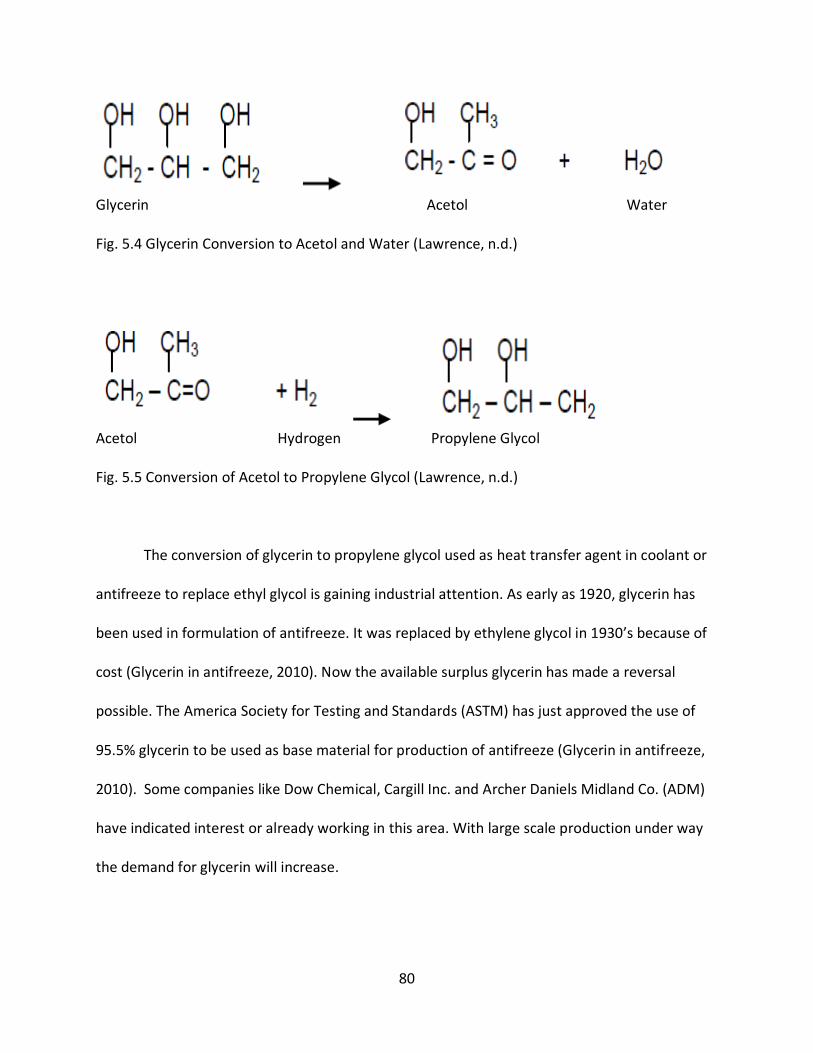
80
Glycerin Acetol Water Fig. 5.4 Glycerin Conversion to Acetol and Water (Lawrence, n.d.)
Acetol Hydrogen Propylene Glycol Fig. 5.5 Conversion of Acetol to Propylene Glycol (Lawrence, n.d.)
The conversion of glycerin to propylene glycol used as heat transfer agent in coolant or
antifreeze to replace ethyl glycol is gaining industrial attention. As early as 1920, glycerin has
been used in formulation of antifreeze. It was replaced by ethylene glycol in 1930’s because of
cost (Glycerin in antifreeze, 2010). Now the available surplus glycerin has made a reversal
possible. The America Society for Testing and Standards (ASTM) has just approved the use of
95.5% glycerin to be used as base material for production of antifreeze (Glycerin in antifreeze,
2010). Some companies like Dow Chemical, Cargill Inc. and Archer Daniels Midland Co. (ADM)
have indicated interest or already working in this area. With large scale production under way
the demand for glycerin will increase.

81
5.4.2 Epichlorohydrin
Epichlorohydrin is an organochlorine compound with pungent odor, is colorless and is
slightly soluble in water. It is used in the manufacture of epoxy glues, plastics and resins. The
conventional production method is through propylene a product of petroleum. Because of the
high cost of petroleum products, low selectivity and toxic effects alternative production method
are needed.
The synthesis of epichlorohydrin from glycerin is of interest to market and industrial
watchers because of the new availability of glycerin. One method of production is by
hydrochlorination.
Hydrochlorination of glycerin yields mixture of two components: 1,2-dichlorohydrin and
1,3-dichlorohydrin, fig. 5.6 illustrate that. This mixture is then dehydrochlorinated to
epichlorohydrin.
Fig. 5.6 Hydrochlorination of Glycerin (Dimitiev, 2011)

82
The epoxy resins produced from epichlorohydrin are used in corrosion protective
coating, the reinforcement of paper and water purification. Its demand is growing in China at a
rate of about 20% per year.
5.5 Summary
Only a very few applications of glycerin are mentioned here but, there about 2000. In
this chapter, specific applications where mentioned because of its relevance in the glycerin
industries or its potential in the future to be of great importance. Many more applications are
being developed and many patents are being sought all because of the availability of surplus
crude glycerin made possible by biodiesel manufacturing and the nontoxic nature of glycerin.

83
CHAPTER 6
GLYCERIN MARKET AND ECONOMICS 6.1 Introduction
The entrance of the biodiesel produced glycerin was devastating to a once rosy glycerin
market. The biodiesel 2012 output was 1.1 billion gallons above U. S. Environmental Protection
Agency (EPA) estimated 800 million gallon target needed under the EPA’s renewable fuel
Standard (RFS) (U.S. biodiesel production, 2012). This output also generated glycerin as co-
product at about 110 million gallons since 10% glycerin is produced for all biodiesel produced
(Johnson and Taconi, 2007). This output impacts mostly the crude glycerin market which is very
volatile but, the refined glycerin has been holding steady at about 64 cents to 71 cents per
pound (Taylor, 2012).
The U.S. is not the only country with a large volume of glycerin. The European Union
(EU) policy makers are working to make Europe independent of foreign oil and to that effect
have produced large volumes of glycerin as well with Germany leading the way. There is a
policy mandate that by 2010, 5.75% of energy should be from renewable energy (Glycerin
market analysis, 2012). The Asia pacific market is manifested with Japan, an old player in the
glycerin market, with China and India coming on board, Malaysia and Indonesia showing strong
presence with surplus palm oil glycerin.
It is important to point out that a glycerin market without profit will mean tight spot for

84
other co-products like biodiesel that is struggling to make its stand. In economics, demand and
supply have to be balanced for a robust market to exist. But, the volume of biodiesel produced
has changed the market dynamics and has tilted the balance to demand as the determinant of
the market. The only option left is to diversify the glycerin demand more to make the market
forces balance.
In this chapter the glycerin market and economics will be discussed, future projection
will be made and suggestion will be proposed for a way forward. To do this first; glycerin
output, supply, demand, import and export will be considered.
6.2 Glycerin Output
There are four main methods through which glycerin is obtained and these are:
biodiesel production, fat splitting, soap production and fatty alcohol production. Prior to early
1990’s the traditional way of obtaining glycerin is through soap production and that explain
why most of glycerin refining plants are owned by big time soap manufacturer like Proctor and
Gamble, Colgate-Palmolive, Lever Brothers, Dial, etc.
The glycerin supply is determined based on the demand of soap because glycerin is a
byproduct of soap production. This created limited stock and there was high demand and that
made glycerin price to be high and reached about $1.00 per pound for refined glycerin. Fig. 6.1
shows refined glycerin prices from January 1980 to January 2006. But, in late 1990’s the major
glycerin producing source shifted to fat splitting and lots of glycerin was available which started
downward trend of glycerin price but that finally stabilized. Fig. 6.2 shows the rate of glycerin

85
output from different sources.
Fig. 6.1, Refined Glycerin Price (Glycerin market analysis, 2012)
Fig. 6.2 Rate of Glycerin Output from Different Sources (Ayoub and Abdullah, 2012)
0% 10% 20% 30% 40% 50% 60% 70%
others
Synthetic
Fatty Alcohol
Soap
Fatty Acid
Biodiesel
2009
1999

86
Again in the mid 1990’s biodiesel started contributing to glycerin output and in 2006
became a major source and now it contributes to about 64% of global glycerin stock.
With the quest for renewable energy and the desire to shift dependence on Middle East
countries for energy, biodiesel will remain major contributor to glycerin stock. The only way to
take care of surplus stock is to diversify more the application of glycerin in order to keep a
modest market.
Fig. 6.3 shows United States biodiesel production from 1999 to 2012. The glycerin
output is estimated based on rate in fig. 6.2 and the data in fig. 6.3.
Fig. 6.3 U.S. Biodiesel Production (U.S. biodiesel production, 2012)

87
From the chart above U.S. biodiesel was low until 2004 when it started to pick up. With
some fluctuations the total output as of 2012 is 1100 million gallons. Table 6.1 shows world
glycerin output from different sources.
Table 6.1 World Glycerin Output (x103 metric tons/year) (Ayoub and Abdullah, 2012)
SOURCES YEAR
1992 1995 1999 2003 2005 2006 2008 2010
Biodiesel 0 42 42 167 375 521 1125 1583
Fatty Acid 271 292 313 333 396 438 479 521
Soap 208 208 198 188 167 146 125 83
Fatty Alcohol 83 104 125 104 125 167 250 250
Synthetic 83 83 63 63 21 0 0 0
Others 0 0 42 63 42 0 21 21
Total Production 645 729 783 918 1126 1272 2000 2458
6.3 Glycerin Market
The market is a very important aspect of glycerin industry and it is one of the major
determining factors of glycerin future. There are two types of market for glycerin; refined which
is about 99.7% pure and crude which is about 80% pure. There are also two types of prices
contract price for advance sale and spot price for instant price. Like mentioned earlier the
refined price does have some fluctuation but, it looks strong with price range of about 64 cents
to 71 cents per pound for contract sale (Taylor, 2012). The crude price has experienced a
downward trend and is at about 9 cents to 12 cents per pounds for spot price (Taylor, 2012).
This is better than previous price of almost 5 cents per pound in 2006 (Nilles, 2006). In Europe
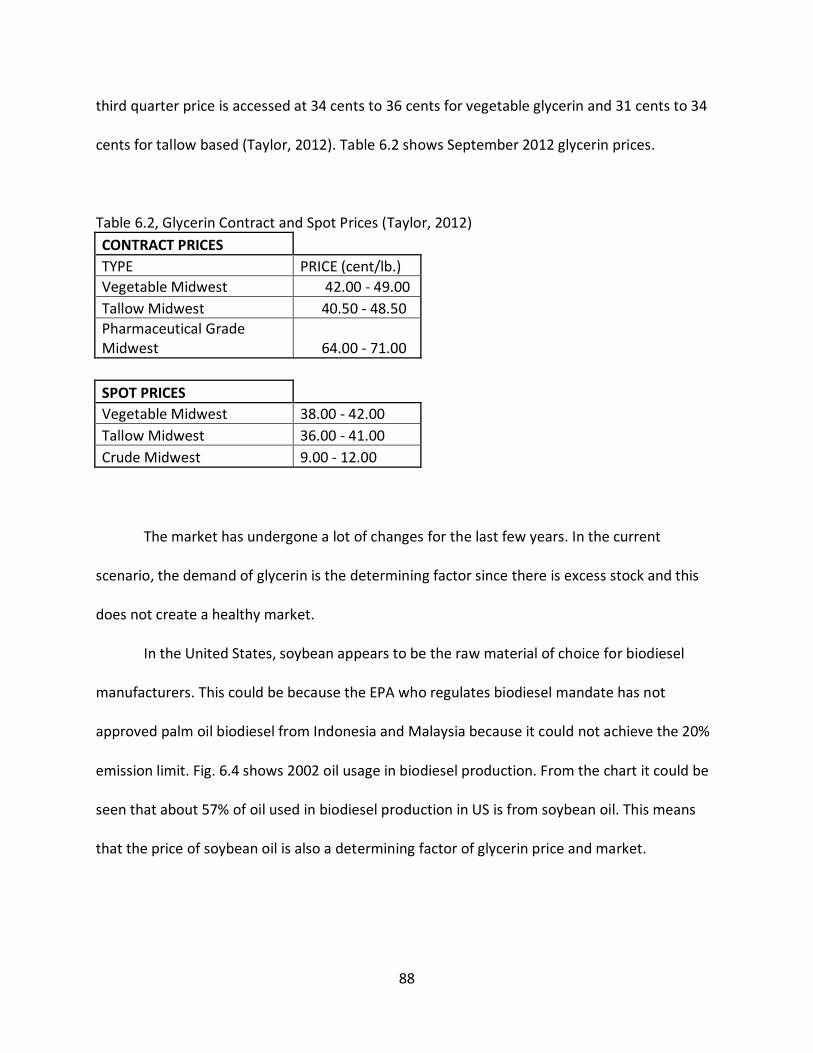
88
third quarter price is accessed at 34 cents to 36 cents for vegetable glycerin and 31 cents to 34
cents for tallow based (Taylor, 2012). Table 6.2 shows September 2012 glycerin prices.
Table 6.2, Glycerin Contract and Spot Prices (Taylor, 2012)
CONTRACT PRICES TYPE PRICE (cent/lb.)
Vegetable Midwest 42.00 - 49.00
Tallow Midwest 40.50 - 48.50
Pharmaceutical Grade Midwest 64.00 - 71.00
SPOT PRICES Vegetable Midwest 38.00 - 42.00
Tallow Midwest 36.00 - 41.00
Crude Midwest 9.00 - 12.00
The market has undergone a lot of changes for the last few years. In the current
scenario, the demand of glycerin is the determining factor since there is excess stock and this
does not create a healthy market.
In the United States, soybean appears to be the raw material of choice for biodiesel
manufacturers. This could be because the EPA who regulates biodiesel mandate has not
approved palm oil biodiesel from Indonesia and Malaysia because it could not achieve the 20%
emission limit. Fig. 6.4 shows 2002 oil usage in biodiesel production. From the chart it could be
seen that about 57% of oil used in biodiesel production in US is from soybean oil. This means
that the price of soybean oil is also a determining factor of glycerin price and market.

89
Fig. 6.4, Biodiesel Oil Usage (Kleber, 2004)
A look at the global scene shows that there are three major players in this biodiesel
drive which subsequently drives up the glycerin output. These three players are U.S., European
Union and Asia Pacific with European Union (E.U.) leading partly because of a mandate on bio-
fuels. The E.U. provides incentives to biodiesel manufacturers for use of rapeseed oil and this
has given rise to increase in glycerin production. Fig. 6.5 shows two major players in refined
glycerin production; Germany and Italy and the rest of EU. Notice their production has hovered
around 200 million lbs. / year.

90
Fig. 6.5 European Union Refined Glycerin Production (Glycerin market analysis, 2012)
Asia Pacific is another area of interest in glycerin production. China which is a promising
market with an expected economic growth of about 7.5% (Ching, 2013), is estimated to have
glycerin stock of about 210,000 tons as of 2012 (Glycerin market review 2011, 2012). Most of
this will be used in epichlorohydrin and propylene glycol production. There are other important
players such as Indonesia, Malaysia and Japan.
The import and export of glycerin is another source of glycerin stock in US, fig. 6.6 shows
an import and export chart of refined glycerin and fig. 6.7 is an import and export chart for
crude glycerin. From fig. 6.6, it shows that there is a lot of import of refined glycerin into US
while the exports appear to holding steady. The import of refined glycerin is steadily increasing,
the highest amount was experienced in 2012 at about 124, 000 metric tons/ year this might be
due to new application for glycerin as base chemicals. The export appears to hold steady at
about 20, 000 tons/year.

91
Fig. 6.6 Refined Glycerin Import and Export (Units: Tons/year) Source: USCBFTD
Fig. 6.7 Crude Glycerin Import and Export (Units: Tons/year) Source: USCBFTD
0 20000 40000 60000 80000 100000 120000 140000
2006
2007
2008
2009
2010
2011
2012
Import
Export
0 10000 20000 30000 40000 50000 60000 70000
2006
2007
2008
2009
2010
2011
2012
Import
Export

92
This overall refined glycerin import shows that there is not enough glycerin refining
capacity in U.S. to meet up with demand. From fig. 6.7 the activity in crude sector appears to be
the opposite of the refined glycerin. It was on the low side since there is not enough refining
capacity and the use of glycerin for technical purpose is more when it is refined to at least
technical grade.
6.4 Glycerin Economics
The demand for glycerin has always been strong and in spite of the surplus stock it can
be made even stronger because new needs as base chemical for other chemicals. Effort to
strengthen the glycerin market should start from conception (the formulation of raw materials),
because when defective raw materials are used it goes a long way in affecting its market since
more will be spent on refining it. This is why this thesis started from fats and oils formation.
Glycerin is a product that has come to stay and will not go out even if any of its co-product
leave the market. Sustaining a good price will go a long way boosting other industries like
biodiesel which is struggling to gain a foothold. In this section factors behind glycerin market
will be examined and its effect on other industries mostly biodiesel will be discussed.
6.4.1 Factors Behind the Market and How to Strengthen the Market
Demand of glycerin is one factor that is driving the market. The demand for refined
glycerin is holding strong while the demand for crude is going down. In this period of surplus
crude glycerin, operators will look for cheap stock and this goes a long way in slowing the
market activity. To encourage more demand, new applications using crude glycerin should be

93
sought. An increase in the refining capacity of glycerin, good raw materials and good
manufacturing standards should be adopted to avoid contamination of the end product which
goes a long way to affecting refining cost.
The refining cost for a biodiesel derived glycerin from Lurgi 2002 data is $366/metric ton
for a 10MMgal refining plant (Kleber, 2004). If the refined glycerin price is 64cents/lb., this will
give a sale price $1408/metric ton. This will give a net profit of $1042 which could be used to
subsidize the biodiesel cost of production. The refining cost is even cheaper for 20MMgal-
$269.5/ metric tons and for 30MMgal -$225.1/metric ton (Kleber, 2004).
The cost of raw material also plays a vital role. From fig. 6.4 above, the raw material of
choice by biodiesel producers is soybean at 8.7million metric tons per year. It far out ways
other raw materials this could be because of its cost and its availability. The use of edible raw
material like soybeans will be a problem in the future if nothing is done now to check it. The
demand by food industries will adversely affect the cost of glycerin and biodiesel and other
industries that are using oil base raw material.
Biodiesel production as can be seen from fig. 6.2 contributes about 64% total of global
glycerin stock and it is the major reason of fluctuating glycerin prices. This trend will not change
as biodiesel outlook appears to be strong. The only way out of this will be biodiesel operators
installing a refining plant like most major soap producers do, this will help upgrade crude stock
and it will be an added value to them.
The cost of other glycerin substitute like sorbitol, propylene glycol, etc., is another factor
affecting glycerin market. When these substitutes are cheap it will reduce the demand for
glycerin. But, when glycerin is cheap like now, it will tap into some of these substitute markets,

94
for example the use of glycerin in place of propylene glycol. The use of propylene glycol has a
very wide range such as personal care, polyester resins, food, functional fluid, etc. With
propylene glycol at a 943 million pound demand, glycerin could tap into this area making good
the glycerin market.
The cost of petroleum will also affect the glycerin market because lower petroleum
price will make raw material propylene oxide cheaper and this will encourage production of
synthetic glycerin.
6.4.2 Projections
As mentioned earlier, despite the dwindling price of crude glycerin the prospect of
better glycerin market is clear. New glycerin applications have left the research stage and it is
now in implementation stage. Based on four particularly promising signs, a better and healthier
glycerin industry is projected.
6.4.2.1 New Glycerin Applications
The conversion of glycerin into other chemicals creates a very promising future for
glycerin. Glycerin could be converted through oxidation or reduction into any other chemicals
or in combination with other chemicals to attend the industry’s needs. The uses of glycerin as
base chemical have being made possible because of its cost and availability. In doing this
conversion, the chemical to which glycerin is converted to should have a large market and cost
more to accommodate the cost of conversion and profit. Table 6.3 shows chemicals with
possible glycerin base. Their prices are better than glycerin and also have large market. Of

95
these chemicals, the malonic acid has a good price but the market is small and investing in its
conversion will be unprofitable for now.
Table 6.3 Chemicals with Possible Glycerin Base (Johnson and Taconi, 2007)
Type Price ($/lbs) US Capacity (MMlbs)
Propylene Glycol 0.44 - 1.00 1410
Propionic acid 0.46 -0.62 440
Propanol 0.52 260
Isopropanol 0.28 - 0.49 1965
Ally Alcohol 1.00 60
Acrylic Acid 0.45 -1.01 2880
Acrolein 0.64 more than 250
Malonic Acid 14 less than 1
Propylene glycol has attracted a lot of interest. Some companies have indicated interest
or are already working in this area of converting glycerin to propylene glycol because of its
promising outcome. These companies include: Senergy which announced in 2007 that it will
start the production of propylene glycol from glycerin by setting up a plant in southeast US with
production capacity of 65 million lbs./year (Johnson and Taconi, 2007), Archer Daniels Midland
(ADM), Cargill, Huntsman, Dow Chemical, etc. The reason these companies are investing in it, is
the high cost of petroleum based raw material propylene oxide compared to glycerin.
6.4.2.2 Growth in Asia Pacific
The growth in population in Asia is pulling with it the economic weight, with Asia having
a population of 4.3 billion. This is more than half of world’s population of about 7 billion people

96
and their affect is felt in world economy. China with its population of about 1.34 billion is
contributing greatly to this Asian effect, its economy is growing at the rate of about 7.5%
(Ching, 2013). The rate of increase in China glycerin demand can be seen in fig. 6.8.
Fig. 6.8 China Glycerin Demand (Bogaart, 2009)
From fig. 6.8 the sharp increase in demand from 120 kilo tons in 2006 to 500 kilo tons in
2009 shows the strength of China’s glycerin market. In China glycerin is mostly used in the
manufacturing of drugs and other pharmaceutical related activities. It is also used as a chemical
base for manufacturing of other chemicals.
Another area generating a lot of interest is the Epichlorohydrin market. It is estimated
by Markets and Markets a global market research company based in U.S. to be growing at a
compound annual growth rate (CAGR) of 4.8% and is estimated to hit 1,926 metric kilo tons by
0
100
200
300
400
500
600
2004 2005 2006 2007 2008 2009 2010
Kto
ns
year

97
2017 (ECH market growing with CAGR of 4.8%, 2013). The international chemical company
Solvay’s Thailand epichlorohydrin plant is expected to start by the beginning of 2013 and it will
source its glycerin raw material from China. This same company in April 2007 setup an
epichlorohydrin pilot plant in Tavaux, France and glycerin from rapeseed is used for the
process.
6.4.2.3 Increase in Glycerin Refining Capacity
An increase in the refining capacity by biodiesel manufacturer will help ease the volatile
crude glycerin market. Most new application of glycerin requires a technical grade glycerin as a
base chemical. In 2012 a grain company Owenboro Grain Company announced it will setup 40
million pounds per year glycerin refinery. Prior to this other companies like Purada, Cargill, etc
have already setup glycerin plant or in process of setting up new ones. The outcome of new
glycerin refinery is to improve on the glycerin quality so that it will attract better pricing, like
illustrated earlier glycerin refining could attract profit of about $1042 per ton of refined glycerin
6.4.2.4 Shale Gas Discovery
Fracking which is repositioning the natural gas industries have given access to deposits
of shale gases. To that effect natural gas production has increased by 18% from 2005 to 2011.
The production of shale gas will increase from 2.23 trillion cubic ft. /year in 2009 to 12.25
trillion cubic ft. /year in 2035. The price of natural gas went down from $13.00 MMBtu to $3.00
MMBtu (Minnesota Roadmap, 2012).

98
It is generally accepted that shale gas discovery will have impact on biodiesel and other
renewable energy and to what extent is what is not fully known for now. One possibility is that
shale gas will suppress the use of renewable energy including biodiesel. Another possibility is
that shale gas will not have an impact on biodiesel use because the method of application for
each energy source is different.
According to an MIT study it is understood that with a renewable energy having 25%
mandate, renewable energy use will not go beyond that 25% mandate (Lacey, 2012). A
mandate is a government order that a certain amount of a product, in this case energy, be used
for a certain period of time, this is used to encourage the product.
To that effect let us assume a 50% reduction in biodiesel production and use, which will mean a
corresponding 50% reduction in glycerin production from biodiesel production. This will create
about 32% reduction in glycerin overall stock which will drive the market upward.
In another scenario, some industrial and market watchers are of the opinion that shale
gas will not affect biodiesel production. This is because there methods of application are
different for both energy sources. Which side is right cannot be determined now and both
possibilities must be accounted for in a projection. It is important to mention at this point that
all these projections are all estimates. On the other hand the shale gas discovery will not affect
the glycerin market negatively unlike in a scenario where crude oil is discovered which will
mean abundance of raw material propylene oxide for synthetic glycerin.

99
6.4.2.5 Projections Effects on the Market
The factors mentioned above; new glycerin applications, growth in Asia pacific, increase
in glycerin refining, shale gas, and increase in biodiesel glycerin are the major factors that will
be having an impact on glycerin market. These are not the only factors that can influence the
market, there are other possibilities but, this thesis will be limited to these factors. Fig. 6.9
below shows factors acting on glycerin market.
The new glycerin applications with an average of about 122 million gallons for the next
five years coming from Epichlorohydrin and Propylene glycol, growth in Asia Pacific with China
buying about 9% US glycerin, building of new glycerin refineries and shale gas will be pushing
the glycerin market upwards. While the increase in biodiesel production with its corresponding
increases in glycerin output will be pushing down glycerin market. If excess biodiesel glycerin
production is suppressed by these four upward factors the glycerin market will be strong. The
bases for the projection are on the following assumptions and data:
1) Assumed 10% Biodiesel growth rate which also implies 10% biodiesel glycerin growth. The
biodiesel output in fig. 6.3 was used as basis together with the output rate in fig. 6.2 to
determine the total glycerin supply.
2) Glycerin consumption as of 2006 was 450 million pound/year (43 million gallons/year)
(Nilles, 2006) and this will be referred to as normal demand. The analysis assumes that
this is the demand basis which is added to by the following four factors:
Epichlorohydrin (ECH) is expected to increase by 27.3% (Ayoub and Abdullah, 2012).
With world demand to be 1,926 kilo tons in 2017 at expected compound annual growth

100
rate (CAGR) of 4.8% and current expected consumption is 1520 kilo tons in 2012 (ECH
market est. 1,926 ktons by 2017, n.d.).
a) Assume the US gets 30% of 1520 kilo tons (102.13 million gallon) by 2013 with
subsequent 3% yearly growth rate.
Glycerin Market
New Applications:
ECH: 3%P.G: 2%
Asia Pacific:China: 9%
New Glycerin Refineries
Shale Gas:50% Reduction in
Biodiesel Glycerin Output
Biodiesel Glycerin:With or Without Shale
Gas
Fig. 6.9 Projected Glycerin Market

101
Propylene Glycol (PG) with market of 943 million pounds per year (20 million gallon) by
2013 and assuming 18.1% are made from glycerin and with 2% subsequent growth
(Glycerin market analysis, 2012)
9% of yearly glycerin production goes to China (Ayoub and Abdullah, 2012).
Assume Shale Gas will cause a 50% reduction of biodiesel glycerin.
Table 6.4 is the U.S. projected glycerin supply while table 6.5 is the U.S. projected
glycerin demand with expected growth.
Table 6.4 U.S. Projected Glycerin Output (million gallons)
Table 6.5 US. Projected Demand (million gallons)
2013 2014 2015 2016 2017
N. Growth 43 43 43 43 43
ECH 102.13 105.2 108.4 111.7 115.1
P.G 20 20.4 20.81 21.22 21.65
China 17.01 18.72 20.61 22.68 24.93
Total 182.14 187.32 192.82 198.6 204.68

102
In table 6.4 the projection was made based on the ratio of 1 glycerin unit for every 10
units of biodiesel produced and assuming that there is no synthetic glycerin production in U.S.
within this time limit. The synthetic glycerin which is mostly preferred by drug makers stopped
being a relevant source after 2005 partly to Dow Chemical which is one of three world
manufacturer shut down its Texas plant.
The relationship between the supply (glycerin outputs) and demand can be seen below
in fig. 6.10 below.
Fig. 6.10 Relationship between Demand and Supply
0
50
100
150
200
250
300
2012 2013 2014 2015 2016 2017
Mill
ion
gal
lon
s/Ye
ar
Year
Supply
Demand

103
The implication of normal expected demand with expected growth and normal expected
supply with normal biodiesel growth shows that the market will still be unpredictable because
glycerin supply will still be more than demand. From the data above the demand and supply
appear to be close in 2013 but, the supply increased sharply while demand was almost flat. This
will mean a better glycerin market in 2013 but, an unpredictable market after wards.
In an event that shale gas reduces biodiesel production by 50% with subsequent 50%
reduction in biodiesel glycerin production. Table 6.6 and fig. 6.11 show what the expected
outcome will be. The effect of shale gas on glycerin market can be noticed by reduction in
biodiesel production which implies reduction in glycerin obtained from that process.
Table 6.6 US Projected Glycerin Output with Shale Gas Impact (million gallon/year)
SOURCES YEAR
2011 2012 2013 2014 2015 2016 2017
Biodiesel 110 110 60.5 66.5 73.2 80.5 88.5 Fatty Acid 36.09 36.09 39.7 43.6 48 53 58.1 Soap 10.31 10.31 11.3 12.5 13.7 15.1 16.6 Fatty Alcohol 13.75 13.75 15.1 16.6 18.3 20 22 Synthetic 0 0 0 0 0 0 0 Others 1.72 1.72 1.9 2.1 2.3 2.5 2.8
Total Production 172 172 128.5 141.3 155.5 171.1 188
A look at the data shows reduction in glycerin output (supply) because of shale gas
reduction of biodiesel production and biodiesel glycerin. A look at the chart shows a better
glycerin market because of less supply and more demand this will push glycerin price upward.
A look at the demand and supply relation in fig 6. 11 show more glycerin demand and

104
inadequate supply which will create a healthy market. But, in 2017 the market still good, the
supply are getting closer to demand and this means an unpredictable outcome to follow after
2017.
Fig. 6.11 U.S. Projected Demand and Supply with Shale Gas Effect
6.5 Summary
The unstable glycerin market mostly the crude glycerin does not mean it will be like that
forever. But, it is an opportunity for glycerin to be used as substitute for other chemicals with
high price. The glycerin will not go away soon it has come to stay. The initiative to build new
refineries will also improve the market because it is the crude glycerin market that is volatile
the refined market appears to be steady. When these refineries are in full stream it will reduce
0
50
100
150
200
250
2012 2013 2014 2015 2016 2017
Mill
ion
ga
llon
s/Y
ear
Year
Supply
Demand
105
the importation of refined glycerin from outside USA and create more opportunities.
The growth in Asia Pacific and with China’s influence, the need for more glycerin or its
related product will be on the rise. The shale gas discovery is also a big plus thou its affect have
not been fully understood but, in a long run it will add to the better nature of glycerin market.

106
CHAPTER 7
CONCLUSION This in depth review of glycerin from its bonding to fatty acids as triglyceride in fats and
oils to the market has shown the importance of glycerin as a product that will remain strong.
The nontoxic nature of glycerin and its ability to be transformed into different other chemicals
has made it a possible replacement for many petrochemicals.
The production processes from triglyceride stage to refined glycerin should be carried
out by good manufacturing practices so as to obtain better product at the end. Impurities affect
the quality of glycerin and it goes a long way to affecting the prices. To make glycerin affordable
means reducing its cost of production and it will be more profit oriented.
As the drive to reduce dependence on fossil fuel and as the quest to reduce greenhouse
gases continues, there will be the push to use biodiesel which in turn will result in production of
more glycerin. Glycerin prices will be strong despite large volume of glycerin stock because
more refineries will be operating and new applications will come on line. The biodiesel
operators, on the other hand will benefit from a good glycerin market because it will help offset
the cost of production and help make biodiesel affordable.
The volatile nature of glycerin has made some investors sit on the side line. In spite of
this some companies are investing on new refineries having understood the indispensable
nature of glycerin.

107
The problem that is likely to occur in the future and which requires an early search for solution
is availability of raw material. This will be felt more in the biodiesel market. The increasing cost
of vegetable oil feed stock will make biodiesel cost more, which will affect its affordability and
demand.
In conclusion the outlook for glycerin looks good although there might exist some
uncertainty now. The cheap cost of glycerin now will make it a substitute for other industrial
chemicals in the future. This will increase its demand, thereby creating a good market and in a
long run help biodiesel operators offset cost.

108
REFERENCE Dowex ion Exchange Resins: Fundamentals of Ion Exchange. (n.d.). Retrieved from:
http://msdssearch.dow.com/PublishedLiteratureDOWCOM/dh_0032/0901b803800326ca.pdf?filepath=liquidseps/pdfs/noreg/177-01837.pdf&fromPage=GetDoc
Epichlorohydrin (ECH) Market estimated 1,926 kilo tons by 2017. (n.d.). Retrieved from
http://www.marketsandmarkets.com/PressReleases/epichlorohydrin.asp Epichlorohydrin (ECH) Market is Growing with a CAGR of 4.8% and to Reach 1,926 Kilo Tons by
2017 (2013). Retrieved from: http://www.prweb.com/releases/epichlorohydrin-ech/market/prweb10511189.htm
Fatty Acid Technology. (n.d.). 1-12. Retrieved from:
http://lurgi.com/website/fileadmin/user.../1.../0274e_Fatty_Acid.pdf Glycerin Recovery. (n.d.). Retrieved from:
http://www.crowniron.com/userimages/glycerinbrochure.pdf Glycerine: An Overview. (n.d.). http://www.aciscience.org/docs/Glycerine_-_an_overview.pdf Glycerin in Antifreeze. (2010). Retrieved from:
http://www.astm.org/SNEWS/MJ_2010/d1593_mj10.html Global Glycerin Market to Reach 5.4 Billion Pounds by 2017. (2011). Retrieved from:
http://www.prweb.com/releases/glycerin_pharmaceuticals/personal_care/prweb8950181.htm
Glycerin and the Market. (n.d.) Retrieved from:
http://biofuelstechnologyllc.com/Crude_Glycerine.html Glycerin Market Analysis. (2012). Retrieved from:
http://www.biodiesel.ucsd.edu/mediagallery/download.php?mid Glycerin Market Review 2011. (2012). Retrieved from: http://www.greenchemical.jp/member/201203/eng/specialreport.pdf
109
Minnesota Road Map: Downstream Market Development-Biofuels. (2012). Retrieved from:
https://www.lifesciencealley.org/content/documents/BBAM%20Documents/MN%20BioIndustrial%20Processing%20Roadmap%20-%20FULL%20REPORT.pdf
SRS Engineering Corporation Biodiesel Technology. (n.d). Retrieved from:
http://www.srsbiodiesel.com/ExistingBiodieselPlants.aspx Refined Glycerine. (n.d.). Retrieved from:
http://food-chemicals.com/products/refined-glycerine/ U.S. Biodiesel Production. (2012). Retrieved from: http://www.biodiesel.org/production/production-statistics Soap and Detergent Manufacture. (n.d.). Retrieved from:
http://nzic.org.nz/ChemProcesses/detergents/11A.pdf Ayoub, M., & Abdullah, A. Z. (2012). Critical review on the current scenario and significance of
crude glycerol resulting from biodiesel industry towards more sustainable renewable energy industry. Renewable and Sustainable Energy Reviews, 16(5), 2671-2686. doi: http://dx.doi.org/10.1016/j.rser.2012.01.054
Bogaart, V. (2009). Glycerin Market Brief. Retrieved from:
http://www.npt.nl/cms/images/stories/Verslagen/Presentatie_Bogaart_Croda_15042010.pdf
Carmona, M., Lech, A., de Lucas, A., Pérez, A., & Rodriguez, J. F. (2009). Purification of
glycerol/water solutions from biodiesel synthesis by ion exchange: sodium and chloride removal. Part II. Journal of Chemical Technology & Biotechnology, 84(8), 1130-1135. doi: 10.1002/jctb.2144
Ching, N. (2013). Li Urges Pairing State Role to Fuel China Growth. Retrieved from:
http://www.bloomberg.com/news/2013-03-17/china-s-li-vows-to-keep-7-5-growth- and-spread-wealth-benefits.html
Dimitiev, G. S., & Zanaveskin, L. N. (2011). Synthesis of Epichlorohydrin from Glycerol. 24. doi: 10.3303/cet1124008 Efeovbokhan, V. E., Anawe, P. A. L., Adeeyo, O., & Obafunso, B. A. RECOVERY OF GLYCERINE
FROM SPENT PALM KERNEL SOAP AND PALM OIL SOAP LYE. International Journal of Engineering and Tecnology, 12(2), 11-16. Retrieved from:
http://www.ijens.org/Vol_12_I_02/122402-7171-IJET-IJENS.pdf
110
Johnson, D. T., & Taconi, K. A. (2007). The glycerin glut: Options for the value‐added conversion of crude glycerol resulting from biodiesel production. Environmental Progress, 26(4), 338-348. doi: 10.1002/ep
Kleber, M. (2004). Economics of Biodiesel plant. Retrived from: http://communitybiofuels.com/references/Lurgi%20AOCS%202004%20Presentation.pdf KOVÁCS, A. (2011). Aspects of refining biodiesel byproduct glycerin. Petroleum & Coal, 53(1),
91-97. Retrieved from: http://www.vurup.sk/volume-53-2011-issue-2 Lacey, S. (2012). What Do Falling Gas Prices Mean for Renewables. Retrieved from: http://www.renewableenergyworld.com/rea/news/article/2012/01/what-do-falling-
natural-gas-prices-mean-for-renewables
Lawrence, R. Adding Value to Glycerine. Retrieved from: http://www.davyprotech.com/pdfs/Add%20Value%20to%20Glycerine.pdf
Manosak, R., Limpattayanate, S., & Hunsom, M. (2011). Sequential-refining of crude
glycerol derived from waste used-oil methyl ester plant via a combined process of chemical and adsorption. Fuel Processing Technology, 92(1), 92-99. doi: http://dx.doi.org/10.1016/j.fuproc.2010.09.002
McFarlane, J. (2011). Processing of Soybean Oil into Fuels. Recent Trends for Enhancing the
Diversity and Quality of Soybean Products. Retrieved from: http://cdn.intechopen.com/pdfs/22611/InTechProcessing_of_soybean_oil_into_fuels.pdf
Nilles, D. (2006). Combating the Glycerin Glut. Retrieved from: http://www.biodieselmagazine.com/articles/1123/combating-the-glycerin-glut/ Perry, A. (2007). Fortifying Feed with Biodiesel Co-product. Retrieved from:
http://www.ars.usda.gov/is/pr/2007/070920.htm Rahayu, S. S., & Mindaryani, A. (2007). Optimization of Biodiesel Washing by Water
Extraction. Paper presented at the Proceedings of the World Congress on Engineering and Computer Science. Retrieved from: http://www.iaeng.org/publication/WCECS2007/WCECS2007_pp103-107.pdf
Shahidi, F. (2005). Bailey's Industrial Oil and Fat Products, 6 Volume Set (Vol. 4): Chapter.
Suwannakarn, K. (2008). Biodiesel production from high free fatty acid content feedstocks. Clemson University. Retrieved from: http://etd.lib.clemson.edu/documents/1211389077/umi-clemson-1615.pdf
Taylor, J. (2012). ICIS Pricing: 1st August 2012 Glycerine (US Gulf). Retrieved from:

111
http://www.icis.com Taylor, J. (2012). ICIS pricing: 5th September 2012 Glycerin: ICIS pricing. Van Gerpen, J. (2005). Biodiesel processing and production. Fuel Processing Technology,
86(10), 1097-1107. doi: http://dx.doi.org/10.1016/j.fuproc.2004.11.005 Van Gerpen, J., & Knothe, G. (2005). Basics of the transesterification reaction. The biodiesel
handbook, 26-41. Retrieved from: http://demec.ufmg.br/disciplinas/eng032-BL/processo_biodiesel.pdf
Van Gerpen, J., Shanks, B., Pruszko, R., Clements, D., & Knothe, G. (2004). Biodiesel Production
Technology. Retrieved from: http://www.nrel.gov/docs/fy04osti/36244.pdf Yong, K., Ooi, T., Dzulkefly, K., Wan Yunus, W., & Hazimah, A. (2001). Refining of crude
glycerine recovered from glycerol residue by simple vacuum distillation. Journal of Oil Palm Research, 13, 39-44. Retrieved from: http://palmoilis.mpob.gov.my/publications/Joprv13n2-6.pdf

112
APPENDIX A
GLYCERIN PROPERTIES
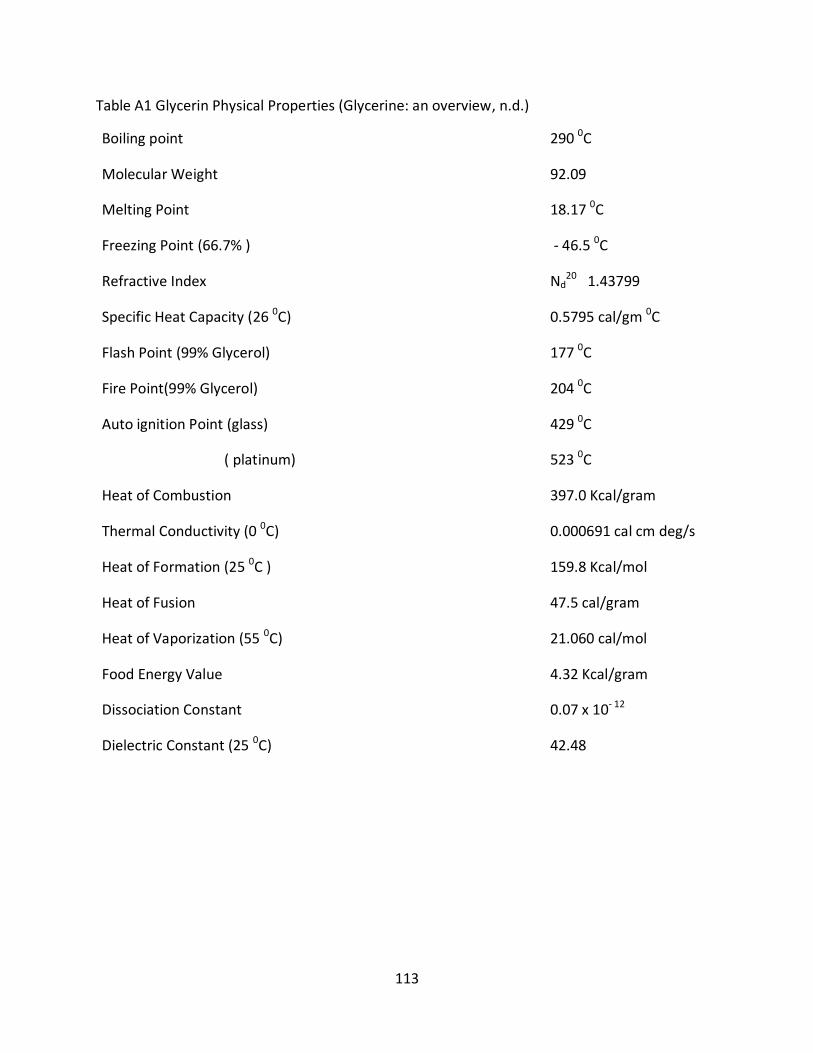
113
Table A1 Glycerin Physical Properties (Glycerine: an overview, n.d.)
Boiling point
290 0C
Molecular Weight
92.09
Melting Point
18.17 0C
Freezing Point (66.7% )
- 46.5 0C
Refractive Index
Nd20 1.43799
Specific Heat Capacity (26 0C)
0.5795 cal/gm 0C
Flash Point (99% Glycerol)
177 0C
Fire Point(99% Glycerol)
204 0C
Auto ignition Point (glass)
429 0C
( platinum)
523 0C
Heat of Combustion
397.0 Kcal/gram
Thermal Conductivity (0 0C)
0.000691 cal cm deg/s
Heat of Formation (25 0C )
159.8 Kcal/mol
Heat of Fusion
47.5 cal/gram
Heat of Vaporization (55 0C)
21.060 cal/mol
Food Energy Value
4.32 Kcal/gram
Dissociation Constant
0.07 x 10- 12
Dielectric Constant (25 0C)
42.48

114
Table A2 Glycerin Viscosity (centipoises) (Shahidi, 2005)
0C Cp 0C Cp
80 32.18 130 5.986 90 21.2 140 4.726
100 14.6 150 3.823 110 7.797 158 3.282
120 5.986 167 2.806
Table A3 Glycerin Vapor Pressure (mmHg) (Shahidi, 2005)
mmHg 0C
mmHg 0C
1 125.5 60 208
5 153.8 100 220.1 10 167.2 200 240
20 182.2 400 263 40 198 760 290

115
VITA
Valentine Chijioke Mbamalu was born in Urualla, Ideato LGA. of Imo State, Nigeria to
parents of Damian and Christiana Mbamalu. He attended Ngwa High School, Aba, Abia State,
where he obtained his secondary education and attended Institute of Management and
Technology, Enugu where he obtained a bachelor of technology degree in Chemical
Engineering. He attended University of Tennessee at Chattanooga where he obtained his
masters degree in Chemical Engineering. He has some industrial experience and his areas of
interest are in process design, control and improvement.