glyphosate (158) and metabolites … · glyphosate (158) and metabolites ... urine and faeces...
TRANSCRIPT

Glyphosate 619
GLYPHOSATE (158) AND METABOLITES
First draft prepared by C.M. Mahieu, B.C. Ossendorp, Centre for Substances and
Integrated Risk Assessment, National Institute of Public Health and the Environment, The Netherlands
EXPLANATION
Glyphosate was listed in the Periodic Re-evaluation Programme of the Thirty-fouth Session of the CCPR for residue review by 2005 JMPR. It has been reviewed by the JMPR in 1986 (TR), 1987 (R), 1988 (R), 1994 (R), 1997 (TR), 2004 (T) and 2005 (R).
For the current evaluation the Meeting received critical data required for the estimation of MRLs for lentils (dry), glyphosate tolerant sugar beet and glyphosate tolerant sweet corn (both containing the CP4-EPSPS gene), and glyphosate tolerant soya beans and glyphosate tolerant maize (both with the gat trait). CP4-EPSPS, further to be called EPSPS crops, and gat are both different genetic modifications of the crops. Glyphosate treatment blocks the aromatic biosynthetic pathway and thereby prevents the plants ability to synthesize the aromatic acids essential for protein syntheses.
In sugar beet and sweet corn crops that have been genetically modified to be tolerant to glyphosate and contain the CP4-EPSPS trait, this pathway is not blocked by glyphosate. This does not affect the route of metabolism of glyphosate as compared to the metabolic profile of conventional crops. As such, no additional metabolism data have been submitted. The Meeting received supervised residue trials on glyphosate tolerant sugar beet and sweet corn. One processing study in glyphosate tolerant sugar beet [Steinmetz, 1999, MSL 16087] was included in the 2005 JMPR evaluation report, but not in the appraisal, because a maximum residue limit was not estimated for sugar beet at that time.
The glyphosate tolerant crops with the gat trait have been inserted with a glyphosate N-acetyl-transferase gene which inactivates glyphosate by converting it to N-acetylglyphosate, making it the main metabolite in plant commodities. The Meeting received data on glyphosate metabolism in glyphosate tolerant maize and soya bean (both containing the gat trait) and on N-acetylglyphosate (main plant metabolite of glyphosate in maize and soya bean containing the gat trait) metabolism in animals, methods of residue analysis, storage stability, use patterns (USA and Canada), data from supervised residue trials and processing studies.
Additional supervised residue trials were received by the Meeting to support the estimation of an MRL for lentils (conventional).
IDENTITY
ISO common name: glyphosate
Chemical name
IUPAC: N-(phosphonomethyl)glycine
CAS: N-(phosphonomethyl)glycine
CAS Registry No: 1071-83-6
CIPAC No: 284
Structural formula:
N H P
O O H
O H O H
O
620 Glyphosate
Molecular formula: C3H8NO5P
Molecular weight: 169.1 g/mol
Physical and chemical properties
The meeting did not receive new information on the physical and chemical properties.
Formulations
Glyphosate end-use products are formulated as soluble concentrate or liquids;
SC 450 g ae/L, SL 540 g ae/L, SL 500 g ae/L and SL 600 g ae/L
FAO specifications for technical and formulated glyphosate have been published in 2000/2001; glyphosate acid technical material in 2000, 2001, glyphosate acid technical concentrate in 2000, 2001, glyphosate isopropylamine salt technical concentrate in 2000, glyphosate soluble concentrates in 2000, and glyphosate water soluble granules in 2000.
Trivial and systematic chemical names of all glyphosate related compounds referenced in the study reports submitted for the evaluation of the use of glyphosate on maize and soya bean with the gat trait are shown below. These genetically modified crops lead to a different metabolic pathway of glyphosate in plants than in conventional crops or crops genetically modified to contain the CP4-EPSPS gene making them tolerant for glyphosate. The compounds used in the additional data supporting the use of glyphosate on glyphosate tolerant sweet corn and sugar beets (EPSPS varieties) are covered in the previous JMPR evaluations.
Abbreviation Trivial and systematic chemical names
Other abbreviations used in study reports Found as or in
Gly metabolite 1/parent glyphosate N-(phosphonomethyl)glycine C3H8NO5P DPX-B2856
Rat, goat, hen
AMPA metabolite 2 AMPA (aminomethyl)phosphonic acid H2NCH2PO3H IN-YB726
Rat, goat, hen
NA-AMPA metabolite 6 N-acetyl AMPA [(acetylamonio)methyl]phosphonic acid CH3C(O)NHCH2PO3H2 IN-EY252
Rat, goat, hen
NA-Gly metabolite 9 N-acetylglyphosate N-acetyl-N-(phosphonomethyl)glycine IN-MCX20
Rat, goat, hen
METABOLISM AND ENVIRONMENTAL FATE
Glyphosate 621
Animal metabolism
The Meeting received information on the fate of orally dosed N-acetylglyphosate in laboratory animals (rats) and livestock (lactating goat and laying hens). N-acetylglyphosate is the principal metabolite of glyphosate formed in maize and soya beans containing the gat trait and as such may occur in animal feed items. The identification of metabolites was accomplished by co-chromotography with reference standards and LC-MS analysis of selected extracts to confirm the assignments made by co-chromotography. The reference standards used were N-acetylglyphosate, [14C]-N-acetyl AMPA, N-acetyl AMPA, [14C]-glyphosate, glyphosate, [14C]-AMPA and AMPA and for plant metabolism studies [14C]-N-acetylglyphosate.
The metabolism of N-acetylglyphosate in the laboratory animals (rats) was summarized and evaluated by the WHO panel of the JMPR in 2011. The metabolism in livestock is described below.
Study 1
The kinetic behaviour and the metabolism of N-acetylglyphosate (N-acetyl-N-(phosphomethyl)glycine) were investigated [Lowrie, 2007a, DuPont-19796] in a single lactating goat (British Saanen variety, body weight 30 kg). The goat was dosed (orally via gelatine capsules containing feed) with an aqueous solution of [14C]-N-acetylglyphosate twice daily for 5 consecutive days. The average dose was 263 mg N-acetylglyphosate per day and the daily food consumption was 1.3 kg. The mean dose level in feed over the entire dosing period was 205 ppm N-acetylglyphosate equivalents. Radioactivity was measured in faeces, urine, milk, cage wash and tissues sampled at different time points; urine and faeces samples were taken prior to the first dose and at 24 h intervals thereafter until the time of sacrifice and milk samples were collected pre-dose and twice daily thereafter. The goat was sacrificed approximately 12 hours after the last dose and the total radioactive residues (TRR) in bile, liver, kidney, muscle (loin and flank muscle samples were pooled) and fat (omental, renal and subcutaneous) were determined. Samples were stored at -20 °C and analysed within 2 months.
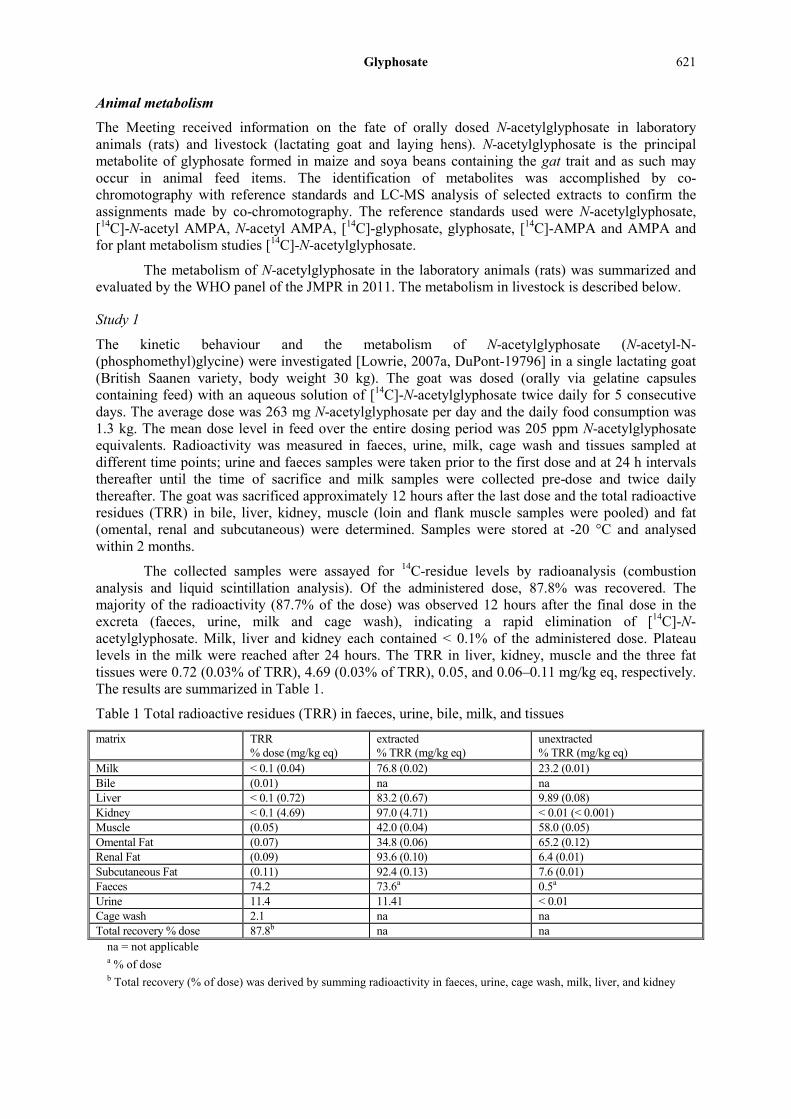
The collected samples were assayed for 14C-residue levels by radioanalysis (combustion analysis and liquid scintillation analysis). Of the administered dose, 87.8% was recovered. The majority of the radioactivity (87.7% of the dose) was observed 12 hours after the final dose in the excreta (faeces, urine, milk and cage wash), indicating a rapid elimination of [14C]-N-acetylglyphosate. Milk, liver and kidney each contained < 0.1% of the administered dose. Plateau levels in the milk were reached after 24 hours. The TRR in liver, kidney, muscle and the three fat tissues were 0.72 (0.03% of TRR), 4.69 (0.03% of TRR), 0.05, and 0.06–0.11 mg/kg eq, respectively. The results are summarized in Table 1.
Table 1 Total radioactive residues (TRR) in faeces, urine, bile, milk, and tissues
matrix TRR % dose (mg/kg eq)
extracted % TRR (mg/kg eq)
unextracted % TRR (mg/kg eq)
Milk < 0.1 (0.04) 76.8 (0.02) 23.2 (0.01) Bile (0.01) na na Liver < 0.1 (0.72) 83.2 (0.67) 9.89 (0.08) Kidney < 0.1 (4.69) 97.0 (4.71) < 0.01 (< 0.001) Muscle (0.05) 42.0 (0.04) 58.0 (0.05) Omental Fat (0.07) 34.8 (0.06) 65.2 (0.12) Renal Fat (0.09) 93.6 (0.10) 6.4 (0.01) Subcutaneous Fat (0.11) 92.4 (0.13) 7.6 (0.01) Faeces 74.2 73.6a 0.5a Urine 11.4 11.41 < 0.01 Cage wash 2.1 na na Total recovery % dose 87.8b na na
na = not applicable a % of dose b Total recovery (% of dose) was derived by summing radioactivity in faeces, urine, cage wash, milk, liver, and kidney
622 Glyphosate
Composite (day 1–5) samples of faeces, urine and milk were analysed. Composite urine was not extracted, but was centrifuged to remove particulates prior to analysis.
Milk was extracted with 0.2N hydrochloric acid followed by addition of dichloromethane to precipitate milk solids from the extract, and by further extraction with 0.2N hydrochloric acid. The aqueous extracts were combined and radioactive content determined by LSC. The extract was partitioned against hexane to remove fatty acid. The hexane fraction contained negligible radioactivity as determined by LSC analysis and as such the fat fraction was not further processed. The aqueous extract was concentrated to dryness and reconstituted in 0.1% trifluoroacetic acid:methanol (96:4, v/v) and extracted radioactive residues were determined by LSC.
Liver, kidney and muscle samples were extracted with 0.2N HCl and radioactive content was determined by LSC. The extract of muscle and kidney were partitioned against hexane to remove fatty material. The radioactive content of the hexane fraction was determined by LSC analysis and found to be negligible and as such was not processed any further. The cleaned aqueous extract was then concentrated to dryness and reconstituted in 0.1% trifluoroacetic acid:methanol (96:4, v/v) and extracted radioactive residues were determined by LSC. Subsamples of post-extraction solids (PES) were assayed by combustion followed by LSC analysis.
Omental, renal and subcutaneous fat samples were extracted with 0.2N hydrochloric acid. Dichloromethane was added to dissolve fatty material, followed by further extraction with 0.2N hydrochloric acid after centrifugation and decanting. The aqueous extracts were combined and radioactive content determined by LSC. The dichloromethane fraction and PES were placed under a flow of nitrogen to remove solvent. The aqueous extract was partitioned against hexane to remove fatty acid. The hexane fraction contained negligible radioactivity as determined by LSC analysis and as such the fat fraction was not further processed. The cleaned aqueous extract was concentrated to dryness and reconstituted in 0.1% trifluoroacetic acid:methanol (96:4, v/v) and extracted radioactive residues were determined by LSC.
TRR in PES from liver, kidney, muscle and omental fat were all in excess of 0.01 mg/kg eq and as such these residues were further characterized by enzyme hydrolysis (pepsin and protease). The PES were mixed with pepsin and 0.1N hydrochloric acid. After incubation at 37 °C the radioactive content was determined by LSC prior to and post filtration (glass fibre filter paper). The used filter paper was returned to the PES and protease enzyme was added along with phosphate buffer. After incubation at 37 °C the radioactive content of both samples was measured prior to and post filtration. Attempts were made to clean up the enzyme digest using iron loaded Chelex 100 ligand exchange resin followed by AG1X8 resin columns. The radioactive content of the column eluent for both samples was determined by LSC analysis. Recoveries were low (17–37%) making it impossible to profile the cleaned up samples.
Quantification of the metabolites was accomplished either by on-line radio detection with peak integration or by fraction collection and LSC.
N-Acetylglyphosate was found in all tissues along with low levels of glyphosate, AMPA (IN-YB726), and N-acetyl AMPA (IN-EY252). Unchanged N-acetylglyphosate was the major residue identified in liver (0.45 mg/kg), kidney (3.74 mg/kg), muscle (0.01 mg/kg), and fat samples (0.07 mg/kg). Glyphosate was identified in kidney (0.24 mg/kg), liver (0.12 mg/kg) and fat (≤ 0.01 mg/kg). AMPA was found in the liver (0.07 mg/kg) and in fat (≤ 0.01 mg/kg). N-Acetyl AMPA was identified in fat at 0.01 mg/kg. Unchanged N-acetylglyphosate (0.01 mg/kg) was the principal residue detected in whole milk. Trace levels (< 0.01 mg/kg) of glyphosate and AMPA were also detected in milk.
The relative amount of unextracted residues in milk, muscle and fat was high, 23.2, 58% and 26.4% TRR respectively. For milk the concentration was 0.006 mg/kg eq (< 0.01) so no further action was indicated. The tissue concentration in muscle was 0.050 mg/kg eq indicating a need for further characterization/identification. Further attempts of clean up however, did not result in better profiling of the samples. The tissue concentration in fat was 0.47 mg/kg glyphosate equivalents. Apparently no further attempt of clean up was performed.

Glyphosate 623
The metabolism of N-acetylglyphosate in ruminants (lactating goat) is adequately understood and is consistent with the metabolism observed in laying hens. N-Acetylglyphosate was metabolized in the goat by de-acetylation to form glyphosate. N-Acetylglyphosate and glyphosate were further metabolized to N-acetyl AMPA and AMPA, respectively. N-Acetyl AMPA may also have undergone de-acetylation to form AMPA.
There was no significant potential for transfer of residues of N-acetylglyphosate and its metabolites to fat, meat, and milk; as the administered dose was eliminated rapidly by the lactating goat primarily in the excreta including faeces, urine and cage wash (87.7% of the dose). Milk and edible tissues combined represented ca. 0.1% of the administered total dose. The results are summarized in Table 2.
Table 2 Quantitative distribution of metabolites in the edible tissues and in milk after administration of [14C]-N-acetylglyphosate to a single lactating goat
component composite milk (day 1–5)
liver kidney composite muscle composite fat
% TRR
mg/kg eq
% TRR
mg/kg eq
% TRR
mg/kg eq
% TRR mg/kg eq
% TRR
mg/kg eq
TRR (mg/kg eq) 0.027 0.804 4.85 0.086 0.144 Initial extract 76.9 0.021 83.2 0.669 97.0 4.708 42.0 0.036 73.6 0.098 AMPA (mg/kg) 3.35 0.001 8.45 0.068 - - - - 2.16 0.003 Glyphosate (mg/kg) 3.59 0.001 14.71 0.118 4.98 0.24 - - 4.57 0.007 N-acetyl AMPA (mg/kg)
- - - - - - - - 6.59 0.01
N-acetylglyphosate (mg/kg)
40.0 0.011 55.5 0.446 77.1 3.74 16.7 0.014 53.1 0.069
Minor unknowns - - 0.52a 0.004a 7.97b 0.386b 11.1c 0.009c 3.39 d 0.003 d Pepsin digest na na 6.90 0.055 4.64 0.225 < 0.01 < 0.001 28.5e 0.053e Protease digest na na < 0.01 < 0.001 < 0.01 < 0.001 < 0.01 < 0.001 < 0.01 < 0.001 Unextracted residues 23.2 0.006 9.89 0.080 < 0.01 < 0.001 58.0 0.050 26.40 0.47
na = not applicable a Single component b Up to 7 non-discreet components with no component accounting for greater than 2.13% TRR (0.103 mg/kg eq) c Up to 3 components with no component accounting for greater than 6.00% TRR (0.006 mg/kg eq). d In omental fat up to 3 components with no component accounting for greater than 0.76% TRR (< 0.001 mg/kg eq); In renal fat up to 6 components with no component accounting for greater than 49%TRR (0.003 mg/kg eq); no unknowns in subcutaneous fat. e Only determined in omental fat.
Study 2
The metabolism of N-acetylglyphosate in hens was investigated [Lowrie, 2007b, DuPont-19795]. Five laying hens (obtained from Gilchrist Poultry, Glasgow, UK) were orally dosed by capsule twice daily with [14C]-N-acetylglyphosate at an actual dose rate equivalent to 63.3 mg/kg feed/day for 7 consecutive days. The nominal daily dose level in feed was 50 ppm. Average body weights were 1.937 kg and 2.065 kg at the start and the end of the experiment (range 1.710–2.593 kg).
Excreta were collected once daily and eggs were collected twice daily during the dosing period. Eggs were separated in egg yolks and whites. The hens were sacrificed 6 hours after the last dose and the tissues liver, muscle (composite breast and thigh), and abdominal fat were collected. Samples were stored at -20 °C until analysis. All samples were extracted and initially analysed within 4 months.
The collected samples were assayed for 14C residue levels using (combustion) radioassay. A total of 90.18% of the administered dose was recovered overall. The majority of the residue, comprising 90.08% of the TRR, was recovered in the excreta (including cage wash). Liver, fat, muscle and eggs each contained ≤0.05% of the dose. Higher concentrations were found in the egg yolks than in whites. The concentration of radioactivity in the egg yolks increased steadily from
624 Glyphosate
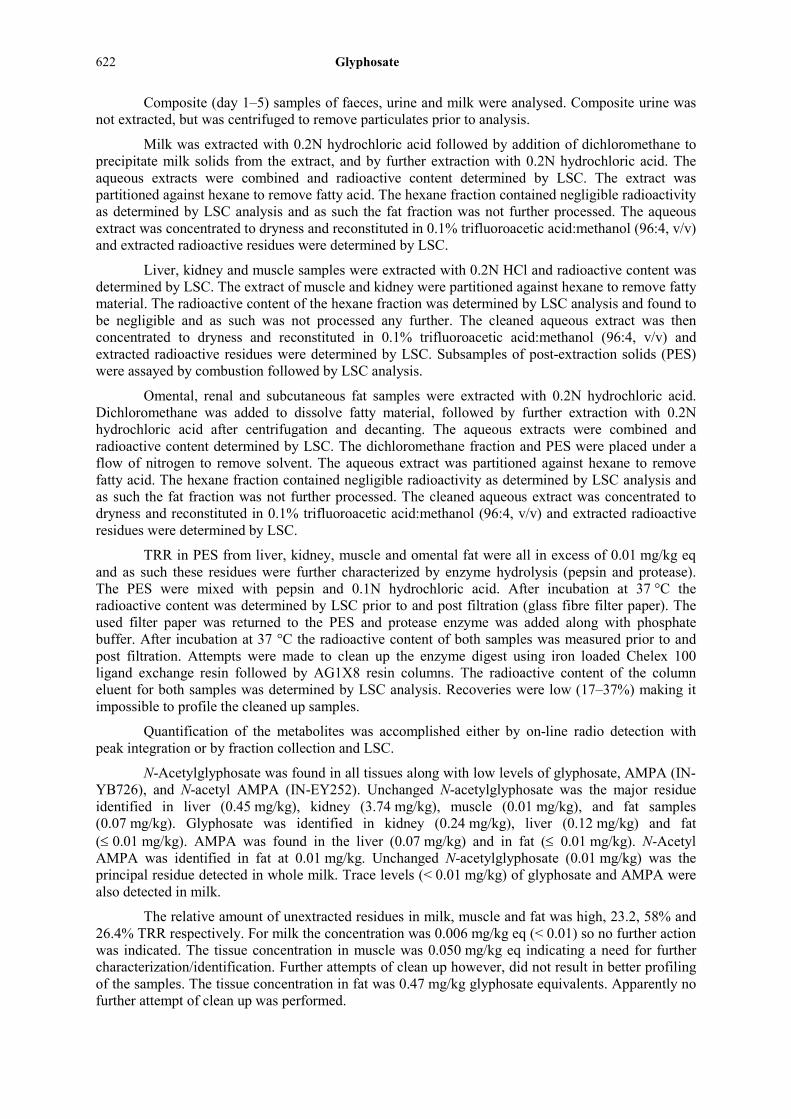
0.044 mg/kg eq after 48 hours to 0.342 mg/kg eq after 158 hours. Egg white concentrations ranged from 0.001 to 0.019 mg/kg eq. Of the total dose 0.04% was recovered in the egg yolk and 0.01% in the egg whites. TRR in liver, muscle and fat were 0.51, 0.04, and 0.05 mg/kg eq, respectively (see Table 3).
Table 3 Total radioactive residues in excreta, eggs and tissues following twice daily administration of 14C-N-acetylglyphosate
matrix TRR % dose (mg/kg eq)
extracted % TRR (mg/kg eq)
unextracted % TRR (mg/kg eq)
Egg white 0.01 (0.02) 94.3 (0.01) 5.7 (< 0.01) Egg yolk 0.04 (0.34 ) 81.5 (0.19) 18.5 (0.04)a Whole egg (0.36b) na c na Liver 0.05 (0.51) 95.6 (0.48) 4.4 (0.02)a Muscle (0.04) 87.5 (0.03) 12.5 (< 0.01) Abdominal fat (0.05) 92.4 (0.05) 7.6 <(0.01) Excreta 84.1 83.2 1.0 Cage wash 5.9 na na Total recovery (% dose) 90.2c na na na = not applicable a Egg yolk and liver PES (post extraction solids) were subjected to enzyme digestion b Levels in reconstructed whole eggs calculated by summing (proportionally) residue levels in egg whites and yolks c Total recovery was derived by summing radioactivity in excreta, cage wash, egg yolks, egg whites and liver.
Composite (day 1–7) excreta were extracted with water. Tissues (liver, muscle and fat) were extracted with 0.2N hydrochloric acid. Composite (day 1–7) egg whites were extracted with 0.2N hydrochloric acid containing a mixture of dichloromethane and chloroform. Composite (day 1–7) egg yolks were extracted with 0.2N hydrochloric acid:methanol (1:1, v/v). Approximately 81–96% TRR was extracted from eggs, tissues and excreta. The TRR remaining in the liver and egg yolk samples were subject to sequential treatment with pepsin and protease enzymes, which liberated additional radio-activity (4.1–14.7% TRR, in toto).
The HPLC profile of the excreta contained 2 radiolabelled components, which co-chromatographed with N-acetylglyphosate (82.38% of the dose) and glyphosate (0.79% of the dose).
In egg whites N-acetylglyphosate, glyphosate and N-acetyl AMPA were identified accounting for respectively 41.48% TRR (0.004 mg/kg), 10.90% TRR (0.001 mg/kg) and 4.34% TRR (< 0.001 mg/kg). Also a single minor, unknown component, which was less polar than N-acetylglyphosate, accounted for 3.40% TRR (< 0.001 mg/kg eq).
In egg yolks N-acetylglyphosate, AMPA, glyphosate and N-acetyl AMPA were identified accounting for respectively 68.40% TRR (0.157 mg/kg), 0.91% TRR (0.002 mg/kg), 5.69% TRR (0.013 mg/kg , and 1.10% TRR (0.003 mg/kg).
The highest level of total radioactive residues in reconstructed whole eggs (sum of residues in egg whites and yolks) was observed after 7 days and was 0.361 mg/kg. Concentrations of unchanged N-acetylglyphosate and the metabolites AMPA, glyphosate and N-acetyl AMPA were 0.161, 0.002, 0.014, and 0.003 mg/kg, respectively in whole eggs.
In the liver N-acetylglyphosate, AMPA, glyphosate and N-acetyl AMPA were identified accounting for respectively 63.82% TRR (0.323 mg/kg), 6.74% TRR (0.034 mg/kg), 16.34% TRR (0.084 mg/kg) and 4.04% TRR (0.020 mg/kg).
In the muscle eight radiolabelled components were detected. N-acetylglyphosate, AMPA, glyphosate and N-acetyl AMPA were identified accounting for respectively 25.22% TRR (0.009 mg/kg), 16.69% TRR (0.005 mg/kg), 7.19% TRR (0.002 mg/kg), and 1.89% TRR (0.001 mg/kg). The remaining 4 components were minor in nature with none accounting for more than 8.95% TRR (0.003 mg/kg eq).

Glyphosate 625
In abdominal fat six radiolabelled components were detected; Glyphosate (39.43% TRR or 0.023 mg/kg), AMPA (11.29% TRR or 0.007 mg/kg), N-acetyl AMPA (10.18% TRR or 0.006 mg/kg), and N-acetylglyphosate (23.45% TRR or 0.014 mg/kg). The remaining 2 components were minor in nature with none accounting for more than 0.71% TRR (< 0.001 mg/kg eq). The results are summarized in Table 4.
Table 4 Quantitative distribution of metabolites in the edible tissues and in eggs after administration of [14C]-N-acetylglyphosate to laying hens
component composite egg white (day 1–7)
composite egg yolk (day 1–7)
liver composite muscle
composite fat
% TRR
mg/kg eq
% TRR
mg/kg eq
% TRR
mg/kg eq
% TRR
mg/kg eq
% TRR
mg/kg eq
TRR (mg/kg eq) 0.010 0.229 0.505 0.033 0.057 Initial extract 94.33 0.009 81.47 0.187 95.56 0.483 87.47 0.029 92.42 0.053 Concentrated extract 94.33 0.009 80.01a 0.183 63.86b 0.322 87.47 0.029 92.42 0.053 AMPA (mg/kg) - - 0.91 0.002 6.74 0.034 16.69 0.005 11.29 0.007 Glyphosate (mg/kg) 10.90 0.001 5.69 0.013 16.34 0.084 7.19 0.002 39.43 0.023 N-Acetyl AMPA (mg/kg) 4.34 < 0.001 1.10 0.003 4.04 0.020 1.89 0.001 10.18 0.006 N-Acetylglyphosate (mg/kg)
41.48 0.004 68.40 0.157 63.82 0.323 25.22 0.009 23.45 0.014
Minor unknowns 3.40 < 0.001c - - - - 14.86d 0.006 1.37e 0.001 Pepsin digest na Na 11.61 0.027 3.81 0.019 na na na na Processed pepsin digest na Na 4.33f 0.010 0.63f 0.003 na na na na Protease digest na Na 3.10f 0.007 0.27f 0.001 na na na na Unextracted residues 5.67 0.001 3.82 0.008 0.36 0.002 12.53 0.004 7.58 0.004
- = not detected; na = not applicable a Differences during processing reflect losses (1.47% TRR) incurred during concentration and/or sample clean-up for HPLC analysis. The concentrated extract was assumed to be representative of the initial extract and metabolite concentrations were calculated as such. b Losses (31.7% TRR) during the process were attributed to the non-selective adsorption to particulate matter in the concentrated extract. Concentrated extracts were assumed to be representative of the initial extract and were calculated as such. c Single component. d Up to 4 components with no components accounting for greater than 8.95% TRR (0.003 mg/kg eq). e Up to two components with no component accounting for greater than 0.71% TRR (< 0.001 mg/kg eq). f Low levels of radioactivity in the concentrated digest precluded further characterization.
N-acetylglyphosate and its metabolites were eliminated rapidly primarily in the excreta
(90.08% of the dose including cage wash). There was not a significant transfer of residues of N-acetylglyphosate and its metabolites into fat, meat, and eggs. Eggs and edible tissues contained < 0.1% of the total administered dose.
The metabolism of N-acetylglyphosate in laying hens is adequately understood and consistent with that in ruminants (lactating goat). N-Acetylglyphosate was metabolized (de-acetylated) in the hen and goat to form glyphosate. N-Acetylglyphosate and glyphosate were metabolized to form N-acetyl AMPA and AMPA, respectively. N-acetyl AMPA may also have undergone de-acetylation to form AMPA.
The proposed metabolic pathway in livestock is proposed as shown in Figure 1.
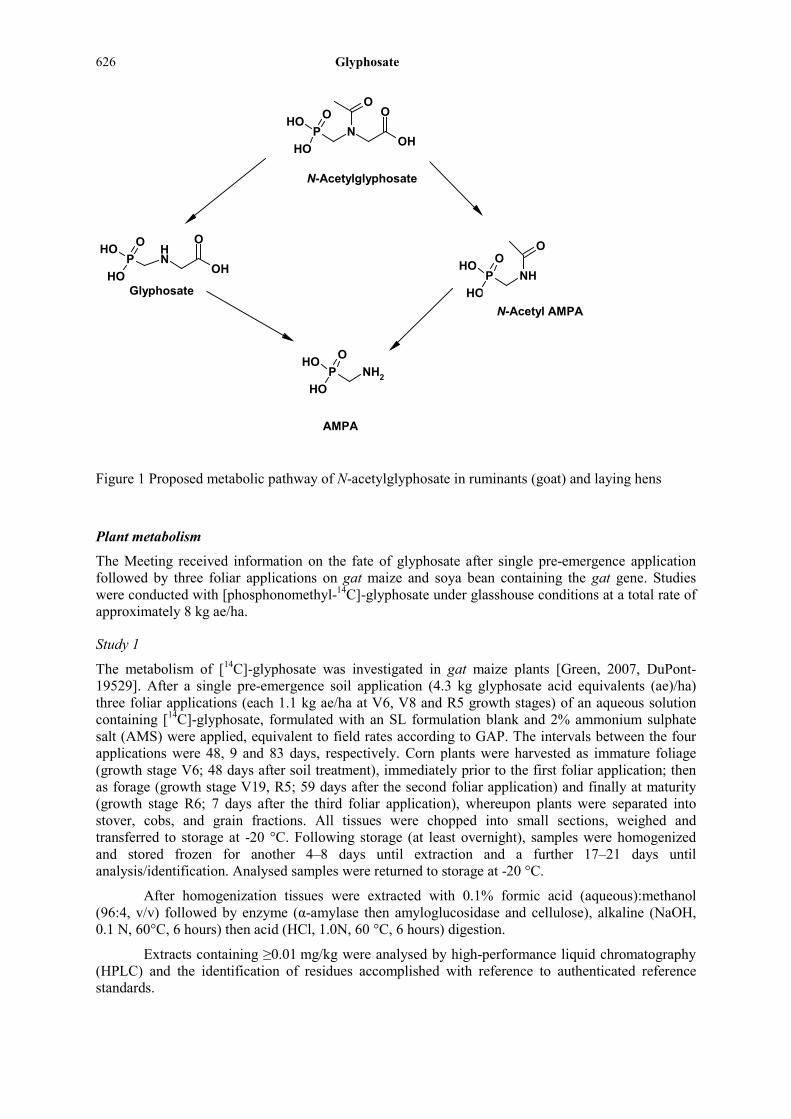
626 Glyphosate
Figure 1 Proposed metabolic pathway of N-acetylglyphosate in ruminants (goat) and laying hens
Plant metabolism
The Meeting received information on the fate of glyphosate after single pre-emergence application followed by three foliar applications on gat maize and soya bean containing the gat gene. Studies were conducted with [phosphonomethyl-14C]-glyphosate under glasshouse conditions at a total rate of approximately 8 kg ae/ha.
Study 1
The metabolism of [14C]-glyphosate was investigated in gat maize plants [Green, 2007, DuPont-19529]. After a single pre-emergence soil application (4.3 kg glyphosate acid equivalents (ae)/ha) three foliar applications (each 1.1 kg ae/ha at V6, V8 and R5 growth stages) of an aqueous solution containing [14C]-glyphosate, formulated with an SL formulation blank and 2% ammonium sulphate salt (AMS) were applied, equivalent to field rates according to GAP. The intervals between the four applications were 48, 9 and 83 days, respectively. Corn plants were harvested as immature foliage (growth stage V6; 48 days after soil treatment), immediately prior to the first foliar application; then as forage (growth stage V19, R5; 59 days after the second foliar application) and finally at maturity (growth stage R6; 7 days after the third foliar application), whereupon plants were separated into stover, cobs, and grain fractions. All tissues were chopped into small sections, weighed and transferred to storage at -20 °C. Following storage (at least overnight), samples were homogenized and stored frozen for another 4–8 days until extraction and a further 17–21 days until analysis/identification. Analysed samples were returned to storage at -20 °C.
After homogenization tissues were extracted with 0.1% formic acid (aqueous):methanol (96:4, v/v) followed by enzyme (α-amylase then amyloglucosidase and cellulose), alkaline (NaOH, 0.1 N, 60°C, 6 hours) then acid (HCl, 1.0N, 60 °C, 6 hours) digestion.
Extracts containing ≥0.01 mg/kg were analysed by high-performance liquid chromatography (HPLC) and the identification of residues accomplished with reference to authenticated reference standards.
NPOOH
OH
O
OH
O
NH
POOH
OH OH
O
NHPOOH
OH
O
NH2POOH
OH
N-Acetylglyphosate
GlyphosateN-Acetyl AMPA
AMPA

Glyphosate 627
The TRR in immature foliage (collected prior to the first foliar application) was low (0.02 mg/kg eq) indicating that low levels of radioactive soil residues were incorporated by the developing corn plants. The low levels of extractable and unextracted radioactivity in the immature foliage were not investigated further.
The TRR in forage (which had received one pre-emergent and two foliar applications) were 3.48 mg/kg eq with the majority extractable (96.4% TRR, 3.35 mg/kg eq). The major components in forage were glyphosate (58.0% TRR, 2.02 mg/kg) and N-acetylglyphosate (27.0% TRR, 0.94 mg/kg). AMPA and N-acetyl AMPA were present at 4.0% TRR (0.14 mg/kg) and 1.7% TRR (0.06 mg/kg), respectively.
At maturity, plants were separated into stover (12.24 mg/kg eq), cobs (0.69 mg/kg eq) and grain (0.28 mg/kg eq). The majority of the radioactivity was extractable (84.9–100.5% TRR) from the mature corn fractions.
The major components in stover were parent (glyphosate; 74.9% TRR, 9.17 mg/kg) and N-acetylglyphosate (17.8% TRR, 2.19 mg/kg). The metabolites AMPA and N-acetyl AMPA were also identified but at much lower levels (4.4% TRR, 0.42 mg/kg, and 1.3% TRR, 0.15 mg/kg, respectively).
The major component in cobs and in grain was N-acetylglyphosate which accounted for 63.8% TRR (0.44 mg/kg) and 51.2% TRR (0.14 mg/kg), respectively. N-Acetyl AMPA was the second most prominent metabolite, present in the cobs and grain at 5.0% TRR (0.03 mg/kg) and 9.4% TRR (0.03 mg/kg), respectively. AMPA and glyphosate were detected in grain at 6.1% TRR (0.02 mg/kg) and 0.1% TRR (< 0.01 mg/kg), respectively.
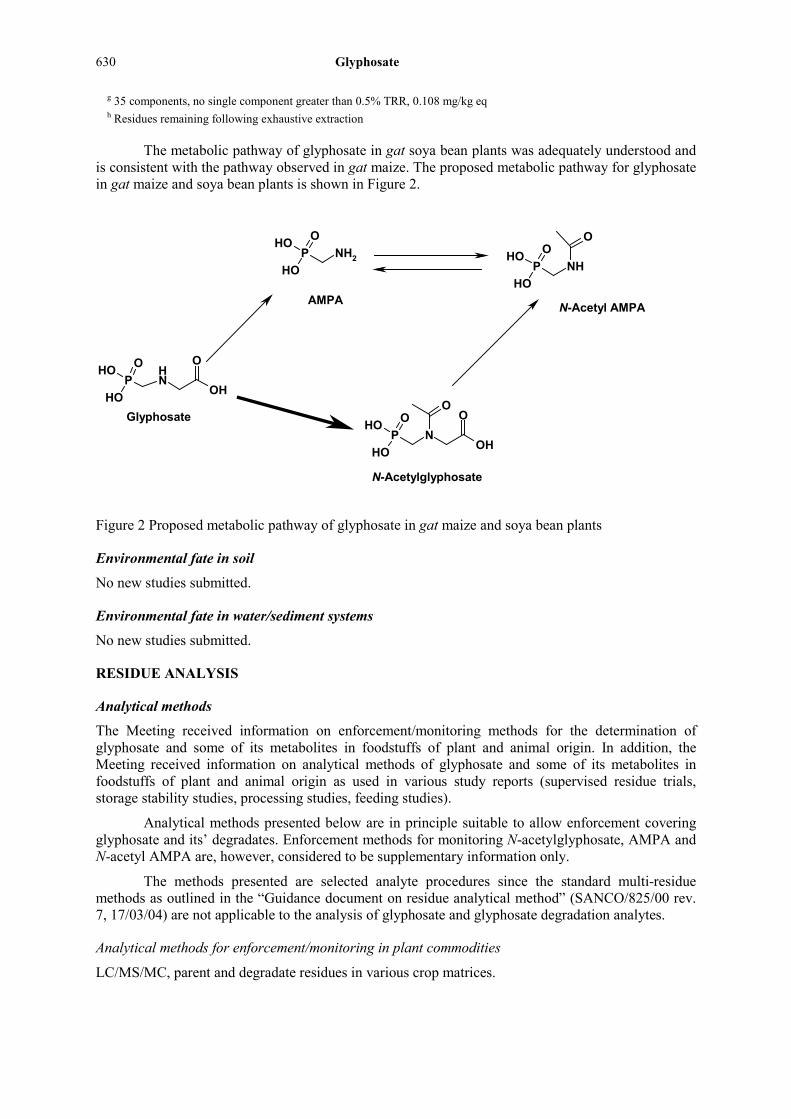
The metabolic pathway of glyphosate in gat maize plants was adequately understood and is consistent with the pathway observed in gat soya beans. The results are summarized in Table 5.
Table 5 Characterisation of radioactive residues in maize samples following a single pre-emergent soil application and three foliar applications of [14C]-glyphosate
sample forage stover cobs grain %TRR mg/kg eq %TRR mg/kg eq %TRR mg/kg eq %TRR mg/kg eq TRR (mg/kg) 3.476 12.242 0.686 0.275 Extracted 96.4 3.350 100.5 12.304 84.9 0.583 84.9 0.234 Unextracted 0.9 0.031 0.9 0.110 4.2 0.029 7.9 0.022 AMPA (mg/kg) 4.0 0.140 4.4 0.422 - - 6.1 0.016 glyphosate (mg/kg) 58.0 2.016 74.9 9.166 - - 0.1 < 0.001 N-acetyl AMPA (mg/kg)
1.7 0.060 1.3 0.152 5.0 0.034 9.4 0.026
N-acetylglyphosate (mg/kg)
27.0 0.937 17.8 2.188 63.8 0.435 51.2 0.141
Unidentified a 1.6 0.057 < 0.8 0.092 < 12.8 < 0.074 10.9 0.041 - = not detected a Comprised of one or more components individually present at < 0.02 mg/kg
Study 2
The metabolism of [14C]-glyphosate was investigated in gat soya bean plants [MacDonald, 2007, Dupont19530]. The magnitude and nature of the residues in soya bean were examined following a single pre-emergence soil application and three foliar applications of an aqueous solution containing [14C]-glyphosate formulated as an SL formulation and 2% ammonium sulphate salt (AMS). [14C]-Glyphosate was applied at a rate of 3.4 kg acid equivalents/ha to the soil, followed by three foliar applications at 1.5 kg ae/ha, 2.4 kg ae/ha and 0.9 kg ae/ha at V6, R2 and R7 (14 days prior to maturity) growth stages, respectively. The intervals between the four applications were 60, 10 and 82 days, respectively. Samples were collected 36 days after the pre-emergence soil treatment (prior to the first foliar application), 4 days after the first foliar application, at the beginning of maturity just prior to the last application and at normal harvest (14 days after the last treatment). Whole aerial portions of
628 Glyphosate
soya beans were taken at each sampling. The two pre-harvest samples were separated into foliage (with pods) and grain. The two samples taken at beginning and full maturity were separated into straw (foliage), pods, and grain. All tissues were chopped into small sections, weighed and transferred to storage at -20 °C. Following storage (2–4 days), samples were homogenized and stored for another 4–7 days after homogenization until extraction and a further 0–5 days until analysis/identification. Analysed samples were returned to storage at -20 °C.
After homogenization tissues were extracted (Extract 1) with 0.1% formic acid (aqueous):methanol (96:4, v/v). Further extraction was done by enzyme extraction with α-amylase (Extract 2) followed by incubation with amyloglucosidase and cellulose (Extract 3). The last extraction steps were alkaline extraction with 0.1N NaOH (Extract 4) followed by acid extraction with 1.0N HCl, (Extract 5). Levels of radioactivity were determined in each extract by LSC (solutions) and in post-extraction solids (PES) by oxidative combustion followed by LSC.
Extracts containing ≥0.01 mg/kg were analysed by high-performance liquid chromatography (HPLC) and the identification of residues accomplished with reference to authenticated reference standards.
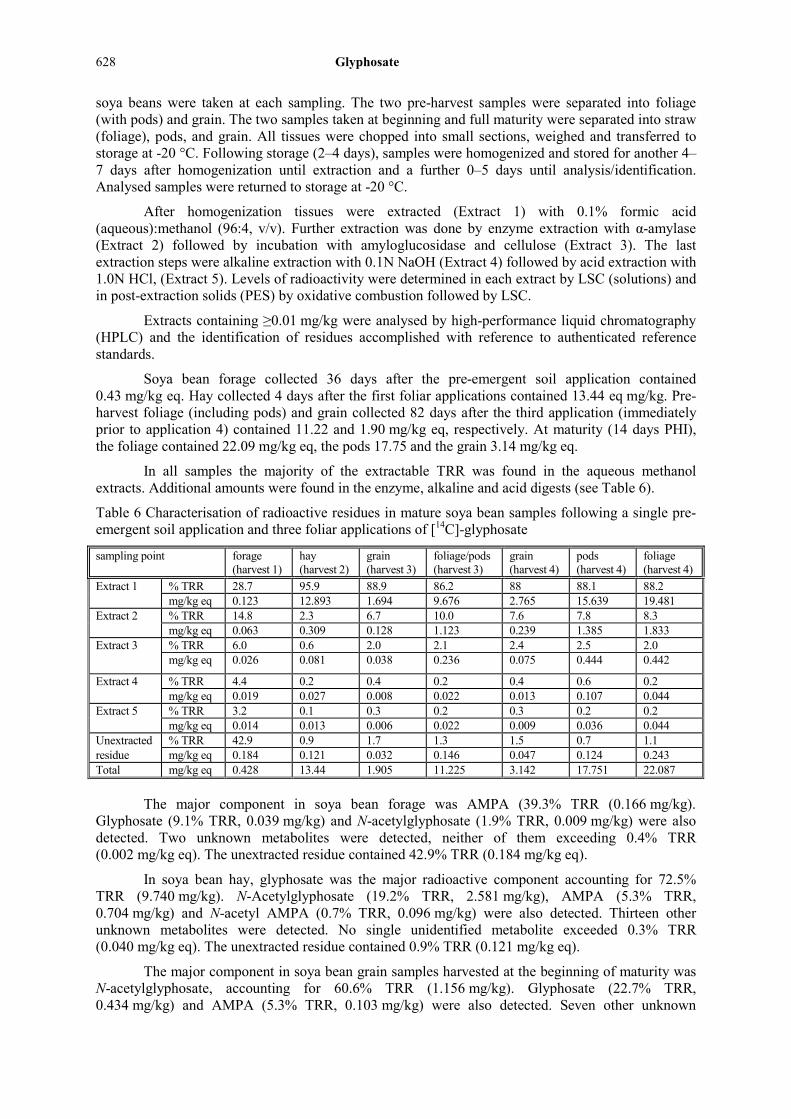
Soya bean forage collected 36 days after the pre-emergent soil application contained 0.43 mg/kg eq. Hay collected 4 days after the first foliar applications contained 13.44 eq mg/kg. Pre-harvest foliage (including pods) and grain collected 82 days after the third application (immediately prior to application 4) contained 11.22 and 1.90 mg/kg eq, respectively. At maturity (14 days PHI), the foliage contained 22.09 mg/kg eq, the pods 17.75 and the grain 3.14 mg/kg eq.
In all samples the majority of the extractable TRR was found in the aqueous methanol extracts. Additional amounts were found in the enzyme, alkaline and acid digests (see Table 6).
Table 6 Characterisation of radioactive residues in mature soya bean samples following a single pre-emergent soil application and three foliar applications of [14C]-glyphosate
sampling point forage (harvest 1)
hay (harvest 2)
grain (harvest 3)
foliage/pods (harvest 3)
grain (harvest 4)
pods (harvest 4)
foliage (harvest 4)
Extract 1 % TRR 28.7 95.9 88.9 86.2 88 88.1 88.2 mg/kg eq 0.123 12.893 1.694 9.676 2.765 15.639 19.481 Extract 2 % TRR 14.8 2.3 6.7 10.0 7.6 7.8 8.3 mg/kg eq 0.063 0.309 0.128 1.123 0.239 1.385 1.833 Extract 3 % TRR 6.0 0.6 2.0 2.1 2.4 2.5 2.0 mg/kg eq 0.026 0.081 0.038 0.236 0.075 0.444 0.442
Extract 4 % TRR 4.4 0.2 0.4 0.2 0.4 0.6 0.2 mg/kg eq 0.019 0.027 0.008 0.022 0.013 0.107 0.044 Extract 5 % TRR 3.2 0.1 0.3 0.2 0.3 0.2 0.2 mg/kg eq 0.014 0.013 0.006 0.022 0.009 0.036 0.044 Unextracted % TRR 42.9 0.9 1.7 1.3 1.5 0.7 1.1 residue mg/kg eq 0.184 0.121 0.032 0.146 0.047 0.124 0.243 Total mg/kg eq 0.428 13.44 1.905 11.225 3.142 17.751 22.087
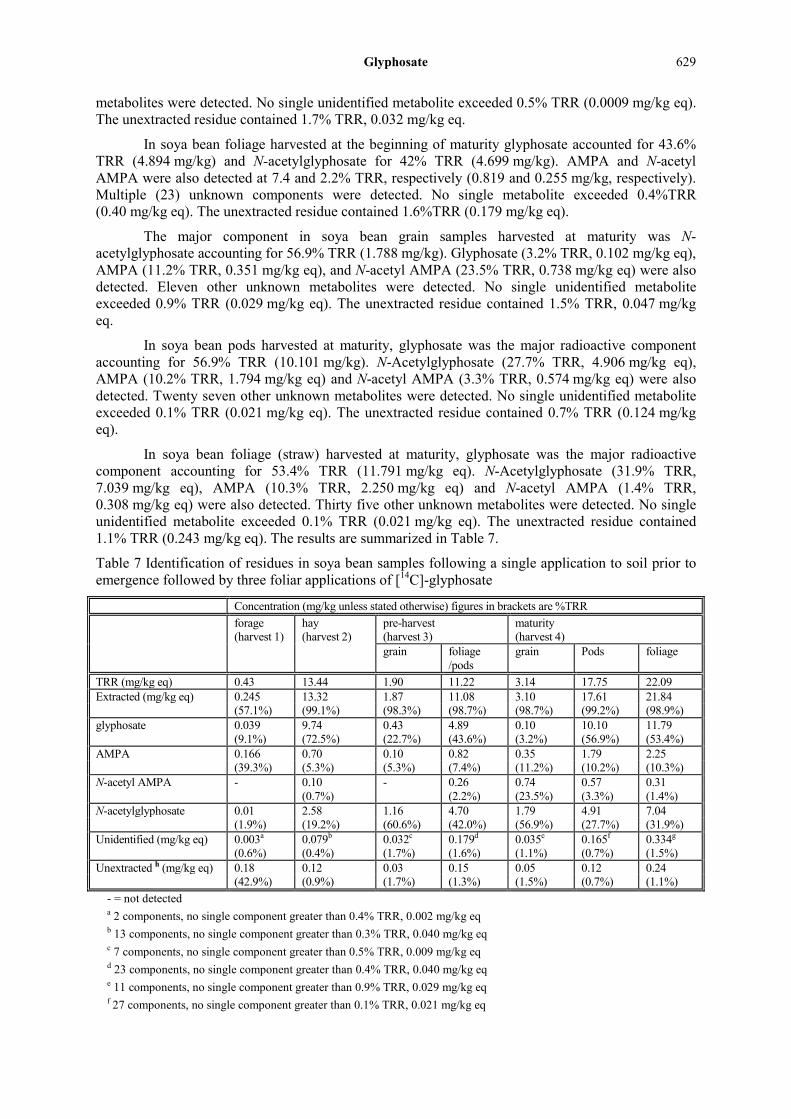
The major component in soya bean forage was AMPA (39.3% TRR (0.166 mg/kg). Glyphosate (9.1% TRR, 0.039 mg/kg) and N-acetylglyphosate (1.9% TRR, 0.009 mg/kg) were also detected. Two unknown metabolites were detected, neither of them exceeding 0.4% TRR (0.002 mg/kg eq). The unextracted residue contained 42.9% TRR (0.184 mg/kg eq).
In soya bean hay, glyphosate was the major radioactive component accounting for 72.5% TRR (9.740 mg/kg). N-Acetylglyphosate (19.2% TRR, 2.581 mg/kg), AMPA (5.3% TRR, 0.704 mg/kg) and N-acetyl AMPA (0.7% TRR, 0.096 mg/kg) were also detected. Thirteen other unknown metabolites were detected. No single unidentified metabolite exceeded 0.3% TRR (0.040 mg/kg eq). The unextracted residue contained 0.9% TRR (0.121 mg/kg eq).
The major component in soya bean grain samples harvested at the beginning of maturity was N-acetylglyphosate, accounting for 60.6% TRR (1.156 mg/kg). Glyphosate (22.7% TRR, 0.434 mg/kg) and AMPA (5.3% TRR, 0.103 mg/kg) were also detected. Seven other unknown
Glyphosate 629
metabolites were detected. No single unidentified metabolite exceeded 0.5% TRR (0.0009 mg/kg eq). The unextracted residue contained 1.7% TRR, 0.032 mg/kg eq.
In soya bean foliage harvested at the beginning of maturity glyphosate accounted for 43.6% TRR (4.894 mg/kg) and N-acetylglyphosate for 42% TRR (4.699 mg/kg). AMPA and N-acetyl AMPA were also detected at 7.4 and 2.2% TRR, respectively (0.819 and 0.255 mg/kg, respectively). Multiple (23) unknown components were detected. No single metabolite exceeded 0.4%TRR (0.40 mg/kg eq). The unextracted residue contained 1.6%TRR (0.179 mg/kg eq).
The major component in soya bean grain samples harvested at maturity was N-acetylglyphosate accounting for 56.9% TRR (1.788 mg/kg). Glyphosate (3.2% TRR, 0.102 mg/kg eq), AMPA (11.2% TRR, 0.351 mg/kg eq), and N-acetyl AMPA (23.5% TRR, 0.738 mg/kg eq) were also detected. Eleven other unknown metabolites were detected. No single unidentified metabolite exceeded 0.9% TRR (0.029 mg/kg eq). The unextracted residue contained 1.5% TRR, 0.047 mg/kg eq.
In soya bean pods harvested at maturity, glyphosate was the major radioactive component accounting for 56.9% TRR (10.101 mg/kg). N-Acetylglyphosate (27.7% TRR, 4.906 mg/kg eq), AMPA (10.2% TRR, 1.794 mg/kg eq) and N-acetyl AMPA (3.3% TRR, 0.574 mg/kg eq) were also detected. Twenty seven other unknown metabolites were detected. No single unidentified metabolite exceeded 0.1% TRR (0.021 mg/kg eq). The unextracted residue contained 0.7% TRR (0.124 mg/kg eq).
In soya bean foliage (straw) harvested at maturity, glyphosate was the major radioactive component accounting for 53.4% TRR (11.791 mg/kg eq). N-Acetylglyphosate (31.9% TRR, 7.039 mg/kg eq), AMPA (10.3% TRR, 2.250 mg/kg eq) and N-acetyl AMPA (1.4% TRR, 0.308 mg/kg eq) were also detected. Thirty five other unknown metabolites were detected. No single unidentified metabolite exceeded 0.1% TRR (0.021 mg/kg eq). The unextracted residue contained 1.1% TRR (0.243 mg/kg eq). The results are summarized in Table 7.
Table 7 Identification of residues in soya bean samples following a single application to soil prior to emergence followed by three foliar applications of [14C]-glyphosate
Concentration (mg/kg unless stated otherwise) figures in brackets are %TRR forage
(harvest 1) hay (harvest 2)
pre-harvest (harvest 3)
maturity (harvest 4)
grain foliage /pods
grain Pods foliage
TRR (mg/kg eq) 0.43 13.44 1.90 11.22 3.14 17.75 22.09 Extracted (mg/kg eq) 0.245 13.32 1.87 11.08 3.10 17.61 21.84 (57.1%) (99.1%) (98.3%) (98.7%) (98.7%) (99.2%) (98.9%) glyphosate 0.039 9.74 0.43 4.89 0.10 10.10 11.79 (9.1%) (72.5%) (22.7%) (43.6%) (3.2%) (56.9%) (53.4%) AMPA 0.166 0.70 0.10 0.82 0.35 1.79 2.25 (39.3%) (5.3%) (5.3%) (7.4%) (11.2%) (10.2%) (10.3%) N-acetyl AMPA -
0.10 -
0.26 0.74 0.57 0.31
(0.7%) (2.2%) (23.5%) (3.3%) (1.4%) N-acetylglyphosate 0.01 2.58 1.16 4.70 1.79 4.91 7.04 (1.9%) (19.2%) (60.6%) (42.0%) (56.9%) (27.7%) (31.9%) Unidentified (mg/kg eq) 0.003a 0.079b 0.032c 0.179d 0.035e 0.165f 0.334g
(0.6%) (0.4%) (1.7%) (1.6%) (1.1%) (0.7%) (1.5%) Unextracted h (mg/kg eq) 0.18 0.12 0.03 0.15 0.05 0.12 0.24 (42.9%) (0.9%) (1.7%) (1.3%) (1.5%) (0.7%) (1.1%)
- = not detected a 2 components, no single component greater than 0.4% TRR, 0.002 mg/kg eq b 13 components, no single component greater than 0.3% TRR, 0.040 mg/kg eq c 7 components, no single component greater than 0.5% TRR, 0.009 mg/kg eq d 23 components, no single component greater than 0.4% TRR, 0.040 mg/kg eq e 11 components, no single component greater than 0.9% TRR, 0.029 mg/kg eq f 27 components, no single component greater than 0.1% TRR, 0.021 mg/kg eq
630 Glyphosate
g 35 components, no single component greater than 0.5% TRR, 0.108 mg/kg eq h Residues remaining following exhaustive extraction
The metabolic pathway of glyphosate in gat soya bean plants was adequately understood and
is consistent with the pathway observed in gat maize. The proposed metabolic pathway for glyphosate in gat maize and soya bean plants is shown in Figure 2.
Figure 2 Proposed metabolic pathway of glyphosate in gat maize and soya bean plants
Environmental fate in soil
No new studies submitted.
Environmental fate in water/sediment systems
No new studies submitted.
RESIDUE ANALYSIS
Analytical methods
The Meeting received information on enforcement/monitoring methods for the determination of glyphosate and some of its metabolites in foodstuffs of plant and animal origin. In addition, the Meeting received information on analytical methods of glyphosate and some of its metabolites in foodstuffs of plant and animal origin as used in various study reports (supervised residue trials, storage stability studies, processing studies, feeding studies).
Analytical methods presented below are in principle suitable to allow enforcement covering glyphosate and its’ degradates. Enforcement methods for monitoring N-acetylglyphosate, AMPA and N-acetyl AMPA are, however, considered to be supplementary information only.
The methods presented are selected analyte procedures since the standard multi-residue methods as outlined in the “Guidance document on residue analytical method” (SANCO/825/00 rev. 7, 17/03/04) are not applicable to the analysis of glyphosate and glyphosate degradation analytes.
Analytical methods for enforcement/monitoring in plant commodities
LC/MS/MC, parent and degradate residues in various crop matrices.
NPOOH
OH
O
OH
O
NH
POOH
OH OH
O
NH2POOH
OH NHPOOH
OH
O
N-Acetylglyphosate
AMPA
Glyphosate
N-Acetyl AMPA
Glyphosate 631
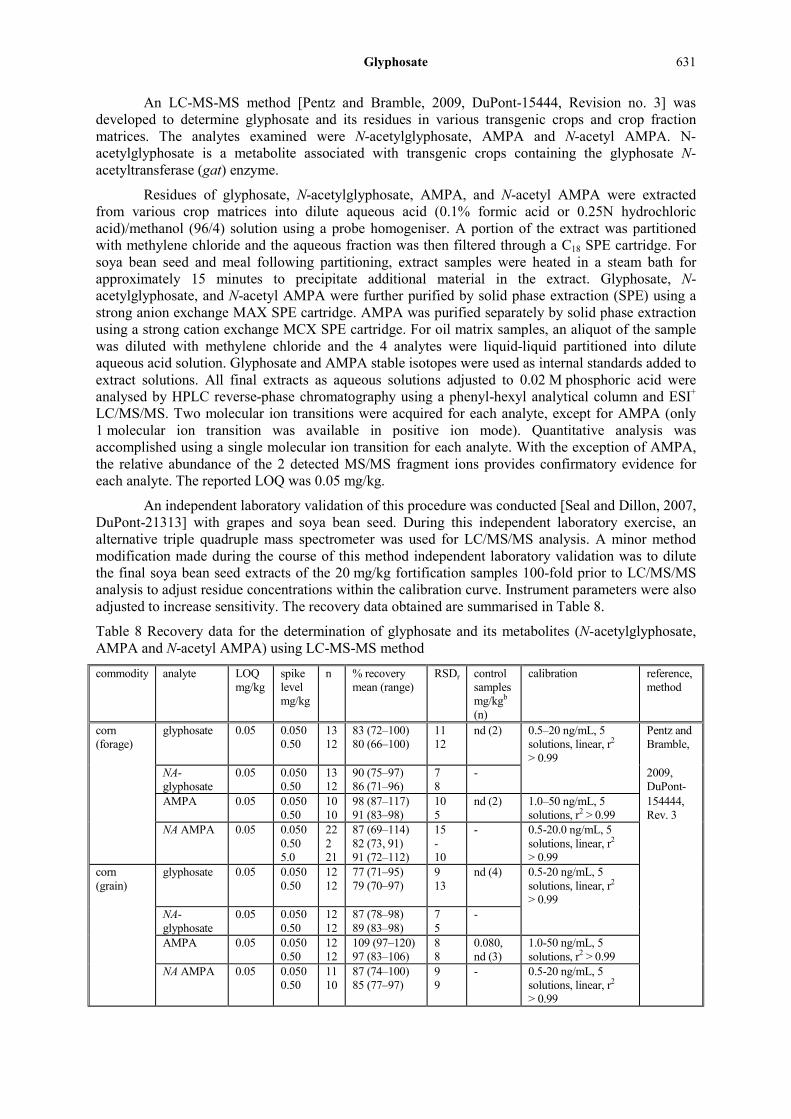
An LC-MS-MS method [Pentz and Bramble, 2009, DuPont-15444, Revision no. 3] was developed to determine glyphosate and its residues in various transgenic crops and crop fraction matrices. The analytes examined were N-acetylglyphosate, AMPA and N-acetyl AMPA. N-acetylglyphosate is a metabolite associated with transgenic crops containing the glyphosate N-acetyltransferase (gat) enzyme.
Residues of glyphosate, N-acetylglyphosate, AMPA, and N-acetyl AMPA were extracted from various crop matrices into dilute aqueous acid (0.1% formic acid or 0.25N hydrochloric acid)/methanol (96/4) solution using a probe homogeniser. A portion of the extract was partitioned with methylene chloride and the aqueous fraction was then filtered through a C18 SPE cartridge. For soya bean seed and meal following partitioning, extract samples were heated in a steam bath for approximately 15 minutes to precipitate additional material in the extract. Glyphosate, N-acetylglyphosate, and N-acetyl AMPA were further purified by solid phase extraction (SPE) using a strong anion exchange MAX SPE cartridge. AMPA was purified separately by solid phase extraction using a strong cation exchange MCX SPE cartridge. For oil matrix samples, an aliquot of the sample was diluted with methylene chloride and the 4 analytes were liquid-liquid partitioned into dilute aqueous acid solution. Glyphosate and AMPA stable isotopes were used as internal standards added to extract solutions. All final extracts as aqueous solutions adjusted to 0.02 M phosphoric acid were analysed by HPLC reverse-phase chromatography using a phenyl-hexyl analytical column and ESI+ LC/MS/MS. Two molecular ion transitions were acquired for each analyte, except for AMPA (only 1 molecular ion transition was available in positive ion mode). Quantitative analysis was accomplished using a single molecular ion transition for each analyte. With the exception of AMPA, the relative abundance of the 2 detected MS/MS fragment ions provides confirmatory evidence for each analyte. The reported LOQ was 0.05 mg/kg.
An independent laboratory validation of this procedure was conducted [Seal and Dillon, 2007, DuPont-21313] with grapes and soya bean seed. During this independent laboratory exercise, an alternative triple quadruple mass spectrometer was used for LC/MS/MS analysis. A minor method modification made during the course of this method independent laboratory validation was to dilute the final soya bean seed extracts of the 20 mg/kg fortification samples 100-fold prior to LC/MS/MS analysis to adjust residue concentrations within the calibration curve. Instrument parameters were also adjusted to increase sensitivity. The recovery data obtained are summarised in Table 8.
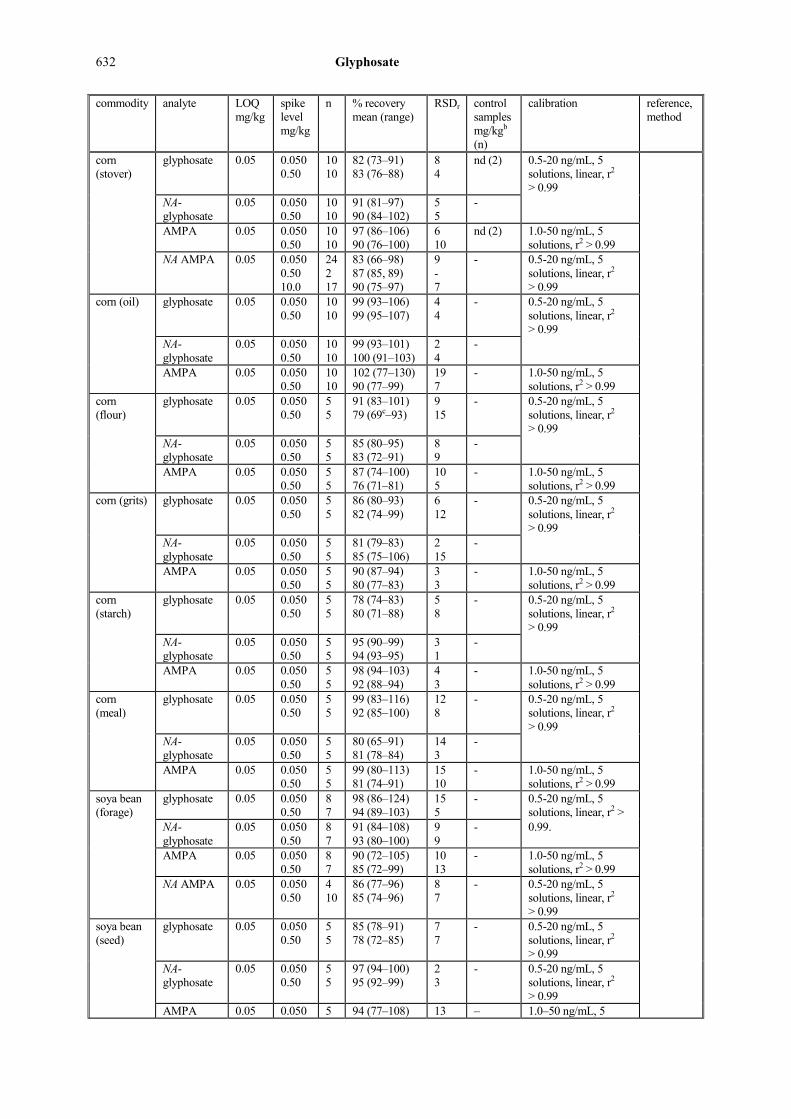
Table 8 Recovery data for the determination of glyphosate and its metabolites (N-acetylglyphosate, AMPA and N-acetyl AMPA) using LC-MS-MS method
commodity analyte LOQ mg/kg
spike level mg/kg
n % recovery mean (range)
RSDr control samples mg/kgb (n)
calibration reference, method
corn (forage)
glyphosate 0.05 0.050 0.50
13 12
83 (72–100) 80 (66–100)
11 12
nd (2) 0.5–20 ng/mL, 5 solutions, linear, r2 > 0.99
Pentz and Bramble,
NA-glyphosate
0.05 0.050 0.50
13 12
90 (75–97) 86 (71–96)
7 8
- 2009, DuPont-
AMPA 0.05 0.050 0.50
10 10
98 (87–117) 91 (83–98)
10 5
nd (2) 1.0–50 ng/mL, 5 solutions, r2 > 0.99
154444, Rev. 3
NA AMPA 0.05 0.050 0.50 5.0
22 2 21
87 (69–114) 82 (73, 91) 91 (72–112)
15 - 10
- 0.5-20.0 ng/mL, 5 solutions, linear, r2 > 0.99
corn (grain)
glyphosate 0.05 0.050 0.50
12 12
77 (71–95) 79 (70–97)
9 13
nd (4) 0.5-20 ng/mL, 5 solutions, linear, r2 > 0.99
NA-glyphosate
0.05 0.050 0.50
12 12
87 (78–98) 89 (83–98)
7 5
-
AMPA 0.05 0.050 0.50
12 12
109 (97–120) 97 (83–106)
8 8
0.080, nd (3)
1.0-50 ng/mL, 5 solutions, r2 > 0.99
NA AMPA 0.05 0.050 0.50
11 10
87 (74–100) 85 (77–97)
9 9
- 0.5-20 ng/mL, 5 solutions, linear, r2 > 0.99
632 Glyphosate
commodity analyte LOQ mg/kg
spike level mg/kg
n % recovery mean (range)
RSDr control samples mg/kgb (n)
calibration reference, method
corn (stover)
glyphosate 0.05 0.050 0.50
10 10
82 (73–91) 83 (76–88)
8 4
nd (2) 0.5-20 ng/mL, 5 solutions, linear, r2 > 0.99
NA-glyphosate
0.05 0.050 0.50
10 10
91 (81–97) 90 (84–102)
5 5
-
AMPA 0.05 0.050 0.50
10 10
97 (86–106) 90 (76–100)
6 10
nd (2) 1.0-50 ng/mL, 5 solutions, r2 > 0.99
NA AMPA 0.05 0.050 0.50 10.0
24 2 17
83 (66–98) 87 (85, 89) 90 (75–97)
9 - 7
- 0.5-20 ng/mL, 5 solutions, linear, r2 > 0.99
corn (oil) glyphosate 0.05 0.050 0.50
10 10
99 (93–106) 99 (95–107)
4 4
- 0.5-20 ng/mL, 5 solutions, linear, r2 > 0.99
NA-glyphosate
0.05 0.050 0.50
10 10
99 (93–101) 100 (91–103)
2 4
-
AMPA 0.05 0.050 0.50
10 10
102 (77–130) 90 (77–99)
19 7
- 1.0-50 ng/mL, 5 solutions, r2 > 0.99
corn (flour)
glyphosate 0.05 0.050 0.50
5 5
91 (83–101) 79 (69c–93)
9 15
- 0.5-20 ng/mL, 5 solutions, linear, r2 > 0.99
NA-glyphosate
0.05 0.050 0.50
5 5
85 (80–95) 83 (72–91)
8 9
-
AMPA 0.05 0.050 0.50
5 5
87 (74–100) 76 (71–81)
10 5
- 1.0-50 ng/mL, 5 solutions, r2 > 0.99
corn (grits) glyphosate 0.05 0.050 0.50
5 5
86 (80–93) 82 (74–99)
6 12
- 0.5-20 ng/mL, 5 solutions, linear, r2 > 0.99
NA-glyphosate
0.05 0.050 0.50
5 5
81 (79–83) 85 (75–106)
2 15
-
AMPA 0.05 0.050 0.50
5 5
90 (87–94) 80 (77–83)
3 3
- 1.0-50 ng/mL, 5 solutions, r2 > 0.99
corn (starch)
glyphosate 0.05 0.050 0.50
5 5
78 (74–83) 80 (71–88)
5 8
- 0.5-20 ng/mL, 5 solutions, linear, r2 > 0.99
NA-glyphosate
0.05 0.050 0.50
5 5
95 (90–99) 94 (93–95)
3 1
-
AMPA 0.05 0.050 0.50
5 5
98 (94–103) 92 (88–94)
4 3
- 1.0-50 ng/mL, 5 solutions, r2 > 0.99
corn (meal)
glyphosate 0.05 0.050 0.50
5 5
99 (83–116) 92 (85–100)
12 8
- 0.5-20 ng/mL, 5 solutions, linear, r2 > 0.99
NA-glyphosate
0.05 0.050 0.50
5 5
80 (65–91) 81 (78–84)
14 3
-
AMPA 0.05 0.050 0.50
5 5
99 (80–113) 81 (74–91)
15 10
- 1.0-50 ng/mL, 5 solutions, r2 > 0.99
soya bean (forage)
glyphosate 0.05 0.050 0.50
8 7
98 (86–124) 94 (89–103)
15 5
- 0.5-20 ng/mL, 5 solutions, linear, r2 >
NA-glyphosate
0.05 0.050 0.50
8 7
91 (84–108) 93 (80–100)
9 9
- 0.99.
AMPA 0.05 0.050 0.50
8 7
90 (72–105) 85 (72–99)
10 13
- 1.0-50 ng/mL, 5 solutions, r2 > 0.99
NA AMPA 0.05 0.050 0.50
4 10
86 (77–96) 85 (74–96)
8 7
- 0.5-20 ng/mL, 5 solutions, linear, r2 > 0.99
soya bean (seed)
glyphosate 0.05 0.050 0.50
5 5
85 (78–91) 78 (72–85)
7 7
- 0.5-20 ng/mL, 5 solutions, linear, r2 > 0.99
NA-glyphosate
0.05 0.050 0.50
5 5
97 (94–100) 95 (92–99)
2 3
- 0.5-20 ng/mL, 5 solutions, linear, r2 > 0.99
AMPA 0.05 0.050 5 94 (77–108) 13 – 1.0–50 ng/mL, 5

Glyphosate 633
commodity analyte LOQ mg/kg
spike level mg/kg
n % recovery mean (range)
RSDr control samples mg/kgb (n)
calibration reference, method
0.50 5 78 (73–85) 7 solutions, r2 > 0.99 NA AMPA 0.05 0.050
0.50 17 10
89 (66–116) 85 (70–115)
13 12
– 0.5–20 ng/mL, 5 solutions, linear, r2 > 0.99
soya bean (hay)
glyphosate 0.05 0.050 0.50
5 5
94 (83–107) 80 (76–86)
10 5
– 0.5-20 ng/mL, 5 solutions, linear, r2 > 0.99
NA-glyphosate
0.05 0.050 0.50
5 5
94 (87–105) 86 (84–88)
8 2
- 0.5-20 ng/mL, 5 solutions, linear, r2 > 0.99
AMPA 0.05 0.050 0.50
5 5
99 (94–113) 79 (74–85)
8 6
- 1.0-50 ng/mL, 5 solutions, r2 > 0.99
NA AMPA 0.05 0.050 0.50
23 6
75 (61–92) 78 (71–83)
10 6
- 0.5-20 ng/mL, 5 solutions, linear, r2 > 0.99
soya bean (oil)
glyphosate 0.05 0.050 0.50
5 5
99 (91–105) 93 (83–101)
6 9
- 0.5-20 ng/mL, 5 solutions, linear, r2 > 0.99
NA-glyphosate
0.05 0.050 0.50
5 5
94 (92–97) 98 (96–101)
2 2
- 0.5-20 ng/mL, 5 solutions, linear, r2 > 0.99
AMPA 0.05 0.050 0.50
5 5
107 (98–118) 95 (94–96)
9 1
- 0.5-20 ng/mL, 5 solutions, linear, r2 > 0.99
soya bean (meal)
glyphosate 0.05 0.050 0.50
5 5
93 (87–102) 79 (77–81)
7 2
- 0.5-20 ng/mL, 5 solutions, linear, r2 > 0.99
NA-glyphosate
0.05 0.050 0.50
5 5
89 (75–97) 93 (88–100)
9 5
- 0.5-20 ng/mL, 5 solutions, linear, r2 > 0.99
AMPA 0.05 0.050 0.50
5 5
84 (76–90) 74 (72–76)
6 2
- 0.5-20 ng/mL, 5 solutions, linear, r2 > 0.99
soya bean (hulls)
glyphosate 0.05 0.050 0.50
5 5
84 (72–92) 75 (71–78)
12 3
- 0.5-20 ng/mL, 5 solutions, linear, r2 > 0.99
NA-glyphosate
0.05 0.050 0.50
5 5
99 (93–104) 100 (95–102)
5 3
- 0.5-20 ng/mL, 5 solutions, linear, r2 > 0.99
AMPA 0.05 0.050 0.50
5 5
87 (84–96) 80 (72–84)
6 6
- 0.5-20 ng/mL, 5 solutions, linear, r2 > 0.99
corn oil NA-AMPA 0.05 0.050 0.50
2 2
105 (101,109) 99 (97, 100)
- -
- 0.5-20 ng/mL, 5 solutions, linear, r2 > 0.99
soya bean oil
NA-AMPA 0.05 0.050 0.50
4 4
100 (96–108) 102 (99–105)
- -
- 0.5-20 ng/mL, 5 solutions, linear, r2 > 0.99
combined oil
NA-AMPA 0.05 0.050 0.50
6 6
101 (97–109) 101 (97–105)
6 3
- 0.5-20 ng/mL, 5 solutions, linear, r2 > 0.99
plums glyphosate 0.05 0.050 0.50
5 5
95 (90–99) 91 (85–96)
4 5
- 0.5-20 ng/mL, 5 solutions, linear, r2 > 0.99
NA-glyphosate
0.05 0.050 0.50
5 5
102 (91–110) 93 (82–100)
9 8
- 0.5-20 ng/mL, 5 solutions, linear, r2 > 0.99
AMPA 0.05 0.050 0.50
5 5
95 (88–108) 100 (93–112)
8 9
- 1.0-50 ng/mL, 5 solutions, r2 > 0.99
NA AMPA 0.05 0.050 0.50
5 5
102 (98–109) 100 (89–112)
5 8
- 0.5-20 ng/mL, 5 solutions, linear, r2

634 Glyphosate
commodity analyte LOQ mg/kg
spike level mg/kg
n % recovery mean (range)
RSDr control samples mg/kgb (n)
calibration reference, method
> 0.99 limes glyphosate 0.05 0.050
0.50 5 5
100 (88–110) 99 (90–107)
9 6
- 0.5-20 ng/mL, 5 solutions, linear, r2 > 0.99
NA-glyphosate
0.05 0.050 0.50
5 5
86 (78–99) 91 (85–98)
10 6
- 0.5-20 ng/mL, 5 solutions, linear, r2 > 0.99
AMPA 0.05 0.050 0.50
5 5
95 (85–104) 98 (90–101)
8 5
- 1.0-50 ng/mL, 5 solutions, r2 > 0.99
NA AMPA 0.05 0.050 0.50
5 5
94 (79–105) 107 (95–121)
12 9
- 0.5-20 ng/mL, 5 solutions, linear, r2 > 0.99
soya bean (seed)
glyphosate 0.05 0.050 0.20
5 5
96 (83–113) 85 (73–90)
13a no int 0.5-20 ng/mL, >5 solutions, r2 > 0.99
Seal and Dillon,
NA-glyphosate
0.05 0.050 0.20
5 5
84 (81–90) 90 (83–95)
5.6a - 0.5-20 ng/mL, 5 solutions, linear, r2 > 0.99
2007, DuPont-
AMPA 0.05 0.050 0.20
5 5
91 (78–105) 89 (74–99)
10a - 0.5-20 ng/mL, 5 solutions, linear, r2 > 0.99
21313
NA AMPA 0.05 0.050 0.20
5 5
96 (88–102) 111 (86–126)
14a - 1-20 ng/mL, 5 solutions, linear, r2 > 0.99
grapes glyphosate 0.05 0.050 20
5 5
81 (72–93) 80 (70–89)
9.2a no int <1.0-100 ng/mL, >5 solutions, r2 > 0.99
NA-glyphosate
0.05 0.050 0.20
5 5
95 (92–99) 86 (80–90)
6.6a no int <1.0-100 ng/mL, >5 solutions, r2 > 0.99
AMPA 0.05 0.050 20
5 5
81 (76–84) 73 (70–78)
6.7a no int <1.0-100 ng/mL, >5 solutions, r2 > 0.99
NA AMPA 0.05 0.050 0.20
5 5
93 (80–101) 82 (77–88)
10a - <1.0-50 ng/mL, >5 solutions, r2 > 0.99.
a Based on recovery data of both fortification levels. b No significant matrix interference was observed at the chromatographic retention times of glyphosate, AMPA or N-
acetylglyphosate elutions of control extract for corn and soya bean matrices. Because genetically modified plants and glyphosate containing herbicides are widely used in soya bean crop, commercially available samples (including organic) generally contain glyphosate and AMPA residues. Soy bean control samples used in this study were untreated controls from field plots in regulatory studies.
Analytical methods for enforcement/monitoring in animal commodities
LC/MS/MC, N-acetylglyphosate and other analytes in various animal matrices.
An LC-MS-MS method [Pentz and Bramble, 2008, DuPont-20009, Revision no. 1] was developed to determine N-acetylglyphosate and other analytes in various animal matrices. The other analytes examined were glyphosate, AMPA and N-acetyl AMPA. Animal matrices included milk, eggs, muscle, kidney, liver and fat.
For milk and egg commodities, samples diluted in aqueous 0.1% formic acid/methanol (96/4) were successively partitioned with hexane and methylene chloride. Aliquots of the aqueous fraction are filtered through a C18 SPE cartridge. Samples for the analysis of glyphosate, N-acetylglyphosate, and/or N-acetyl AMPA (depending on matrix) were further purified by solid phase extraction (SPE) using polymeric anion exchange MAX SPE cartridge, followed by a rinse with methanol/water (80/20), 0.1M acetic acid in methanol/water (80/20) and methanol/water (95/5). Analytes are eluted in 1% TFA in 90% methanol/10% water solution. After evaporation to dryness and restoration in final LC/MS/MS solution, samples are analysed. Samples for the analysis of N-acetylglyphosate, AMPA and/or N-acetyl AMPA (depending on the matrix) were further purified using a cation exchange MCX
Glyphosate 635
SPE cartridge, followed by a methanol rinse. Methanol is then evaporated and extracts are diluted in final LC/MS/MS solution and analysed.
For animal tissues, samples blended with C18 sorbent material and homogenized, were extracted in 0.1N HCl solution (96% water/4%methanol) and re-extracted with water. Samples for the analysis of glyphosate, N-acetylglyphosate, and/or N-acetyl AMPA (depending on matrix) were diluted in acetonitrile and methanol in the presence of triethylamine, centrifuged, diluted in methanol and purified by solid phase extraction (SPE) using polymeric anion exchange MAX SPE cartridge, followed by a rinse with methanol/water (80/20), 0.1M acetic acid in methanol/water (80/20) and methanol/water (95/5). Analytes are eluted in 1% TFA in 90% methanol/10% water solution. After evaporation to dryness and restoration in final LC/MS/MS solution, samples are analysed. Samples for the analysis of N-acetylglyphosate, AMPA and/or N-acetyl AMPA (depending on the matrix) were diluted in acetonitrile and methanol, centrifuged, diluted in methanol and filtered through a cation exchange MCX SPE cartridge, which was then rinsed with methanol rinse. The eluate is then evaporated and diluted in final LC/MS/MS solution and analysed.
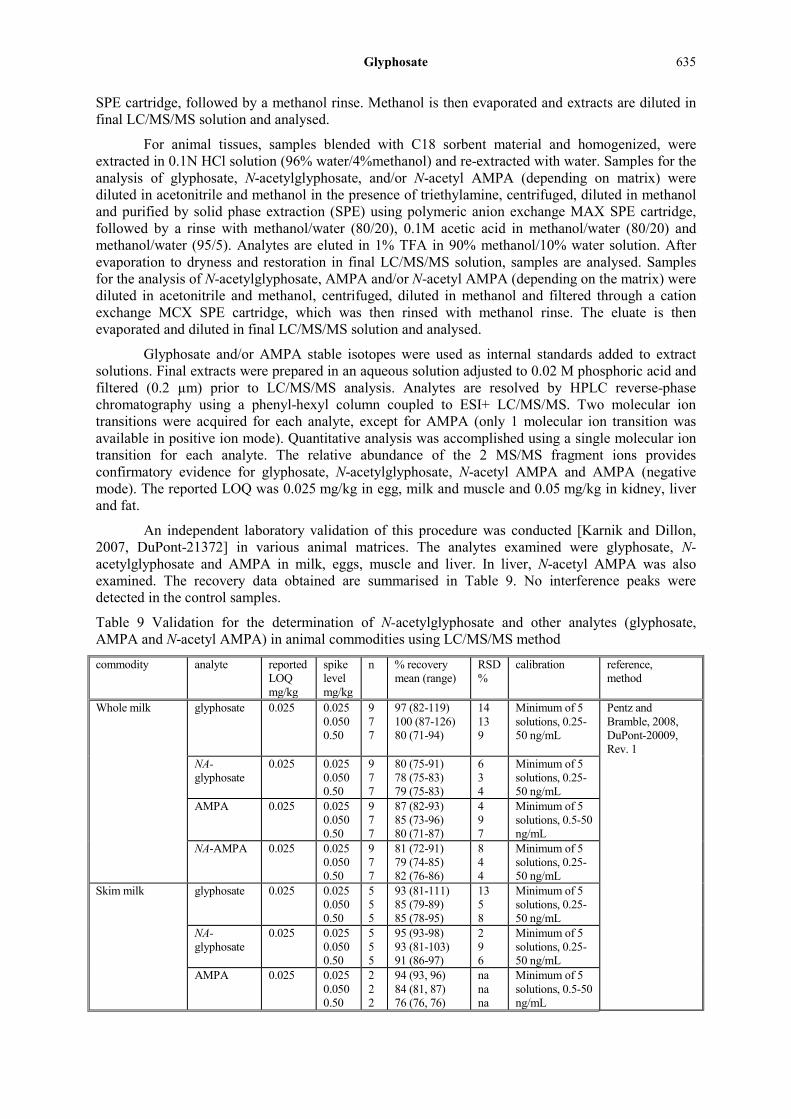
Glyphosate and/or AMPA stable isotopes were used as internal standards added to extract solutions. Final extracts were prepared in an aqueous solution adjusted to 0.02 M phosphoric acid and filtered (0.2 µm) prior to LC/MS/MS analysis. Analytes are resolved by HPLC reverse-phase chromatography using a phenyl-hexyl column coupled to ESI+ LC/MS/MS. Two molecular ion transitions were acquired for each analyte, except for AMPA (only 1 molecular ion transition was available in positive ion mode). Quantitative analysis was accomplished using a single molecular ion transition for each analyte. The relative abundance of the 2 MS/MS fragment ions provides confirmatory evidence for glyphosate, N-acetylglyphosate, N-acetyl AMPA and AMPA (negative mode). The reported LOQ was 0.025 mg/kg in egg, milk and muscle and 0.05 mg/kg in kidney, liver and fat.
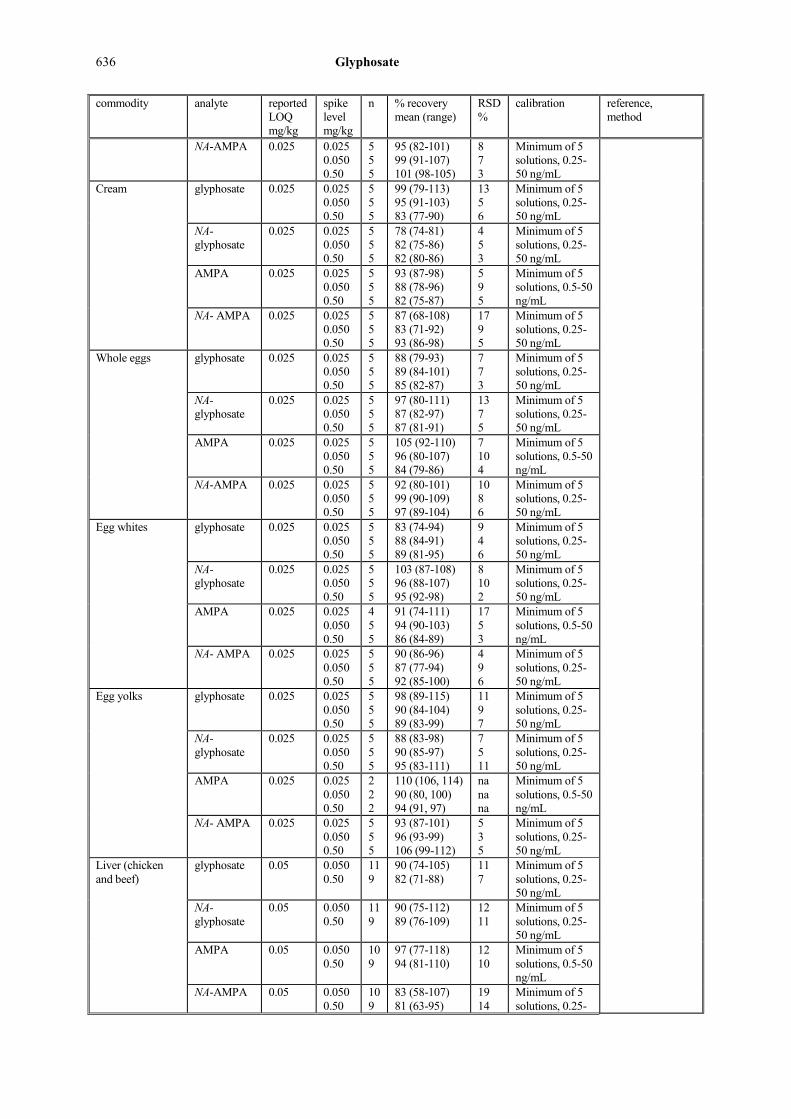
An independent laboratory validation of this procedure was conducted [Karnik and Dillon, 2007, DuPont-21372] in various animal matrices. The analytes examined were glyphosate, N-acetylglyphosate and AMPA in milk, eggs, muscle and liver. In liver, N-acetyl AMPA was also examined. The recovery data obtained are summarised in Table 9. No interference peaks were detected in the control samples.
Table 9 Validation for the determination of N-acetylglyphosate and other analytes (glyphosate, AMPA and N-acetyl AMPA) in animal commodities using LC/MS/MS method
commodity analyte reported LOQ mg/kg
spike level mg/kg
n % recovery mean (range)
RSD %
calibration reference, method
Whole milk glyphosate 0.025 0.025 0.050 0.50
9 7 7
97 (82-119) 100 (87-126) 80 (71-94)
14 13 9
Minimum of 5 solutions, 0.25-50 ng/mL
Pentz and Bramble, 2008, DuPont-20009, Rev. 1
NA-glyphosate
0.025 0.025 0.050 0.50
9 7 7
80 (75-91) 78 (75-83) 79 (75-83)
6 3 4
Minimum of 5 solutions, 0.25-50 ng/mL
AMPA 0.025 0.025 0.050 0.50
9 7 7
87 (82-93) 85 (73-96) 80 (71-87)
4 9 7
Minimum of 5 solutions, 0.5-50 ng/mL
NA-AMPA 0.025 0.025 0.050 0.50
9 7 7
81 (72-91) 79 (74-85) 82 (76-86)
8 4 4
Minimum of 5 solutions, 0.25-50 ng/mL
Skim milk glyphosate 0.025 0.025 0.050 0.50
5 5 5
93 (81-111) 85 (79-89) 85 (78-95)
13 5 8
Minimum of 5 solutions, 0.25-50 ng/mL
NA-glyphosate
0.025 0.025 0.050 0.50
5 5 5
95 (93-98) 93 (81-103) 91 (86-97)
2 9 6
Minimum of 5 solutions, 0.25-50 ng/mL
AMPA 0.025 0.025 0.050 0.50
2 2 2
94 (93, 96) 84 (81, 87) 76 (76, 76)
na na na
Minimum of 5 solutions, 0.5-50 ng/mL
636 Glyphosate
commodity analyte reported LOQ mg/kg
spike level mg/kg
n % recovery mean (range)
RSD %
calibration reference, method
NA-AMPA 0.025 0.025 0.050 0.50
5 5 5
95 (82-101) 99 (91-107) 101 (98-105)
8 7 3
Minimum of 5 solutions, 0.25-50 ng/mL
Cream glyphosate 0.025 0.025 0.050 0.50
5 5 5
99 (79-113) 95 (91-103) 83 (77-90)
13 5 6
Minimum of 5 solutions, 0.25-50 ng/mL
NA-glyphosate
0.025 0.025 0.050 0.50
5 5 5
78 (74-81) 82 (75-86) 82 (80-86)
4 5 3
Minimum of 5 solutions, 0.25-50 ng/mL
AMPA 0.025 0.025 0.050 0.50
5 5 5
93 (87-98) 88 (78-96) 82 (75-87)
5 9 5
Minimum of 5 solutions, 0.5-50 ng/mL
NA- AMPA 0.025 0.025 0.050 0.50
5 5 5
87 (68-108) 83 (71-92) 93 (86-98)
17 9 5
Minimum of 5 solutions, 0.25-50 ng/mL
Whole eggs glyphosate 0.025 0.025 0.050 0.50
5 5 5
88 (79-93) 89 (84-101) 85 (82-87)
7 7 3
Minimum of 5 solutions, 0.25-50 ng/mL
NA-glyphosate
0.025 0.025 0.050 0.50
5 5 5
97 (80-111) 87 (82-97) 87 (81-91)
13 7 5
Minimum of 5 solutions, 0.25-50 ng/mL
AMPA 0.025 0.025 0.050 0.50
5 5 5
105 (92-110) 96 (80-107) 84 (79-86)
7 10 4
Minimum of 5 solutions, 0.5-50 ng/mL
NA-AMPA 0.025 0.025 0.050 0.50
5 5 5
92 (80-101) 99 (90-109) 97 (89-104)
10 8 6
Minimum of 5 solutions, 0.25-50 ng/mL
Egg whites glyphosate 0.025 0.025 0.050 0.50
5 5 5
83 (74-94) 88 (84-91) 89 (81-95)
9 4 6
Minimum of 5 solutions, 0.25-50 ng/mL
NA-glyphosate
0.025 0.025 0.050 0.50
5 5 5
103 (87-108) 96 (88-107) 95 (92-98)
8 10 2
Minimum of 5 solutions, 0.25-50 ng/mL
AMPA 0.025 0.025 0.050 0.50
4 5 5
91 (74-111) 94 (90-103) 86 (84-89)
17 5 3
Minimum of 5 solutions, 0.5-50 ng/mL
NA- AMPA 0.025 0.025 0.050 0.50
5 5 5
90 (86-96) 87 (77-94) 92 (85-100)
4 9 6
Minimum of 5 solutions, 0.25-50 ng/mL
Egg yolks glyphosate 0.025 0.025 0.050 0.50
5 5 5
98 (89-115) 90 (84-104) 89 (83-99)
11 9 7
Minimum of 5 solutions, 0.25-50 ng/mL
NA-glyphosate
0.025 0.025 0.050 0.50
5 5 5
88 (83-98) 90 (85-97) 95 (83-111)
7 5 11
Minimum of 5 solutions, 0.25-50 ng/mL
AMPA 0.025 0.025 0.050 0.50
2 2 2
110 (106, 114) 90 (80, 100) 94 (91, 97)
na na na
Minimum of 5 solutions, 0.5-50 ng/mL
NA- AMPA 0.025 0.025 0.050 0.50
5 5 5
93 (87-101) 96 (93-99) 106 (99-112)
5 3 5
Minimum of 5 solutions, 0.25-50 ng/mL
Liver (chicken and beef)
glyphosate 0.05 0.050 0.50
11 9
90 (74-105) 82 (71-88)
11 7
Minimum of 5 solutions, 0.25-50 ng/mL
NA-glyphosate
0.05 0.050 0.50
11 9
90 (75-112) 89 (76-109)
12 11
Minimum of 5 solutions, 0.25-50 ng/mL
AMPA 0.05 0.050 0.50
10 9
97 (77-118) 94 (81-110)
12 10
Minimum of 5 solutions, 0.5-50 ng/mL
NA-AMPA 0.05 0.050 0.50
10 9
83 (58-107) 81 (63-95)
19 14
Minimum of 5 solutions, 0.25-

Glyphosate 637
commodity analyte reported LOQ mg/kg
spike level mg/kg
n % recovery mean (range)
RSD %
calibration reference, method
50 ng/mL Kidney (beef) glyphosate 0.05 0.050
0.50 6 7
98 (78-116) 87 (81-92)
15 5
Minimum of 5 solutions, 0.25-50 ng/mL
NA-glyphosate
0.05 0.050 0.50
6 7
99 (80-112) 83 (73-88)
11 6
Minimum of 5 solutions, 0.25-50 ng/mL
AMPA 0.05 0.050 0.50
6 7
92 (76-113) 89 (71-108)
17 14
Minimum of 5 solutions, 0.5-50 ng/mL
NA-AMPA 0.05 0.050 0.50
6 6
82 (69-94) 79 (71-93)
12 11
Minimum of 5 solutions, 0.25-50 ng/mL
Fat (chicken and beef)
glyphosate 0.05 0.050 0.50
6 6
98 (86-113) 94 (86-98)
12 5
Minimum of 5 solutions, 0.25-50 ng/mL
NA-glyphosate
0.05 0.050 0.50
6 6
100 (91-107) 90 (83-97)
6 6
Minimum of 5 solutions, 0.25-50 ng/mL
AMPA 0.05 0.050 0.50
5 5
103 (95-109) 93 (89-97)
6 4
Minimum of 5 solutions, 0.5-50 ng/mL
NA-AMPA 0.05 0.050 0.50
6 6
88 (82-95) 87 (71-93)
6 9
Minimum of 5 solutions, 0.25-50 ng/mL
muscle glyphosate 0.025 0.025 0.25
7 7
92 (77-103) 84 (78-91)
11 5
Minimum of 5 solutions, 0.25-50 ng/mL
NA-glyphosate
0.025 0.025 0.25
7 7
92 (76-113) 81 (70-92)
14 10
Minimum of 5 solutions, 0.25-50 ng/mL
AMPA 0.025 0.025 0.25
6 5
94 (84-103) 94 (85-101)
10 7
Minimum of 5 solutions, 0.5-50 ng/mL
NA-AMPA 0.025 0.025 0.25
6 5
83 (69-96) 80 (64-88)
13 12
Minimum of 5 solutions, 0.25-50 ng/mL
Milk (failed for AMPA and N-acetylglyphosate)
glyphosate 0.025 0.025 0.05 0.25
5 5 5
95 (88-101) 98 (90-107) 95 (92-102)
7.6a 7 single points, 0.25-20 ng/mL, linear, r > 0.99
Karnik and Dillon, 2007, DuPont-21372
NA-glyphosate
0.025 0.025 0.05 0.25
5 5 5
40 (31-50) 132 (128-135) 65 (45-128)
13a 7 single points, 0.25-20 ng/mL, linear, r > 0.99
AMPA 0.025 0.025 0.05 0.25
5 5 5
109 (83-124) 99 (86-104) 93 (85-97)
9.3a 7 single points, 0.25-20 ng/mL, linear, r > 0.99
milk glyphosate 0.025 0.025 0.05 0.25
10 10 10
100 (88-114) 102 (90-113) 99 (92-111)
7.6a 7 single points, 0.25-20 ng/mL, linear, r > 0.99
NA-glyphosate
0.025 0.025 0.05 0.25
5 5 5
96 (85-108) 89 (82-98) 77 (65-83)
13a 7 single points, 0.25-20 ng/mL, linear, r > 0.99
AMPA 0.025 0.025 0.05 0.25
5 5 5
105 (96-110) 95 (79-106) 91 (85-99)
9.3 a 0.25-50 ng/mL, linear
eggs glyphosate 0.025 0.025 0.05 0.25
5 5 5
100 (90-108) 107 (100-111) 109 (104-113)
6.2 a 0.25-20 ng/mL, linear
NA-glyphosate
0.025 0.025 0.05 0.25
5 5 5
100 (85-110) 90 (87-92) 81 (75-86)
12 a 0.25-20 ng/mL, linear
AMPA 0.025 0.025 5 106 (89-114) 8.8 a 0.25-20 ng/mL,
638 Glyphosate
commodity analyte reported LOQ mg/kg
spike level mg/kg
n % recovery mean (range)
RSD %
calibration reference, method
0.05 0.25
5 5
97 (88-105) 94 (90-101)
linear
Muscle (beef) glyphosate 0.025 0.025 0.05 0.25
5 5 5
89 (80-106) 87 (79-99) 85 (79-91)
9 a 0.25-20 ng/mL, linear
NA-glyphosate
0.025 0.025 0.05 0.25
5 5 5
70 (64-79) 84 (76-93) 76 (70-81)
11 a 0.25-20 ng/mL, linear
AMPA 0.025 0.025 0.05 0.25
5 5 5
91 (87-95) 93 (86-100) 87 (83-89)
5.2 a 0.25-20 ng/mL, linear
Liver (beef) (failed for glyphosate and N-acetyl AMPA)
glyphosate 0.05 0.05 0.1 0.5
5 5 5
91 (85-99) 62 (41-99) 44 (41-47)
10 a 0.25-20 ng/mL, linear
NA-glyphosate
0.05 0.05 0.1 0.5
5 5 5
81 (76-87) 85 (70-91) 74 (70-80)
8.4 a 0.25-20 ng/mL, linear
AMPA 0.05 0.05 0.1 0.5
5 5 5
106 (101-110) 105 (95-114) 103 (95-112)
7.4 a 0.25-20 ng/mL, linear
NA-AMPA 0.05 0.05 0.1 0.5
5 5 5
60 (57-63) 66 (63-69) 70 (68-76)
6.3 a 0.25-20 ng/mL, linear
Liver (beef) glyphosate 0.05 0.05 0.1 0.5
5 5 5
106 (88-115) 110 (99-125) 102 (87-111)
10 a 0.25-20 ng/mL, linear
NA-glyphosate
0.05 0.05 0.1 0.5
10 10 10
79 (71-87) 80 (68-91) 72 (67-80)
8.4 a 0.25-20 ng/mL, linear
AMPA 0.05 0.05 0.1 0.5
10 10 10
108 (90-122) 104 (94-114) 108 (95-126)
7.4 a 0.25-20 ng/mL, linear
NA- AMPA 0.05 0.05 0.1 0.5
5 5 5
87 (80-93) 88 (77-95) 85 (80-93)
6.3 a 0.25-20 ng/mL, linear
na = not applicable a Based on recovery data of all fortification levels (and where relevant both studies).
Stability of pesticide residues in stored analytical samples
The Meeting received data on the storage stability of glyphosate residues (and metabolites) in plant commodities (corn and soya bean) and in animal commodities. The studies were conducted to determine the stability of glyphosate (and metabolites) following frozen storage.
Storage stability in plant commodities
Study 1
Ground and homogenized corn samples (forage, grain and stover) containing the gat gene were fortified with N-(phosphonomethyl)glycine (glyphosate), N-acetyl-N-(phosphonomethyl)glycine (N-acetylglyphosate) and (aminomethyl)phosphonic acid (AMPA) at concentrations of 0.50 mg/kg and stored frozen at approximately -20 °C [Schwartz, 2007a, DuPont-17379]. Samples were analysed at various time points for up to 12 months using LC/MS/MS analysis based on DuPont-15444 with modifications. The LOQs were 0.05 mg/kg. Stability data is given in Tables 10, 11 and 12.
Glyphosate 639
Table 10 Storage stability of 0.50 mg/kg glyphosate at -20 °C
commodity Storage time (months) % remaining a concurrent recovery a
Corn Forage 0 - 99, 105 1 101, 102 105, 106 3 91, 96 85, 89 6 81,82 81, 84 12 96, 98 96, 101
Corn Grain 0 - 100, 105 1 108, 114 105, 106 3 82, 88 82, 93 6 80, 84 80 12 89, 105 89, 93
Corn Stover 0 - 105, 106 1 100 96 3 78, 88 87, 92 6 86, 89 100 12 89 92, 93
a Since n= 2 or less, no means and RSD values were reported
Table 11 Storage stability of 0.5 mg/kg N-acetylglyphosate at -20 °C
commodity Storage time (months) % remaining a concurrent recovery a Corn Forage 0 - 92
1 71, 72 70, 74 3 81, 82 75, 83 6 75, 76 78, 83 12 88 98, 99
Corn Grain 0 - 98 1 74, 94 77, 84 3 80, 82 78, 81 6 73, 74 78, 79 12 80, 81 74, 84
Corn Stover 0 - 90, 98 1 85, 87 85, 89 3 76, 81 73, 81 6 93, 95 100, 102 12 101, 104 98, 104
a Since n= 2 or less, no means and RSD values were reported
Table 12 Storage stability of 0.5 mg/kg AMPA at -20 °C
commodity Storage time (months) % remaining a concurrent recovery a Corn Forage 0 - 94, 99
1 90, 91 95, 96 3 93, 101 93, 100 6 74 79, 84 12 71, 77 91, 99
Corn Grain 0 - 97, 100 1 95, 98 102, 108 3 100, 102 91, 92 6 82, 84 86, 87 12 81, 94 84, 85
Corn Stover 0 - 94, 95 1 90, 95 90, 95 3 83, 86 90, 101 6 71, 78 92 12 64, 65 85, 87
a Since n= 2 or less, no means and RSD values were reported
640 Glyphosate
Study 2
Ground and homogenized corn samples (green plant, forage, grain and stover) containing the gat4602 and ZM-hra genes were fortified with N-(phosphonomethyl)glycine (glyphosate), N-acetyl-N-(phosphonomethyl)glycine (N-acetylglyphosate), (aminomethyl)phosphonic acid (AMPA) and [(acetylamino)methyl]phosphonic acid (N-acetyl AMPA) at concentrations of 0.50 mg/kg and stored frozen at approximately -20 °C [Schwartz, 2009b, DuPont-20094]. Residues were extracted from all corn samples after a 15 minute pre-soak in extraction solvent (96% aqueous/0.1% formic acid/4% methanol) using a homogenizing blade assembly. Stover samples, analysed for N-acetyl AMPA were also pre-soaked with a small amount of water before homogenization. Samples were analysed at various time points for up to 12 months (or 23 months for stover) (glyphosate, N-acetylglyphosate and AMPA) or 23 months for N-acetyl AMPA using LC/MS/MS analysis based on DuPont-15444 with modifications. The reported LOQ was 0.050 mg/kg. Stability data are given in Tables 13 to 16. Samples were corrected for normalized average concurrent method recoveries (78–117% for glyphosate, N-acetylglyphosate and AMPA up to 12 months; 70–115% for glyphosate, N-acetylglyphosate and AMPA up to 23 months [stover] and 96–115% for N-acetyl AMPA up to 23 months).
Table 13 Storage stability of 0.5 mg/kg glyphosate at -20 °C
commodity Storage time (months) % remaining a concurrent recovery a Corn Green Plant 0 - 85, 87
1 87, 88 92, 105 3 95, 98 98 6 87, 90 87, 90 9 83, 85 85, 90 12 109, 112 110, 115
Corn Forage 0 - 94, 96 1 86, 88 77, 86 3 92, 98 98, 103 6 91, 94 88, 90 9 90, 91 80, 85 12 114, 116 110, 116
Corn Grain 0 - 85, 89 1 93, 94 92, 93 3 82, 89 88, 101 6 90, 95 84, 95 9 83, 85 79, 85 12 94, 102 95, 105
Corn Stover 0 - 91, 108 1 106, 107 101, 105 3 101, 112 98, 108 6 103, 109 98, 106 9 99, 103 96, 100 12 105, 108 110, 112
23 98, 103 99, 109 a Since n= 2 or less, no means and RSD values were reported
Table 14 Storage stability of 0.5 mg/kg N-acetylglyphosate at -20 °C
commodity Storage time (months)
% remaining a concurrent recovery a
Corn Green Plant 0 - 80, 86 1 82, 85 85, 97 3 90, 91 94, 97 6 95, 97 88, 92 9 84, 94 80, 100 12 104, 107 95
Corn Forage 0 - 94 1 70, 71 70, 85 3 88, 95 90, 94
Glyphosate 641
commodity Storage time (months)
% remaining a concurrent recovery a
6 85, 87 87, 88 9 90, 98 77, 83 12 91, 98 94, 97
Corn Grain 0 - 84, 93 1 94, 98 88, 92 3 88, 102 90, 106 6 83, 85 81, 85 9 76, 83 75, 79 12 79, 80 75, 78
Corn Stover 0 - 90, 97 1 106, 113 92, 99 3 91, 93 91, 94 6 85, 87 80, 90 9 94, 97 93, 94 12 79, 84d 81, 92 23 61, 63c, d 64b
a Since n= 2 or less, no means and RSD values were reported b Due to matrix interference for the N-acetylglyphosate 212>88 mass transition, the results from the 212>170 mass transition for the 12 and 23 month time points are:. c 12 months: Stored Fort. A:0.41 ppm, 82%; Stored Fort. B: 0.40 mg/kg, 80%; concurrent recoveries A: 0.39 mg/kg, 78%; B.:0.41 mg/kg, 83%; Normalized Rec. A: 102%; Normalized Rec. B: 98%. d 23 months: Stored Fort. A:0.36 mg/kg, 71%; Stored Fort. B: 0.34 mg/kg, 68c%; concurrent recoveries A: 0.34 mg/kg, 69c%; B.:0.36 mg/kg, 72%; Normalized Rec. A: 102%; Normalized Rec. B: 97%.
Table 15 Storage stability of 0.5 mg/kg AMPA at -20 °C
commodity Storage time (months) % remaining a concurrent recovery a
Corn Green Plant 0 - 84, 88 1 71, 76 87, 92 3 75, 82 92, 95 6 72, 75 89, 90 9 64c 74, 80 12 70, 74 85, 95
Corn Forage 0 - 91, 92 1 73 74, 76 3 83, 87 90, 94 6 74, 86 89 9 73, 77 89, 90 12 75, 76 90, 103
Corn Grain 0 - 83, 95 1 72 74, 82 3 87, 91 88, 90 6 96, 97 96, 97 9 86, 88 80, 90 12 92, 95 94, 95
Corn Stover 0 - 84, 89 1 86, 88 87, 91 3 83, 88 91, 95 6 68, 74 80, 86 9 73, 75 84, 87 12 75, 81 96, 102 23 67, 68 93, 102
a Since n= 2 or less, no means and RSD values were reported
642 Glyphosate
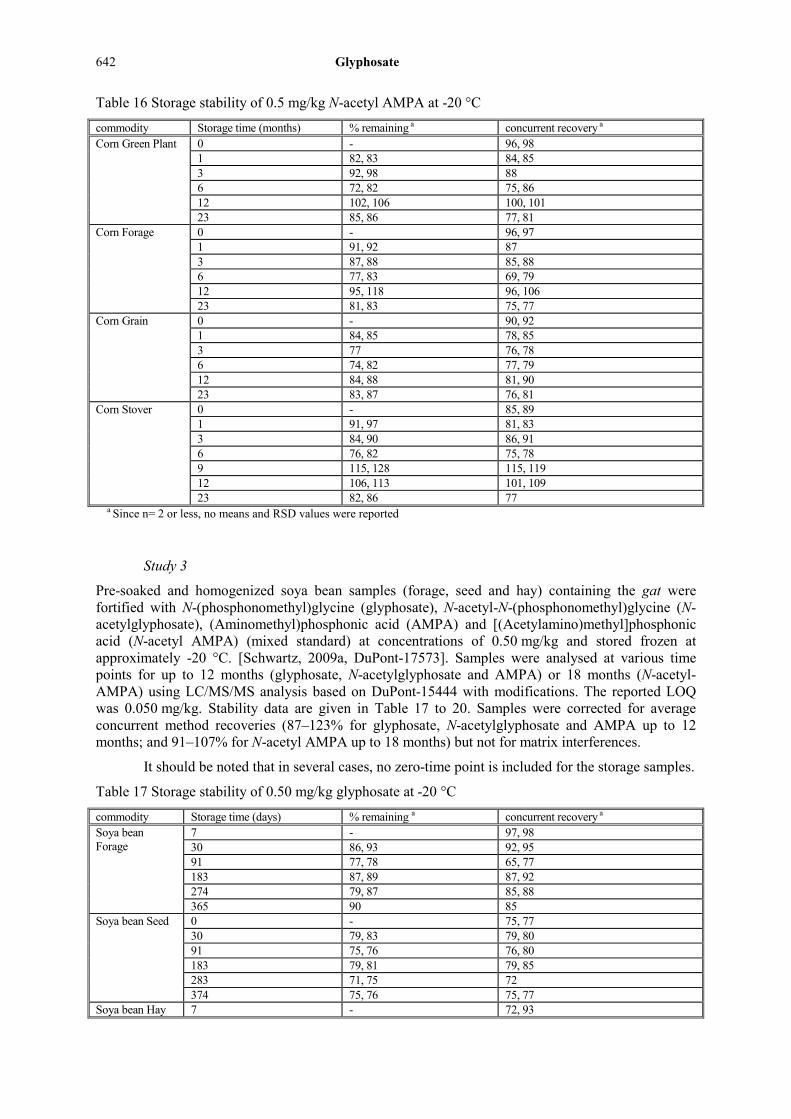
Table 16 Storage stability of 0.5 mg/kg N-acetyl AMPA at -20 °C
commodity Storage time (months) % remaining a concurrent recovery a
Corn Green Plant 0 - 96, 98 1 82, 83 84, 85 3 92, 98 88 6 72, 82 75, 86 12 102, 106 100, 101 23 85, 86 77, 81
Corn Forage 0 - 96, 97 1 91, 92 87 3 87, 88 85, 88 6 77, 83 69, 79 12 95, 118 96, 106 23 81, 83 75, 77
Corn Grain 0 - 90, 92 1 84, 85 78, 85 3 77 76, 78 6 74, 82 77, 79 12 84, 88 81, 90 23 83, 87 76, 81
Corn Stover 0 - 85, 89 1 91, 97 81, 83 3 84, 90 86, 91 6 76, 82 75, 78 9 115, 128 115, 119 12 106, 113 101, 109 23 82, 86 77
a Since n= 2 or less, no means and RSD values were reported
Study 3
Pre-soaked and homogenized soya bean samples (forage, seed and hay) containing the gat were fortified with N-(phosphonomethyl)glycine (glyphosate), N-acetyl-N-(phosphonomethyl)glycine (N-acetylglyphosate), (Aminomethyl)phosphonic acid (AMPA) and [(Acetylamino)methyl]phosphonic acid (N-acetyl AMPA) (mixed standard) at concentrations of 0.50 mg/kg and stored frozen at approximately -20 °C. [Schwartz, 2009a, DuPont-17573]. Samples were analysed at various time points for up to 12 months (glyphosate, N-acetylglyphosate and AMPA) or 18 months (N-acetyl-AMPA) using LC/MS/MS analysis based on DuPont-15444 with modifications. The reported LOQ was 0.050 mg/kg. Stability data are given in Table 17 to 20. Samples were corrected for average concurrent method recoveries (87–123% for glyphosate, N-acetylglyphosate and AMPA up to 12 months; and 91–107% for N-acetyl AMPA up to 18 months) but not for matrix interferences.
It should be noted that in several cases, no zero-time point is included for the storage samples.
Table 17 Storage stability of 0.50 mg/kg glyphosate at -20 °C
commodity Storage time (days) % remaining a concurrent recovery a
Soya bean Forage
7 - 97, 98 30 86, 93 92, 95 91 77, 78 65, 77
183 87, 89 87, 92 274 79, 87 85, 88 365 90 85
Soya bean Seed 0 - 75, 77 30 79, 83 79, 80 91 75, 76 76, 80 183 79, 81 79, 85 283 71, 75 72 374 75, 76 75, 77
Soya bean Hay 7 - 72, 93
Glyphosate 643
commodity Storage time (days) % remaining a concurrent recovery a
30 73, 74 65, 74
91 76, 78 71, 73 183 74, 77 69, 75
274 76, 80 76, 82 365 67, 69 73
a Since n= 2 or less, no means and RSD values were reported
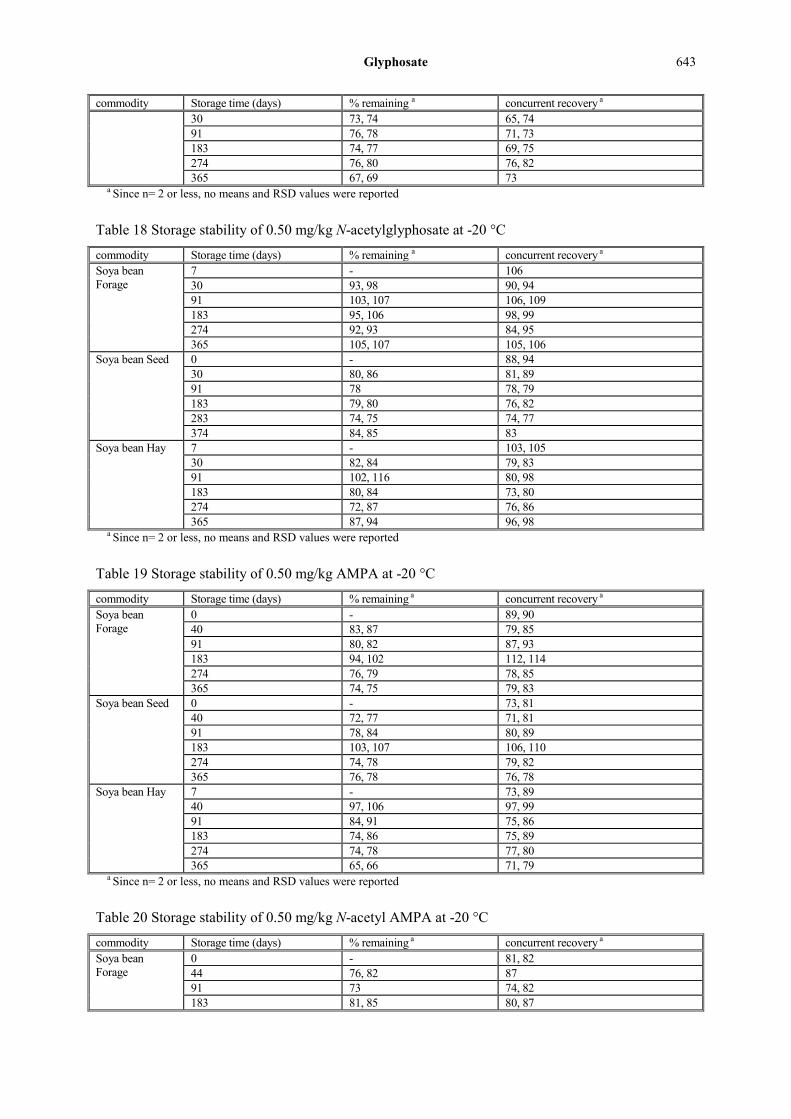
Table 18 Storage stability of 0.50 mg/kg N-acetylglyphosate at -20 °C
commodity Storage time (days) % remaining a concurrent recovery a
Soya bean Forage
7 - 106 30 93, 98 90, 94 91 103, 107 106, 109 183 95, 106 98, 99 274 92, 93 84, 95 365 105, 107 105, 106
Soya bean Seed 0 - 88, 94 30 80, 86 81, 89 91 78 78, 79 183 79, 80 76, 82 283 74, 75 74, 77 374 84, 85 83
Soya bean Hay 7 - 103, 105 30 82, 84 79, 83 91 102, 116 80, 98 183 80, 84 73, 80 274 72, 87 76, 86 365 87, 94 96, 98
a Since n= 2 or less, no means and RSD values were reported
Table 19 Storage stability of 0.50 mg/kg AMPA at -20 °C
commodity Storage time (days) % remaining a concurrent recovery a
Soya bean Forage
0 - 89, 90 40 83, 87 79, 85 91 80, 82 87, 93 183 94, 102 112, 114
274 76, 79 78, 85 365 74, 75 79, 83
Soya bean Seed 0 - 73, 81 40 72, 77 71, 81 91 78, 84 80, 89 183 103, 107 106, 110 274 74, 78 79, 82 365 76, 78 76, 78
Soya bean Hay 7 - 73, 89 40 97, 106 97, 99 91 84, 91 75, 86 183 74, 86 75, 89 274 74, 78 77, 80 365 65, 66 71, 79
a Since n= 2 or less, no means and RSD values were reported
Table 20 Storage stability of 0.50 mg/kg N-acetyl AMPA at -20 °C
commodity Storage time (days) % remaining a concurrent recovery a Soya bean Forage
0 - 81, 82 44 76, 82 87 91 73 74, 82 183 81, 85 80, 87
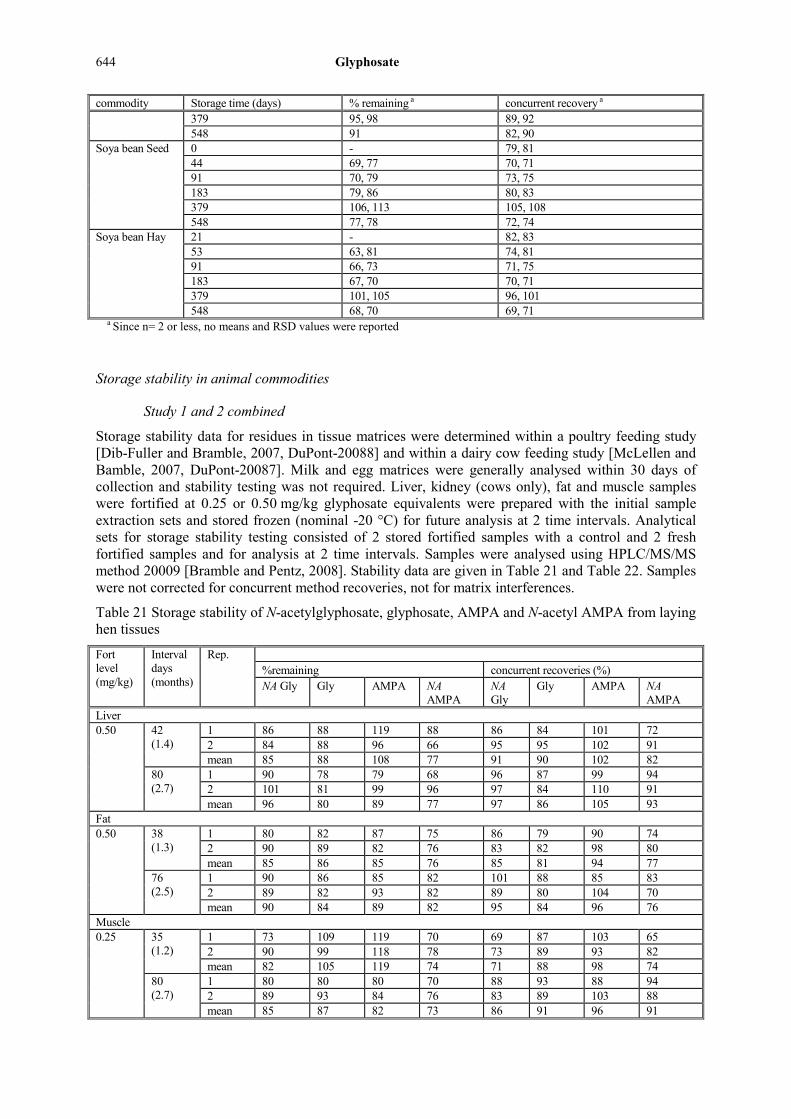
644 Glyphosate
commodity Storage time (days) % remaining a concurrent recovery a 379 95, 98 89, 92 548 91 82, 90
Soya bean Seed 0 - 79, 81 44 69, 77 70, 71 91 70, 79 73, 75 183 79, 86 80, 83 379 106, 113 105, 108 548 77, 78 72, 74
Soya bean Hay 21 - 82, 83 53 63, 81 74, 81 91 66, 73 71, 75 183 67, 70 70, 71 379 101, 105 96, 101 548 68, 70 69, 71
a Since n= 2 or less, no means and RSD values were reported
Storage stability in animal commodities
Study 1 and 2 combined
Storage stability data for residues in tissue matrices were determined within a poultry feeding study [Dib-Fuller and Bramble, 2007, DuPont-20088] and within a dairy cow feeding study [McLellen and Bamble, 2007, DuPont-20087]. Milk and egg matrices were generally analysed within 30 days of collection and stability testing was not required. Liver, kidney (cows only), fat and muscle samples were fortified at 0.25 or 0.50 mg/kg glyphosate equivalents were prepared with the initial sample extraction sets and stored frozen (nominal -20 °C) for future analysis at 2 time intervals. Analytical sets for storage stability testing consisted of 2 stored fortified samples with a control and 2 fresh fortified samples and for analysis at 2 time intervals. Samples were analysed using HPLC/MS/MS method 20009 [Bramble and Pentz, 2008]. Stability data are given in Table 21 and Table 22. Samples were not corrected for concurrent method recoveries, not for matrix interferences.
Table 21 Storage stability of N-acetylglyphosate, glyphosate, AMPA and N-acetyl AMPA from laying hen tissues
Fort level (mg/kg)
Interval days (months)
Rep. %remaining concurrent recoveries (%) NA Gly Gly AMPA NA
AMPA NA Gly
Gly AMPA NA AMPA
Liver 0.50 42
(1.4) 1 86 88 119 88 86 84 101 72 2 84 88 96 66 95 95 102 91 mean 85 88 108 77 91 90 102 82
80 (2.7)
1 90 78 79 68 96 87 99 94 2 101 81 99 96 97 84 110 91 mean 96 80 89 77 97 86 105 93
Fat 0.50 38
(1.3) 1 80 82 87 75 86 79 90 74 2 90 89 82 76 83 82 98 80 mean 85 86 85 76 85 81 94 77
76 (2.5)
1 90 86 85 82 101 88 85 83 2 89 82 93 82 89 80 104 70 mean 90 84 89 82 95 84 96 76
Muscle 0.25 35
(1.2) 1 73 109 119 70 69 87 103 65 2 90 99 118 78 73 89 93 82 mean 82 105 119 74 71 88 98 74
80 (2.7)
1 80 80 80 70 88 93 88 94 2 89 93 84 76 83 89 103 88 mean 85 87 82 73 86 91 96 91

Glyphosate 645
NA Gly = N-acetylglyphosate, Gly = glyphosate, NA AMPA = N-acetyl AMPA
Table 22 Storage stability of N-acetylglyphosate, glyphosate, AMPA and N-acetyl AMPA from dairy cow tissues
Fort level (mg/kg)
Interval days (months)
Rep. %remaining concurrent recovery (%) NA Gly Gly AMPA NA
AMPA NA Gly
Gly AMPA NA AMPA
Liver 0.50 61
(2.0)
1 85 94 85 87 85 88 97 86 2 80 86 93 85 73 87 84 54* mean 83 90 87 86 79 88 91 70
90 (3.0)
1 84 71 80 89 83 76 99 73 2 70 80 98 71 86 74 90 99 mean 77 76 89 80 85 75 95 86
Kidney 0.50
58 (1.9)
1 86 90 92 81 81 95 109 79 2 80 88 97 72 87 99 93 95 mean 83 89 95 77 84 97 101 87
87 (2.9)
1 82 91 98 87 77 95 98 75 2 78 90 103 75 85 90 95 92 mean 80 91 101 81 81 93 97 84
Fat 0.25 58
(1.9)
1 72 87 88 71 86 89 82 78 2 82 96 99 85 90 95 91 84 mean 77 82 94 78 88 92 87 81
94 (3.1)
1 92 99 83 92 84 94 92 81 2 93 90 86 84 93 99 115 85 mean 93 95 85 88 89 97 104 83
Muscle 0.25
58 (1.9)
1 71 78 83 82 68 79 81 81 2 75 75 80 77 72 77 87 73 mean 73 77 82 80 70 78 84 77
94 (3.1)
1 76 84 87 92 75 84 94 106 2 76 87 77 85 69 81 85 66 mean 76 86 82 89 72 83 90 86
USE PATTERN
Glyphosate is registered as a herbicide on a wide variety of crops. Information on registered uses was made available to the Meeting and those uses of relevance to this evaluation, which are supported by supervised residue trials and based on label information provided by the manufacturers, are summarized in Table 23.
Table 23 Table of use patterns
Crop Country Form Application PHI, days
Remarks Method Growth
stage Rate kg ae a
/ha
Spray conc, kg ae a/hl
No.
Beans, dry n
Canada SL 540 g/L
broadcast spray, ground
pre-harvest when crop has ≤ 30% grain moisture content
0.90 0.90-1.8 1 7-14 Stems are green to brown in colour; pods are mature (yellow to brown in colour); 80-90% leaf drop (original leaves). Do not apply if crop is grown for seed production.

646 Glyphosate
Crop Country Form Application PHI, days
Remarks Method Growth
stage Rate kg ae a
/ha
Spray conc, kg ae a/hl
No.
Beans (field)b
UK SL 450 g/L
broadcast spray, ground
pre-emergence
0.54 1 Ensure spraying precedes ANY crop emergence
wiper application
where equipment can avoid contact with established crop
16% - 30%
Broadcast pre-harvest, grain/seed moisture ≤30%
1.1-1.4 0.43-1.8 1 7
Beans, dry c USA SL 540 g/L
ground spray or hand-held spray with 2% concentr.
spot treatment at or beyond bud stage of growth
0.87 0.47-0.94 1 7 Crop injury is possible. At least a 30-day plant back interval between treatment and replanting of crops not listed in the label. Do not feed treated vines and hay to livestock. Do not combine spot treatment with pre-harvest treatment
hooded sprayers and wiper applicators (preventing all crop contact)
pre-harvest when crop has ≤30% grain moisture content
0.87 0.47-3.1 1 7
Lentils n Canada SL 540 g/L
broadcast spray, ground
pre-harvest when crop has ≤30% grain moisture content
0.90 0.90-1.8 1 7-14 Lowermost pods (bottom 15%) are brown and seeds rattle. Do not apply if crop is grown for seed production.
Maize (glyphosate tolerant varieties with gat trait )
USA SL 600 g/L and 500 g/L (j)
broadcast high volume hydraulic spraying and broadcast aerial
pre-emergence (A)
0.44-2.1
0.12-7.5 ≥1 Total pre-emergence (A) maximum of 4.2 kg ae /ha Total in-crop application (B + C) max 2.6 kg ae/ha. Total seasonal max (A+B+C) = 6.7 kg ae/ha. Avoid spray in whorls of plant. Last application before harvest should not exceed 0.88 kg ae/ha. Allow a minimum of 50 days between post emergence application and harvest of forage
broadcast high volume hydraulic spraying and broadcast aerial d
post-emergence up to crop height 76 cm and from 76 cm to 122 cm (B)
0.88-1.3
0.24-4.6 1-4 50f
spraying using ground equipment and drop nozzles only
pre-harvest, harvest aid, when mature, 35% grain moisture or less (C)
0.88 0.24-3.1 1 7g

Glyphosate 647
Crop Country Form Application PHI, days
Remarks Method Growth
stage Rate kg ae a
/ha
Spray conc, kg ae a/hl
No.
Peas n Canada SL 540 g/L
broadcast spray, ground
pre-harvest when crop has ≤30% grain moisture content
0.90 0.9-1.8 1 7-14 Majority (75-80%) of pods are brown. Do not apply if crop is grown for seed production.
Peas (dry)b UK SL 450 g/L
broadcast spray, ground
pre-emergence
0.54 - 1 Ensure spraying precedes ANY crop emergence.
wiper application
where equipment can avoid contact with established crop
16% - 30%
Broadcast pre-harvest, grain/seed moisture ≤30%
1.1-1.44 0.44-1.8 1 7
Peas (dry), lentils and chickpeas c
USA SL 540 g/L
ground spray or hand-held spray with 2% concentr.
spot treatment
2.5 1.3-2.7 1 7 Crop injury is possible. At least a 30-day plant back interval between treatment and replanting of crops not listed in the label. Do not feed treated vines and hay to livestock. Do not treat cowpeas or field (feed) peas, since these crops are considered to be grown as livestock feed.
hooded sprayers and wiper applicators (preventing all crop contact)
pre-harvest when crop has ≤30% grain moisture content
2.5 1.3-8.9 1 7
Soy bean (glyphosate tolerant varieties with gat trait)
USA SL 600 g/L and 500 g/L (j)
Broadcast spray
pre-emergence (A)
≤4.2
The total pre-emergence maximum is 4.2 kg ae /ha. The total combined maximum (A+B+C) = 6.7 kg ae/ha per season. Total in-crop (B+C) application max 2.6 kg ae/ha. Do not graze or harvest for forage or hay.
Broadcast high volume hydraulic spraying and broadcast aerial
post emergence, from cracking throughout flowering (B)
0.44-1.8
0.11-6.3 1-4
Broadcast spraying ground or aerial
pre-harvest, mature, when pods have lost colour (C)
0.88 0.24-3.1 1 14h
Sugar beet, glyphosate tolerant varieties, EPSPS trait
USA SL 540 g/L
Broadcast spray (ground or aerial)
pre-emergence (A)
≤4.2 (seasonal max 4.2 kg/ha pre-
1.1-15 ≥1e The combined total per year for all applications (A+B+C) = 6.7 kg ae/ha.

648 Glyphosate
Crop Country Form Application PHI, days
Remarks Method Growth
stage Rate kg ae a
/ha
Spray conc, kg ae a/hl
No.
emergence)
The combined total max of post emergence applications (B+C) = 3.9 kg ae/ha Total combined number of post emergence (B+C) applications is 4.
Broadcast spray, in crop (over-the-top), ground or aerial
from crop emergence to 8-leaf stage (B)
≤1.3 (no more than 2.2 kg ae/ha during this stage)
0.35-4.6 1-2e
30
Broadcast spray, in crop (over-the-top), ground or aerial
from 8-leaf stage to canopy closure (C)
≤0.87 (max. of 1.7 kg ae/ha in this stage)
0.23-3.1 1-2e
30
Sugar beet, glyphosate tolerant varieties, EPSPS trait
Canada SL 540 g/L
Broadcast spray, in crop (over-the-top), ground or aerial k
from crop emergence to 8-leaf stage
0.45-0.90 (total seasonal in-crop application max. 1.8 kg ae/ha k)
1-4e
30
Sweet corn (corn on the cob)i glyphosate tolerant, EPSPS trait
USA SL 540 g/L
Broadcast spray (ground or aerial)
Pre-emergence (A)
≤4.2 (seasonal max 4.2 kg/ha pre-emergence)
2.2-4.5 ≥1e The combined total per year for all applications (A+B) = 6.7 kg ae/ha. The total seasonal in-crop maximum is 5.2 kg ae/ha). Avoid spraying if the crop has reached the reproductive stage.
Broadcast spray, in crop (over-the-top), ground or aeriall
From crop emergence to 8-leaf stage or until corn is 76 cm – 122 cm tall (B)
0.63-1.7
0.34-1.9 ≥1e 30m
a Active ingredient (ai.) expressed as glyphosate acid equivalent (ae) b UK label covers peas and field beans c Crops labelled under legume vegetables in the USA product label for glyphosate are limited to dry beans, peas, lentil and chickpeas only. d Spraying using ground equipment and drop nozzles only for the late post emergence applications (crop height 76-122 cm). e Minimum of 10 days between applications f 50 days prior to harvest for forage. g 7 days prior to harvest of mature grain. h 14 days prior to harvest of mature grain. i USA label covers use in field corn, seed corn, silage corn, sweet corn and popcorn j Applied with a non-ionic surfactant or wetting agent at 0.25% v/v k Aerial application only under wet field conditions l Drop nozzle spray (avoid spraying into the whorls of the plan), in crop, ground only during crop height from 76-122 cm m 30 days prior to harvest of sweet corn forage or grain n Cropland use pre-harvest in lentils, peas, and dry beans.
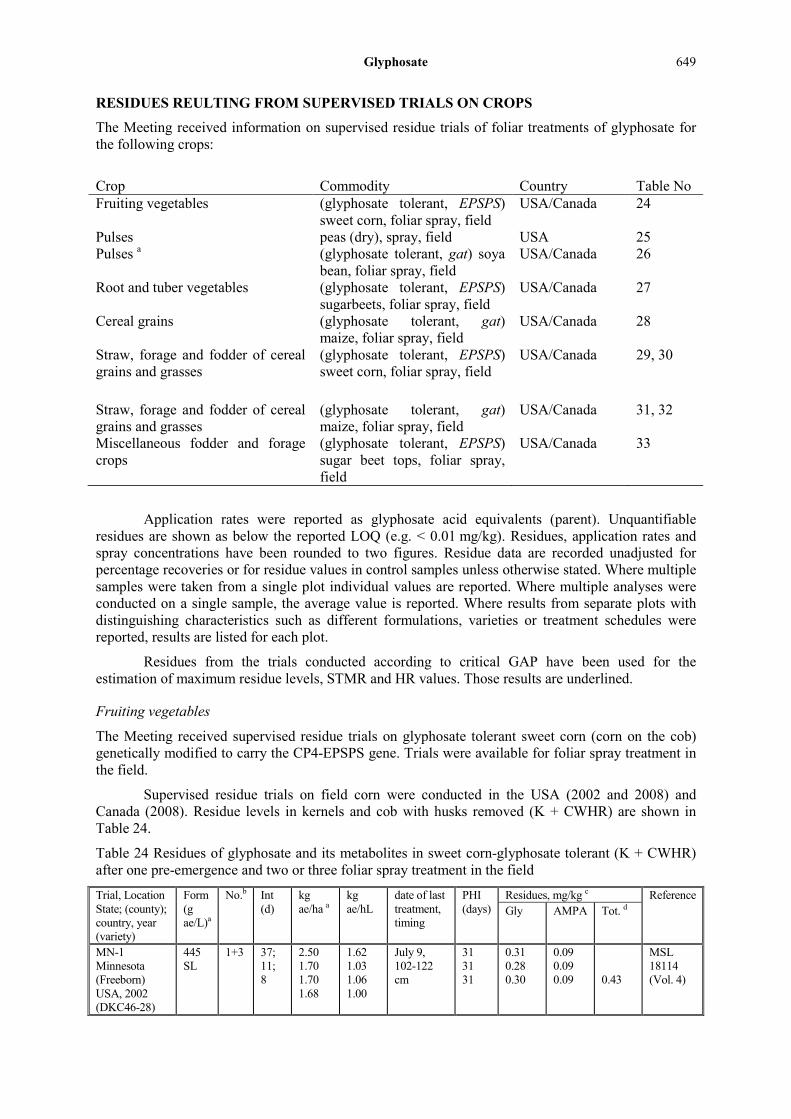
Glyphosate 649
RESIDUES REULTING FROM SUPERVISED TRIALS ON CROPS
The Meeting received information on supervised residue trials of foliar treatments of glyphosate for the following crops:
Crop Commodity Country Table No Fruiting vegetables (glyphosate tolerant, EPSPS)
sweet corn, foliar spray, field USA/Canada 24
Pulses peas (dry), spray, field USA 25 Pulses a (glyphosate tolerant, gat) soya
bean, foliar spray, field USA/Canada 26
Root and tuber vegetables (glyphosate tolerant, EPSPS) sugarbeets, foliar spray, field
USA/Canada 27
Cereal grains (glyphosate tolerant, gat) maize, foliar spray, field
USA/Canada 28
Straw, forage and fodder of cereal grains and grasses
(glyphosate tolerant, EPSPS) sweet corn, foliar spray, field
USA/Canada
29, 30
Straw, forage and fodder of cereal grains and grasses
(glyphosate tolerant, gat) maize, foliar spray, field
USA/Canada
31, 32
Miscellaneous fodder and forage crops
(glyphosate tolerant, EPSPS) sugar beet tops, foliar spray, field
USA/Canada 33
Application rates were reported as glyphosate acid equivalents (parent). Unquantifiable residues are shown as below the reported LOQ (e.g. < 0.01 mg/kg). Residues, application rates and spray concentrations have been rounded to two figures. Residue data are recorded unadjusted for percentage recoveries or for residue values in control samples unless otherwise stated. Where multiple samples were taken from a single plot individual values are reported. Where multiple analyses were conducted on a single sample, the average value is reported. Where results from separate plots with distinguishing characteristics such as different formulations, varieties or treatment schedules were reported, results are listed for each plot.
Residues from the trials conducted according to critical GAP have been used for the estimation of maximum residue levels, STMR and HR values. Those results are underlined.
Fruiting vegetables
The Meeting received supervised residue trials on glyphosate tolerant sweet corn (corn on the cob) genetically modified to carry the CP4-EPSPS gene. Trials were available for foliar spray treatment in the field.
Supervised residue trials on field corn were conducted in the USA (2002 and 2008) and Canada (2008). Residue levels in kernels and cob with husks removed (K + CWHR) are shown in Table 24.
Table 24 Residues of glyphosate and its metabolites in sweet corn-glyphosate tolerant (K + CWHR) after one pre-emergence and two or three foliar spray treatment in the field
Trial, Location State; (county); country, year (variety)
Form (g ae/L)a
No.b Int (d)
kg ae/ha a
kg ae/hL
date of last treatment, timing
PHI (days)
Residues, mg/kg c Reference Gly AMPA Tot. d
MN-1 Minnesota (Freeborn) USA, 2002 (DKC46-28)
445 SL
1+3 37; 11; 8
2.50 1.70 1.70 1.68
1.62 1.03 1.06 1.00
July 9, 102-122 cm
31 31 31
0.31 0.28 0.30
0.09 0.09 0.09
0.43
MSL 18114 (Vol. 4)
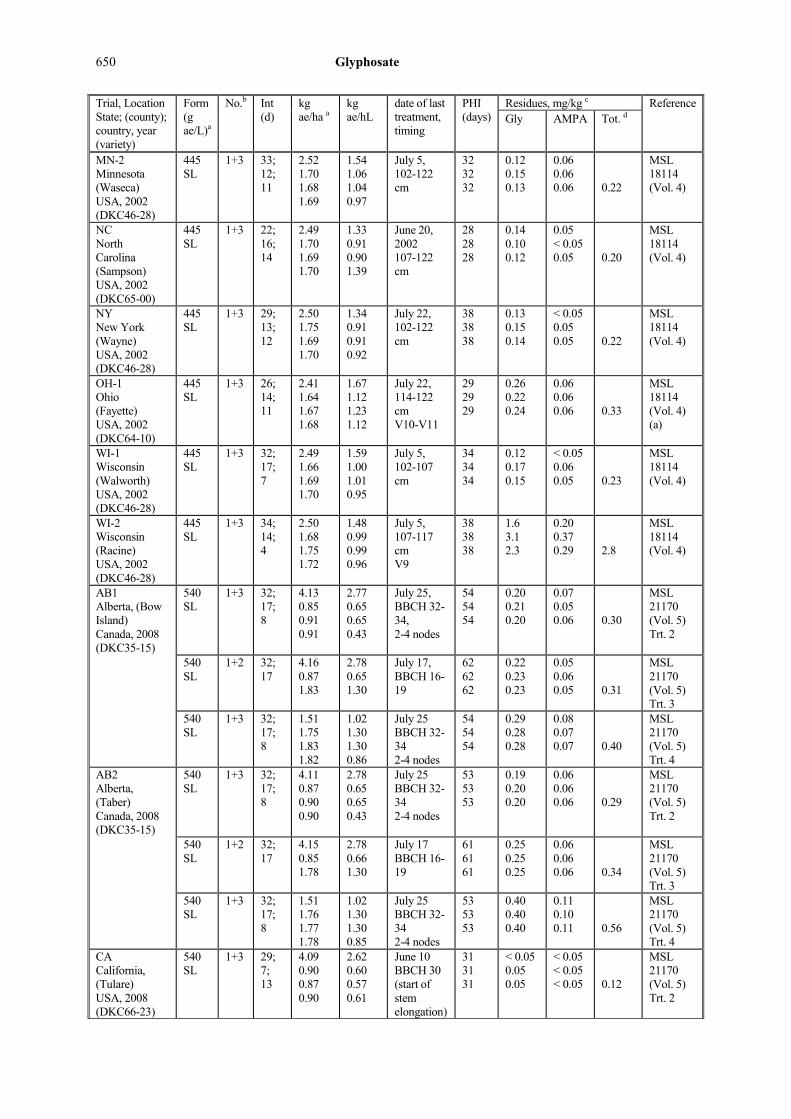
650 Glyphosate
Trial, Location State; (county); country, year (variety)
Form (g ae/L)a
No.b Int (d)
kg ae/ha a
kg ae/hL
date of last treatment, timing
PHI (days)
Residues, mg/kg c Reference Gly AMPA Tot. d
MN-2 Minnesota (Waseca) USA, 2002 (DKC46-28)
445 SL
1+3 33; 12; 11
2.52 1.70 1.68 1.69
1.54 1.06 1.04 0.97
July 5, 102-122 cm
32 32 32
0.12 0.15 0.13
0.06 0.06 0.06
0.22
MSL 18114 (Vol. 4)
NC North Carolina (Sampson) USA, 2002 (DKC65-00)
445 SL
1+3 22; 16; 14
2.49 1.70 1.69 1.70
1.33 0.91 0.90 1.39
June 20, 2002 107-122 cm
28 28 28
0.14 0.10 0.12
0.05 < 0.05 0.05
0.20
MSL 18114 (Vol. 4)
NY New York (Wayne) USA, 2002 (DKC46-28)
445 SL
1+3 29; 13; 12
2.50 1.75 1.69 1.70
1.34 0.91 0.91 0.92
July 22, 102-122 cm
38 38 38
0.13 0.15 0.14
< 0.05 0.05 0.05
0.22
MSL 18114 (Vol. 4)
OH-1 Ohio (Fayette) USA, 2002 (DKC64-10)
445 SL
1+3 26; 14; 11
2.41 1.64 1.67 1.68
1.67 1.12 1.23 1.12
July 22, 114-122 cm V10-V11
29 29 29
0.26 0.22 0.24
0.06 0.06 0.06
0.33
MSL 18114 (Vol. 4) (a)
WI-1 Wisconsin (Walworth) USA, 2002 (DKC46-28)
445 SL
1+3 32; 17; 7
2.49 1.66 1.69 1.70
1.59 1.00 1.01 0.95
July 5, 102-107 cm
34 34 34
0.12 0.17 0.15
< 0.05 0.06 0.05
0.23
MSL 18114 (Vol. 4)
WI-2 Wisconsin (Racine) USA, 2002 (DKC46-28)
445 SL
1+3 34; 14; 4
2.50 1.68 1.75 1.72
1.48 0.99 0.99 0.96
July 5, 107-117 cm V9
38 38 38
1.6 3.1 2.3
0.20 0.37 0.29
2.8
MSL 18114 (Vol. 4)
AB1 Alberta, (Bow Island) Canada, 2008 (DKC35-15)
540 SL
1+3 32; 17; 8
4.13 0.85 0.91 0.91
2.77 0.65 0.65 0.43
July 25, BBCH 32-34, 2-4 nodes
54 54 54
0.20 0.21 0.20
0.07 0.05 0.06
0.30
MSL 21170 (Vol. 5) Trt. 2
540 SL
1+2 32; 17
4.16 0.87 1.83
2.78 0.65 1.30
July 17, BBCH 16-19
62 62 62
0.22 0.23 0.23
0.05 0.06 0.05
0.31
MSL 21170 (Vol. 5) Trt. 3
540 SL
1+3 32; 17; 8
1.51 1.75 1.83 1.82
1.02 1.30 1.30 0.86
July 25 BBCH 32-34 2-4 nodes
54 54 54
0.29 0.28 0.28
0.08 0.07 0.07
0.40
MSL 21170 (Vol. 5) Trt. 4
AB2 Alberta, (Taber) Canada, 2008 (DKC35-15)
540 SL
1+3 32; 17; 8
4.11 0.87 0.90 0.90
2.78 0.65 0.65 0.43
July 25 BBCH 32-34 2-4 nodes
53 53 53
0.19 0.20 0.20
0.06 0.06 0.06
0.29
MSL 21170 (Vol. 5) Trt. 2
540 SL
1+2 32; 17
4.15 0.85 1.78
2.78 0.66 1.30
July 17 BBCH 16-19
61 61 61
0.25 0.25 0.25
0.06 0.06 0.06
0.34
MSL 21170 (Vol. 5) Trt. 3
540 SL
1+3 32; 17; 8
1.51 1.76 1.77 1.78
1.02 1.30 1.30 0.85
July 25 BBCH 32-34 2-4 nodes
53 53 53
0.40 0.40 0.40
0.11 0.10 0.11
0.56
MSL 21170 (Vol. 5) Trt. 4
CA California, (Tulare) USA, 2008 (DKC66-23)
540 SL
1+3 29; 7; 13
4.09 0.90 0.87 0.90
2.62 0.60 0.57 0.61
June 10 BBCH 30 (start of stem elongation)
31 31 31
< 0.05 0.05 0.05
< 0.05 < 0.05 < 0.05
0.12
MSL 21170 (Vol. 5) Trt. 2

Glyphosate 651
Trial, Location State; (county); country, year (variety)
Form (g ae/L)a
No.b Int (d)
kg ae/ha a
kg ae/hL
date of last treatment, timing
PHI (days)
Residues, mg/kg c Reference Gly AMPA Tot. d
540 SL
1+2 29; 7
4.10 0.90 1.73
2.63 0.60 1.11
May 28 BBCH 16-18 (3-9 leaves unfolded)
44 44 44
0.07 0.06 0.07
< 0.05 < 0.05 < 0.05
0.14
MSL 21170 (Vol. 5) Trt. 3
540 SL
1+3 29; 7; 13
1.47 1.73 1.70 1.78
0.95 1.17 1.11 1.20
June 10 BBCH 30 (start of stem elongation)
31 31 31
0.11 0.11 0.11
< 0.05 < 0.05 < 0.05
0.18
MSL 21170 (Vol. 5) Trt. 4
FL Florida, (Tift) USA, 2008 (DK C66-23)
540 SL
1+3 22; 17; 4
4.02 0.86 0.86 0.87
2.42 0.52 0.50 0.72
May 23 102-122 cm
35 35 35
0.10 0.10 0.10
< 0.05 < 0.05 < 0.05
0.18
MSL 21170 (Vol. 5) Trt. 2
540 SL
1+2 22; 17
4.06 0.85 1.77
2.43 0.52 1.02
May 19 86-107 cm V7-V8
39 39 39
0.13 0.13 0.13
< 0.05 < 0.05 < 0.05
0.20
MSL 21170 (Vol. 5) Trt. 3
540 SL
1+3 22; 17; 4
1.47 1.74 1.74 1.72
0.89 1.06 1.03 1.43
May 23 102-122 cm
35 35 35
0.10 0.11 0.10
< 0.05 < 0.05 < 0.05
0.18
MSL 21170 (Vol. 5) Trt. 4
IA Iowa, (Jefferson) USA, 2008 (DKC55-82)
540 SL
1 +3
26; 15; 6
4.14 0.83 0.87 0.89
2.89 0.59 0.53 0.52
July 07 BBCH 39 (8 nodes)
31 31 31
0.11 0.11 0.11
< 0.05 < 0.05 < 0.05
0.18
MSL 21170 (Vol. 5) Trt. 2
540 SL
1+2 26; 15
4.07 0.84 1.75
2.89 0.59 1.07
July 01 BBCH 38 (8 nodes)
37 37 37
0.24 0.24 0.24
< 0.05 0.06 0.05
0.32
MSL 21170 (Vol. 5) Trt. 3
IL Illinois, (Stark) USA, 2008 (Dekalb 61-19)
540 SL
1+3 19; 16; 13
4.14 0.86 0.87 0.86
3.28 0.62 0.67 0.62
July 09 122-133 cm
30 30 30
0.10 0.10 0.10
< 0.05 < 0.05 < 0.05
0.18
MSL 21170 (Vol. 5) Trt. 2
540 SL
1+2 19; 16
4.11 0.86 1.78
3.29 0.62 1.34
June 26 BBCH 18
43 43 43
0.16 0.15 0.16
< 0.05 0.05 0.05
0.23
MSL 21170 (Vol. 5) Trt. 3
IN Indiana, (Parke) USA, 2008 (DKC61-19)
540 SL
1+3 27; 12; 11
3.99 0.87 0.89 0.65
2.59 0.49 0.63 0.62
July 22 BBCH 20-21 to BBCH 30-31 (1st node)
27 27 27
0.60 0.60 0.60
0.12 0.12 0.12
0.78
MSL 21170 (Vol. 5) Trt. 2
540 SL
1+2 27; 12
3.96 0.87 1.72
2.59 0.49 1.25
July 11 BBCH 17-19
38 38 38
0.40 0.39 0.40
0.12 0.11 0.12
0.57
MSL 21170 (Vol. 5) Trt. 3
MN Minnesota, (Freeborn) USA, 2008 (DKC50-19)
540 SL
1+3 37; 9; 13
4.13 0.87 0.85 0.87
2.58 0.55 0.60 0.92
July 11 117-122 cm
33 33 33
< 0.05 < 0.05 < 0.05
< 0.05 < 0.05 < 0.05
< 0.05
MSL 21170 (Vol. 5) Trt. 2
540 SL
1+2 37; 9
4.11 0.87 1.73
2.57 0.55 1.19
June 28 61-71 cm
46 46 46
< 0.05 < 0.05 < 0.05
< 0.05 < 0.05 < 0.05
< 0.05
MSL 21170 (Vol. 5) Trt. 3
NC North Carolina,
540 SL
1+3 31; 16; 8
4.20 0.87 0.89
2.94 0.48 0.49
June 12 BBCH 38 (8 nodes)
33 33 33
1.0 1.0 1.0
0.25 0.23 0.24
1.4
MSL 21170 (Vol. 5)

652 Glyphosate
Trial, Location State; (county); country, year (variety)
Form (g ae/L)a
No.b Int (d)
kg ae/ha a
kg ae/hL
date of last treatment, timing
PHI (days)
Residues, mg/kg c Reference Gly AMPA Tot. d
(Wayne) USA, 2008 (DKC66-23)
0.87 0.50 Trt. 2
540 SL
1+2 31; 16
4.10 0.87 1.77
2.93 0.48 0.98
June 04 BBCH 37 (7 nodes)
41 41 41
1.1 1.1 1.1
0.22 0.23 0.23
1.4
MSL 21170 (Vol. 5) Trt. 3
NY New York, (Wayne) USA, 2008 (DKC55-82)
540 SL
1+3 35; 18; 15
4.09 0.89 0.85 0.87
2.32 0.49 0.49 0.49
July 23 BBCH 19 (9 or more leaves unfolded)
42 42 42
0.07 0.07 0.07
< 0.05 < 0.05 < 0.05
0.15
MSL 21170 (Vol. 5) Trt. 2
540 SL
1+2 35; 18
4.11 0.87 1.74
2.31 0.49 0.98
July 08 2008 66-71 cm (eight leaves with collars)
57 57 57
0.11 0.10 0.11
< 0.05 < 0.05 < 0.05
0.18
MSL 21170 (Vol. 5) Trt. 3
540 SL
1+3 35; 18; 15
1.50 1.75 1.72 1.72
0.84 0.97 0.97 0.97
July 23 BBCH 19 (9 or more leaves unfolded)
42 42 42
0.31 0.31 0.31
0.08 0.08 0.08
0.43
MSL 21170 (Vol. 5) Trt. 4
ON Ontario, (Branchton) Canada, 2008 (DKC46-60)
540 SL
1+3 14; 21; 12
4.02 0.84 0.87 0.87
2.74 0.58 0.56 0.59
July 28 BBCH 19 (9 or more leaves unfolded)
38 38 38
0.15 0.15 0.15
0.05 0.05 0.05
0.22
MSL 21170 (Vol. 5) Trt. 2
540 SL
1+2 14; 21
3.91 0.85 1.77
2.76 0.58 1.12
July 16 61-66 cm
50 50 50
0.22 0.22 0.22
0.05 0.05 0.05
0.30
MSL 21170 (Vol. 5) Trt. 3
540 SL
1+3 14; 21; 12
1.54 1.67 1.73 1.76
1.01 1.16 1.12 1.16
July 28 BBCH 19 (9 or more leaves unfolded)
38 38 38
0.28 0.29 0.28
0.10 0.09 0.10
0.43
MSL 21170 (Vol. 5) Trt. 4
OR Oregon, (Benton) USA, 2008 (DKC55-82)
540 SL
1+3 29; 17; 17
3.96 0.84 0.81 0.90
2.75 0.53 0.53 0.55
August 03 102-122 cm
53 53 53
0.07 0.07 0.07
< 0.05 < 0.05 < 0.05
0.14
MSL 21170 (Vol. 5) Trt. 2
540 SL
1+2 29; 17
3.99 0.85 1.67
2.75 0.53 1.08
July 17 46-71 cm
70 70 70
< 0.05 < 0.05 < 0.05
< 0.05 < 0.05 < 0.05
< 0.05
MSL 21170 (Vol. 5) Trt. 3
540 SL
1+3 29; 17; 17
1.50 1.70 1.72 1.78
1.04 1.07 1.07 1.09
August 03 102-122 cm
53 53 53
0.07 0.07 0.07
< 0.05 < 0.05 < 0.05
0.14
MSL 21170 (Vol. 5) Trt. 4
PA Pennsylvania, (Lehigh) USA, 2008 (DKC61-19)
540 SL
1+3 26; 17; 3
4.15 0.86 0.89 0.89
2.50 0.53 0.53 0.53
July 10 2008 107-122 cm
33 33 33
0.38 0.37 0.38
0.18 0.17 0.17
0.64
MSL 21170 (Vol. 5) Trt. 2
540 SL
1+2 26; 17
4.23 0.87 1.78
2.50 0.53 1.07
July 07 76-102 cm
36 36 36
0.71 0.70 0.70
0.19 0.20 0.19
1.0
MSL 21170 (Vol. 5) Trt. 3
WA Washington, (Grant)
540 SL
1+3 39; 28; 8
4.13 0.87 0.86
2.93 0.62 0.62
July 01 117-142 cm
42 42 42
0.07 0.06 0.07
< 0.05 < 0.05 < 0.05
0.14
MSL 21170 (Vol. 5)
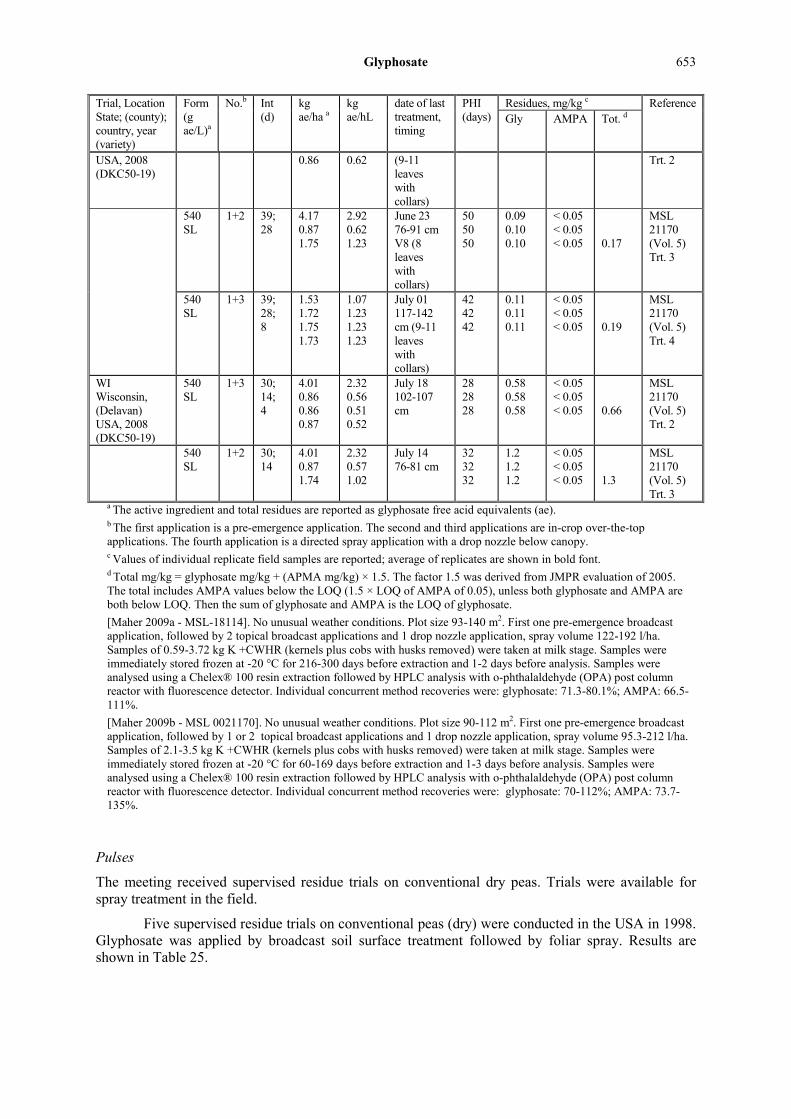
Glyphosate 653
Trial, Location State; (county); country, year (variety)
Form (g ae/L)a
No.b Int (d)
kg ae/ha a
kg ae/hL
date of last treatment, timing
PHI (days)
Residues, mg/kg c Reference Gly AMPA Tot. d
USA, 2008 (DKC50-19)
0.86 0.62 (9-11 leaves with collars)
Trt. 2
540 SL
1+2 39; 28
4.17 0.87 1.75
2.92 0.62 1.23
June 23 76-91 cm V8 (8 leaves with collars)
50 50 50
0.09 0.10 0.10
< 0.05 < 0.05 < 0.05
0.17
MSL 21170 (Vol. 5) Trt. 3
540 SL
1+3 39; 28; 8
1.53 1.72 1.75 1.73
1.07 1.23 1.23 1.23
July 01 117-142 cm (9-11 leaves with collars)
42 42 42
0.11 0.11 0.11
< 0.05 < 0.05 < 0.05
0.19
MSL 21170 (Vol. 5) Trt. 4
WI Wisconsin, (Delavan) USA, 2008 (DKC50-19)
540 SL
1+3 30; 14; 4
4.01 0.86 0.86 0.87
2.32 0.56 0.51 0.52
July 18 102-107 cm
28 28 28
0.58 0.58 0.58
< 0.05 < 0.05 < 0.05
0.66
MSL 21170 (Vol. 5) Trt. 2
540 SL
1+2 30; 14
4.01 0.87 1.74
2.32 0.57 1.02
July 14 76-81 cm
32 32 32
1.2 1.2 1.2
< 0.05 < 0.05 < 0.05
1.3
MSL 21170 (Vol. 5) Trt. 3
a The active ingredient and total residues are reported as glyphosate free acid equivalents (ae). b The first application is a pre-emergence application. The second and third applications are in-crop over-the-top applications. The fourth application is a directed spray application with a drop nozzle below canopy. c Values of individual replicate field samples are reported; average of replicates are shown in bold font. d Total mg/kg = glyphosate mg/kg + (APMA mg/kg) × 1.5. The factor 1.5 was derived from JMPR evaluation of 2005. The total includes AMPA values below the LOQ (1.5 × LOQ of AMPA of 0.05), unless both glyphosate and AMPA are both below LOQ. Then the sum of glyphosate and AMPA is the LOQ of glyphosate. [Maher 2009a - MSL-18114]. No unusual weather conditions. Plot size 93-140 m2. First one pre-emergence broadcast application, followed by 2 topical broadcast applications and 1 drop nozzle application, spray volume 122-192 l/ha. Samples of 0.59-3.72 kg K +CWHR (kernels plus cobs with husks removed) were taken at milk stage. Samples were immediately stored frozen at -20 °C for 216-300 days before extraction and 1-2 days before analysis. Samples were analysed using a Chelex® 100 resin extraction followed by HPLC analysis with o-phthalaldehyde (OPA) post column reactor with fluorescence detector. Individual concurrent method recoveries were: glyphosate: 71.3-80.1%; AMPA: 66.5-111%. [Maher 2009b - MSL 0021170]. No unusual weather conditions. Plot size 90-112 m2. First one pre-emergence broadcast application, followed by 1 or 2 topical broadcast applications and 1 drop nozzle application, spray volume 95.3-212 l/ha. Samples of 2.1-3.5 kg K +CWHR (kernels plus cobs with husks removed) were taken at milk stage. Samples were immediately stored frozen at -20 °C for 60-169 days before extraction and 1-3 days before analysis. Samples were analysed using a Chelex® 100 resin extraction followed by HPLC analysis with o-phthalaldehyde (OPA) post column reactor with fluorescence detector. Individual concurrent method recoveries were: glyphosate: 70-112%; AMPA: 73.7-135%.
Pulses
The meeting received supervised residue trials on conventional dry peas. Trials were available for spray treatment in the field.
Five supervised residue trials on conventional peas (dry) were conducted in the USA in 1998. Glyphosate was applied by broadcast soil surface treatment followed by foliar spray. Results are shown in Table 25.
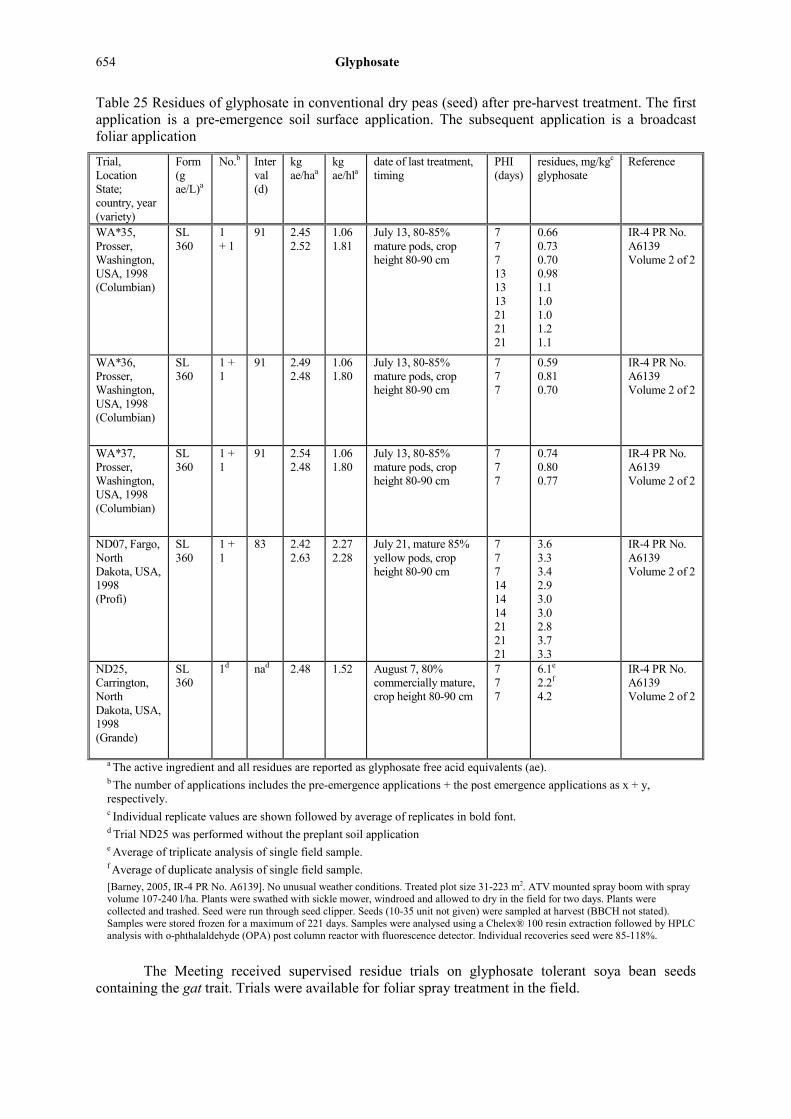
654 Glyphosate
Table 25 Residues of glyphosate in conventional dry peas (seed) after pre-harvest treatment. The first application is a pre-emergence soil surface application. The subsequent application is a broadcast foliar application
Trial, Location State; country, year (variety)
Form (g ae/L)a
No.b Inter val (d)
kg ae/haa
kg ae/hla
date of last treatment, timing
PHI (days)
residues, mg/kgc glyphosate
Reference
WA*35, Prosser, Washington, USA, 1998 (Columbian)
SL 360
1 + 1
91 2.45 2.52
1.06 1.81
July 13, 80-85% mature pods, crop height 80-90 cm
7 7 7 13 13 13 21 21 21
0.66 0.73 0.70 0.98 1.1 1.0 1.0 1.2 1.1
IR-4 PR No. A6139 Volume 2 of 2
WA*36, Prosser, Washington, USA, 1998 (Columbian)
SL 360
1 + 1
91 2.49 2.48
1.06 1.80
July 13, 80-85% mature pods, crop height 80-90 cm
7 7 7
0.59 0.81 0.70
IR-4 PR No. A6139 Volume 2 of 2
WA*37, Prosser, Washington, USA, 1998 (Columbian)
SL 360
1 + 1
91 2.54 2.48
1.06 1.80
July 13, 80-85% mature pods, crop height 80-90 cm
7 7 7
0.74 0.80 0.77
IR-4 PR No. A6139 Volume 2 of 2
ND07, Fargo, North Dakota, USA, 1998 (Profi)
SL 360
1 + 1
83 2.42 2.63
2.27 2.28
July 21, mature 85% yellow pods, crop height 80-90 cm
7 7 7 14 14 14 21 21 21
3.6 3.3 3.4 2.9 3.0 3.0 2.8 3.7 3.3
IR-4 PR No. A6139 Volume 2 of 2
ND25, Carrington, North Dakota, USA, 1998 (Grande)
SL 360
1d nad 2.48 1.52 August 7, 80% commercially mature, crop height 80-90 cm
7 7 7
6.1e
2.2f
4.2
IR-4 PR No. A6139 Volume 2 of 2
a The active ingredient and all residues are reported as glyphosate free acid equivalents (ae). b The number of applications includes the pre-emergence applications + the post emergence applications as x + y, respectively. c Individual replicate values are shown followed by average of replicates in bold font. d Trial ND25 was performed without the preplant soil application e Average of triplicate analysis of single field sample. f Average of duplicate analysis of single field sample. [Barney, 2005, IR-4 PR No. A6139]. No unusual weather conditions. Treated plot size 31-223 m2. ATV mounted spray boom with spray volume 107-240 l/ha. Plants were swathed with sickle mower, windroed and allowed to dry in the field for two days. Plants were collected and trashed. Seed were run through seed clipper. Seeds (10-35 unit not given) were sampled at harvest (BBCH not stated). Samples were stored frozen for a maximum of 221 days. Samples were analysed using a Chelex® 100 resin extraction followed by HPLC analysis with o-phthalaldehyde (OPA) post column reactor with fluorescence detector. Individual recoveries seed were 85-118%.
The Meeting received supervised residue trials on glyphosate tolerant soya bean seeds
containing the gat trait. Trials were available for foliar spray treatment in the field.
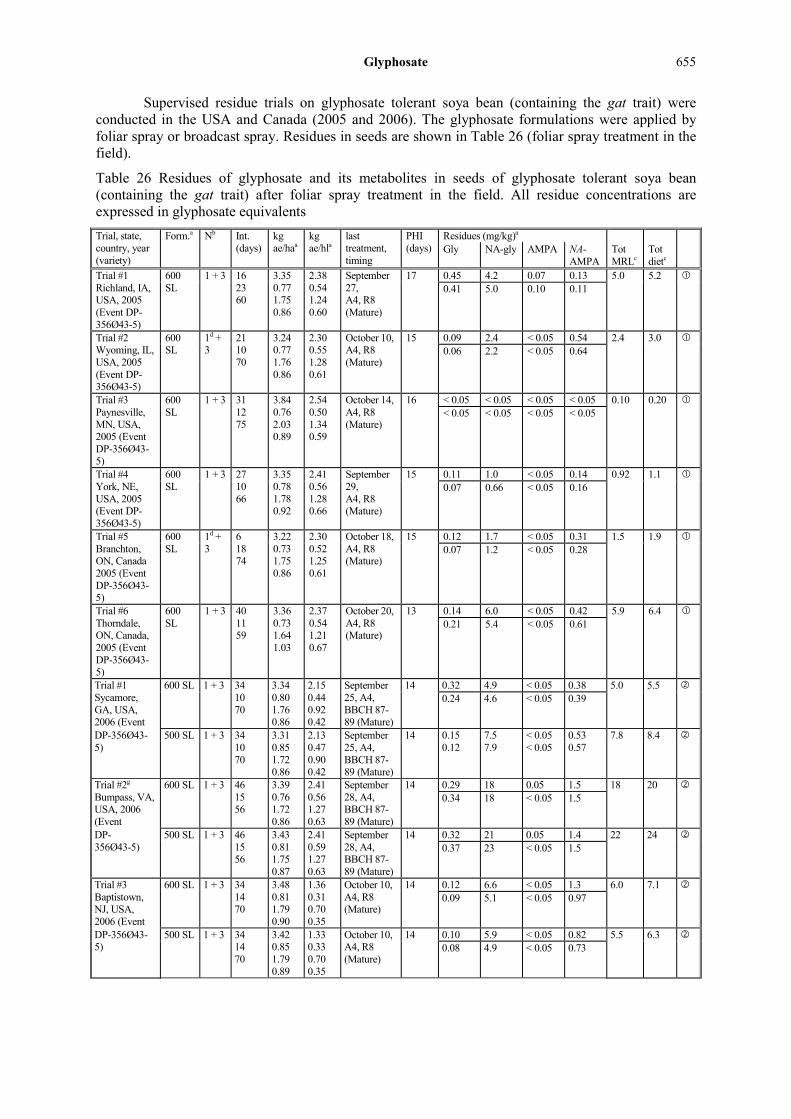
Glyphosate 655
Supervised residue trials on glyphosate tolerant soya bean (containing the gat trait) were conducted in the USA and Canada (2005 and 2006). The glyphosate formulations were applied by foliar spray or broadcast spray. Residues in seeds are shown in Table 26 (foliar spray treatment in the field).
Table 26 Residues of glyphosate and its metabolites in seeds of glyphosate tolerant soya bean (containing the gat trait) after foliar spray treatment in the field. All residue concentrations are expressed in glyphosate equivalents Trial, state, country, year (variety)
Form.a Nb Int. (days)
kg ae/haa
kg ae/hla
last treatment, timing
PHI (days)
Residues (mg/kg)a Gly NA-gly AMPA NA-
AMPA Tot MRLc
Tot dietc
Trial #1 Richland, IA, USA, 2005 (Event DP-356Ø43-5)
600 SL
1 + 3 16 23 60
3.35 0.77 1.75 0.86
2.38 0.54 1.24 0.60
September 27, A4, R8 (Mature)
17 0.45 4.2 0.07 0.13 5.0 5.2 0.41 5.0 0.10 0.11
Trial #2 Wyoming, IL, USA, 2005 (Event DP- 356Ø43-5)
600 SL
1d + 3
21 10 70
3.24 0.77 1.76 0.86
2.30 0.55 1.28 0.61
October 10, A4, R8 (Mature)
15 0.09 2.4 < 0.05 0.54 2.4 3.0 0.06 2.2 < 0.05 0.64
Trial #3 Paynesville, MN, USA, 2005 (Event DP-356Ø43-5)
600 SL
1 + 3 31 12 75
3.84 0.76 2.03 0.89
2.54 0.50 1.34 0.59
October 14, A4, R8 (Mature)
16 < 0.05 < 0.05 < 0.05 < 0.05 0.10 0.20 < 0.05 < 0.05 < 0.05 < 0.05
Trial #4 York, NE, USA, 2005 (Event DP- 356Ø43-5)
600 SL
1 + 3 27 10 66
3.35 0.78 1.78 0.92
2.41 0.56 1.28 0.66
September 29, A4, R8 (Mature)
15 0.11 1.0 < 0.05 0.14 0.92 1.1 0.07 0.66 < 0.05 0.16
Trial #5 Branchton, ON, Canada 2005 (Event DP-356Ø43-5)
600 SL
1d + 3
6 18 74
3.22 0.73 1.75 0.86
2.30 0.52 1.25 0.61
October 18, A4, R8 (Mature)
15 0.12 1.7 < 0.05 0.31 1.5 1.9 0.07 1.2 < 0.05 0.28
Trial #6 Thorndale, ON, Canada, 2005 (Event DP-356Ø43-5)
600 SL
1 + 3 40 11 59
3.36 0.73 1.64 1.03
2.37 0.54 1.21 0.67
October 20, A4, R8 (Mature)
13 0.14 6.0 < 0.05 0.42 5.9 6.4 0.21 5.4 < 0.05 0.61
Trial #1 Sycamore, GA, USA, 2006 (Event
600 SL 1 + 3 34 10 70
3.34 0.80 1.76 0.86
2.15 0.44 0.92 0.42
September 25, A4, BBCH 87-89 (Mature)
14 0.32 4.9 < 0.05 0.38 5.0 5.5 0.24 4.6 < 0.05 0.39
DP-356Ø43- 5)
500 SL 1 + 3 34 10 70
3.31 0.85 1.72 0.86
2.13 0.47 0.90 0.42
September 25, A4, BBCH 87-89 (Mature)
14 0.15 7.5 < 0.05 0.53 7.8 8.4 0.12 7.9 < 0.05 0.57
Trial #2g
Bumpass, VA, USA, 2006 (Event
600 SL 1 + 3 46 15 56
3.39 0.76 1.72 0.86
2.41 0.56 1.27 0.63
September 28, A4, BBCH 87-89 (Mature)
14 0.29 18 0.05 1.5 18 20 0.34 18 < 0.05 1.5
DP- 356Ø43-5)
500 SL 1 + 3 46 15 56
3.43 0.81 1.75 0.87
2.41 0.59 1.27 0.63
September 28, A4, BBCH 87-89 (Mature)
14 0.32 21 0.05 1.4 22 24 0.37 23 < 0.05 1.5
Trial #3 Baptistown, NJ, USA, 2006 (Event
600 SL 1 + 3 34 14 70
3.48 0.81 1.79 0.90
1.36 0.31 0.70 0.35
October 10, A4, R8 (Mature)
14 0.12 6.6 < 0.05 1.3 6.0 7.1 0.09 5.1 < 0.05 0.97
DP-356Ø43- 5)
500 SL 1 + 3 34 14 70
3.42 0.85 1.79 0.89
1.33 0.33 0.70 0.35
October 10, A4, R8 (Mature)
14 0.10 5.9 < 0.05 0.82 5.5 6.3 0.08 4.9 < 0.05 0.73

656 Glyphosate
Trial, state, country, year (variety)
Form.a Nb Int. (days)
kg ae/haa
kg ae/hla
last treatment, timing
PHI (days)
Residues (mg/kg)a Gly NA-gly AMPA NA-
AMPA Tot MRLc
Tot dietc
Trial #4 Cheneyville, LA, USA, 2006 (Event
600 SL
1+3 28 14 54
3.32 0.81 1.72 0.88
2.02 0.49 1.02 0.39
September 25, A4, R7 to R8
14 0.94f 1.6f 0.08f 0.28f 2.6 3.0 1.1 1.6 0.08 0.27
DP-356Ø43-5)
500 SL
1+3 28 14 54
3.38 0.81 1.76 0.88
2.06 0.49 1.04 0.39
September 25, A4, R7 to R8
14 1.7 4.0 0.07 0.36 5.0 5.5 1.8 2.6 0.10 0.31
Trial #5 Washington, LA, USA, 2006 (Event
600 SL
1+3 18 14 55
3.33 0.80 1.79 0.90
2.30 0.52 1.17 0.56
September 7, A4, R5 (Mature)
14 0.25f 0.59f 0.15f 0.15f 0.92 1.2 0.32f 0.69f 0.12f 0.13f
DP-356Ø43-5)
500 SL
1+3 18 14 55
3.35 0.82 1.71 0.90
2.32 0.54 1.12 0.56
September 7, A4, R5 (Mature)
14 0.75 0.98 0.16 0.13 1.7 2.0 0.86 0.90 0.16 0.12
Trial #6 Washington, LA, USA,
600 SL
1+3 18 14 55
3.37 0.81 1.71 0.88
2.34 0.53 1.12 0.56
September 7, A4, R5 (Mature)
14 0.20f 0.52f 0.14f 0.13f 0.76 1.0 0.20f 0.61f 0.12f 0.11f
2006 (Event DP-356Ø43-5)
500 SL 1 + 3 18 14 55
3.35 0.81 1.76 0.91
2.32 0.53 1.15 0.57
September 7 2006, A4, R5 (Mature)
14 0.64 1.1 0.10 0.14 1.8 2.1 0.62 1.3 0.15 0.14
Trial #7 Newport, AR, USA, 2006 (Event DP-
600 SL 1 + 3 15 11 74
3.33 0.77 1.74 0.89
1.78 0.41 0.93 0.48
September 15, A4, R5 (Mature)
17 0.17 2.7 0.07 0.12 3.1 3.3 0.19 3.2 0.08 0.13
356Ø43-5) 500 SL 1 + 3 15 11 74
3.35 0.82 1.75 0.89
1.79 0.44 0.93 0.47
September 15, A4, R5 (Mature)
17 0.17 2.7 0.05 0.09 2.8 2.9 0.15 2.5 0.05 0.08
Trial #9 Carlyle, IL, USA, 2006
600 SL
1+3 28 17 65
3.38 0.79 1.75 0.89
2.44 0.62 1.34 0.37
September 25, A4, R5 (Mature)
12 0.08 3.7 < 0.05 1.1 4.1 5.2 0.07 4.3 < 0.05 1.1
(Event DP- 356Ø43-5)
500 SL
1+3 28 17 65
3.34 0.84 1.79 0.86
2.41 0.54 1.04 0.36
September 25, A4, R5 (Mature)
12 0.29 5.6 < 0.05 0.88 5.8 6.7 0.22 5.4 < 0.05 0.88
Trial #11 Richland, IA, USA, 2006
600 SL
1+3 16 19 75
3.38 0.78 1.74 0.90
2.32 0.53 1.17 0.52
October 2, A4, R5 (Mature)
15 0.06 1.0 < 0.05 0.23 1.1 1.4 0.14 1.0 < 0.05 0.23
(Event DP- 356Ø43-5)
500 SL
1+3 16 19 75
3.35 0.83 1.80 0.89
2.30 0.56 1.22 0.52
October 2, A4, R5 (Mature)
15 0.10 0.98 < 0.05 0.16 1.2 1.4 0.21 1.1 < 0.05 0.16
Trial #12 Richland, IA, USA, 2006
600 SL
1+3 12 22 82
3.40 0.77 1.75 0.88
2.29 0.52 1.20 0.52
October 12, A4, R5 (Mature)
13 < 0.05 0.38 < 0.05 0.16 0.42 0.63 0.05 0.36 < 0.05 0.16
(Event DP- 356Ø43-5)
500 SL
1+3 12 22 82
3.29 0.83 1.73 0.88
2.21 0.56 1.19 0.51
October 12, A4, R5 (Mature)
13 < 0.05 0.49 < 0.05 0.14 0.49 0.67 < 0.05 0.39 < 0.05 0.11
Trial #14i
Paynesville, MN, USA, 2006 (Event
600 SL
1+3 26 26 91
3.92 0.80 2.02 0.97
2.62 0.54 1.36 0.66
October 21, A4, R5 (Mature)
14 2.0 < 0.05 < 0.05 < 0.05 1.7 1.8 1.3 < 0.05 < 0.05 < 0.05
DP-356Ø43-5)
500 SL
1+3 26 26 91
4.48 1.25 2.40 1.21
3.00 0.84 1.61 0.81
October 21, A4, R5 (Mature)
14 1.4 < 0.05 < 0.05 < 0.05 1.1 1.2 0.70 < 0.05 < 0.05 < 0.05

Glyphosate 657
Trial, state, country, year (variety)
Form.a Nb Int. (days)
kg ae/haa
kg ae/hla
last treatment, timing
PHI (days)
Residues (mg/kg)a Gly NA-gly AMPA NA-
AMPA Tot MRLc
Tot dietc
Trial #16 York, NE, USA, 2006 (Event DP-
600 SL
1+3 28 13 71
3.36 0.79 1.76 0.87
2.43 0.58 1.26 0.62
September 29, A4, R5 (Mature)
14 < 0.05 0.86 < 0.05 0.23 0.75 0.99 0.06 0.53 < 0.05 0.15
356Ø43-5) 500 SL
1+3 28 13 71
3.32 0.82 1.74 0.87
2.40 0.60 1.25 0.63
September 29, A4, R5 (Mature)
14 0.08 0.88 < 0.05 0.18 0.89 1.1 0.09 0.73 < 0.05 0.15
Trial #19 Rochelle, IL, USA, 2006 (Event DP-
600 SL
1+3 38 14 75
3.27 0.77 1.75 0.88
7.02e
1.66e
3.61e
1.89e
October 10 2006, A4, R5 (Mature)
14 < 0.05 1.5 < 0.05 0.29 1.6 2.0 < 0.05 1.6 < 0.05 0.32
356Ø43-5) 500 SL
1+3 38 14 75
3.34 0.82 1.76 0.88
7.16e
1.76e
3.64e
1.89e
October 10, A4, R5 (Mature)
14 < 0.05 1.6 < 0.05 0.24 1.7 2.0 < 0.05 1.7 < 0.05 0.24
Trial #20 Ellendale, MN, USA,
600 SL
1+3 28 12 91
3.39 0.77 1.74 0.87
2.19 0.50 1.09 0.53
October 9, A4, R5 (Mature)
13 < 0.05 0.31 < 0.05 0.08 0.34 0.46 < 0.05 0.26 < 0.05 0.07
2006 (Event DP-356Ø43-5)
500 SL
1+3 28 12 91
3.39 0.83 1.75 0.87
2.19 0.54 1.10 0.53
October 9, A4, R5 (Mature)
13 < 0.05 0.18 < 0.05 < 0.05 0.23 0.33 < 0.05 0.18 < 0.05 < 0.05
Trial #22 Branchton, ON, Canada,
600 SL
1+3 29 14 75
3.36 0.78 1.80 0.84
1.70 0.39 0.90 0.42
October 15, A4, R5 (Mature)
11 0.08 2.4 < 0.05 0.49 2.4 3.0 0.09 2.3 < 0.05 0.46
2006 (Event DP-356Ø43-5)
500 SL
1+3 29 14 75
3.33 0.85 1.84 0.84
1.68 0.42 0.92 0.42
October 15 2006, A4, R5 (Mature)
11 0.12 1.5 < 0.05 0.25 1.8 2.1 0.09 1.9 < 0.05 0.32
Trial #23 Springford, ON, Canada,
600 SL
1+3 37 14 74
3.34 0.71 1.76 0.85
1.67 0.36 0.88 0.43
October 15, A4, R7 (Mature)
11 0.09 0.63 < 0.05 0.09 0.69 0.82 0.09 0.56 < 0.05 0.08
2006 (Event DP-356Ø43-5)
500 SL
1+3 37 14 74
3.27 0.76 1.79 0.86
1.63 0.38 0.90 0.43
October 15, A4, R7 (Mature)
11 0.09 0.62 < 0.05 0.06 0.69 0.80
0.08 0.59 < 0.05 0.06 Trial #24 Thorndale, ON, Canada, 2006
600 SL
1+3 39 7 92
3.30 0.77 1.72 0.89
2.38 0.55 1.23 0.63
November 1, A4, (Mature)
14 0.06 3.0 < 0.05 0.42 2.9 3.4 < 0.05 2.7 < 0.05 0.40
(Event DP-356Ø43-5)
500 SL
1+3 39 7 92
3.30 0.85 1.76 0.88
2.38 0.61 1.28 0.63
November 1, A4, (Mature)
14 < 0.05 3.2 < 0.05 0.28 3.1 3.4 0.06 2.9 < 0.05 0.25
a Gly = glyphosate, NA-Gly = N-acetylglyphosate, NA-AMPA = N-acetyl AMPA. The active ingredient and all residues are reported as glyphosate free acid equivalents (ae). Ammonium sulfate (AMS) was also included as a product enhancer. b The number of applications includes the pre-emergence applications + the post emergence applications as x + y, respectively. c For purposes of calculating total mean residue for MRL setting (Tot MRL), the mean of the sums of glyphosate and N-acetylglyphosate is reported, while for calculating the total for dietary intake estimation (Tot diet) the mean of the sums of glyphosate, N-acetylglyphosate, AMPA and N-acetyl AMPA is reported. Residues reported as nd or with a reported value below LOQ have been assigned the value < 0.05 mg/kg, because lower residue concentrations were not validated. For calculation purpose the value of 0.05 mg/kg was used. d The application targeted at pre-emergence (Appl A1) was actually made after the soya bean plants had emerged at 2005 Trials #2 and #5. e This test site experienced plant damage associated with Hurricane Ernesto and excessive rainfall that occurred from late August through to mid-October (harvest of soya bean seed). However, since sample sizes are sufficiently large it is unclear how excessive rainfall results in higher residue levels than expected for N-acetylglyphosate residue and comparable residue levels for the other metabolites as compared to the other field trials. f Average of duplicate analyses of single field sample. g All application rates with the 600 SL formulation were approximately 14% above the maximum target label application rate and with the 500 SL formulation approximately 36% above the maximum target label application rates.

658 Glyphosate
[Buffington, 2006, DuPont PHI-2005-056/030 and Schwartz, 2007b, PHI-2007-102]. DuPont Study PHI-2005-056/030 describes the conduct of the field trials and the analytical results for gly, NA-gly, and AMPA residues. In DuPont Study PHI 2007-102, these samples were reanalysed to determine residues of N-acetyl AMPA. This report (PHI-2007-102) includes all residue data as reported in study PHI-2005-056/030 and adds residue data for N-acetyl AMPA. No unusual weather conditions. Plot size was not reported. First one pre-emergence broadcast application, followed by 3 foliar broadcast applications by back pack sprayer, tractor mounted sprayer or hand boom. Spray volume 135-153 l/ha. Samples of approximately 1 kg of treated seeds and 2 kg of untreated seeds were collected at normal harvest. Seeds at mature stage were threshed from the plants in the field. Samples were immediately stored frozen at -20 °C for 127-228 days before extraction for Gly, NA-Gly and AMPA (PHI-2005-056/030) and 595-673 days for NA-AMPA (PHI-2007-102). Samples were analysed using analytical method DuPont-15444 using extraction with formic acid and methanol and LC/MS/MS detection. Individual concurrent method recoveries were glyphosate: 71-95%, N-acetylglyphosate: 72-96%, AMPA: 64-111% (mean = 82% ± 19%), and N-acetyl AMPA: 86-107%. [Shepard, 2007a, DuPont 20123 - PHI-2006-044]. In six of the 24 field trial sites of this study no Glyphosate was applied (#8, 10, 13, 17, 18 and 21). In trial #15 no seeds were analysed. These trials were not included. No unusual weather conditions. Plot size ranged from 40-446 m2. First one pre-emergence broadcast application, followed by 3 foliar broadcast applications by back pack sprayer, tractor mounted sprayer or hand boom. Spray volume 131-253 l/ha, apart from trial #19 where 46.7 l/ha was applied to simulate aerial application). Samples of 1-2.92 kg seeds were collected at normal harvest. Seeds were threshed from the plants in the field and immediately stored frozen at -20 °C for 38-219 days before analysis. Samples were analysed using analytical method DuPont-15444 using extraction with formic acid and methanol and LC/MS/MS detection. Individual concurrent method recoveries in seed were Glyphosate: 72-111% (mean =85 ± 9%, n = 19); N-acetylglyphosate: 65-95% (mean = 80 ± 7%, n = 20); AMPA: 60-95% (mean = 78 ±9%, n = 21) and N-acetyl AMPA: 66-105% (mean = 87 ± 11%, n = 19)). Several recoveries were below 70%, however 80% or more of the individual recoveries ranged between 70-120% and the SD ≤20%.
Root and tuber vegetables
The Meeting received supervised residue trials on glyphosate tolerant sugar beet genetically modified to contain the EPSPS trait and to be tolerant of glyphosate. Trials were available for foliar spray treatment in the field.
Supervised residue trials on glyphosate tolerant sugar beets were conducted in three studies in the USA (2004 and 2006) and Canada (2004). Results are shown in Table 27 (foliar spray treatment in the field).
Table 27 Residues of glyphosate in sugar beet roots after pre-harvest treatment. The first application is a pre-emergence application. Subsequent applications are in-crop over-the-top applications Trial, Location State; country, year (variety)
Form (g ae/L)a
No.b Int. (d)
kg ae/haa
kg ae/hla
date of last treatment, timing
PHIc residues, mg/kga
Reference
Glyd AMPAd Tot.e AL-1 Fort Saskatchewan, Alberta Canada, 2004 (Event H7-1)
SL 360
4 19; 21; 29
0.91 0.93 0.93 0.90
1.2 1.1 1.1 1.1
September 01, 30 days after the 12-14 leaf stage
28 28 28
3.2 3.0 3.1
0.05 0.06 0.06
3.1
MSL 19260 Volume 1
AL-2 Taber, Alberta Canada, 2004 (Event H7-1)
SL 360
4 14; 26; 30
0.96 0.99 0.90 0.89
0.94 0.95 1.0 1.0
August 13, 30 days after the 12-14 leaf stage
31 31 31 63 63 63
6.0 5.3 5.7 4.1 3.8 4.0
0.11 0.10 0.11 0.10 0.09 0.10
5.8 4.1
MSL 19260 Volume 1
AL-3 Bow Island, Alberta Canada, 2004 (Event H7-1)
SL 360
4 14; 17; 30
1.02 0.89 0.90f
0.90
0.95 0.95 1.0f 0.95
August 18, 30 days after the 12-14 leaf stage
29 29 29 59 59 59
3.3 3.6 3.5 3.3 3.2 3.3
0.05 0.07 0.06 0.09 0.09 0.09
3.5 3.4
MSL 19260 Volume 1
SL 360
5 14; 17; 30; 9
1.02 0.89 0.90g
0.90 0.90
0.95 0.95 1.0g 0.95 0.96
August 27, 39 days after the 12-14 leaf stage
32 32 32 50 50 50
7.4 7.6 7.5 7.0 5.8 6.4
0.12 0.12 0.12 0.14 0.12 0.13
7.7 6.6
MSL 19260 Volume 1 Repeated 4th appl.g
MB Brookdale, Manitoba
SL 360
4 14; 17; 32
0.97 0.93 0.91
0.90 0.89 0.89
August 27, 30 days after the
31 31 31
7.1 7.0 7.1
0.15 0.14 0.14
7.3
MSL 19260 Volume 1
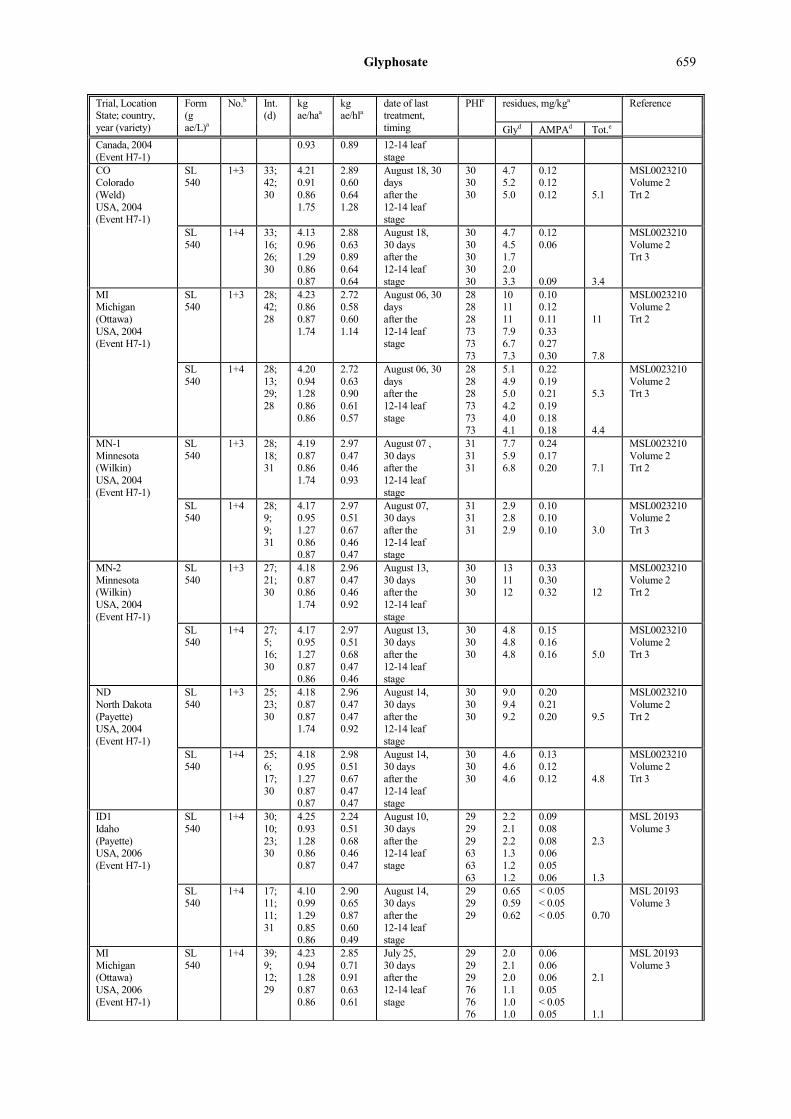
Glyphosate 659
Trial, Location State; country, year (variety)
Form (g ae/L)a
No.b Int. (d)
kg ae/haa
kg ae/hla
date of last treatment, timing
PHIc residues, mg/kga
Reference
Glyd AMPAd Tot.e Canada, 2004 (Event H7-1)
0.93 0.89 12-14 leaf stage
CO Colorado (Weld) USA, 2004 (Event H7-1)
SL 540
1+3 33; 42; 30
4.21 0.91 0.86 1.75
2.89 0.60 0.64 1.28
August 18, 30 days after the 12-14 leaf stage
30 30 30
4.7 5.2 5.0
0.12 0.12 0.12
5.1
MSL0023210 Volume 2 Trt 2
SL 540
1+4 33; 16; 26; 30
4.13 0.96 1.29 0.86 0.87
2.88 0.63 0.89 0.64 0.64
August 18, 30 days after the 12-14 leaf stage
30 30 30 30 30
4.7 4.5 1.7 2.0 3.3
0.12 0.06 0.09
3.4
MSL0023210 Volume 2 Trt 3
MI Michigan (Ottawa) USA, 2004 (Event H7-1)
SL 540
1+3 28; 42; 28
4.23 0.86 0.87 1.74
2.72 0.58 0.60 1.14
August 06, 30 days after the 12-14 leaf stage
28 28 28 73 73 73
10 11 11 7.9 6.7 7.3
0.10 0.12 0.11 0.33 0.27 0.30
11 7.8
MSL0023210 Volume 2 Trt 2
SL 540
1+4 28; 13; 29; 28
4.20 0.94 1.28 0.86 0.86
2.72 0.63 0.90 0.61 0.57
August 06, 30 days after the 12-14 leaf stage
28 28 28 73 73 73
5.1 4.9 5.0 4.2 4.0 4.1
0.22 0.19 0.21 0.19 0.18 0.18
5.3 4.4
MSL0023210 Volume 2 Trt 3
MN-1 Minnesota (Wilkin) USA, 2004 (Event H7-1)
SL 540
1+3 28; 18; 31
4.19 0.87 0.86 1.74
2.97 0.47 0.46 0.93
August 07 , 30 days after the 12-14 leaf stage
31 31 31
7.7 5.9 6.8
0.24 0.17 0.20
7.1
MSL0023210 Volume 2 Trt 2
SL 540
1+4 28; 9; 9; 31
4.17 0.95 1.27 0.86 0.87
2.97 0.51 0.67 0.46 0.47
August 07, 30 days after the 12-14 leaf stage
31 31 31
2.9 2.8 2.9
0.10 0.10 0.10
3.0
MSL0023210 Volume 2 Trt 3
MN-2 Minnesota (Wilkin) USA, 2004 (Event H7-1)
SL 540
1+3 27; 21; 30
4.18 0.87 0.86 1.74
2.96 0.47 0.46 0.92
August 13, 30 days after the 12-14 leaf stage
30 30 30
13 11 12
0.33 0.30 0.32
12
MSL0023210 Volume 2 Trt 2
SL 540
1+4 27; 5; 16; 30
4.17 0.95 1.27 0.87 0.86
2.97 0.51 0.68 0.47 0.46
August 13, 30 days after the 12-14 leaf stage
30 30 30
4.8 4.8 4.8
0.15 0.16 0.16
5.0
MSL0023210 Volume 2 Trt 3
ND North Dakota (Payette) USA, 2004 (Event H7-1)
SL 540
1+3 25; 23; 30
4.18 0.87 0.87 1.74
2.96 0.47 0.47 0.92
August 14, 30 days after the 12-14 leaf stage
30 30 30
9.0 9.4 9.2
0.20 0.21 0.20
9.5
MSL0023210 Volume 2 Trt 2
SL 540
1+4 25; 6; 17; 30
4.18 0.95 1.27 0.87 0.87
2.98 0.51 0.67 0.47 0.47
August 14, 30 days after the 12-14 leaf stage
30 30 30
4.6 4.6 4.6
0.13 0.12 0.12
4.8
MSL0023210 Volume 2 Trt 3
ID1 Idaho (Payette) USA, 2006 (Event H7-1)
SL 540
1+4 30; 10; 23; 30
4.25 0.93 1.28 0.86 0.87
2.24 0.51 0.68 0.46 0.47
August 10, 30 days after the 12-14 leaf stage
29 29 29 63 63 63
2.2 2.1 2.2 1.3 1.2 1.2
0.09 0.08 0.08 0.06 0.05 0.06
2.3 1.3
MSL 20193 Volume 3
SL 540
1+4 17; 11; 11; 31
4.10 0.99 1.29 0.85 0.86
2.90 0.65 0.87 0.60 0.49
August 14, 30 days after the 12-14 leaf stage
29 29 29
0.65 0.59 0.62
< 0.05 < 0.05 < 0.05
0.70
MSL 20193 Volume 3
MI Michigan (Ottawa) USA, 2006 (Event H7-1)
SL 540
1+4 39; 9; 12; 29
4.23 0.94 1.28 0.87 0.86
2.85 0.71 0.91 0.63 0.61
July 25, 30 days after the 12-14 leaf stage
29 29 29 76 76 76
2.0 2.1 2.0 1.1 1.0 1.0
0.06 0.06 0.06 0.05 < 0.05 0.05
2.1 1.1
MSL 20193 Volume 3

660 Glyphosate
Trial, Location State; country, year (variety)
Form (g ae/L)a
No.b Int. (d)
kg ae/haa
kg ae/hla
date of last treatment, timing
PHIc residues, mg/kga
Reference
Glyd AMPAd Tot.e SL
540 1+4 25;
10; 10; 31
4.17 0.95 1.27 0.87 0.87
2.23 0.51 0.68 0.47 0.47
August 14, 30 days after the 12-14 leaf stage
30 30 30
3.3 3.2 3.2
0.12 0.11 0.12
3.4
MSL 20193 Volume 3
MN2 Minnesota (Ottertail) USA, 2006 (Event H7-1)
SL 540
1+4 19; 12; 16; 30
4.19 0.95 1.27 0.87 0.87
2.98 0.51 0.68 0.47 0.47
August 23, 30 days after the 12-14 leaf stage
29 29 29
2.9 2.3 2.6
0.08 0.06 0.07
2.7
MSL 20193 Volume 3
ND North Dakota (Richland) USA, 2006 (Event H7-1)
SL 540
1+4 25; 10; 10; 31
4.17 0.95 1.27 0.87 0.87
2.23 0.51 0.68 0.47 0.47
August 15, 30 days after the 12-14 leaf stage
31 31 31
5.6 5.4 5.5
0.19 0.18 0.18
5.8
MSL 20193 Volume 3
NE Nebraska (Hall) USA, 2006 (Event H7-1)
SL 540
1+4 35; 12; 13; 30
4.17 0.93 1.28 0.86 0.87
2.24 0.51 0.69 0.47 0.47
July 13, 30 days after the 12-14 leaf stage
29 29 29 83 83 83
0.80 1.0 0.90 0.64 0.54 0.59
< 0.05 < 0.05 < 0.05 < 0.05 < 0.05 < 0.05
0.98 0.66
MSL 20193 Volume 3
Gly = glyphosate. a The active ingredient and total residues are reported as glyphosate free acid equivalents (ae). b The number of applications includes the pre-emergence applications + the post emergence applications as x + y, respectively. A single number indicates only over-the-top applications c The harvest data is shown for the primary harvest, about 30 days after the last application. If the trial was located in a region where there was an extended harvest period, an auxiliary sample was taken at a later date. d Individual replicate values are shown followed by average of replicates are shown in bold font. e Total mg/kg = glyphosate mg/kg + APMA mg/kg × 1.5 as proposed in the JMPR evaluation of 2005. The total includes AMPA values below the LOQ. f At Al3 pass time was not recorded by the field cooperator for the 3rd application. Calibrated l/ha value for this application is shown and was used to calculate the kg a.i./hL value. g At AL3 half the treated plot received a repeat 4th application due to inadvertent irrigation 30 minutes after the initial application. Sampled were taken from both halves of the plot and analysed separately. [Bleeke 2005, MSL 19260]. No unusual weather conditions. Treated plot size 54.4-90 m2. Tractor mounted sprayer with spray volume 78.5-108 l/ha. Roots (12 units, >2 kg) were sampled at harvest (BBCH not stated). Samples were stored at -20 °C for a maximum of 45-95 days. Samples were analysed using a Chelex® 100 resin extraction followed by HPLC analysis with PCR system and fluorescence detection. Average concurrent method recoveries were roots: glyphosate: 82.2-95.4%; AMPA: 75.8-92.7% [Bleeke 2005, MSL 0023210]. No unusual weather conditions. Treated plot size 93 m2. Back-back or tractor mounted sprayer with spray volume 135-188 l/ha. Roots (3.3-7.8 kg) were sampled at harvest (BBCH not stated). Samples were stored at -20 °C for a maximum of 84-143 days. Samples were analysed using a Chelex® 100 resin extraction followed by HPLC analysis with PCR system and fluorescence detection. Average concurrent method recoveries were roots: glyphosate: 70.8-93.8%, with an average of 83.1%; AMPA: 68.0-94.2% with an average of 80.3%. [Maher 2007, MSL 20193]. No unusual weather conditions. Treated plot size 93-149 m2. Tractor mounted or back-pack broadcast sprayer (one soils spray followed by foliar spray) with spray volume 133-190 l/ha. Roots (12 units or 2.7-13 kg) were sampled at harvest (BBCH not stated). Samples were stored at -20 °C for a maximum of 105-174 days (roots). Samples were analysed using a Chelex® 100 resin extraction followed by HPLC analysis with PCR system and fluorescence detection. Average concurrent method recoveries were roots: glyphosate: 75.5-87.7%; AMPA: 73.8-88.2%.
Cereal grains
Supervised residue trials were available for glyphosate tolerant maize (cereal grains). Trials were conducted with 600 and 500 g/L formulations on maize genetically modified to contain the gat trait. The trials were conducted in Canada (2006) and the USA (2005 and 2006) using broadcast spraying or foliar spraying. The results for maize grain are shown in Table 28 below.
Table 28 Residues of glyphosate in maize (grain) with gat trait after pre-harvest treatment. The first application is a pre-emergence application. Subsequent applications are in-crop over-the-top
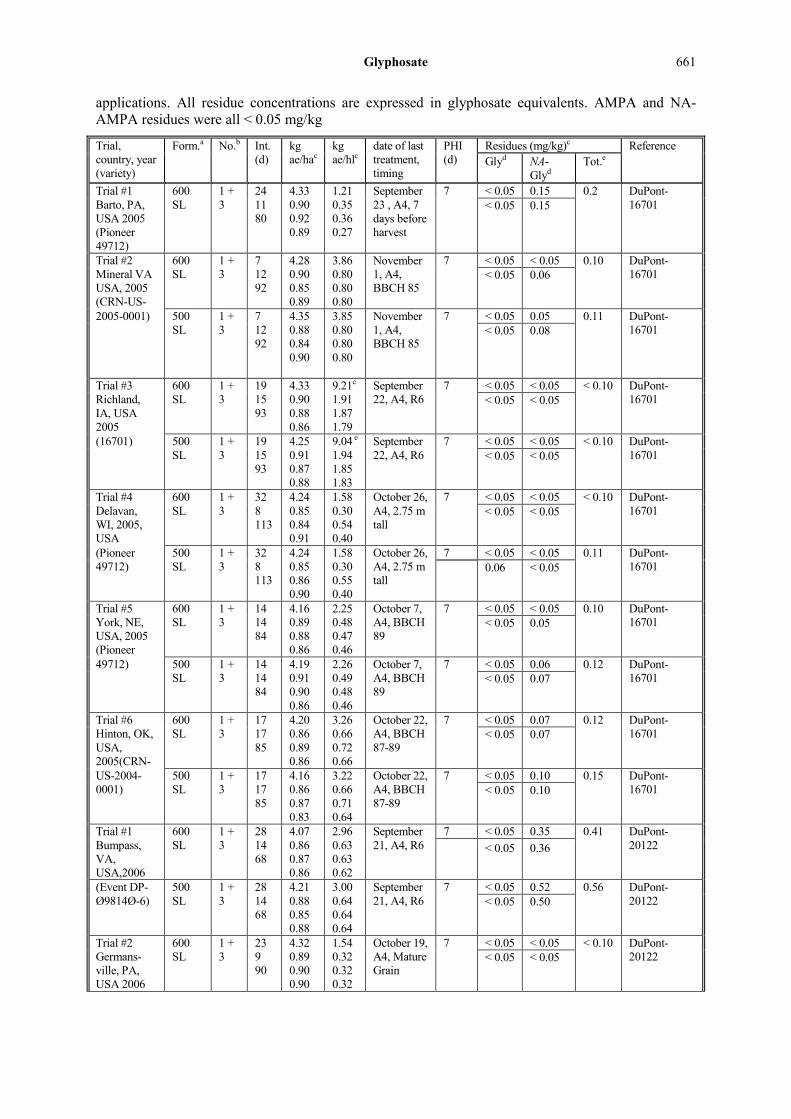
Glyphosate 661
applications. All residue concentrations are expressed in glyphosate equivalents. AMPA and NA-AMPA residues were all < 0.05 mg/kg
Trial, country, year (variety)
Form.a
No.b Int.
(d) kg ae/hac
kg ae/hlc
date of last treatment, timing
PHI (d)
Residues (mg/kg)c Reference Glyd NA-
Glyd Tot.e
Trial #1 Barto, PA, USA 2005 (Pioneer 49712)
600 SL
1 + 3
24 11 80
4.33 0.90 0.92 0.89
1.21 0.35 0.36 0.27
September 23 , A4, 7 days before harvest
7 < 0.05 0.15 0.2 DuPont-16701 < 0.05 0.15
Trial #2 Mineral VA USA, 2005 (CRN-US-
600 SL
1 + 3
7 12 92
4.28 0.90 0.85 0.89
3.86 0.80 0.80 0.80
November 1, A4, BBCH 85
7 < 0.05 < 0.05 0.10 DuPont-16701 < 0.05 0.06
2005-0001) 500 SL
1 + 3
7 12 92
4.35 0.88 0.84 0.90
3.85 0.80 0.80 0.80
November 1, A4, BBCH 85
7 < 0.05 0.05 0.11 DuPont-16701 < 0.05 0.08
Trial #3 Richland, IA, USA 2005
600 SL
1 + 3
19 15 93
4.33 0.90 0.88 0.86
9.21e
1.91 1.87 1.79
September 22, A4, R6
7 < 0.05 < 0.05 < 0.10 DuPont-16701 < 0.05 < 0.05
(16701) 500 SL
1 + 3
19 15 93
4.25 0.91 0.87 0.88
9.04 e 1.94 1.85 1.83
September 22, A4, R6
7 < 0.05 < 0.05 < 0.10 DuPont-16701 < 0.05 < 0.05
Trial #4 Delavan, WI, 2005, USA
600 SL
1 + 3
32 8 113
4.24 0.85 0.84 0.91
1.58 0.30 0.54 0.40
October 26, A4, 2.75 m tall
7 < 0.05 < 0.05 < 0.10 DuPont-16701
< 0.05 < 0.05
(Pioneer 49712)
500 SL
1 + 3
32 8 113
4.24 0.85 0.86 0.90
1.58 0.30 0.55 0.40
October 26, A4, 2.75 m tall
7 < 0.05 < 0.05 0.11 DuPont-16701
0.06 < 0.05
Trial #5 York, NE, USA, 2005 (Pioneer
600 SL
1 + 3
14 14 84
4.16 0.89 0.88 0.86
2.25 0.48 0.47 0.46
October 7, A4, BBCH 89
7 < 0.05 < 0.05 0.10 DuPont-16701 < 0.05 0.05
49712) 500 SL
1 + 3
14 14 84
4.19 0.91 0.90 0.86
2.26 0.49 0.48 0.46
October 7, A4, BBCH 89
7 < 0.05 0.06 0.12 DuPont-16701 < 0.05 0.07
Trial #6 Hinton, OK, USA, 2005(CRN-
600 SL
1 + 3
17 17 85
4.20 0.86 0.89 0.86
3.26 0.66 0.72 0.66
October 22, A4, BBCH 87-89
7 < 0.05 0.07 0.12 DuPont-16701 < 0.05 0.07
US-2004-0001)
500 SL
1 + 3
17 17 85
4.16 0.86 0.87 0.83
3.22 0.66 0.71 0.64
October 22, A4, BBCH 87-89
7 < 0.05 0.10 0.15 DuPont-16701 < 0.05 0.10
Trial #1 Bumpass, VA, USA,2006
600 SL
1 + 3
28 14 68
4.07 0.86 0.87 0.86
2.96 0.63 0.63 0.62
September 21, A4, R6
7 < 0.05 0.35 0.41 DuPont-20122 < 0.05 0.36
(Event DP-Ø9814Ø-6)
500 SL
1 + 3
28 14 68
4.21 0.88 0.85 0.88
3.00 0.64 0.64 0.64
September 21, A4, R6
7 < 0.05 0.52 0.56 DuPont-20122 < 0.05 0.50
Trial #2 Germans-ville, PA, USA 2006
600 SL
1 + 3
23 9 90
4.32 0.89 0.90 0.90
1.54 0.32 0.32 0.32
October 19, A4, Mature Grain
7 < 0.05 < 0.05 < 0.10 DuPont-20122 < 0.05 < 0.05
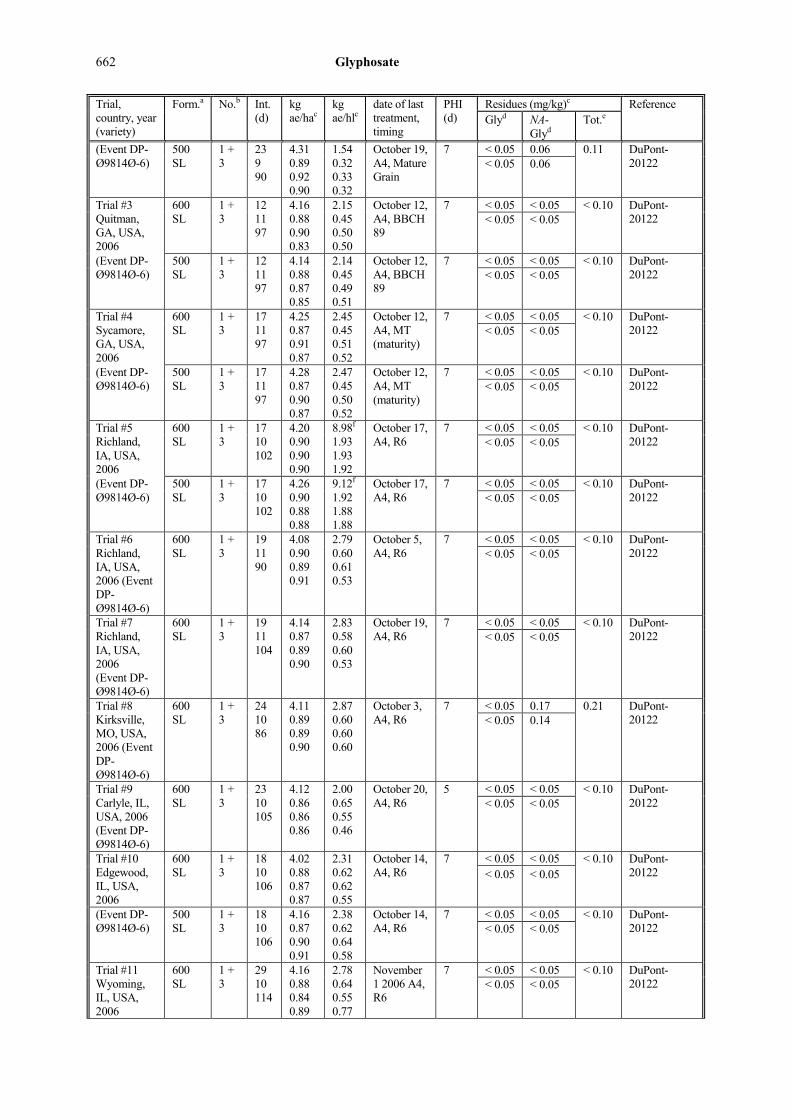
662 Glyphosate
Trial, country, year (variety)
Form.a
No.b Int.
(d) kg ae/hac
kg ae/hlc
date of last treatment, timing
PHI (d)
Residues (mg/kg)c Reference Glyd NA-
Glyd Tot.e
(Event DP-Ø9814Ø-6)
500 SL
1 + 3
23 9 90
4.31 0.89 0.92 0.90
1.54 0.32 0.33 0.32
October 19, A4, Mature Grain
7 < 0.05 0.06 0.11 DuPont-20122
< 0.05 0.06
Trial #3 Quitman, GA, USA, 2006
600 SL
1 + 3
12 11 97
4.16 0.88 0.90 0.83
2.15 0.45 0.50 0.50
October 12, A4, BBCH 89
7 < 0.05 < 0.05 < 0.10 DuPont-20122
< 0.05 < 0.05
(Event DP-Ø9814Ø-6)
500 SL
1 + 3
12 11 97
4.14 0.88 0.87 0.85
2.14 0.45 0.49 0.51
October 12, A4, BBCH 89
7 < 0.05 < 0.05 < 0.10 DuPont-20122
< 0.05 < 0.05
Trial #4 Sycamore, GA, USA, 2006
600 SL
1 + 3
17 11 97
4.25 0.87 0.91 0.87
2.45 0.45 0.51 0.52
October 12, A4, MT (maturity)
7 < 0.05 < 0.05 < 0.10 DuPont-20122
< 0.05 < 0.05
(Event DP-Ø9814Ø-6)
500 SL
1 + 3
17 11 97
4.28 0.87 0.90 0.87
2.47 0.45 0.50 0.52
October 12, A4, MT (maturity)
7 < 0.05 < 0.05 < 0.10 DuPont-20122
< 0.05 < 0.05
Trial #5 Richland, IA, USA, 2006
600 SL
1 + 3
17 10 102
4.20 0.90 0.90 0.90
8.98f 1.93 1.93 1.92
October 17, A4, R6
7 < 0.05 < 0.05 < 0.10 DuPont-20122
< 0.05 < 0.05
(Event DP-Ø9814Ø-6)
500 SL
1 + 3
17 10 102
4.26 0.90 0.88 0.88
9.12f 1.92 1.88 1.88
October 17, A4, R6
7 < 0.05 < 0.05 < 0.10 DuPont-20122
< 0.05 < 0.05
Trial #6 Richland, IA, USA, 2006 (Event DP-Ø9814Ø-6)
600 SL
1 + 3
19 11 90
4.08 0.90 0.89 0.91
2.79 0.60 0.61 0.53
October 5, A4, R6
7 < 0.05 < 0.05 < 0.10 DuPont-20122
< 0.05 < 0.05
Trial #7 Richland, IA, USA, 2006 (Event DP- Ø9814Ø-6)
600 SL
1 + 3
19 11 104
4.14 0.87 0.89 0.90
2.83 0.58 0.60 0.53
October 19, A4, R6
7 < 0.05 < 0.05 < 0.10 DuPont-20122
< 0.05 < 0.05
Trial #8 Kirksville, MO, USA, 2006 (Event DP-Ø9814Ø-6)
600 SL
1 + 3
24 10 86
4.11 0.89 0.89 0.90
2.87 0.60 0.60 0.60
October 3, A4, R6
7 < 0.05 0.17 0.21 DuPont-20122
< 0.05 0.14
Trial #9 Carlyle, IL, USA, 2006 (Event DP-Ø9814Ø-6)
600 SL
1 + 3
23 10 105
4.12 0.86 0.86 0.86
2.00 0.65 0.55 0.46
October 20, A4, R6
5 < 0.05 < 0.05 < 0.10 DuPont-20122 < 0.05 < 0.05
Trial #10 Edgewood, IL, USA, 2006
600 SL
1 + 3
18 10 106
4.02 0.88 0.87 0.87
2.31 0.62 0.62 0.55
October 14, A4, R6
7 < 0.05 < 0.05 < 0.10 DuPont-20122 < 0.05 < 0.05
(Event DP-Ø9814Ø-6)
500 SL
1 + 3
18 10 106
4.16 0.87 0.90 0.91
2.38 0.62 0.64 0.58
October 14, A4, R6
7 < 0.05 < 0.05 < 0.10 DuPont-20122 < 0.05 < 0.05
Trial #11 Wyoming, IL, USA, 2006
600 SL
1 + 3
29 10 114
4.16 0.88 0.84 0.89
2.78 0.64 0.55 0.77
November 1 2006 A4, R6
7 < 0.05 < 0.05 < 0.10 DuPont-20122 < 0.05 < 0.05

Glyphosate 663
Trial, country, year (variety)
Form.a
No.b Int.
(d) kg ae/hac
kg ae/hlc
date of last treatment, timing
PHI (d)
Residues (mg/kg)c Reference Glyd NA-
Glyd Tot.e
(Event DP-Ø9814Ø-6)
500 SL
1 + 3
29 10 114
4.14 0.90 0.89 0.89
2.77 0.65 0.59 0.77
November 1, A4, R6
7 < 0.05 0.05 0.10 DuPont-20122 < 0.05 0.05
Trial #12 Brunswick, NE, USA, 2006 (Event DP-Ø9814Ø-6)
600 SL
1 + 3
22 10 116
4.08 0.89 0.86 0.90
2.19 0.48 0.47 0.48
October 20, A4, BBCH 89 Maturity
7 < 0.05 < 0.05 < 0.10 DuPont-20122 < 0.05 < 0.05
Trial #13 Polk, NE, USA, 2006 (Event DP-
600 SL
1 + 3
21 10 108
4.05 0.86 0.86 0.87
2.95 0.62 0.62 0.47
October 19, A4, BBCH 89
7 < 0.05 < 0.05 < 0.10 DuPont-20122 < 0.05 < 0.05
Ø9814Ø-6) 500 SL
1 + 3
21 10 108
4.13 0.89 0.89 0.85
3.01 0.65 0.65 0.46
October 19, A4, BBCH 89
7 < 0.05 < 0.05 < 0.10 DuPont-20122
< 0.05 < 0.05
Trial #14 York, NE, USA 2006 (Event DP-
600 SL
1 + 3
20 11 113
4.11 0.88 0.88 0.88
2.99 0.64 0.64 0.47
October 246, A4, BBCH 89
7 < 0.05 < 0.05 < 0.10 DuPont-20122
< 0.05 < 0.05
Ø9814Ø-6) 500 SL
1 + 3
20 11 113
4.14 0.88 0.88 0.88
3.01 0.64 0.63 0.47
October 24, A4, BBCH 89
7 < 0.05 < 0.05 < 0.10 DuPont-20122
< 0.05 < 0.05
Trial #18 Geneva, MN, USA, 2006
600 SL
1 + 3
27 10 108
4.19 0.90 0.88 0.88
2.65 0.57 0.58 0.57
October 24A4, R6
7 < 0.05 < 0.05 < 0.10 DuPont-20122 GLP 2006
< 0.05 < 0.05
(Event DP-Ø9814Ø-6)
500 SL
1 + 3
27 10 108
4.24 0.89 0.88 0.87
2.68 0.56 0.58 0.56
October 24, A4, R6
7 < 0.05 < 0.05 < 0.10 DuPont-20122
< 0.05 < 0.05
Trial #19 Geneva, MN, USA, 2006
600 SL
1 + 3
27 10 108
4.12 0.88 0.89 0.88
2.56 0.62 0.56 0.57
October 24, A4, R6
7 < 0.05 < 0.05 < 0.10 DuPont-20122
< 0.05 < 0.05
(Event DP-Ø9814Ø-6)
500 SL
1 + 3
26 10 112
4.17 0.89 0.89 0.88
2.59 0.62 0.56 0.56
October 24, A4, R6
7 < 0.05 < 0.05 0.10 DuPont-20122
< 0.05 0.06
Trial #20 Gardner, ND, USA, 2006
600 SL
1 + 3
23 10 87
4.26 0.88 0.89 0.91
2.28 0.47 0.48 0.49
September 28, A4, R6
7 < 0.05 < 0.05 < 0.10 DuPont-20122
< 0.05 < 0.05
(Event DP-Ø9814Ø-6)
500 SL
1 + 3
23 10 87
4.21 0.88 0.87 0.87
2.25 0.47 0.47 0.47
September 28, A4, R6
7 < 0.05 < 0.05 < 0.10 DuPont-20122
< 0.05 < 0.05
Trial #21 Branchton, ON, Canada,
600 SL
1 + 3
27 10 127
3.96 0.86 0.87 0.91
2.05 0.44 0.44 0.44
November 14, A4, R6
7 < 0.05 < 0.05 < 0.10 DuPont-20122
< 0.05 < 0.05
2006 (Event DP-Ø9814Ø-6)
500 SL
1 + 3
27 10 127
4.19 0.85 0.92 0.88
2.08 0.44 0.44 0.43
November 14, A4, R6
7 < 0.05 < 0.05 < 0.10 DuPont-20122
< 0.05 < 0.05
Trial #22 Thorndale, ON, Canada, 2006 (Event DP-
600 SL
1 + 3
36 8 131
4.09 0.85 0.87 0.91
3.11 0.61 0.62 0.65
November 29, A4, R6
7 < 0.05 < 0.05 < 0.10 DuPont-20122
< 0.05 < 0.05

664 Glyphosate
Trial, country, year (variety)
Form.a
No.b Int.
(d) kg ae/hac
kg ae/hlc
date of last treatment, timing
PHI (d)
Residues (mg/kg)c Reference Glyd NA-
Glyd Tot.e
Ø9814Ø-6) Trial #23 Weatherford, OK, USA, 2006
600 SL
1 + 3
23 14 84
4.55 0.85 0.90 0.85
3.74 0.68 0.73 0.42
October 6, A4, R6
7 0.08 0.20 0.26 DuPont-20122
0.06 0.17
(Event DP-Ø9814Ø-6)
500 SL
1 + 3
23 14 84
4.60 0.87 0.91 0.85
3.79 0.69 0.74 0.42
October 6, A4, R6
7 < 0.05 0.23 0.30 DuPont-20122
0.08 0.24
Trial #24 Hinton, OK, USA, 2006
600 SL
1 + 3
17 12 85
4.15 0.86 0.89 0.89
3.42 0.62 0.73 0.73
October 11, A4, R6
7 < 0.05 < 0.05 0.10 DuPont-20122
0.05 0.06
(Event DP-Ø9814Ø-6)
500 SL
1 + 3
17 12 85
4.16 0.87 0.88 0.89
3.42 0.64 0.73 0.73
October 11, A4, R6
7 0.05 0.07 0.13 DuPont-20122
< 0.05 0.10
Gly = glyphosate, NA-gly = N-acetylglyphosate, NA-AMPA = N-acetyl AMPA. a 600 g ae/L SL, 500 g ae/L SL. Ammonium sulfate (AMS) was also included as a product enhancer in both applications and a non-ionic surfactant was applied as an adjuvant with the 600 SL applications. b The number of applications includes the pre-emergence applications + the post emergence applications as x + y, respectively. c The active ingredient and all residues are reported as glyphosate free acid equivalents (ae). d The residue levels are reported as glyphosate and N-acetyl glyphosate, followed by the replicate values for both residues in the cell below. e For purposes of calculating total residue (Total), the sum of glyphosate and N-acetylglyphosate is reported. AMPA and N-acetyl AMPA residues are not taken into account, because all residue levels were either not detectable or well below LOQ. Residues reported as nd or with a reported value below LOQ have been assigned the value < 0.05 mg/kg, because lower residue concentrations were not validated. For calculation purpose the value of 0.05 mg/kg was used. f Applications were made in approximately 47 l/ha to simulate aerial application. [DuPont 16701]. No unusual weather conditions. Plot size ranged from 37-84 m2. First one pre-emergence broadcast application, followed by 3 foliar broadcast applications by back pack sprayer, tractor mounted sprayer or hand boom. Spray volume 105-358 l/ha, apart from trial# 3 where 47-48 ll/ha was applied without further explanation. Samples of 0.91-2.75 grain were collected at normal harvest. Samples were immediately stored frozen. Seed samples were stored at -20 °C for a maximum of 335 days before analysis, except samples for N-acetyl AMPA, which were stored frozen for a maximum of 628 days. Samples were analysed using analytical method DuPont-15444 using extraction with formic acid and methanol and LC/MS/MS detection. Individual concurrent method recoveries in seed were glyphosate: 75-99% (mean =88 ± 9%); N-acetylglyphosate: 63-95% (mean = 81 ± 12%; AMPA: 73-103% (mean = 88 ± 11%) and N-acetyl AMPA: 71-89% (mean = 85 ± 7%). [DuPont 20122]. No unusual weather conditions. Plot size ranged from 39-1800 m2. First one pre-emergence broadcast application, followed by 3 foliar broadcast applications by back pack sprayer, tractor mounted sprayer or hand boom. Spray volume 112-280 ll/ha, apart from trial# 5 where 47 ll/ha was applied to mimic aerial application. Samples of 1-3 kg kg grain were collected at normal harvest. Samples were immediately stored frozen for a maximum of 314 days (grain). Samples were analysed using analytical method DuPont-15444 using extraction with formic acid and methanol and LC/MS/MS detection. Individual concurrent method recoveries in seed were glyphosate: 80-121%; N-acetylglyphosate: 72-102%; AMPA: 80-115% and N-acetyl AMPA: 74-100%.
Straw, forage and fodder of cereal grains and grasses
The Meeting received supervised residue trials on glyphosate tolerant sweet corn forage and sweet corn stover (containing the EPSPS trait). Trials were available for foliar spray treatment in the field.
Supervised residue trials on field corn were conducted in the USA (2002 and 2008) and Canada (2008). Residue levels in sweet corn forage (= whole aerial portion of the plant left after removal of the ears at milk stage) and stover (= mature dried stalks from which the grain or whole ear (cob and grain) have been removed) both on as received basis are shown in Table 29 and 30, respectively.
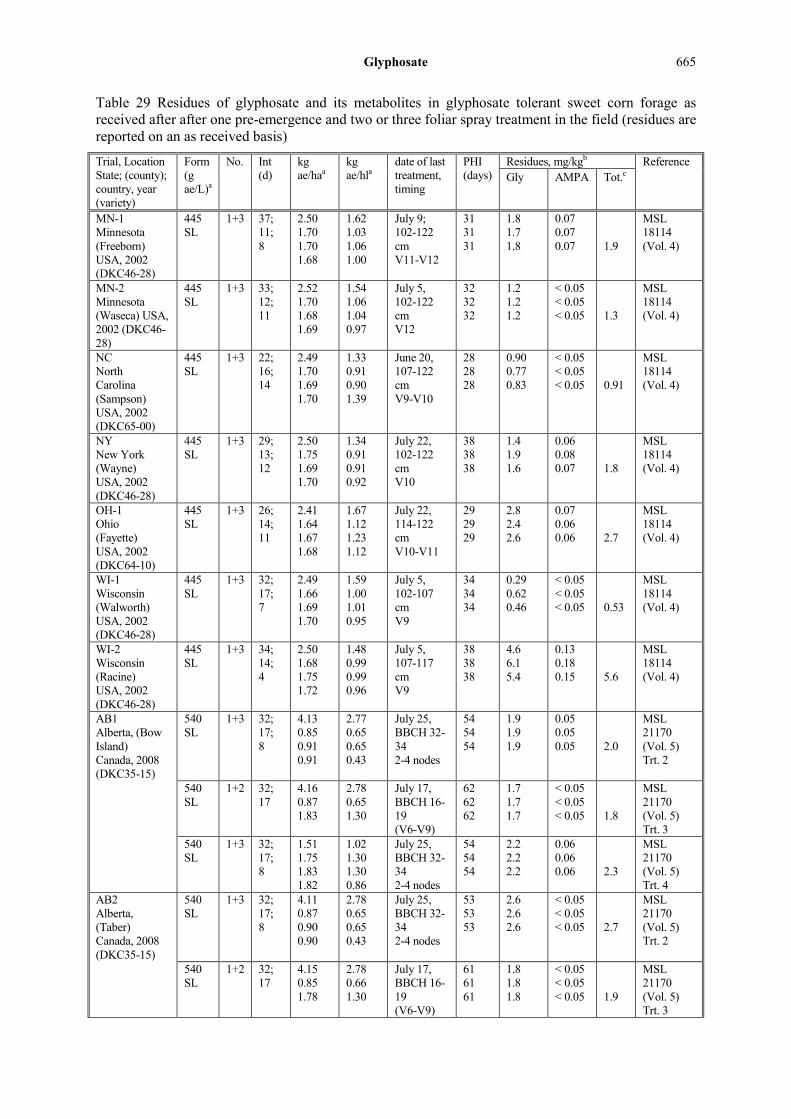
Glyphosate 665
Table 29 Residues of glyphosate and its metabolites in glyphosate tolerant sweet corn forage as received after after one pre-emergence and two or three foliar spray treatment in the field (residues are reported on an as received basis)
Trial, Location State; (county); country, year (variety)
Form (g ae/L)a
No. Int (d)
kg ae/haa
kg ae/hla
date of last treatment, timing
PHI (days)
Residues, mg/kgb Reference Gly AMPA Tot.c
MN-1 Minnesota (Freeborn) USA, 2002 (DKC46-28)
445 SL
1+3 37; 11; 8
2.50 1.70 1.70 1.68
1.62 1.03 1.06 1.00
July 9; 102-122 cm V11-V12
31 31 31
1.8 1.7 1.8
0.07 0.07 0.07
1.9
MSL 18114 (Vol. 4)
MN-2 Minnesota (Waseca) USA, 2002 (DKC46-28)
445 SL
1+3 33; 12; 11
2.52 1.70 1.68 1.69
1.54 1.06 1.04 0.97
July 5, 102-122 cm V12
32 32 32
1.2 1.2 1.2
< 0.05 < 0.05 < 0.05
1.3
MSL 18114 (Vol. 4)
NC North Carolina (Sampson) USA, 2002 (DKC65-00)
445 SL
1+3 22; 16; 14
2.49 1.70 1.69 1.70
1.33 0.91 0.90 1.39
June 20, 107-122 cm V9-V10
28 28 28
0.90 0.77 0.83
< 0.05 < 0.05 < 0.05
0.91
MSL 18114 (Vol. 4)
NY New York (Wayne) USA, 2002 (DKC46-28)
445 SL
1+3 29; 13; 12
2.50 1.75 1.69 1.70
1.34 0.91 0.91 0.92
July 22, 102-122 cm V10
38 38 38
1.4 1.9 1.6
0.06 0.08 0.07
1.8
MSL 18114 (Vol. 4)
OH-1 Ohio (Fayette) USA, 2002 (DKC64-10)
445 SL
1+3 26; 14; 11
2.41 1.64 1.67 1.68
1.67 1.12 1.23 1.12
July 22, 114-122 cm V10-V11
29 29 29
2.8 2.4 2.6
0.07 0.06 0.06
2.7
MSL 18114 (Vol. 4)
WI-1 Wisconsin (Walworth) USA, 2002 (DKC46-28)
445 SL
1+3 32; 17; 7
2.49 1.66 1.69 1.70
1.59 1.00 1.01 0.95
July 5, 102-107 cm V9
34 34 34
0.29 0.62 0.46
< 0.05 < 0.05 < 0.05
0.53
MSL 18114 (Vol. 4)
WI-2 Wisconsin (Racine) USA, 2002 (DKC46-28)
445 SL
1+3 34; 14; 4
2.50 1.68 1.75 1.72
1.48 0.99 0.99 0.96
July 5, 107-117 cm V9
38 38 38
4.6 6.1 5.4
0.13 0.18 0.15
5.6
MSL 18114 (Vol. 4)
AB1 Alberta, (Bow Island) Canada, 2008 (DKC35-15)
540 SL
1+3 32; 17; 8
4.13 0.85 0.91 0.91
2.77 0.65 0.65 0.43
July 25, BBCH 32-34 2-4 nodes
54 54 54
1.9 1.9 1.9
0.05 0.05 0.05
2.0
MSL 21170 (Vol. 5) Trt. 2
540 SL
1+2 32; 17
4.16 0.87 1.83
2.78 0.65 1.30
July 17, BBCH 16-19 (V6-V9)
62 62 62
1.7 1.7 1.7
< 0.05 < 0.05 < 0.05
1.8
MSL 21170 (Vol. 5) Trt. 3
540 SL
1+3 32; 17; 8
1.51 1.75 1.83 1.82
1.02 1.30 1.30 0.86
July 25, BBCH 32-34 2-4 nodes
54 54 54
2.2 2.2 2.2
0.06 0.06 0.06
2.3
MSL 21170 (Vol. 5) Trt. 4
AB2 Alberta, (Taber) Canada, 2008 (DKC35-15)
540 SL
1+3 32; 17; 8
4.11 0.87 0.90 0.90
2.78 0.65 0.65 0.43
July 25, BBCH 32-34 2-4 nodes
53 53 53
2.6 2.6 2.6
< 0.05 < 0.05 < 0.05
2.7
MSL 21170 (Vol. 5) Trt. 2
540 SL
1+2 32; 17
4.15 0.85 1.78
2.78 0.66 1.30
July 17, BBCH 16-19 (V6-V9)
61 61 61
1.8 1.8 1.8
< 0.05 < 0.05 < 0.05
1.9
MSL 21170 (Vol. 5) Trt. 3
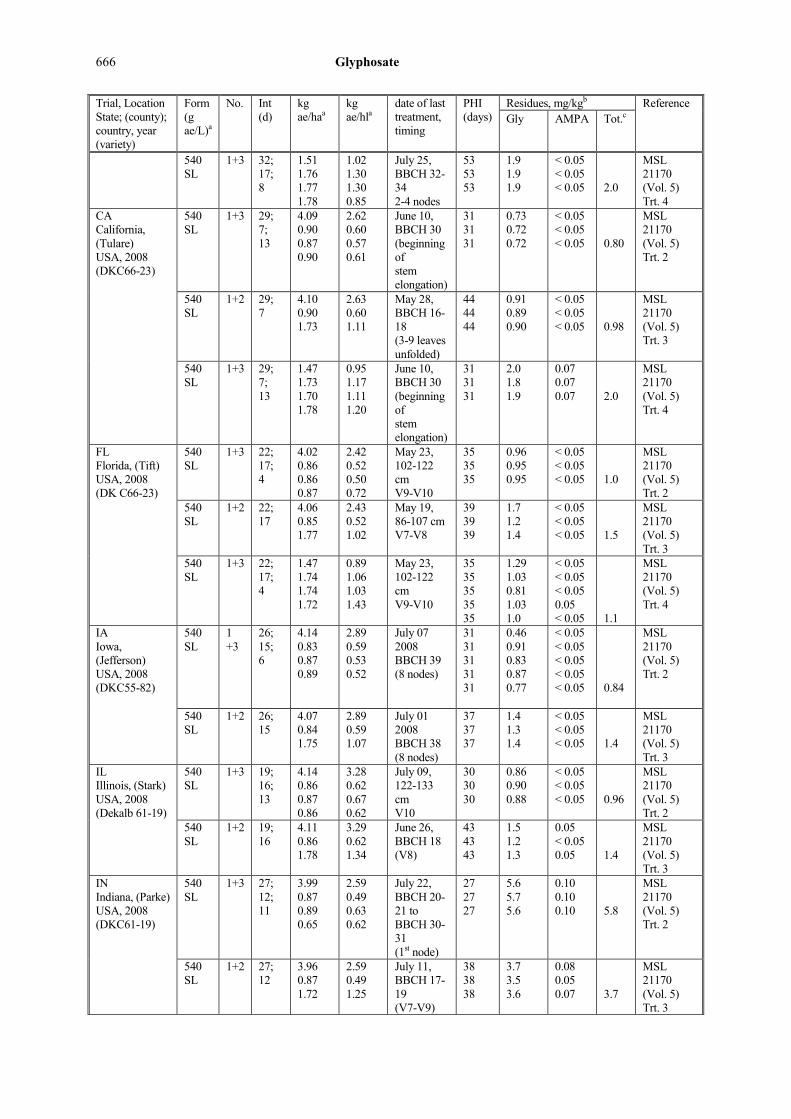
666 Glyphosate
Trial, Location State; (county); country, year (variety)
Form (g ae/L)a
No. Int (d)
kg ae/haa
kg ae/hla
date of last treatment, timing
PHI (days)
Residues, mg/kgb Reference Gly AMPA Tot.c
540 SL
1+3 32; 17; 8
1.51 1.76 1.77 1.78
1.02 1.30 1.30 0.85
July 25, BBCH 32-34 2-4 nodes
53 53 53
1.9 1.9 1.9
< 0.05 < 0.05 < 0.05
2.0
MSL 21170 (Vol. 5) Trt. 4
CA California, (Tulare) USA, 2008 (DKC66-23)
540 SL
1+3 29; 7; 13
4.09 0.90 0.87 0.90
2.62 0.60 0.57 0.61
June 10, BBCH 30 (beginning of stem elongation)
31 31 31
0.73 0.72 0.72
< 0.05 < 0.05 < 0.05
0.80
MSL 21170 (Vol. 5) Trt. 2
540 SL
1+2 29; 7
4.10 0.90 1.73
2.63 0.60 1.11
May 28, BBCH 16-18 (3-9 leaves unfolded)
44 44 44
0.91 0.89 0.90
< 0.05 < 0.05 < 0.05
0.98
MSL 21170 (Vol. 5) Trt. 3
540 SL
1+3 29; 7; 13
1.47 1.73 1.70 1.78
0.95 1.17 1.11 1.20
June 10, BBCH 30 (beginning of stem elongation)
31 31 31
2.0 1.8 1.9
0.07 0.07 0.07
2.0
MSL 21170 (Vol. 5) Trt. 4
FL Florida, (Tift) USA, 2008 (DK C66-23)
540 SL
1+3 22; 17; 4
4.02 0.86 0.86 0.87
2.42 0.52 0.50 0.72
May 23, 102-122 cm V9-V10
35 35 35
0.96 0.95 0.95
< 0.05 < 0.05 < 0.05
1.0
MSL 21170 (Vol. 5) Trt. 2
540 SL
1+2 22; 17
4.06 0.85 1.77
2.43 0.52 1.02
May 19, 86-107 cm V7-V8
39 39 39
1.7 1.2 1.4
< 0.05 < 0.05 < 0.05
1.5
MSL 21170 (Vol. 5) Trt. 3
540 SL
1+3 22; 17; 4
1.47 1.74 1.74 1.72
0.89 1.06 1.03 1.43
May 23, 102-122 cm V9-V10
35 35 35 35 35
1.29 1.03 0.81 1.03 1.0
< 0.05 < 0.05 < 0.05 0.05 < 0.05
1.1
MSL 21170 (Vol. 5) Trt. 4
IA Iowa, (Jefferson) USA, 2008 (DKC55-82)
540 SL
1 +3
26; 15; 6
4.14 0.83 0.87 0.89
2.89 0.59 0.53 0.52
July 07 2008 BBCH 39 (8 nodes)
31 31 31 31 31
0.46 0.91 0.83 0.87 0.77
< 0.05 < 0.05 < 0.05 < 0.05 < 0.05
0.84
MSL 21170 (Vol. 5) Trt. 2
540 SL
1+2 26; 15
4.07 0.84 1.75
2.89 0.59 1.07
July 01 2008 BBCH 38 (8 nodes)
37 37 37
1.4 1.3 1.4
< 0.05 < 0.05 < 0.05
1.4
MSL 21170 (Vol. 5) Trt. 3
IL Illinois, (Stark) USA, 2008 (Dekalb 61-19)
540 SL
1+3 19; 16; 13
4.14 0.86 0.87 0.86
3.28 0.62 0.67 0.62
July 09, 122-133 cm V10
30 30 30
0.86 0.90 0.88
< 0.05 < 0.05 < 0.05
0.96
MSL 21170 (Vol. 5) Trt. 2
540 SL
1+2 19; 16
4.11 0.86 1.78
3.29 0.62 1.34
June 26, BBCH 18 (V8)
43 43 43
1.5 1.2 1.3
0.05 < 0.05 0.05
1.4
MSL 21170 (Vol. 5) Trt. 3
IN Indiana, (Parke) USA, 2008 (DKC61-19)
540 SL
1+3 27; 12; 11
3.99 0.87 0.89 0.65
2.59 0.49 0.63 0.62
July 22, BBCH 20-21 to BBCH 30-31 (1st node)
27 27 27
5.6 5.7 5.6
0.10 0.10 0.10
5.8
MSL 21170 (Vol. 5) Trt. 2
540 SL
1+2 27; 12
3.96 0.87 1.72
2.59 0.49 1.25
July 11, BBCH 17-19 (V7-V9)
38 38 38
3.7 3.5 3.6
0.08 0.05 0.07
3.7
MSL 21170 (Vol. 5) Trt. 3

Glyphosate 667
Trial, Location State; (county); country, year (variety)
Form (g ae/L)a
No. Int (d)
kg ae/haa
kg ae/hla
date of last treatment, timing
PHI (days)
Residues, mg/kgb Reference Gly AMPA Tot.c
MN Minnesota, (Freeborn) USA, 2008 (DKC50-19)
540 SL
1+3 37; 9; 13
4.13 0.87 0.85 0.87
2.58 0.55 0.60 0.92
July 11, 117-122 cm V12
33 33 33
0.22 0.21 0.22
< 0.05 < 0.05 < 0.05
0.29
MSL 21170 (Vol. 5) Trt. 2
540 SL
1+2 37; 9
4.11 0.87 1.73
2.57 0.55 1.19
June 28, 61-71 cm V8
46 46 46
0.28 0.38 0.37 0.46 0.37
< 0.05 < 0.05 < 0.05 < 0.05 < 0.05
0.45
MSL 21170 (Vol. 5) Trt. 3
NC North Carolina, (Wayne) USA, 2008 (DKC66-23)
540 SL
1+3 31; 16; 8
4.20 0.87 0.89 0.87
2.94 0.48 0.49 0.50
June 12, BBCH 38 (8 nodes)
33 33 33
3.4 4.0 3.7
0.14 0.16 0.15
3.9
MSL 21170 (Vol. 5) Trt. 2
540 SL
1+2 31; 16
4.10 0.87 1.77
2.93 0.48 0.98
June 04, BBCH 37 (7 nodes)
41 41 41
5.2 5.2 5.2
0.17 0.17 0.17
5.5
MSL 21170 (Vol. 5) Trt. 3
NY New York, (Wayne) USA, 2008 (DKC55-82)
540 SL
1+3 35; 18; 15
4.09 0.89 0.85 0.87
2.32 0.49 0.49 0.49
July 23, BBCH 19 (9 or more leaves unfolded)
42 42 42
0.92 0.87 0.89
< 0.05 < 0.05 < 0.05
0.97
MSL 21170 (Vol. 5) Trt. 2
540 SL
1+2 35; 18
4.11 0.87 1.74
2.31 0.49 0.98
July 08, 66-71 cm V8 (eight leaves with collars)
57 57 57
1.2 1.2 1.2
< 0.05 < 0.05 < 0.05
1.3
MSL 21170 (Vol. 5) Trt. 3
540 SL
1+3 35; 18; 15
1.50 1.75 1.72 1.72
0.84 0.97 0.97 0.97
July 23, BBCH 19 (9 or more leaves unfolded)
42 42 42
3.7 3.6 3.7
0.07 0.08 0.08
3.8
MSL 21170 (Vol. 5) Trt. 4
ON Ontario, (Branchton) Canada, 2008 (DKC46-60)
540 SL
1+3 14; 21; 12
4.02 0.84 0.87 0.87
2.74 0.58 0.56 0.59
July 28, BBCH 19 (9 or more leaves unfolded)
38 38 38
1.3 1.3 1.3
< 0.05 < 0.05 < 0.05
1.4
MSL 21170 (Vol. 5) Trt. 2
540 SL
1+2 14; 21
3.91 0.85 1.77
2.76 0.58 1.12
July 16, 61-66 cm V8
50 50 50
1.6 1.6 1.6
< 0.05 < 0.05 < 0.05
1.7
MSL 21170 (Vol. 5) Trt. 3
540 SL
1+3 14; 21; 12
1.54 1.67 1.73 1.76
1.01 1.16 1.12 1.16
July 28, BBCH 19 (9 or more leaves unfolded)
38 38 38
1.9 1.8 1.9
0.05 0.05 0.05
1.9
MSL 21170 (Vol. 5) Trt. 4
OR Oregon, (Benton) USA, 2008 (DKC55-82)
540 SL
1+3 29; 17; 17
3.96 0.84 0.81 0.90
2.75 0.53 0.53 0.55
August 03, 102-122 cm
53 53 53
0.24 0.24 0.24
< 0.05 < 0.05 < 0.05
0.32
MSL 21170 (Vol. 5) Trt. 2
540 SL
1+2 29; 17
3.99 0.85 1.67
2.75 0.53 1.08
July 17 2008 46-71 cm V8
70 70 70
0.22 0.22 0.22
< 0.05 < 0.05 < 0.05
0.30
MSL 21170 (Vol. 5) Trt. 3
540 SL
1+3 29; 17; 17
1.50 1.70 1.72 1.78
1.04 1.07 1.07 1.09
August 03, 102-122 cm
53 53 53
0.67 0.67 0.67
< 0.05 < 0.05 < 0.05
0.74
MSL 21170 (Vol. 5) Trt. 4
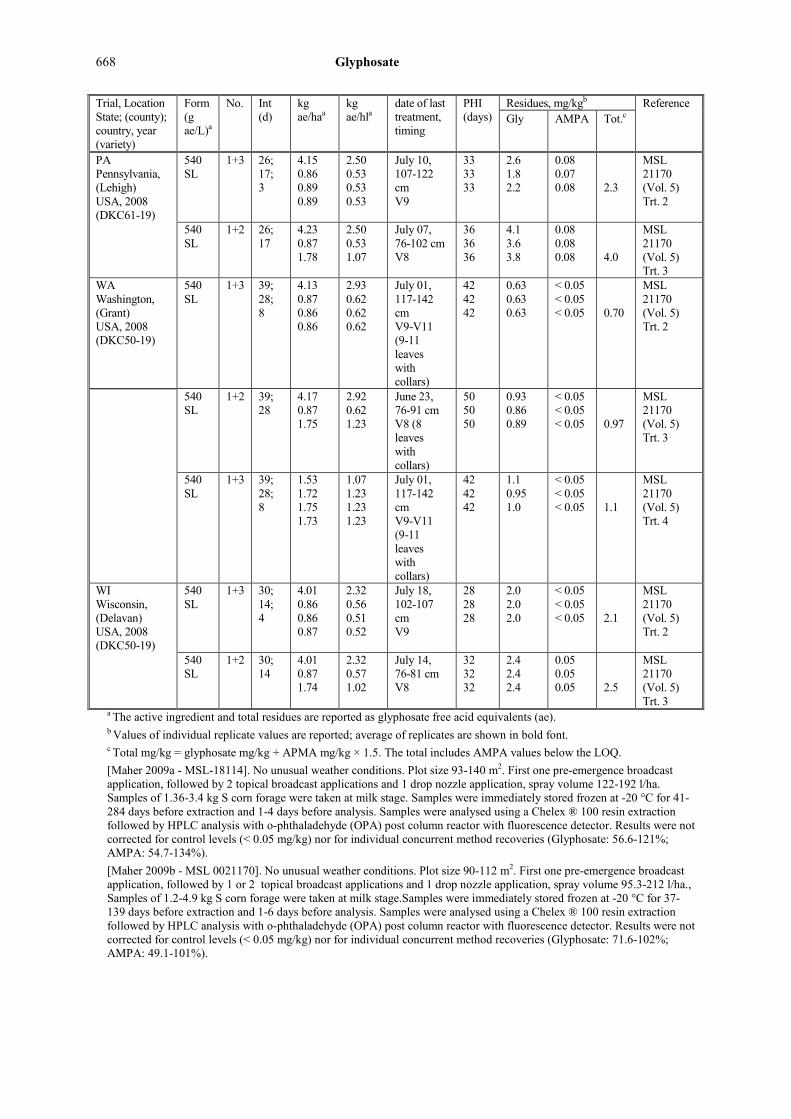
668 Glyphosate
Trial, Location State; (county); country, year (variety)
Form (g ae/L)a
No. Int (d)
kg ae/haa
kg ae/hla
date of last treatment, timing
PHI (days)
Residues, mg/kgb Reference Gly AMPA Tot.c
PA Pennsylvania, (Lehigh) USA, 2008 (DKC61-19)
540 SL
1+3 26; 17; 3
4.15 0.86 0.89 0.89
2.50 0.53 0.53 0.53
July 10, 107-122 cm V9
33 33 33
2.6 1.8 2.2
0.08 0.07 0.08
2.3
MSL 21170 (Vol. 5) Trt. 2
540 SL
1+2 26; 17
4.23 0.87 1.78
2.50 0.53 1.07
July 07, 76-102 cm V8
36 36 36
4.1 3.6 3.8
0.08 0.08 0.08
4.0
MSL 21170 (Vol. 5) Trt. 3
WA Washington, (Grant) USA, 2008 (DKC50-19)
540 SL
1+3 39; 28; 8
4.13 0.87 0.86 0.86
2.93 0.62 0.62 0.62
July 01, 117-142 cm V9-V11 (9-11 leaves with collars)
42 42 42
0.63 0.63 0.63
< 0.05 < 0.05 < 0.05
0.70
MSL 21170 (Vol. 5) Trt. 2
540 SL
1+2 39; 28
4.17 0.87 1.75
2.92 0.62 1.23
June 23, 76-91 cm V8 (8 leaves with collars)
50 50 50
0.93 0.86 0.89
< 0.05 < 0.05 < 0.05
0.97
MSL 21170 (Vol. 5) Trt. 3
540 SL
1+3 39; 28; 8
1.53 1.72 1.75 1.73
1.07 1.23 1.23 1.23
July 01, 117-142 cm V9-V11 (9-11 leaves with collars)
42 42 42
1.1 0.95 1.0
< 0.05 < 0.05 < 0.05
1.1
MSL 21170 (Vol. 5) Trt. 4
WI Wisconsin, (Delavan) USA, 2008 (DKC50-19)
540 SL
1+3 30; 14; 4
4.01 0.86 0.86 0.87
2.32 0.56 0.51 0.52
July 18, 102-107 cm V9
28 28 28
2.0 2.0 2.0
< 0.05 < 0.05 < 0.05
2.1
MSL 21170 (Vol. 5) Trt. 2
540 SL
1+2 30; 14
4.01 0.87 1.74
2.32 0.57 1.02
July 14, 76-81 cm V8
32 32 32
2.4 2.4 2.4
0.05 0.05 0.05
2.5
MSL 21170 (Vol. 5) Trt. 3
a The active ingredient and total residues are reported as glyphosate free acid equivalents (ae). b Values of individual replicate values are reported; average of replicates are shown in bold font. c Total mg/kg = glyphosate mg/kg + APMA mg/kg × 1.5. The total includes AMPA values below the LOQ. [Maher 2009a - MSL-18114]. No unusual weather conditions. Plot size 93-140 m2. First one pre-emergence broadcast application, followed by 2 topical broadcast applications and 1 drop nozzle application, spray volume 122-192 l/ha. Samples of 1.36-3.4 kg S corn forage were taken at milk stage. Samples were immediately stored frozen at -20 °C for 41-284 days before extraction and 1-4 days before analysis. Samples were analysed using a Chelex ® 100 resin extraction followed by HPLC analysis with o-phthaladehyde (OPA) post column reactor with fluorescence detector. Results were not corrected for control levels (< 0.05 mg/kg) nor for individual concurrent method recoveries (Glyphosate: 56.6-121%; AMPA: 54.7-134%). [Maher 2009b - MSL 0021170]. No unusual weather conditions. Plot size 90-112 m2. First one pre-emergence broadcast application, followed by 1 or 2 topical broadcast applications and 1 drop nozzle application, spray volume 95.3-212 l/ha., Samples of 1.2-4.9 kg S corn forage were taken at milk stage.Samples were immediately stored frozen at -20 °C for 37-139 days before extraction and 1-6 days before analysis. Samples were analysed using a Chelex ® 100 resin extraction followed by HPLC analysis with o-phthaladehyde (OPA) post column reactor with fluorescence detector. Results were not corrected for control levels (< 0.05 mg/kg) nor for individual concurrent method recoveries (Glyphosate: 71.6-102%; AMPA: 49.1-101%).
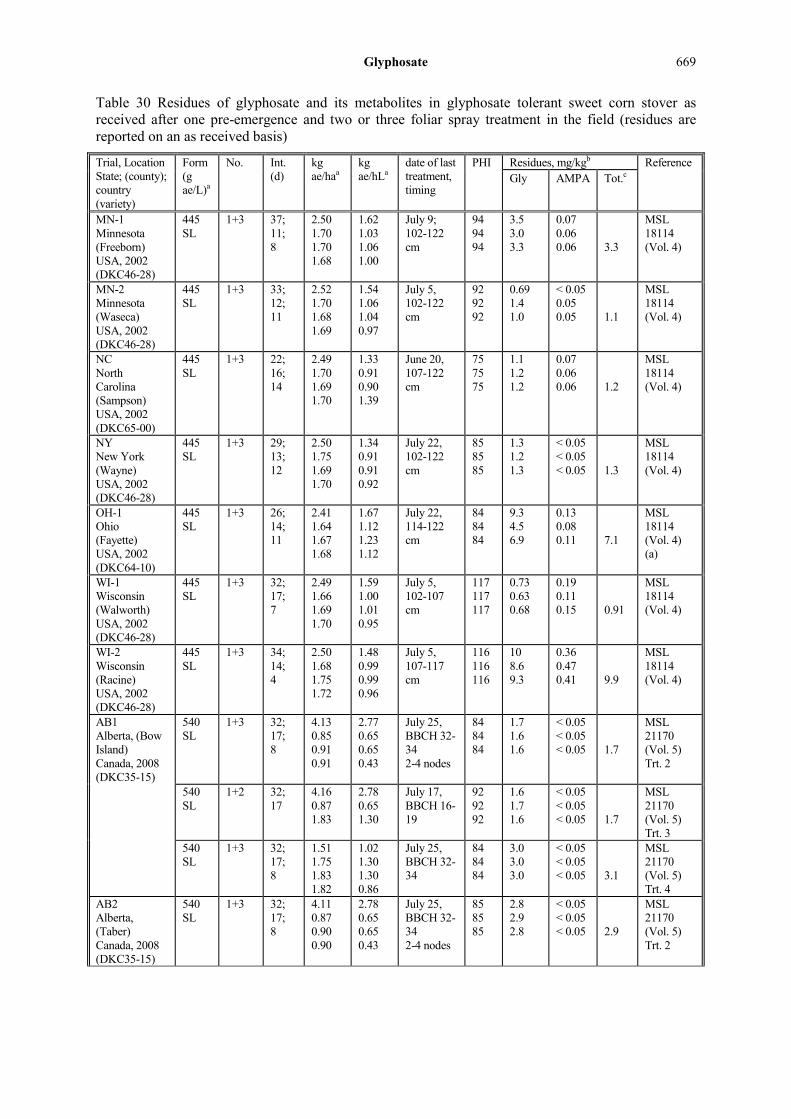
Glyphosate 669
Table 30 Residues of glyphosate and its metabolites in glyphosate tolerant sweet corn stover as received after one pre-emergence and two or three foliar spray treatment in the field (residues are reported on an as received basis)
Trial, Location State; (county); country (variety)
Form (g ae/L)a
No. Int. (d)
kg ae/haa
kg ae/hLa
date of last treatment, timing
PHI Residues, mg/kgb Reference Gly AMPA Tot.c
MN-1 Minnesota (Freeborn) USA, 2002 (DKC46-28)
445 SL
1+3 37; 11; 8
2.50 1.70 1.70 1.68
1.62 1.03 1.06 1.00
July 9; 102-122 cm
94 94 94
3.5 3.0 3.3
0.07 0.06 0.06
3.3
MSL 18114 (Vol. 4)
MN-2 Minnesota (Waseca) USA, 2002 (DKC46-28)
445 SL
1+3 33; 12; 11
2.52 1.70 1.68 1.69
1.54 1.06 1.04 0.97
July 5, 102-122 cm
92 92 92
0.69 1.4 1.0
< 0.05 0.05 0.05
1.1
MSL 18114 (Vol. 4)
NC North Carolina (Sampson) USA, 2002 (DKC65-00)
445 SL
1+3 22; 16; 14
2.49 1.70 1.69 1.70
1.33 0.91 0.90 1.39
June 20, 107-122 cm
75 75 75
1.1 1.2 1.2
0.07 0.06 0.06
1.2
MSL 18114 (Vol. 4)
NY New York (Wayne) USA, 2002 (DKC46-28)
445 SL
1+3 29; 13; 12
2.50 1.75 1.69 1.70
1.34 0.91 0.91 0.92
July 22, 102-122 cm
85 85 85
1.3 1.2 1.3
< 0.05 < 0.05 < 0.05
1.3
MSL 18114 (Vol. 4)
OH-1 Ohio (Fayette) USA, 2002 (DKC64-10)
445 SL
1+3 26; 14; 11
2.41 1.64 1.67 1.68
1.67 1.12 1.23 1.12
July 22, 114-122 cm
84 84 84
9.3 4.5 6.9
0.13 0.08 0.11
7.1
MSL 18114 (Vol. 4) (a)
WI-1 Wisconsin (Walworth) USA, 2002 (DKC46-28)
445 SL
1+3 32; 17; 7
2.49 1.66 1.69 1.70
1.59 1.00 1.01 0.95
July 5, 102-107 cm
117 117 117
0.73 0.63 0.68
0.19 0.11 0.15
0.91
MSL 18114 (Vol. 4)
WI-2 Wisconsin (Racine) USA, 2002 (DKC46-28)
445 SL
1+3 34; 14; 4
2.50 1.68 1.75 1.72
1.48 0.99 0.99 0.96
July 5, 107-117 cm
116 116 116
10 8.6 9.3
0.36 0.47 0.41
9.9
MSL 18114 (Vol. 4)
AB1 Alberta, (Bow Island) Canada, 2008 (DKC35-15)
540 SL
1+3 32; 17; 8
4.13 0.85 0.91 0.91
2.77 0.65 0.65 0.43
July 25, BBCH 32-34 2-4 nodes
84 84 84
1.7 1.6 1.6
< 0.05 < 0.05 < 0.05
1.7
MSL 21170 (Vol. 5) Trt. 2
540 SL
1+2 32; 17
4.16 0.87 1.83
2.78 0.65 1.30
July 17, BBCH 16-19
92 92 92
1.6 1.7 1.6
< 0.05 < 0.05 < 0.05
1.7
MSL 21170 (Vol. 5) Trt. 3
540 SL
1+3 32; 17; 8
1.51 1.75 1.83 1.82
1.02 1.30 1.30 0.86
July 25, BBCH 32-34
84 84 84
3.0 3.0 3.0
< 0.05 < 0.05 < 0.05
3.1
MSL 21170 (Vol. 5) Trt. 4
AB2 Alberta, (Taber) Canada, 2008 (DKC35-15)
540 SL
1+3 32; 17; 8
4.11 0.87 0.90 0.90
2.78 0.65 0.65 0.43
July 25, BBCH 32-34 2-4 nodes
85 85 85
2.8 2.9 2.8
< 0.05 < 0.05 < 0.05
2.9
MSL 21170 (Vol. 5) Trt. 2
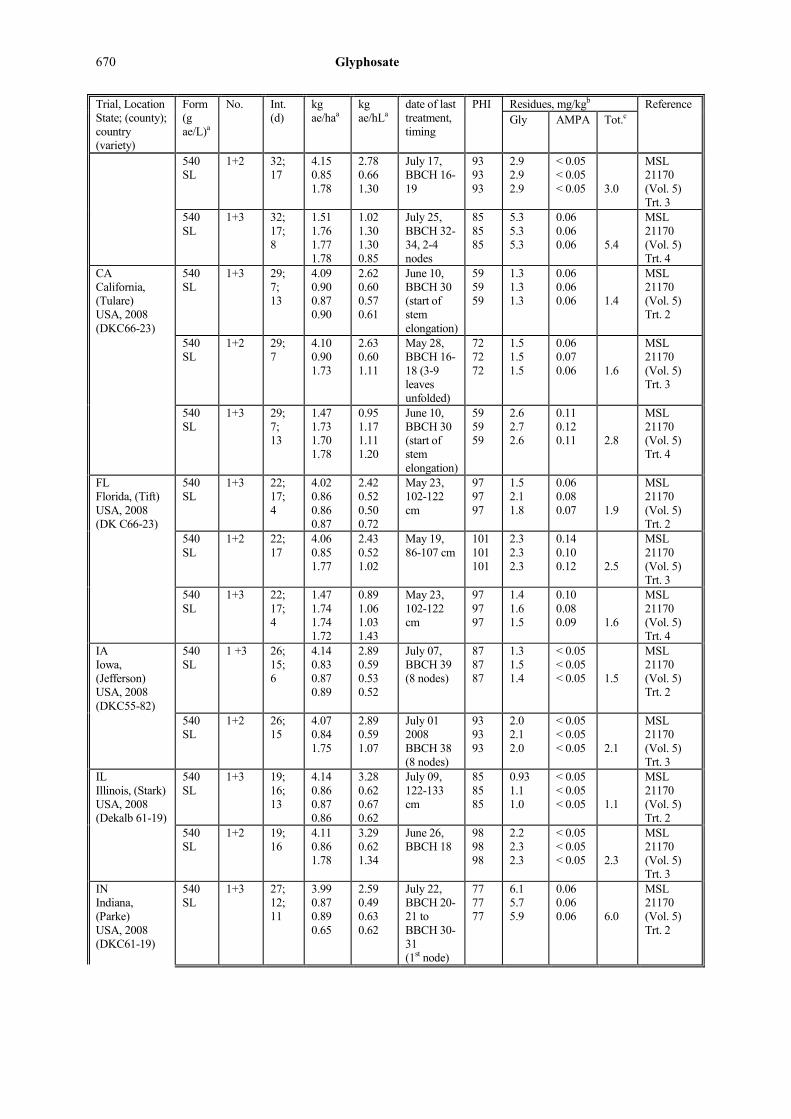
670 Glyphosate
Trial, Location State; (county); country (variety)
Form (g ae/L)a
No. Int. (d)
kg ae/haa
kg ae/hLa
date of last treatment, timing
PHI Residues, mg/kgb Reference Gly AMPA Tot.c
540 SL
1+2 32; 17
4.15 0.85 1.78
2.78 0.66 1.30
July 17, BBCH 16-19
93 93 93
2.9 2.9 2.9
< 0.05 < 0.05 < 0.05
3.0
MSL 21170 (Vol. 5) Trt. 3
540 SL
1+3 32; 17; 8
1.51 1.76 1.77 1.78
1.02 1.30 1.30 0.85
July 25, BBCH 32-34, 2-4 nodes
85 85 85
5.3 5.3 5.3
0.06 0.06 0.06
5.4
MSL 21170 (Vol. 5) Trt. 4
CA California, (Tulare) USA, 2008 (DKC66-23)
540 SL
1+3 29; 7; 13
4.09 0.90 0.87 0.90
2.62 0.60 0.57 0.61
June 10, BBCH 30 (start of stem elongation)
59 59 59
1.3 1.3 1.3
0.06 0.06 0.06
1.4
MSL 21170 (Vol. 5) Trt. 2
540 SL
1+2 29; 7
4.10 0.90 1.73
2.63 0.60 1.11
May 28, BBCH 16-18 (3-9 leaves unfolded)
72 72 72
1.5 1.5 1.5
0.06 0.07 0.06
1.6
MSL 21170 (Vol. 5) Trt. 3
540 SL
1+3 29; 7; 13
1.47 1.73 1.70 1.78
0.95 1.17 1.11 1.20
June 10, BBCH 30 (start of stem elongation)
59 59 59
2.6 2.7 2.6
0.11 0.12 0.11
2.8
MSL 21170 (Vol. 5) Trt. 4
FL Florida, (Tift) USA, 2008 (DK C66-23)
540 SL
1+3 22; 17; 4
4.02 0.86 0.86 0.87
2.42 0.52 0.50 0.72
May 23, 102-122 cm
97 97 97
1.5 2.1 1.8
0.06 0.08 0.07
1.9
MSL 21170 (Vol. 5) Trt. 2
540 SL
1+2 22; 17
4.06 0.85 1.77
2.43 0.52 1.02
May 19, 86-107 cm
101 101 101
2.3 2.3 2.3
0.14 0.10 0.12
2.5
MSL 21170 (Vol. 5) Trt. 3
540 SL
1+3 22; 17; 4
1.47 1.74 1.74 1.72
0.89 1.06 1.03 1.43
May 23, 102-122 cm
97 97 97
1.4 1.6 1.5
0.10 0.08 0.09
1.6
MSL 21170 (Vol. 5) Trt. 4
IA Iowa, (Jefferson) USA, 2008 (DKC55-82)
540 SL
1 +3 26; 15; 6
4.14 0.83 0.87 0.89
2.89 0.59 0.53 0.52
July 07, BBCH 39 (8 nodes)
87 87 87
1.3 1.5 1.4
< 0.05 < 0.05 < 0.05
1.5
MSL 21170 (Vol. 5) Trt. 2
540 SL
1+2 26; 15
4.07 0.84 1.75
2.89 0.59 1.07
July 01 2008 BBCH 38 (8 nodes)
93 93 93
2.0 2.1 2.0
< 0.05 < 0.05 < 0.05
2.1
MSL 21170 (Vol. 5) Trt. 3
IL Illinois, (Stark) USA, 2008 (Dekalb 61-19)
540 SL
1+3 19; 16; 13
4.14 0.86 0.87 0.86
3.28 0.62 0.67 0.62
July 09, 122-133 cm
85 85 85
0.93 1.1 1.0
< 0.05 < 0.05 < 0.05
1.1
MSL 21170 (Vol. 5) Trt. 2
540 SL
1+2 19; 16
4.11 0.86 1.78
3.29 0.62 1.34
June 26, BBCH 18
98 98 98
2.2 2.3 2.3
< 0.05 < 0.05 < 0.05
2.3
MSL 21170 (Vol. 5) Trt. 3
IN Indiana, (Parke) USA, 2008 (DKC61-19)
540 SL
1+3 27; 12; 11
3.99 0.87 0.89 0.65
2.59 0.49 0.63 0.62
July 22, BBCH 20-21 to BBCH 30-31 (1st node)
77 77 77
6.1 5.7 5.9
0.06 0.06 0.06
6.0
MSL 21170 (Vol. 5) Trt. 2

Glyphosate 671
Trial, Location State; (county); country (variety)
Form (g ae/L)a
No. Int. (d)
kg ae/haa
kg ae/hLa
date of last treatment, timing
PHI Residues, mg/kgb Reference Gly AMPA Tot.c
540 SL
1+2 27; 12
3.96 0.87 1.72
2.59 0.49 1.25
July 11 2008 BBCH 17-19 (V7-V9)
88 88 88
2.6 3.2 2.9
< 0.05 < 0.05 < 0.05
3.0
MSL 21170 (Vol. 5) Trt. 3
MN Minnesota, (Freeborn) USA, 2008 (DKC50-19)
540 SL
1+3 37; 9; 13
4.13 0.87 0.85 0.87
2.58 0.55 0.60 0.92
July 11, 117-122 cm
93 93 93
0.49 0.48 0.48
< 0.05 < 0.05 < 0.05
0.56
MSL 21170 (Vol. 5) Trt. 2
540 SL
1+2 37; 9
4.11 0.87 1.73
2.57 0.55 1.19
June 28, 61-71 cm
106 106 106
0.43 0.44 0.44
< 0.05 < 0.05 < 0.05
0.51
MSL 21170 (Vol. 5) Trt. 3
NC North Carolina, (Wayne) USA, 2008 (DKC66-23)
540 SL
1+3 31; 16; 8
4.20 0.87 0.89 0.87
2.94 0.48 0.49 0.50
June 12, BBCH 38 (8 nodes)
88 88 88
3.6 4.7 4.1
0.08 0.08 0.08
4.3
MSL 21170 (Vol. 5) Trt. 2
540 SL
1+2 31; 16
4.10 0.87 1.77
2.93 0.48 0.98
June 04, BBCH 37 (7 nodes)
96 96 96
4.6 4.9 4.8
0.10 0.11 0.10
4.9
MSL 21170 (Vol. 5) Trt. 3
NY New York, (Wayne) USA, 2008 (DKC55-82)
540 SL
1+3 35; 18; 15
4.09 0.89 0.85 0.87
2.32 0.49 0.49 0.49
July 23, BBCH 19 (9 or more leaves unfolded)
83 83 83
0.95 1.1 1.0
< 0.05 < 0.05 < 0.05
1.1
MSL 21170 (Vol. 5) Trt. 2
540 SL
1+2 35; 18
4.11 0.87 1.74
2.31 0.49 0.98
July 08, 66-71 cm V8 (eight leaves with collars)
98 98 98
0.78 0.82 0.80
< 0.05 < 0.05 < 0.05
0.88
MSL 21170 (Vol. 5) Trt. 3
540 SL
1+3 35; 18; 15
1.50 1.75 1.72 1.72
0.84 0.97 0.97 0.97
July 23, BBCH 19 (9 or more leaves unfolded)
83 83 83
4.4 3.2 3.8
0.05 < 0.05 0.05
3.9
MSL 21170 (Vol. 5) Trt. 4
ON Ontario, (Branchton) Canada, 2008 (DKC46-60)
540 SL
1+3 14; 21; 12
4.02 0.84 0.87 0.87
2.74 0.58 0.56 0.59
July 28, BBCH 19 (9 or more leaves unfolded)
92 92 92
1.1 1.1 1.1
< 0.05 < 0.05 < 0.05
1.2
MSL 21170 (Vol. 5) Trt. 2
540 SL
1+2 14; 21
3.91 0.85 1.77
2.76 0.58 1.12
July 16, 61-66 cm
104 104 104
2.3 1.6 2.0
< 0.05 < 0.05 < 0.05
2.0
MSL 21170 (Vol. 5) Trt. 3
540 SL
1+3 14; 21; 12
1.54 1.67 1.73 1.76
1.01 1.16 1.12 1.16
July 28, BBCH 19 (9 or more leaves unfolded)
92 92 92
2.0 2.3 2.2
< 0.05 < 0.05 < 0.05
2.2
MSL 21170 (Vol. 5) Trt. 4
OR Oregon, (Benton) USA, 2008 (DKC55-82)
540 SL
1+3 29; 17; 17
3.96 0.84 0.81 0.90
2.75 0.53 0.53 0.55
August 03, 102-122 cm
145 145 145
2.7 2.1 2.4
0.05 0.05 0.05
2.5
MSL 21170 (Vol. 5) Trt. 2
540 SL
1+2 29; 17
3.99 0.85 1.67
2.75 0.53 1.08
July 17, 46-71 cm
162 162 162
1.1 0.75 0.91
< 0.05 < 0.05 < 0.05
1.0
MSL 21170 (Vol. 5) Trt. 3
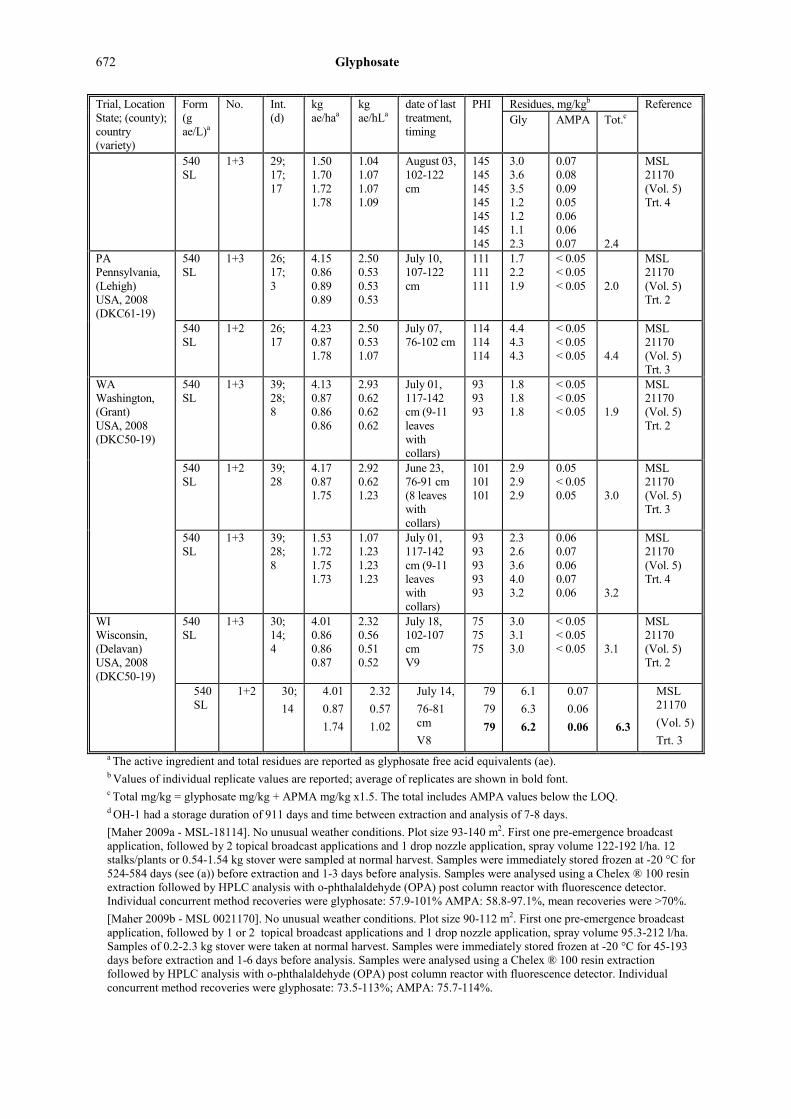
672 Glyphosate
Trial, Location State; (county); country (variety)
Form (g ae/L)a
No. Int. (d)
kg ae/haa
kg ae/hLa
date of last treatment, timing
PHI Residues, mg/kgb Reference Gly AMPA Tot.c
540 SL
1+3 29; 17; 17
1.50 1.70 1.72 1.78
1.04 1.07 1.07 1.09
August 03, 102-122 cm
145 145 145 145 145 145 145
3.0 3.6 3.5 1.2 1.2 1.1 2.3
0.07 0.08 0.09 0.05 0.06 0.06 0.07
2.4
MSL 21170 (Vol. 5) Trt. 4
PA Pennsylvania, (Lehigh) USA, 2008 (DKC61-19)
540 SL
1+3 26; 17; 3
4.15 0.86 0.89 0.89
2.50 0.53 0.53 0.53
July 10, 107-122 cm
111 111 111
1.7 2.2 1.9
< 0.05 < 0.05 < 0.05
2.0
MSL 21170 (Vol. 5) Trt. 2
540 SL
1+2 26; 17
4.23 0.87 1.78
2.50 0.53 1.07
July 07, 76-102 cm
114 114 114
4.4 4.3 4.3
< 0.05 < 0.05 < 0.05
4.4
MSL 21170 (Vol. 5) Trt. 3
WA Washington, (Grant) USA, 2008 (DKC50-19)
540 SL
1+3 39; 28; 8
4.13 0.87 0.86 0.86
2.93 0.62 0.62 0.62
July 01, 117-142 cm (9-11 leaves with collars)
93 93 93
1.8 1.8 1.8
< 0.05 < 0.05 < 0.05
1.9
MSL 21170 (Vol. 5) Trt. 2
540 SL
1+2 39; 28
4.17 0.87 1.75
2.92 0.62 1.23
June 23, 76-91 cm (8 leaves with collars)
101 101 101
2.9 2.9 2.9
0.05 < 0.05 0.05
3.0
MSL 21170 (Vol. 5) Trt. 3
540 SL
1+3 39; 28; 8
1.53 1.72 1.75 1.73
1.07 1.23 1.23 1.23
July 01, 117-142 cm (9-11 leaves with collars)
93 93 93 93 93
2.3 2.6 3.6 4.0 3.2
0.06 0.07 0.06 0.07 0.06
3.2
MSL 21170 (Vol. 5) Trt. 4
WI Wisconsin, (Delavan) USA, 2008 (DKC50-19)
540 SL
1+3 30; 14; 4
4.01 0.86 0.86 0.87
2.32 0.56 0.51 0.52
July 18, 102-107 cm V9
75 75 75
3.0 3.1 3.0
< 0.05 < 0.05 < 0.05
3.1
MSL 21170 (Vol. 5) Trt. 2
540 SL
1+2 30; 14
4.01 0.87 1.74
2.32 0.57 1.02
July 14, 76-81 cm V8
79 79 79
6.1 6.3 6.2
0.07 0.06 0.06
6.3
MSL 21170 (Vol. 5) Trt. 3
a The active ingredient and total residues are reported as glyphosate free acid equivalents (ae). b Values of individual replicate values are reported; average of replicates are shown in bold font. c Total mg/kg = glyphosate mg/kg + APMA mg/kg x1.5. The total includes AMPA values below the LOQ. d OH-1 had a storage duration of 911 days and time between extraction and analysis of 7-8 days. [Maher 2009a - MSL-18114]. No unusual weather conditions. Plot size 93-140 m2. First one pre-emergence broadcast application, followed by 2 topical broadcast applications and 1 drop nozzle application, spray volume 122-192 l/ha. 12 stalks/plants or 0.54-1.54 kg stover were sampled at normal harvest. Samples were immediately stored frozen at -20 °C for 524-584 days (see (a)) before extraction and 1-3 days before analysis. Samples were analysed using a Chelex ® 100 resin extraction followed by HPLC analysis with o-phthalaldehyde (OPA) post column reactor with fluorescence detector. Individual concurrent method recoveries were glyphosate: 57.9-101% AMPA: 58.8-97.1%, mean recoveries were >70%. [Maher 2009b - MSL 0021170]. No unusual weather conditions. Plot size 90-112 m2. First one pre-emergence broadcast application, followed by 1 or 2 topical broadcast applications and 1 drop nozzle application, spray volume 95.3-212 l/ha. Samples of 0.2-2.3 kg stover were taken at normal harvest. Samples were immediately stored frozen at -20 °C for 45-193 days before extraction and 1-6 days before analysis. Samples were analysed using a Chelex ® 100 resin extraction followed by HPLC analysis with o-phthalaldehyde (OPA) post column reactor with fluorescence detector. Individual concurrent method recoveries were glyphosate: 73.5-113%; AMPA: 75.7-114%.
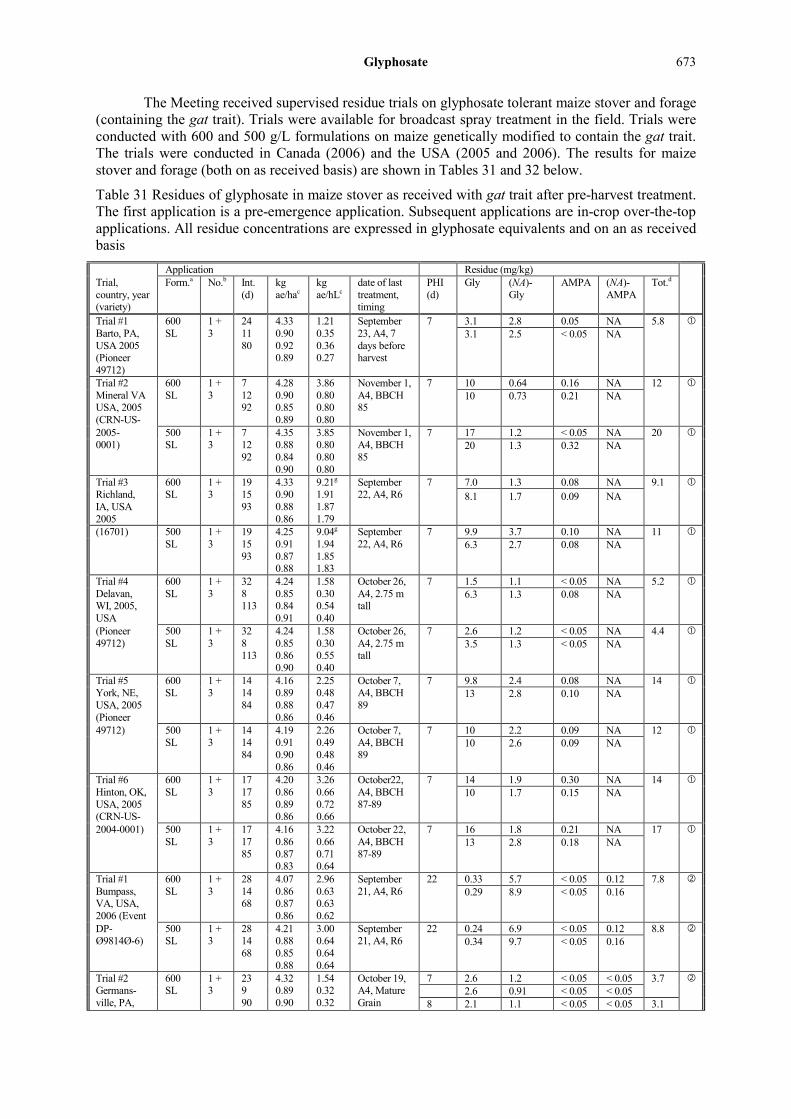
Glyphosate 673
The Meeting received supervised residue trials on glyphosate tolerant maize stover and forage (containing the gat trait). Trials were available for broadcast spray treatment in the field. Trials were conducted with 600 and 500 g/L formulations on maize genetically modified to contain the gat trait. The trials were conducted in Canada (2006) and the USA (2005 and 2006). The results for maize stover and forage (both on as received basis) are shown in Tables 31 and 32 below.
Table 31 Residues of glyphosate in maize stover as received with gat trait after pre-harvest treatment. The first application is a pre-emergence application. Subsequent applications are in-crop over-the-top applications. All residue concentrations are expressed in glyphosate equivalents and on an as received basis Application Residue (mg/kg) Trial, country, year (variety)
Form.a
No.b Int.
(d) kg ae/hac
kg ae/hLc
date of last treatment, timing
PHI (d)
Gly (NA)-Gly
AMPA (NA)-AMPA
Tot.d
Trial #1 Barto, PA, USA 2005 (Pioneer 49712)
600 SL
1 + 3
24 11 80
4.33 0.90 0.92 0.89
1.21 0.35 0.36 0.27
September 23, A4, 7 days before harvest
7 3.1 2.8 0.05 NA 5.8 3.1 2.5 < 0.05 NA
Trial #2 Mineral VA USA, 2005 (CRN-US-
600 SL
1 + 3
7 12 92
4.28 0.90 0.85 0.89
3.86 0.80 0.80 0.80
November 1, A4, BBCH 85
7 10 0.64 0.16 NA 12 10 0.73 0.21 NA
2005- 0001)
500 SL
1 + 3
7 12 92
4.35 0.88 0.84 0.90
3.85 0.80 0.80 0.80
November 1, A4, BBCH 85
7 17 1.2 < 0.05 NA 20 20 1.3 0.32 NA
Trial #3 Richland, IA, USA 2005
600 SL
1 + 3
19 15 93
4.33 0.90 0.88 0.86
9.21g
1.91 1.87 1.79
September 22, A4, R6
7 7.0 1.3 0.08 NA 9.1 8.1 1.7 0.09 NA
(16701) 500 SL
1 + 3
19 15 93
4.25 0.91 0.87 0.88
9.04g 1.94 1.85 1.83
September 22, A4, R6
7 9.9 3.7 0.10 NA 11 6.3 2.7 0.08 NA
Trial #4 Delavan, WI, 2005, USA
600 SL
1 + 3
32 8 113
4.24 0.85 0.84 0.91
1.58 0.30 0.54 0.40
October 26, A4, 2.75 m tall
7 1.5 1.1 < 0.05 NA 5.2 6.3 1.3 0.08 NA
(Pioneer 49712)
500 SL
1 + 3
32 8 113
4.24 0.85 0.86 0.90
1.58 0.30 0.55 0.40
October 26, A4, 2.75 m tall
7 2.6 1.2 < 0.05 NA 4.4 3.5 1.3 < 0.05 NA
Trial #5 York, NE, USA, 2005 (Pioneer
600 SL
1 + 3
14 14 84
4.16 0.89 0.88 0.86
2.25 0.48 0.47 0.46
October 7, A4, BBCH 89
7 9.8 2.4 0.08 NA 14 13 2.8 0.10 NA
49712) 500 SL
1 + 3
14 14 84
4.19 0.91 0.90 0.86
2.26 0.49 0.48 0.46
October 7, A4, BBCH 89
7 10 2.2 0.09 NA 12 10 2.6 0.09 NA
Trial #6 Hinton, OK, USA, 2005 (CRN-US-
600 SL
1 + 3
17 17 85
4.20 0.86 0.89 0.86
3.26 0.66 0.72 0.66
October22, A4, BBCH 87-89
7 14 1.9 0.30 NA 14 10 1.7 0.15 NA
2004-0001) 500 SL
1 + 3
17 17 85
4.16 0.86 0.87 0.83
3.22 0.66 0.71 0.64
October 22, A4, BBCH 87-89
7 16 1.8 0.21 NA 17 13 2.8 0.18 NA
Trial #1 Bumpass, VA, USA, 2006 (Event
600 SL
1 + 3
28 14 68
4.07 0.86 0.87 0.86
2.96 0.63 0.63 0.62
September 21, A4, R6
22 0.33 5.7 < 0.05 0.12 7.8 0.29 8.9 < 0.05 0.16
DP-Ø9814Ø-6)
500 SL
1 + 3
28 14 68
4.21 0.88 0.85 0.88
3.00 0.64 0.64 0.64
September 21, A4, R6
22 0.24 6.9 < 0.05 0.12 8.8 0.34 9.7 < 0.05 0.16
Trial #2 Germans-ville, PA,
600 SL
1 + 3
23 9 90
4.32 0.89 0.90
1.54 0.32 0.32
October 19, A4, Mature Grain
7 2.6 1.2 < 0.05 < 0.05 3.7 2.6 0.91 < 0.05 < 0.05 8 2.1 1.1 < 0.05 < 0.05 3.1

674 Glyphosate
Application Residue (mg/kg) Trial, country, year (variety)
Form.a
No.b Int.
(d) kg ae/hac
kg ae/hLc
date of last treatment, timing
PHI (d)
Gly (NA)-Gly
AMPA (NA)-AMPA
Tot.d
USA 2006 (Event DP-Ø9814Ø-6)
0.90 0.32 2.1 0.80 < 0.05 < 0.05 11 1.1 0.76 < 0.05 < 0.05 1.8 0.99 0.73 < 0.05 < 0.05 14 0.49 0.76 < 0.05 < 0.05 1.4 0.75 0.69 < 0.05 < 0.05 21 0.42 0.73 < 0.05 < 0.05 1.1 0.33 0.65 < 0.05 < 0.05 28 0.42 0.92 < 0.05 < 0.05 1.3 0.33 0.90 < 0.05 < 0.05
500 SL
1 + 3
23 9 90
4.31 0.89 0.92 0.90
1.54 0.32 0.33 0.32
October 19, A4, Mature Grain
7 2.5 1.1 < 0.05 < 0.05 3.7 2.3 1.4 < 0.05 < 0.05 8 2.2 1.2 < 0.05 < 0.05 3.5 2.0 1.4 < 0.05 < 0.05 11 0.78 0.77 < 0.05 < 0.05 1.7 0.76 1.0 < 0.05 < 0.05 14 0.47 1.1 < 0.05 < 0.05 1.6 0.47 1.1 < 0.05 < 0.05 21 0.33 1.2 < 0.05 < 0.05 1.6 0.37 1.1 < 0.05 < 0.05 28 0.25 0.83 < 0.05 < 0.05 1.2 0.22 0.95 < 0.05 < 0.05
Trial #3 Quitman, GA, USA, 2006 (Event
600 SL
1 + 3
12 11 97
4.16 0.88 0.90 0.83
2.15 0.45 0.50 0.50
October 12, A4, BBCH 89
7 3.3 0.44 0.09 < 0.05 5.0 4.8 0.25 0.15 < 0.05
DP-Ø9814Ø-6)
500 SL
1 + 3
12 11 97
4.14 0.88 0.87 0.85
2.14 0.45 0.49 0.51
October 12, A4, BBCH 89
7 3.7 0.30 0.16 < 0.05 4.0 3.2 0.36 0.09 < 0.05
Trial #4 Sycamore, GA, USA, 2006 (Event DP-Ø9814Ø-6)
600 SL
1 + 3
17 11 97
4.25 0.87 0.91 0.87
2.45 0.45 0.51 0.52
October 12, A4, MT (maturity)
7 11 0.73 0.17 < 0.05 6.2 9.4 0.85 0.13 < 0.05 8 13 1.0 0.24 < 0.05 14 12 1.0 0.25 < 0.05 10 3.5 0.60 0.09 < 0.05 4.5 4.1 0.41 0.15 < 0.05 14 6.4 0.69 0.21 < 0.05 6.5 4.9 0.54 0.16 < 0.05 21 2.7 1.0 0.07 < 0.05 4.1 3.4 0.77 0.10 < 0.05 28 3.7 0.72 0.11 < 0.05 4.3 3.0 0.88 0.11 < 0.05
500 SL
1 + 3
17 11 97
4.28 0.87 0.90 0.87
2.47 0.45 0.50 0.52
October 12, A4, MT (maturity)
7 12 0.75 0.23 < 0.05 13 11 0.94 0.29 < 0.05 8 10 0.72 0.21 < 0.05 11 10 0.98 0.23 < 0.05 10 4.0 0.68 0.17 < 0.05 5.5 4.4 1.4 0.15 0.05 14 3.4 1.3 0.11 < 0.05 4.4 3.1 0.65 0.10 < 0.05 21 2.4 0.75 0.06 < 0.05 2.5 1.2 0.45 < 0.05 < 0.05 28 2.1 0.65 0.07 < 0.05 3.4 3.3 0.50 0.08 < 0.05
Trial #5 Richland, IA, USA, 2006 (Event
600 SL
1 + 3
17 10 102
4.20 0.90 0.90 0.90
8.98 e 1.93 1.93 1.92
October 17, A4, R6
7 1.7 0.43 < 0.05 < 0.05 2.2 1.8 0.44 < 0.05 < 0.05
DP-Ø9814Ø-6)
500 SL
1 + 3
17 10 102
4.26 0.90 0.88 0.88
9.12e 1.92 1.88 1.88
October 17, A4, R6
7 2.4 0.48 < 0.05 < 0.05 2.2 1.0 0.41 < 0.05 < 0.05
Trial #6 Richland, IA, USA, 2006 (Event DP-Ø9814Ø-6)
600 SL
1 + 3
19 11 90
4.08 0.90 0.89 0.91
2.79 0.60 0.61 0.53
October 5, A4, R6
7 7.3 1.4 0.07 < 0.05 8.4 6.5 1.3 0.07 < 0.05
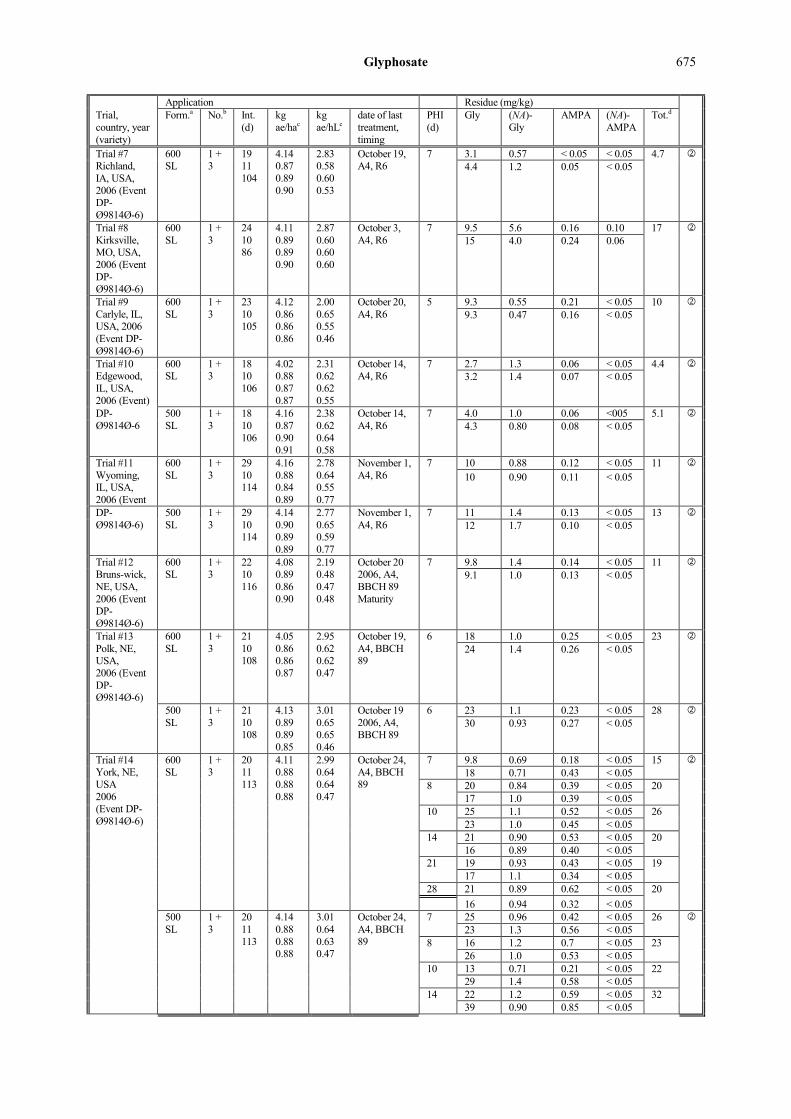
Glyphosate 675
Application Residue (mg/kg) Trial, country, year (variety)
Form.a
No.b Int.
(d) kg ae/hac
kg ae/hLc
date of last treatment, timing
PHI (d)
Gly (NA)-Gly
AMPA (NA)-AMPA
Tot.d
Trial #7 Richland, IA, USA, 2006 (Event DP-Ø9814Ø-6)
600 SL
1 + 3
19 11 104
4.14 0.87 0.89 0.90
2.83 0.58 0.60 0.53
October 19, A4, R6
7 3.1 0.57 < 0.05 < 0.05 4.7 4.4 1.2 0.05 < 0.05
Trial #8 Kirksville, MO, USA, 2006 (Event DP-Ø9814Ø-6)
600 SL
1 + 3
24 10 86
4.11 0.89 0.89 0.90
2.87 0.60 0.60 0.60
October 3, A4, R6
7 9.5 5.6 0.16 0.10 17 15 4.0 0.24 0.06
Trial #9 Carlyle, IL, USA, 2006 (Event DP- Ø9814Ø-6)
600 SL
1 + 3
23 10 105
4.12 0.86 0.86 0.86
2.00 0.65 0.55 0.46
October 20, A4, R6
5 9.3 0.55 0.21 < 0.05 10 9.3 0.47 0.16 < 0.05
Trial #10 Edgewood, IL, USA, 2006 (Event)
600 SL
1 + 3
18 10 106
4.02 0.88 0.87 0.87
2.31 0.62 0.62 0.55
October 14, A4, R6
7 2.7 1.3 0.06 < 0.05 4.4 3.2 1.4 0.07 < 0.05
DP-Ø9814Ø-6
500 SL
1 + 3
18 10 106
4.16 0.87 0.90 0.91
2.38 0.62 0.64 0.58
October 14, A4, R6
7 4.0 1.0 0.06 <005 5.1 4.3 0.80 0.08 < 0.05
Trial #11 Wyoming, IL, USA, 2006 (Event
600 SL
1 + 3
29 10 114
4.16 0.88 0.84 0.89
2.78 0.64 0.55 0.77
November 1, A4, R6
7 10 0.88 0.12 < 0.05 11 10 0.90 0.11 < 0.05
DP-Ø9814Ø-6)
500 SL
1 + 3
29 10 114
4.14 0.90 0.89 0.89
2.77 0.65 0.59 0.77
November 1, A4, R6
7 11 1.4 0.13 < 0.05 13 12 1.7 0.10 < 0.05
Trial #12 Bruns-wick, NE, USA, 2006 (Event DP- Ø9814Ø-6)
600 SL
1 + 3
22 10 116
4.08 0.89 0.86 0.90
2.19 0.48 0.47 0.48
October 20 2006, A4, BBCH 89 Maturity
7 9.8 1.4 0.14 < 0.05 11 9.1 1.0 0.13 < 0.05
Trial #13 Polk, NE, USA, 2006 (Event DP- Ø9814Ø-6)
600 SL
1 + 3
21 10 108
4.05 0.86 0.86 0.87
2.95 0.62 0.62 0.47
October 19, A4, BBCH 89
6 18 1.0 0.25 < 0.05 23 24 1.4 0.26 < 0.05
500 SL
1 + 3
21 10 108
4.13 0.89 0.89 0.85
3.01 0.65 0.65 0.46
October 19 2006, A4, BBCH 89
6 23 1.1 0.23 < 0.05 28 30 0.93 0.27 < 0.05
Trial #14 York, NE, USA 2006 (Event DP- Ø9814Ø-6)
600 SL
1 + 3
20 11 113
4.11 0.88 0.88 0.88
2.99 0.64 0.64 0.47
October 24, A4, BBCH 89
7 9.8 0.69 0.18 < 0.05 15 18 0.71 0.43 < 0.05 8 20 0.84 0.39 < 0.05 20 17 1.0 0.39 < 0.05 10 25 1.1 0.52 < 0.05 26 23 1.0 0.45 < 0.05 14 21 0.90 0.53 < 0.05 20 16 0.89 0.40 < 0.05 21 19 0.93 0.43 < 0.05 19 17 1.1 0.34 < 0.05 28 21 0.89 0.62 < 0.05 20 16 0.94 0.32 < 0.05
500 SL
1 + 3
20 11 113
4.14 0.88 0.88 0.88
3.01 0.64 0.63 0.47
October 24, A4, BBCH 89
7 25 0.96 0.42 < 0.05 26 23 1.3 0.56 < 0.05 8 16 1.2 0.7 < 0.05 23 26 1.0 0.53 < 0.05 10 13 0.71 0.21 < 0.05 22 29 1.4 0.58 < 0.05 14 22 1.2 0.59 < 0.05 32 39 0.90 0.85 < 0.05
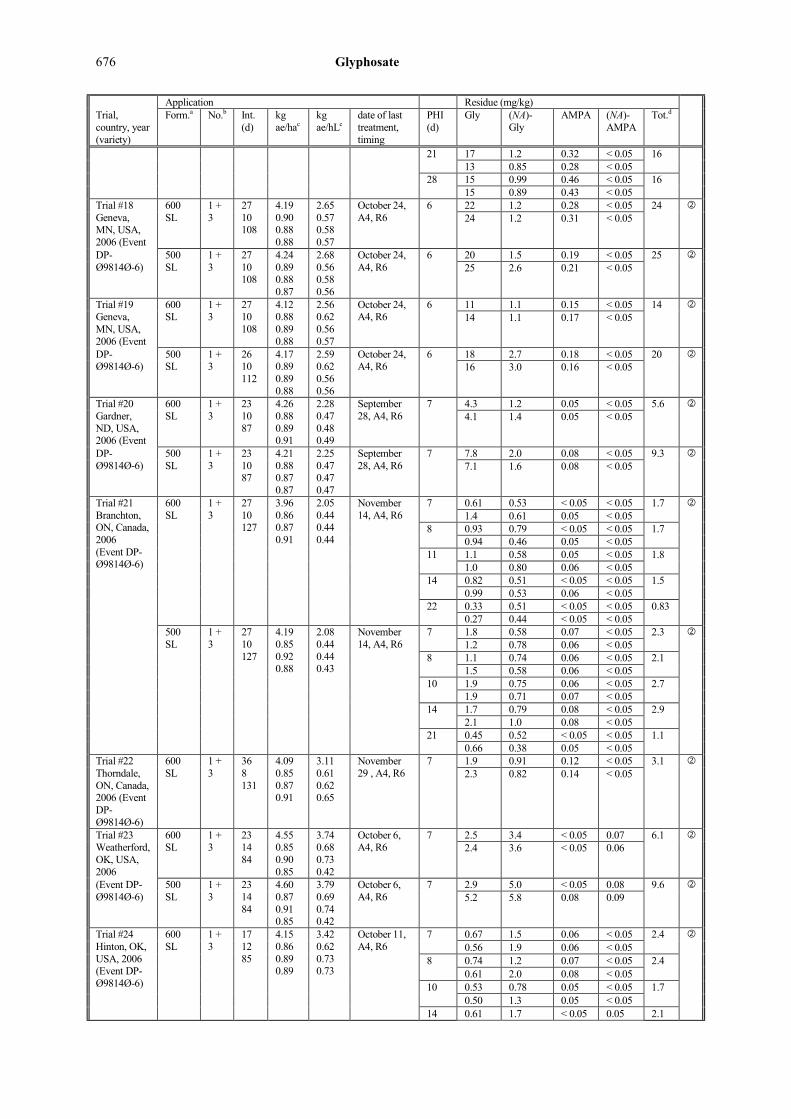
676 Glyphosate
Application Residue (mg/kg) Trial, country, year (variety)
Form.a
No.b Int.
(d) kg ae/hac
kg ae/hLc
date of last treatment, timing
PHI (d)
Gly (NA)-Gly
AMPA (NA)-AMPA
Tot.d
21 17 1.2 0.32 < 0.05 16 13 0.85 0.28 < 0.05 28 15 0.99 0.46 < 0.05 16 15 0.89 0.43 < 0.05
Trial #18 Geneva, MN, USA, 2006 (Event
600 SL
1 + 3
27 10 108
4.19 0.90 0.88 0.88
2.65 0.57 0.58 0.57
October 24, A4, R6
6 22 1.2 0.28 < 0.05 24 24 1.2 0.31 < 0.05
DP-Ø9814Ø-6)
500 SL
1 + 3
27 10 108
4.24 0.89 0.88 0.87
2.68 0.56 0.58 0.56
October 24, A4, R6
6 20 1.5 0.19 < 0.05 25 25 2.6 0.21 < 0.05
Trial #19 Geneva, MN, USA, 2006 (Event
600 SL
1 + 3
27 10 108
4.12 0.88 0.89 0.88
2.56 0.62 0.56 0.57
October 24, A4, R6
6 11 1.1 0.15 < 0.05 14 14 1.1 0.17 < 0.05
DP-Ø9814Ø-6)
500 SL
1 + 3
26 10 112
4.17 0.89 0.89 0.88
2.59 0.62 0.56 0.56
October 24, A4, R6
6 18 2.7 0.18 < 0.05 20 16 3.0 0.16 < 0.05
Trial #20 Gardner, ND, USA, 2006 (Event
600 SL
1 + 3
23 10 87
4.26 0.88 0.89 0.91
2.28 0.47 0.48 0.49
September 28, A4, R6
7 4.3 1.2 0.05 < 0.05 5.6 4.1 1.4 0.05 < 0.05
DP-Ø9814Ø-6)
500 SL
1 + 3
23 10 87
4.21 0.88 0.87 0.87
2.25 0.47 0.47 0.47
September 28, A4, R6
7 7.8 2.0 0.08 < 0.05 9.3 7.1 1.6 0.08 < 0.05
Trial #21 Branchton, ON, Canada, 2006 (Event DP- Ø9814Ø-6)
600 SL
1 + 3
27 10 127
3.96 0.86 0.87 0.91
2.05 0.44 0.44 0.44
November 14, A4, R6
7 0.61 0.53 < 0.05 < 0.05 1.7 1.4 0.61 0.05 < 0.05 8 0.93 0.79 < 0.05 < 0.05 1.7 0.94 0.46 0.05 < 0.05 11 1.1 0.58 0.05 < 0.05 1.8 1.0 0.80 0.06 < 0.05 14 0.82 0.51 < 0.05 < 0.05 1.5 0.99 0.53 0.06 < 0.05 22 0.33 0.51 < 0.05 < 0.05 0.83 0.27 0.44 < 0.05 < 0.05
500 SL
1 + 3
27 10 127
4.19 0.85 0.92 0.88
2.08 0.44 0.44 0.43
November 14, A4, R6
7 1.8 0.58 0.07 < 0.05 2.3 1.2 0.78 0.06 < 0.05 8 1.1 0.74 0.06 < 0.05 2.1 1.5 0.58 0.06 < 0.05 10 1.9 0.75 0.06 < 0.05 2.7 1.9 0.71 0.07 < 0.05 14 1.7 0.79 0.08 < 0.05 2.9 2.1 1.0 0.08 < 0.05 21 0.45 0.52 < 0.05 < 0.05 1.1 0.66 0.38 0.05 < 0.05
Trial #22 Thorndale, ON, Canada, 2006 (Event DP-Ø9814Ø-6)
600 SL
1 + 3
36 8 131
4.09 0.85 0.87 0.91
3.11 0.61 0.62 0.65
November 29 , A4, R6
7 1.9 0.91 0.12 < 0.05 3.1 2.3 0.82 0.14 < 0.05
Trial #23 Weatherford, OK, USA, 2006
600 SL
1 + 3
23 14 84
4.55 0.85 0.90 0.85
3.74 0.68 0.73 0.42
October 6, A4, R6
7 2.5 3.4 < 0.05 0.07 6.1 2.4 3.6 < 0.05 0.06
(Event DP-Ø9814Ø-6)
500 SL
1 + 3
23 14 84
4.60 0.87 0.91 0.85
3.79 0.69 0.74 0.42
October 6, A4, R6
7 2.9 5.0 < 0.05 0.08 9.6 5.2 5.8 0.08 0.09
Trial #24 Hinton, OK, USA, 2006 (Event DP-Ø9814Ø-6)
600 SL
1 + 3
17 12 85
4.15 0.86 0.89 0.89
3.42 0.62 0.73 0.73
October 11, A4, R6
7 0.67 1.5 0.06 < 0.05 2.4 0.56 1.9 0.06 < 0.05 8 0.74 1.2 0.07 < 0.05 2.4 0.61 2.0 0.08 < 0.05 10 0.53 0.78 0.05 < 0.05 1.7 0.50 1.3 0.05 < 0.05 14 0.61 1.7 < 0.05 0.05 2.1

Glyphosate 677
Application Residue (mg/kg) Trial, country, year (variety)
Form.a
No.b Int.
(d) kg ae/hac
kg ae/hLc
date of last treatment, timing
PHI (d)
Gly (NA)-Gly
AMPA (NA)-AMPA
Tot.d
0.50 1.1 < 0.05 < 0.05 21 0.43 1.5 < 0.05 < 0.05 2.2 0.51 1.8 0.06 0.05
500 SL
1 + 3
17 12 85
4.16 0.87 0.88 0.89
3.42 0.64 0.73 0.73
October 11, A4, R6
7 0.71 0.76 0.07 < 0.05 1.6 0.55 1.0 0.08 < 0.05 8 0.54 1.1 0.05 < 0.05 1.7 0.35 1.2 < 0.05 < 0.05 10 0.66 0.65 0.05 < 0.05 1.3 0.70 0.48 < 0.05 < 0.05 14 0.98 1.8 0.07 < 0.05 2.6 0.82 1.4 0.08 < 0.05 21 0.54 1.6 0.06 < 0.05 1.7 0.23 0.77 < 0.05 < 0.05
Gly = glyphosate, NA-gly = N-acetylglyphosate, NA-AMPA = N-acetyl AMPA; NA = not analysed a 600 g ae/L SL, 500 g ae/L SL. Ammonium sulfate (AMS) was also included as a product enhancer in both applications and a non-ionic surfactant was applied as an adjuvant with 600SL. b The number of applications includes the pre-emergence applications + the post emergence applications as x + y, respectively. c The active ingredient and all residues are reported as glyphosate free acid equivalents (ae). d For purposes of calculating total residue (Total), the sum of glyphosate, N-acetylglyphosate, AMPA and N-acetyl AMPA is reported. If both AMPA and N-acetyl AMPA residues were below LOQ (0.05 mg/kg) only the LOQ of AMPA was taken into account. Residues reported as nd or with a reported value below LOQ have been assigned the value < 0.05 mg/kg, because lower residue concentrations were not validated. For calculation purpose the value of 0.05 mg/kg was used. No conversion factors were applied, since all residues are reported as glyphosate equivalents. e Applications were made in approximately 47 l/ha to simulate aerial application. [DuPont 16701]. No unusual weather conditions. Plot size ranged from 37-84 m2. First one pre-emergence broadcast application, followed by 3 foliar broadcast applications by back pack sprayer, tractor mounted sprayer or hand boom. Spray volume 105-358 l/ha, apart from trial# 3 where 47-48 l/ha was applied without further explanation. Samples of 0.62-4.25 kg were collected at several time intervals, 7 days PHI or later. Samples were immediately stored at -20 °C for a maximum of 335 days before analysis. Samples were analysed using analytical method DuPont-15444 using extraction with formic acid and methanol and LC/MS/MS detection. Individual concurrent method recoveries in stover were glyphosate: 87-122% (mean =101 ± 11%); N-acetylglyphosate: 81-104% (mean = 94 ± 7%); and AMPA: 76-115% (mean = 95 ± 14%). No recovery data for N-acetyl AMPA in stover were provided. [DuPont 20122]. No unusual weather conditions. Plot size ranged from 39-1400 m2. First one pre-emergence broadcast application, followed by 3 foliar broadcast applications by back pack sprayer, tractor mounted sprayer or hand boom. Spray volume 112-280 L/ha, apart from trial# 5 where 47 l/ha was applied to mimic aerial application. Samples were composed of at least 12 plants and collected at several time intervals, 7 days PHI or later. Samples were immediately stored frozen for a maximum of 302 days (corn stover) before analysis. Samples were analysed using analytical method DuPont-15444 using extraction with formic acid and methanol and LC/MS/MS detection. Individual concurrent method recoveries in corn stover were: glyphosate: 68-119%; N-acetylglyphosate: 75-125%; AMPA: 81-107% and N-acetyl AMPA: 66-97%.
Table 32 Residues of glyphosate in maize forage on as received basis with gat trait after pre-harvest treatment. The first application is a pre-emergence application. Subsequent applications are in-crop over-the-top applications. All residue concentrations are expressed in glyphosate equivalents and on an as received basis Trial Application Residues (mg/kg) country, year (variety)
Form.a
No.b Int.
(days) kg ae/hac
kg ae/hLc
date of last treatment, timing
PHI (d)
Gly (NA)-Gly
AMPA (NA)-AMPA
Tot.d
Trial #1 Barto, PA, USA 2005 (Pioneer 49712)
600 SL
1 + 3
24 11 80
4.33 0.90 0.92 0.89
1.21 0.35 0.36 0.27
September 23, A4, 7 days before harvest
51 < 0.05 0.59 < 0.05 NA 0.50 < 0.05 0.42 < 0.05 NA
Trial #2 Mineral VA USA, 2005 (CRN-US-
600 SL
1 + 3
7 12 92
4.28 0.90 0.85 0.89
3.86 0.80 0.80 0.80
November 1, A4, BBCH 85
51 < 0.05 0.28 < 0.05 NA 0.25 < 0.05 0.22 < 0.05 NA

678 Glyphosate
Trial Application Residues (mg/kg) country, year (variety)
Form.a
No.b Int.
(days) kg ae/hac
kg ae/hLc
date of last treatment, timing
PHI (d)
Gly (NA)-Gly
AMPA (NA)-AMPA
Tot.d
2005- 0001) 500 SL
1 + 3
7 12 92
4.35 0.88 0.84 0.90
3.85 0.80 0.80 0.80
November 1, A4, BBCH 85
51 < 0.05 0.27 < 0.05 NA 0.37 < 0.05 0.47 < 0.05 NA
Trial #3 Richland, IA, USA 2005
600 SL
1 + 3
19 15 93
4.33 0.90 0.88 0.86
9.21e
1.91 1.87 1.79
September 22, A4, R6
64 < 0.05 0.37 < 0.05 NA 0.46 < 0.05 0.55 < 0.05 NA
(16701) 500 SL
1 + 3
19 15 93
4.25 0.91 0.87 0.88
9.04 e 1.94 1.85 1.83
September 22, A4, R6
64 < 0.05 0.92 < 0.05 NA 0.96 < 0.05 1.0 < 0.05 NA
Trial #4 Delavan, WI, 2005, USA
600 SL
1 + 3
32 8 113
4.24 0.85 0.84 0.91
1.58 0.30 0.54 0.40
October 26, A4, 2.75 m tall
63 < 0.05 1.6 < 0.05 NA 1.6 < 0.05 1.7 < 0.05 NA
(Pioneer 49712)
500 SL
1 + 3
32 8 113
4.24 0.85 0.86 0.90
1.58 0.30 0.55 0.40
October 26, A4, 2.75 m tall
63 < 0.05 1.8 < 0.05 NA 1.6 < 0.05 1.5 < 0.05 NA
Trial #5 York, NE, USA, 2005 (Pioneer
600 SL
1 + 3
14 14 84
4.16 0.89 0.88 0.86
2.25 0.48 0.47 0.46
October 7, A4, BBCH 89
55 < 0.05 1.1 < 0.05 NA 1.2 < 0.05 1.3 < 0.05 NA
49712) 500 SL
1 + 3
14 14 84
4.19 0.91 0.90 0.86
2.26 0.49 0.48 0.46
October 7, A4, BBCH 89
55 < 0.05 1.7 < 0.05 NA 1.6 < 0.05 1.4 < 0.05 NA
Trial #6 Hinton, OK, USA, 2005 (CRN-US-
600 SL
1 + 3
17 17 85
4.20 0.86 0.89 0.86
3.26 0.66 0.72 0.66
October 22, A4, BBCH 87-89
52 < 0.05 1.1 < 0.05 NA 1.2 < 0.05 1.4 < 0.05 NA
2004-0001) 500 SL
1 + 3
17 17 85
4.16 0.86 0.87 0.83
3.22 0.66 0.71 0.64
October 22, A4, BBCH 87-89
52 < 0.05 0.82 < 0.05 NA 1.1 < 0.05 1.3 < 0.05 NA
Trial #1 Bumpass, VA, USA, 2006 (Event
600 SL
1 + 3
28 14 68
4.07 0.86 0.87 0.86
2.96 0.63 0.63 0.62
September 21, A4, R6
61 < 0.05 3.5 < 0.05 < 0.05 3.6 < 0.05 3.8 < 0.05 < 0.05
DP-Ø9814Ø-6)
500 SL
1 + 3
28 14 68
4.21 0.88 0.85 0.88
3.00 0.64 0.64 0.64
September 21, A4, R6
61 < 0.05 1.8 < 0.05 < 0.05 2.4 < 0.05 2.9 < 0.05 < 0.05
Trial #2 Germansville, PA, USA 2006 (Event DP-Ø9814Ø-6)
600 SL
1 + 3
23 9 90
4.32 0.89 0.90 0.90
1.54 0.32 0.32 0.32
October 19, A4, Mature Grain
66 < 0.05 1.0 < 0.05 < 0.05 1.2 < 0.05 1.3 < 0.05 < 0.05 67 < 0.05 0.82 < 0.05 < 0.05 0.66 < 0.05 0.50 < 0.05 < 0.05 69 < 0.05 1.1 < 0.05 < 0.05 0.91 < 0.05 0.72 < 0.05 < 0.05 73 < 0.05 0.90 < 0.05 < 0.05 0.90 < 0.05 0.90 < 0.05 < 0.05 80 < 0.05 1.3 < 0.05 < 0.05 1.3 < 0.05 1.3 < 0.05 < 0.05 87 < 0.05 1.0 < 0.05 < 0.05 1.2 < 0.05 1.4 < 0.05 < 0.05
500 SL
1 + 3
23 9 90
4.31 0.89 0.92 0.90
1.54 0.32 0.33 0.32
October 19, A4, Mature Grain
66 < 0.05 2.0 < 0.05 < 0.05 1.6 < 0.05 1.2 < 0.05 < 0.05 67 < 0.05 1.4 < 0.05 < 0.05 1.3 < 0.05 1.2 < 0.05 < 0.05 69 < 0.05 1.3 < 0.05 < 0.05 1.2 < 0.05 1.2 < 0.05 < 0.05 73 < 0.05 1.7 < 0.05 < 0.05 1.5 < 0.05 1.3 < 0.05 < 0.05 80 < 0.05 1.7 < 0.05 < 0.05 1.7 < 0.05 1.7 < 0.05 < 0.05 87 < 0.05 1.4 < 0.05 < 0.05 1.5 < 0.05 1.6 < 0.05 < 0.05
Trial #3 600 1 + 12 4.16 2.15 October 12, 70 < 0.05 0.12 < 0.05 < 0.05 0.14

Glyphosate 679
Trial Application Residues (mg/kg) country, year (variety)
Form.a
No.b Int.
(days) kg ae/hac
kg ae/hLc
date of last treatment, timing
PHI (d)
Gly (NA)-Gly
AMPA (NA)-AMPA
Tot.d
Quitman, GA, USA, 2006 (Event
SL 3 11 97
0.88 0.90 0.83
0.45 0.50 0.50
A4, BBCH 89
< 0.05 0.16 < 0.05 < 0.05
DP-Ø9814Ø-6)
500 SL
1 + 3
12 11 97
4.14 0.88 0.87 0.85
2.14 0.45 0.49 0.51
October 12, A4, BBCH 89
70 < 0.05 0.11 < 0.05 < 0.05 0.092 < 0.05 0.07 < 0.05 < 0.05
Trial #4 Sycamore, GA, USA, 2006 (Event DP-Ø9814Ø-6)
600 SL
1 + 3
17 11 97
4.25 0.87 0.91 0.87
2.45 0.45 0.51 0.52
October 12, A4, MT (maturity)
67 < 0.05 0.78 < 0.05 < 0.05 0.89 < 0.05 1.0 < 0.05 < 0.05 68 < 0.05 0.52 < 0.05 < 0.05 0.60 < 0.05 0.68 < 0.05 < 0.05 70 < 0.05 0.52 < 0.05 < 0.05 0.49 < 0.05 0.45 < 0.05 < 0.05 74 < 0.05 0.37 < 0.05 < 0.05 0.46 < 0.05 0.55 < 0.05 < 0.05 81 < 0.05 0.26 < 0.05 < 0.05 0.29 < 0.05 0.32 < 0.05 < 0.05 88 < 0.05 0.29 < 0.05 < 0.05 0.32 < 0.05 0.34 < 0.05 < 0.05
500 SL
1 + 3
17 11 97
4.28 0.87 0.90 0.87
2.47 0.45 0.50 0.52
October 12, A4, MT (maturity)
67 < 0.05 0.56 < 0.05 < 0.05 0.67 < 0.05 0.77 < 0.05 < 0.05 68 < 0.05 0.58 < 0.05 < 0.05 0.60 < 0.05 0.61 < 0.05 < 0.05 70 < 0.05 0.44 < 0.05 < 0.05 0.46 < 0.05 0.49 < 0.05 < 0.05 74 < 0.05 0.25 < 0.05 < 0.05 0.30 < 0.05 0.34 < 0.05 < 0.05 81 < 0.05 0.35 < 0.05 < 0.05 0.31 < 0.05 0.27 < 0.05 < 0.05 88 < 0.05 0.30 < 0.05 < 0.05 0.26 < 0.05 0.22 < 0.05 < 0.05
Trial #5 Richland, IA, USA, 2006 (Event)
600 SL
1 + 3
17 10 102
4.20 0.90 0.90 0.90
8.98 e 1.93 1.93 1.92
October 17, A4, R6
62 < 0.05 0.32 < 0.05 < 0.05 0.46 < 0.05 0.60 < 0.05 < 0.05
DP-Ø9814Ø-6
500 SL
1 + 3
17 10 102
4.26 0.90 0.88 0.88
9.12e 1.92 1.88 1.88
October 17, A4, R6
62 < 0.05 0.55 < 0.05 < 0.05 0.46 < 0.05 0.38 < 0.05 < 0.05
Trial #6 Richland, IA, USA, 2006 (Event DP-Ø9814Ø-6)
600 SL
1 + 3
19 11 90
4.08 0.90 0.89 0.91
2.79 0.60 0.61 0.53
October 5, A4, R6
63 < 0.05 0.61 < 0.05 < 0.05 0.68 < 0.05 0.76 < 0.05 < 0.05
Trial #7 Richland, IA, USA, 2006 (Event DP-Ø9814Ø-6)
600 SL
1 + 3
19 11 104
4.14 0.87 0.89 0.90
2.83 0.58 0.60 0.53
October 19, A4, R6
62 < 0.05 0.91 < 0.05 < 0.05 0.88 < 0.05 0.86 < 0.05 < 0.05
Trial #8 Kirksville, MO, USA, 2006 (Event DP-Ø9814Ø-6)
600 SL
1 + 3
24 10 86
4.11 0.89 0.89 0.90
2.87 0.60 0.60 0.60
October 3, A4, R6
57 < 0.05 4.8 < 0.05 < 0.05 4.8 < 0.05 4.7 < 0.05 < 0.05
Trial #9 Carlyle, IL, USA, 2006 (Event DP-Ø9814Ø-6)
600 SL
1 + 3
23 10 105
4.12 0.86 0.86 0.86
2.00 0.65 0.55 0.46
October 20, A4, R6
54 < 0.05 0.74 < 0.05 < 0.05 0.70 < 0.05 0.65 < 0.05 < 0.05
Trial #10 Edgewood, IL, USA, 2006 (Event
600 SL
1 + 3
18 10 106
4.02 0.88 0.87 0.87
2.31 0.62 0.62 0.55
October 14 2006, A4, R6
57 < 0.05 0.94 < 0.05 < 0.05 1.1 < 0.05 1.2 < 0.05 < 0.05
DP-Ø9814Ø-6)
500 SL
1 + 3
18 10 106
4.16 0.87 0.90 0.91
2.38 0.62 0.64 0.58
October 14, A4, R6
57 < 0.05 0.85 < 0.05 < 0.05 0.86 < 0.05 0.88 < 0.05 < 0.05
Trial #11 600 1 + 29 4.16 2.78 November 88 < 0.05 1.2 < 0.05 < 0.05 1.1

680 Glyphosate
Trial Application Residues (mg/kg) country, year (variety)
Form.a
No.b Int.
(days) kg ae/hac
kg ae/hLc
date of last treatment, timing
PHI (d)
Gly (NA)-Gly
AMPA (NA)-AMPA
Tot.d
Wyoming, IL, USA, 2006 (Event
SL 3 10 114
0.88 0.84 0.89
0.64 0.55 0.77
1, A4, R6
< 0.05 0.95 < 0.05 < 0.05
DP-Ø9814Ø-6)
500 SL
1 + 3
29 10 114
4.14 0.90 0.89 0.89
2.77 0.65 0.59 0.77
November 1, A4, R6
88 < 0.05 1.8 < 0.05 < 0.05 1.7 < 0.05 1.6 < 0.05 < 0.05
Trial #12 Bruns-wick, NE, USA, 2006 (Event DP- Ø9814Ø-6)
600 SL
1 + 3
22 10 116
4.08 0.89 0.86 0.90
2.19 0.48 0.47 0.48
October 20 2006, A4, BBCH 89 Maturity
66 < 0.05 0.46 < 0.05 < 0.05 0.54 < 0.05 0.61 < 0.05 < 0.05
Trial #13 Polk, NE, USA, 2006 (Event DP-
600 SL
1 + 3
21 10 108
4.05 0.86 0.86 0.87
2.95 0.62 0.62 0.47
October 19, A4, BBCH 89
60 < 0.05 0.62 < 0.05 < 0.05 0.64 < 0.05 0.66 < 0.05 < 0.05
Ø9814Ø-6) 500 SL
1 + 3
21 10 108
4.13 0.89 0.89 0.85
3.01 0.65 0.65 0.46
October 19, A4, BBCH 89
60 < 0.05 0.61 < 0.05 < 0.05 0.56 < 0.05 0.51 < 0.05 < 0.05
Trial #14 York, NE, USA 2006 (Event DP- Ø9814Ø-6)
600 SL
1 + 3
20 11 113
4.11 0.88 0.88 0.88
2.99 0.64 0.64 0.47
October 24, A4, BBCH 89
57 < 0.05 0.56 < 0.05 < 0.05 0.50 < 0.05 0.44 < 0.05 < 0.05 58 < 0.05 0.38 < 0.05 < 0.05 0.40 < 0.05 0.43 < 0.05 < 0.05 60 < 0.05 0.49 < 0.05 < 0.05 0.47 < 0.05 0.45 < 0.05 < 0.05 64 < 0.05 0.18 < 0.05 < 0.05 0.40 < 0.05 0.63 < 0.05 < 0.05 72 < 0.05 0.30 < 0.05 < 0.05 0.33 < 0.05 0.36 < 0.05 < 0.05 78 < 0.05 0.32 < 0.05 < 0.05 0.34 < 0.05 0.37 < 0.05 < 0.05
500 SL
1 + 3
20 11 113
4.14 0.88 0.88 0.88
3.01 0.64 0.63 0.47
October 24, A4, BBCH 89
57 < 0.05 0.18 < 0.05 < 0.05 0.32 < 0.05 0.47 < 0.05 < 0.05 58 < 0.05 0.45 < 0.05 < 0.05 0.42 < 0.05 0.38 < 0.05 < 0.05 60 < 0.05 0.60 < 0.05 < 0.05 0.66 < 0.05 0.72 < 0.05 < 0.05 64 < 0.05 0.45 < 0.05 < 0.05 0.41 < 0.05 0.37 < 0.05 < 0.05 72 < 0.05 0.46 < 0.05 < 0.05 0.39 < 0.05 0.32 < 0.05 < 0.05 78 < 0.05 0.49 < 0.05 < 0.05 0.39 < 0.05 0.29 < 0.05 < 0.05
Trial #18 Geneva, MN, USA, 2006 (Event
600 SL
1 + 3
27 10 108
4.19 0.90 0.88 0.88
2.65 0.57 0.58 0.57
October 24, A4, R6
74 < 0.05 0.72 < 0.05 < 0.05 0.66 < 0.05 0.61 < 0.05 < 0.05
DP-Ø9814Ø-6)
500 SL
1 + 3
27 10 108
4.24 0.89 0.88 0.87
2.68 0.56 0.58 0.56
October 24, A4, R6
74 < 0.05 0.50 < 0.05 < 0.05 0.46 < 0.05 0.42 < 0.05 < 0.05
Trial #19 Geneva, MN, USA, 2006 (Event
600 SL
1 + 3
27 10 108
4.12 0.88 0.89 0.88
2.56 0.62 0.56 0.57
October 24, A4, R6
71 < 0.05 0.51 < 0.05 < 0.05 0.60 < 0.05 0.69 < 0.05 < 0.05
DP-Ø9814Ø-6)
500 SL
1 + 3
26 10 112
4.17 0.89 0.89 0.88
2.59 0.62 0.56 0.56
October 24 , A4, R6
71 < 0.05 0.48 < 0.05 < 0.05 0.79 < 0.05 1.1 < 0.05 < 0.05
Trial #20 Gardner, ND, USA, 2006 (Event
600 SL
1 + 3
23 10 87
4.26 0.88 0.89 0.91
2.28 0.47 0.48 0.49
September 28, A4, R6
75 < 0.05 1.1 < 0.05 < 0.05 1.0 < 0.05 0.99 < 0.05 < 0.05
DP-Ø9814Ø-6)
500 SL
1 + 3
23 10 87
4.21 0.88 0.87 0.87
2.25 0.47 0.47 0.47
September 28, A4, R6
75 < 0.05 1.0 < 0.05 < 0.05 1.5 < 0.05 2.0 < 0.05 < 0.05
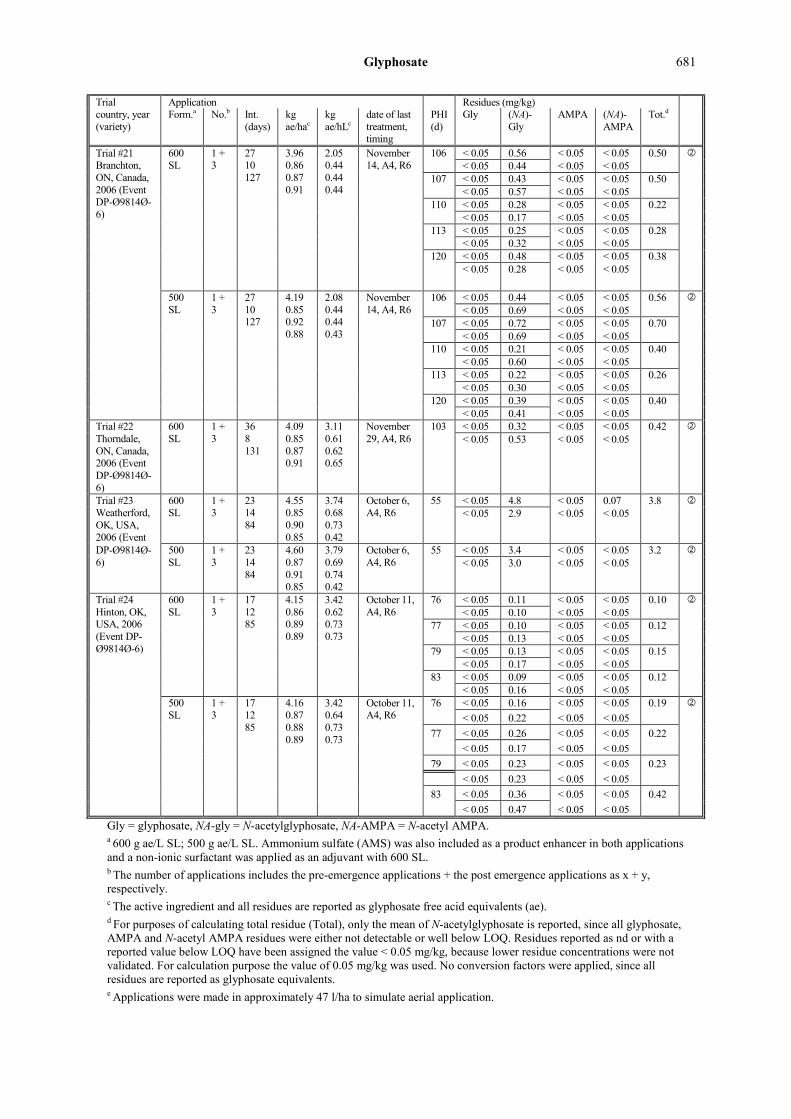
Glyphosate 681
Trial Application Residues (mg/kg) country, year (variety)
Form.a
No.b Int.
(days) kg ae/hac
kg ae/hLc
date of last treatment, timing
PHI (d)
Gly (NA)-Gly
AMPA (NA)-AMPA
Tot.d
Trial #21 Branchton, ON, Canada, 2006 (Event DP-Ø9814Ø-6)
600 SL
1 + 3
27 10 127
3.96 0.86 0.87 0.91
2.05 0.44 0.44 0.44
November 14, A4, R6
106 < 0.05 0.56 < 0.05 < 0.05 0.50 < 0.05 0.44 < 0.05 < 0.05 107 < 0.05 0.43 < 0.05 < 0.05 0.50 < 0.05 0.57 < 0.05 < 0.05 110 < 0.05 0.28 < 0.05 < 0.05 0.22 < 0.05 0.17 < 0.05 < 0.05 113 < 0.05 0.25 < 0.05 < 0.05 0.28 < 0.05 0.32 < 0.05 < 0.05 120 < 0.05 0.48 < 0.05 < 0.05 0.38 < 0.05 0.28 < 0.05 < 0.05
500 SL
1 + 3
27 10 127
4.19 0.85 0.92 0.88
2.08 0.44 0.44 0.43
November 14, A4, R6
106 < 0.05 0.44 < 0.05 < 0.05 0.56 < 0.05 0.69 < 0.05 < 0.05 107 < 0.05 0.72 < 0.05 < 0.05 0.70 < 0.05 0.69 < 0.05 < 0.05 110 < 0.05 0.21 < 0.05 < 0.05 0.40 < 0.05 0.60 < 0.05 < 0.05 113 < 0.05 0.22 < 0.05 < 0.05 0.26 < 0.05 0.30 < 0.05 < 0.05 120 < 0.05 0.39 < 0.05 < 0.05 0.40 < 0.05 0.41 < 0.05 < 0.05
Trial #22 Thorndale, ON, Canada, 2006 (Event DP-Ø9814Ø-6)
600 SL
1 + 3
36 8 131
4.09 0.85 0.87 0.91
3.11 0.61 0.62 0.65
November 29, A4, R6
103 < 0.05 0.32 < 0.05 < 0.05 0.42 < 0.05 0.53 < 0.05 < 0.05
Trial #23 Weatherford, OK, USA, 2006 (Event
600 SL
1 + 3
23 14 84
4.55 0.85 0.90 0.85
3.74 0.68 0.73 0.42
October 6, A4, R6
55 < 0.05 4.8 < 0.05 0.07 3.8 < 0.05 2.9 < 0.05 < 0.05
DP-Ø9814Ø-6)
500 SL
1 + 3
23 14 84
4.60 0.87 0.91 0.85
3.79 0.69 0.74 0.42
October 6, A4, R6
55 < 0.05 3.4 < 0.05 < 0.05 3.2 < 0.05 3.0 < 0.05 < 0.05
Trial #24 Hinton, OK, USA, 2006 (Event DP- Ø9814Ø-6)
600 SL
1 + 3
17 12 85
4.15 0.86 0.89 0.89
3.42 0.62 0.73 0.73
October 11, A4, R6
76 < 0.05 0.11 < 0.05 < 0.05 0.10 < 0.05 0.10 < 0.05 < 0.05 77 < 0.05 0.10 < 0.05 < 0.05 0.12 < 0.05 0.13 < 0.05 < 0.05 79 < 0.05 0.13 < 0.05 < 0.05 0.15 < 0.05 0.17 < 0.05 < 0.05 83 < 0.05 0.09 < 0.05 < 0.05 0.12 < 0.05 0.16 < 0.05 < 0.05
500 SL
1 + 3
17 12 85
4.16 0.87 0.88 0.89
3.42 0.64 0.73 0.73
October 11, A4, R6
76 < 0.05 0.16 < 0.05 < 0.05 0.19 < 0.05 0.22 < 0.05 < 0.05 77 < 0.05 0.26 < 0.05 < 0.05 0.22 < 0.05 0.17 < 0.05 < 0.05 79 < 0.05 0.23 < 0.05 < 0.05 0.23 < 0.05 0.23 < 0.05 < 0.05 83 < 0.05 0.36 < 0.05 < 0.05 0.42 < 0.05 0.47 < 0.05 < 0.05
Gly = glyphosate, NA-gly = N-acetylglyphosate, NA-AMPA = N-acetyl AMPA. a 600 g ae/L SL; 500 g ae/L SL. Ammonium sulfate (AMS) was also included as a product enhancer in both applications and a non-ionic surfactant was applied as an adjuvant with 600 SL. b The number of applications includes the pre-emergence applications + the post emergence applications as x + y, respectively. c The active ingredient and all residues are reported as glyphosate free acid equivalents (ae). d For purposes of calculating total residue (Total), only the mean of N-acetylglyphosate is reported, since all glyphosate, AMPA and N-acetyl AMPA residues were either not detectable or well below LOQ. Residues reported as nd or with a reported value below LOQ have been assigned the value < 0.05 mg/kg, because lower residue concentrations were not validated. For calculation purpose the value of 0.05 mg/kg was used. No conversion factors were applied, since all residues are reported as glyphosate equivalents. e Applications were made in approximately 47 l/ha to simulate aerial application.
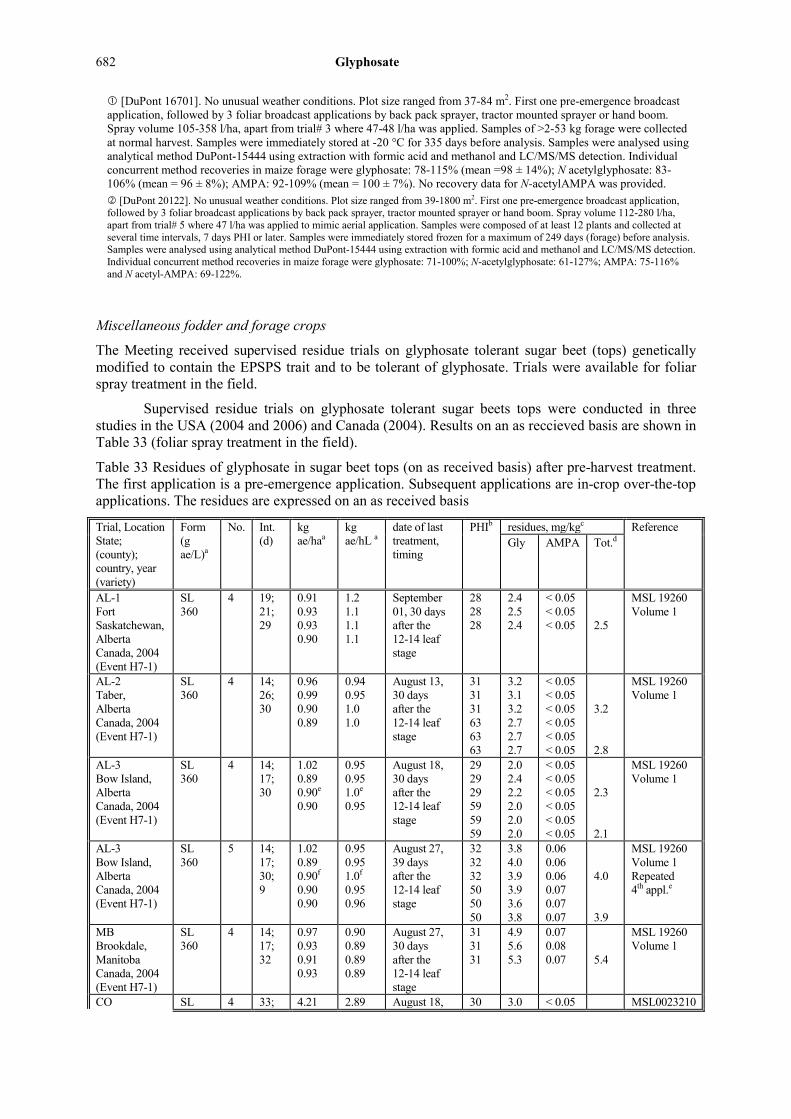
682 Glyphosate
[DuPont 16701]. No unusual weather conditions. Plot size ranged from 37-84 m2. First one pre-emergence broadcast application, followed by 3 foliar broadcast applications by back pack sprayer, tractor mounted sprayer or hand boom. Spray volume 105-358 l/ha, apart from trial# 3 where 47-48 l/ha was applied. Samples of >2-53 kg forage were collected at normal harvest. Samples were immediately stored at -20 °C for 335 days before analysis. Samples were analysed using analytical method DuPont-15444 using extraction with formic acid and methanol and LC/MS/MS detection. Individual concurrent method recoveries in maize forage were glyphosate: 78-115% (mean =98 ± 14%); N acetylglyphosate: 83-106% (mean = 96 ± 8%); AMPA: 92-109% (mean = 100 ± 7%). No recovery data for N-acetylAMPA was provided. [DuPont 20122]. No unusual weather conditions. Plot size ranged from 39-1800 m2. First one pre-emergence broadcast application, followed by 3 foliar broadcast applications by back pack sprayer, tractor mounted sprayer or hand boom. Spray volume 112-280 l/ha, apart from trial# 5 where 47 l/ha was applied to mimic aerial application. Samples were composed of at least 12 plants and collected at several time intervals, 7 days PHI or later. Samples were immediately stored frozen for a maximum of 249 days (forage) before analysis. Samples were analysed using analytical method DuPont-15444 using extraction with formic acid and methanol and LC/MS/MS detection. Individual concurrent method recoveries in maize forage were glyphosate: 71-100%; N-acetylglyphosate: 61-127%; AMPA: 75-116% and N acetyl-AMPA: 69-122%.
Miscellaneous fodder and forage crops
The Meeting received supervised residue trials on glyphosate tolerant sugar beet (tops) genetically modified to contain the EPSPS trait and to be tolerant of glyphosate. Trials were available for foliar spray treatment in the field.
Supervised residue trials on glyphosate tolerant sugar beets tops were conducted in three studies in the USA (2004 and 2006) and Canada (2004). Results on an as reccieved basis are shown in Table 33 (foliar spray treatment in the field).
Table 33 Residues of glyphosate in sugar beet tops (on as received basis) after pre-harvest treatment. The first application is a pre-emergence application. Subsequent applications are in-crop over-the-top applications. The residues are expressed on an as received basis
Trial, Location State; (county); country, year (variety)
Form (g ae/L)a
No. Int. (d)
kg ae/haa
kg ae/hL a
date of last treatment, timing
PHIb residues, mg/kgc Reference Gly AMPA Tot.d
AL-1 Fort Saskatchewan, Alberta Canada, 2004 (Event H7-1)
SL 360
4 19; 21; 29
0.91 0.93 0.93 0.90
1.2 1.1 1.1 1.1
September 01, 30 days after the 12-14 leaf stage
28 28 28
2.4 2.5 2.4
< 0.05 < 0.05 < 0.05
2.5
MSL 19260 Volume 1
AL-2 Taber, Alberta Canada, 2004 (Event H7-1)
SL 360
4 14; 26; 30
0.96 0.99 0.90 0.89
0.94 0.95 1.0 1.0
August 13, 30 days after the 12-14 leaf stage
31 31 31 63 63 63
3.2 3.1 3.2 2.7 2.7 2.7
< 0.05 < 0.05 < 0.05 < 0.05 < 0.05 < 0.05
3.2 2.8
MSL 19260 Volume 1
AL-3 Bow Island, Alberta Canada, 2004 (Event H7-1)
SL 360
4 14; 17; 30
1.02 0.89 0.90e
0.90
0.95 0.95 1.0e
0.95
August 18, 30 days after the 12-14 leaf stage
29 29 29 59 59 59
2.0 2.4 2.2 2.0 2.0 2.0
< 0.05 < 0.05 < 0.05 < 0.05 < 0.05 < 0.05
2.3 2.1
MSL 19260 Volume 1
AL-3 Bow Island, Alberta Canada, 2004 (Event H7-1)
SL 360
5 14; 17; 30; 9
1.02 0.89 0.90f
0.90 0.90
0.95 0.95 1.0f
0.95 0.96
August 27, 39 days after the 12-14 leaf stage
32 32 32 50 50 50
3.8 4.0 3.9 3.9 3.6 3.8
0.06 0.06 0.06 0.07 0.07 0.07
4.0 3.9
MSL 19260 Volume 1 Repeated 4th appl.e
MB Brookdale, Manitoba Canada, 2004 (Event H7-1)
SL 360
4 14; 17; 32
0.97 0.93 0.91 0.93
0.90 0.89 0.89 0.89
August 27, 30 days after the 12-14 leaf stage
31 31 31
4.9 5.6 5.3
0.07 0.08 0.07
5.4
MSL 19260 Volume 1
CO SL 4 33; 4.21 2.89 August 18, 30 3.0 < 0.05 MSL0023210
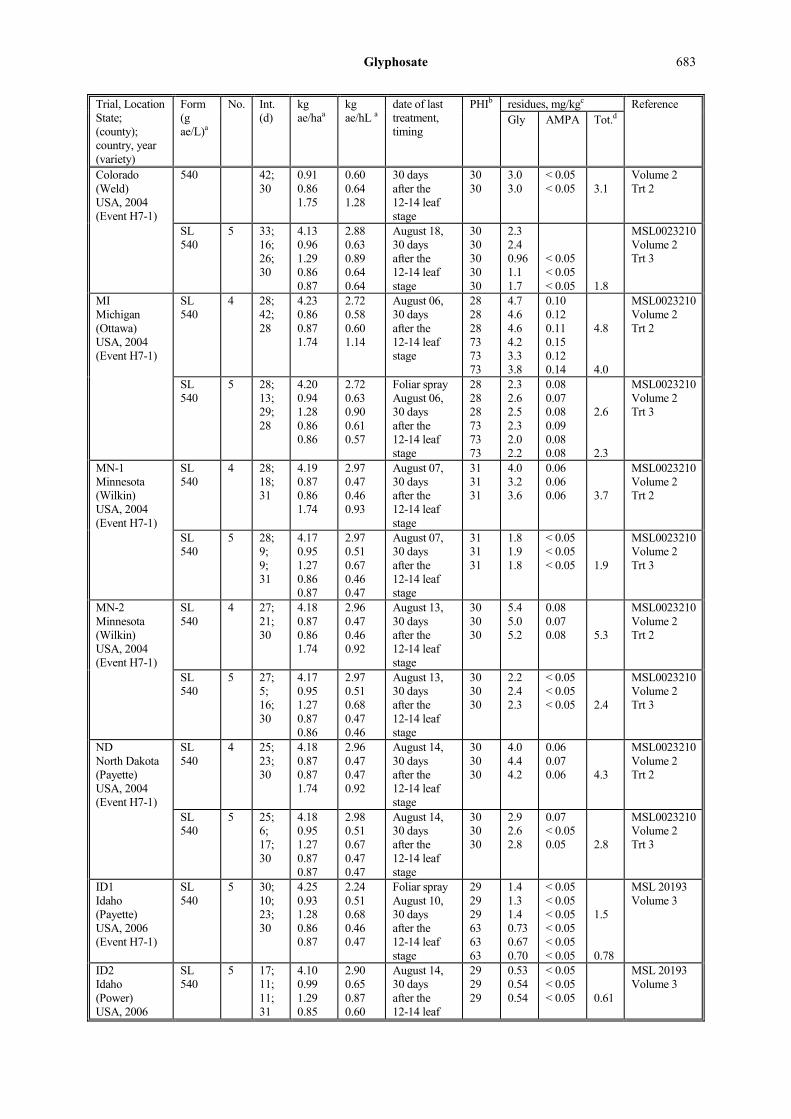
Glyphosate 683
Trial, Location State; (county); country, year (variety)
Form (g ae/L)a
No. Int. (d)
kg ae/haa
kg ae/hL a
date of last treatment, timing
PHIb residues, mg/kgc Reference Gly AMPA Tot.d
Colorado (Weld) USA, 2004 (Event H7-1)
540 42; 30
0.91 0.86 1.75
0.60 0.64 1.28
30 days after the 12-14 leaf stage
30 30
3.0 3.0
< 0.05 < 0.05
3.1
Volume 2 Trt 2
SL 540
5 33; 16; 26; 30
4.13 0.96 1.29 0.86 0.87
2.88 0.63 0.89 0.64 0.64
August 18, 30 days after the 12-14 leaf stage
30 30 30 30 30
2.3 2.4 0.96 1.1 1.7
< 0.05 < 0.05 < 0.05
1.8
MSL0023210 Volume 2 Trt 3
MI Michigan (Ottawa) USA, 2004 (Event H7-1)
SL 540
4 28; 42; 28
4.23 0.86 0.87 1.74
2.72 0.58 0.60 1.14
August 06, 30 days after the 12-14 leaf stage
28 28 28 73 73 73
4.7 4.6 4.6 4.2 3.3 3.8
0.10 0.12 0.11 0.15 0.12 0.14
4.8 4.0
MSL0023210 Volume 2 Trt 2
SL 540
5 28; 13; 29; 28
4.20 0.94 1.28 0.86 0.86
2.72 0.63 0.90 0.61 0.57
Foliar spray August 06, 30 days after the 12-14 leaf stage
28 28 28 73 73 73
2.3 2.6 2.5 2.3 2.0 2.2
0.08 0.07 0.08 0.09 0.08 0.08
2.6 2.3
MSL0023210 Volume 2 Trt 3
MN-1 Minnesota (Wilkin) USA, 2004 (Event H7-1)
SL 540
4 28; 18; 31
4.19 0.87 0.86 1.74
2.97 0.47 0.46 0.93
August 07, 30 days after the 12-14 leaf stage
31 31 31
4.0 3.2 3.6
0.06 0.06 0.06
3.7
MSL0023210 Volume 2 Trt 2
SL 540
5 28; 9; 9; 31
4.17 0.95 1.27 0.86 0.87
2.97 0.51 0.67 0.46 0.47
August 07, 30 days after the 12-14 leaf stage
31 31 31
1.8 1.9 1.8
< 0.05 < 0.05 < 0.05
1.9
MSL0023210 Volume 2 Trt 3
MN-2 Minnesota (Wilkin) USA, 2004 (Event H7-1)
SL 540
4 27; 21; 30
4.18 0.87 0.86 1.74
2.96 0.47 0.46 0.92
August 13, 30 days after the 12-14 leaf stage
30 30 30
5.4 5.0 5.2
0.08 0.07 0.08
5.3
MSL0023210 Volume 2 Trt 2
SL 540
5 27; 5; 16; 30
4.17 0.95 1.27 0.87 0.86
2.97 0.51 0.68 0.47 0.46
August 13, 30 days after the 12-14 leaf stage
30 30 30
2.2 2.4 2.3
< 0.05 < 0.05 < 0.05
2.4
MSL0023210 Volume 2 Trt 3
ND North Dakota (Payette) USA, 2004 (Event H7-1)
SL 540
4 25; 23; 30
4.18 0.87 0.87 1.74
2.96 0.47 0.47 0.92
August 14, 30 days after the 12-14 leaf stage
30 30 30
4.0 4.4 4.2
0.06 0.07 0.06
4.3
MSL0023210 Volume 2 Trt 2
SL 540
5 25; 6; 17; 30
4.18 0.95 1.27 0.87 0.87
2.98 0.51 0.67 0.47 0.47
August 14, 30 days after the 12-14 leaf stage
30 30 30
2.9 2.6 2.8
0.07 < 0.05 0.05
2.8
MSL0023210 Volume 2 Trt 3
ID1 Idaho (Payette) USA, 2006 (Event H7-1)
SL 540
5 30; 10; 23; 30
4.25 0.93 1.28 0.86 0.87
2.24 0.51 0.68 0.46 0.47
Foliar spray August 10, 30 days after the 12-14 leaf stage
29 29 29 63 63 63
1.4 1.3 1.4 0.73 0.67 0.70
< 0.05 < 0.05 < 0.05 < 0.05 < 0.05 < 0.05
1.5 0.78
MSL 20193 Volume 3
ID2 Idaho (Power) USA, 2006
SL 540
5 17; 11; 11; 31
4.10 0.99 1.29 0.85
2.90 0.65 0.87 0.60
August 14, 30 days after the 12-14 leaf
29 29 29
0.53 0.54 0.54
< 0.05 < 0.05 < 0.05
0.61
MSL 20193 Volume 3
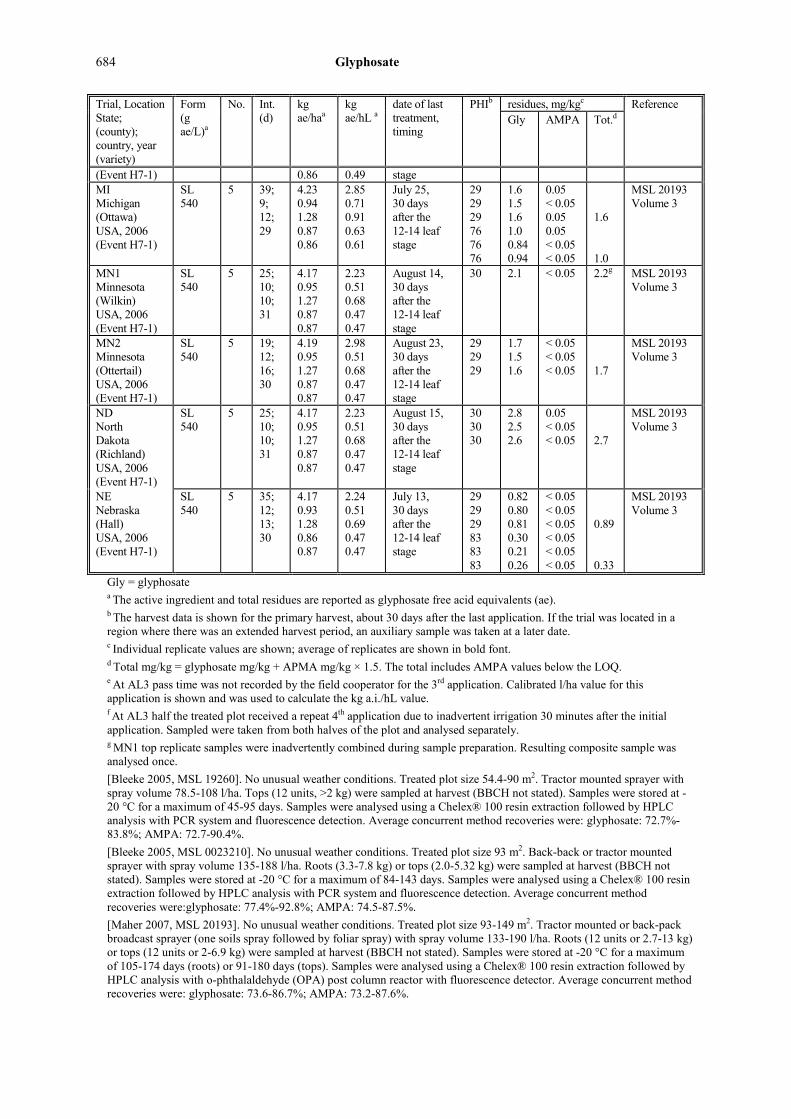
684 Glyphosate
Trial, Location State; (county); country, year (variety)
Form (g ae/L)a
No. Int. (d)
kg ae/haa
kg ae/hL a
date of last treatment, timing
PHIb residues, mg/kgc Reference Gly AMPA Tot.d
(Event H7-1) 0.86 0.49 stage MI Michigan (Ottawa) USA, 2006 (Event H7-1)
SL 540
5 39; 9; 12; 29
4.23 0.94 1.28 0.87 0.86
2.85 0.71 0.91 0.63 0.61
July 25, 30 days after the 12-14 leaf stage
29 29 29 76 76 76
1.6 1.5 1.6 1.0 0.84 0.94
0.05 < 0.05 0.05 0.05 < 0.05 < 0.05
1.6 1.0
MSL 20193 Volume 3
MN1 Minnesota (Wilkin) USA, 2006 (Event H7-1)
SL 540
5 25; 10; 10; 31
4.17 0.95 1.27 0.87 0.87
2.23 0.51 0.68 0.47 0.47
August 14, 30 days after the 12-14 leaf stage
30 2.1 < 0.05 2.2g MSL 20193 Volume 3
MN2 Minnesota (Ottertail) USA, 2006 (Event H7-1)
SL 540
5 19; 12; 16; 30
4.19 0.95 1.27 0.87 0.87
2.98 0.51 0.68 0.47 0.47
August 23, 30 days after the 12-14 leaf stage
29 29 29
1.7 1.5 1.6
< 0.05 < 0.05 < 0.05
1.7
MSL 20193 Volume 3
ND North Dakota (Richland) USA, 2006 (Event H7-1)
SL 540
5 25; 10; 10; 31
4.17 0.95 1.27 0.87 0.87
2.23 0.51 0.68 0.47 0.47
August 15, 30 days after the 12-14 leaf stage
30 30 30
2.8 2.5 2.6
0.05 < 0.05 < 0.05
2.7
MSL 20193 Volume 3
NE Nebraska (Hall) USA, 2006 (Event H7-1)
SL 540
5 35; 12; 13; 30
4.17 0.93 1.28 0.86 0.87
2.24 0.51 0.69 0.47 0.47
July 13, 30 days after the 12-14 leaf stage
29 29 29 83 83 83
0.82 0.80 0.81 0.30 0.21 0.26
< 0.05 < 0.05 < 0.05 < 0.05 < 0.05 < 0.05
0.89 0.33
MSL 20193 Volume 3
Gly = glyphosate a The active ingredient and total residues are reported as glyphosate free acid equivalents (ae). b The harvest data is shown for the primary harvest, about 30 days after the last application. If the trial was located in a region where there was an extended harvest period, an auxiliary sample was taken at a later date. c Individual replicate values are shown; average of replicates are shown in bold font. d Total mg/kg = glyphosate mg/kg + APMA mg/kg × 1.5. The total includes AMPA values below the LOQ. e At AL3 pass time was not recorded by the field cooperator for the 3rd application. Calibrated l/ha value for this application is shown and was used to calculate the kg a.i./hL value. f At AL3 half the treated plot received a repeat 4th application due to inadvertent irrigation 30 minutes after the initial application. Sampled were taken from both halves of the plot and analysed separately. g MN1 top replicate samples were inadvertently combined during sample preparation. Resulting composite sample was analysed once. [Bleeke 2005, MSL 19260]. No unusual weather conditions. Treated plot size 54.4-90 m2. Tractor mounted sprayer with spray volume 78.5-108 l/ha. Tops (12 units, >2 kg) were sampled at harvest (BBCH not stated). Samples were stored at -20 °C for a maximum of 45-95 days. Samples were analysed using a Chelex® 100 resin extraction followed by HPLC analysis with PCR system and fluorescence detection. Average concurrent method recoveries were: glyphosate: 72.7%-83.8%; AMPA: 72.7-90.4%. [Bleeke 2005, MSL 0023210]. No unusual weather conditions. Treated plot size 93 m2. Back-back or tractor mounted sprayer with spray volume 135-188 l/ha. Roots (3.3-7.8 kg) or tops (2.0-5.32 kg) were sampled at harvest (BBCH not stated). Samples were stored at -20 °C for a maximum of 84-143 days. Samples were analysed using a Chelex® 100 resin extraction followed by HPLC analysis with PCR system and fluorescence detection. Average concurrent method recoveries were:glyphosate: 77.4%-92.8%; AMPA: 74.5-87.5%. [Maher 2007, MSL 20193]. No unusual weather conditions. Treated plot size 93-149 m2. Tractor mounted or back-pack broadcast sprayer (one soils spray followed by foliar spray) with spray volume 133-190 l/ha. Roots (12 units or 2.7-13 kg) or tops (12 units or 2-6.9 kg) were sampled at harvest (BBCH not stated). Samples were stored at -20 °C for a maximum of 105-174 days (roots) or 91-180 days (tops). Samples were analysed using a Chelex® 100 resin extraction followed by HPLC analysis with o-phthalaldehyde (OPA) post column reactor with fluorescence detector. Average concurrent method recoveries were: glyphosate: 73.6-86.7%; AMPA: 73.2-87.6%.
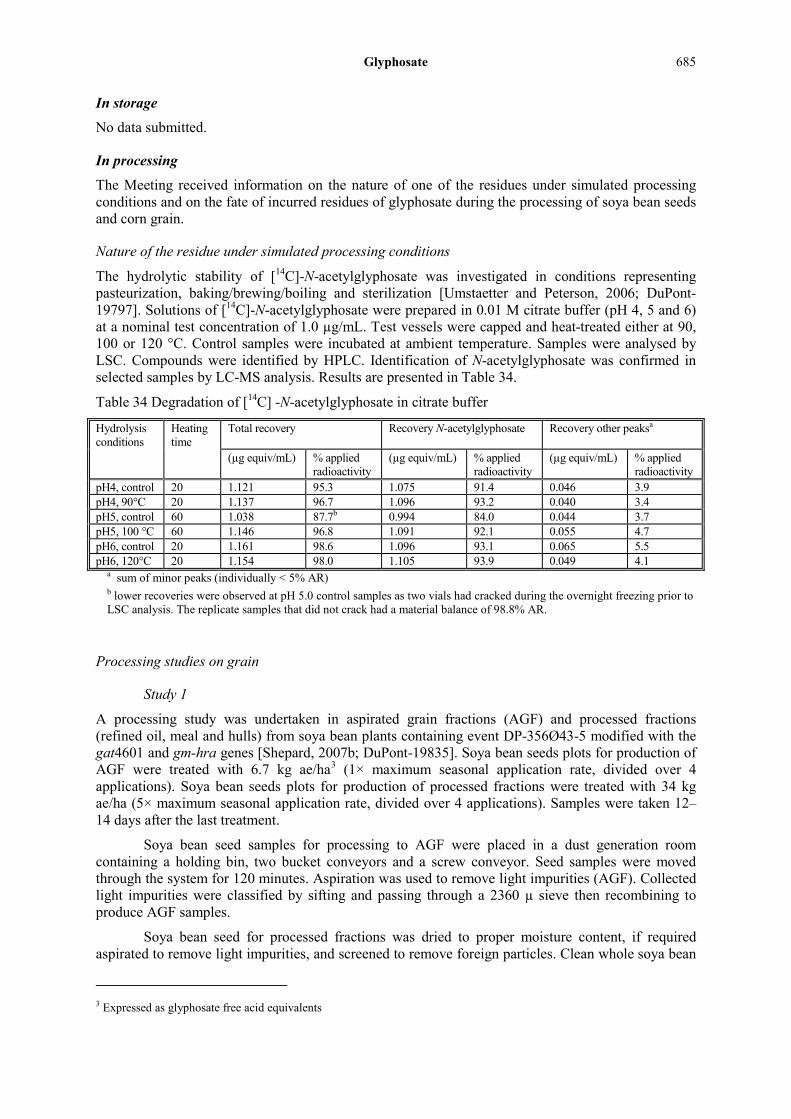
Glyphosate 685
In storage
No data submitted.
In processing
The Meeting received information on the nature of one of the residues under simulated processing conditions and on the fate of incurred residues of glyphosate during the processing of soya bean seeds and corn grain.
Nature of the residue under simulated processing conditions
The hydrolytic stability of [14C]-N-acetylglyphosate was investigated in conditions representing pasteurization, baking/brewing/boiling and sterilization [Umstaetter and Peterson, 2006; DuPont-19797]. Solutions of [14C]-N-acetylglyphosate were prepared in 0.01 M citrate buffer (pH 4, 5 and 6) at a nominal test concentration of 1.0 µg/mL. Test vessels were capped and heat-treated either at 90, 100 or 120 °C. Control samples were incubated at ambient temperature. Samples were analysed by LSC. Compounds were identified by HPLC. Identification of N-acetylglyphosate was confirmed in selected samples by LC-MS analysis. Results are presented in Table 34.
Table 34 Degradation of [14C] -N-acetylglyphosate in citrate buffer
Hydrolysis conditions
Heating time
Total recovery
Recovery N-acetylglyphosate Recovery other peaksa
(µg equiv/mL) % applied radioactivity
(µg equiv/mL) % applied radioactivity
(µg equiv/mL) % applied radioactivity
pH4, control 20 1.121 95.3 1.075 91.4 0.046 3.9 pH4, 90°C 20 1.137 96.7 1.096 93.2 0.040 3.4 pH5, control 60 1.038 87.7b 0.994 84.0 0.044 3.7 pH5, 100 °C 60 1.146 96.8 1.091 92.1 0.055 4.7 pH6, control 20 1.161 98.6 1.096 93.1 0.065 5.5 pH6, 120°C 20 1.154 98.0 1.105 93.9 0.049 4.1
a sum of minor peaks (individually < 5% AR) b lower recoveries were observed at pH 5.0 control samples as two vials had cracked during the overnight freezing prior to LSC analysis. The replicate samples that did not crack had a material balance of 98.8% AR.
Processing studies on grain
Study 1
A processing study was undertaken in aspirated grain fractions (AGF) and processed fractions (refined oil, meal and hulls) from soya bean plants containing event DP-356Ø43-5 modified with the gat4601 and gm-hra genes [Shepard, 2007b; DuPont-19835]. Soya bean seeds plots for production of AGF were treated with 6.7 kg ae/ha3 (1× maximum seasonal application rate, divided over 4 applications). Soya bean seeds plots for production of processed fractions were treated with 34 kg ae/ha (5× maximum seasonal application rate, divided over 4 applications). Samples were taken 12–14 days after the last treatment.
Soya bean seed samples for processing to AGF were placed in a dust generation room containing a holding bin, two bucket conveyors and a screw conveyor. Seed samples were moved through the system for 120 minutes. Aspiration was used to remove light impurities (AGF). Collected light impurities were classified by sifting and passing through a 2360 µ sieve then recombining to produce AGF samples.
Soya bean seed for processed fractions was dried to proper moisture content, if required aspirated to remove light impurities, and screened to remove foreign particles. Clean whole soya bean
3 Expressed as glyphosate free acid equivalents

686 Glyphosate
seed was fed into a cracking roll mill to crack the outer seed hull and liberate the seed kernel. Hull material was separated to produce samples for analysis. Remaining kernel material was heated to 71–79 °C, flaked, extruded, and converted to collets using steam injection, heat, and compression. The resulting collets were dried and then solvent extracted with hexane three times at elevated temperature. Hexane solvent was removed by heating to 93–99 °C with mixing to produce soya bean meal. Crude oil/hexane was passed through a recovery unit to separate crude oil, which was heated to 73–91 °C to remove hexane. Remaining crude oil was alkali refined to produce refined oil.
Samples were analysed by LC/MS/MS, based on DuPont-15444. Residues of glyphosate and its metabolites N-acetylglyphosate, AMPA and N-acetyl AMPA were expressed as concentrations of glyphosate free acid equivalents. Results were not corrected for control levels or for average concurrent method recoveries. Processing results are summarized in Table 35.
Study 2
A processing study was undertaken in aspirated grain fractions (AGF) and processed fractions (starch, grits, flour, refined oil [wet and dry milling] and meal [dry milling]) from field corn plants containing event DP-Ø9814Ø-6 modified with the gat and zm-hra genes [Thiel, 2007c; DuPont-19836]. Corn seeds plots for production of AGF were treated with 6.7 kg ae/ha4 (1× maximum seasonal application rate, divided over 4 applications). Corn seeds plots for production of processed fractions were treated with 33 kg ae/ha (5× maximum seasonal application rate, divided over 4 applications). Samples were taken 7 days after the last treatment.
Corn grain samples for processing to AGF were placed in a dust generation room containing a holding bin, two bucket conveyors and a screw conveyor. Seed samples were moved through the system for 120 minutes. Aspiration was used to remove light impurities (AGF). Collected light impurities were classified by sifting and passing through a 2360 µ sieve then recombining to produce one AGF sample.
Corn grain for processed fractions by dry milling was dried to proper moisture content, light impurities were separated and the grain was screened to remove large and small foreign particles. Clean whole grain was moisture conditioned to 20–22% and allowed to temper for 2–3 hours. Grain was cracked in a disc mill to produce corn stock which was dried and screened to separate larger particles from smaller particles. Dried germ was heated to 71–79 °C for 10 minutes. Heated germ was flaked and taken to solvent extraction, whereby the flaked germ was placed in stainless steel batch extractors and submerged in 49–60 °C hexane. After 30 minutes, the hexane was drained and fresh hexane added to repeat the cycle twice more. After two final washes for 15–30 minutes each, the extracted flakes were desolventized in a steam heated mixer to remove residual hexane. Crude oil/hexane was passed through a vacuum evaporator and heated to 73–91 °C to separate crude oil from hexane. Remaining crude oil was alkali refined to produce refined oil.
Clean whole corn grain for processed fractions by wet milling was steeped in 49–54 °C water containing 0.1-0.2% sulfur dioxide (sulfurous acid) for 22–48 hours. After steeping, the corn grain was cracked in a disc mill to break the kernel while keeping the germ intact as much as possible. Germ and hull were removed via hydroclone and dried at 74–91 °C to obtain final moisture between 5 and 10%. Germ was moisture conditioned to 12%, heated to 88–104 °C, flaked, and a portion of the crude oil pressed out. The resultant presscake was taken to solvent extraction, where it was placed in stainless steel batch extractors and submerged in 49–60 °C hexane. After 30 minutes, the hexane was drained and fresh hexane added to repeat the cycle twice more. After two final washes for 15–30 minutes each, the extracted flakes were desolventized in a steam heated mixer to remove residual hexane. Crude oil/hexane was passed through a vacuum evaporator and heated to 73–90 °C to separate crude oil from hexane. Remaining crude oil was alkali refined to produce refined oil.
Samples were analysed by LC/MS/MS method, based on DuPont-15444. Residues of glyphosate and its metabolites N-acetylglyphosate, AMPA and N-acetyl AMPA were expressed as concentrations of glyphosate free acid equivalents. Processing results are summarized in Table 35. 4 Expressed as glyphosate free acid equivalents

Glyphosate 687
Table 35 Residues of glyphosate after processing
Location, year, (variety)
Treatment DAT processed products
Residues (mg ae/kg)a PF reference GLY NA-GLY AMPA NA AMPA
Illinois
4 appl.: 3.4 kg ae/ha 0.79 kg ae/ha 1.8 kg ae/ha 0.89 kg ae/ha
12 Soya bean - seed - AGF
0.056 23
3.5 3.6
< 0.05 2.9
1.2 0.78
6.3
DuPont-19835
Nebraska 4 appl.: 3.4 kg ae/ha 0.79 kg ae/ha 1.8 kg ae/ha 0.89 kg ae/ha
14 Soya bean - seed - AGF
0.090 43
0.73 2.2
< 0.05 2.5
0.23 0.21
44
DuPont-19835
Nebraska 4 appl.: 17 kg ae/ha 3.9 kg ae/ha 8.8 kg ae/ha 4.4 kg ae/ha
14 Soya bean - seed - refined oil - meal - hulls
0.3 < 0.05 0.22 2.0
2.3 < 0.05 1.6 12
0.15 < 0.05 < 0.05 0.21
0.65 < 0.05 0.52 3.2
<1.0 0.7 5.1
DuPont-19835
Nebraska 4 appl.: 4.1 kg ae/ha 0.88 kg ae/ha 0.87 kg ae/ha 0.87 kg ae/ha
7 Corn - grain - AGF
< 0.05 1.9
< 0.05 0.069
< 0.05 0.13
< 0.05 < 0.05
11
DuPont-19836
Iowa 4 appl.: 20 kg ae/ha 4.4 kg ae/ha 4.4 kg ae/ha 4.4 kg ae/ha
7 Corn - grain - starch - grits - flour - refined oil (wet milling) - refined oil (dry milling) - meal (dry milling)
< 0.05 < 0.05 < 0.05 0.046 < 0.05 < 0.05 < 0.05
0.090 < 0.05 0.073 0.097 < 0.05 < 0.05 0.12
< 0.05 < 0.05 < 0.05 < 0.05 < 0.05 < 0.05 < 0.05
< 0.05 < 0.05 < 0.05 < 0.05 < 0.05 < 0.05 < 0.05
<1.0 0.93 1.0 <1.0 <1.0 1.1
DuPont-19836
Nebraska 4 appl.: 20 kg ae/ha 4.4 kg ae/ha 4.4 kg ae/ha 4.4 kg ae/ha
7 Corn - grain - starch - grits - flour - refined oil (wet milling) - refined oil (dry milling) - meal (dry milling)
0.11 < 0.05 < 0.05 0.072 < 0.05 < 0.05 0.068
0.17 < 0.05 0.13 0.15 < 0.05 < 0.05 0.20
< 0.05 < 0.05 < 0.05 < 0.05 < 0.05 < 0.05 < 0.05
< 0.05 < 0.05 < 0.05 < 0.05 < 0.05 < 0.05 < 0.05
<1.0 0.74 0.85 <1.0 <1.0 0.97
DuPont-19836
GLY = glyphosate; NA-GLY = N-acetylglyphosate, NA-AMPA = N-acetyl AMPA PF = processing factor = concentration total glyphosate acid equivalents in processed product/concentration in RAC (seed or grain) a All residues are reported as concentrations of glyphosate free acid equivalents. All levels reported as not detectable or below validated LOQ (0.05 mg/kg for each metabolites) are reported as < 0.05 mg/kg.
Calculated processing factors for processed soya bean seed and corn grain are summarized in
Table 36. Processing factors are based on total glyphosate free acid equivalents
Table 36 Summary of calculated processing factors
Commodity processing factors* processing factor (median or best estimate)
Soya bean AGF 6.3, 44 25 Soya bean refined oil - - Soya bean meal 0.7 0.7 Soya bean hulls 5.1 5.1 Corn AGF 11 11 Corn Starch - -
688 Glyphosate
Corn Grits 0.93, 0.74 0.84 Corn Flour 1.0, 0.85 0.93 Corn Refined oil (wet milling) - - Corn Refined oil (dry milling) - - Corn Meal (dry milling) 1.1, 0.97 1.0
* Calculated; based on the study results
Residues in the edible portion of food commodities
No data submitted.
RESIDUES IN ANIMAL COMMODITIES
Direct animal treatments
Not relevant for the present intended uses.
Farm animal feeding studies
The Meeting received information on feeding studies with lactating cows and laying hens dosed with N-acetylglyphosate.
Study 1 – Cattle feeding study.
A feeding study was conducted in lactating cows [McLellan and Bramble, 2007, DuPont-20087]. Four groups of lactating Holstein cows (3 cows/group) were fed rations containing N-acetylglyphosate at actual dietary levels of 44, 130, 437, and 1179 ppm N-acetylglyphosate in feed per day via oral drench for 28 consecutive days. Dose levels correspond to 1.27–1.29, 3.78–3.83, 12.6–12.7, and 38.3–38.9 mg N-acetylglyphosate/kg bw/day, respectively. In addition, a control group (2 cows) and a depuration group (2 cows dosed at top rate) were included in the study. The actual daily feed intake was calculated as 2.8 to 3.4% of bodyweight. Bodyweights of the animals ranged between 539 and 664 kg. The animals were sacrificed within 23–24 hours after the final dose, except for the depuration group and one control cow. One of the cows from the depuration group was sacrificed 4 days post dosing, the second cow from this group 8 days post dosing. The second control cow was not sacrificed.
Milk was collected twice daily. Samples were stored at -20 °C after dilution with 0.1% formic acid for 30 days before analysis. The few samples that were analysed later were re-analysed showing consistent values in the concurrently storage stability testing. The edible tissues (kidney, liver, composite fat (omental and perirenal) and composite muscle (flank, leg, loin) and milk samples were analysed for N-acetylglyphosate and the metabolites glyphosate, N-acetyl-AMPA and AMPA, according to the LC/MS/MS method described by Pentz and Bramble, 2008 [DuPont method 20009]. Results were not corrected for levels in control samples (< 0.3 LOQ) or for concurrent method recoveries (63–119%, all analytes, all matrices).
The LOQ for N-acetylglyphosate and each relevant metabolite was 0.025 mg/kg glyphosate equivalents in milk and muscle and 0.050 mg/kg in liver, kidney, and fat matrices.
The milk production, feed consumption, and body weight were not adversely affected by the dosing level.
Milk: Whole milk residues were either not detectable or less than the validated LOQ of the method (0.025 mg glyphosate equivalents/kg) for N-acetylglyphosate and glyphosate at all dose levels and sampling intervals, except for one sample (day 14 skim milk) where 0.03 mg/kg was detected.

Glyphosate 689
The residues in skim milk and cream were either not detectable or less than the validated LOQ of the method (0.025 mg glyphosate equivalents/kg) for N-acetylglyphosate and glyphosate at all dose levels and sampling intervals.
Tissues: In tissue samples obtained within ca. 24 hours of the last dose, residue levels were highest in kidney followed by liver, fat, and muscle. Residue levels in fat, liver, kidney and muscle increased linearly with dose. N-acetylglyphosate was the predominant residue in all tissue matrices.
Residues in liver, fat, kidney and muscle were dose dependent. A summary of N-acetylglyphosate, glyphosate, N-acetyl AMPA and AMPA average residue data in tissues is presented in Table 37. In the lowest dose group of 1.25 mg N-acetylglyphosate/kg bw/day N-acetylglyphosate was the only residue above LOQ and was only observed in the kidney (at 0.079, 0.11 and 0.060 mg/kg in glyphosate equivalents in the three respective cows) and not in the other tissues. Only the results of highest dose groups were included in the table below.
Table 37 Residues (in mg glyphosate equivalents/kga) in tissues of cows fed with N-acetylglyphosate for 28 consecutive days.
Matrix Analyte 1179 mg N-acetylglyphosate /kg feed (37.5 mg N-acetylglyphosate/kg bw/day) cow number
437 mg N-acetylglyphosate /kg feed (12.5 mg N-acetylglyphosate/kg bw/day) cow number
130 mg N-acetylglyphosate /kg feed (3.75 mg N-acetylglyphosate/kg bw/day) cow number
10 11 12 mean 7 8 9 mean 4 5 6 mean Fat NA-Gly 0.22 0.055 0.075 0.12 0.054 0.051 < 0.052 < 0.17 < 0.09 Gly < < < < < < < < < < < < NA-
AMPA < < < < < < < < < < < <
AMPA < < < < - - - - - - - - totalb 0.22 0.055 0.075 0.12 0.054 0.051 < 0.052 < 0.17 < 0.09 liver NA-Gly 0.37 0.52 0.38 0.42 0.10d 0.10 0.12 0.10 < < < < Gly < < < < <d < < < < < < < NA-
AMPA < < < < < < < < < < < <
AMPA < < < < < < < < < < < < totalb 0.37 0.52 0.38 0.42 0.10 0.10 0.12 0.10 < < < < kidneyc NA-Gly 2.0e 3.2e 3.2e 2.8 0.62e 0.69e 0.71e 0.67 0.16 0.24 0.11 0.17 Gly 0.19e 0.23e 0.20e 0.21 0.072e 0.071e 0.078e 0.074 < < < < NA-
AMPA 0.069e 0.083e 0.078e 0.077 < < < < < < < <
AMPA < 0.089 < 0.063 < < < < < < < < totalb 2.3 3.6 3.5 3.2 0.69 0.76 0.79 0.74 0.16 0.24 0.11 0.17 muscle NA-Gly < < 0.053 0.051 < < < < < < < < Gly < < < < < < < < < < < < NA-
AMPA < < < < < < < < - - - -
AMPA < < < < - - - - - - - - totalb < < 0.053 0.051
NA-Gly = N-acetylglyphosate; Gly = Glyphosate; NA-AMPA = N-acetyl AMPA < Less than LOQ (0.025 mg/kg for each analyte in muscle, and 0.050 mg/kg for all anaytes in liver, kidney and fat. - no analysis performed a Residues are expressed in mg/kg in glyphosate equivalents. b Except for the total residues in kidney, the total residues only include N-acetylglyphosate levels, since all other residues levels were either not detectable or far below LOQ. c The only residue above LOQ in the lowest dose group (1.25 mg N-acetylglyphosate/kg bw/day, corresponding to 35 mg glyphosate equivalents/kg feed) in the kidney was N-acetylglyphosate; 0.079, 0.11 and 0.060 with a mean of 0.082 mg/kg in glyphosate equivalents. d Average results from analyses of 3 subsamples from the bulk sample. Initial subsample 1 result identified as outlier and not included. e Average results from 2 analyses of sample extract. The 37.5 mg/kg extracts were diluted 1/10 for quantification.
690 Glyphosate
Depuration: Following a 4-day depuration period for a cow dosed at 37.5 mg/kg bw, residues
of all analytes decreased in all tissues. Following an 8-day depuration period the residues of each analyte were decreased further in liver and kidney. Residues of each analyte in muscle and fat seemed to have increased slightly between day 4 and 8 past last dose, but this is believed to be a result of individual animal variation and analytical variability associated with the lower concentrations observed in these tissues. Residues in milk collects from the depuration animals decreased over time. No clear decline of residues in milk was possible due to low reisdues in milk samples.
Study 2 Laying hens
A residue transfer study in livestock [Dibb-Fuller and Bramble, 2007, DuPont-20088] was conducted with four groups of 10 Isa Warren laying hens, dosed once daily for 35 consecutive days with an aqueous solution of N-acetylglyphosate on a body weight (bw) basis at target levels of 1.5 mg, 5 mg, 15 and 50 mg N-acetylglyphosate per kg bw (corresponding with 1.2, 4, 12 and 40 mg glyphosate equivalents/kg bw) to determine the magnitude of residues (MOR) in eggs and tissue. An additional group of 10 hens was also dosed at 50 mg/kg bw and was used to study depuration of N-acetylglyphosate residues once dosing had stopped. A control group was administered water. The mean dietary burden per dose group was 22, 77, 214, 782, and 787 mg N-acetylglyphosate/kg diet consumed per dose group. The body weights prior to dosing were 1.627–1.933 kg and remained relatively constant during the study with a range of 1.443–1.892 kg at the end of the study. The different dose groups were re-divided into 3 subgroups of 3, 3, and 4 hens, respectively. The main daily food consumption, calculated on the basis of the mean daily food consumption per sub group per week, was 0.116 kg.
Eggs were collected twice daily until sacrifice and eggs within each subgroup were pooled before processing. After processing the eggs were stored frozen.
All hens (except for the depuration group) were sacrificed 6 hours after administering the last dose and liver, the abdominal fat pad with skin attached and muscle from breast and leg were sampled. Hens within the depuration subgroups were sacrificed 6, 14, and 20 days after dose termination. Tissue samples were pooled within subgroups, frozen and processed.
All samples were transferred frozen to the analytical test site. The metabolism study in laying hens [Lowrie 2007, DuPont-19795] supported analysis of N-acetylglyphosate and glyphosate in all egg and tissue matrices plus (aminomethyl)phosphonic acid (AMPA) and N-acetyl AMPA in liver. In addition to the above-defined analytes, selected egg (on plateau), muscle and fat samples were analysed in this study for AMPA and N-acetyl AMPA to substantiate the working definition of the residues as defined in the metabolism study.
Egg samples were analysed within 30 days following collection. Storage stability test samples were prepared at 10× LOQ fortification levels (chicken fat samples at 5× LOQ (0.25 mg/kg glyphosate equivalents)) and stored frozen at the time of the initial test sample extractions for each tissue matrix for extraction and analysis at 2 intervals, an approximate mid-point and final interval that exceeded the total frozen storage time for each tissue. The maximum storage intervals for liver, fat, and muscle samples following collection were 76, 77 and 80 days respectively.
Analyses of N-acetylglyphosate and glyphosate in eggs from pooled subgroups were conducted using samples collected on days 1, 3, 5, 7, 10, 14, 17, 24, 28, 31 and 34 to establish the plateau of residues in eggs during the dosing period. Analyses of the eggs from the depuration group were conducted on samples collected on days -1 (day 34), 0, 1, 3, 5, 7, 10, 13, 16, and 19 after termination of dosing. In addition, day 31 egg samples were analysed for the presence of AMP and N-acetyl AMPA. The LC/MS/MS method of analyses was used as is described in the relevant section [Bramble and Pentz, 2007, Dupont-20009]. The validated limit of quantification (LOQ) for N-acetylglyphosate and each relevant analyte was 0.025 mg/kg in egg and muscle matrices, and 0.050 mg/kg in liver and fat matrices. Concurrent recoveries determined for all analytes in the various samples at 5 fortification levels were determined and are summarized in Table 38.
Glyphosate 691
Table 38 Analytical recovery data for the analytes in chicken tissues and eggs from fortified control samples
Matrix Fortification range Mean % Recovery ± sd* N-acetylglyphosate Glyphosate AMPA N-acetyl AMPA
Eggs 0.025-1.0 82 ± 12 90 ± 13 92 ± 10 91 ± 9 Liver 0.050–6.0 89 ± 9 86 ± 7 99 ± 8 87 ± 11 Fat 0.050–2.0 87 ± 10 90 ± 9 97 ± 9 80 ± 8 Muscle 0.025–0.50 81 ± 9 87 ± 8 94 ± 7 80 ± 9
* = standard deviation
Residues were not detected on day 1 in whole eggs for any dose group. The predominant residue was N-acetylglyphosate. Glyphosate was detected mostly in the highest dose group (50 mg/kg bw group). AMPA and N-acetyl AMPA were not observed in whole egg. The total residue levels increased until about 14 days, where it reached a plateau for the remainder of the 34-day period. Residues in eggs were dose depended, increasing with dose level. Mean total residues in whole eggs during the plateau phase (day 14–34) were 0.037, 0.082, 0.15, and 0.60 mg/kg glyphosate equivalents in the respective dose groups. Mean total residues declined quickly during the depuration period from 0.76 to < 0.025 mg/kg glyphosate equivalents 10 days after termination of dosing. Results are presented in Table 39.
Table 39 Residue levels and highest residue levels for N-acetylglyphosate, glyphosate, AMPA and N-acetyl AMPA in eggs following dosing with N-acetylglyphosate for 35 consecutive days
Feeding level in mg N-acetylglyphosate/kg feed Collection day
Residues (mg/kg glyphosate equivalents) (n) N-acetylglyphosate glyphosate Mean totala
0 1-34 nd (16) nd (16) < 0.025
22 1 nd (3) nd (3) < 0.025 3 nd (3) nd (3) < 0.025 5 nd (2) < 0.025 nd (3) < 0.025 7 < 0.025 (3) nd (3) < 0.025 10 < 0.025 (2), 0.025 nd (3) < 0.025 14 < 0.025 (2), 0.028 nd (3) 0.026
17 0.028b, < 0.025b, 0.030b nd (3) 0.028
24 0.045, 0.026, 0.030 < 0.025, nd (2) 0.034 28 0.050, < 0.025, 0.025 nd (3) 0.033 31 0.050, 0.025, 0.035 nd (3) 0.037 34 0.044, 0.030, 0.029 0.030, nd, < 0.025 0.034
average day 14–34 0.036 < 0.025 0.032
maximum 0.050 0.030
77
1 nd (3) nd (3) < 0.025 3 < 0.025 (2), nd nd (3) < 0.025 5 0.044, 0.030, 0.046 nd (3) 0.040 7 0.045, 0.064, 0.051 nd (3) 0.053 10 0.066, 0.060, 0.069 nd (3) 0.065 14 0.066, 0.076, 0.079 nd (3) 0.074 17 0.081b, 0.079b, 0.078b nd (3) 0.079 24 0.094, 0.087, 0.091 nd (3) 0.091 28 0.093, 0.072, 0.080 nd (3) 0.082 31 0.087, 0.090, 0.064 nd (3) 0.080 34 0.10, 0.093, 0.065 < 0.025, nd (2) 0.087 average day 14–34 0.082 < 0.025 0.082
maximum 0.10 < 0.025
214 1 nd (3) nd (3) < 0.025 3 0.044, 0.041, 0.025 nd (3) 0.036 5 0.10, 0.089, 0.051 nd (3) 0.080
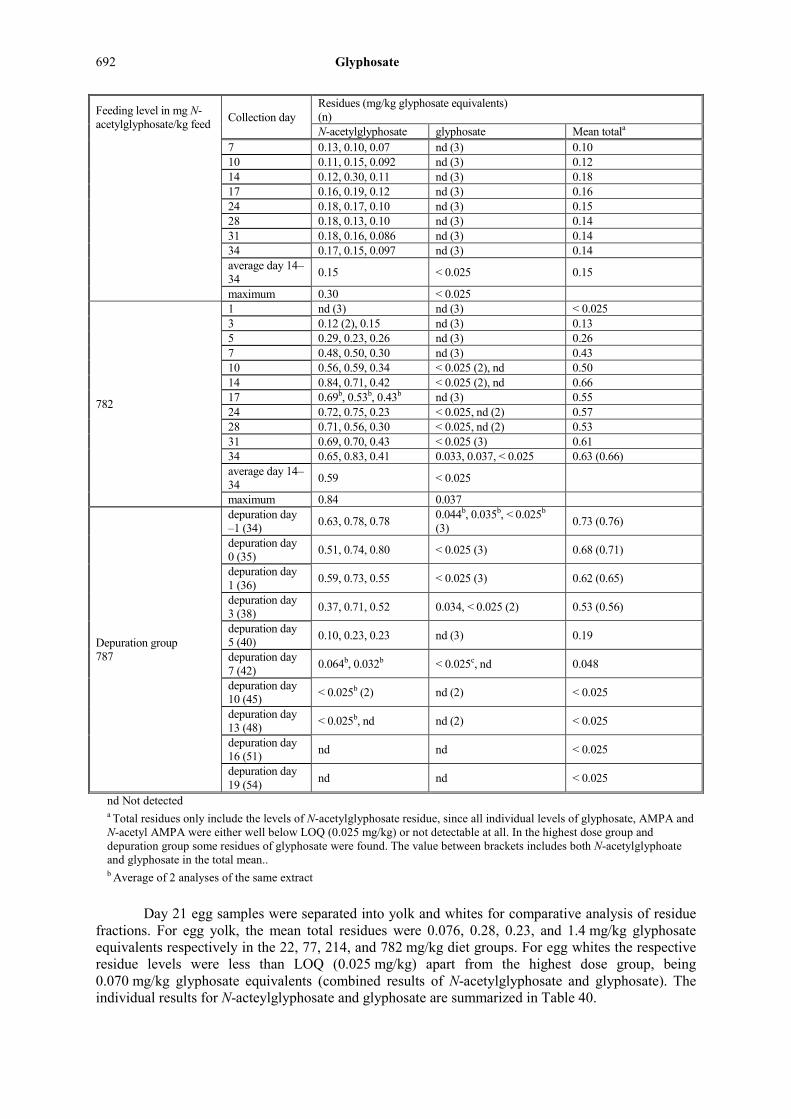
692 Glyphosate
Feeding level in mg N-acetylglyphosate/kg feed Collection day
Residues (mg/kg glyphosate equivalents) (n) N-acetylglyphosate glyphosate Mean totala
7 0.13, 0.10, 0.07 nd (3) 0.10 10 0.11, 0.15, 0.092 nd (3) 0.12 14 0.12, 0.30, 0.11 nd (3) 0.18 17 0.16, 0.19, 0.12 nd (3) 0.16 24 0.18, 0.17, 0.10 nd (3) 0.15 28 0.18, 0.13, 0.10 nd (3) 0.14 31 0.18, 0.16, 0.086 nd (3) 0.14 34 0.17, 0.15, 0.097 nd (3) 0.14 average day 14–34 0.15 < 0.025 0.15
maximum 0.30 < 0.025
782
1 nd (3) nd (3) < 0.025 3 0.12 (2), 0.15 nd (3) 0.13 5 0.29, 0.23, 0.26 nd (3) 0.26 7 0.48, 0.50, 0.30 nd (3) 0.43 10 0.56, 0.59, 0.34 < 0.025 (2), nd 0.50 14 0.84, 0.71, 0.42 < 0.025 (2), nd 0.66 17 0.69b, 0.53b, 0.43b nd (3) 0.55 24 0.72, 0.75, 0.23 < 0.025, nd (2) 0.57 28 0.71, 0.56, 0.30 < 0.025, nd (2) 0.53 31 0.69, 0.70, 0.43 < 0.025 (3) 0.61 34 0.65, 0.83, 0.41 0.033, 0.037, < 0.025 0.63 (0.66) average day 14–34 0.59 < 0.025
maximum 0.84 0.037
Depuration group 787
depuration day –1 (34) 0.63, 0.78, 0.78 0.044b, 0.035b, < 0.025b
(3) 0.73 (0.76)
depuration day 0 (35) 0.51, 0.74, 0.80 < 0.025 (3) 0.68 (0.71)
depuration day 1 (36) 0.59, 0.73, 0.55 < 0.025 (3) 0.62 (0.65)
depuration day 3 (38) 0.37, 0.71, 0.52 0.034, < 0.025 (2) 0.53 (0.56)
depuration day 5 (40) 0.10, 0.23, 0.23 nd (3) 0.19
depuration day 7 (42) 0.064b, 0.032b < 0.025c, nd 0.048
depuration day 10 (45) < 0.025b (2) nd (2) < 0.025
depuration day 13 (48) < 0.025b, nd nd (2) < 0.025
depuration day 16 (51) nd nd < 0.025
depuration day 19 (54) nd nd < 0.025
nd Not detected a Total residues only include the levels of N-acetylglyphosate residue, since all individual levels of glyphosate, AMPA and N-acetyl AMPA were either well below LOQ (0.025 mg/kg) or not detectable at all. In the highest dose group and depuration group some residues of glyphosate were found. The value between brackets includes both N-acetylglyphoate and glyphosate in the total mean.. b Average of 2 analyses of the same extract
Day 21 egg samples were separated into yolk and whites for comparative analysis of residue
fractions. For egg yolk, the mean total residues were 0.076, 0.28, 0.23, and 1.4 mg/kg glyphosate equivalents respectively in the 22, 77, 214, and 782 mg/kg diet groups. For egg whites the respective residue levels were less than LOQ (0.025 mg/kg) apart from the highest dose group, being 0.070 mg/kg glyphosate equivalents (combined results of N-acetylglyphosate and glyphosate). The individual results for N-acteylglyphosate and glyphosate are summarized in Table 40.
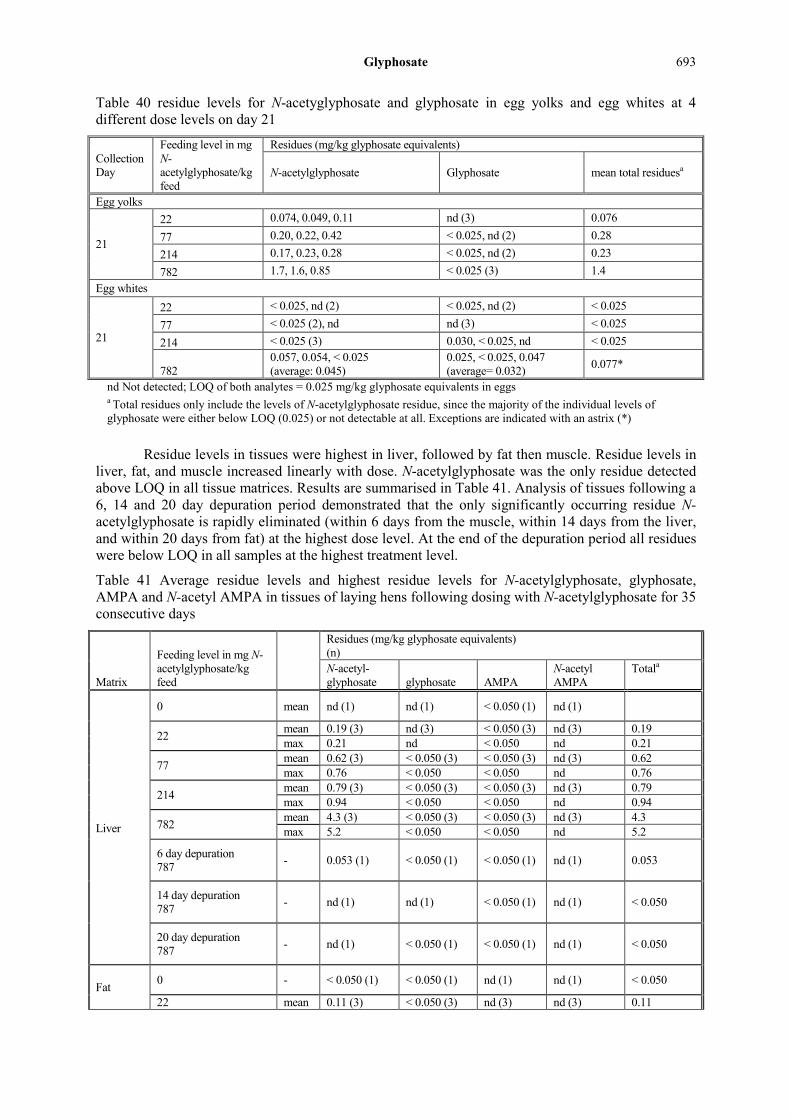
Glyphosate 693
Table 40 residue levels for N-acetyglyphosate and glyphosate in egg yolks and egg whites at 4 different dose levels on day 21
Collection Day
Feeding level in mg N-acetylglyphosate/kg feed
Residues (mg/kg glyphosate equivalents)
N-acetylglyphosate Glyphosate mean total residuesa
Egg yolks
21
22 0.074, 0.049, 0.11 nd (3) 0.076 77 0.20, 0.22, 0.42 < 0.025, nd (2) 0.28 214 0.17, 0.23, 0.28 < 0.025, nd (2) 0.23 782 1.7, 1.6, 0.85 < 0.025 (3) 1.4
Egg whites
21
22 < 0.025, nd (2) < 0.025, nd (2) < 0.025 77 < 0.025 (2), nd nd (3) < 0.025 214 < 0.025 (3) 0.030, < 0.025, nd < 0.025
782 0.057, 0.054, < 0.025 (average: 0.045)
0.025, < 0.025, 0.047 (average= 0.032) 0.077*
nd Not detected; LOQ of both analytes = 0.025 mg/kg glyphosate equivalents in eggs a Total residues only include the levels of N-acetylglyphosate residue, since the majority of the individual levels of glyphosate were either below LOQ (0.025) or not detectable at all. Exceptions are indicated with an astrix (*)
Residue levels in tissues were highest in liver, followed by fat then muscle. Residue levels in
liver, fat, and muscle increased linearly with dose. N-acetylglyphosate was the only residue detected above LOQ in all tissue matrices. Results are summarised in Table 41. Analysis of tissues following a 6, 14 and 20 day depuration period demonstrated that the only significantly occurring residue N-acetylglyphosate is rapidly eliminated (within 6 days from the muscle, within 14 days from the liver, and within 20 days from fat) at the highest dose level. At the end of the depuration period all residues were below LOQ in all samples at the highest treatment level.
Table 41 Average residue levels and highest residue levels for N-acetylglyphosate, glyphosate, AMPA and N-acetyl AMPA in tissues of laying hens following dosing with N-acetylglyphosate for 35 consecutive days
Matrix
Feeding level in mg N-acetylglyphosate/kg feed
Residues (mg/kg glyphosate equivalents) (n) N-acetyl-glyphosate glyphosate AMPA
N-acetyl AMPA
Totala
Liver
0 mean nd (1) nd (1) < 0.050 (1) nd (1)
22 mean 0.19 (3) nd (3) < 0.050 (3) nd (3) 0.19 max 0.21 nd < 0.050 nd 0.21
77 mean 0.62 (3) < 0.050 (3) < 0.050 (3) nd (3) 0.62 max 0.76 < 0.050 < 0.050 nd 0.76
214 mean 0.79 (3) < 0.050 (3) < 0.050 (3) nd (3) 0.79 max 0.94 < 0.050 < 0.050 nd 0.94
782 mean 4.3 (3) < 0.050 (3) < 0.050 (3) nd (3) 4.3 max 5.2 < 0.050 < 0.050 nd 5.2
6 day depuration 787 - 0.053 (1) < 0.050 (1) < 0.050 (1) nd (1) 0.053
14 day depuration 787 - nd (1) nd (1) < 0.050 (1) nd (1) < 0.050
20 day depuration 787 - nd (1) < 0.050 (1) < 0.050 (1) nd (1) < 0.050
Fat 0 - < 0.050 (1) < 0.050 (1) nd (1) nd (1) < 0.050
22 mean 0.11 (3) < 0.050 (3) nd (3) nd (3) 0.11

694 Glyphosate
Matrix
Feeding level in mg N-acetylglyphosate/kg feed
Residues (mg/kg glyphosate equivalents) (n) N-acetyl-glyphosate glyphosate AMPA
N-acetyl AMPA
Totala
max 0.13 < 0.050 na nd 0.13
77 mean 0.49 (3) < 0.050 (3) nd (3) nd (3) 0.49 max 0.60 < 0.050 na nd 0.60
214 mean 0.25 (3) < 0.050 (3) nd (3) nd (3) 0.25 max 0.39 < 0.050 na nd 0.39
782 mean 1.3 (3) < 0.050 (3) nd (3) nd (3) 1.3 max 1.9 < 0.050 nd nd 1.9
6 day depuration 787 - 0.071 (1) < 0.050 (1) na nd (1) 0.071
14 day depuration 787 - 0.051 (1) < 0.050 (1) na nd (1) 0.051
20 day depuration 787 - nd (1) < 0.050 (1) na nd (1) < 0.050
Muscle
0 - nd (1) nd (1) < 0.025 (1) nd (1) < 0.025
22 mean 0.030 (3) nd (3) nd (3) nd (3) 0.030 max 0.036 < 0.025 na nd 0.036
77 mean 0.13 (3) < 0.025 (3) nd (3) nd (3) 0.13 max 0.16 < 0.025 na nd 0.16
214 mean 0.082 (3) < 0.025 (3) < 0.025 (3) nd (3) 0.082 max 0.13 < 0.025 < 0.025 nd 0.13
782 mean 0.41 (3) < 0.025 (3) < 0.025 (3) nd (3) 0.41 max 0.58 < 0.025 < 0.025 nd 0.58
6 day depuration 787 - < 0.025 (1) nd (1) na nd (1) < 0.025
14 day depuration 787 - < 0.025 (1) nd (1) na nd (1) < 0.025
20 day depuration 787 - nd (1) nd (1) na nd (1) < 0.025
na Not Analysed nd Not detected (Estimated LOD values for each analyte and matrix are provided under “LOD” in the Analysis Method section of this study summary) a Total residues only include the levels of N-acetylglyphosate residue, since all individual levels of glyphosate, AMPA and N-acetyl AMPA were either well below LOQ or not detectable at all in all tissues.
RESIDUES IN FOOD IN COMMERCE OR AT CONSUMPTION
No data submitted.
NATIONAL RESIDUES DEFINITION
Not applicable.
APPRAISAL
Glyphosate is an herbicide with uses on many crops, conventional and glyphosate tolerant. Glyphosate has been evaluated several times with the initial evaluation in 1986 and the latest in 2005 (Periodic re-evaluation Programme of the Thirty-fourth Session of the CCPR for residue review). The

Glyphosate 695
Meeting of 2005 established a residue definition for compliance with MRLs as “glyphosate” and a definition of the residue for the estimation of the dietary intake as “sum of glyphosate and AMPA, expressed as glyphosate” for both plant and animal commodities. The toxicology of glyphosate was re-evaluated by the 2004 JMPR which estimated a group ADI of 0–1 mg/kg bw for the sum of glyphosate and AMPA. The same Meeting concluded that an ARfD did not need to be derived.
Glyphosate is used on conventional and glyphosate tolerant crops. Different types of glyphosate tolerant crops can be distinguished. Glyphosate tolerant crops containing the modified 5-enolpyruvylshikimate-3-phosphate synthase (EPSPS) gene are referred to here as EPSPS crops and those containing the glyphosate-N-acetyltransferase (GAT) gene will be referred to as gat crops. EPSPS crops are tolerant to glyphosate but essentially metabolise glyphosate in the same way as conventional crops. Both EPSPS genetically modified crops and conventional crops have been evaluated by the 2005 JMPR. For the current evaluation in addition to data on conventional crops and EPSPS crops, data have been submitted covering the use on genetically modified crops containing the GAT trait. These crops inactivate glyphosate by converting it to N-acetyl-glyphosate, a different metabolic pathway than for the crops described by the 2005 JMPR.
The Meeting received information on N-acetyl-glyphosate (the main metabolite expected to be formed in plants) metabolism in animals, on glyphosate metabolism in genetically modified maize and soya beans containing the GAT trait, methods of residue analysis, freezer storage stability, GAP information, supervised residue trials on conventional (dry peas) and EPSPS glyphosate tolerant crops (sweet corn and sugar beets) and gat crops (maize and soya beans), fate of residue during storage and processing, and livestock feeding studies with N-acetyl-glyphosate.
To assist uniform interpretation of GAP application rates have been expressed in terms of glyphosate acid equivalents (ae), unless indicated otherwise.
Metabolites referred to in the appraisal were addressed by their common names,
N-acetyl-glyphosate N-acetyl-N-(phosphonomethyl)glycine
AMPA aminomethylphosphonic acid
N-acetyl AMPA [(acetylamino)methyl]phosphonic acid.
Animal metabolism
The metabolism of glyphosate was evaluated by the 2005 JMPR. The current Meeting received metabolism studies for N-acetyl-glyphosate, the main glyphosate metabolite in genetically modified maize and soya beans containing the gat trait, in lactating goats and laying hens. Metabolism of N-acetyl-glyphosate in laboratory animals was summarized and evaluated by the WHO panel of the JMPR 2011.
A lactating goat was orally treated twice daily for 5 consecutive days with [14C]-N-acetyl-glyphosate at a dose equivalent to 205 ppm (mg test substance equivalent/kg feed) per day. Approximately 88% of the administered dose was recovered with the majority in the excreta (87.7% of the dose). Faeces, urine and cage wash contained 74, 11 and 2.3% of the total administered dose, respectively. Composite milk (day 1–5), liver and kidney each contained < 0.1% TRR of the administered dose. The radioactivity in the tissues ranged from 0.05 in muscle to 4.69 mg/kg N-acetyl-glyphosate equivalents in kidney. TRR values in milk were 0.030 to 0.036 mg/kg N-acetyl-glyphosate equivalents during the dosing period. Plateau levels in milk were reached after 24 hours.
Unchanged N-acetyl-glyphosate was the major residue in all tissues. Low levels of glyphosate, AMPA and N-acetyl AMPA were also detected. N-acetyl-glyphosate accounted for 53% TRR in fat, 77% in kidney, 55% in liver, 40% in milk and 17% in muscle. The minor metabolites glyphosate, AMPA and N-acetyl AMPA, accounted for no more than 15% TRR in liver, 8.4% liver and 6.6% fat, respectively.

696 Glyphosate
Six laying hens were orally treated twice daily for 7 consecutive days with [14C]-N-acetyl-glyphosate at a dose equivalent to 63 ppm (mg test substance equivalent/kg feed) per day and were sacrificed 6 hours after the last dose. The recovery of the total administered dose in excreta, eggs, and tissues was 90.2%. The majority (90.1%) of the dose was eliminated in the excreta. Eggs and edible tissues contained ~ 0.1% of the total administered dose. The radioactivity in the tissues ranged from 0.04 mg/kg N-acetyl-glyphosate equivalents in muscle and 0.05 mg/kg N-acetyl-glyphosate equivalents in fat, to 0.51 mg/kg N-acetyl-glyphosate equivalents in liver. The concentrations in whole eggs ranged from 0.05 mg/kg N-acetyl-glyphosate equivalents after 48 hours, to 0.36 mg/kg N-acetyl-glyphosate equivalents after 158 hours. Higher levels were observed in the egg yolks than in the whites.
Unchanged N-acetyl-glyphosate was the principle residue in egg yolks (68% TRR, 0.16 mg/kg), liver (64% TRR, 0.32 mg/kg), fat and muscle (25 and 23% TRR respectively, both 0.01 mg/kg), and was detected in egg whites in trace levels (41% TRR, < 0.01 mg/kg). Glyphosate was identified in fat (39% TRR, 0.023 mg/kg), egg yolks (5.7% TRR, 0.013 mg/kg) and liver (16% TRR, 0.084 mg/kg), and detected in muscle and egg whites at < 0.01 mg/kg (7.2% TRR and 11% TRR, respectively). AMPA was found in liver (6.7% TRR, 0.03 mg/kg), muscle and fat (17 and 11 %TRR respectively, both 0.01 mg/kg) and egg yolks (0.91% TRR, < 0.01 mg/kg). N-acetyl AMPA was identified in fat and liver at 0.01 and 0.02 mg/kg, 10 and 4.0% TRR respectively and at trace levels in egg whites, egg yolks and muscle. N-acetyl-glyphosate and glyphosate were the only residues eliminated to any significant extent in the excreta.
The absorbed dose of N-acetyl-glyphosate was not extensively metabolized in cattle and hens. Two basic metabolic pathways are proposed, both leading to AMPA. One route via de-acetylation to form glyphosate, which can be further metabolized to AMPA and one route where N-acetyl-glyphosate is metabolized to N-acetyl AMPA, which is further de-acetylated to form AMPA.
The metabolism for N-acetyl-glyphosate proposed for ruminants and laying hens is consistent with that for rats with regard to the conversion into glyphosate. A small difference between rats and livestock was that AMPA and N-acetyl AMPA were not detected in the rat metabolism studies. However, rats dosed with glyphosate show it can be metabolized in the rat to AMPA. Glyphosate, N-acetyl-glyphosate and AMPA are poorly absorbed from the gastrointestinal tract and rapidly and essentially completely excreted. Neither molecule accumulates in mammalian systems. It is predicted that N-acetyl AMPA will exhibit similar absorption, distribution and metabolism characteristics as glyphosate and its two metabolites.
Plant metabolism
The Meeting received plant metabolism studies for glyphosate treatments on genetically modified maize and soya beans; both contain the gat trait.
The metabolic fate of [14C]glyphosate in GAT maize plants was examined following a single pre-emergence soil application followed by three foliar applications (each 1.1 kg ai/ha at three different growth stages). Maize plants were harvested as immature foliage (immediately prior to the first foliar application), then as forage (prior to the last application) and finally at maturity (7 days PHI) whereupon plants were separated into stover, cob and grain fractions.
The TRRs in immature maize foliage were low (0.02 mg/kg glyphosate equivalents) indicating that low levels of radioactive soil residues were incorporated by the developing plant. In maize forage (one pre-emergence application and two foliar applications) the TRR was 3.48 mg/kg glyphosate equivalents. The major components in maize forage were glyphosate (58% TRR) and N-acetyl-glyphosate (27% TRR). AMPA and N-acetyl-AMPA were present at 4.0% TRR and 1.7% TRR respectively. The major components in maize stover were glyphosate (74.9% TRR) and N-acetyl-glyphosate (17.8% TRR) with AMPA and N-acetyl AMPA also identified but at much lower levels (4.4% and 1.3% TRR respectively). The major component in maize cobs and grain was N-acetyl-glyphosate which accounted for 63.8% TRR (0.44 mg/kg) and 51.2% TRR (0.14 mg/kg) respectively. N-acetyl-AMPA was the second most prominent metabolite present in cobs and grains at 5.0% TRR
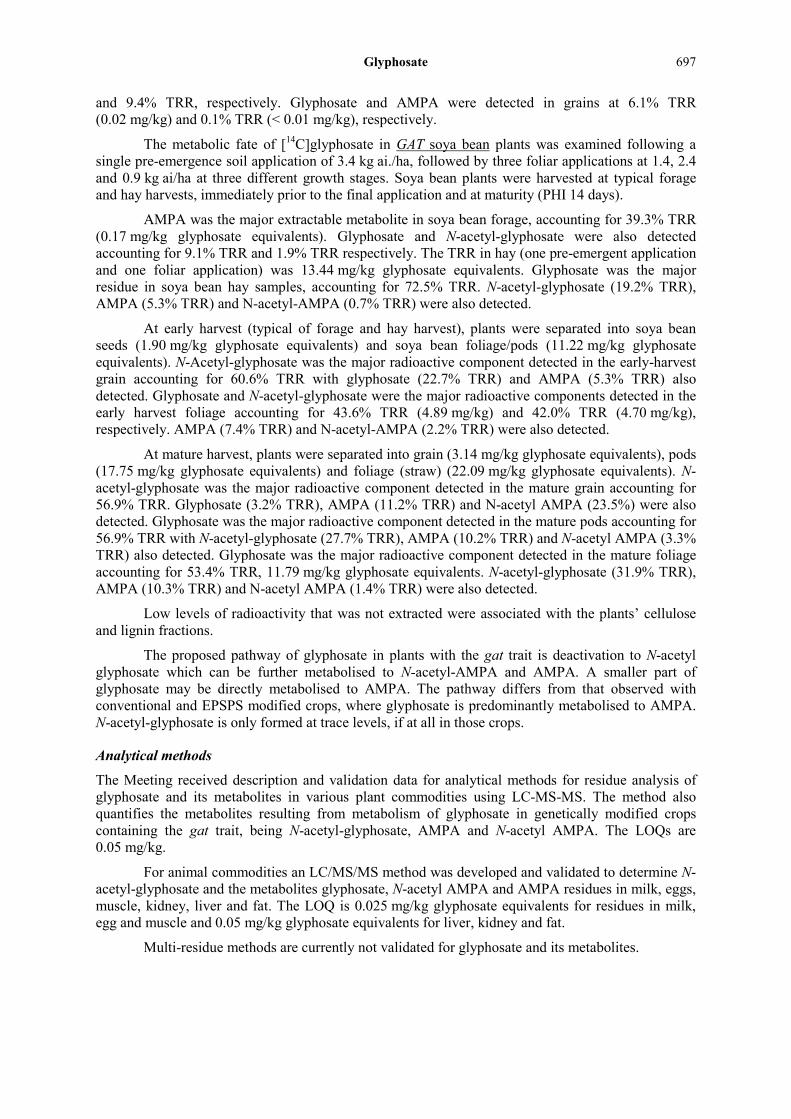
Glyphosate 697
and 9.4% TRR, respectively. Glyphosate and AMPA were detected in grains at 6.1% TRR (0.02 mg/kg) and 0.1% TRR (< 0.01 mg/kg), respectively.
The metabolic fate of [14C]glyphosate in GAT soya bean plants was examined following a single pre-emergence soil application of 3.4 kg ai./ha, followed by three foliar applications at 1.4, 2.4 and 0.9 kg ai/ha at three different growth stages. Soya bean plants were harvested at typical forage and hay harvests, immediately prior to the final application and at maturity (PHI 14 days).
AMPA was the major extractable metabolite in soya bean forage, accounting for 39.3% TRR (0.17 mg/kg glyphosate equivalents). Glyphosate and N-acetyl-glyphosate were also detected accounting for 9.1% TRR and 1.9% TRR respectively. The TRR in hay (one pre-emergent application and one foliar application) was 13.44 mg/kg glyphosate equivalents. Glyphosate was the major residue in soya bean hay samples, accounting for 72.5% TRR. N-acetyl-glyphosate (19.2% TRR), AMPA (5.3% TRR) and N-acetyl-AMPA (0.7% TRR) were also detected.
At early harvest (typical of forage and hay harvest), plants were separated into soya bean seeds (1.90 mg/kg glyphosate equivalents) and soya bean foliage/pods (11.22 mg/kg glyphosate equivalents). N-Acetyl-glyphosate was the major radioactive component detected in the early-harvest grain accounting for 60.6% TRR with glyphosate (22.7% TRR) and AMPA (5.3% TRR) also detected. Glyphosate and N-acetyl-glyphosate were the major radioactive components detected in the early harvest foliage accounting for 43.6% TRR (4.89 mg/kg) and 42.0% TRR (4.70 mg/kg), respectively. AMPA (7.4% TRR) and N-acetyl-AMPA (2.2% TRR) were also detected.
At mature harvest, plants were separated into grain (3.14 mg/kg glyphosate equivalents), pods (17.75 mg/kg glyphosate equivalents) and foliage (straw) (22.09 mg/kg glyphosate equivalents). N-acetyl-glyphosate was the major radioactive component detected in the mature grain accounting for 56.9% TRR. Glyphosate (3.2% TRR), AMPA (11.2% TRR) and N-acetyl AMPA (23.5%) were also detected. Glyphosate was the major radioactive component detected in the mature pods accounting for 56.9% TRR with N-acetyl-glyphosate (27.7% TRR), AMPA (10.2% TRR) and N-acetyl AMPA (3.3% TRR) also detected. Glyphosate was the major radioactive component detected in the mature foliage accounting for 53.4% TRR, 11.79 mg/kg glyphosate equivalents. N-acetyl-glyphosate (31.9% TRR), AMPA (10.3% TRR) and N-acetyl AMPA (1.4% TRR) were also detected.
Low levels of radioactivity that was not extracted were associated with the plants’ cellulose and lignin fractions.
The proposed pathway of glyphosate in plants with the gat trait is deactivation to N-acetyl glyphosate which can be further metabolised to N-acetyl-AMPA and AMPA. A smaller part of glyphosate may be directly metabolised to AMPA. The pathway differs from that observed with conventional and EPSPS modified crops, where glyphosate is predominantly metabolised to AMPA. N-acetyl-glyphosate is only formed at trace levels, if at all in those crops.
Analytical methods
The Meeting received description and validation data for analytical methods for residue analysis of glyphosate and its metabolites in various plant commodities using LC-MS-MS. The method also quantifies the metabolites resulting from metabolism of glyphosate in genetically modified crops containing the gat trait, being N-acetyl-glyphosate, AMPA and N-acetyl AMPA. The LOQs are 0.05 mg/kg.
For animal commodities an LC/MS/MS method was developed and validated to determine N-acetyl-glyphosate and the metabolites glyphosate, N-acetyl AMPA and AMPA residues in milk, eggs, muscle, kidney, liver and fat. The LOQ is 0.025 mg/kg glyphosate equivalents for residues in milk, egg and muscle and 0.05 mg/kg glyphosate equivalents for liver, kidney and fat.
Multi-residue methods are currently not validated for glyphosate and its metabolites.
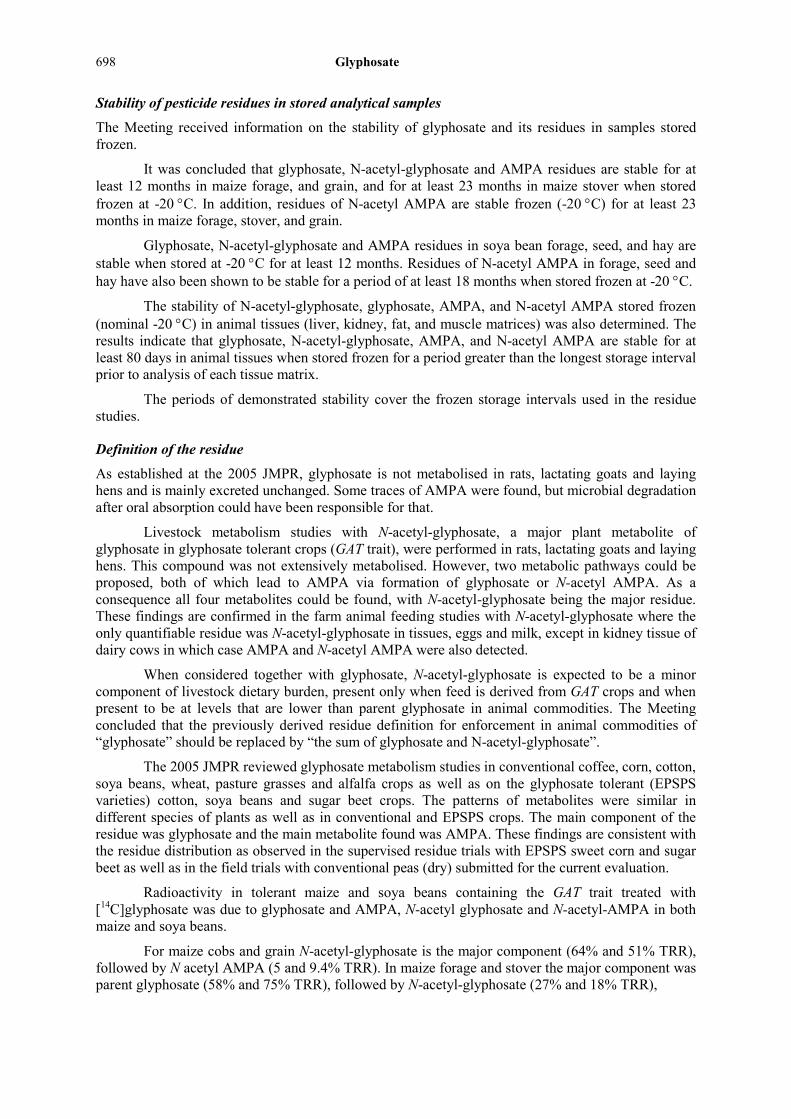
698 Glyphosate
Stability of pesticide residues in stored analytical samples
The Meeting received information on the stability of glyphosate and its residues in samples stored frozen.
It was concluded that glyphosate, N-acetyl-glyphosate and AMPA residues are stable for at least 12 months in maize forage, and grain, and for at least 23 months in maize stover when stored frozen at -20 °C. In addition, residues of N-acetyl AMPA are stable frozen (-20 °C) for at least 23 months in maize forage, stover, and grain.
Glyphosate, N-acetyl-glyphosate and AMPA residues in soya bean forage, seed, and hay are stable when stored at -20 °C for at least 12 months. Residues of N-acetyl AMPA in forage, seed and hay have also been shown to be stable for a period of at least 18 months when stored frozen at -20 °C.
The stability of N-acetyl-glyphosate, glyphosate, AMPA, and N-acetyl AMPA stored frozen (nominal -20 °C) in animal tissues (liver, kidney, fat, and muscle matrices) was also determined. The results indicate that glyphosate, N-acetyl-glyphosate, AMPA, and N-acetyl AMPA are stable for at least 80 days in animal tissues when stored frozen for a period greater than the longest storage interval prior to analysis of each tissue matrix.
The periods of demonstrated stability cover the frozen storage intervals used in the residue studies.
Definition of the residue
As established at the 2005 JMPR, glyphosate is not metabolised in rats, lactating goats and laying hens and is mainly excreted unchanged. Some traces of AMPA were found, but microbial degradation after oral absorption could have been responsible for that.
Livestock metabolism studies with N-acetyl-glyphosate, a major plant metabolite of glyphosate in glyphosate tolerant crops (GAT trait), were performed in rats, lactating goats and laying hens. This compound was not extensively metabolised. However, two metabolic pathways could be proposed, both of which lead to AMPA via formation of glyphosate or N-acetyl AMPA. As a consequence all four metabolites could be found, with N-acetyl-glyphosate being the major residue. These findings are confirmed in the farm animal feeding studies with N-acetyl-glyphosate where the only quantifiable residue was N-acetyl-glyphosate in tissues, eggs and milk, except in kidney tissue of dairy cows in which case AMPA and N-acetyl AMPA were also detected.
When considered together with glyphosate, N-acetyl-glyphosate is expected to be a minor component of livestock dietary burden, present only when feed is derived from GAT crops and when present to be at levels that are lower than parent glyphosate in animal commodities. The Meeting concluded that the previously derived residue definition for enforcement in animal commodities of “glyphosate” should be replaced by “the sum of glyphosate and N-acetyl-glyphosate”.
The 2005 JMPR reviewed glyphosate metabolism studies in conventional coffee, corn, cotton, soya beans, wheat, pasture grasses and alfalfa crops as well as on the glyphosate tolerant (EPSPS varieties) cotton, soya beans and sugar beet crops. The patterns of metabolites were similar in different species of plants as well as in conventional and EPSPS crops. The main component of the residue was glyphosate and the main metabolite found was AMPA. These findings are consistent with the residue distribution as observed in the supervised residue trials with EPSPS sweet corn and sugar beet as well as in the field trials with conventional peas (dry) submitted for the current evaluation.
Radioactivity in tolerant maize and soya beans containing the GAT trait treated with [14C]glyphosate was due to glyphosate and AMPA, N-acetyl glyphosate and N-acetyl-AMPA in both maize and soya beans.
For maize cobs and grain N-acetyl-glyphosate is the major component (64% and 51% TRR), followed by N acetyl AMPA (5 and 9.4% TRR). In maize forage and stover the major component was parent glyphosate (58% and 75% TRR), followed by N-acetyl-glyphosate (27% and 18% TRR),
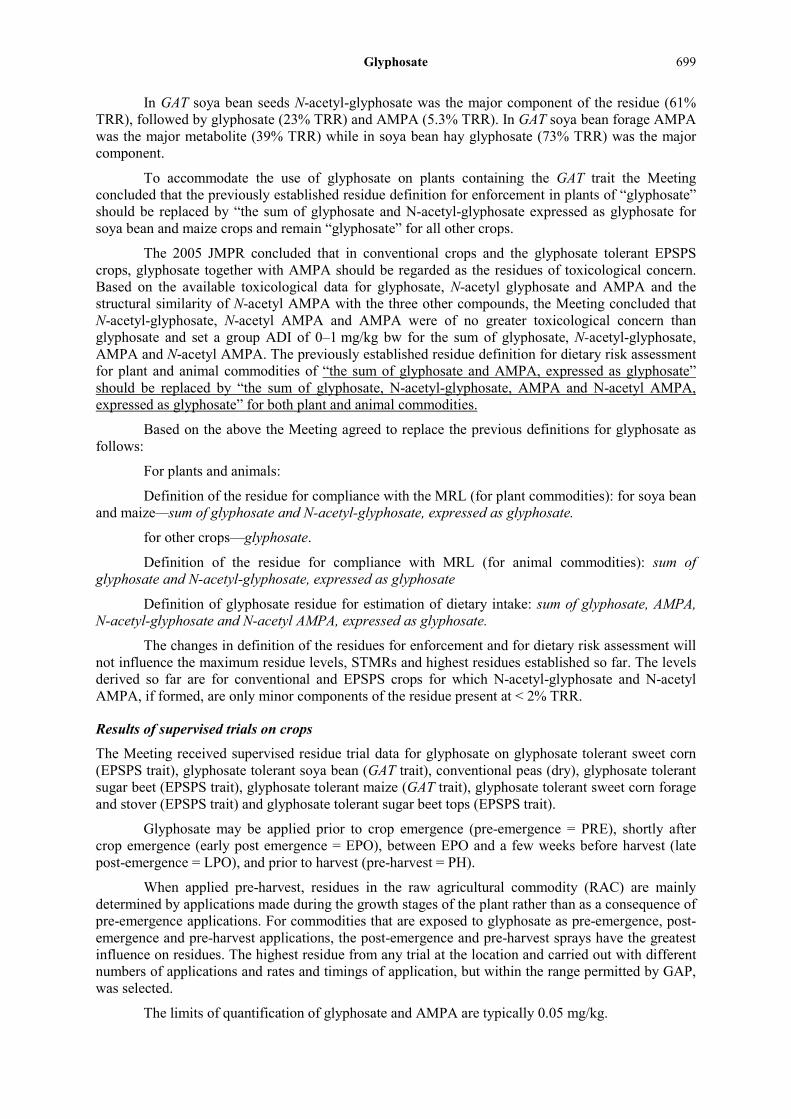
Glyphosate 699
In GAT soya bean seeds N-acetyl-glyphosate was the major component of the residue (61% TRR), followed by glyphosate (23% TRR) and AMPA (5.3% TRR). In GAT soya bean forage AMPA was the major metabolite (39% TRR) while in soya bean hay glyphosate (73% TRR) was the major component.
To accommodate the use of glyphosate on plants containing the GAT trait the Meeting concluded that the previously established residue definition for enforcement in plants of “glyphosate” should be replaced by “the sum of glyphosate and N-acetyl-glyphosate expressed as glyphosate for soya bean and maize crops and remain “glyphosate” for all other crops.
The 2005 JMPR concluded that in conventional crops and the glyphosate tolerant EPSPS crops, glyphosate together with AMPA should be regarded as the residues of toxicological concern. Based on the available toxicological data for glyphosate, N-acetyl glyphosate and AMPA and the structural similarity of N-acetyl AMPA with the three other compounds, the Meeting concluded that N-acetyl-glyphosate, N-acetyl AMPA and AMPA were of no greater toxicological concern than glyphosate and set a group ADI of 0–1 mg/kg bw for the sum of glyphosate, N-acetyl-glyphosate, AMPA and N-acetyl AMPA. The previously established residue definition for dietary risk assessment for plant and animal commodities of “the sum of glyphosate and AMPA, expressed as glyphosate” should be replaced by “the sum of glyphosate, N-acetyl-glyphosate, AMPA and N-acetyl AMPA, expressed as glyphosate” for both plant and animal commodities.
Based on the above the Meeting agreed to replace the previous definitions for glyphosate as follows:
For plants and animals:
Definition of the residue for compliance with the MRL (for plant commodities): for soya bean and maize—sum of glyphosate and N-acetyl-glyphosate, expressed as glyphosate.
for other crops—glyphosate.
Definition of the residue for compliance with MRL (for animal commodities): sum of glyphosate and N-acetyl-glyphosate, expressed as glyphosate
Definition of glyphosate residue for estimation of dietary intake: sum of glyphosate, AMPA, N-acetyl-glyphosate and N-acetyl AMPA, expressed as glyphosate.
The changes in definition of the residues for enforcement and for dietary risk assessment will not influence the maximum residue levels, STMRs and highest residues established so far. The levels derived so far are for conventional and EPSPS crops for which N-acetyl-glyphosate and N-acetyl AMPA, if formed, are only minor components of the residue present at < 2% TRR.
Results of supervised trials on crops
The Meeting received supervised residue trial data for glyphosate on glyphosate tolerant sweet corn (EPSPS trait), glyphosate tolerant soya bean (GAT trait), conventional peas (dry), glyphosate tolerant sugar beet (EPSPS trait), glyphosate tolerant maize (GAT trait), glyphosate tolerant sweet corn forage and stover (EPSPS trait) and glyphosate tolerant sugar beet tops (EPSPS trait).
Glyphosate may be applied prior to crop emergence (pre-emergence = PRE), shortly after crop emergence (early post emergence = EPO), between EPO and a few weeks before harvest (late post-emergence = LPO), and prior to harvest (pre-harvest = PH).
When applied pre-harvest, residues in the raw agricultural commodity (RAC) are mainly determined by applications made during the growth stages of the plant rather than as a consequence of pre-emergence applications. For commodities that are exposed to glyphosate as pre-emergence, post-emergence and pre-harvest applications, the post-emergence and pre-harvest sprays have the greatest influence on residues. The highest residue from any trial at the location and carried out with different numbers of applications and rates and timings of application, but within the range permitted by GAP, was selected.
The limits of quantification of glyphosate and AMPA are typically 0.05 mg/kg.

700 Glyphosate
In general, data from conventional crops and genetically modified crops cannot be combined since application rates in genetically modified crops are usually higher than in conventional crops. The data were only combined when the GAP-s were similar.
For estimation of maximum residue levels for soya beans and maize crops glyphosate and N-acetyl glyphosate levels are summed and expressed as glyphosate equivalents.
The values used for the estimation of maximum residue level are underlined.
For estimation of residue levels for dietary risk assessment in conventional crops and glyphosate tolerant crops (EPSPS varieties) glyphosate and AMPA form the total residue, since N-acetyl-glyphosate and N-acetyl AMPA are not formed. When glyphosate and AMPA are summed, AMPA was converted to glyphosate acid equivalents (AMPA mg/kg × 1.5). The Meeting concluded that generally if AMPA residues are < 0.05 mg/kg, the LOQ level is not summed with glyphosate because AMPA residues are typically much less than glyphosate. If both glyphosate and AMPA are < LOQ, then the sum is < LOQ of glyphosate. This is also the case for glyphosate tolerant sugar beet (EPSPS variety). The exception is where there is evidence that AMPA residues are comparable to glyphosate residues such as for glyphosate tolerant sweet corn (EPSPS variety). In that situation the LOQs are summed and if both glyphosate and AMPA residues are < LOQ and the level reported as less than the sum of the LOQs for glyphosate and AMPA.
For estimation of the residue levels for dietary risk assessment of glyphosate in GAT crops, in general, all four analytes are present in significant amounts. In the GAT modified soya beans, N-acetyl glyphosate is the major residue found in soya bean seed, followed by N-acetyl AMPA and glyphosate. AMPA occurs in lower levels. However, as AMPA does occur in levels above LOQ in a small number of residue trials the LOQ for AMPA is included in the sum of residues when AMPA is reported as < LOQ. In maize with the GAT trait N-acetyl glyphosate residue levels were found to be the major residue in grain. Since in a small number of trials glyphosate residues were also observed the LOQ for both N-acetyl glyphosate and glyphosate were included in the calculation of the total residue when residues were reported as < LOQ. Because all AMPA and N-acetyl AMPA residue levels were below LOQ and the metabolism study suggests they are components, when present at < LOQ the LOQs for these metabolites were not included in the calculation of the total residue for dietary risk assessment for maize.
The OECD calculator was used as a tool in the estimation of the maximum residue level from the selected residue data set obtained from trials conducted according to GAP. As a first step, the Meeting reviewed all relevant factors related to each data set in arriving at a best estimate of the maximum residue level using expert judgement. Then, the OECD calculator was employed. If the statistical calculation spreadsheet suggested a different value from that recommended by the JMPR, a brief explanation of the deviation was provided.
Fruiting vegetables
Sweet corn
Field trials involving glyphosate tolerant sweet corn (EPSPS variety) conducted in the USA and Canada were available to the Meeting.
The GAP for sweet corn in the USA is ≥ 1 LPO (late post emergence) applications, maximum of 1.7 kg ai/ha per application (PHI 30 days), with a total in-crop maximum of 5.2 kg ai/ha. In the trials matching this GAP the glyphosate residues reported as free acid equivalent in ranked order were (n = 14) 0.11, 0.12, 0.13, 0.13, 0.14, 0.15, 0.24, 0.24, 0.28, 0.30, 0.60, 0.70, 1.2 and 2.3 mg/kg. The Meeting agreed that the USA and Canadian data set could be used to support a maximum residue level recommendation and estimated a maximum residue level of 3 mg/kg for glyphosate on corn-on-the-cob.
Total residues in ranked order were (n = 14) 0.18, 0.20, 0.20, 0.22, 0.22, 0.23, 0.32, 0.33, 0.43, 0.43, 0.78, 1.0, 1.3 and 2.8 mg/kg. The STMR for total residues is 0.325 mg/kg.

Glyphosate 701
Pulses
The Meeting received a request to re-evaluate previously submitted data on lentils, in combination with the data on dried peas and dried beans and new trials in dried peas, and to consider extrapolation of the pea and bean data to support a maximum residue level recommendation for lentils. The Meeting noted extrapolation based on peas (dry) would lead to a higher maximum residue level estimation. The previously evaluated data for peas (dry) and lentils together with newly submitted data for peas (dry) are summarized below.
Lentils
The 2005 JMPR reviewed two trials on conventional lentils, conducted in Canada and matching the GAP of Canada (1 pre-harvest (PH) application of 0.9 kg ai/ha, when crop has 30% grain moisture content and lowermost pods are brown with seed rattle, PHI 7–14 days). Residues of glyphosate reported were < 0.05 and 3.0 mg/kg and for AMPA < 0.05 mg/kg. The total residues (glyphosate and AMPA) were < 0.05 mg/kg and 3.0 mg/kg.
Peas (dry)
Residue data from trials in conventional peas (dry) in the UK, Belgium, Denmark and Canada were evaluated against the GAPs of the UK and Canada by the 2005 JMPR and combined. GAP in Canada is a single PH application of 0.9 kg glyphosate ai/ha when grain moisture is < 30% (PHI 7–14 days). GAP in the UK is a single PH application of 1.4 kg ai/ha when grain moisture is < 30% (PHI 7 days). Glyphosate residues in ranked order were (n = 11): 0.13, 0.16, 0.17, 0.17, 0.5, 0.5, 0.82, 1.4, 1.7, 1.8, and 2.1 mg/kg. Based on these data an MRL of 5 mg/kg was estimated.
When measured, AMPA residues were all < 0.05 (4) mg/kg. The STMR was estimated to be 0.5 mg/kg.
The current Meeting received five additional field trials in conventional peas (dry), performed in three locations in the USA in 1998, matching the USA GAP for 1 PH application of up to 2.55 kg ai/ha, PHI 7 days, and with grain moisture ≤ 30%. Glyphosate residues (glyphosate only) in grains in ranked order were: 0.70, 0.77, 1.1, 3.4, and 4.2 mg/kg (n = 5) at PHI 7. The data are insufficient to estimate a new maximum residue level and STMR for conventional peas (dry) based on the USA GAP.
Data from peas (dry) can both be used to extrapolate to other members of the group pulses that have similar GAP such as lentils. The Meeting proposed to use the dataset from peas that support the Canadian GAP of 1 PH application of 0.9 kg ai/ha, grain moisture ≤ 30%, PHI 7–14 days. The Meeting extrapolated the residues on peas (dry) to estimate a maximum residue level of 5 mg/kg, an STMR of 0.5 mg/kg, respectively for lentils.
Soya beans
The 2005 JMPR reviewed field trials conducted according to USA GAP in both conventional and glyphosate tolerant soya beans (EPSPS varieties) and concluded them to be similar residue populations for the purpose of estimating MRLs and combined the datasets. The USA GAP for conventional soya beans was 4.3 kg ai/ha PRE, 4.2 kg ai/ha PH, with a PHI of 7 days. The USA GAP for glyphosate tolerant soya beans (EPSPS variety) was 0.43–4.2 kg ai/ha PRE, 1.7 kg ai/ha LPO, 0.83 kg ai/ha PH (combined LPO + PH < 2.5 kg ai/ha), with a PHI of 14 days. Glyphosate residues in ranked order were (n = 36): 0.27, 0.28, 0.34, 0.37, 0.42, 0.44, 0.45, 0.51, 0.56, 0.60, 0.70, 1.0, 1.1, 1.4, 1.4, 1.5, 1.7, 1.8, 1.9, 1.9, 1.9, 2.0, 2.6, 2.7, 2.7, 3.0, 3.3, 3.5, 3.6, 3.7, 4.4, 5.3, 5.4, 5.6, 13 and 17 mg/kg. The 2005 JMPR used the data to confirm the previous maximum residue level of glyphosate in soya beans of 20 mg/kg.
Total residues (glyphosate and AMPA only) were (n = 36): 0.45, 0.59, 0.78, 0.89, 1.0, 1.1, 1.1, 1.2, 1.2, 1.5, 1.6, 2.4, 3.2, 4.0, 4.0, 4.3, 4.7, 4.9, 5.1, 5.4, 5.7, 6.2, 6.6, 7.1, 7.2, 7.6, 7.6, 7.9, 8.2, 8.5, 11, 11, 11, 16, 17 and 20 mg/kg. The highest residue and STMR for total residues were estimated to be 20 and 5.0, respectively.

702 Glyphosate
The current Meeting received field trials performed in the USA and Canada involving glyphosate tolerant soya beans containing the GAT trait. GAP for USA and Canada is for 1 pre-emergence application (0.44–4.2 kg ai/ha PRE), followed by three field applications, with a maximum application of 1.76 kg ai/ha at LPO (late post emergence) and the last application PH (pre harvest) not exceeding 0.88 kg ai/ha (PHI 14 days). The Meeting noted that the pre-emergence applications were conducted at a lower rate (mostly 3.2–3.9 kg ai/ha) than indicated by GAP of 4.2 kg ai/ha. However, as established by the 2005 JMPR the difference in application rates at pre-emergence account for less than 10% difference in the residue at harvest and the later post-emergence sprays determine the residue. At one trial location the crop was damaged due to a hurricane and heavy rain fall. Residues in this trial were considerably higher than samples collected from other sites and the results for this site are not considered further.
Residues in the remaining trials matching USA GAP (late post emergence application 1.76 kg ai/ha and pre-harvest application 0.88 kg ai/ha, PHI 14 days) in soya bean seeds were 0.1, 0.34, 0.49, 0.69, 0.89, 0.92, 1.2, 1.5, 1.7, 1.7, 1.7, 1.8, 2.4, 2.4, 3.1, 3.1, 5, 5, 5.8, 5.9, 6 and 7.8 mg/kg (n = 22). The Meeting noted that the use of glyphosate on soya beans containing the GAT trait is covered by the previous recommendation of 20 mg/kg for soya bean (dry).
Root and tuber vegetables
Sugar beets
The current Meeting received field trials involving glyphosate tolerant sugar beets containing the EPSPS gene conducted in Canada and the USA.
GAP for these glyphosate tolerant sugar beets in the USA is ≥ 1 PRE applications, total max 4.2 kg ai/ha, 2 LPO of 1.3 kg ai/ha, and 2 PH applications of 0.9 kg ai/ha, PHI 30 days and total in crop application rate (LPO and PH) of 3.9 kg ai/ha. The Canadian GAP consists of ≥ 1 × PRE applications and up to 4 × LPO applications at 0.9 kg ai/ha, PHI 30 days, and a total in crop application rate (for LPO) of 3.6 kg ai/ha. The pre-emergence application was not considered to attribute significantly by the Meeting of 2005.
In trials performed in Canada matching the GAP (4 × 0.9 kg ai/ha, PHI 30 days) glyphosate residues in sugar beet roots in ranked order were (n = 4): 3.1, 3.5, 5.7 and 7.1 mg/kg.
In trials matching the USA GAP (2 × 1.3 kg ai/ha LPO and 2× 0.9 kg ai/ha PH, PHI 30 days) glyphosate residues (glyphosate only) in ranked order were (n = 12): 0.62, 0.90, 2.0, 2.2, 2.6, 2.9, 3.2, 3.3, 4.6, 4.8, 5.0 and 5.5 mg/kg.
The Meeting noted that the last two critical applications of the Canadian and USA GAP were similar and that the trials conducted in Canada with a lower application rate led to higher residues. The Meeting decided to combine the results. Glyphosate residues in ranked order were (n = 16): 0.62, 0.9, 2, 2.2, 2.6, 2.9, 3.1, 3.2, 3.3, 3.5, 4.6, 4.8, 5, 5.5, 5.7 and 7.1 mg/kg. The Meeting estimated a maximum residue level of 15 mg/kg.
The total residues in ranked order were (n = 16) 0.7, 0.98, 2.1, 2.3, 2.7, 3, 3.1, 3.4, 3.4, 3.5, 4.8, 5, 5.3, 5.8, 5.8 and 7.3 mg/kg. The highest residue and STMR for total residues are 7.3 and 3.4 mg/kg for glyphosate tolerant sugar beet.
Maize
The 2005 JMPR reviewed trials on conventional maize conducted in the USA (GAP of 0.43–4.5 kg ai/ha PRE, 0.87 kg ai/ha directed spray when crop > 30 cm tall and 2.5 kg ai/ha PH grain moisture < 35%, with a PHI of 7 days). From 21 trials that approximated the USA GAP, which involved a single pre-harvest application to conventional maize, glyphosate residues of < 0.05 (12), 0.05 (2), 0.06 (2), 0.07, 0.09, 0.54, and 3.0 mg/kg were found. Corresponding total residues were < 0.12 (11), < 0.14 (2), 0.14, < 0.16, 0.19, < 0.23, 0.25, < 0.26, < 0.62 and 3.0 mg/kg, respectively. The 2005 JMPR estimated a maximum residue level for conventional maize of 5 mg/kg, an STMR of
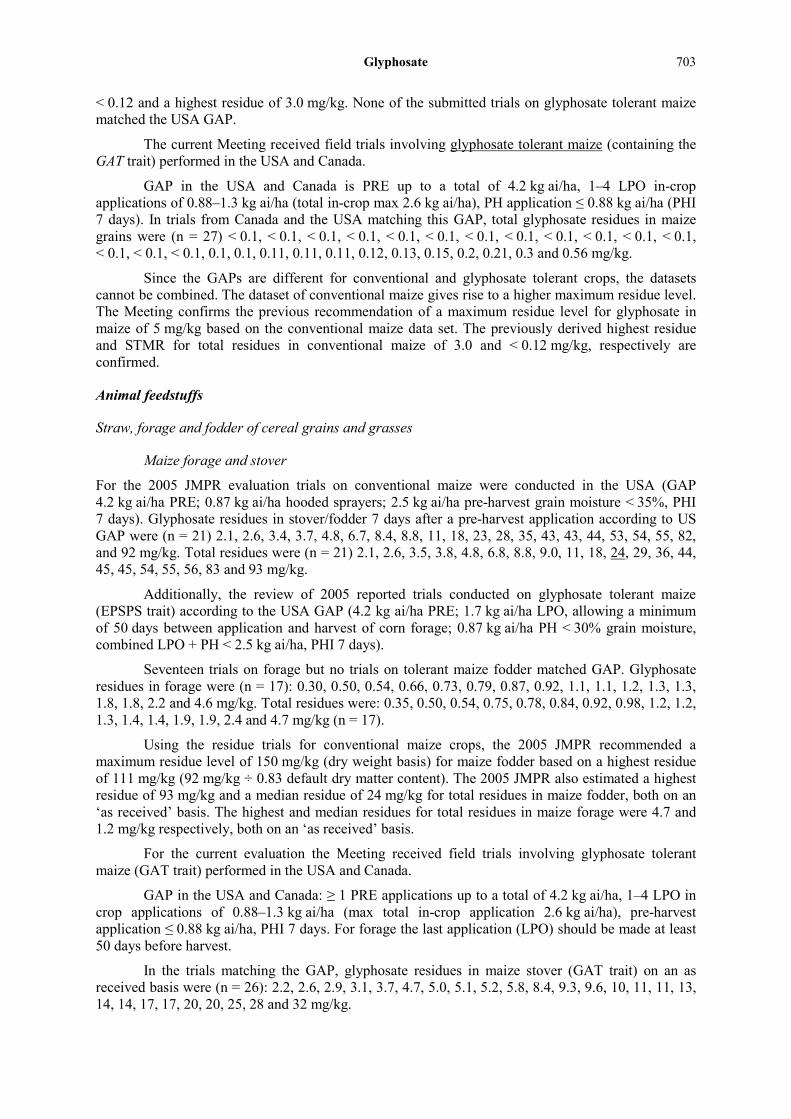
Glyphosate 703
< 0.12 and a highest residue of 3.0 mg/kg. None of the submitted trials on glyphosate tolerant maize matched the USA GAP.
The current Meeting received field trials involving glyphosate tolerant maize (containing the GAT trait) performed in the USA and Canada.
GAP in the USA and Canada is PRE up to a total of 4.2 kg ai/ha, 1–4 LPO in-crop applications of 0.88–1.3 kg ai/ha (total in-crop max 2.6 kg ai/ha), PH application ≤ 0.88 kg ai/ha (PHI 7 days). In trials from Canada and the USA matching this GAP, total glyphosate residues in maize grains were (n = 27) < 0.1, < 0.1, < 0.1, < 0.1, < 0.1, < 0.1, < 0.1, < 0.1, < 0.1, < 0.1, < 0.1, < 0.1, < 0.1, < 0.1, < 0.1, 0.1, 0.1, 0.11, 0.11, 0.11, 0.12, 0.13, 0.15, 0.2, 0.21, 0.3 and 0.56 mg/kg.
Since the GAPs are different for conventional and glyphosate tolerant crops, the datasets cannot be combined. The dataset of conventional maize gives rise to a higher maximum residue level. The Meeting confirms the previous recommendation of a maximum residue level for glyphosate in maize of 5 mg/kg based on the conventional maize data set. The previously derived highest residue and STMR for total residues in conventional maize of 3.0 and < 0.12 mg/kg, respectively are confirmed.
Animal feedstuffs
Straw, forage and fodder of cereal grains and grasses
Maize forage and stover
For the 2005 JMPR evaluation trials on conventional maize were conducted in the USA (GAP 4.2 kg ai/ha PRE; 0.87 kg ai/ha hooded sprayers; 2.5 kg ai/ha pre-harvest grain moisture < 35%, PHI 7 days). Glyphosate residues in stover/fodder 7 days after a pre-harvest application according to US GAP were (n = 21) 2.1, 2.6, 3.4, 3.7, 4.8, 6.7, 8.4, 8.8, 11, 18, 23, 28, 35, 43, 43, 44, 53, 54, 55, 82, and 92 mg/kg. Total residues were (n = 21) 2.1, 2.6, 3.5, 3.8, 4.8, 6.8, 8.8, 9.0, 11, 18, 24, 29, 36, 44, 45, 45, 54, 55, 56, 83 and 93 mg/kg.
Additionally, the review of 2005 reported trials conducted on glyphosate tolerant maize (EPSPS trait) according to the USA GAP (4.2 kg ai/ha PRE; 1.7 kg ai/ha LPO, allowing a minimum of 50 days between application and harvest of corn forage; 0.87 kg ai/ha PH < 30% grain moisture, combined LPO + PH < 2.5 kg ai/ha, PHI 7 days).
Seventeen trials on forage but no trials on tolerant maize fodder matched GAP. Glyphosate residues in forage were (n = 17): 0.30, 0.50, 0.54, 0.66, 0.73, 0.79, 0.87, 0.92, 1.1, 1.1, 1.2, 1.3, 1.3, 1.8, 1.8, 2.2 and 4.6 mg/kg. Total residues were: 0.35, 0.50, 0.54, 0.75, 0.78, 0.84, 0.92, 0.98, 1.2, 1.2, 1.3, 1.4, 1.4, 1.9, 1.9, 2.4 and 4.7 mg/kg (n = 17).
Using the residue trials for conventional maize crops, the 2005 JMPR recommended a maximum residue level of 150 mg/kg (dry weight basis) for maize fodder based on a highest residue of 111 mg/kg (92 mg/kg ÷ 0.83 default dry matter content). The 2005 JMPR also estimated a highest residue of 93 mg/kg and a median residue of 24 mg/kg for total residues in maize fodder, both on an ‘as received’ basis. The highest and median residues for total residues in maize forage were 4.7 and 1.2 mg/kg respectively, both on an ‘as received’ basis.
For the current evaluation the Meeting received field trials involving glyphosate tolerant maize (GAT trait) performed in the USA and Canada.
GAP in the USA and Canada: ≥ 1 PRE applications up to a total of 4.2 kg ai/ha, 1–4 LPO in crop applications of 0.88–1.3 kg ai/ha (max total in-crop application 2.6 kg ai/ha), pre-harvest application ≤ 0.88 kg ai/ha, PHI 7 days. For forage the last application (LPO) should be made at least 50 days before harvest.
In the trials matching the GAP, glyphosate residues in maize stover (GAT trait) on an as received basis were (n = 26): 2.2, 2.6, 2.9, 3.1, 3.7, 4.7, 5.0, 5.1, 5.2, 5.8, 8.4, 9.3, 9.6, 10, 11, 11, 13, 14, 14, 17, 17, 20, 20, 25, 28 and 32 mg/kg.
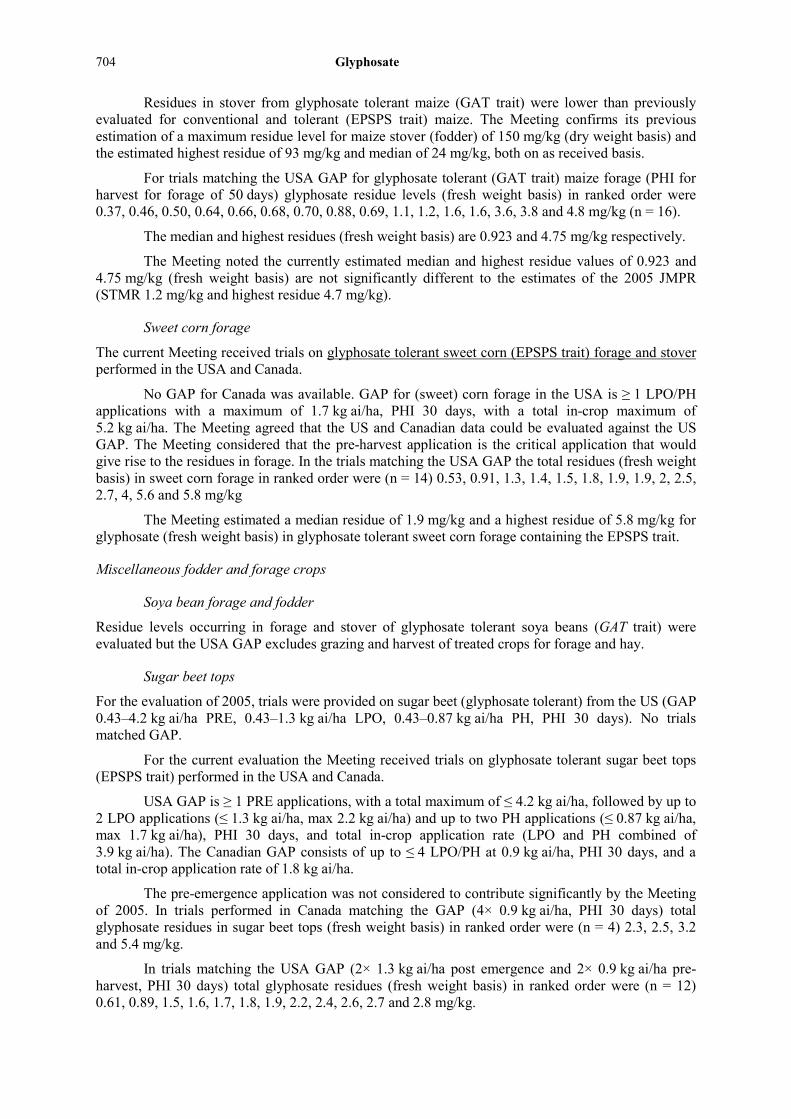
704 Glyphosate
Residues in stover from glyphosate tolerant maize (GAT trait) were lower than previously evaluated for conventional and tolerant (EPSPS trait) maize. The Meeting confirms its previous estimation of a maximum residue level for maize stover (fodder) of 150 mg/kg (dry weight basis) and the estimated highest residue of 93 mg/kg and median of 24 mg/kg, both on as received basis.
For trials matching the USA GAP for glyphosate tolerant (GAT trait) maize forage (PHI for harvest for forage of 50 days) glyphosate residue levels (fresh weight basis) in ranked order were 0.37, 0.46, 0.50, 0.64, 0.66, 0.68, 0.70, 0.88, 0.69, 1.1, 1.2, 1.6, 1.6, 3.6, 3.8 and 4.8 mg/kg (n = 16).
The median and highest residues (fresh weight basis) are 0.923 and 4.75 mg/kg respectively.
The Meeting noted the currently estimated median and highest residue values of 0.923 and 4.75 mg/kg (fresh weight basis) are not significantly different to the estimates of the 2005 JMPR (STMR 1.2 mg/kg and highest residue 4.7 mg/kg).
Sweet corn forage
The current Meeting received trials on glyphosate tolerant sweet corn (EPSPS trait) forage and stover performed in the USA and Canada.
No GAP for Canada was available. GAP for (sweet) corn forage in the USA is ≥ 1 LPO/PH applications with a maximum of 1.7 kg ai/ha, PHI 30 days, with a total in-crop maximum of 5.2 kg ai/ha. The Meeting agreed that the US and Canadian data could be evaluated against the US GAP. The Meeting considered that the pre-harvest application is the critical application that would give rise to the residues in forage. In the trials matching the USA GAP the total residues (fresh weight basis) in sweet corn forage in ranked order were (n = 14) 0.53, 0.91, 1.3, 1.4, 1.5, 1.8, 1.9, 1.9, 2, 2.5, 2.7, 4, 5.6 and 5.8 mg/kg
The Meeting estimated a median residue of 1.9 mg/kg and a highest residue of 5.8 mg/kg for glyphosate (fresh weight basis) in glyphosate tolerant sweet corn forage containing the EPSPS trait.
Miscellaneous fodder and forage crops
Soya bean forage and fodder
Residue levels occurring in forage and stover of glyphosate tolerant soya beans (GAT trait) were evaluated but the USA GAP excludes grazing and harvest of treated crops for forage and hay.
Sugar beet tops
For the evaluation of 2005, trials were provided on sugar beet (glyphosate tolerant) from the US (GAP 0.43–4.2 kg ai/ha PRE, 0.43–1.3 kg ai/ha LPO, 0.43–0.87 kg ai/ha PH, PHI 30 days). No trials matched GAP.
For the current evaluation the Meeting received trials on glyphosate tolerant sugar beet tops (EPSPS trait) performed in the USA and Canada.
USA GAP is ≥ 1 PRE applications, with a total maximum of ≤ 4.2 kg ai/ha, followed by up to 2 LPO applications (≤ 1.3 kg ai/ha, max 2.2 kg ai/ha) and up to two PH applications (≤ 0.87 kg ai/ha, max 1.7 kg ai/ha), PHI 30 days, and total in-crop application rate (LPO and PH combined of 3.9 kg ai/ha). The Canadian GAP consists of up to ≤ 4 LPO/PH at 0.9 kg ai/ha, PHI 30 days, and a total in-crop application rate of 1.8 kg ai/ha.
The pre-emergence application was not considered to contribute significantly by the Meeting of 2005. In trials performed in Canada matching the GAP (4× 0.9 kg ai/ha, PHI 30 days) total glyphosate residues in sugar beet tops (fresh weight basis) in ranked order were (n = 4) 2.3, 2.5, 3.2 and 5.4 mg/kg.
In trials matching the USA GAP (2× 1.3 kg ai/ha post emergence and 2× 0.9 kg ai/ha pre-harvest, PHI 30 days) total glyphosate residues (fresh weight basis) in ranked order were (n = 12) 0.61, 0.89, 1.5, 1.6, 1.7, 1.8, 1.9, 2.2, 2.4, 2.6, 2.7 and 2.8 mg/kg.
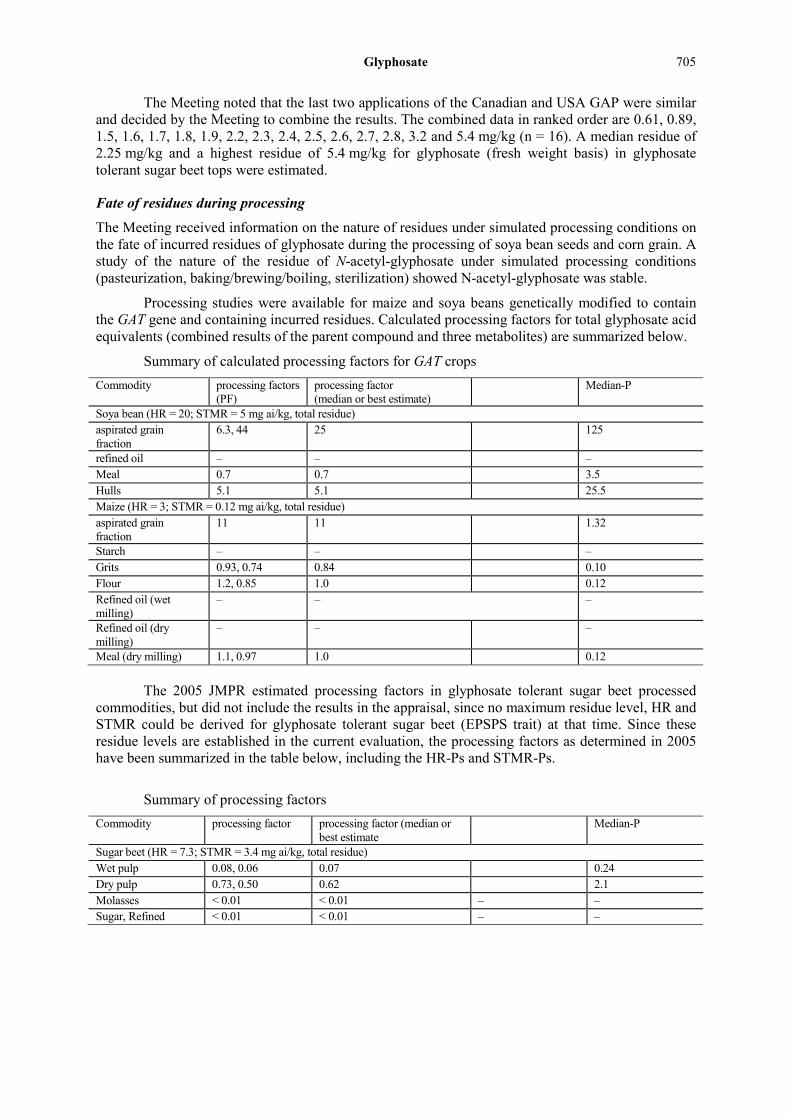
Glyphosate 705
The Meeting noted that the last two applications of the Canadian and USA GAP were similar and decided by the Meeting to combine the results. The combined data in ranked order are 0.61, 0.89, 1.5, 1.6, 1.7, 1.8, 1.9, 2.2, 2.3, 2.4, 2.5, 2.6, 2.7, 2.8, 3.2 and 5.4 mg/kg (n = 16). A median residue of 2.25 mg/kg and a highest residue of 5.4 mg/kg for glyphosate (fresh weight basis) in glyphosate tolerant sugar beet tops were estimated.
Fate of residues during processing
The Meeting received information on the nature of residues under simulated processing conditions on the fate of incurred residues of glyphosate during the processing of soya bean seeds and corn grain. A study of the nature of the residue of N-acetyl-glyphosate under simulated processing conditions (pasteurization, baking/brewing/boiling, sterilization) showed N-acetyl-glyphosate was stable.
Processing studies were available for maize and soya beans genetically modified to contain the GAT gene and containing incurred residues. Calculated processing factors for total glyphosate acid equivalents (combined results of the parent compound and three metabolites) are summarized below.
Summary of calculated processing factors for GAT crops Commodity processing factors
(PF) processing factor (median or best estimate)
Median-P
Soya bean (HR = 20; STMR = 5 mg ai/kg, total residue) aspirated grain fraction
6.3, 44 25 125
refined oil – – – Meal 0.7 0.7 3.5 Hulls 5.1 5.1 25.5 Maize (HR = 3; STMR = 0.12 mg ai/kg, total residue) aspirated grain fraction
11 11 1.32
Starch – – – Grits 0.93, 0.74 0.84 0.10 Flour 1.2, 0.85 1.0 0.12 Refined oil (wet milling)
– – –
Refined oil (dry milling)
– – –
Meal (dry milling) 1.1, 0.97 1.0 0.12
The 2005 JMPR estimated processing factors in glyphosate tolerant sugar beet processed commodities, but did not include the results in the appraisal, since no maximum residue level, HR and STMR could be derived for glyphosate tolerant sugar beet (EPSPS trait) at that time. Since these residue levels are established in the current evaluation, the processing factors as determined in 2005 have been summarized in the table below, including the HR-Ps and STMR-Ps.
Summary of processing factors
Commodity processing factor processing factor (median or best estimate
Median-P
Sugar beet (HR = 7.3; STMR = 3.4 mg ai/kg, total residue) Wet pulp 0.08, 0.06 0.07 0.24 Dry pulp 0.73, 0.50 0.62 2.1 Molasses < 0.01 < 0.01 – – Sugar, Refined < 0.01 < 0.01 – –
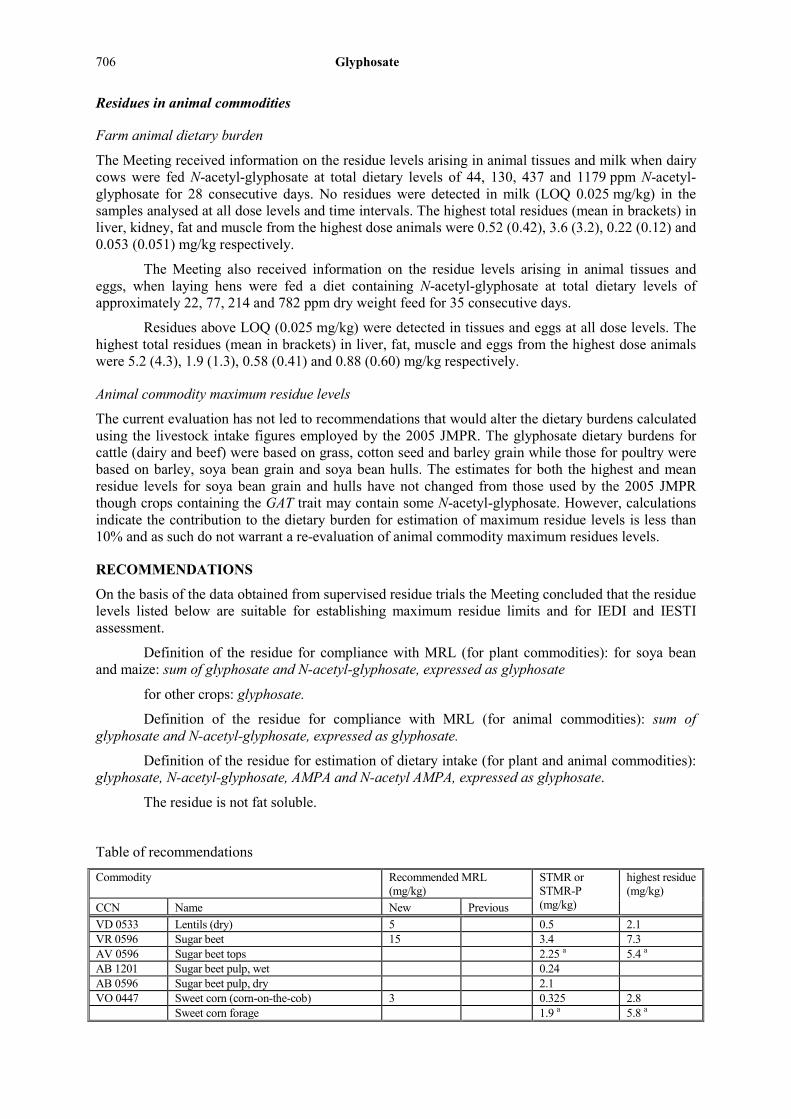
706 Glyphosate
Residues in animal commodities
Farm animal dietary burden
The Meeting received information on the residue levels arising in animal tissues and milk when dairy cows were fed N-acetyl-glyphosate at total dietary levels of 44, 130, 437 and 1179 ppm N-acetyl-glyphosate for 28 consecutive days. No residues were detected in milk (LOQ 0.025 mg/kg) in the samples analysed at all dose levels and time intervals. The highest total residues (mean in brackets) in liver, kidney, fat and muscle from the highest dose animals were 0.52 (0.42), 3.6 (3.2), 0.22 (0.12) and 0.053 (0.051) mg/kg respectively.
The Meeting also received information on the residue levels arising in animal tissues and eggs, when laying hens were fed a diet containing N-acetyl-glyphosate at total dietary levels of approximately 22, 77, 214 and 782 ppm dry weight feed for 35 consecutive days.
Residues above LOQ (0.025 mg/kg) were detected in tissues and eggs at all dose levels. The highest total residues (mean in brackets) in liver, fat, muscle and eggs from the highest dose animals were 5.2 (4.3), 1.9 (1.3), 0.58 (0.41) and 0.88 (0.60) mg/kg respectively.
Animal commodity maximum residue levels
The current evaluation has not led to recommendations that would alter the dietary burdens calculated using the livestock intake figures employed by the 2005 JMPR. The glyphosate dietary burdens for cattle (dairy and beef) were based on grass, cotton seed and barley grain while those for poultry were based on barley, soya bean grain and soya bean hulls. The estimates for both the highest and mean residue levels for soya bean grain and hulls have not changed from those used by the 2005 JMPR though crops containing the GAT trait may contain some N-acetyl-glyphosate. However, calculations indicate the contribution to the dietary burden for estimation of maximum residue levels is less than 10% and as such do not warrant a re-evaluation of animal commodity maximum residues levels.
RECOMMENDATIONS
On the basis of the data obtained from supervised residue trials the Meeting concluded that the residue levels listed below are suitable for establishing maximum residue limits and for IEDI and IESTI assessment.
Definition of the residue for compliance with MRL (for plant commodities): for soya bean and maize: sum of glyphosate and N-acetyl-glyphosate, expressed as glyphosate
for other crops: glyphosate.
Definition of the residue for compliance with MRL (for animal commodities): sum of glyphosate and N-acetyl-glyphosate, expressed as glyphosate.
Definition of the residue for estimation of dietary intake (for plant and animal commodities): glyphosate, N-acetyl-glyphosate, AMPA and N-acetyl AMPA, expressed as glyphosate.
The residue is not fat soluble.
Table of recommendations
Commodity Recommended MRL (mg/kg)
STMR or STMR-P (mg/kg)
highest residue (mg/kg)
CCN Name New Previous VD 0533 Lentils (dry) 5 0.5 2.1 VR 0596 Sugar beet 15 3.4 7.3 AV 0596 Sugar beet tops 2.25 a 5.4 a AB 1201 Sugar beet pulp, wet 0.24 AB 0596 Sugar beet pulp, dry 2.1 VO 0447 Sweet corn (corn-on-the-cob) 3 0.325 2.8 Sweet corn forage 1.9 a 5.8 a
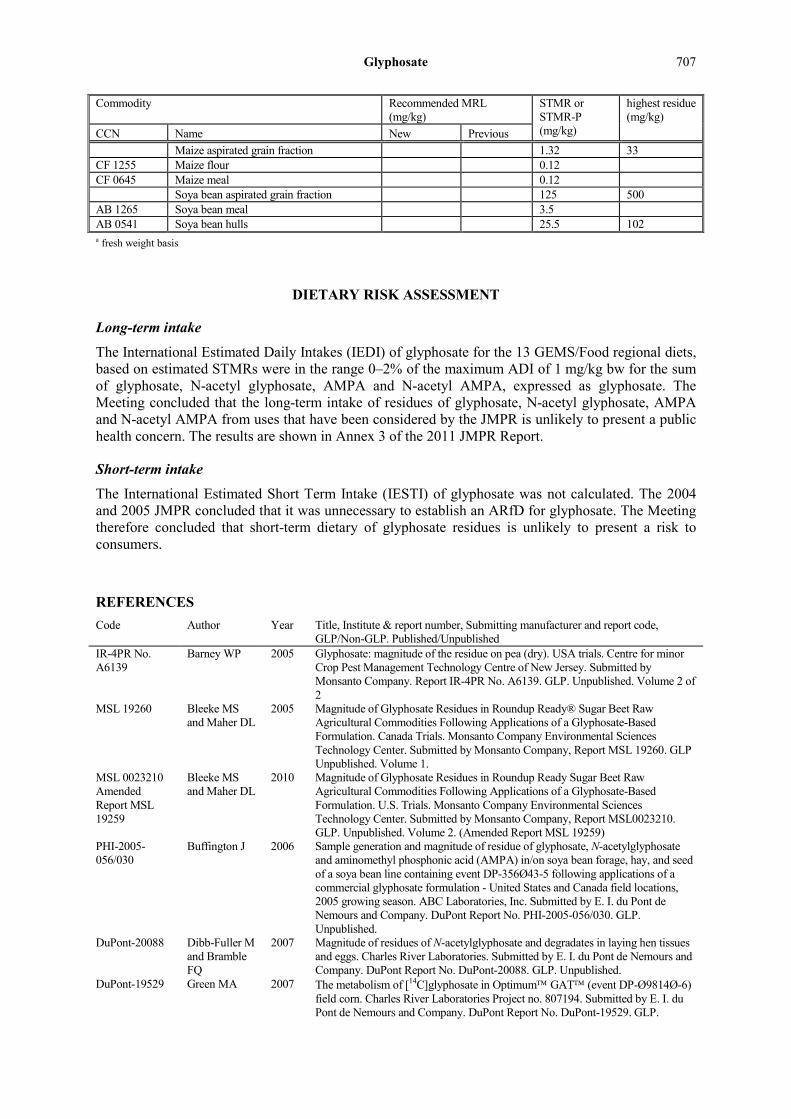
Glyphosate 707
Commodity Recommended MRL (mg/kg)
STMR or STMR-P (mg/kg)
highest residue (mg/kg)
CCN Name New Previous Maize aspirated grain fraction 1.32 33 CF 1255 Maize flour 0.12 CF 0645 Maize meal 0.12 Soya bean aspirated grain fraction 125 500 AB 1265 Soya bean meal 3.5 AB 0541 Soya bean hulls 25.5 102 a fresh weight basis
DIETARY RISK ASSESSMENT
Long-term intake
The International Estimated Daily Intakes (IEDI) of glyphosate for the 13 GEMS/Food regional diets, based on estimated STMRs were in the range 0–2% of the maximum ADI of 1 mg/kg bw for the sum of glyphosate, N-acetyl glyphosate, AMPA and N-acetyl AMPA, expressed as glyphosate. The Meeting concluded that the long-term intake of residues of glyphosate, N-acetyl glyphosate, AMPA and N-acetyl AMPA from uses that have been considered by the JMPR is unlikely to present a public health concern. The results are shown in Annex 3 of the 2011 JMPR Report.
Short-term intake
The International Estimated Short Term Intake (IESTI) of glyphosate was not calculated. The 2004 and 2005 JMPR concluded that it was unnecessary to establish an ARfD for glyphosate. The Meeting therefore concluded that short-term dietary of glyphosate residues is unlikely to present a risk to consumers.
REFERENCES Code Author Year Title, Institute & report number, Submitting manufacturer and report code,
GLP/Non-GLP. Published/Unpublished IR-4PR No. A6139
Barney WP 2005 Glyphosate: magnitude of the residue on pea (dry). USA trials. Centre for minor Crop Pest Management Technology Centre of New Jersey. Submitted by Monsanto Company. Report IR-4PR No. A6139. GLP. Unpublished. Volume 2 of 2
MSL 19260 Bleeke MS and Maher DL
2005 Magnitude of Glyphosate Residues in Roundup Ready® Sugar Beet Raw Agricultural Commodities Following Applications of a Glyphosate-Based Formulation. Canada Trials. Monsanto Company Environmental Sciences Technology Center. Submitted by Monsanto Company, Report MSL 19260. GLP Unpublished. Volume 1.
MSL 0023210 Amended Report MSL 19259
Bleeke MS and Maher DL
2010 Magnitude of Glyphosate Residues in Roundup Ready Sugar Beet Raw Agricultural Commodities Following Applications of a Glyphosate-Based Formulation. U.S. Trials. Monsanto Company Environmental Sciences Technology Center. Submitted by Monsanto Company, Report MSL0023210. GLP. Unpublished. Volume 2. (Amended Report MSL 19259)
PHI-2005-056/030
Buffington J 2006 Sample generation and magnitude of residue of glyphosate, N-acetylglyphosate and aminomethyl phosphonic acid (AMPA) in/on soya bean forage, hay, and seed of a soya bean line containing event DP-356Ø43-5 following applications of a commercial glyphosate formulation - United States and Canada field locations, 2005 growing season. ABC Laboratories, Inc. Submitted by E. I. du Pont de Nemours and Company. DuPont Report No. PHI-2005-056/030. GLP. Unpublished.
DuPont-20088 Dibb-Fuller M and Bramble FQ
2007 Magnitude of residues of N-acetylglyphosate and degradates in laying hen tissues and eggs. Charles River Laboratories. Submitted by E. I. du Pont de Nemours and Company. DuPont Report No. DuPont-20088. GLP. Unpublished.
DuPont-19529 Green MA 2007 The metabolism of [14C]glyphosate in Optimum GAT (event DP-Ø9814Ø-6) field corn. Charles River Laboratories Project no. 807194. Submitted by E. I. du Pont de Nemours and Company. DuPont Report No. DuPont-19529. GLP.
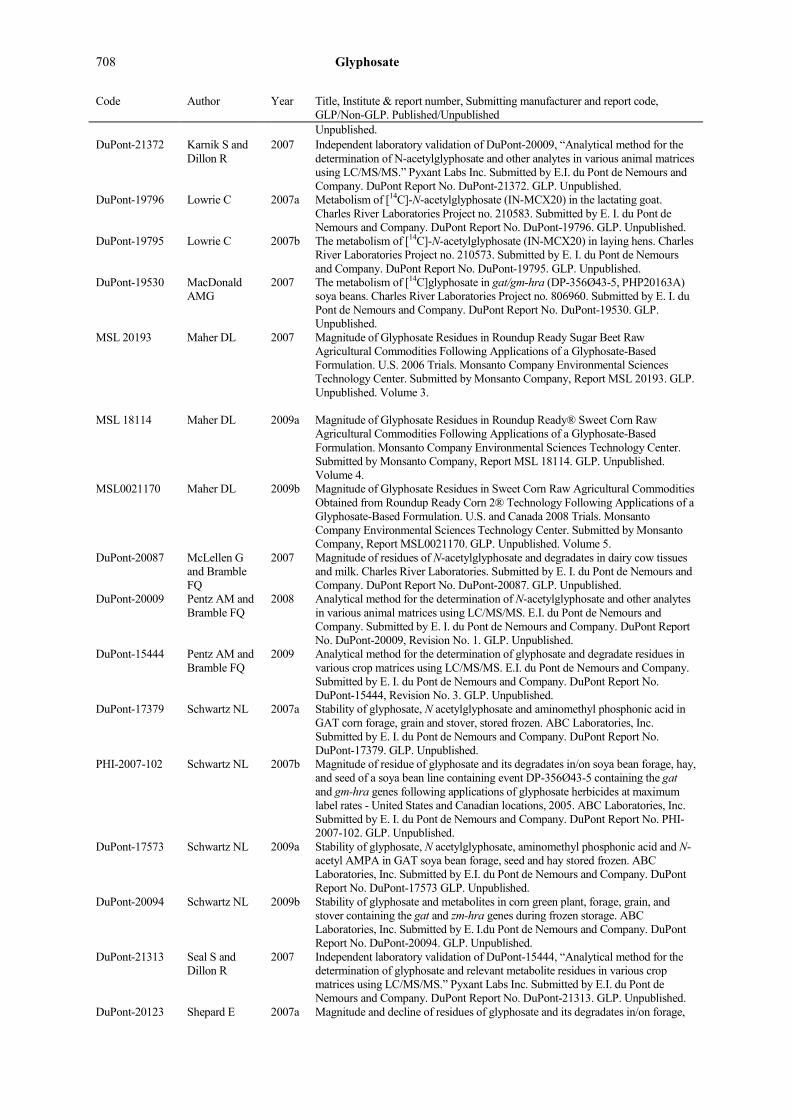
708 Glyphosate
Code Author Year Title, Institute & report number, Submitting manufacturer and report code, GLP/Non-GLP. Published/Unpublished Unpublished.
DuPont-21372 Karnik S and Dillon R
2007 Independent laboratory validation of DuPont-20009, “Analytical method for the determination of N-acetylglyphosate and other analytes in various animal matrices using LC/MS/MS.” Pyxant Labs Inc. Submitted by E.I. du Pont de Nemours and Company. DuPont Report No. DuPont-21372. GLP. Unpublished.
DuPont-19796 Lowrie C 2007a Metabolism of [14C]-N-acetylglyphosate (IN-MCX20) in the lactating goat. Charles River Laboratories Project no. 210583. Submitted by E. I. du Pont de Nemours and Company. DuPont Report No. DuPont-19796. GLP. Unpublished.
DuPont-19795 Lowrie C 2007b The metabolism of [14C]-N-acetylglyphosate (IN-MCX20) in laying hens. Charles River Laboratories Project no. 210573. Submitted by E. I. du Pont de Nemours and Company. DuPont Report No. DuPont-19795. GLP. Unpublished.
DuPont-19530 MacDonald AMG
2007 The metabolism of [14C]glyphosate in gat/gm-hra (DP-356Ø43-5, PHP20163A) soya beans. Charles River Laboratories Project no. 806960. Submitted by E. I. du Pont de Nemours and Company. DuPont Report No. DuPont-19530. GLP. Unpublished.
MSL 20193 Maher DL 2007 Magnitude of Glyphosate Residues in Roundup Ready Sugar Beet Raw Agricultural Commodities Following Applications of a Glyphosate-Based Formulation. U.S. 2006 Trials. Monsanto Company Environmental Sciences Technology Center. Submitted by Monsanto Company, Report MSL 20193. GLP. Unpublished. Volume 3.
MSL 18114 Maher DL 2009a Magnitude of Glyphosate Residues in Roundup Ready® Sweet Corn Raw Agricultural Commodities Following Applications of a Glyphosate-Based Formulation. Monsanto Company Environmental Sciences Technology Center. Submitted by Monsanto Company, Report MSL 18114. GLP. Unpublished. Volume 4.
MSL0021170 Maher DL 2009b Magnitude of Glyphosate Residues in Sweet Corn Raw Agricultural Commodities Obtained from Roundup Ready Corn 2® Technology Following Applications of a Glyphosate-Based Formulation. U.S. and Canada 2008 Trials. Monsanto Company Environmental Sciences Technology Center. Submitted by Monsanto Company, Report MSL0021170. GLP. Unpublished. Volume 5.
DuPont-20087 McLellen G and Bramble FQ
2007 Magnitude of residues of N-acetylglyphosate and degradates in dairy cow tissues and milk. Charles River Laboratories. Submitted by E. I. du Pont de Nemours and Company. DuPont Report No. DuPont-20087. GLP. Unpublished.
DuPont-20009 Pentz AM and Bramble FQ
2008 Analytical method for the determination of N-acetylglyphosate and other analytes in various animal matrices using LC/MS/MS. E.I. du Pont de Nemours and Company. Submitted by E. I. du Pont de Nemours and Company. DuPont Report No. DuPont-20009, Revision No. 1. GLP. Unpublished.
DuPont-15444 Pentz AM and Bramble FQ
2009 Analytical method for the determination of glyphosate and degradate residues in various crop matrices using LC/MS/MS. E.I. du Pont de Nemours and Company. Submitted by E. I. du Pont de Nemours and Company. DuPont Report No. DuPont-15444, Revision No. 3. GLP. Unpublished.
DuPont-17379 Schwartz NL 2007a Stability of glyphosate, N acetylglyphosate and aminomethyl phosphonic acid in GAT corn forage, grain and stover, stored frozen. ABC Laboratories, Inc. Submitted by E. I. du Pont de Nemours and Company. DuPont Report No. DuPont-17379. GLP. Unpublished.
PHI-2007-102 Schwartz NL 2007b Magnitude of residue of glyphosate and its degradates in/on soya bean forage, hay, and seed of a soya bean line containing event DP-356Ø43-5 containing the gat and gm-hra genes following applications of glyphosate herbicides at maximum label rates - United States and Canadian locations, 2005. ABC Laboratories, Inc. Submitted by E. I. du Pont de Nemours and Company. DuPont Report No. PHI-2007-102. GLP. Unpublished.
DuPont-17573 Schwartz NL 2009a Stability of glyphosate, N acetylglyphosate, aminomethyl phosphonic acid and N-acetyl AMPA in GAT soya bean forage, seed and hay stored frozen. ABC Laboratories, Inc. Submitted by E.I. du Pont de Nemours and Company. DuPont Report No. DuPont-17573 GLP. Unpublished.
DuPont-20094 Schwartz NL 2009b Stability of glyphosate and metabolites in corn green plant, forage, grain, and stover containing the gat and zm-hra genes during frozen storage. ABC Laboratories, Inc. Submitted by E. I.du Pont de Nemours and Company. DuPont Report No. DuPont-20094. GLP. Unpublished.
DuPont-21313 Seal S and Dillon R
2007 Independent laboratory validation of DuPont-15444, “Analytical method for the determination of glyphosate and relevant metabolite residues in various crop matrices using LC/MS/MS.” Pyxant Labs Inc. Submitted by E.I. du Pont de Nemours and Company. DuPont Report No. DuPont-21313. GLP. Unpublished.
DuPont-20123 Shepard E 2007a Magnitude and decline of residues of glyphosate and its degradates in/on forage,
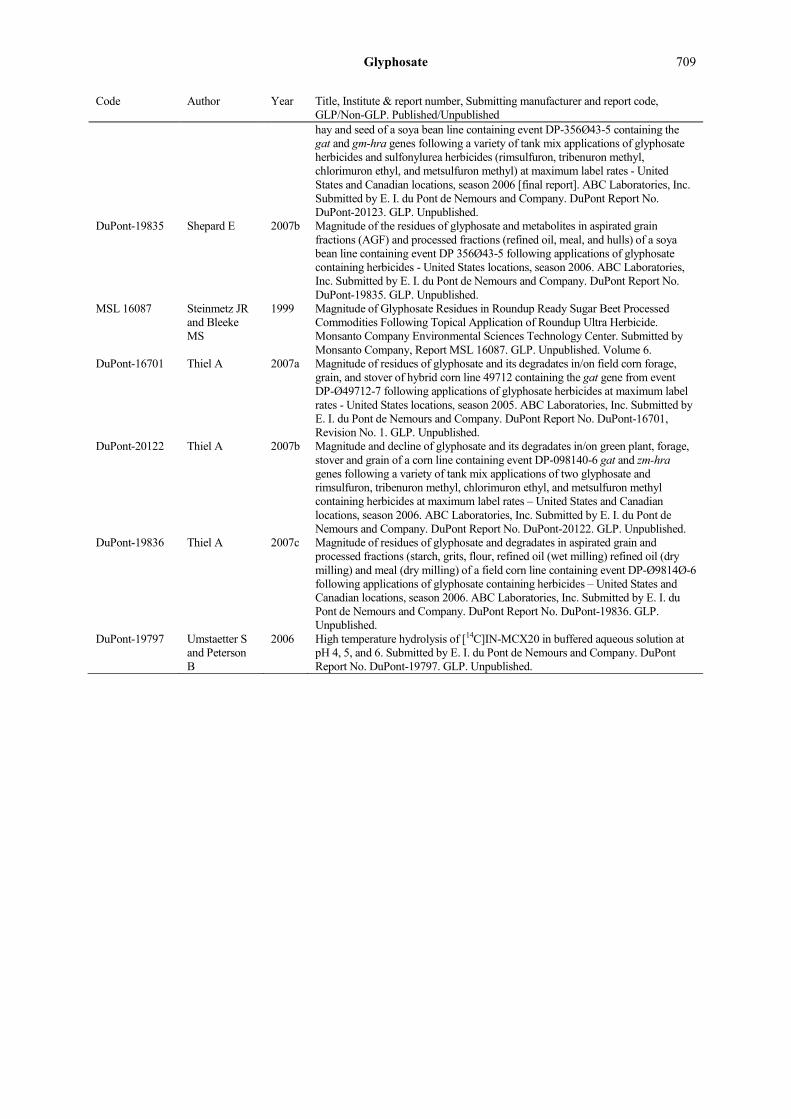
Glyphosate 709
Code Author Year Title, Institute & report number, Submitting manufacturer and report code, GLP/Non-GLP. Published/Unpublished hay and seed of a soya bean line containing event DP-356Ø43-5 containing the gat and gm-hra genes following a variety of tank mix applications of glyphosate herbicides and sulfonylurea herbicides (rimsulfuron, tribenuron methyl, chlorimuron ethyl, and metsulfuron methyl) at maximum label rates - United States and Canadian locations, season 2006 [final report]. ABC Laboratories, Inc. Submitted by E. I. du Pont de Nemours and Company. DuPont Report No. DuPont-20123. GLP. Unpublished.
DuPont-19835 Shepard E 2007b Magnitude of the residues of glyphosate and metabolites in aspirated grain fractions (AGF) and processed fractions (refined oil, meal, and hulls) of a soya bean line containing event DP 356Ø43-5 following applications of glyphosate containing herbicides - United States locations, season 2006. ABC Laboratories, Inc. Submitted by E. I. du Pont de Nemours and Company. DuPont Report No. DuPont-19835. GLP. Unpublished.
MSL 16087 Steinmetz JR and Bleeke MS
1999 Magnitude of Glyphosate Residues in Roundup Ready Sugar Beet Processed Commodities Following Topical Application of Roundup Ultra Herbicide. Monsanto Company Environmental Sciences Technology Center. Submitted by Monsanto Company, Report MSL 16087. GLP. Unpublished. Volume 6.
DuPont-16701 Thiel A 2007a Magnitude of residues of glyphosate and its degradates in/on field corn forage, grain, and stover of hybrid corn line 49712 containing the gat gene from event DP-Ø49712-7 following applications of glyphosate herbicides at maximum label rates - United States locations, season 2005. ABC Laboratories, Inc. Submitted by E. I. du Pont de Nemours and Company. DuPont Report No. DuPont-16701, Revision No. 1. GLP. Unpublished.
DuPont-20122 Thiel A 2007b Magnitude and decline of glyphosate and its degradates in/on green plant, forage, stover and grain of a corn line containing event DP-098140-6 gat and zm-hra genes following a variety of tank mix applications of two glyphosate and rimsulfuron, tribenuron methyl, chlorimuron ethyl, and metsulfuron methyl containing herbicides at maximum label rates – United States and Canadian locations, season 2006. ABC Laboratories, Inc. Submitted by E. I. du Pont de Nemours and Company. DuPont Report No. DuPont-20122. GLP. Unpublished.
DuPont-19836 Thiel A 2007c Magnitude of residues of glyphosate and degradates in aspirated grain and processed fractions (starch, grits, flour, refined oil (wet milling) refined oil (dry milling) and meal (dry milling) of a field corn line containing event DP-Ø9814Ø-6 following applications of glyphosate containing herbicides – United States and Canadian locations, season 2006. ABC Laboratories, Inc. Submitted by E. I. du Pont de Nemours and Company. DuPont Report No. DuPont-19836. GLP. Unpublished.
DuPont-19797 Umstaetter S and Peterson B
2006 High temperature hydrolysis of [14C]IN-MCX20 in buffered aqueous solution at pH 4, 5, and 6. Submitted by E. I. du Pont de Nemours and Company. DuPont Report No. DuPont-19797. GLP. Unpublished.