gm reports record full-year earnings per share€¦ · 2016 2015 cash and current marketable...
TRANSCRIPT

2016 FULL-YEAR AND FOURTH-QUARTER EARNINGS
EBIT-Adj. Margin EBIT-Adj. Adj. Auto FCF EPS Diluted-Adj.
Non-GAAP 7.5% $12.5 B $6.9 B $6.12Vs. 2015 +0.4 pts +15.9 % +$4.7 B +21.9 %
FULL-YEAR 2016 RESULTS OVERVIEW
GM Reports Record Full-Year Earnings Per Share• Strong full-year net income and records for revenue, EBIT-adjusted and EBIT-adjusted margin
• Fourth-quarter EPS-diluted of $1.19; EPS diluted-adjusted of $1.28
• Fourth-quarter net income of $1.8 billion and EBIT-adjusted of $2.4 billion
• Returned $4.8 billion to shareholders in 2016
2017 OUTLOOK: GM EXPECTS ANOTHER YEAR OF STRONG EARNINGS
Net Revenue Net IncomeAuto Operating
Cash FlowEPS-Diluted
GAAP $166.4 B $9.4 B $14.3 B $6.00Vs. 2015 +9.2 % (2.7) % +$4.3 B +1.5 %
• GM expects to deliver full-year 2017 EPS-diluted and diluted-adjusted of $6.00-$6.50; maintain or improve EBIT-adjusted and EBIT-adjusted margin; and generate higher revenues, compared to 2016. The company also expects to generate about $15 billion in automotive operating cash flow and about $6 billion in adjusted-automotive free cash flow. These measures do not consider potential future adjustments.
• GM expects its global volume from new or refreshed vehicles to grow to 38 percent from 2017-2020, up from 26 percent in the 2011-2016 period. New or refreshed crossovers, trucks and SUVs are expected to represent a majority of this volume between 2017-2020.
• The company raised its cost efficiency target for 2015-2018 to $6.5 billion, an increase of $1 billion.
“By almost any measure, 2016 was a great year for our business and I am confident we can achieve even stronger results. We’ll work to build on our momentum, while continuing to drive our company to innovate and shape the future of mobility.”
– Mary Barra, Chairman & CEO
2018 Chevrolet Equinox Premier

Net Revenue Net IncomeAuto Operating
Cash FlowEPS-Diluted
GAAP $43.9 B $1.8 B $4.3 B $1.19Vs. 2015 +10.8 % (70.7) % +2.1 B (69.6) %
EBIT-Adj. Margin EBIT-Adj. Adj. Auto FCF EPS Diluted-Adj.
Non-GAAP 5.4% $2.4 B $1.7 B $1.28Vs. 2015 (1.5) pts (13.7) % +$2.0 B (7.9) %
North America Europe International Ops South America GM Financial (EBT)
2016 2015 2016 2015 2016 2015 2016 2015 2016 2015
12.0 11.0 (0.3) (0.8) 1.1 1.4 (0.4) (0.6) 0.9 0.8
Q4 16 Q4 15 Q4 16 Q4 15 Q4 16 Q4 15 Q4 16 Q4 15 Q4 16 Q4 15
2.6 2.8 (0.2) (0.3) 0.3 0.4 (0.1) (0.0) 0.2 0.2
SEGMENT RESULTS (EBIT-ADJUSTED - $B)
Calendar-year (CY) records for EBIT-adj. of $12.0 billion and revenue of $119 billion. Achieved 10.1 percent EBIT-adj. margin for the year – the second consecutive year this margin has been 10 percent or greater.
Reduced losses in 2016 by $0.6 billion during the year. Without the negative $0.3-billion impact of Brexit, GM would have achieved its objective of breakeven for the year.
Q4 and CY results include strong China equity income of $0.5 billion and $2.0 billion, respectively.
Lower costs contributed to $0.2-billion year-over-year improvement during 2016.
In 2016, posted record revenues of $9.6 billion and record 2016 EBT-adj. of $0.9 billion. Earning assets grew 36 percent to about $77 billion, supporting expected future earnings growth.
“Solid results in the fourth quarter capped another record year of earnings and beat the commitments we outlined for 2016. We’ll stay focused on delivering results that will enable
us to return capital and create more shareholder value.”
– Chuck Stevens, Executive Vice President and CFO
Q4 RESULTS OVERVIEW
Fourth-quarter 2016 net income of $1.8 billion includes a net loss from special items of $0.1 billion, and an unfavorable $0.3 billion foreign exchange impact, compared to the prior year. Fourth-quarter 2015 net income of $6.3 billion included a net gain from special items
of $4.0 billion, primarily related to the reversal of deferred tax asset valuation allowances in Europe.
Fourth-quarter 2016 EBIT-adjusted of $2.4 billion includes an unfavorable $0.5 billion foreign exchange impact, compared to the prior year.
FOURTH-QUARTER RESULTS
2016 2015
Cash and Current Marketable Securities 21.6 20.3
Total Auto Liquidity 35.6 32.5
LIQUIDITY ($B)
GM’s 2016 year-end global underfunded position was $18.3 billion, down from $21.2 billion at the end of 2015. The year-end global pension obligation of $92.9 billion was about 80-percent funded. The company’s 2016 year-end U.S. defined-benefit pension plan underfunded position was $7.2 billion, down from $10.4 billion at the end of 2015. The year-end U.S. defined-benefit pension plan obligation of $68.8 billion was about 90-percent funded. Based on current assumptions, GM doesn’t expect to make significant, mandatory contributions to its U.S. qualified pension plans for the next five years.
PENSION UPDATE
Returned $4.8 billion to shareholders in 2016 through share buybacks of $2.5 billion and dividends of $2.3 billion. Since 2012, GM has returned more than $18 billion, which represents more than 90 percent of available free cash flow to shareholders during the 2012-2016 period.
CAPITAL RETURN
For the year ended Dec. 31, 2016, GM sold a record 10 million vehicles around the world, up 1.2 percent from 2015. In Q4, GM sold 2.78 million vehicles, up 3.3 percent compared to Q4 2015. December 2016 global volume of 1.05 million units was the highest in the company’s history, capping the fourth consecutive record year for global deliveries.
For the full year, GM sold 3.04 million vehicles in the U.S. and increased retail share 0.5 percentage points – more than any full-line automaker. In China, deliveries increased 7.1 percent to a record 3.87 million vehicles. In Europe, Opel/Vauxhall posted a 4.0-percent sales increase.
For more details on GM’s global sales, click here.
GLOBAL VEHICLE SALES
Led by strong gains in midsize pickups, small crossovers and large SUVs, Chevrolet was the fastest-growing U.S. brand in 2016, gaining 0.5 percentage points of U.S. retail market share.
Cadillac volume in China rose 46 percent to 116,406 – the first time it has eclipsed 100,000 in China during a single year – driving global brand sales up 11 percent to a 30-year high.
In 2016, Opel/Vauxhall improved market share in 18 of 22 European markets, including Germany, led by the European Car of the Year, Opel Astra, which was up more than 25 percent versus 2015.
Crossover momentum: Chevrolet Trax and Buick Encore combined retail sales in the U.S. increased 28 percent in 2016. In 2017, GM plans to launch the all-new Chevrolet Equinox and Traverse, and GMC Terrain.
PRODUCT HIGHLIGHTS
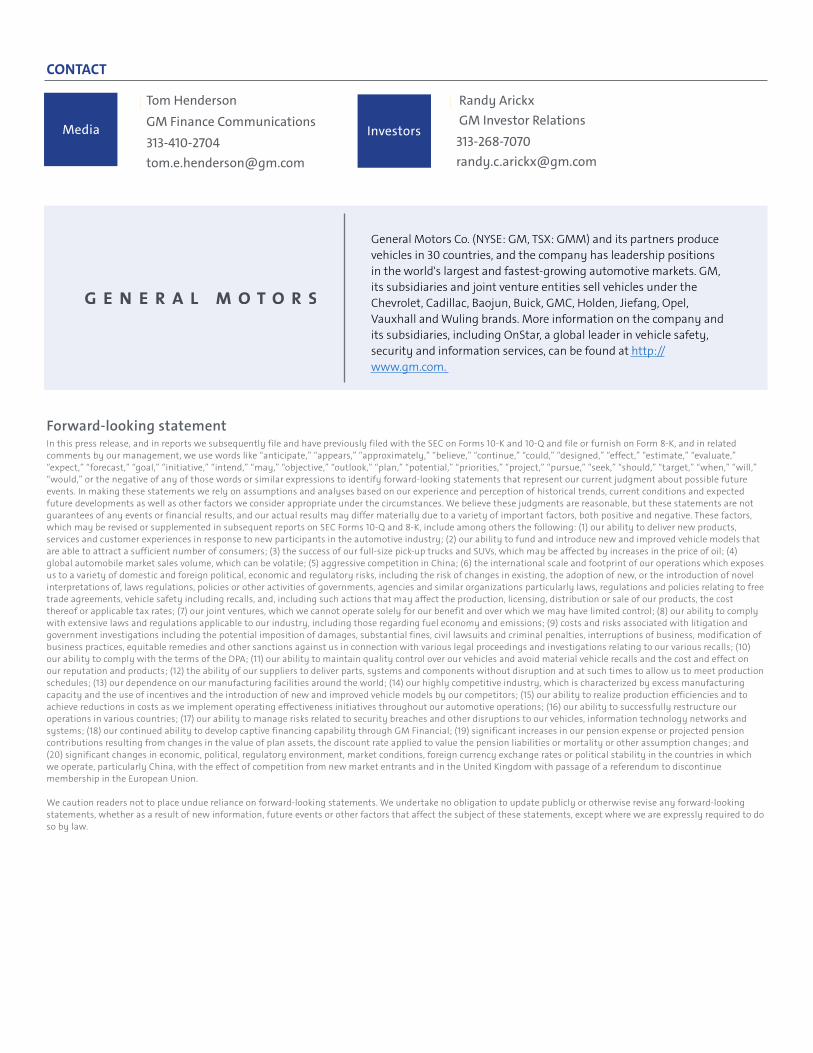
2018 GMC Terrain SLT (left) and Denali (right)
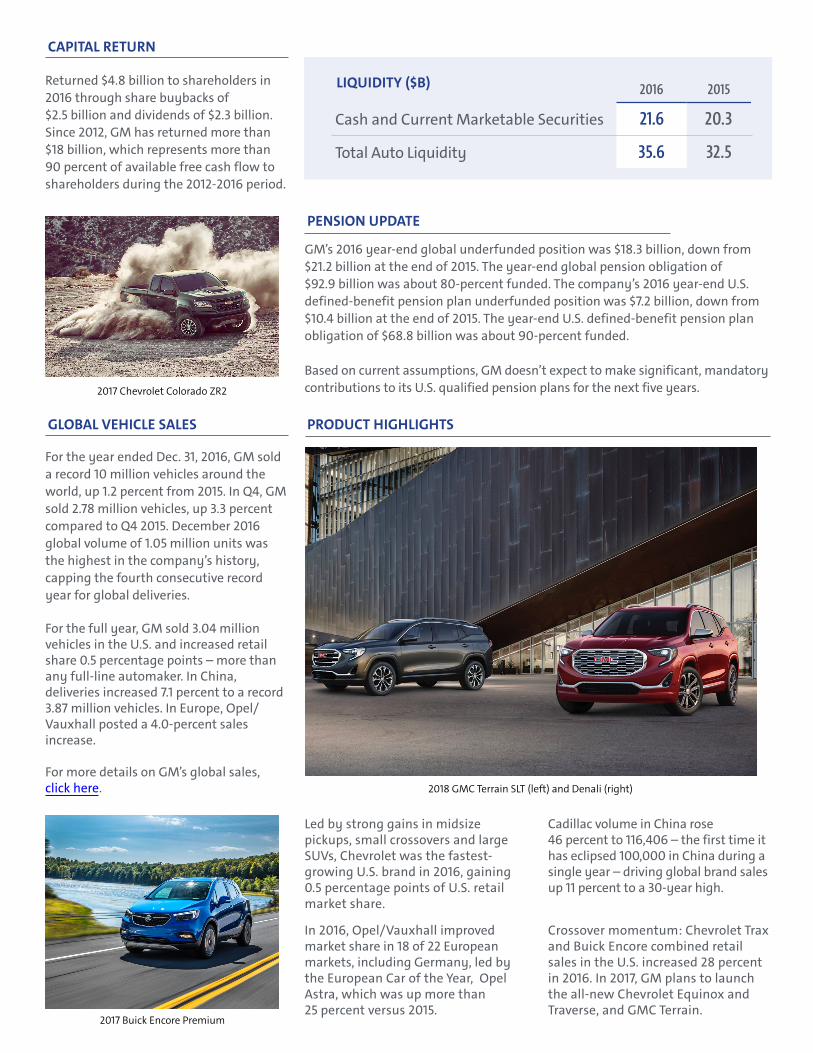
2017 Chevrolet Colorado ZR2
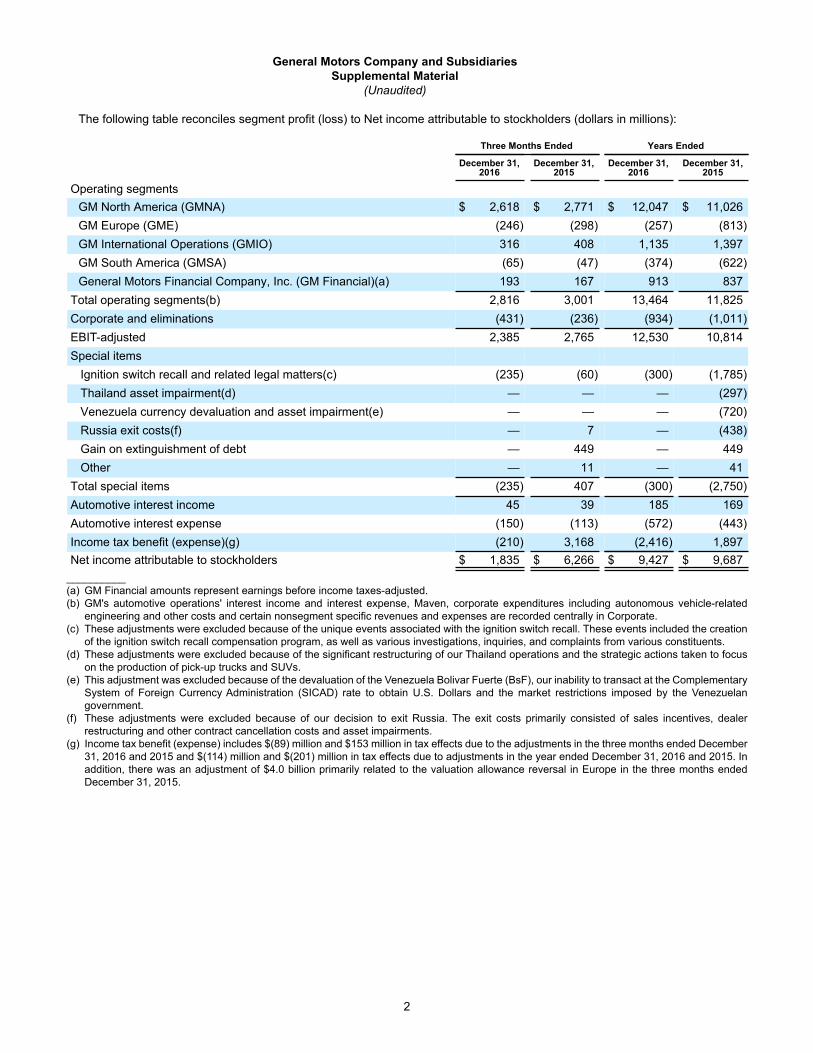
2017 Buick Encore Premium
Forward-looking statement In this press release, and in reports we subsequently file and have previously filed with the SEC on Forms 10-K and 10-Q and file or furnish on Form 8-K, and in related comments by our management, we use words like “anticipate,” “appears,” “approximately,” “believe,” “continue,” “could,” “designed,” “effect,” “estimate,” “evaluate,” “expect,” “forecast,” “goal,” “initiative,” “intend,” “may,” “objective,” “outlook,” “plan,” “potential,” “priorities,” “project,” “pursue,” “seek,” “should,” “target,” “when,” “will,” “would,” or the negative of any of those words or similar expressions to identify forward-looking statements that represent our current judgment about possible future events. In making these statements we rely on assumptions and analyses based on our experience and perception of historical trends, current conditions and expected future developments as well as other factors we consider appropriate under the circumstances. We believe these judgments are reasonable, but these statements are not guarantees of any events or financial results, and our actual results may differ materially due to a variety of important factors, both positive and negative. These factors, which may be revised or supplemented in subsequent reports on SEC Forms 10-Q and 8-K, include among others the following: (1) our ability to deliver new products, services and customer experiences in response to new participants in the automotive industry; (2) our ability to fund and introduce new and improved vehicle models that are able to attract a sufficient number of consumers; (3) the success of our full-size pick-up trucks and SUVs, which may be affected by increases in the price of oil; (4) global automobile market sales volume, which can be volatile; (5) aggressive competition in China; (6) the international scale and footprint of our operations which exposes us to a variety of domestic and foreign political, economic and regulatory risks, including the risk of changes in existing, the adoption of new, or the introduction of novel interpretations of, laws regulations, policies or other activities of governments, agencies and similar organizations particularly laws, regulations and policies relating to free trade agreements, vehicle safety including recalls, and, including such actions that may affect the production, licensing, distribution or sale of our products, the cost thereof or applicable tax rates; (7) our joint ventures, which we cannot operate solely for our benefit and over which we may have limited control; (8) our ability to comply with extensive laws and regulations applicable to our industry, including those regarding fuel economy and emissions; (9) costs and risks associated with litigation and government investigations including the potential imposition of damages, substantial fines, civil lawsuits and criminal penalties, interruptions of business, modification of business practices, equitable remedies and other sanctions against us in connection with various legal proceedings and investigations relating to our various recalls; (10) our ability to comply with the terms of the DPA; (11) our ability to maintain quality control over our vehicles and avoid material vehicle recalls and the cost and effect on our reputation and products; (12) the ability of our suppliers to deliver parts, systems and components without disruption and at such times to allow us to meet production schedules; (13) our dependence on our manufacturing facilities around the world; (14) our highly competitive industry, which is characterized by excess manufacturing capacity and the use of incentives and the introduction of new and improved vehicle models by our competitors; (15) our ability to realize production efficiencies and to achieve reductions in costs as we implement operating effectiveness initiatives throughout our automotive operations; (16) our ability to successfully restructure our operations in various countries; (17) our ability to manage risks related to security breaches and other disruptions to our vehicles, information technology networks and systems; (18) our continued ability to develop captive financing capability through GM Financial; (19) significant increases in our pension expense or projected pension contributions resulting from changes in the value of plan assets, the discount rate applied to value the pension liabilities or mortality or other assumption changes; and (20) significant changes in economic, political, regulatory environment, market conditions, foreign currency exchange rates or political stability in the countries in which we operate, particularly China, with the effect of competition from new market entrants and in the United Kingdom with passage of a referendum to discontinue membership in the European Union.
We caution readers not to place undue reliance on forward-looking statements. We undertake no obligation to update publicly or otherwise revise any forward-looking statements, whether as a result of new information, future events or other factors that affect the subject of these statements, except where we are expressly required to do so by law.
General Motors Co. (NYSE: GM, TSX: GMM) and its partners produce vehicles in 30 countries, and the company has leadership positions in the world's largest and fastest-growing automotive markets. GM, its subsidiaries and joint venture entities sell vehicles under the Chevrolet, Cadillac, Baojun, Buick, GMC, Holden, Jiefang, Opel, Vauxhall and Wuling brands. More information on the company and its subsidiaries, including OnStar, a global leader in vehicle safety, security and information services, can be found at http://www.gm.com.
Tom Henderson GM Finance Communications 313-410-2704 [email protected]
Randy Arickx GM Investor Relations 313-268-7070 [email protected]
Media Investors
CONTACT

1
Exhibit 99.2
Exhibit 1General Motors Company and Subsidiaries
Supplemental Material(Unaudited)
General Motors Company's (GM) non-GAAP measures include earnings before interest and taxes adjusted for special items, presented net of noncontrolling interests (EBIT-adjusted), earnings per share (EPS)-diluted-adjusted, return on invested capital-adjusted (ROIC-adjusted) and adjusted automotive free cash flow. GM's calculation of these non-GAAP measures may not be comparable to similarly titled measures of other companies due to potential differences between companies in the method of calculation. As a result, the use of these non-GAAP measures has limitations and should not be considered superior to, in isolation from, or as a substitute for, related U.S. GAAP measures. These non-GAAP measures have not been audited or reviewed by GM's independent auditors.
These non-GAAP measures allow management and investors to view operating trends, perform analytical comparisons and benchmark performance between periods and among geographic regions to understand operating performance without regard to items we do not consider a component of our core operating performance. Furthermore, these non-GAAP measures allow investors the opportunity to measure and monitor our performance against our externally communicated targets and evaluate the investment decisions being made by management to improve ROIC-adjusted. Management uses these measures in its financial, investment and operational decision-making processes, for internal reporting and as part of its forecasting and budgeting processes. Further, our Board of Directors uses these and other measures as key metrics to determine management performance under our performance-based compensation plans. For these reasons we believe these non-GAAP measures are useful for our investors.
EBIT-adjusted is used by management and can be used by investors to review GM's consolidated operating results because it excludes automotive interest income, automotive interest expense and income taxes as well as certain additional adjustments that are not considered part of our core operations. Examples of adjustments to EBIT include but are not limited to impairment charges related to goodwill, impairment charges on long-lived assets and other exit costs resulting from strategic shifts in our operations or discrete market and business conditions; costs arising from the ignition switch recall and related legal matters; and certain currency devaluations associated with hyperinflationary economies. For EBIT-adjusted and our other non-GAAP measures, once we have made an adjustment in the current period for an item, we will also adjust the related non-GAAP measure in any future periods in which there is an impact from the item.
EPS-diluted-adjusted is used by management and can be used by investors to review GM's consolidated diluted earnings per share results on a consistent basis. EPS-diluted-adjusted is calculated as net income attributable to common stockholders-diluted less certain adjustments noted above for EBIT-adjusted and gains or losses on the extinguishment of debt obligations on an after-tax basis as well as redemptions of preferred stock and certain income tax adjustments divided by weighted-average common shares outstanding-diluted. Examples of income tax adjustments include the establishment or reversal of significant deferred tax asset valuation allowances.
ROIC-adjusted is used by management and can be used by investors to review GM's investment and capital allocation decisions. GM defines ROIC-adjusted as EBIT-adjusted for the trailing four quarters divided by average net assets, which is considered to be the average equity balances adjusted for average automotive debt and interest liabilities, exclusive of capital leases; average automotive net pension and other postretirement benefits (OPEB) liabilities; and average automotive net income tax assets during the same period.
Adjusted automotive free cash flow is used by management and can be used by investors to review the liquidity of GM's automotive operations and to measure and monitor our performance against our capital allocation program and evaluate our automotive liquidity against the substantial cash requirements of our automotive operations. GM measures adjusted automotive free cash flow as automotive cash flow from operations less capital expenditures adjusted for management actions, primarily related to strengthening its balance sheet, such as prepayments of debt and discretionary contributions to employee benefit plans.
2
General Motors Company and SubsidiariesSupplemental Material
(Unaudited)
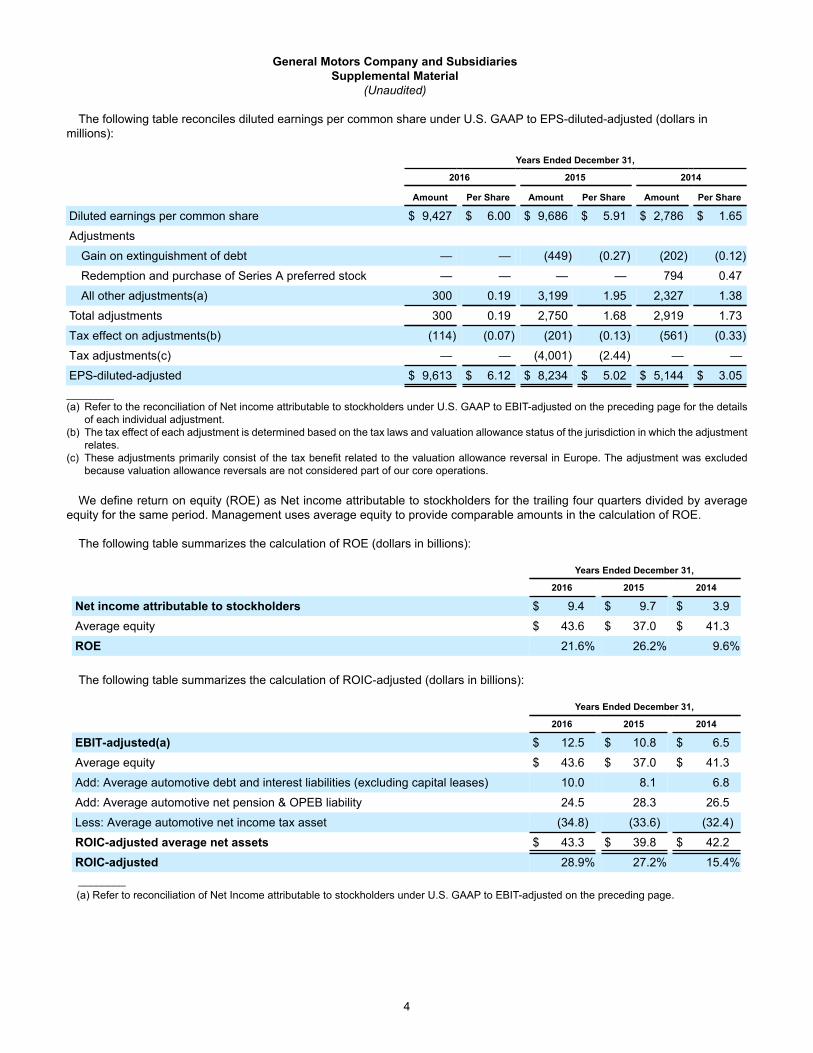
The following table reconciles segment profit (loss) to Net income attributable to stockholders (dollars in millions):
Three Months Ended Years Ended
December 31,2016
December 31,2015
December 31,2016
December 31,2015
Operating segmentsGM North America (GMNA) $ 2,618 $ 2,771 $ 12,047 $ 11,026GM Europe (GME) (246) (298) (257) (813)GM International Operations (GMIO) 316 408 1,135 1,397GM South America (GMSA) (65) (47) (374) (622)General Motors Financial Company, Inc. (GM Financial)(a) 193 167 913 837
Total operating segments(b) 2,816 3,001 13,464 11,825Corporate and eliminations (431) (236) (934) (1,011)EBIT-adjusted 2,385 2,765 12,530 10,814Special items Ignition switch recall and related legal matters(c) (235) (60) (300) (1,785) Thailand asset impairment(d) — — — (297) Venezuela currency devaluation and asset impairment(e) — — — (720) Russia exit costs(f) — 7 — (438) Gain on extinguishment of debt — 449 — 449 Other — 11 — 41Total special items (235) 407 (300) (2,750)Automotive interest income 45 39 185 169Automotive interest expense (150) (113) (572) (443)Income tax benefit (expense)(g) (210) 3,168 (2,416) 1,897Net income attributable to stockholders $ 1,835 $ 6,266 $ 9,427 $ 9,687
__________(a) GM Financial amounts represent earnings before income taxes-adjusted.(b) GM's automotive operations' interest income and interest expense, Maven, corporate expenditures including autonomous vehicle-related
engineering and other costs and certain nonsegment specific revenues and expenses are recorded centrally in Corporate.(c) These adjustments were excluded because of the unique events associated with the ignition switch recall. These events included the creation
of the ignition switch recall compensation program, as well as various investigations, inquiries, and complaints from various constituents.(d) These adjustments were excluded because of the significant restructuring of our Thailand operations and the strategic actions taken to focus
on the production of pick-up trucks and SUVs.(e) This adjustment was excluded because of the devaluation of the Venezuela Bolivar Fuerte (BsF), our inability to transact at the Complementary
System of Foreign Currency Administration (SICAD) rate to obtain U.S. Dollars and the market restrictions imposed by the Venezuelan government.
(f) These adjustments were excluded because of our decision to exit Russia. The exit costs primarily consisted of sales incentives, dealer restructuring and other contract cancellation costs and asset impairments.
(g) Income tax benefit (expense) includes $(89) million and $153 million in tax effects due to the adjustments in the three months ended December 31, 2016 and 2015 and $(114) million and $(201) million in tax effects due to adjustments in the year ended December 31, 2016 and 2015. In addition, there was an adjustment of $4.0 billion primarily related to the valuation allowance reversal in Europe in the three months ended December 31, 2015.

3
General Motors Company and SubsidiariesSupplemental Material
(Unaudited)
The following table reconciles Net income attributable to stockholders under U.S. GAAP to EBIT-adjusted used in the calculation of ROIC-adjusted (dollars in millions):
Years Ended December 31,
2016 2015 2014
Net income attributable to stockholders $ 9,427 $ 9,687 $ 3,949
Income tax expense (benefit) 2,416 (1,897) 228
Gain on extinguishment of debt — (449) (202)
Automotive interest expense 572 443 403
Automotive interest income (185) (169) (211)
Adjustments
Ignition switch recall and related legal matters(a) 300 1,785 400
Recall campaign catch-up adjustment(b) — — 874
Thailand asset impairments(c) — 297 158
Venezuela currency devaluation and asset impairment(d) — 720 419
Russia exit costs and asset impairment(e) — 438 245
Goodwill impairment — — 120
Other — (41) 111
Total adjustments 300 3,199 2,327
EBIT-adjusted $ 12,530 $ 10,814 $ 6,494________(a) These adjustments were excluded because of the unique events associated with the ignition switch recall. These events included the creation
of the ignition switch recall compensation program, as well as various investigations, inquiries, and complaints from various constituents.(b) This adjustment was excluded because it resulted from our decision to change the method we use to estimate costs associated with recall
campaigns in GMNA. (c) These adjustments were excluded because of the significant restructuring of our Thailand operations and the strategic actions taken to focus
on the production of pick-up trucks and SUVs.(d) This adjustment was excluded because of the devaluation of the BsF, our inability to transact at the SICAD rate to obtain U.S. Dollars and the
market restrictions imposed by the Venezuelan government.(e) These adjustments were excluded because they were driven by deteriorating market conditions in Russia, which led to asset impairments in
2014 and our decision to exit the Russia market in 2015. The Russia exit costs primarily consisted of sales incentives, dealer restructuring and other contract cancellation costs, and asset impairments.
4
General Motors Company and SubsidiariesSupplemental Material
(Unaudited)
The following table reconciles diluted earnings per common share under U.S. GAAP to EPS-diluted-adjusted (dollars in millions):
Years Ended December 31,
2016 2015 2014
Amount Per Share Amount Per Share Amount Per Share
Diluted earnings per common share $ 9,427 $ 6.00 $ 9,686 $ 5.91 $ 2,786 $ 1.65
Adjustments
Gain on extinguishment of debt — — (449) (0.27) (202) (0.12)
Redemption and purchase of Series A preferred stock — — — — 794 0.47
All other adjustments(a) 300 0.19 3,199 1.95 2,327 1.38
Total adjustments 300 0.19 2,750 1.68 2,919 1.73
Tax effect on adjustments(b) (114) (0.07) (201) (0.13) (561) (0.33)
Tax adjustments(c) — — (4,001) (2.44) — —
EPS-diluted-adjusted $ 9,613 $ 6.12 $ 8,234 $ 5.02 $ 5,144 $ 3.05________(a) Refer to the reconciliation of Net income attributable to stockholders under U.S. GAAP to EBIT-adjusted on the preceding page for the details
of each individual adjustment.(b) The tax effect of each adjustment is determined based on the tax laws and valuation allowance status of the jurisdiction in which the adjustment
relates.(c) These adjustments primarily consist of the tax benefit related to the valuation allowance reversal in Europe. The adjustment was excluded
because valuation allowance reversals are not considered part of our core operations.
We define return on equity (ROE) as Net income attributable to stockholders for the trailing four quarters divided by average equity for the same period. Management uses average equity to provide comparable amounts in the calculation of ROE.
The following table summarizes the calculation of ROE (dollars in billions):
Years Ended December 31,
2016 2015 2014
Net income attributable to stockholders $ 9.4 $ 9.7 $ 3.9
Average equity $ 43.6 $ 37.0 $ 41.3
ROE 21.6% 26.2% 9.6%
The following table summarizes the calculation of ROIC-adjusted (dollars in billions):
Years Ended December 31,
2016 2015 2014
EBIT-adjusted(a) $ 12.5 $ 10.8 $ 6.5
Average equity $ 43.6 $ 37.0 $ 41.3
Add: Average automotive debt and interest liabilities (excluding capital leases) 10.0 8.1 6.8
Add: Average automotive net pension & OPEB liability 24.5 28.3 26.5
Less: Average automotive net income tax asset (34.8) (33.6) (32.4)
ROIC-adjusted average net assets $ 43.3 $ 39.8 $ 42.2
ROIC-adjusted 28.9% 27.2% 15.4% ________ (a) Refer to reconciliation of Net Income attributable to stockholders under U.S. GAAP to EBIT-adjusted on the preceding page.

5
General Motors Company and SubsidiariesSupplemental Material
(Unaudited)
The following table reconciles Net automotive cash provided by operating activities under U.S. GAAP to adjusted automotive free cash flow (dollars in millions):
Three Months Ended Years EndedDecember 31,
2016December 31,
2015December 31,
2016December 31,
2015
Net automotive cash provided by operating activities $ 4,300 $ 2,235 $ 14,321 $ 9,979Capital expenditures (2,600) (2,524) (9,435) (7,784)Adjustment – discretionary pension plan contributions — — 1,982 —
Adjusted automotive free cash flow $ 1,700 $ (289) $ 6,868 $ 2,195
For the year ending December 31, 2017 GM expects to continue to generate strong consolidated financial results including improved net sales and revenue, EBIT-adjusted and EBIT-adjusted margins that equal or exceed the corresponding amounts in 2016, ROIC-adjusted of greater than 25%, Automotive operating cash flow of approximately $15 billion, adjusted automotive free cash flow of approximately $6 billion and EPS-diluted and EPS-diluted-adjusted of between $6.00 and $6.50. GM does not consider the potential future impact of adjustments on the expected financial results. The company expects these financial results in part to be driven by favorable shifts in mix for our new or refreshed product launches, including crossovers.
The following table reconciles expected automotive net cash provided by operating activities under U.S. GAAP to expected adjusted automotive free cash flow (dollars in billions):
Year Ending December 31, 2017
Automotive net cash provided by operating activities $ 15
Less: expected capital expenditures (9)
Adjusted automotive free cash flow $ 6
6
General Motors Company and SubsidiariesSupplemental Material
(Unaudited)
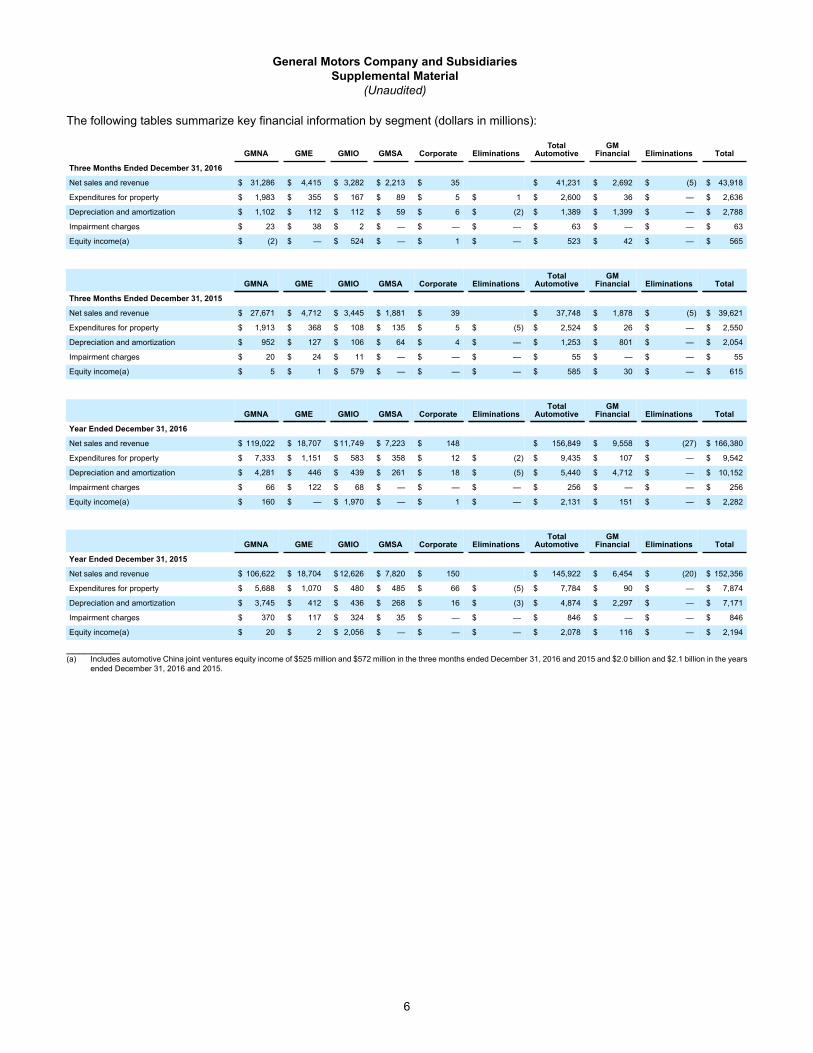
The following tables summarize key financial information by segment (dollars in millions):
GMNA GME GMIO GMSA Corporate EliminationsTotal
AutomotiveGM
Financial Eliminations Total
Three Months Ended December 31, 2016
Net sales and revenue $ 31,286 $ 4,415 $ 3,282 $ 2,213 $ 35 $ 41,231 $ 2,692 $ (5) $ 43,918
Expenditures for property $ 1,983 $ 355 $ 167 $ 89 $ 5 $ 1 $ 2,600 $ 36 $ — $ 2,636
Depreciation and amortization $ 1,102 $ 112 $ 112 $ 59 $ 6 $ (2) $ 1,389 $ 1,399 $ — $ 2,788
Impairment charges $ 23 $ 38 $ 2 $ — $ — $ — $ 63 $ — $ — $ 63
Equity income(a) $ (2) $ — $ 524 $ — $ 1 $ — $ 523 $ 42 $ — $ 565
GMNA GME GMIO GMSA Corporate EliminationsTotal
AutomotiveGM
Financial Eliminations Total
Three Months Ended December 31, 2015
Net sales and revenue $ 27,671 $ 4,712 $ 3,445 $ 1,881 $ 39 $ 37,748 $ 1,878 $ (5) $ 39,621
Expenditures for property $ 1,913 $ 368 $ 108 $ 135 $ 5 $ (5) $ 2,524 $ 26 $ — $ 2,550
Depreciation and amortization $ 952 $ 127 $ 106 $ 64 $ 4 $ — $ 1,253 $ 801 $ — $ 2,054
Impairment charges $ 20 $ 24 $ 11 $ — $ — $ — $ 55 $ — $ — $ 55
Equity income(a) $ 5 $ 1 $ 579 $ — $ — $ — $ 585 $ 30 $ — $ 615
GMNA GME GMIO GMSA Corporate EliminationsTotal
AutomotiveGM
Financial Eliminations Total
Year Ended December 31, 2016
Net sales and revenue $ 119,022 $ 18,707 $ 11,749 $ 7,223 $ 148 $ 156,849 $ 9,558 $ (27) $ 166,380
Expenditures for property $ 7,333 $ 1,151 $ 583 $ 358 $ 12 $ (2) $ 9,435 $ 107 $ — $ 9,542
Depreciation and amortization $ 4,281 $ 446 $ 439 $ 261 $ 18 $ (5) $ 5,440 $ 4,712 $ — $ 10,152
Impairment charges $ 66 $ 122 $ 68 $ — $ — $ — $ 256 $ — $ — $ 256
Equity income(a) $ 160 $ — $ 1,970 $ — $ 1 $ — $ 2,131 $ 151 $ — $ 2,282
GMNA GME GMIO GMSA Corporate EliminationsTotal
AutomotiveGM
Financial Eliminations Total
Year Ended December 31, 2015
Net sales and revenue $ 106,622 $ 18,704 $ 12,626 $ 7,820 $ 150 $ 145,922 $ 6,454 $ (20) $ 152,356
Expenditures for property $ 5,688 $ 1,070 $ 480 $ 485 $ 66 $ (5) $ 7,784 $ 90 $ — $ 7,874
Depreciation and amortization $ 3,745 $ 412 $ 436 $ 268 $ 16 $ (3) $ 4,874 $ 2,297 $ — $ 7,171
Impairment charges $ 370 $ 117 $ 324 $ 35 $ — $ — $ 846 $ — $ — $ 846
Equity income(a) $ 20 $ 2 $ 2,056 $ — $ — $ — $ 2,078 $ 116 $ — $ 2,194
_________(a) Includes automotive China joint ventures equity income of $525 million and $572 million in the three months ended December 31, 2016 and 2015 and $2.0 billion and $2.1 billion in the years
ended December 31, 2016 and 2015.

7
General Motors Company and SubsidiariesSupplemental Material
(Unaudited)
Vehicle Sales
GM presents both wholesale and retail vehicle sales data to assist in the analysis of its revenue and market share. GM does not currently export vehicles to Cuba, Iran, North Korea, Sudan or Syria. Accordingly, these countries are excluded from industry sales data and corresponding calculations of GM's market share.
Wholesale vehicle sales data, which represents sales directly to dealers and others, including sales to fleet customers, is the measure that correlates to GM's revenue from the sale of vehicles, which is the largest component of Automotive net sales and revenue. Wholesale vehicle sales exclude vehicles sold by joint ventures. In the year ended December 31, 2016 46.3% of GM's wholesale vehicle sales volume was generated outside the U.S. The following table summarizes total wholesale vehicle sales of new vehicles by automotive segment (vehicles in thousands):
Three Months Ended Years EndedDecember 31, 2016 December 31, 2015 December 31, 2016 December 31, 2015
GMNA 1,050 913 3,958 3,558GME 282 280 1,162 1,127GMIO 153 157 559 588GMSA 168 168 568 603Worldwide 1,653 1,518 6,247 5,876

8
General Motors Company and SubsidiariesSupplemental Material
(Unaudited)
Retail vehicle sales data, which represents sales to end customers based upon the good faith estimates of management, including sales to fleet customers, does not correlate directly to the revenue GM recognizes during the period. However, retail vehicle sales data is indicative of the underlying demand for GM vehicles. Market share information is based primarily on retail vehicle sales volume. In countries where retail vehicle sales data is not readily available, other data sources such as wholesale or forecast volumes are used to estimate retail vehicle sales to end customers.
Retail vehicle sales data includes all sales by joint ventures on a total vehicle basis, not based on the percentage of ownership in the joint venture. Certain joint venture agreements in China allow for the contractual right to report vehicle sales on non-GM trademarked vehicles by those joint ventures. Retail vehicle sales data includes vehicles used by dealers under courtesy transportation programs and vehicles sold through the dealer registration channel primarily in Europe. This sales channel consists primarily of dealer demonstrator, loaner and self-registered vehicles which are not eligible to be sold as new vehicles after being registered by dealers. Certain fleet sales that are accounted for as operating leases are included in retail vehicle sales at the time of delivery to daily rental car companies. The following table summarizes total retail sales volume, or estimated sales volume where retail sales volume is not available, by geographic region (vehicles in thousands):
Three Months Ended Years EndedDecember 31, 2016 December 31, 2015 December 31, 2016 December 31, 2015
United StatesChevrolet - Cars 188 177 736 767Chevrolet - Trucks 251 239 915 888Chevrolet - Crossovers 125 113 445 471Cadillac 51 50 170 175Buick 60 55 230 223GMC 155 149 547 558Total United States 830 783 3,043 3,082
Canada, Mexico and Other 171 144 587 531Total North America 1,001 927 3,630 3,613
EuropeOpel/Vauxhall 264 262 1,159 1,113Chevrolet(a) 12 13 48 63Total Europe 276 275 1,207 1,176
Asia/Pacific, Middle East and Africa(b)Chevrolet 319 326 987 1,174Wuling 384 406 1,352 1,519Buick 339 350 1,183 1,035Baojun 277 195 755 499Cadillac 44 27 124 87Other 45 55 186 211Total Asia/Pacific, Middle East and Africa(b) 1,408 1,359 4,587 4,525
South America(c) 162 160 584 645Total Worldwide 2,847 2,721 10,008 9,959
_______(a) Includes Buick, Cadillac, GMC and Daewoo sales.(b) China is wholesale data. (c) Primarily Chevrolet.

9
General Motors Company and SubsidiariesSupplemental Material
(Unaudited)
The wholesale vehicle sales at GM's China joint ventures presented in the following table are included in GM's retail vehicle sales on the preceding page (vehicles in thousands):
Three Months Ended Years EndedDecember 31, 2016 December 31, 2015 December 31, 2016 December 31, 2015
SAIC General Motors Sales Co., Ltd. 563 553 1,806 1,711SAIC GM Wuling Automobile Co., Ltd. and FAW-
GM Light Duty Commercial Vehicle Co., Ltd. 661 601 2,108 2,019
Three Months Ended Years EndedDecember 31, 2016 December 31, 2015 December 31, 2016 December 31, 2015
Market ShareUnited States - Cars 13.9% 12.4% 12.9% 12.4%United States - Trucks 26.2% 25.0% 24.2% 24.6%United States - Crossovers 15.9% 15.9% 15.0% 16.9%Total United States 18.4% 17.3% 17.0% 17.3%Total North America 18.0% 16.9% 16.6% 16.8%Total Europe 5.6% 5.7% 6.0% 6.1%Total Asia/Pacific, Middle East and Africa 10.5% 10.7% 9.7% 10.2%Total South America 16.8% 15.9% 15.9% 15.4%
Total Worldwide 11.5% 11.4% 10.8% 11.1%
United States fleet sales as a percentage of retailvehicle sales 21.0% 19.7% 19.6% 22.0%
North America Capacity Two Shift Utilization 113.2% 102.2% 108.3% 105.0%
10
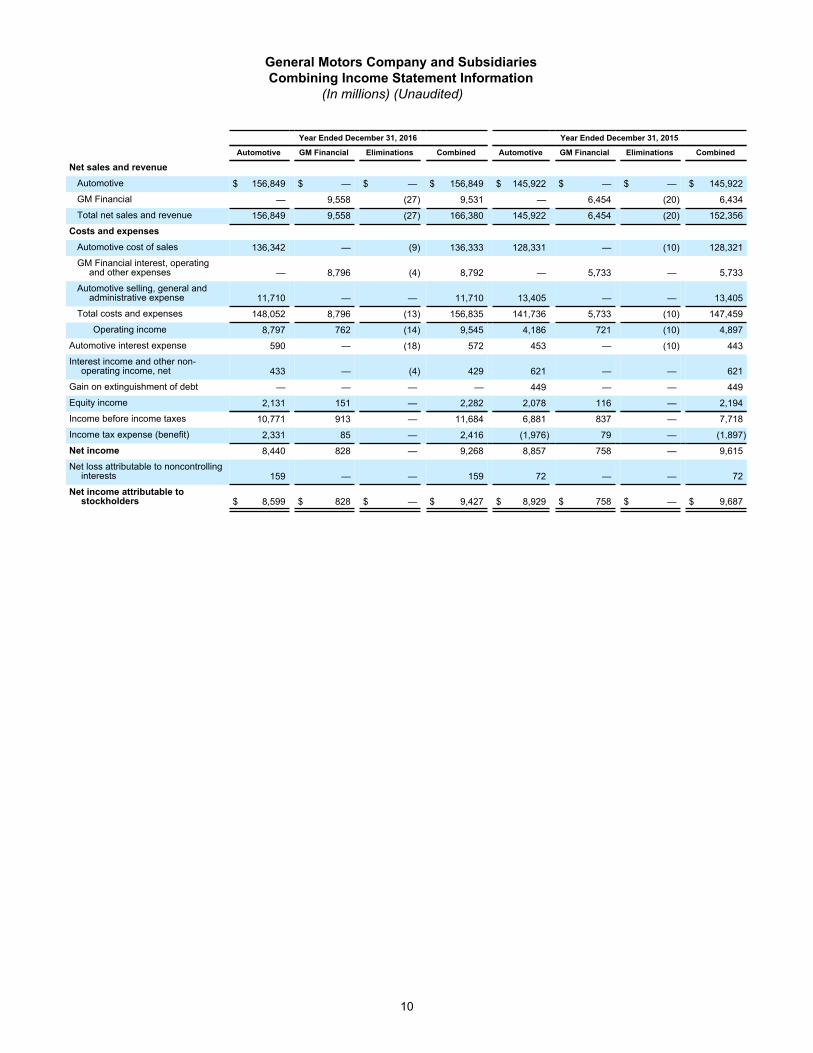
General Motors Company and SubsidiariesCombining Income Statement Information
(In millions) (Unaudited)
Year Ended December 31, 2016 Year Ended December 31, 2015
Automotive GM Financial Eliminations Combined Automotive GM Financial Eliminations Combined
Net sales and revenueAutomotive $ 156,849 $ — $ — $ 156,849 $ 145,922 $ — $ — $ 145,922
GM Financial — 9,558 (27) 9,531 — 6,454 (20) 6,434
Total net sales and revenue 156,849 9,558 (27) 166,380 145,922 6,454 (20) 152,356
Costs and expensesAutomotive cost of sales 136,342 — (9) 136,333 128,331 — (10) 128,321
GM Financial interest, operatingand other expenses — 8,796 (4) 8,792 — 5,733 — 5,733
Automotive selling, general andadministrative expense 11,710 — — 11,710 13,405 — — 13,405
Total costs and expenses 148,052 8,796 (13) 156,835 141,736 5,733 (10) 147,459
Operating income 8,797 762 (14) 9,545 4,186 721 (10) 4,897
Automotive interest expense 590 — (18) 572 453 — (10) 443Interest income and other non-
operating income, net 433 — (4) 429 621 — — 621Gain on extinguishment of debt — — — — 449 — — 449Equity income 2,131 151 — 2,282 2,078 116 — 2,194
Income before income taxes 10,771 913 — 11,684 6,881 837 — 7,718
Income tax expense (benefit) 2,331 85 — 2,416 (1,976) 79 — (1,897)Net income 8,440 828 — 9,268 8,857 758 — 9,615
Net loss attributable to noncontrollinginterests 159 — — 159 72 — — 72
Net income attributable tostockholders $ 8,599 $ 828 $ — $ 9,427 $ 8,929 $ 758 $ — $ 9,687

11
General Motors Company and SubsidiariesBasic and Diluted Earnings per Share
(Unaudited)
The following table summarizes basic and diluted earnings per share (in millions, except per share amounts):
Three Months Ended Years EndedDecember 31,
2016December 31,
2015December 31,
2016December 31,
2015
Basic earnings per shareNet income attributable to stockholders $ 1,835 $ 6,266 $ 9,427 $ 9,687
Weighted-average common shares outstanding 1,516 1,553 1,540 1,586
Basic earnings per common share $ 1.21 $ 4.03 $ 6.12 $ 6.11Diluted earnings per shareNet income attributable to common stockholders – diluted $ 1,835 $ 6,266 $ 9,427 $ 9,686
Weighted-average common shares outstanding – diluted 1,546 1,597 1,570 1,640
Diluted earnings per common share $ 1.19 $ 3.92 $ 6.00 $ 5.91

12
General Motors Company and SubsidiariesCombining Balance Sheet Information
(In millions, except per share amounts) (Unaudited)
December 31, 2016 December 31, 2015
Automotive GM Financial Eliminations Combined Automotive GM Financial Eliminations Combined
ASSETSCurrent Assets
Cash and cash equivalents $ 9,759 $ 3,201 $ — $ 12,960 $ 12,177 $ 3,061 $ — $ 15,238
Marketable securities 11,841 — — 11,841 8,163 — — 8,163
Accounts and notes receivable, net(a) 9,553 996 (911) 9,638 8,590 681 (934) 8,337
GM Financial receivables, net(b) — 22,466 (401) 22,065 — 18,281 (230) 18,051
Inventories 13,788 — — 13,788 13,764 — — 13,764
Equipment on operating leases, net 1,896 — — 1,896 2,783 — — 2,783
Other current assets 1,730 2,285 — 4,015 1,332 1,740 — 3,072
Total current assets 48,567 28,948 (1,312) 76,203 46,809 23,763 (1,164) 69,408
Non-current Assets
GM Financial receivables, net — 20,724 — 20,724 — 18,500 — 18,500
Equity in net assets of nonconsolidated affiliates 8,052 944 — 8,996 8,215 986 — 9,201
Property, net 35,541 279 — 35,820 31,010 219 — 31,229
Goodwill and intangible assets, net 4,881 1,378 — 6,259 4,558 1,389 — 5,947
GM Financial equipment on operating leases, net — 34,526 — 34,526 — 20,172 — 20,172
Deferred income taxes(c) 34,819 273 — 35,092 36,635 225 — 36,860
Other assets 3,195 875 — 4,070 2,194 827 — 3,021
Total non-current assets 86,488 58,999 — 145,487 82,612 42,318 — 124,930
Total Assets $ 135,055 $ 87,947 $ (1,312) $ 221,690 $ 129,421 $ 66,081 $ (1,164) $ 194,338
LIABILITIES AND EQUITY
Current Liabilities
Accounts payable (principally trade)(a) $ 26,942 $ 793 $ (774) $ 26,961 $ 24,093 $ 740 $ (771) $ 24,062
Short-term debt and current portion of long-term debt
Automotive(a)(b) 1,705 — (538) 1,167 1,209 — (392) 817
GM Financial — 27,861 — 27,861 — 18,745 — 18,745
Accrued liabilities(c) 26,376 2,816 — 29,192 26,043 1,550 — 27,593
Total current liabilities 55,023 31,470 (1,312) 85,181 51,345 21,035 (1,163) 71,217
Non-current Liabilities
Long-term debt
Automotive 9,585 — — 9,585 7,948 — — 7,948
GM Financial — 46,015 — 46,015 — 35,601 — 35,601
Postretirement benefits other than pensions 5,803 — — 5,803 5,685 — — 5,685
Pensions 17,836 115 — 17,951 20,804 107 — 20,911
Other liabilities(c) 11,760 1,320 — 13,080 11,627 1,027 (1) 12,653
Total non-current liabilities 44,984 47,450 — 92,434 46,064 36,735 (1) 82,798
Total Liabilities 100,007 78,920 (1,312) 177,615 97,409 57,770 (1,164) 154,015
Commitments and contingencies
Equity
Common stock, $0.01 par value 15 — — 15 15 — — 15
Additional paid-in capital 26,982 1 — 26,983 27,606 1 — 27,607
Retained earnings 15,903 10,265 — 26,168 10,870 9,415 — 20,285
Accumulated other comprehensive loss (8,091) (1,239) — (9,330) (6,931) (1,105) — (8,036)
Total stockholders’ equity 34,809 9,027 — 43,836 31,560 8,311 — 39,871
Noncontrolling interests 239 — — 239 452 — — 452
Total Equity 35,048 9,027 — 44,075 32,012 8,311 — 40,323
Total Liabilities and Equity $ 135,055 $ 87,947 $ (1,312) $ 221,690 $ 129,421 $ 66,081 $ (1,164) $ 194,338
_________(a) Eliminations include Automotive accounts receivable of $396 million offset by GM Financial accounts payable, GM Financial accounts receivable of $373 million offset by Automotive accounts
payable and GM Financial notes receivable of $137 million offset by loans to Automotive at December 31, 2016 and Automotive accounts receivable of $358 million offset by GM Financial accounts payable, GM Financial accounts receivable of $409 million offset by Automotive accounts payable and GM Financial notes receivable of $163 million offset by loans to Automotive at December 31, 2015.
(b) Eliminations include GM Financial receivables of $401 million and $230 million offset by loans to Automotive at December 31, 2016 and December 31, 2015.(c) As a result of GM's adoption of Accounting Standards Update (ASU) 2015-17, "Balance Sheet Classification of Deferred Taxes" certain prior year amounts have been reclassified.
13
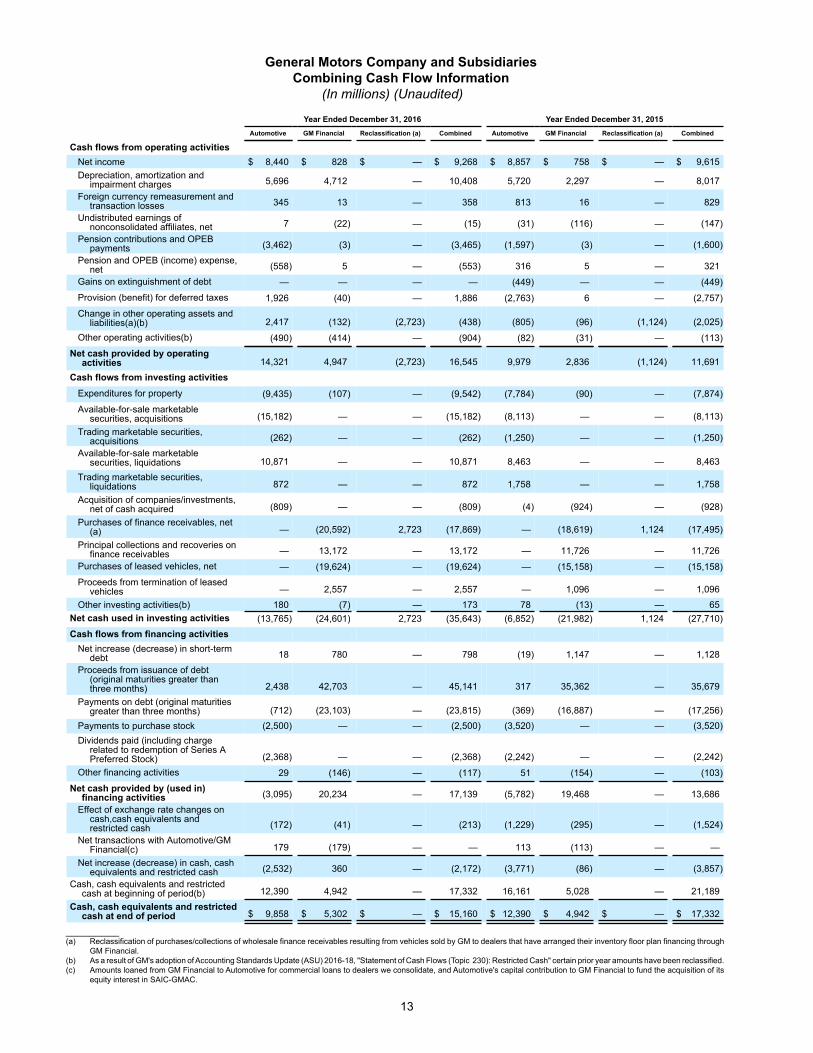
General Motors Company and SubsidiariesCombining Cash Flow Information
(In millions) (Unaudited)
Year Ended December 31, 2016 Year Ended December 31, 2015Automotive GM Financial Reclassification (a) Combined Automotive GM Financial Reclassification (a) Combined
Cash flows from operating activitiesNet income $ 8,440 $ 828 $ — $ 9,268 $ 8,857 $ 758 $ — $ 9,615Depreciation, amortization and
impairment charges 5,696 4,712 — 10,408 5,720 2,297 — 8,017
Foreign currency remeasurement andtransaction losses 345 13 — 358 813 16 — 829
Undistributed earnings ofnonconsolidated affiliates, net 7 (22) — (15) (31) (116) — (147)
Pension contributions and OPEBpayments (3,462) (3) — (3,465) (1,597) (3) — (1,600)
Pension and OPEB (income) expense,net (558) 5 — (553) 316 5 — 321
Gains on extinguishment of debt — — — — (449) — — (449)Provision (benefit) for deferred taxes 1,926 (40) — 1,886 (2,763) 6 — (2,757)Change in other operating assets and
liabilities(a)(b) 2,417 (132) (2,723) (438) (805) (96) (1,124) (2,025)Other operating activities(b) (490) (414) — (904) (82) (31) — (113)
Net cash provided by operatingactivities 14,321 4,947 (2,723) 16,545 9,979 2,836 (1,124) 11,691
Cash flows from investing activitiesExpenditures for property (9,435) (107) — (9,542) (7,784) (90) — (7,874)Available-for-sale marketable
securities, acquisitions (15,182) — — (15,182) (8,113) — — (8,113)Trading marketable securities,
acquisitions (262) — — (262) (1,250) — — (1,250)Available-for-sale marketable
securities, liquidations 10,871 — — 10,871 8,463 — — 8,463
Trading marketable securities,liquidations 872 — — 872 1,758 — — 1,758
Acquisition of companies/investments,net of cash acquired (809) — — (809) (4) (924) — (928)
Purchases of finance receivables, net(a) — (20,592) 2,723 (17,869) — (18,619) 1,124 (17,495)
Principal collections and recoveries onfinance receivables — 13,172 — 13,172 — 11,726 — 11,726
Purchases of leased vehicles, net — (19,624) — (19,624) — (15,158) — (15,158)Proceeds from termination of leased
vehicles — 2,557 — 2,557 — 1,096 — 1,096
Other investing activities(b) 180 (7) — 173 78 (13) — 65Net cash used in investing activities (13,765) (24,601) 2,723 (35,643) (6,852) (21,982) 1,124 (27,710)Cash flows from financing activities
Net increase (decrease) in short-termdebt 18 780 — 798 (19) 1,147 — 1,128
Proceeds from issuance of debt(original maturities greater thanthree months) 2,438 42,703 — 45,141 317 35,362 — 35,679
Payments on debt (original maturitiesgreater than three months) (712) (23,103) — (23,815) (369) (16,887) — (17,256)
Payments to purchase stock (2,500) — — (2,500) (3,520) — — (3,520)Dividends paid (including charge
related to redemption of Series APreferred Stock) (2,368) — — (2,368) (2,242) — — (2,242)
Other financing activities 29 (146) — (117) 51 (154) — (103)Net cash provided by (used in)
financing activities (3,095) 20,234 — 17,139 (5,782) 19,468 — 13,686Effect of exchange rate changes on
cash,cash equivalents andrestricted cash (172) (41) — (213) (1,229) (295) — (1,524)
Net transactions with Automotive/GMFinancial(c) 179 (179) — — 113 (113) — —
Net increase (decrease) in cash, cashequivalents and restricted cash (2,532) 360 — (2,172) (3,771) (86) — (3,857)
Cash, cash equivalents and restrictedcash at beginning of period(b) 12,390 4,942 — 17,332 16,161 5,028 — 21,189
Cash, cash equivalents and restrictedcash at end of period $ 9,858 $ 5,302 $ — $ 15,160 $ 12,390 $ 4,942 $ — $ 17,332
_________(a) Reclassification of purchases/collections of wholesale finance receivables resulting from vehicles sold by GM to dealers that have arranged their inventory floor plan financing through
GM Financial.(b) As a result of GM's adoption of Accounting Standards Update (ASU) 2016-18, "Statement of Cash Flows (Topic 230): Restricted Cash" certain prior year amounts have been reclassified.(c) Amounts loaned from GM Financial to Automotive for commercial loans to dealers we consolidate, and Automotive's capital contribution to GM Financial to fund the acquisition of its
equity interest in SAIC-GMAC.