(gmac admission test (gmat - eric · admission test ® (gmat ®). the gmat exam is an important...
TRANSCRIPT


About This Study
The 2012 Application Trends Survey conducted by the Graduate Management Admission Council® (GMAC®) is the industry source for comprehensive statistics and timely insights into the demand for graduate management education worldwide. Since 2000, this survey of admission professionals has provided information on application volume trends, applicant pool composition, recruitment strategies, acceptance and enrollment rates, and incoming class size.
The Application Trends Survey Report is a product of GMAC, a global nonprofit education organization of leading graduate business schools and the owner of the Graduate Management Admission Test® (GMAT®). The GMAT exam is an important part of the admissions process for more than 5,500 graduate management programs around the world. GMAC is dedicated to creating access to and disseminating information about graduate management education; these schools and others rely on the Council as the premier provider of reliable data about the graduate management education industry.
Accompanying Data
Participating schools receive access to the 120-page Application Trends Survey Participant Report, which provides detailed survey trends by program type and various demographic factors in both graphical and written formats, and the Application Trends Interactive Benchmark Tool that allows them to select peer groups of their choosing against which to benchmark their programs. Information on how schools can participate in this study can be found at the end of this report.

Application Trends Survey 2012 Survey Report
© 2012 Graduate Management Admission Council®. All rights reserved. 1
Table of Contents
INTRODUCTION ................................................................................................................... 3
Key Findings .................................................................................................................................................. 4
TRENDS FOR MBA PROGRAMS .......................................................................................... 5
Key Findings: MBA Programs .................................................................................................................... 6
Regional MBA Program Trends.................................................................................................................. 9
Demographic Trends in MBA Application Volume .............................................................................. 12
Program Size ................................................................................................................................................ 14
Outreach Efforts ......................................................................................................................................... 15
Applicant Profile .......................................................................................................................................... 16
Foreign Candidate Pool .............................................................................................................................. 18
Tuition Assistance ....................................................................................................................................... 19
Employer Funding ...................................................................................................................................... 20
TRENDS FOR MASTER’S AND PHD PROGRAMS .......................................................... 22
Key Findings: Master’s and PhD Programs ............................................................................................ 23
Regional Program Trends .......................................................................................................................... 25
Demographic Trends in Application Volume......................................................................................... 27
Program Size ................................................................................................................................................ 29
Outreach Efforts ......................................................................................................................................... 29
Applicant Profile .......................................................................................................................................... 31
Foreign Candidate Pool .............................................................................................................................. 32
Tuition Assistance ....................................................................................................................................... 34
Employer Funding ...................................................................................................................................... 34
APPLICANT DEMOGRAPHIC PROFILE .......................................................................... 36
ABOUT THE SURVEY .......................................................................................................... 38

2012 Survey Report Application Trends Survey
2 © 2012 Graduate Management Admission Council®. All rights reserved.
Methodology ................................................................................................................................................ 38
Survey Participation .................................................................................................................................... 39
Regional Location of Survey Respondents .............................................................................................. 39
Key Survey Definitions............................................................................................................................... 40
CONTACT INFORMATION ................................................................................................ 41
Authorship .................................................................................................................................................... 42
Acknowledgements ..................................................................................................................................... 42
REFERENCES ....................................................................................................................... 42

Application Trends Survey 2012 Survey Report
© 2012 Graduate Management Admission Council®. All rights reserved. 3
Introduction
his year’s Application Trends Survey—the thirteenth since GMAC introduced the annual survey in 2000—included more participants than ever before: A record-breaking 744 programs were represented in the survey from 359 business schools and faculties, 44 percent of which submitted data for more than one program type. Participating programs are located
in 46 countries, 42 states, and the District of Columbia in the United States. By program type, survey respondents include 527 MBA programs, 193 specialized master’s programs, and 24 doctoral programs in business.1 Two-thirds (66%) of participating schools were located in the United States; however, a record percentage of programs (34%) from elsewhere in the world are represented in these findings.
Most business schools today offer a variety of graduate management education degree options, from the MBA—delivered in part-time, full-time, executive, flexible, and online/distance degree format options—to a range of specialized master’s programs. Although this survey is not designed to track shifts in the “supply side” of graduate management education, there are a variety of data points that speak to the diversification of programs in the business school landscape. Related data in the GMAT exam pipeline of test takers also show greater awareness of the diverse business school program portfolio—prospective students sent GMAT score reports to 900 more programs in 2011 than in 2007, moving the total to nearly 5,000 programs receiving GMAT scores in the last testing year.2 These changes in the business school market help illuminate what may be driving the shifts in who’s applying to GME programs and why application volumes on the “demand side” may be changing.
In addition to the expanded and more diverse survey sample this year, new items in the 2012 survey allow for detail about expected employer funding among incoming students, richer detail about the makeup of the master’s applicant pipeline, and further details about targeted student recruitment for all graduate management education programs, such as pre-experience candidates, students with an entrepreneurial background, underrepresented nationalities, and members of the lesbian, gay, bisexual, and transgender (LGBT) community.
For the purposes of this report, two approaches are used to assess changes in the application volume to graduate management programs. The relative approach involves monitoring the number of programs that report either an increase or decrease in applications compared with last year. The absolute approach involves monitoring the number of applications received by programs.
1 See the About the Survey section of this report for a detailed breakdown of respondents by program type.
2 Graduate Management Admission Council. GMAT® examinee data for testing years 2007 and 2011. Reston, VA: GMAC.
T

2012 Survey Report Application Trends Survey
4 © 2012 Graduate Management Admission Council®. All rights reserved.
Key Findings
Demand for Graduate Management Education Is Healthy
A greater share of all programs (MBA, master’s, and PhD combined) participating in this year’s survey (51%) noted increased application volumes for their incoming class of 2012–2013 compared with last year. Yet, demand for different graduate management programs continues to be driven by distinct applicant pipelines.
Globally, across all MBA and specialized master’s programs, the percentage of programs attracting more applications in 2012 ranges from 41 percent to 78 percent, depending on degree type and study format.
The majority of business master’s programs continue to experience the same strong growth in application volume they have witnessed over the past few years. The share of all master’s programs attracting more applications in 2012 ranges between 57 percent and 78 percent.
Although MBA programs have experienced improvement in application volumes in 2012 compared with last year, fewer than half of each MBA program type reported increased volumes over 2011, with the exception of online/distance MBA programs. The percentage of MBA programs that experienced increased application volume in 2012 ranges from 41 percent to 66 percent.
Women and Foreign Citizens Deepen the Applicant Pool
The flow of applications from foreign citizens continues to be a source of increased or steady application volume in 2012 for the majority of responding programs (MBA, master’s, and PhD combined) compared with 2011.
Women make up more than half of the 2012–2013 applicant pool for master’s programs in management, accounting, and marketing/communications. Forty-six percent of all MBA and master’s programs combined saw increased applications from women this year compared with 2011.
Candidate Recruitment Is Global and Diverse
In 2012, 40 percent of all MBA and master’s programs combined conducted recruiting activities in a total of 82 countries worldwide seeking to attract foreign applicants. Globally, their foreign candidate recruitment took place in China, India, and the United States more often than in any other country.
Findings new to this year’s survey reveal special efforts programs made to recruit entrepreneurs (16%), pre-experience candidates (13%), and members of the LGBT community (9%).
New Findings on Expected Employer Funding
Asked for the first time about the share of their incoming class they expect to receive employer funding, nearly 4 in 5 MBA programs (77%) and more than half of master’s programs (56%) expect incoming students in 2012 to receive some level of employer support.

Application Trends Survey 2012 Survey Report
© 2012 Graduate Management Admission Council®. All rights reserved. 5
Trends for MBA Programs
Last year we noted that MBA application volume historically trends countercyclical to economic conditions, but data collected this year suggest an important change from previous post-recession patterns: MBA programs are experiencing a turnabout from recent downward application cycles even as the economy moves toward recovery. This year’s data demonstrate that the application downturn for MBA programs was neither as steep nor as deep as the downturn experienced after 2002 (Figure 1).
Figure 1. Change in Application Volume Trends Over Time for Full-Time, Part-Time, and Executive MBA Programs, 2000–2012
In 2001–2002, when the global economy slowed, applications to MBA programs increased. As the global economy recovered, programs reported a decrease in the number of applications received, with full-time MBA programs bottoming out in 2004 and 2005. Part-time and executive MBA programs fared better, as students were able to keep working while completing their course work.
As the most recent global recession began in late 2007 and deepened in 2008, unemployment rates rose and application volumes for full-time MBA programs once again began to climb, peaking in 2009. For the past three years of sluggish economic recovery (2009–2011), full-time MBA programs reported slowing or decreasing application growth.
Participants who indicated that applications declined for a given program were asked to indicate an explanation for such change. Several respondents from full-time two-year MBA programs commented that even though applications to their programs stabilized somewhat this year, economic factors around the world might make prospects think twice about giving up a job. “Reluctance to leave full-time position,” commented one US admissions professional. “The economy is picking up and students are finding full-time jobs or have received promotions and do not want to leave to go back to school for two years,” said another.
2000 2001 2002 2003 2004 2005 2006 2007 2008 2009 2010 2011 2012
Rela
tive c
ha
ng
e in a
pp
lica
tio
n v
olu
me
Executive MBA Full-time MBA Part-time MBA
Up significantly
Down significantly
No change

2012 Survey Report Application Trends Survey
6 © 2012 Graduate Management Admission Council®. All rights reserved.
Figure 3. Change in Application Volume for
All MBA Programs
2011 vs.
2010
2012 vs.
2011
36% 46%
11% Flat 10%
54% 45%
In 2012, all MBA program formats saw an increase in the percentage of programs reporting growth compared with findings from 2011. Fueled by application gains among online/distance offerings, 46 percent of all MBA programs saw improved volumes in 2012, while 45 percent saw declines and 10 percent reported no change. By comparison, in 2011 just over a third of all MBA programs (36%) reported increases in application volume (Figures 2 and 3.)3
Figure 2. MBA Programs Reporting Change in Application Volume, 2012 vs. 2011
Key Findings: MBA Programs
All Full-Time MBA Programs
More than half (52%) of full-time MBA programs reported steady (7%) or increased (44%) application volume in 2012. Comparatively, only 37 percent of full-time MBA programs saw increased volume in 2011.
Full-Time Two-Year MBA Programs
Globally, 43 percent of full-time two-year MBA programs reported an increase in application volume for the incoming class of 2012–2013 compared with last year.
The percentage of programs seeing increasing application volume rose for the first time since 2008 (Figure 4). Fifty-one percent of programs saw decreasing volume this year; however, 24 percent of programs said the decrease was slight compared with 2011 (less than 10%).
3 Graduate Management Admission Council. (2011). Application Trends Survey Report. Reston, VA: GMAC.
43% 47% 44% 41%49%
66%
6%9% 14%
11%12%
3%51% 44% 42% 48%
39%31%
0%
20%
40%
60%
80%
100%
Full-timetwo-year
MBA
Full-timeone-year
MBA
Part-timeMBA
FlexibleMBA
ExecutiveMBA
Online/distance
MBA
Perc
enta
ge o
f p
rog
ram
s
Up Flat Down

Application Trends Survey 2012 Survey Report
© 2012 Graduate Management Admission Council®. All rights reserved. 7
Full-time two-year MBA programs worldwide received a median of 267 applications, more than twice the median of full-time one-year programs (135) and three-and-a-half times the median of part-time MBA applications (75).
By world region, programs in Asia-Pacific (79%) and Central Asia (80%) reported the strongest growth in volumes for full-time two-year programs, which may be attributed to domestic applicants, the greatest source of growth across Asia.
Figure 4. Full-Time Two-Year MBA Programs Reporting Change in Application Volume Over Time, 2007–2012
Full-Time One-Year MBA Programs
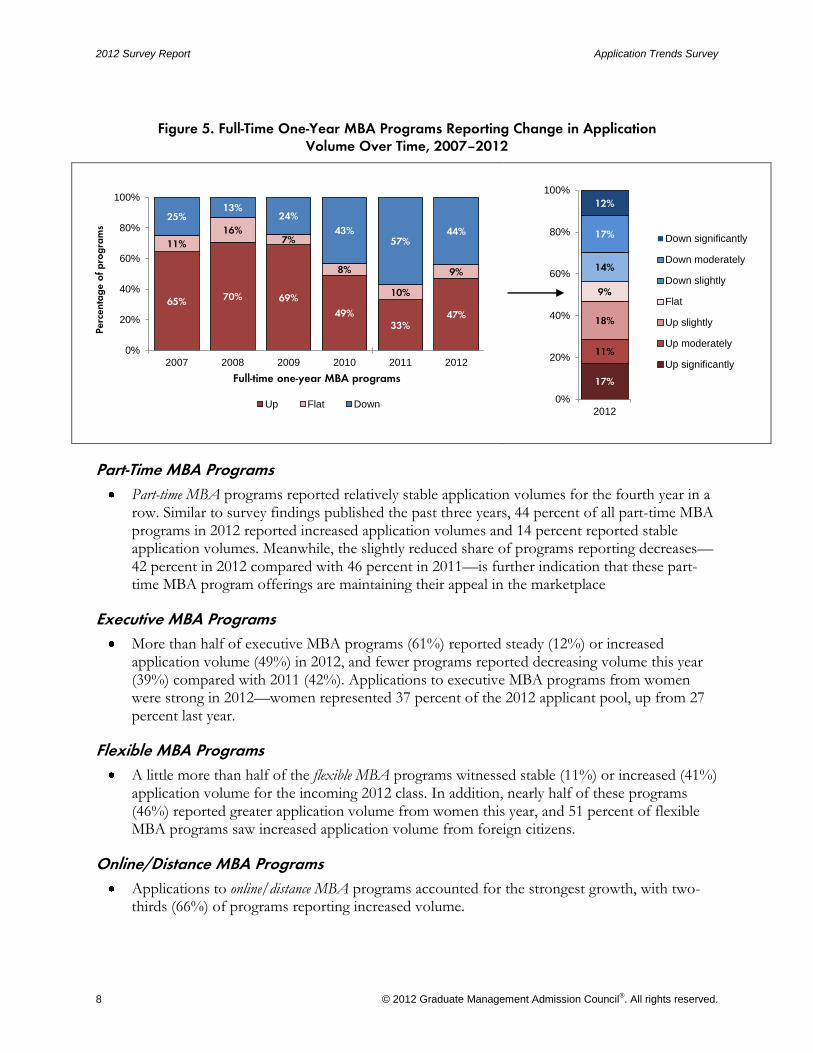
In 2012, the share of full-time one-year MBA programs that reported increased application volume (47%) exceeded the percentage reporting decreased volume (44%; Figure 5). Regionally, full-time one-year MBA programs across all of Asia witnessed the strongest overall growth in application volume in 2012.
63%80%
64%
41%28%
43%
6%
8%
4%
10%
5%
6%
31%
12%
32%49%
67%51%
0%
20%
40%
60%
80%
100%
2007 2008 2009 2010 2011 2012
Perc
enta
ge o
f p
rog
ram
s
Full-time two-year MBA programs
Up Flat Down
7%
15%
20%
6%
24%
17%
10%
0%
20%
40%
60%
80%
100%
2012
Down significantly
Down moderately
Down slightly
Flat
Up slightly
Up moderately
Up significantly
2012 Survey Report Application Trends Survey
8 © 2012 Graduate Management Admission Council®. All rights reserved.
Figure 5. Full-Time One-Year MBA Programs Reporting Change in Application Volume Over Time, 2007–2012
Part-Time MBA Programs
Part-time MBA programs reported relatively stable application volumes for the fourth year in a row. Similar to survey findings published the past three years, 44 percent of all part-time MBA programs in 2012 reported increased application volumes and 14 percent reported stable application volumes. Meanwhile, the slightly reduced share of programs reporting decreases—42 percent in 2012 compared with 46 percent in 2011—is further indication that these part-time MBA program offerings are maintaining their appeal in the marketplace
Executive MBA Programs
More than half of executive MBA programs (61%) reported steady (12%) or increased application volume (49%) in 2012, and fewer programs reported decreasing volume this year (39%) compared with 2011 (42%). Applications to executive MBA programs from women were strong in 2012—women represented 37 percent of the 2012 applicant pool, up from 27 percent last year.
Flexible MBA Programs
A little more than half of the flexible MBA programs witnessed stable (11%) or increased (41%) application volume for the incoming 2012 class. In addition, nearly half of these programs (46%) reported greater application volume from women this year, and 51 percent of flexible MBA programs saw increased application volume from foreign citizens.
Online/Distance MBA Programs
Applications to online/distance MBA programs accounted for the strongest growth, with two-thirds (66%) of programs reporting increased volume.
65% 70% 69%
49%33%
47%
11%
16%7%
8%
10%
9%
25%13%
24%
43%57%
44%
0%
20%
40%
60%
80%
100%
2007 2008 2009 2010 2011 2012
Perc
enta
ge o
f p
rog
ram
s
Full-time one-year MBA programs
Up Flat Down
17%
11%
18%
9%
14%
17%
12%
0%
20%
40%
60%
80%
100%
2012
Down significantly
Down moderately
Down slightly
Flat
Up slightly
Up moderately
Up significantly

Application Trends Survey 2012 Survey Report
© 2012 Graduate Management Admission Council®. All rights reserved. 9
Regional MBA Program Trends
Examining changes in application volume from a global perspective often masks the dynamics happening at the regional level.
Full-Time Two-Year MBA. A far greater percentage of full-time two-year MBA programs in Asia reported increases in application volume for the incoming 2012–2013 class compared with US programs. Four out of five full-time two-year MBA programs in the regions of Asia-Pacific (79%) and Central Asia (80%) saw increased applications; in the United States, a third (32%) of the full-time two-year MBA programs saw growth (Figure 6).4
Figure 6. Change in Application Volume for Full-Time Two-Year Programs,* by World Region, 2012 vs. 2011
*Percentages may not sum to 100 due to rounding.
4 Regional findings shown for Asia-Pacific, Central Asia, and the United States. Response for other regions was not sufficient to report. Data for two-year postgraduate (PGP) programs, an Indian version of the MBA, were aggregated within full-time two-year MBA data.
79% 80%
32%
7% 10%
7%
14% 10%
62%
0%
25%
50%
75%
100%
Asia-Pacific Central Asia United States
Perc
enta
ge o
f p
rog
ram
s
Up Flat Down
2012 Survey Report Application Trends Survey
10 © 2012 Graduate Management Admission Council®. All rights reserved.
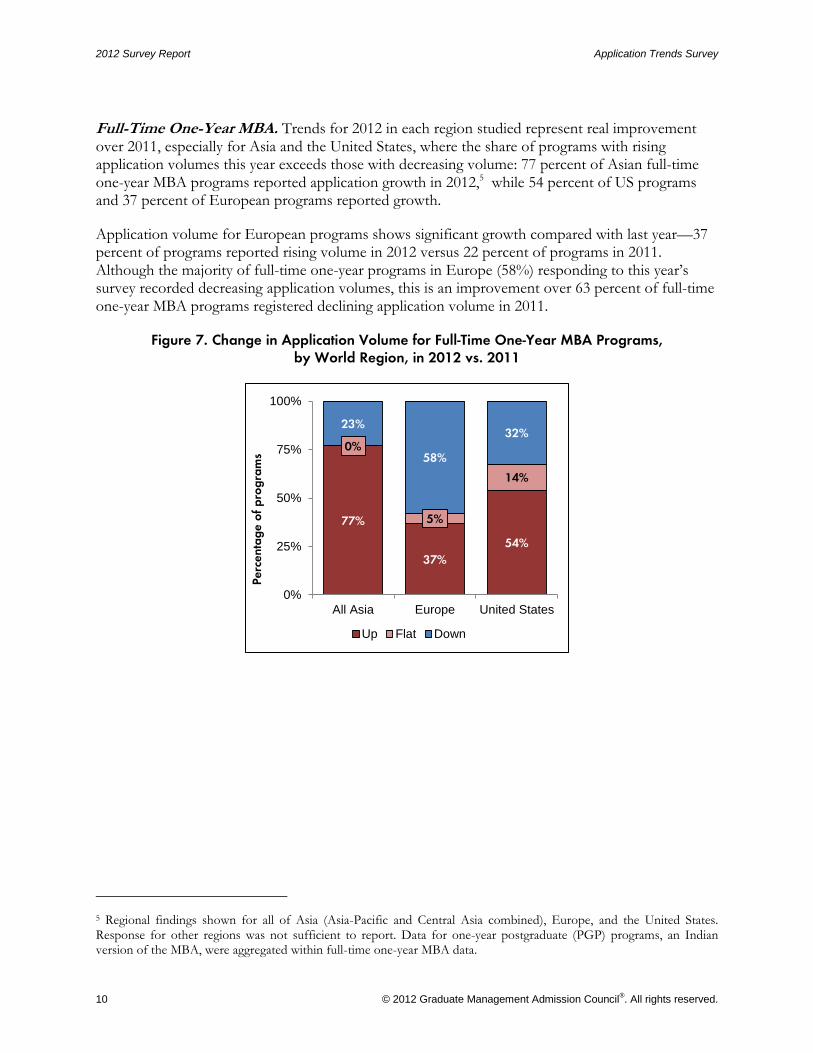
Full-Time One-Year MBA. Trends for 2012 in each region studied represent real improvement over 2011, especially for Asia and the United States, where the share of programs with rising application volumes this year exceeds those with decreasing volume: 77 percent of Asian full-time one-year MBA programs reported application growth in 2012,5 while 54 percent of US programs and 37 percent of European programs reported growth.
Application volume for European programs shows significant growth compared with last year—37 percent of programs reported rising volume in 2012 versus 22 percent of programs in 2011. Although the majority of full-time one-year programs in Europe (58%) responding to this year’s survey recorded decreasing application volumes, this is an improvement over 63 percent of full-time one-year MBA programs registered declining application volume in 2011.
Figure 7. Change in Application Volume for Full-Time One-Year MBA Programs, by World Region, in 2012 vs. 2011
5 Regional findings shown for all of Asia (Asia-Pacific and Central Asia combined), Europe, and the United States. Response for other regions was not sufficient to report. Data for one-year postgraduate (PGP) programs, an Indian version of the MBA, were aggregated within full-time one-year MBA data.
77%
37%
54%
0%
5%
14%
23%
58%
32%
0%
25%
50%
75%
100%
All Asia Europe United States
Perc
enta
ge o
f p
rog
ram
s
Up Flat Down

Application Trends Survey 2012 Survey Report
© 2012 Graduate Management Admission Council®. All rights reserved. 11
Executive MBA. A regional analysis of executive MBA programs yielded some comparison data for European and US programs.6 Nearly equal proportions of European and US executive MBA programs—55 percent of US programs and 53 percent of European programs—reported increased application volume for this year’s incoming class compared with 2011 (Figure 8). Percentages for programs reporting a decrease in application volume were somewhat lower for US executive MBA programs (39%) than for European programs (47%).
Figure 8. Executive MBA Programs Reporting Increased Volume, by World Region, 2012 vs. 2011
US Regional Trends7
An examination of application trends for MBA programs in the United States shows that full-time two-year MBA programs in the Mid-Atlantic saw the greatest growth in application volume; 59 percent of programs reported increased applications compared with last year (Figure 9), and the Mid-Atlantic was the only US region where a greater proportion of programs saw increased application volumes compared with those reporting decreasing volumes.
6 Regional executive MBA program findings are available only for Europe and the United States; data for other regions were insufficient to report.
7 For a geographic classification of US programs by region and state, see Regional Location of Survey Respondents at the end of this report.
53% 55%
0%6%
47%39%
0%
20%
40%
60%
80%
100%
Europe United States
Perc
enta
ge o
f p
rog
ram
s
Up Flat Down

2012 Survey Report Application Trends Survey
12 © 2012 Graduate Management Admission Council®. All rights reserved.
Figure 9. Full-Time Two-Year MBA Programs Reporting Change in Application Volume by US Regions, 2012 vs. 2011
More than half of US part-time MBA programs located in the Midwest (54%) experienced increased application volume in 2012 while only 35 percent saw decreasing volume in 2012. Western programs showed similar growth, with half (50%) of programs reporting increased volume, and 14 percent seeing no change compared with last year.
In addition, 47 percent of part-time MBA programs in the US Mid-Atlantic experienced increased application volumes and 7 percent reported stable volumes. In other US regions, notably the Northeast, South, and Southwest, a greater share of part-time MBA programs (64%, 55%, and 50%, respectively) saw decreasing application volume in 2012.
Demographic Trends in MBA Application Volume
Citizenship
Globally, the majority of MBA programs reported increased or steady application growth from domestic applicants. Full-time two-year MBA programs were the exception—only 43 percent of these programs reported increased (35%) or steady (7%) domestic volume (Figure 10).
Applications from foreign citizens were a source of stable or increased volume this year across a majority of all MBA program types combined. MBA programs that reported the greatest percentage increase in foreign application volume include full-time two-year (45%), full-time one-year (47%), and flexible MBA (51%).
26%
59%
35%
19%27% 28%
9%
6%
0%
10%0%
11%
65%
35%
65%71% 73%
61%
0%
25%
50%
75%
100%
Northeast Mid-Atlantic South Midwest Southwest West
Perc
enta
ge o
f p
rog
ram
s
Up Flat Down
The term foreign refers to applicants who are not citizens of the country where the program is located.
The term domestic refers to applicants who are citizens of the country where a program is located.

Application Trends Survey 2012 Survey Report
© 2012 Graduate Management Admission Council®. All rights reserved. 13
Figure 10. MBA Programs Reporting Application Volume Change, by Citizenship, 2012 vs. 2011
Gender
Men continue to represent the greatest share of application volume for MBA programs. In terms of growth, online/distance MBA programs show the greatest change from men at 45 percent of programs reporting an increase.
In 2012, however, a greater percentage of MBA programs reported increased application volume from women compared with 2011, moving the percentage from 31 percent of programs reporting an increase in 2011 to 43 percent of programs in 2012.
Regionally, across all MBA programs, full-time one-year MBA programs in Asia (Asia-Pacific and Central Asia combined) reported the greatest growth in female application volume in 2012 at 77 percent, compared with 32 percent of full-time one-year MBA programs in Europe and 47 percent in the United States.
35%45% 38%
47%36% 30%
7%
10%14%
11%19%
45%
58%45% 48% 42% 45%
25%
0%
20%
40%
60%
80%
100%
Domestic Foreign Domestic Foreign Domestic Foreign
Full-time two-year MBA Full-time one-year MBA Part-time MBA
Perc
enta
ge o
f p
rog
ram
s
40%51% 43% 42% 45% 41%
13%
18% 29% 35%17% 31%
47%31% 28% 23%
38%28%
0%
20%
40%
60%
80%
100%
Domestic Foreign Domestic Foreign Domestic Foreign
Flexible MBA Executive MBA Online MBA
Perc
enta
ge o
f p
rog
ram
s
Up Flat Down

2012 Survey Report Application Trends Survey
14 © 2012 Graduate Management Admission Council®. All rights reserved.
Underrepresented US Populations8
Full-time two-year MBA programs in the US South and West saw the greatest increase in applications from underrepresented populations in 2012, as reported by 59 percent and 50 percent of programs, respectively. In contrast, more than half of US programs in the Northeast, Midwest, and Southwest reported decreasing volume.
Findings for US full-time one-year MBA programs in 2012 were similar to findings in 2011. This year, 76 percent of these programs reported either increased (38%) or stable (38%) application volume from underrepresented populations. Flexible MBA programs in the United States reported similar findings—67 percent of programs saw the same (36%) or greater (31%) application volume from underrepresented populations while a third (33%) saw decreasing volumes.
In 2012, 31 percent of all US part-time MBA programs saw increased application volume from underrepresented populations and 41 experienced decreasing volumes from these candidates. By US region, the greatest influx of applications from these subgroups this year occurred in the Mid-Atlantic region, as seen by 43 percent of responding programs.
Application volume from underrepresented populations was greatest for US-based online/distance MBA programs, 70 percent of which reported steady or increased growth in application volume from these candidates.
Program Size
In 2012, 60 percent of all MBA programs increased their targeted program size compared with 2011. Nearly three-quarters of flexible MBA programs (73%) and 65 percent of full-time one-year MBA and online/distance MBA programs increased their targeted class size (Table 1).
Online/distance programs have the highest acceptance rates, with a median of 82 percent of applicants expected to receive admittance into the class of 2012–2013. Comparable to findings from previous years, full-time two-year MBA (45%) and full-time one-year MBA (49%) programs reported the lowest median acceptance rates among MBA programs.
8 For definition of “underrepresented populations” see Key Survey Definitions at the back of this report.
Application Trends Survey 2012 Survey Report
© 2012 Graduate Management Admission Council®. All rights reserved. 15
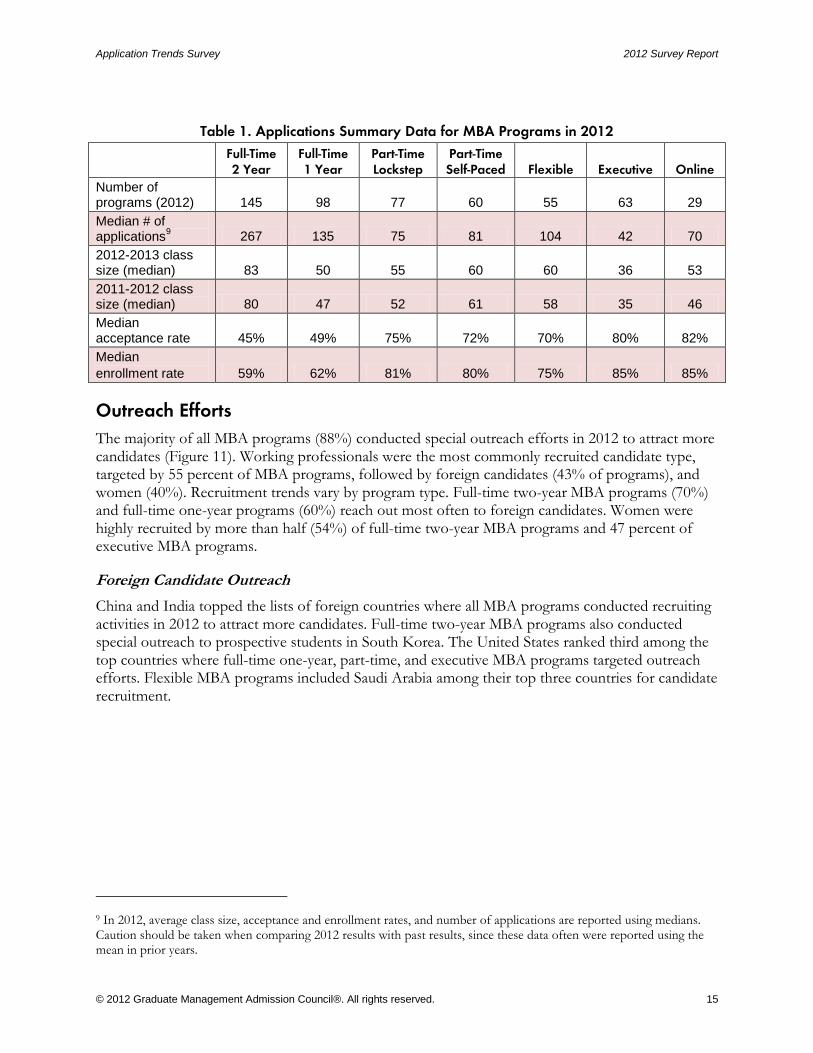
Table 1. Applications Summary Data for MBA Programs in 2012
Full-Time 2 Year
Full-Time 1 Year
Part-Time Lockstep
Part-Time Self-Paced Flexible Executive Online
Number of programs (2012) 145 98 77 60 55 63 29
Median # of applications
9 267 135 75 81 104 42 70
2012-2013 class size (median) 83 50 55 60 60 36 53
2011-2012 class size (median) 80 47 52 61 58 35 46
Median acceptance rate 45% 49% 75% 72% 70% 80% 82%
Median
enrollment rate 59% 62% 81% 80% 75% 85% 85%
Outreach Efforts
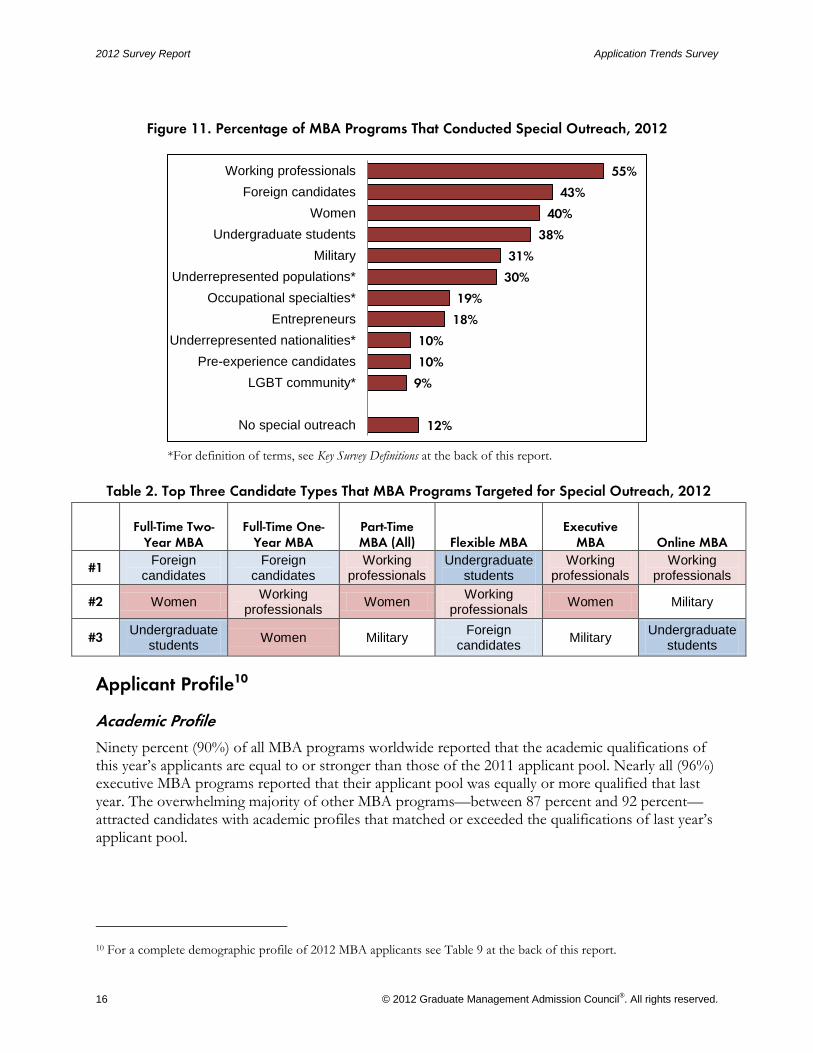
The majority of all MBA programs (88%) conducted special outreach efforts in 2012 to attract more candidates (Figure 11). Working professionals were the most commonly recruited candidate type, targeted by 55 percent of MBA programs, followed by foreign candidates (43% of programs), and women (40%). Recruitment trends vary by program type. Full-time two-year MBA programs (70%) and full-time one-year programs (60%) reach out most often to foreign candidates. Women were highly recruited by more than half (54%) of full-time two-year MBA programs and 47 percent of executive MBA programs.
Foreign Candidate Outreach
China and India topped the lists of foreign countries where all MBA programs conducted recruiting activities in 2012 to attract more candidates. Full-time two-year MBA programs also conducted special outreach to prospective students in South Korea. The United States ranked third among the top countries where full-time one-year, part-time, and executive MBA programs targeted outreach efforts. Flexible MBA programs included Saudi Arabia among their top three countries for candidate recruitment.
9 In 2012, average class size, acceptance and enrollment rates, and number of applications are reported using medians. Caution should be taken when comparing 2012 results with past results, since these data often were reported using the mean in prior years.
2012 Survey Report Application Trends Survey
16 © 2012 Graduate Management Admission Council®. All rights reserved.
Figure 11. Percentage of MBA Programs That Conducted Special Outreach, 2012
*For definition of terms, see Key Survey Definitions at the back of this report.
Table 2. Top Three Candidate Types That MBA Programs Targeted for Special Outreach, 2012
Full-Time Two-Year MBA
Full-Time One-Year MBA
Part-Time MBA (All) Flexible MBA
Executive MBA Online MBA
#1 Foreign
candidates Foreign
candidates Working
professionals Undergraduate
students Working
professionals Working
professionals
#2 Women Working
professionals Women
Working professionals
Women Military
#3 Undergraduate
students Women Military
Foreign candidates
Military Undergraduate
students
Applicant Profile10
Academic Profile
Ninety percent (90%) of all MBA programs worldwide reported that the academic qualifications of this year’s applicants are equal to or stronger than those of the 2011 applicant pool. Nearly all (96%) executive MBA programs reported that their applicant pool was equally or more qualified that last year. The overwhelming majority of other MBA programs—between 87 percent and 92 percent—attracted candidates with academic profiles that matched or exceeded the qualifications of last year’s applicant pool.
10 For a complete demographic profile of 2012 MBA applicants see Table 9 at the back of this report.
12%
9%
10%
10%
18%
19%
30%
31%
38%
40%
43%
55%
No special outreach
LGBT community*
Pre-experience candidates
Underrepresented nationalities*
Entrepreneurs
Occupational specialties*
Underrepresented populations*
Military
Undergraduate students
Women
Foreign candidates
Working professionals

Application Trends Survey 2012 Survey Report
© 2012 Graduate Management Admission Council®. All rights reserved. 17
Gender
There continues to be movement toward greater gender parity within each of the MBA program types. For example, in 2012 women accounted for 39 percent of the applicant pool for full-time two-year MBA programs, up from 35 percent in 2011. The largest shift was seen among applicants to executive MBA programs. In 2012, 37 percent of executive MBA applicants were women, in contrast to 2011, when women accounted for only 27 percent of executive MBA applicants.
In 2012, women make up more than 40 percent of applicants for four MBA program types: part-time lockstep (41%), part-time self-paced11 (41%), flexible (44%), and online/distance (43%).
Age and Experience
Program findings reveal that MBA candidates for the incoming class of 2012–2013 resemble their predecessors from past years: Candidates typically are between the ages of 26 and 30 with 3 to 6 years of work experience. The exceptions continue to be candidates for executive MBA programs, who tend to be older (57% over the age of 35) and have been in the workforce more than six years.
Distance from Program12
This year, more MBA program applicants are applying to schools closer to home. For example, 31 percent of full-time two year MBA candidates reside within the same metropolitan area of the program they plan to attend, up from 26 percent in 2011. Although local candidates are a growing proportion of the 2012 applicant pool for full-time two-year MBA programs, they account for a smaller share when compared with the 39 percent of candidates to full-time two year MBA programs who are international,13 a share which decreased from 45 percent last year.
Part-time self-paced programs (83%) also reported an increase this year in their percentage of local applicants, up from 77 percent in 2011. Only nine percent of this year’s part-time self-paced MBA applicants live outside the metro area, but within the country, down from 15 percent in 2011.
Full-time one-year MBA programs have the most international applicant pool in 2012, with more than half (55%) of applicants residing outside the country where the program is administered.
11 For definition of “part-time lockstep” and “part-time self-paced” MBA program, see Key Survey Definitions at the back of this report.
12 Distance from program refers to the location where applicants currently reside, and not to their country of citizenship.
13 The term “international” is defined by applicant residence, not by citizenship. See Key Survey Definitions for more information.

2012 Survey Report Application Trends Survey
18 © 2012 Graduate Management Admission Council®. All rights reserved.
Foreign Candidate Pool
Foreign candidates represent 33 percent of the application volume for all MBA programs in 2012 (Figure 12). Among the various regions, programs in Europe boast the greatest showing of foreign candidates (61%).
Figure 12. Percentage of MBA Applicants, by Citizenship and World Region, 2012
Change in Foreign Applications Received in 2012, by Citizenship and
Percentage of MBA Programs14
Foreign Countries as Source of:
Greatest Volume Increase in Applications
China: 31% of programs
India: 16% of programs
Saudi Arabia: 8% of programs15
Greatest Volume Decrease in Applications
India: 29% of programs
China: 7% of programs
Taiwan: 5% of programs
Greatest Number of Applications
India: 43% of programs
China: 27% of programs
United States: 6% of programs
The full-time one-year MBA applicant pool has the greatest proportion of foreign applicants of all program types; 61 percent of candidates to these programs are foreign citizens. Online/distance and part-time programs have a much lower 13 percent of candidates, but the lowest is part-time lock-step MBA programs at 10 percent of applicants.
Worldwide, Indian, Chinese, and US citizens accounted for the greatest number of foreign applicants to MBA programs for 43 percent, 27 percent, and 6 percent of MBA programs, respectively. Chinese citizens also accounted for the greatest increase in application volume for MBA programs globally, as reported by 31 percent of MBA programs, followed by Indian and Saudi Arabian citizens, reported by 16 percent and 8 percent of MBA programs, respectively.
14 Countries discussed here as sources of greatest application volume increase/decrease or number of foreign applicants in 2012 were those reported by the greatest percentage of programs. Numerous other countries across all world regions were reported by smaller numbers of programs. These findings were provided to participating programs in a separate report prepared exclusively for survey respondents.
15 The Saudi government launched a scholarship program (KASP) in 2005 that provides funding for more than 125,000 undergraduate and graduate students to attend programs abroad. For more information, see References.
67%
97%
70% 68%
39%33%
3%
30% 32%
61%
0%
20%
40%
60%
80%
100%
Worldwide Central Asia UnitedStates
Asia-Pacific Europe
Perc
enta
ge o
f a
pp
lica
nts
Domestic Foreign

Application Trends Survey 2012 Survey Report
© 2012 Graduate Management Admission Council®. All rights reserved. 19
Foreign Applicants to MBA Programs, by Region16
All Asia
Across all of Asia, 34 percent of MBA programs indicated that Indian citizens accounted for their greatest number of foreign applications in 2012.
In 2012, 14 percent of MBA programs across Asia saw the greatest increase in foreign application volume from India.
Europe17
Citizens of India and Russia accounted for the greatest number of foreign applications in 2012 to MBA programs in Europe, as reported by 59 percent and 9 percent of programs, respectively.
In 2012, 17 percent of MBA programs in Europe saw the greatest increase in foreign application volume each from China and India.
Although Indian citizens represented the greatest number of foreign applications to European MBA programs, they also accounted for the greatest decrease in application volume for 28 percent of European MBA programs.
United States
US MBA programs reported that citizens of India (44% of programs), China (35% of programs), and Saudi Arabia (7% of programs) accounted for the greatest number of foreign applications in 2012.
In 2012, MBA programs in the United States saw their greatest increase in foreign application volume from China (40% of programs), India (16%), and Saudi Arabia (12%).
US MBA programs also reported their greatest decrease in foreign application volume was from India (34% of programs), China (8%), and Taiwan (7%)
Tuition Assistance
Scholarships and assistantships are the most common types of financial assistance that MBA programs will offer to their incoming 2012–2013 class. The vast majority of full-time two-year MBA programs (86%) and full-time one-year MBA programs (84%) and 65 percent of flexible MBA programs will offer scholarships this year to incoming students. Other types of financial aid will also be made available to incoming students of the 2012–2013 class and vary by program. Table 3 displays the top three types of tuition assistance that MBA programs expect to offer this year.
A large share of MBA programs will offer no tuition assistance this year, notably 52 percent of online/distance MBA programs, 46 percent of executive MBA, and 40 percent of part-time MBA programs.
16 Regional findings are limited to all Asia (Asia-Pacific and Central Asia combined), Europe, and the United States.
17 Since 2009, several European countries including Sweden and Finland have instituted laws establishing tuition and application fees for students from outside the EU and EEA and in 2011, the United Kingdom made changes to the student visa system. For more information see the References section of this report.

2012 Survey Report Application Trends Survey
20 © 2012 Graduate Management Admission Council®. All rights reserved.
Table 3. Top Three Types of Tuition Assistance Offered to Incoming 2012 MBA Students, by Percentage of Programs
Full-Time Two--
Year MBA Full-Time One-
Year MBA Part-Time MBA
(All) Flexible MBA Executive MBA Online/Distance
MBA
#1 Scholarships
(86%) Scholarships
(84%) Scholarships
(38%) Assistantships
(79%) Scholarships
(36%) Scholarships
(30%)
#2 Assistantships
(42%) Assistantships
(30%)
Reduced tuition
(18%)
Scholarships (65%)
Reduced tuition
(19%)
Assistantships (19%)
#3 Fellowships
(24%)
Reduced tuition
(21%)
Assistantships
(15%)
Reduced tuition (25%)
Assistantships
(3%)
Reduced tuition
(4%)
Fellowships (3%) On-campus
work-study
(4%) On-campus work study
(3%)
None 4% 6% 40% 2% 46% 52%
Employer Funding
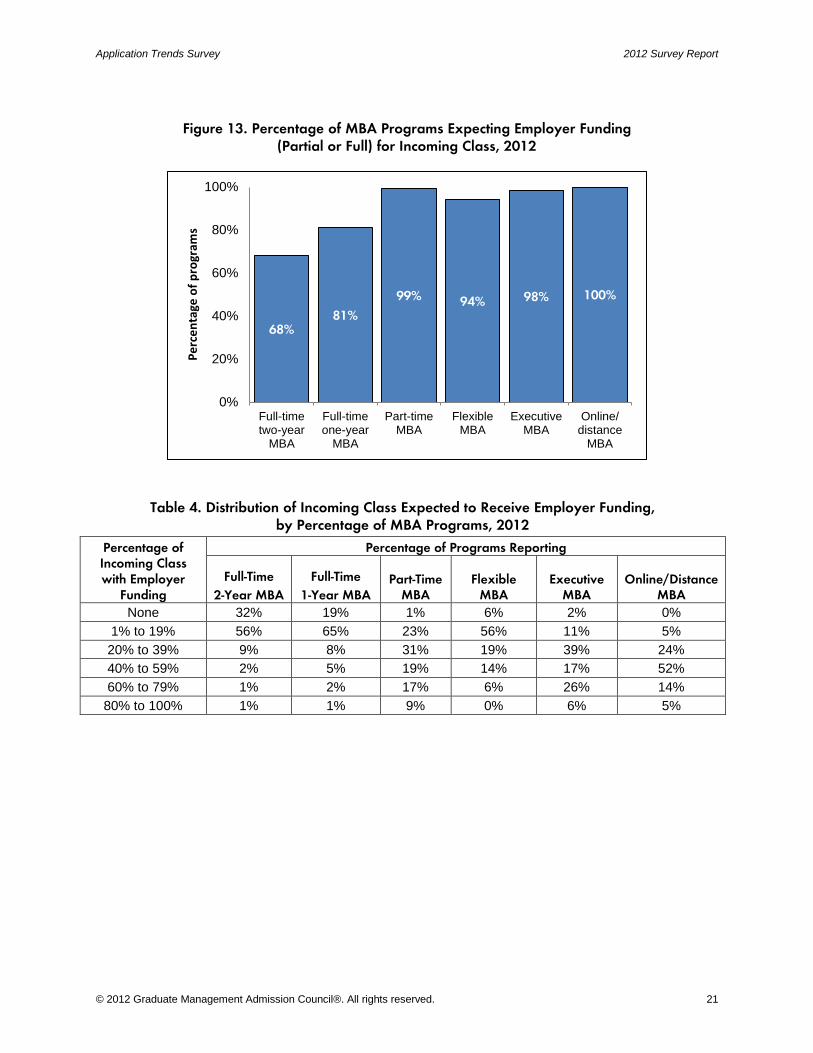
This year, for the first time, the Application Trends Survey asked respondents for information about anticipated levels of employer funding for incoming students. Overall, 77 percent of MBA programs indicated that at least some of their students enrolling in the class of 2012–2013 will receive funding (partial or in full) from their employers (Figure 13).
The expected level of employer funding for the incoming class varies widely by program type. Sixty-eight percent of full-time two-year MBA programs reported they expect some of their students to receive employer funding, but the majority of these programs (56%) reported that fewer than 20 percent of their students will receive employer funding (Table 4). Similarly, 81 percent of full-time one-year MBA programs expect that some of their incoming students will receive employer funding, however, two-thirds (65%) of the programs reported that fewer than 20 percent of students will receive such funding.
Students enrolled in online/distance MBA programs are more likely than incoming students in all other MBA programs to receive employer funding. The majority of online/distance MBA programs (52%) reported that between 40 percent and 59 percent of their incoming class will receive employer funding. And, not surprisingly, nearly half (49%) of executive MBA programs expect that between 40 percent and 100 percent of incoming students will receive funding through their employers.
Application Trends Survey 2012 Survey Report
© 2012 Graduate Management Admission Council®. All rights reserved. 21
Figure 13. Percentage of MBA Programs Expecting Employer Funding (Partial or Full) for Incoming Class, 2012
Table 4. Distribution of Incoming Class Expected to Receive Employer Funding, by Percentage of MBA Programs, 2012
Percentage of Incoming Class with Employer
Funding
Percentage of Programs Reporting
Full-Time
2-Year MBA
Full-Time
1-Year MBA Part-Time
MBA Flexible
MBA Executive
MBA Online/Distance
MBA
None 32% 19% 1% 6% 2% 0%
1% to 19% 56% 65% 23% 56% 11% 5%
20% to 39% 9% 8% 31% 19% 39% 24%
40% to 59% 2% 5% 19% 14% 17% 52%
60% to 79% 1% 2% 17% 6% 26% 14%
80% to 100% 1% 1% 9% 0% 6% 5%
68%81%
99% 94% 98% 100%
0%
20%
40%
60%
80%
100%
Full-timetwo-year
MBA
Full-timeone-year
MBA
Part-timeMBA
FlexibleMBA
ExecutiveMBA
Online/distance
MBA
Pe
rce
nta
ge o
f p
rogr
ams
2012 Survey Report Application Trends Survey
22 © 2012 Graduate Management Admission Council®. All rights reserved.
Trends for Master’s and PhD Programs
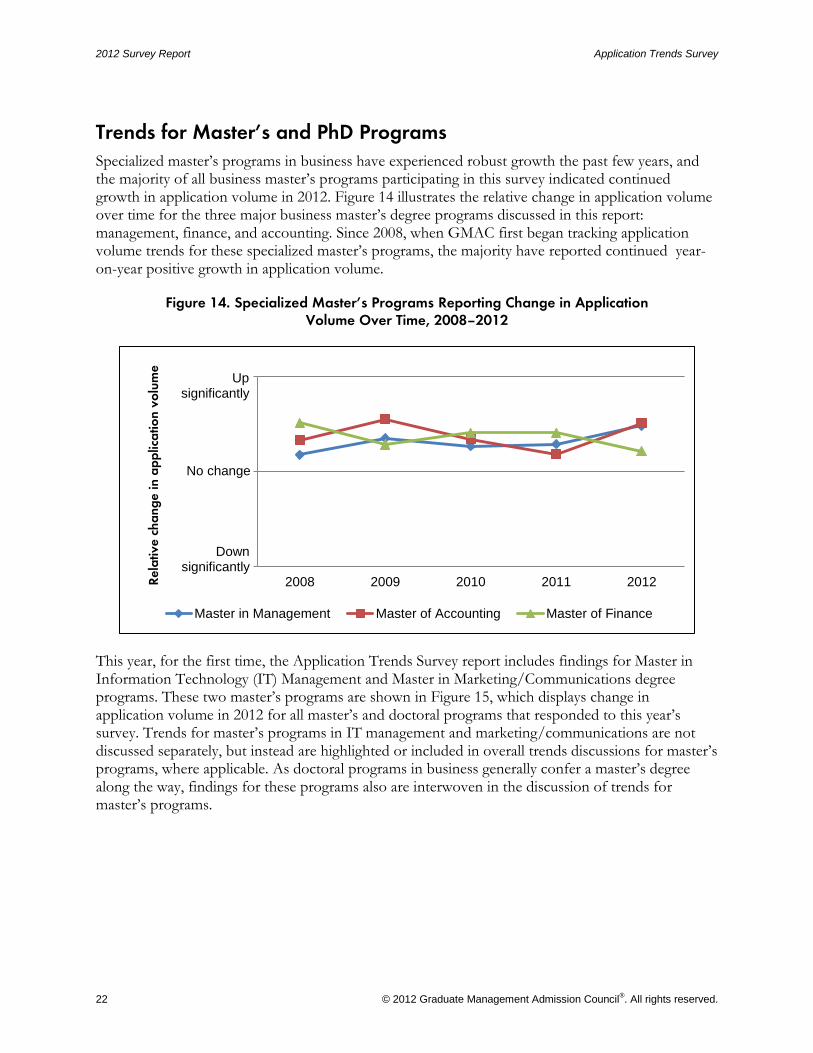
Specialized master’s programs in business have experienced robust growth the past few years, and the majority of all business master’s programs participating in this survey indicated continued growth in application volume in 2012. Figure 14 illustrates the relative change in application volume over time for the three major business master’s degree programs discussed in this report: management, finance, and accounting. Since 2008, when GMAC first began tracking application volume trends for these specialized master’s programs, the majority have reported continued year-on-year positive growth in application volume.
Figure 14. Specialized Master’s Programs Reporting Change in Application Volume Over Time, 2008–2012
This year, for the first time, the Application Trends Survey report includes findings for Master in Information Technology (IT) Management and Master in Marketing/Communications degree programs. These two master’s programs are shown in Figure 15, which displays change in application volume in 2012 for all master’s and doctoral programs that responded to this year’s survey. Trends for master’s programs in IT management and marketing/communications are not discussed separately, but instead are highlighted or included in overall trends discussions for master’s programs, where applicable. As doctoral programs in business generally confer a master’s degree along the way, findings for these programs also are interwoven in the discussion of trends for master’s programs.
2008 2009 2010 2011 2012Rela
tive c
ha
ng
e in a
pp
lica
tio
n v
olu
me
Master in Management Master of Accounting Master of Finance
Up significantly
Down significantly
No change
Application Trends Survey 2012 Survey Report
© 2012 Graduate Management Admission Council®. All rights reserved. 23
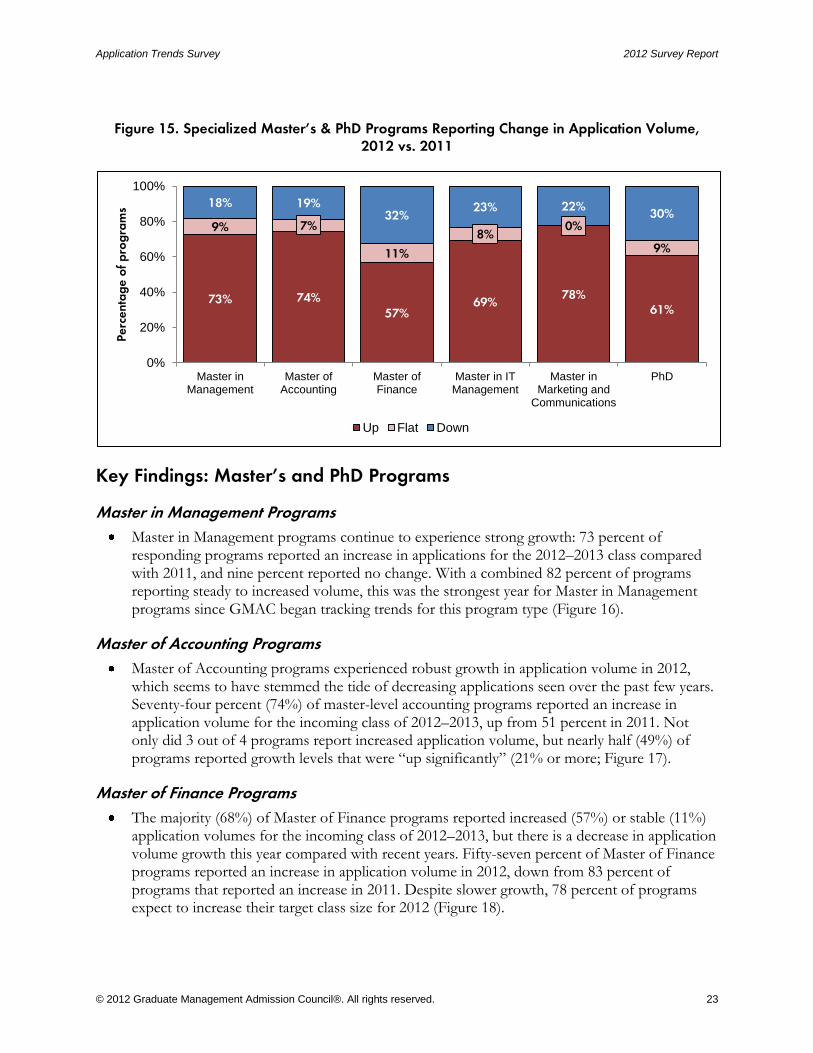
Figure 15. Specialized Master’s & PhD Programs Reporting Change in Application Volume, 2012 vs. 2011
Key Findings: Master’s and PhD Programs
Master in Management Programs
Master in Management programs continue to experience strong growth: 73 percent of responding programs reported an increase in applications for the 2012–2013 class compared with 2011, and nine percent reported no change. With a combined 82 percent of programs reporting steady to increased volume, this was the strongest year for Master in Management programs since GMAC began tracking trends for this program type (Figure 16).
Master of Accounting Programs
Master of Accounting programs experienced robust growth in application volume in 2012, which seems to have stemmed the tide of decreasing applications seen over the past few years. Seventy-four percent (74%) of master-level accounting programs reported an increase in application volume for the incoming class of 2012–2013, up from 51 percent in 2011. Not only did 3 out of 4 programs report increased application volume, but nearly half (49%) of programs reported growth levels that were “up significantly” (21% or more; Figure 17).
Master of Finance Programs
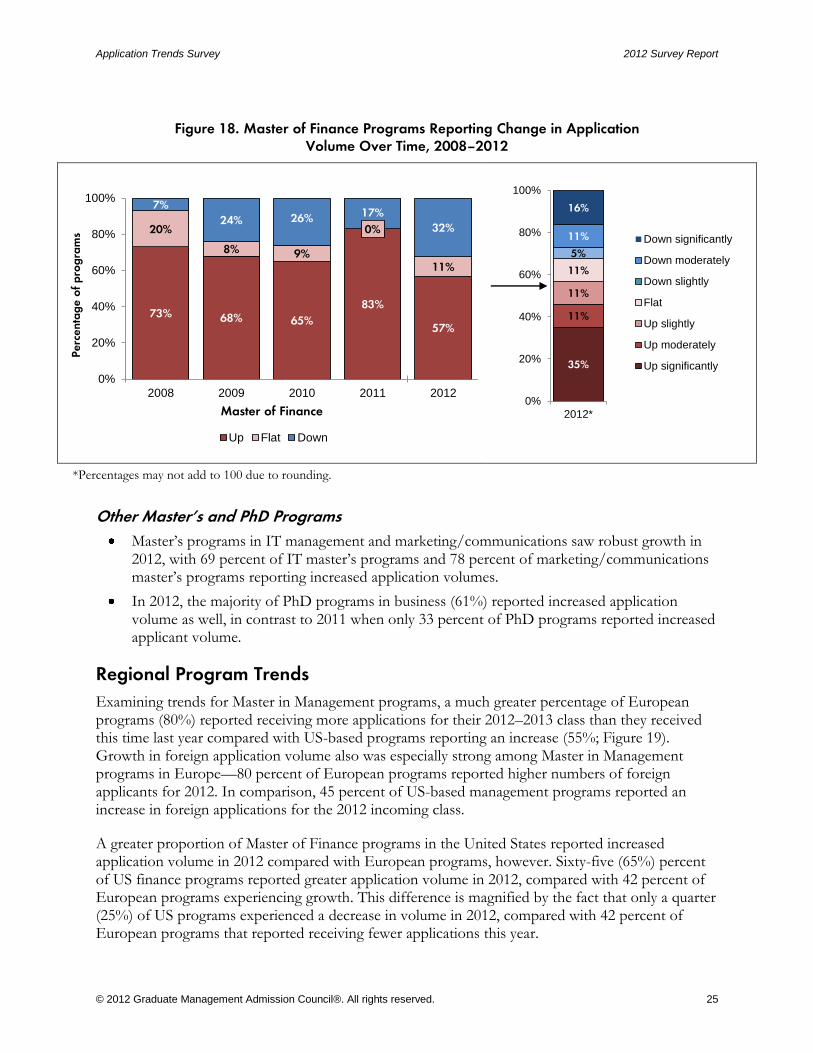
The majority (68%) of Master of Finance programs reported increased (57%) or stable (11%) application volumes for the incoming class of 2012–2013, but there is a decrease in application volume growth this year compared with recent years. Fifty-seven percent of Master of Finance programs reported an increase in application volume in 2012, down from 83 percent of programs that reported an increase in 2011. Despite slower growth, 78 percent of programs expect to increase their target class size for 2012 (Figure 18).
73% 74%57%
69%78%
61%
9% 7%
11%
8%0%
9%
18% 19%32%
23% 22%30%
0%
20%
40%
60%
80%
100%
Master inManagement
Master ofAccounting
Master ofFinance
Master in ITManagement
Master inMarketing and
Communications
PhD
Perc
enta
ge o
f p
rog
ram
s
Up Flat Down

2012 Survey Report Application Trends Survey
24 © 2012 Graduate Management Admission Council®. All rights reserved.
Figure 16. Master in Management Programs Reporting Change in Application Volume Over Time, 2008–2012
*Percentages may not add to 100 due to rounding.
Figure 17. Master of Accounting Programs Reporting Change in Application Volume Over Time, 2008–2012
*Percentages may not add to 100 due to rounding.
63% 63% 62%69% 73%
0%13%
7%3%
9%38%
25% 31% 28%18%
0%
20%
40%
60%
80%
100%
2008 2009 2010 2011 2012
Perc
enta
ge o
f p
rog
ram
s
Master in Management programs
Up Flat Down
48%
9%
15%
9%
6%6%6%
0%
20%
40%
60%
80%
100%
2012*
Down significantly
Down moderately
Down slightly
Flat
Up slightly
Up moderately
Up significantly
65%78%
62%51%
74%
14%
9%
11%
13%
7%
21%13%
28%36%
19%
0%
20%
40%
60%
80%
100%
2008 2009 2010 2011 2012
Perc
enta
ge o
f p
rog
ram
s
Up Flat Down
Master of Accounting
49%
19%
7%7%2%
12%
5%
0%
20%
40%
60%
80%
100%
2012*
Down significantly
Down moderately
Down slightly
Flat
Up slightly
Up moderately
Up significantly
Application Trends Survey 2012 Survey Report
© 2012 Graduate Management Admission Council®. All rights reserved. 25
Figure 18. Master of Finance Programs Reporting Change in Application Volume Over Time, 2008–2012
*Percentages may not add to 100 due to rounding.
Other Master’s and PhD Programs
Master’s programs in IT management and marketing/communications saw robust growth in 2012, with 69 percent of IT master’s programs and 78 percent of marketing/communications master’s programs reporting increased application volumes.
In 2012, the majority of PhD programs in business (61%) reported increased application volume as well, in contrast to 2011 when only 33 percent of PhD programs reported increased applicant volume.
Regional Program Trends
Examining trends for Master in Management programs, a much greater percentage of European programs (80%) reported receiving more applications for their 2012–2013 class than they received this time last year compared with US-based programs reporting an increase (55%; Figure 19). Growth in foreign application volume also was especially strong among Master in Management programs in Europe—80 percent of European programs reported higher numbers of foreign applicants for 2012. In comparison, 45 percent of US-based management programs reported an increase in foreign applications for the 2012 incoming class.
A greater proportion of Master of Finance programs in the United States reported increased application volume in 2012 compared with European programs, however. Sixty-five (65%) percent of US finance programs reported greater application volume in 2012, compared with 42 percent of European programs experiencing growth. This difference is magnified by the fact that only a quarter (25%) of US programs experienced a decrease in volume in 2012, compared with 42 percent of European programs that reported receiving fewer applications this year.
73% 68% 65%
83%
57%
20%
8% 9%
0%
11%
7%
24% 26% 17%
32%
0%
20%
40%
60%
80%
100%
2008 2009 2010 2011 2012
Perc
enta
ge o
f p
rog
ram
s
Up Flat Down
Master of Finance
35%
11%
11%
11%
5%
11%
16%
0%
20%
40%
60%
80%
100%
2012*
Down significantly
Down moderately
Down slightly
Flat
Up slightly
Up moderately
Up significantly
2012 Survey Report Application Trends Survey
26 © 2012 Graduate Management Admission Council®. All rights reserved.
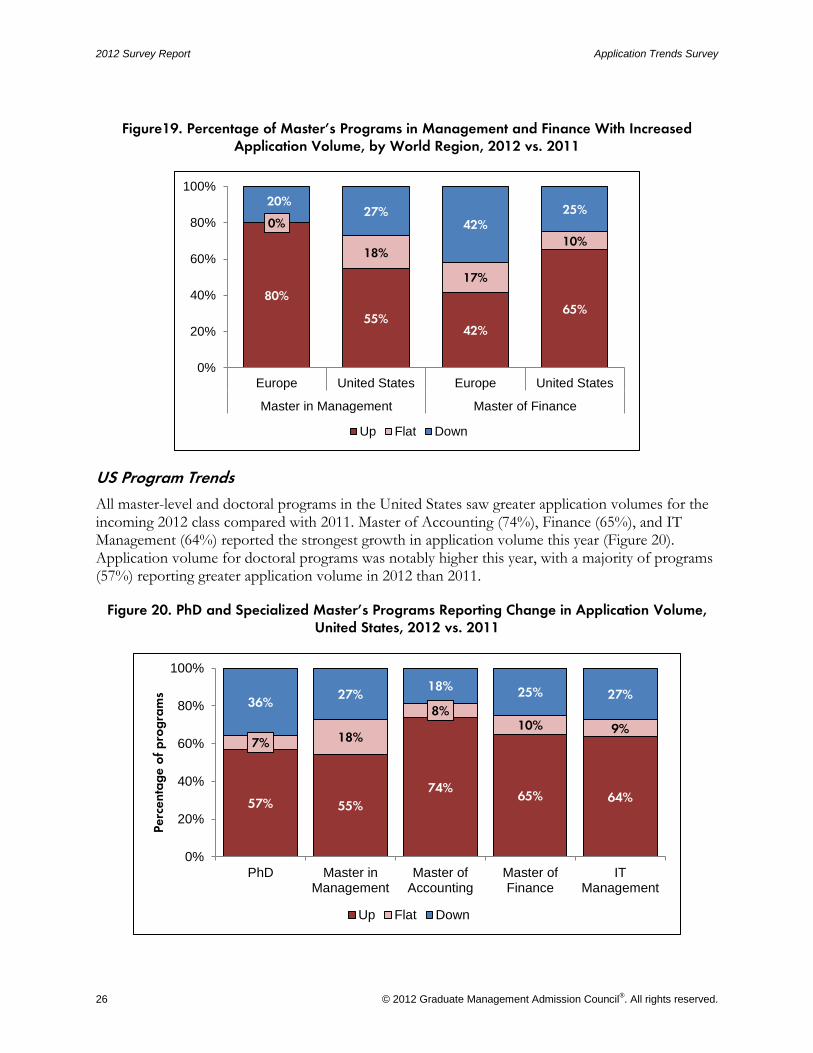
Figure19. Percentage of Master’s Programs in Management and Finance With Increased Application Volume, by World Region, 2012 vs. 2011
US Program Trends
All master-level and doctoral programs in the United States saw greater application volumes for the incoming 2012 class compared with 2011. Master of Accounting (74%), Finance (65%), and IT Management (64%) reported the strongest growth in application volume this year (Figure 20). Application volume for doctoral programs was notably higher this year, with a majority of programs (57%) reporting greater application volume in 2012 than 2011.
Figure 20. PhD and Specialized Master’s Programs Reporting Change in Application Volume, United States, 2012 vs. 2011
80%
55%42%
65%
0%
18%
17%
10%
20%27%
42%25%
0%
20%
40%
60%
80%
100%
Europe United States Europe United States
Master in Management Master of Finance
Up Flat Down
57% 55%
74%65% 64%
7% 18%
8%10% 9%
36%27%
18% 25% 27%
0%
20%
40%
60%
80%
100%
PhD Master inManagement
Master ofAccounting
Master ofFinance
ITManagement
Perc
enta
ge o
f p
rog
ram
s
Up Flat Down

Application Trends Survey 2012 Survey Report
© 2012 Graduate Management Admission Council®. All rights reserved. 27
The term foreign refers to applicants who are not citizens of the country where the program is located.
The term domestic refers to applicants who are citizens of the country where a program is located.
Demographic Trends in Application Volume
Changes in application volume in 2012 for specialized master’s in business and doctoral programs reflect significant variation based on a number of applicant characteristics (Figure 21)
Citizenship (Domestic)
On the whole, the majority of specialized master’s programs saw varying degrees of change in their application volume this year from domestic candidates. A majority (58%) of Master of Accounting programs and 61 percent of Master in Marketing/Communication programs reported their strongest growth in 2012 in domestic application volume compared with other master’s programs.
Forty-seven percent of Master in Management programs saw increased application volume from domestic candidates, compared with 28 percent that experienced decreasing volume.
The majority (53%) of Master of Finance programs experienced a decrease in domestic volume, but 42 percent reported increased volume.
Thirty-eight percent of Master in IT Management programs saw increased domestic volume while nearly half (46%) saw decreases in domestic applications.
One-third (32%) of PhD programs saw increased volume from domestic applicants, yet 45 percent of programs experienced a decrease from this group.
Citizenship (Foreign)
Two-thirds (67%) of Master in Management programs, 65 percent of Master of Accounting programs, and 75 percent of Master of Marketing/Communication programs reported greater application volume from foreign citizens in 2012 compared with last year.
Gender
The majority of master’s programs experienced strong application growth from men. Master’s programs in management (52%), accounting (63%), finance (63%), IT management (69%), and marketing/communications (53%) received a greater number of applications from male candidates in 2012 than they did in 2011. Doctoral programs reported stable application volume among men, with 48 percent of programs seeing increased volume, and 48 percent reporting decreases in male applications.
The majority of master-level programs of accounting (57%), finance (54%), IT management (54%), and marketing/communications (71%) reported increased application volume in 2012 from women as well. Both Master in Management programs (48%) and PhD (48%) programs received more applications from women this year than in 2011, but 16 percent of Master in Management programs and 38 percent of doctoral programs saw a decrease in applications from women in 2012.

2012 Survey Report Application Trends Survey
28 © 2012 Graduate Management Admission Council®. All rights reserved.
Figure 21. Specialized Master’s Programs Reporting Change in Application Volume, by Citizenship, 2012
Underrepresented US Populations18
Forty-two percent (42%) of all specialized business master’s programs in the United States reported increased volume from underrepresented minority populations in 2012, with just a quarter (25%) of programs reporting a decrease. Although the percentage of finance (40%) and accounting (44%) programs that reported increased volume was similar, a greater share of finance programs saw decreasing application volume (40%) compared with accounting programs (16%).
18 For a definition of “underrepresented populations” see Key Survey Definitions at the back of this report.
47%
67%58% 65%
42%
63%
25%
12%12%
16%
6%
6%
28% 21%30%
19%
53%
31%
0%
20%
40%
60%
80%
100%
Domestic Foreign Domestic Foreign Domestic Foreign
Master inManagement
Master ofAccounting
Master ofFinance
Perc
enta
ge o
f p
rog
ram
s
38%54% 61%
75%
32%
55%
15%
23% 6%
19%
23%
18%
46%
23%33%
6%
45%27%
0%
20%
40%
60%
80%
100%
Domestic Foreign Domestic Foreign Domestic Foreign
IT Management Master in Marketing/Communications
PhD
Perc
enta
ge o
f p
rog
ram
s
Up Flat Down

Application Trends Survey 2012 Survey Report
© 2012 Graduate Management Admission Council®. All rights reserved. 29
Program Size
Globally, across all business master’s programs, two-thirds of programs have increased their targeted class size for 2012–2013 compared with 2011. The median class size for master’s programs in management, accounting, and finance ranges from 40 (finance programs) to 45 (accounting and finance). Master’s programs in IT management have the lowest expected median class size of all master’s programs, estimated at 20 seats per program (Table 5).
Table 5. Application Summary Data for Master’s and PhD Programs in 2012
PhD Master in
Management Master of
Accounting Master of Finance
Master of IT Management
Master in Marketing &
Communications
Number of programs (2012) 24 33 45 39 14 18
Median number of applications
19 66 73 116 216 29 84
2012-2013 expected class size (median) 8 45 45 40 20 31
2011-2012 actual class size (median) 7 40 39 34 17 27
Median acceptance rate 17% 61% 61% 47% 61% 55%
Median enrollment rate 59% 61% 75% 50% 56% 56%
Outreach Efforts
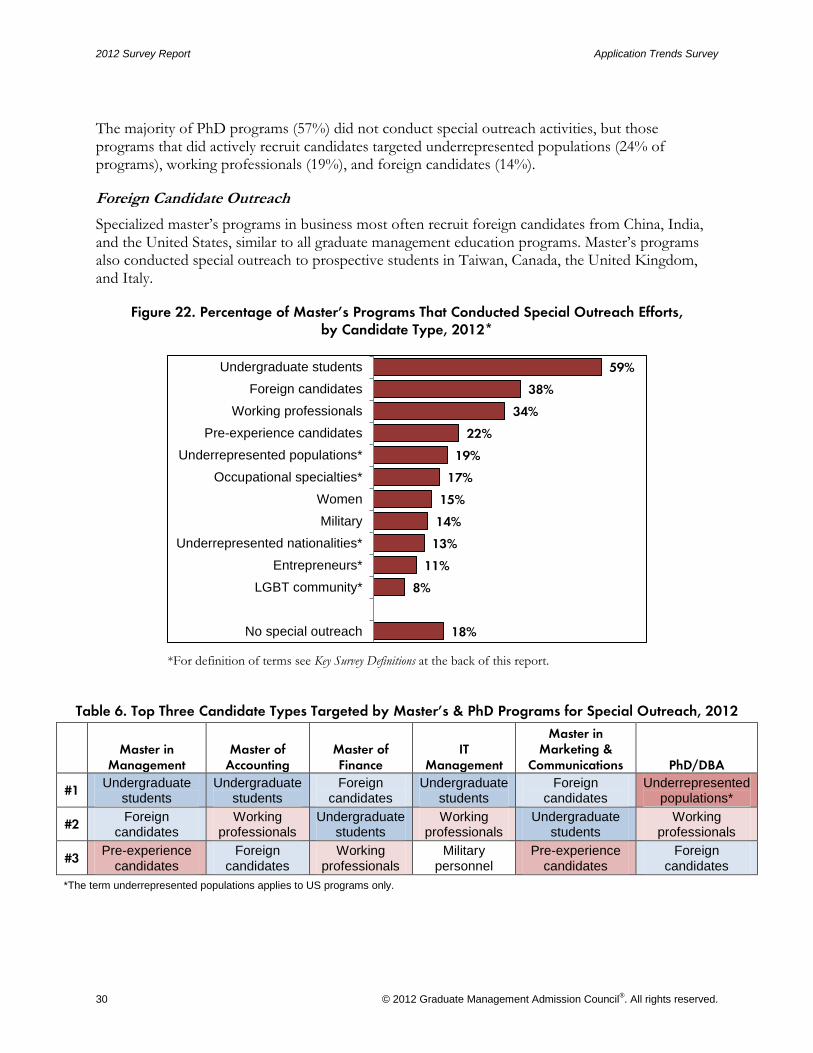
Overall, 82 percent of master’s in business programs conducted special outreach activities in 2012 to attract more candidates (Figure 22). Undergraduate students were the most commonly recruited subgroup among all master’s programs, targeted by 59 percent of programs, followed by foreign candidates (38%), and working professionals (34%).
There were variations in the different populations that master’s programs targeted for recruitment (Table 6). Undergraduate students were recruited most heavily by master’s programs in IT management (75%) and accounting (74%). Master’s programs in IT management also sought working professionals (75%) more often than other master’s programs.
Master’s programs in finance (56%) and marketing/communications (56%) conducted special outreach most frequently to attract foreign candidates.
19 In 2012, average class size, acceptance and enrollment rates, and number of applications are reported using medians. Caution should be taken when comparing 2012 results with past results, since these data often were reported using the mean in prior years.
2012 Survey Report Application Trends Survey
30 © 2012 Graduate Management Admission Council®. All rights reserved.
The majority of PhD programs (57%) did not conduct special outreach activities, but those programs that did actively recruit candidates targeted underrepresented populations (24% of programs), working professionals (19%), and foreign candidates (14%).
Foreign Candidate Outreach
Specialized master’s programs in business most often recruit foreign candidates from China, India, and the United States, similar to all graduate management education programs. Master’s programs also conducted special outreach to prospective students in Taiwan, Canada, the United Kingdom, and Italy.
Figure 22. Percentage of Master’s Programs That Conducted Special Outreach Efforts, by Candidate Type, 2012*
*For definition of terms see Key Survey Definitions at the back of this report.
Table 6. Top Three Candidate Types Targeted by Master’s & PhD Programs for Special Outreach, 2012
Master in Management
Master of Accounting
Master of Finance
IT Management
Master in Marketing &
Communications PhD/DBA
#1 Undergraduate
students Undergraduate
students Foreign
candidates Undergraduate
students Foreign
candidates Underrepresented
populations*
#2 Foreign
candidates Working
professionals Undergraduate
students Working
professionals Undergraduate
students Working
professionals
#3 Pre-experience
candidates Foreign
candidates Working
professionals Military
personnel Pre-experience
candidates Foreign
candidates
*The term underrepresented populations applies to US programs only.
18%
8%
11%
13%
14%
15%
17%
19%
22%
34%
38%
59%
No special outreach
LGBT community*
Entrepreneurs*
Underrepresented nationalities*
Military
Women
Occupational specialties*
Underrepresented populations*
Pre-experience candidates
Working professionals
Foreign candidates
Undergraduate students
Application Trends Survey 2012 Survey Report
© 2012 Graduate Management Admission Council®. All rights reserved. 31
Applicant Profile20
Academic Profile
On average, 95 percent of master’s programs and all (100%) doctoral (PhD) programs as well as marketing/communications, and finance master’s programs reported that their applicant pool in 2012 was equally or more academically qualified than last year’s applicants.
Gender
More than half (52%) of applicants to master’s programs are women;21 but the proportion of applications received varies by program type. Master’s programs in marketing/communications received the highest percentage of applications from women (63%); IT Management programs (40%), on the other hand, had the lowest proportion of women.22
Similar to the trend seen among MBA programs, women continue to account for a growing percentage of the applicant pool for master’s programs. In 2012, 46 percent of Master of Finance applicants were women, up from 42 percent in 2011. This year, 40 percent of PhD applicants are women, up from 35 percent in 2011.
Age and Work Experience
Demographic data reported by participating master’s programs continue to show that applicants to master’s programs represent a distinctly different cohort of candidates compared with MBA applicants. The majority of applicants to master’s programs in management (75%), accounting (81%), and finance (76%) are 25 years old or younger, and most applicants to specialized degree programs have fewer years of work experience than applicants to MBA programs. The average percentage of applicants with less than one year of prior work experience ranges from 59 percent for applicants to management and finance programs up to a high of 70 percent for candidates to accounting programs.
Distance From Program23
In 2012, more applicants to Master in Management programs are staying close to home compared with last year. Thirty percent of the incoming students to the 2012 class reside within the local or metropolitan area of the program they plan to attend, up from 24 percent in 2011. Meanwhile, international students still make up more than half of the applicant pool (53%) to Master in
20 For a complete profile of 2012 master’s and PhD applicants by program type, age, gender, work experience, academic qualifications, and more see Table 10 at the back of this report.
21 This average includes master’s programs in management, accounting, finance, IT management, marketing/communications, and ‘other business masters’ programs only. When PhD applicants are included, the average changes to 50 percent men, 50 percent women.
22 Gender data for Master in IT Managament and Master in Marketing/Communications programs are available only for
2012.
23 The terms “local,” “national,” and “international” refer to the applicants’ current location of residence, and not to their citizenship.
2012 Survey Report Application Trends Survey
32 © 2012 Graduate Management Admission Council®. All rights reserved.
Management programs, although this is down from 60 percent in 2011. European programs typically receive more international applications than US programs receive and that was true in 2012 (72% versus 44%, respectively). European survey respondents further reported that 46 percent of their international applicants in 2012 live outside of Europe.
More applicants to Master of Accounting programs are targeting schools outside their local residential area this year. Only a third (34%) of accounting applicants lives locally near their chosen program, down from 48 percent in 2011. About a third (31%) of accounting applicants to the class of 2012, however, currently live in the same country (nationally) as their selected program, but outside the local or metropolitan area of the school. This is double the proportion of national applicants (16%) seen in 2011.
Unlike Master in Management and accounting programs, which have larger local and national applicant pools, the majority of applicants to Master of Finance programs worldwide (65%) are international (living outside the country where the program is administered). This is most pronounced for US finance programs, which indicated that nearly three-quarters (74%) of their applicants in 2012 are international students.
Foreign Candidate Pool
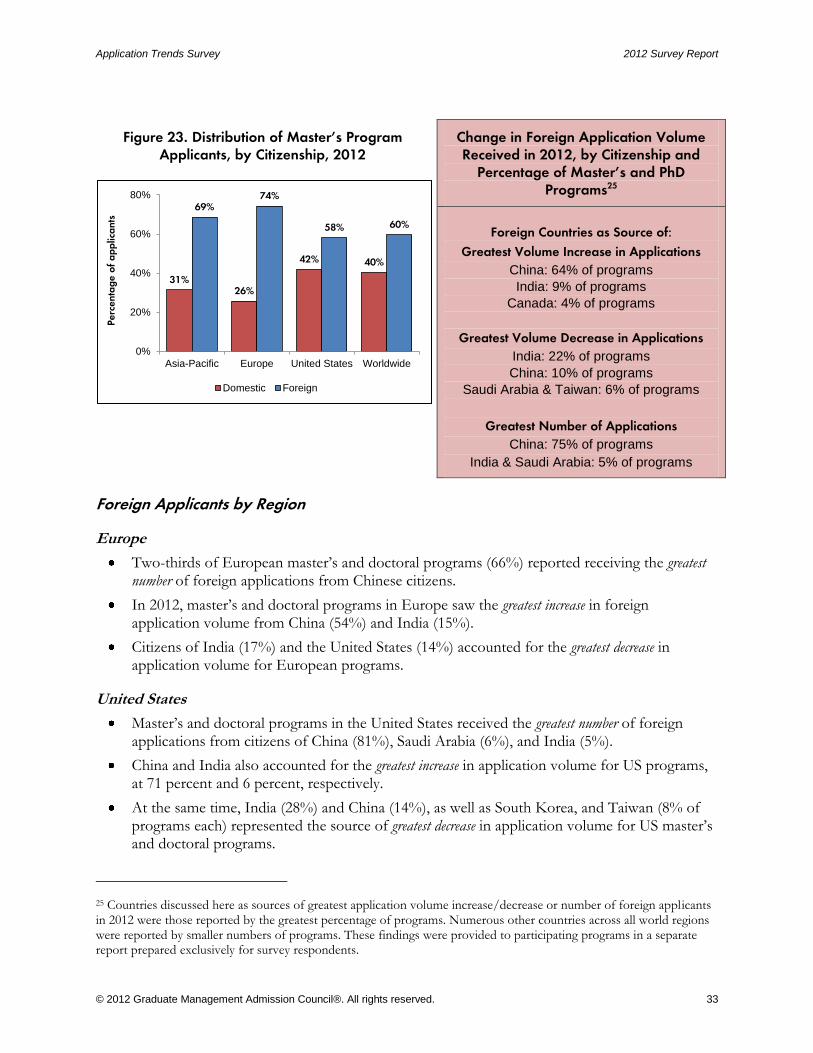
Foreign candidates represent 60 percent of the application volume for all master’s programs in 2012 (Figure 23).24 Master of Finance programs have the greatest proportion of foreign applicants (78%), followed by IT management (56%), marketing/communication (56%), and management (55%). Foreign citizens represent half (50%) of the Master in Accounting applicant pool, and 64 percent of PhD applicants are foreign candidates.
Worldwide, master’s and doctoral programs report a geographic draw of foreign citizens similar to that seen by MBA programs, with Chinese (75%) citizens accounting for the greatest number of foreign applicants.
24 This percentage includes master’s programs in management, accounting, finance, IT management, and marketing/ communications. When all other master’s programs are included, the average changes to 56 percent of application volume.
Application Trends Survey 2012 Survey Report
© 2012 Graduate Management Admission Council®. All rights reserved. 33
Figure 23. Distribution of Master’s Program Applicants, by Citizenship, 2012
Change in Foreign Application Volume Received in 2012, by Citizenship and
Percentage of Master’s and PhD Programs25
Foreign Countries as Source of:
Greatest Volume Increase in Applications
China: 64% of programs
India: 9% of programs
Canada: 4% of programs
Greatest Volume Decrease in Applications
India: 22% of programs
China: 10% of programs
Saudi Arabia & Taiwan: 6% of programs
Greatest Number of Applications
China: 75% of programs
India & Saudi Arabia: 5% of programs
Foreign Applicants by Region
Europe
Two-thirds of European master’s and doctoral programs (66%) reported receiving the greatest number of foreign applications from Chinese citizens.
In 2012, master’s and doctoral programs in Europe saw the greatest increase in foreign application volume from China (54%) and India (15%).
Citizens of India (17%) and the United States (14%) accounted for the greatest decrease in application volume for European programs.
United States
Master’s and doctoral programs in the United States received the greatest number of foreign applications from citizens of China (81%), Saudi Arabia (6%), and India (5%).
China and India also accounted for the greatest increase in application volume for US programs, at 71 percent and 6 percent, respectively.
At the same time, India (28%) and China (14%), as well as South Korea, and Taiwan (8% of programs each) represented the source of greatest decrease in application volume for US master’s and doctoral programs.
25 Countries discussed here as sources of greatest application volume increase/decrease or number of foreign applicants in 2012 were those reported by the greatest percentage of programs. Numerous other countries across all world regions were reported by smaller numbers of programs. These findings were provided to participating programs in a separate report prepared exclusively for survey respondents.
31%26%
42% 40%
69%74%
58% 60%
0%
20%
40%
60%
80%
Asia-Pacific Europe United States Worldwide
Perc
enta
ge o
f a
pp
lica
nts
Domestic Foreign

2012 Survey Report Application Trends Survey
34 © 2012 Graduate Management Admission Council®. All rights reserved.
Tuition Assistance
Nearly all master’s and doctoral programs in business worldwide will offer one or more types of tuition assistance to incoming students in 2012, most likely in the form of scholarships at master’s programs in marketing/communications (87%), management (74%), finance (75%), and accounting (72%; Table 7). More than half of master’s programs in accounting (62%) and doctoral programs (52%) also offer assistantships. Between a quarter and a third of master’s programs also offer applicants opportunities for reduced tuition.
Table 7. Top Three Types of Tuition Assistance Offered to Incoming 2012 Master’s Students, by Percentage of Programs
PhD
Master in Management
Master of Accounting Master of Finance
Master of IT Management
Master in Marketing/
Communications
#1 Assistantships
(52%) Scholarships
(74%) Scholarships
(72%) Scholarships
(75%) Scholarships
(54%) Scholarships
(87%)
#2 Scholarships
(48%)
Reduced tuition
(29%) Assistantships (62%)
Assistantships (36%)
Reduced tuition
(31%)
Reduced
tuition
(33%) Assistantships (29%)
#3
Fellowships (43%) Fellowships
(10%)
Reduced tuition
(33%)
Reduced
tuition
(25%)
Assistantships (31%)
Assistantships (27%)
Stipends (43%)
None 13% 13% 3% 8% 15% 7%
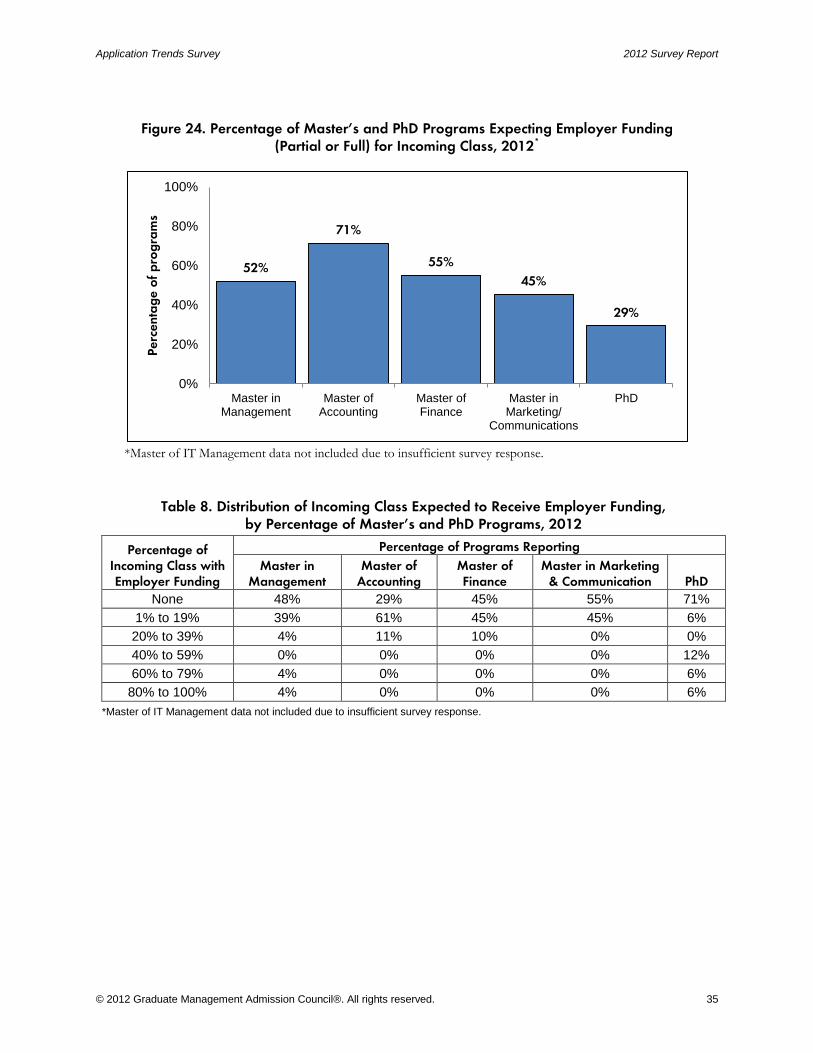
Employer Funding
Overall, 56 percent of master’s and 29 percent of PhD programs estimate that at least some of the students enrolling in their programs in 2012 will receive funding (partial or in full) from their employers (Figure 24). Although 71 percent of Master of Accounting programs reported that they expect some of their students to receive employer funding, the majority of these programs (61%) reported that fewer than 20 percent of their incoming 2012 students will receive such funding (Table 8).
Application Trends Survey 2012 Survey Report
© 2012 Graduate Management Admission Council®. All rights reserved. 35
Figure 24. Percentage of Master’s and PhD Programs Expecting Employer Funding (Partial or Full) for Incoming Class, 2012*
*Master of IT Management data not included due to insufficient survey response.
Table 8. Distribution of Incoming Class Expected to Receive Employer Funding, by Percentage of Master’s and PhD Programs, 2012
Percentage of Incoming Class with Employer Funding
Percentage of Programs Reporting
Master in Management
Master of Accounting
Master of Finance
Master in Marketing & Communication PhD
None 48% 29% 45% 55% 71%
1% to 19% 39% 61% 45% 45% 6%
20% to 39% 4% 11% 10% 0% 0%
40% to 59% 0% 0% 0% 0% 12%
60% to 79% 4% 0% 0% 0% 6%
80% to 100% 4% 0% 0% 0% 6%
*Master of IT Management data not included due to insufficient survey response.
52%
71%
55%
45%
29%
0%
20%
40%
60%
80%
100%
Master inManagement
Master ofAccounting
Master ofFinance
Master inMarketing/
Communications
PhD
Perc
enta
ge o
f p
rog
ram
s
2012 Survey Report Application Trends Survey
36 © 2012 Graduate Management Admission Council®. All rights reserved.
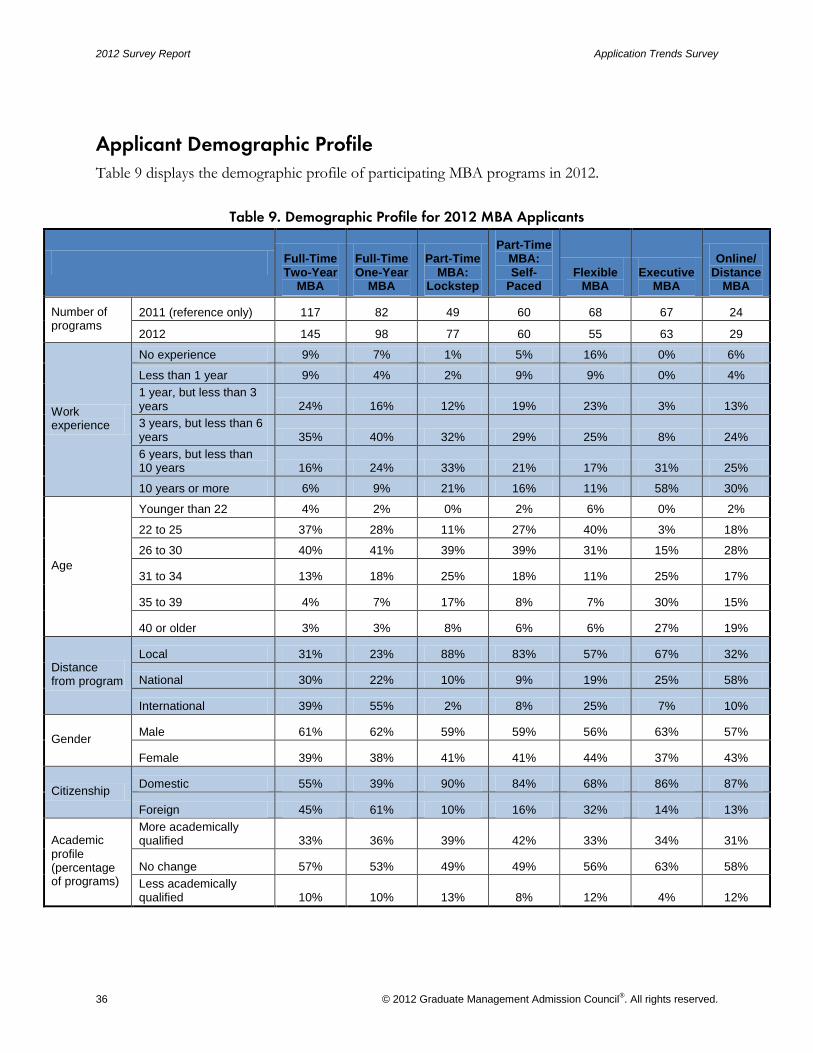
Applicant Demographic Profile
Table 9 displays the demographic profile of participating MBA programs in 2012.
Table 9. Demographic Profile for 2012 MBA Applicants
Full-Time Two-Year
MBA
Full-Time One-Year
MBA
Part-Time MBA:
Lockstep
Part-Time MBA: Self-
Paced Flexible
MBA Executive
MBA
Online/ Distance
MBA
Number of programs
2011 (reference only) 117 82 49 60 68 67 24
2012 145 98 77 60 55 63 29
Work experience
No experience 9% 7% 1% 5% 16% 0% 6%
Less than 1 year 9% 4% 2% 9% 9% 0% 4%
1 year, but less than 3 years 24% 16% 12% 19% 23% 3% 13%
3 years, but less than 6 years 35% 40% 32% 29% 25% 8% 24%
6 years, but less than 10 years 16% 24% 33% 21% 17% 31% 25%
10 years or more 6% 9% 21% 16% 11% 58% 30%
Age
Younger than 22 4% 2% 0% 2% 6% 0% 2%
22 to 25 37% 28% 11% 27% 40% 3% 18%
26 to 30 40% 41% 39% 39% 31% 15% 28%
31 to 34 13% 18% 25% 18% 11% 25% 17%
35 to 39 4% 7% 17% 8% 7% 30% 15%
40 or older 3% 3% 8% 6% 6% 27% 19%
Distance from program
Local 31% 23% 88% 83% 57% 67% 32%
National 30% 22% 10% 9% 19% 25% 58%
International 39% 55% 2% 8% 25% 7% 10%
Gender Male 61% 62% 59% 59% 56% 63% 57%
Female 39% 38% 41% 41% 44% 37% 43%
Citizenship Domestic 55% 39% 90% 84% 68% 86% 87%
Foreign 45% 61% 10% 16% 32% 14% 13%
Academic profile (percentage of programs)
More academically qualified 33% 36% 39% 42% 33% 34% 31%
No change 57% 53% 49% 49% 56% 63% 58%
Less academically qualified 10% 10% 13% 8% 12% 4% 12%

Application Trends Survey 2012 Survey Report
© 2012 Graduate Management Admission Council®. All rights reserved. 37
Table 10 displays the demographic profile of participating master’s and PhD programs in 2012.
Table 10. Demographic Profile for 2012 PhD and Master’s Program Applicants
PhD Master in
Management Master of
Accounting Master of Finance
IT Management
Master in Marketing/
Communications
Number of programs
2011 (reference only) 24 29 41 30 15 11
2012 24 33 45 39 14 18
Work experience
No experience 4% 37% 46% 34% 25% 33%
Less than 1 year 8% 22% 24% 25% 7% 17%
1 year, but less than 3 years 20% 22% 16% 22% 28% 29%
3 years, but less than 6 years 32% 10% 7% 14% 22% 16%
6 years, but less than 10 years 22% 7% 4% 4% 9% 4%
10 years or more 13% 1% 2% 1% 9% 1%
Age
Younger than 22 1% 14% 16% 13% 3% 14%
22 to 25 17% 61% 65% 63% 45% 52%
26 to 30 31% 13% 13% 19% 33% 21%
31 to 34 21% 5% 3% 4% 7% 7%
35 to 39 19% 4% 2% 1% 7% 4%
40 or older 12% 3% 2% 0% 6% 2%
Distance from program
Local 19% 30% 34% 19% 33% 36%
National 36% 18% 31% 16% 20% 20%
International 46% 53% 36% 65% 47% 44%
Gender Male 60% 47% 44% 54% 60% 37%
Female 40% 53% 56% 46% 40% 63%
Citizenship Domestic 36% 45% 50% 22% 44% 44%
Foreign 64% 55% 50% 78% 56% 56%
Academic profile (percentage of programs)
More academically qualified 17% 59% 49% 60% 54% 50%
No change 83% 38% 41% 40% 38% 50%
Less academically qualified 0% 3% 11% 0% 8% 0%

2012 Survey Report Application Trends Survey
38 © 2012 Graduate Management Admission Council®. All rights reserved.
About the Survey
The 13th annual Application Trends Survey was conducted from early June to late July 2012. Approximately 3,418 graduate business schools and faculties were invited to participate in this year’s survey. By the survey closing date, 359 graduate business schools and faculties had participated by submitting data for 744 graduate management programs, including 145 full-time two-year MBA (including international MBA and two-year PGP programs), 98 full-time one-year MBA (including one-year international MBA and one-year PGP programs), 137 part-time or professional MBA, 63 executive MBA, 55 flexible MBA, and 29 online/distance MBA programs.
Also participating were 45 Master of Accounting/Master of Taxation, 39 Master of Finance, 33 Master in Management/or International Management, 18 Master in Marketing and/or Communications, 14 Master of Information Technology or Systems, and 44 other master-level programs in business fields, as well as 24 PhD or DBA programs.
Overall, 492 programs from 229 responding schools were in the United States; 114 programs from 62 schools were in Europe; 50 programs from 27 schools were in the Asia-Pacific region; 34 programs from 18 schools were in Canada; 24 programs from 4 schools were in Latin America, 13 programs from 11 schools were from Central Asia; and 17 programs from 10 responding schools were in the Middle East/Africa. Geographically, the survey sample represents 46 countries worldwide and 42 states and the District of Columbia in the United States. Combined, participating programs received more than 484,385 applications during the 2012 application cycle. Findings reported in this document are based on survey responses, which represent data from the responding programs, and are not a census of all graduate management programs.
Percentages in tables may not add to 100, due either to multiple responses provided by respondents or to rounding. Data are not reported if the number of observations in a cell is less than 10. Unless otherwise specified, responses “don’t know,” “prefer not to say,” or “not applicable” are not included. Visit gmac.com/applicationtrends for more details about the survey methodology.
Methodology
The survey questionnaire contained approximately 29 questions which respondents were required to complete in order to qualify as a survey participant. All survey questions might not have been applicable to all responding programs. The survey was conducted online. All application numbers and trends discussed in this report refer to complete applications that contained all documents needed for making an admission decision, which were received on or about July 1, 2012 for the 2012–2013 incoming class.
In 2012, the programs were asked about the following topics for the first time: male application trends, and employer funding. Because 2012 was the first time data was collected for these questions, comparisons to previous years is not possible.
In 2012, average class sizes, acceptance rates, enrollment rates, and number of applications are reported using medians. Caution should be taken when comparing 2012 results to past results, as these data were often reported using the mean in prior years.

Application Trends Survey 2012 Survey Report
© 2012 Graduate Management Admission Council®. All rights reserved. 39
A list of business schools that participated in the survey is publicly available at gmac.com/surveys.
All participating graduate business programs receive a comprehensive data report exclusive to survey participants, plus access to the Application Trends Interactive Benchmark Tool, which allows them to compare their survey responses with aggregated responses from their peer programs. All research publications of the Graduate Management Admissions Council, including the Application Trends report series, are complimentary to participating schools.
The opinions and evaluations contained in this report represent those of individual contributors and are not necessarily the views of the Graduate Management Admission Council.
Survey Participation
The year 2013 will mark the 14th anniversary of the GMAC Application Trends Survey. Admissions professionals at business schools and universities that offer graduate management programs can secure the survey invitation by visiting gmac.com/surveysignup.
Participation benefits for schools include comprehensive statistics, customized interactive benchmark reports, and advance access to survey findings.
Application Trends research consists of two independent studies. All graduate management programs are eligible to participate in either one or both regardless of their location, affiliation, or admissions structure. MBA programs as well as doctoral and specialized master’s in business offered in full-time, part-time, executive, flexible, or distance-learning formats are invited online.
The Preliminary Application Trends Survey is conducted in early February each year. Results from this survey are distributed exclusively to participating schools and provide advance information on the application volume during the early stages of the application cycle for programs that start in August-September and a quick snapshot of the end-of-cycle results for programs that start in January.
A comprehensive Application Trends Survey is open from early June to mid-July of each year. In addition to assessing longitudinal trends in application volume of a broad spectrum of graduate management programs and providing detailed applicant profile statistics to participating schools, this study has served as a primary source of application trends information for the graduate management education community worldwide for more than a decade through an annual publicly released executive summary.
Regional Location of Survey Respondents
World geographic classifications used in this report are based on the following categories:
Asia and Pacific Islands (APAC): Australia, China, Hong Kong (SAR of China), Japan, Korea (Republic of, South), New Zealand, Philippines, Singapore, Taiwan, Thailand, Vietnam
Canada: Canada
Central Asia: India, Pakistan
2012 Survey Report Application Trends Survey
40 © 2012 Graduate Management Admission Council®. All rights reserved.
Europe: Belgium, Cyprus, Denmark, Finland, France, Georgia, Germany, Greece, Iceland, Ireland, Italy, Latvia, Netherlands, Portugal, Russian Federation, Slovenia, Spain, Sweden, Switzerland, Ukraine, United Kingdom of Great Britain and Northern Ireland
Latin America: Brazil, Columbia, Peru
Middle East/Africa: Egypt, Kenya, Lebanon, Morocco, Nigeria, South Africa, Turkey
United States: United States of America and its territories
In addition, US graduate management programs were grouped geographically using the following regional classifications:
Northeast (NE): Connecticut, Maine, Massachusetts, New Hampshire, New Jersey, New York, Rhode Island
Middle Atlantic (MA): Delaware, District of Columbia, Maryland, Pennsylvania, Virginia, West Virginia
Midwest (MW): Illinois, Indiana, Iowa, Kansas, Michigan, Minnesota, Missouri, Nebraska, North Dakota, Ohio, Wisconsin
South (S): Alabama, Arkansas, Florida, Georgia, Kentucky, Louisiana, Mississippi, North Carolina, South Carolina, Tennessee
Southwest (SW): Arizona, Oklahoma, Texas
West (W): California, Colorado, Hawaii, Oregon, Utah, Washington
Key Survey Definitions
The survey questionnaire included the following definitions:
Academic profile includes undergraduate GPA (UGPA), GMAT score, essays, and other indicators of academic quality used by a particular program in the admission process.
Acceptance rate is calculated as the number of acceptance offers divided by the number of total completed applications times 100.
The term domestic refers to applicants who are citizens of the country where the program is located.
Enrollment rate is calculated as the number of accepted applicants who enroll divided by the number of all accepted applicants times 100.
The term entrepreneurs refers to individuals contemplating or currently running their own businesses that schools may specifically recruit as potential applicants.
Flexible MBA programs combine full-time and part-time course delivery options for students and are delivered primarily on campus.
The term foreign is defined by applicant citizenship and refers to any applicant whose citizenship differs from that of the country where he/she applies. For example, US citizens applying to UK

Application Trends Survey 2012 Survey Report
© 2012 Graduate Management Admission Council®. All rights reserved. 41
programs would be considered foreign in the United Kingdom, and UK citizens applying to US programs would be considered foreign in the United States.
The term international is defined by applicant residence, not by citizenship. International refers to an applicant who lives outside the country of the school location. For this survey, European programs were asked to classify international applications based on whether applicants were citizens of countries within Europe or outside of Europe.
The term LGBT community includes lesbian, gay, bisexual, and transgender individuals.
Lockstep part-time or professional programs require students in the same year (cohorts) to advance together taking specific courses in a particular order.
The term occupational specialties refers to individuals working in particular professions such as engineering, technology, or other occupational categories that schools may target for special recruitment activities.
The term residence refers to an applicant’s current residence and not to his or her citizenship.
The term underrepresented nationalities may include those born in a country where another nationality constitutes the majority and migrants. For example, in Belgium, all nationalities other than Belgian, which is the majority, would be considered underrepresented nationalities.
The term underrepresented population refers to racial or ethnic minorities that include the following groups of US citizens: Hispanic American or Latino, Black or African American, Native Hawaiian or Pacific Islander, and American Indian or Alaska Native. The category does not include Asian Americans.
Percentage distributions based on original survey response categories are often collapsed into broader categories “Up”, “Flat”, or “Down” at the bottom of a table or figure for reader convenience. The category “Up” includes up significantly (21% or higher), up moderately (11% to 20%), and up slightly (1% to 10%). “Flat” means there was no (0%) change from the previous year. “Down” includes down slightly (–1% to –10%), down moderately (–11% to –20%), and down significantly (–21% or lower).
Postgraduate Program (PGP) is the Indian version of the MBA. Based on the length of the programs, the responses were aggregated within full-time one- or two-year MBA program data.
Self-paced part-time or professional programs allow students flexibility in the pace or sequence in which they choose to complete their courses.
Contact Information
For questions or comments about the study findings, methodology, or data, please contact the GMAC Research and Development Department at [email protected].

2012 Survey Report Application Trends Survey
42 © 2012 Graduate Management Admission Council®. All rights reserved.
Authorship
The following individual made significant contributions to the concept and design or analysis and interpretation of data and the drafting/revising of the manuscript for intellectual content:
Rebecca Estrada, Survey Research Manager, Research and Development, Graduate Management Admission Council (GMAC); and Paula Bruggeman, Editor/Writer, Manager, Research and Development, GMAC.
Acknowledgements
Gregg Schoenfeld, Director, Management Education Research, GMAC, review of questionnaire, analysis, and report; Dr. Lawrence M. Rudner, Vice President, Research and Development, GMAC, manuscript review; Michelle Sparkman-Renz, Director, Research Communications, GMAC, manuscript review; Veronica Sinz, Lead Publications Manager, Research and Development, GMAC, manuscript review and editing; Alex Chisholm, Director, Statistical Analysis, Research and Development, GMAC, manuscript review; and Tacoma Williams, Research Coordinator, GMAC, survey support.
The Graduate Management Admission Council extends sincere appreciation to the business school admissions professionals who generously contributed both time and information to the 2012 Application Trends Survey. Their participation in this research ensures the continuous availability of application trends statistics for the graduate management education industry, prospective students, researchers, media, and the general public.
References
ICEF Monitor. (February 27, 2012). Enormous Saudi scholarship programme extended to 2020. Retrieved September 9, 2012 from: http://monitor.icef.com/2012/02/enormous-saudi-scholarship-programme-in-the-spotlight/
Saudi-US Relations Information Service. (July 30, 2012). King Abdullah scholarship program: The Saudi Arabian educational youth stride. Retrieved September 9, 2012 from http://www.susris.com/2012/07/30/king-abdullah-scholarship-program-the-saudi-arabian-educational-youth-stride/ Accessed September 3, 2012
Financial Times. Stacey, K. (September 4, 2012) MPs attack border agency over student visas. Retrieved on September 9, 2012 at http://www.ft.com/intl/cms/s/0/3426d030-f5e4-11e1-a6c2-00144feabdc0.html#axzz25SvQtdJe
The Times Higher Education Co. (July 13, 2012). Cable fires latest salvo on student visas. Retrieved on September 9, 2012 at http://www.timeshighereducation.co.uk/story.asp?storycode=420570
Workpermit.com. (March 23, 2012). UK immigration changes 6 April 2012 affects Tier 1, 2, 4 visas—Apply Now ! Retrieved on September 9, 2012 at http://www.workpermit.com/news/2012-03-23/uk/uk-immigration-changes-6-april-2012-affects-tier-1-2-4-visas-apply-now.htm

© 2012 Graduate Management Admission Council® (GMAC®). All rights reserved.
No part of this publication may be reproduced, stored in a retrieval system, distributed or transmitted in any form by any means, electronic, mechanical, photocopying, recording or otherwise, without the prior written permission of GMAC. For permission contact the GMAC legal department at [email protected].
The GMAC logo, GMAC®, GMAT®, Graduate Management Admission Council®, and Graduate Management Admission Test® are registered trademarks of the Graduate Management Admission Council in the United States and other countries.