gmacs conceptual design report - texas a&m astronomical
TRANSCRIPT

3
GMACS Conceptual Design Report
September 14, 2011

GMACS Conceptual Design Report ii
GMACS Team Members
D. L. DePoy (Texas A&M University): PI & PM
R. Allen (Texas A&M University): Mechanical Design
R. Barkhouser (Johns Hopkins University): Optical Design
E. Boster (Texas A&M University): Project Management
D. Carona (Texas A&M University): Software Engineer
A. Harding (Johns Hopkins University): Senior Mechanical Engineer
R. Hammond (Johns Hopkins University): Senior Mechanical Engineer
J. L. Marshall (Texas A&M University): Project Scientist and Project Management
J. Orndorff (Johns Hopkins University): Senior Electronics Engineer
C. Papovich (Texas A&M University): Project Scientist
K. Prochaska (Texas A&M University): Project Management
T. Prochaska (Texas A&M University): Mechanical Engineer
J.-P. Rheault (Texas A&M University): Calibration Scientist
S. Smee (Johns Hopkins University): Chief Mechanical Engineer
S. Shectman (Carnegie Observatories): Project Scientist
S. Villanueva (Texas A&M University): Design Support

GMACS Conceptual Design Report iii
List of Acronyms
AGN: Active Galactic Nuclei
AO: Adaptive Optics
ASIC: Application Specific Integrated Circuit
CCD: Charge Coupled Device
CDM: Cold Dark Matter
CGM: Circumgalactic Medium
CoDR: Conceptual Design Review
DCS: Detector Control System
DES: Dark Energy Survey
DM: Dark Matter
ELT: Extremely Large Telescope
E-ELT: European Extremely Large Telescope
EW: Equivalent Width
FWHM: Full Width at Half Maximum
FEA: Finite Element Analysis
GMACS: Wide-field, moderate resolution, multi-object spectrograph for GMT
GIR: Gregorian Instrument Rotator
GLAO: Ground Layer Adaptive Optics
GMT: Giant Magellan Telescope
ICS: Instrument Control System
IFU: Integral Field Unit
IGM: Intergalactic Medium
JWST: James Webb Space Telescope
KBO: Kuiper Belt Object
HST: Hubble Space Telescope
LBG: Lyman break galaxy
LSST: Large Synoptic Survey Telescope
MTBF: Mean time between failures
OCS: Observation Control System
PAN: Personal Area Network
PI: Principal Investigator
PM: Project Manager
PTF: Palomar Transient Factory
SDSS: Sloan Digital Sky Survey

GMACS Conceptual Design Report iv
SFR: Star Formation Rate
S/N: Signal-to-Noise Ratio
SN: Supernova
SNe: Supernovae
TMT: Thirty-Meter Telescope
TNO: Trans-Neptunian Object
UV: Ultraviolet
VISTA: Visible and Infrared Survey Telescope for Astronomy
WBS: Work Breakdown Structure
WD: White Dwarf
GMACS Conceptual Design Report v
Table of Contents
GMACS Team Members .................................................................................................................................... ii
List of Acronyms ............................................................................................................................................... iii
GMACS Conceptual Design Report ............................................................................................... 1
Executive Summary .................................................................................................................... 1
Introduction ................................................................................................................................. 5
Instrument Science Case and Technical Objectives ................................................................... 6
Specific Science Cases ......................................................................................................................................... 7
Synergies with LSST ......................................................................................................................................... 54
Comparison with other ELT Project Capabilities .............................................................................................. 59
Technical Objectives .......................................................................................................................................... 60
Resolution Choice .............................................................................................................................................. 62
Brief Description of the Instrument Concept ..................................................................................................... 67
Performance Estimate ........................................................................................................................................ 68
Optical Design .......................................................................................................................... 72
General Optical Design, Layout, and Performance ............................................................................................ 72
Gratings .............................................................................................................................................................. 77
Ultraviolet Performance and Throughput .......................................................................................................... 81
Imaging Mode .................................................................................................................................................... 84
Maximum Possible Resolution .......................................................................................................................... 86
Detector Objectives ................................................................................................................... 88
Quantum Efficiency ........................................................................................................................................... 88
Readout Noise .................................................................................................................................................... 88
Detector Flatness ................................................................................................................................................ 90
Conclusion ......................................................................................................................................................... 91
Mechanical Design.................................................................................................................... 92
Focal Plane Unit ................................................................................................................................................. 93
Optics Modules ................................................................................................................................................ 101
GMACS Weight Summary .............................................................................................................................. 108
GMACS Flexure Study .................................................................................................................................... 109

GMACS Conceptual Design Report vi
Flexure Compensation ............................................................................................................ 123
Software Design ...................................................................................................................... 125
Software philosophy ........................................................................................................................................ 125
Data reduction pipeline .................................................................................................................................... 133
Exposure time calculator .................................................................................................................................. 133
Miscellaneous Issues ............................................................................................................... 134
Thermal ............................................................................................................................................................ 134
Electrical .......................................................................................................................................................... 135
Mechanical Interfaces ...................................................................................................................................... 135
Support ............................................................................................................................................................. 136
Shipping ........................................................................................................................................................... 136
Installation ........................................................................................................................................................ 136
Commissioning ................................................................................................................................................ 137
Optical Coupling Fluid Testing ........................................................................................................................ 138
Calibration System ........................................................................................................................................... 139
Management Plan.................................................................................................................... 141
Systems Engineering Approach ....................................................................................................................... 141
Project Management Approach ........................................................................................................................ 142
Documentation ................................................................................................................................................. 144
Work Breakdown Structure and Schedule ....................................................................................................... 145
Personnel requirements .................................................................................................................................... 148
Risk Mitigation ....................................................................................................................... 150
Descope Options ..................................................................................................................... 158
Obvious Descope Options ................................................................................................................................ 158
Rejected Descope Options ............................................................................................................................... 158
Compatibility with MANIFEST ............................................................................................. 160
Conclusions ............................................................................................................................. 163
Appendix 1: Dewar Heat Load Estimate Calculation ............................................................. 164
Appendix 3: Selected Team Biographical Sketches ............................................................... 169
GMACS Conceptual Design Report 1
GMACS Conceptual Design Report
Executive Summary
Wide field, multi-object spectroscopy is a key capability for the Giant Magellan Telescope
(GMT). Indeed, the original GMT Science Requirements document states: ―A spectrometer
operating in the visible spectrum (0.32 µm to 1µm) with the capability to observe multiple
targets simultaneously is critical to our goals in the areas of star formation, stellar populations
and most extragalactic science.‖ The ability to obtain moderate resolution spectra of
astronomical targets at optical wavelengths has been a fundamental scientific capability for more
than a century; the scientific information content of such measurements remains high and this
capability is unlikely to become obsolete over the expected lifetime of the GMT.
In the conceptual design study described in this document we present the design of the Wide
Field, Multi-Object, Moderate-Resolution, Optical Spectrograph (called GMACS) for the GMT.
Ultimately, the goal is to build and use an instrument capable of observing the faintest possible
targets, those that are substantially fainter than the sky. High throughput, simultaneous wide
wavelength coverage, accurate and precise sky subtraction, moderate resolution, and wide field
(for an extremely large telescope) are the crucial design drivers for the instrument. We expect
that GMACS will form one of the most basic scientific capabilities of the GMT.
A conceptual design of the GMACS instrument was described in the original GMT Conceptual
Design Document in 2006. We have advanced and refined this original concept substantially
during the GMACS conceptual design study presented here. The essential description of the
instrument has not changed: a set of four fold mirrors at the GMT focal plane redirect a 9
arcminute × 18 arcminute field to four individual ―arms‖ that each comprise a ―two-channel‖
spectrograph (that is, each arm sees a 4.5 arcminute × 9 arcminute off-axis field and feeds a
double spectrograph). There have, however, been considerable changes in the layout, structure,
optical design, mechanism approach and design, and other specific characteristics of the
spectrograph.
The individual channels are optimized for either the red or the blue, but have very similar design
characteristics (plate scales, resolutions, common shutters, etc.). We have included in the
baseline design selectable and rotatable grating mechanisms, to increase observing flexibility and

GMACS Conceptual Design Report 2
rapid instrument reconfigurations. Currently the design contains four separate VPH gratings (2
red; 2 blue) that give resolutions of ~2000 and ~4000 in each channel.
We have developed science themes that define the purpose of GMACS. Specific observing
projects are described in this document that allow us to set the technical requirements for the
instrument. The broad themes are similar to the (original and new) GMT science justification
documents and include a wide range of topics: from KBO surface composition studies to
characterization of star formation in z=6 galaxies. The interplay between GMACS and the Dark
Energy Survey (DES) and Large Synoptic Survey Telescope (LSST) imaging projects is likely to
be extensive, since we anticipate that GMACS will be the most efficient spectroscopic follow-up
instrument for both of these large imaging surveys. Our team remains convinced that GMACS
will be an enormously popular instrument for the GMT and will ultimately be used for an
extremely broad range of science projects.
We have developed a set of technical objectives for the instrument that are drawn from the
science themes. These objectives include:
Sensitivity: High throughput: >50% at peak and no worse than 30% at any wavelength
Sensitivity: Detectors with low readout noise (<5% addition to background noise)
Excellent image quality: <0.2 arcsec rms over the entire detector plane
Accurate and precise sky subtraction: use direct slits
Multi-object capability: focal plane masks
Wide field: large focal plane masks
Broad wavelength coverage: at least 400-950nm (goal is 350-1100nm)
Moderate resolution: R~1000-5000
Seeing limited operation: plan around use of a 0.7 arcsec slit (although the image quality
could make use of GLAO in the far red)
Spectral accuracy over long exposures of <0.1 resolution element; flexure compensation
These objectives guide our design decisions and are pragmatic choices for the instrument. We
believe that meeting these objectives will result in an instrument that will produce a vast range of
science at the GMT and satisfy most community needs for optical spectroscopic observations of
faint objects.
The optical design is complete for the entire instrument and discussions with potential vendors
have demonstrated that the optics can be fabricated with minimal risk. Estimated performance of
the design meets image quality objectives: <0.2 arcsec rms polychromatic spots over the entire
focal plane. Materials for the lenses are available and the surfaces (including aspherics) pose no
GMACS Conceptual Design Report 3
significant challenge to figure or test. Lens and dichroic coatings that should guarantee
exceptional throughput are available via lens fabrication vendors; estimated performance should
meet the throughput objectives. Gratings with excellent performance are also available.
Detector systems for GMACS are also available commercially. In particular, E2V can provide
both blue- and red-optimized CCDs that can be used in the channels of the instrument; the
performance of the available devices is excellent (quantum efficiency, readout noise, cosmetics,
etc.) and meets our various instrument objectives. E2V can also provide ready-made ―focal
planes‖: mosaics of individual CCDs mounted on a SiC surface and attached to ASIC-based
controllers. Other vendors can also supply acceptable devices. The detector planes are very
large by current standards: we need 8 10K × 20K CCD mosaics (15 μm pixels) for a total focal
plane size of 1.6 Gpixels. The expected slit width will be over-sampled, so we expect to
typically bin the pixels substantially (depending on observing conditions).
The mechanical design of the instrument is now substantially more advanced than at the start of
the conceptual design study. In particular, we have completed adaptation of the instrument to the
new GIR. We now plan to mount ―optics modules‖ in the upper part of two of the instrument
bays. These optics modules are comprised of the major parts of the optics of the individual
spectrographs: collimators, dichroics, gratings, cameras, and detector planes. All are housed in
stiff engineered structures, with two arms coupled into a single housing. Lens cells, detector
cryostats, grating interchange mechanisms, and dichroic mount designs are based on successful
designs from previous instruments (SDSS spectrographs, in particular).
GMACS will also have a ―focal plane unit‖ that consists of the last element of the GMT wide-
field corrector (provided by the GMT), the focal plane mask, the four mirrors to feed the arms,
guide/acquisition cameras, and a magazine of additional masks and interchange mechanism. The
focal plane unit is stored in the bottom of one instrument bay (beneath one of the optics
modules). The focal plane unit translates laterally into the central bay and then is raised into the
observing position by an elevator-like mechanism. The mechanisms involved all have solid
conceptual designs and should be straightforward to prototype.
The design of GMACS is very modular. We believe that this will ease deployment by allowing
―staging‖ of the modules. The modularity will also allow future upgrades and reconfigurations
of the instrument capabilities, which helps to ensure that the instrument is capable of meeting
future science goals.

GMACS Conceptual Design Report 4
Throughout the course of the design study we have concentrated on mitigating risks. We have
retired most of the risks identified at the start of the study, including specifically (all mentioned
in our original proposal)
Optical glass in appropriate blank sizes are available
Figuring of required lenses, including aspheric elements, is possible
Coatings on lenses and dichroics are straightforward
VPH gratings in necessary size and quality are commercially available
Design, fabrication, and handling of slit masks has a solid conceptual design
Flexure analysis and conceptual compensation plan is in place
We believe the remaining risks to the project will be budget and schedule related. We have
developed budget estimates for the project using a mix of vendor responses and previous
experience of the design study team (typically based on actual tracked costs of similar units).
We have adopted a ―best‖ cost estimate based on the mid-point of vendor responses.
Contingency is determined by the upper limit of the vendor responses. We have effectively
assigned a zero probability to the lower half of any vendor cost estimate. We have assigned a
25% contingency to our personnel time estimate. We believe our cost development is precise
enough to meet the ~30% cost precision requirement of the GMTO design study requirement.
The best estimate of the cost of the full four-arm GMACS implementation is $41.6M; with
contingency the cost is $54.3M. These cost estimates include fully burdened personnel costs, as
per GMTO guidance.
We plan to mitigate schedule risk with appropriate management techniques. We have allocated
6-10% of the project budget to management personnel resident at team institutions and plan to
make appropriate hires if the project proceeds. We have a 6-year project plan and have derived
personnel loading from that plan.
GMACS on GMT will have the highest product of effective telescope collecting area and solid
angle field-of-view (A-Ω product) of any planned spectrograph for a 30m-class telescope.
Furthermore, we have maintained the ability for the instrument to interface with the MANIFEST
fiber feed, which will allow use of large numbers of positionable fibers over the full ~300
arcminute2 field of the GMT. Combined with the modularity of the instrument and the ability to
respond to future science needs, we believe the instrument can form an important and productive
resource for the GMT community.

GMACS Conceptual Design Report 5
Introduction
We have worked to continue design and development of a Wide Field, Multi-Object, Moderate-
Resolution, Optical Spectrograph for the Giant Magellan Telescope (GMT). Ultimately, the goal
is to build and use an instrument capable of observing the faintest possible targets, those that are
substantially fainter than the sky. High throughput, simultaneous wide wavelength coverage,
accurate and precise sky subtraction, moderate resolution, and wide field (for an extremely large
telescope) are the crucial design drivers for the instrument.
The proposed instrument will address most of the science drivers that currently define the
purpose of the GMT. As noted in the original GMT Science Requirements document ―A
spectrometer operating in the visible spectrum (0.32 µm to 1µm) with the capability to observe
multiple targets simultaneously is critical to our goals in the areas of star formation, stellar
populations and most extragalactic science‖. More generally, the ability to obtain moderate
resolution spectra of astronomical targets at optical wavelengths has been a fundamental
scientific capability for more than a century; the scientific information content of such
measurements remains high and this capability is unlikely to become obsolete over the expected
lifetime of the GMT. We expect that our instrument will form one of the most basic scientific
capabilities of the GMT.
During this phase of the instrument design process we have concentrated on extending the
spectrograph design as described in the GMT Conceptual Design Review (CoDR)
documentation (known as GMACS; see Section 13.6 at http://www.gmto.org/science-
conceptu.html). There have been significant changes in the layout of the instrument, the optical
design, the mechanism and structural plan, and the interface to the telescope. We have assessed
the critical technologies that must be in place to produce the spectrograph and mitigate the
associated risks via re-design or other investigation. We have optimized the spectrograph optical
design and developed conceptual designs for optical element cells and other structural supports.
There are now solid conceptual designs for the mechanisms and structure of the instrument and
suitable detectors have been identified. We have also produced finite-element-analysis to
understand the impact of flexure and have developed concepts for active flexure compensation of
element motion. We have produced cost and schedule estimates for various incarnations of the
instrument, which allow realistic planning and fund-raising activities. Much more detail is
provided in the rest of this document.

GMACS Conceptual Design Report 6
Instrument Science Case and Technical Objectives
In this section we describe specific science projects we can expect to execute with GMACS on
the GMT. These cases, which encompass many forefront areas of modern astrophysics, are used
to define a specific set of technical objectives for the instrument.
However, it is worthwhile pointing out explicitly that these specific cases are merely
representative of the science that GMACS can and will produce. Indeed, we expect that a list of
the major science accomplishments and important results arising from the instrument after years
of use will include many topics not presented here, if history is any guide. For example,
according to Richard Ellis (2011, at the ―Feeding the Giants: ELTs in the era of surveys‖
conference) the four most interesting results from the Keck telescopes between 1992 and 2007
were the identification and characterization of z=3 galaxies, observations that reveal the redshifts
and nature of gamma-ray burst (GRB) sources, redshifts and identification of type Ia supernovae,
and the discovery of extra-solar-system planets; none of these important and defining topics were
mentioned in the 1985 Keck science case. Further, all were done with optical spectroscopy (of
various resolutions). As further noted by Ellis, ―optimism, versatility, and creativity are the key
attributes for success.‖ We enthusiastically agree and strive throughout this project to merge the
particular objectives associated with the specific cases with more general considerations that our
experience suggests will make GMACS versatile and allow for creative use. We are confident
that we can create a useful and important instrument for the GMT community.
One way to grasp the scientific potential of a moderate resolution optical spectrograph on the
GMT is to consider the potential number of targets such an instrument could conceivably
observe over its lifetime. GMT can access approximately 108 arcminute
2 of the sky. In one hour
an optical spectrograph on the GMT can easily detect 24th
mag objects at high S/N; the density of
24th
mag stars and galaxies is ~5 arcminute-2
. Even with the capability to observe hundreds of
objects simultaneously, an optical spectrograph would require ~106 separate 1-hr exposures or
nearly 500 years of dark time to exhaust all potential targets.
We expect that the instrument will be used for an immense range of projects, most of which we
cannot presently conceive, given the expected lifetime of the instrument. The information
content of moderate-resolution spectra at wavelengths between 350 nm and 1000 nm is high and
historically has been one of the most fundamental astrophysical tools. Given that a spectrograph
on the GMT will be able to observe targets that can be only imaged with broadband filters today,
the scope of future science opportunity is vast.

GMACS Conceptual Design Report 7
The science cases presented below are roughly in the form of ―observing proposals‖ which are
drawn from both the revised GMT science justification and our own particular interests.
Specific Science Cases
The evolution of the distribution of cold gas around galaxies from z=2 to z=4
Abstract: The intervening absorption systems in (background) galaxy spectra provide our best
constraints on the extent of cold gas in the circumgalactic medium around distant galaxies.
Furthermore, (rest-frame) UV spectra of distant galaxies allow for the detailed study of galaxy-
scale outflows of cold gas via strong interstellar absorption lines and Lyman-alpha emission.
Current surveys using large samples of spectroscopic data for LBG galaxies at 2 < z < 3 provides
our best constraints for large-scale superwind outflows in these galaxies, indicative that winds
are a ubiquitous feature associated with star formation. Here we envision a survey using
GMT/GMACS to study the process of galaxy outflows as a function of galaxy mass,
luminosity/SFR, and galaxy density. This GMACS survey will also extend to substantially
fainter galaxies than currently possible using existing facilities. This allows us to study gas
outflows from sub-L* galaxies, which are expected to be responsible for most of the chemical
enrichment of the IGM at these redshifts. The data collected by this survey will also place
interesting constraints on the amount of gas involved in ―cold flows‖ into the inner regions of
these galaxies. Although these inflows are a crucial feature for gas accretion in current galaxy
simulations, evidence for these inflows is scant. GMACS observations could provide the first
direct detection of these cold-gas components at these redshifts.
Motivation: While there is now general agreement about the development of the structure of the
dark matter components on scales larger than galaxies, the physics of how baryons collect in
these halos, and the subsequent feedback of energy from star formation, supernova explosions,
and accretion energy onto supermassive black holes, and flow of gas into and out of galaxies,
remain largely unconstrained. Thus observations are unable to provide constraints on galaxy
formation models, which invoke many types of ―feedback‖ with highly different strengths as a
generic mechanism to both instigate and regulate star formation in galaxies.
One of the promising routes to understanding the relevant baryonic processes is the simultaneous
study of galaxies and gas in the IGM in the same cosmic volumes during the epoch when they
were exerting the most influence on one another -- near the peak of the universal star-formation
and supermassive black hole accretion, in the redshift range 2 < z < 4. Combining two powerful
GMACS Conceptual Design Report 8
lines of investigation provides complementary information on the state of baryons, both those
collapsed into galaxies and those residing outside of galaxies. The IGM and ―circumgalactic
medium‖ (CGM, defined to be the gas within about 300 kpc of the galaxies) provide a laboratory
in which the ―feedback‖ effects from galaxy formation and AGN accretion can be measured.
However, at high redshifts, essentially every galaxy is star forming and the outflow process
appears nearly universal. It likely influences both the chemical evolution of the galaxy and
regulates the maximum SFR of the galaxy. Galaxies have been observed to have large-scale
outflows of cold gas with velocities of several hundred km/s, and that this is a fairly ubiquitous
feature in star-forming galaxies (e.g., Rupke et al. 2005). The outflowing gas has been observed
in detail for only a few (usually gravitationally lensed) galaxies (e.g., Pettini et al. 2002), and
these reveal a complex velocity structure and a gas in multiple phases. These outflows are
clearly an important aspect of the galaxy formation process.
Recent theoretical work has focused on the infall of cold gas (―Cold Accretion‖ in theorist
parlance), which (in the simulations) flow along dense filaments directly onto the central regions
of forming galaxies. Theory is reaching some convergence where this cold gas feeds high SFRs
in high-redshift galaxies until the galaxy halo achieves some critical threshold (usually around
1012
solar masses) so that a virial shock develops, suppressing further cold accretion (e.g., Keres
et al. 2005, Dekel et al. 2009). The observational signatures of cold accretion are thought to be
very subtle, and perhaps indistinguishable, from the outflows. The most telling difference may
be kinematic evidence, in the form of absorption lines of infalling (redshifted) gas. The
discovery of infalling gas—or any constraint on this process—has important consequences for
galaxy simulations.

GMACS Conceptual Design Report 9
Figure 1: Schematic view of a galaxy-galaxy absorption system (from Adelberger et al. 2006). The left side shows a foreground
galaxy, marked as B, which lies at redshift z=1.61. The background galaxy, marked A lies at z=2.17. The 2D spectra of the two
galaxies is shown on the right with galaxy B as the spectrum on the left and galaxy A as the spectrum on the right (Lyman-alpha
in emission is visible at the bottom of the spectrum). Both spectra show absorption of Si II and C IV associated with galaxy B at
z=1.61: these lines exist in the ISM with galaxy B, and within the CGM of B. The angular separation of the two galaxies is 2
arcsec, which corresponds to 17 kpc (physical) at the redshift of galaxy B.
To study both the properties of the galaxies and their CGM requires simultaneous observations
of the galaxies and spectroscopy of background galaxies whose sightlines pass at close impact
parameters to (slightly) lower-redshift galaxies. Figure 1 illustrates this graphically (adapted
from Adelberger et al. 2006). Steidel et al. (2010) recently used a sample of more than 500
foreground-galaxy/background-galaxy pairs as a ―pilot study‖ to probe the CGM on 3-125 kpc
scales around foreground galaxies at z~2.2, providing a first map of cold gas as a function of
galactocentric distance. Figure 2 shows the rest-frame EW distribution of various CGM lines as
a function of galactocentric distance. They model this map with a simple model that the gas is
distributed symmetrically and accelerates outward with a velocity v(r) that increases with
increasing r and a covering fraction that scales at r-0.2
– r-0.6
. However, these data are at the limit
of current technology. To extend this analysis to fainter (sub-L*) galaxies and test for evolution
with redshift requires the next jump forward in instrumentation and telescope collecting area.
GMACS Conceptual Design Report 10
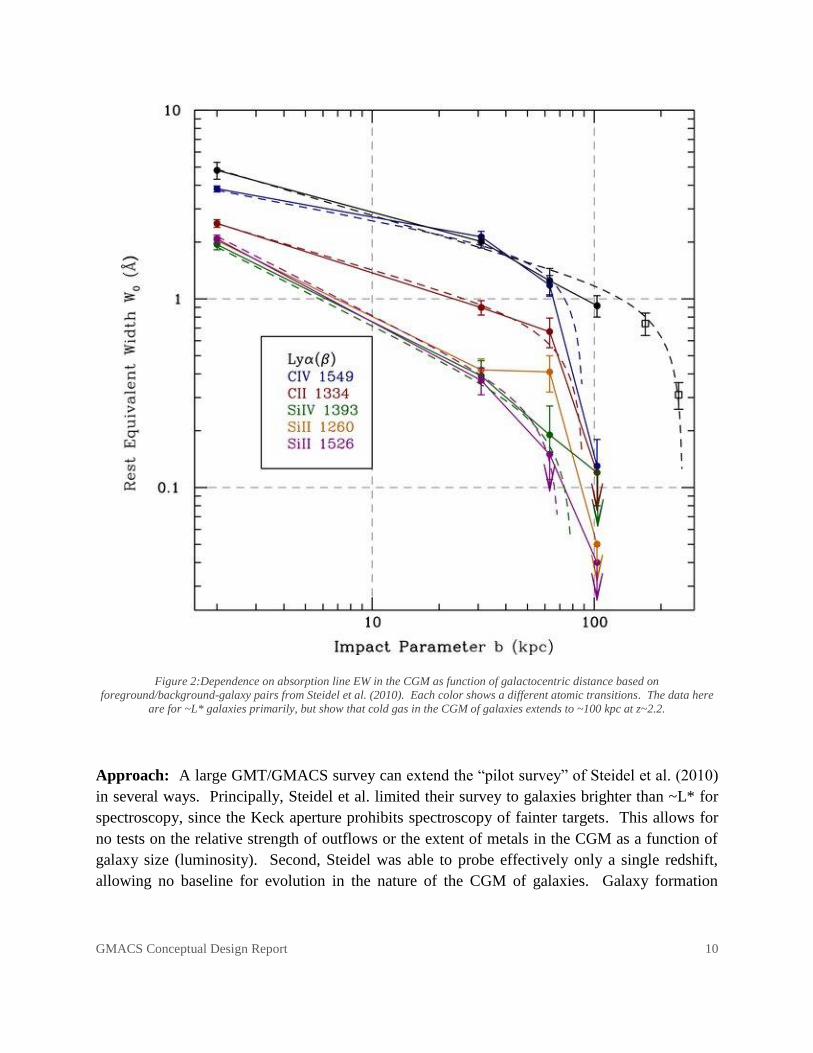
Figure 2:Dependence on absorption line EW in the CGM as function of galactocentric distance based on
foreground/background-galaxy pairs from Steidel et al. (2010). Each color shows a different atomic transitions. The data here
are for ~L* galaxies primarily, but show that cold gas in the CGM of galaxies extends to ~100 kpc at z~2.2.
Approach: A large GMT/GMACS survey can extend the ―pilot survey‖ of Steidel et al. (2010)
in several ways. Principally, Steidel et al. limited their survey to galaxies brighter than ~L* for
spectroscopy, since the Keck aperture prohibits spectroscopy of fainter targets. This allows for
no tests on the relative strength of outflows or the extent of metals in the CGM as a function of
galaxy size (luminosity). Second, Steidel was able to probe effectively only a single redshift,
allowing no baseline for evolution in the nature of the CGM of galaxies. Galaxy formation
GMACS Conceptual Design Report 11
simulations use different feedback effects, including momentum vs. radiation driven winds,
which predict different relations between outflow velocity and galaxy mass/luminosity. With a
larger spectroscopy survey probing both a longer redshift baseline and wider luminosity baseline
using GMT/GMACS, we are able to address these questions.
A GMT/GMACS survey would obtain spectroscopic observations of a large sample of galaxies
from z~1.5 to z~5, spanning fully the cosmic volume when galaxies were most active. Steidel et
al. (2010) obtained spectra for 2500 galaxies at z~2-3, with spectroscopy limited to R ~ 24-24.5
mag, which yielded a sample of 500 foreground—background galaxy pairs with impact
parameters 3 < b < 125 kpc at z=2.2. We will require similar sample sizes of foreground-
background pairs at each redshift we wish to probe (we can do this simultaneously, using
galaxies at 3 < z < 5 to probe the CGM at z=2, etc.).
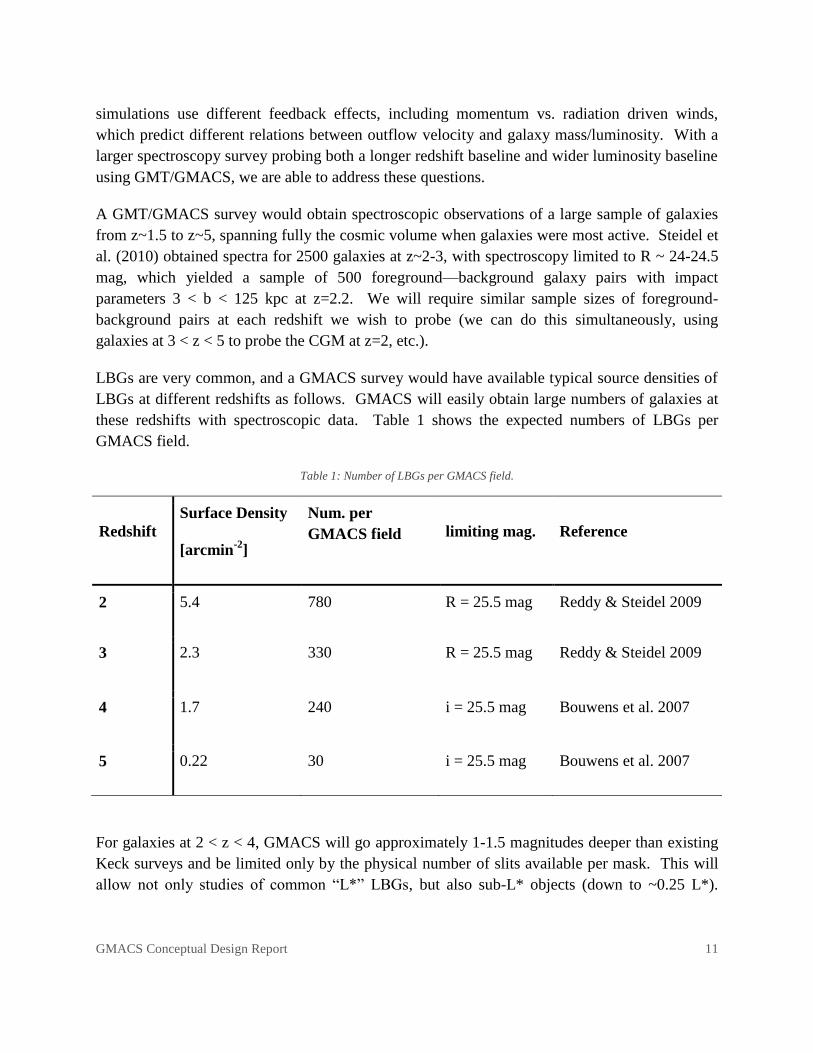
LBGs are very common, and a GMACS survey would have available typical source densities of
LBGs at different redshifts as follows. GMACS will easily obtain large numbers of galaxies at
these redshifts with spectroscopic data. Table 1 shows the expected numbers of LBGs per
GMACS field.
Table 1: Number of LBGs per GMACS field.
Redshift
Surface Density
[arcmin-2
]
Num. per
GMACS field limiting mag. Reference
2 5.4 780 R = 25.5 mag Reddy & Steidel 2009
3 2.3 330 R = 25.5 mag Reddy & Steidel 2009
4 1.7 240 i = 25.5 mag Bouwens et al. 2007
5 0.22 30 i = 25.5 mag Bouwens et al. 2007
For galaxies at 2 < z < 4, GMACS will go approximately 1-1.5 magnitudes deeper than existing
Keck surveys and be limited only by the physical number of slits available per mask. This will
allow not only studies of common ―L*‖ LBGs, but also sub-L* objects (down to ~0.25 L*).
GMACS Conceptual Design Report 12
With 100 slits per mask available for multiplexing, it will take a minimum of 25 masks to obtain
samples of ~2500 galaxies each at redshift 2, 3, and 4. At redshift z=5, the survey will be limited
by the number of GMACS masks as the source density is too low to fill out a GMACS mask.
Nevertheless, a sample of several hundred galaxies could be obtained with ~10 GMACS masks.
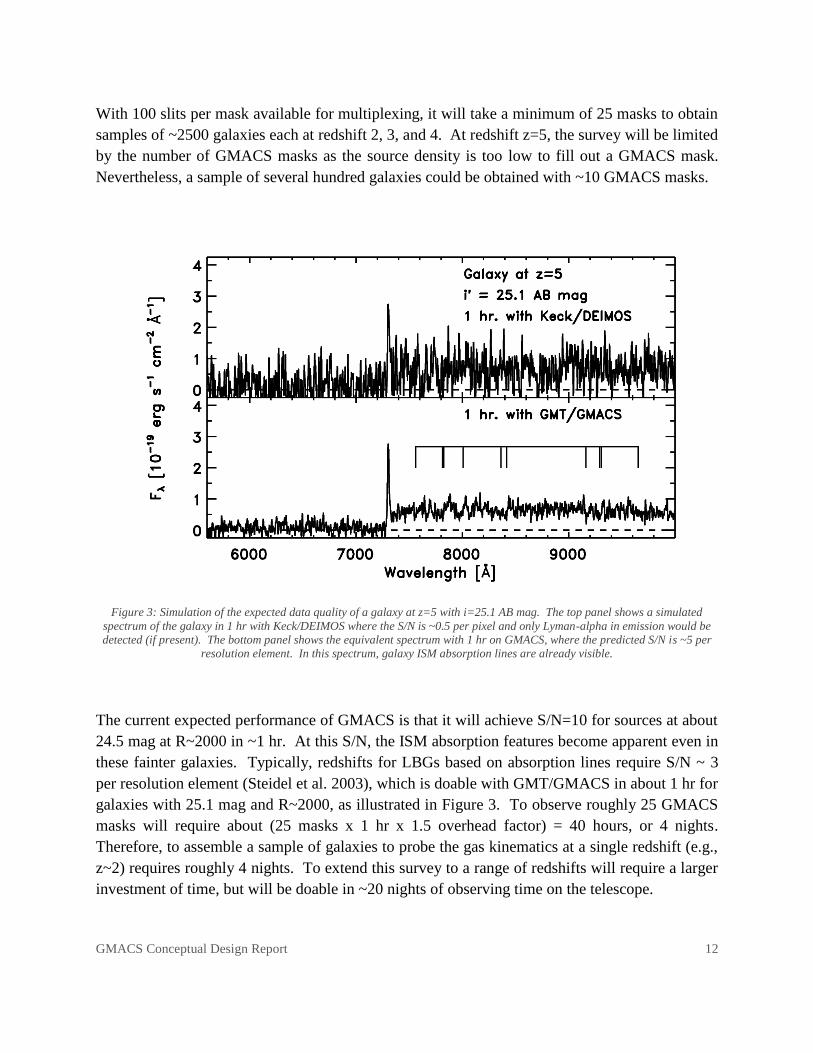
Figure 3: Simulation of the expected data quality of a galaxy at z=5 with i=25.1 AB mag. The top panel shows a simulated
spectrum of the galaxy in 1 hr with Keck/DEIMOS where the S/N is ~0.5 per pixel and only Lyman-alpha in emission would be
detected (if present). The bottom panel shows the equivalent spectrum with 1 hr on GMACS, where the predicted S/N is ~5 per
resolution element. In this spectrum, galaxy ISM absorption lines are already visible.
The current expected performance of GMACS is that it will achieve S/N=10 for sources at about
24.5 mag at R~2000 in ~1 hr. At this S/N, the ISM absorption features become apparent even in
these fainter galaxies. Typically, redshifts for LBGs based on absorption lines require S/N ~ 3
per resolution element (Steidel et al. 2003), which is doable with GMT/GMACS in about 1 hr for
galaxies with 25.1 mag and R~2000, as illustrated in Figure 3. To observe roughly 25 GMACS
masks will require about (25 masks x 1 hr x 1.5 overhead factor) = 40 hours, or 4 nights.
Therefore, to assemble a sample of galaxies to probe the gas kinematics at a single redshift (e.g.,
z~2) requires roughly 4 nights. To extend this survey to a range of redshifts will require a larger
investment of time, but will be doable in ~20 nights of observing time on the telescope.

GMACS Conceptual Design Report 13
In addition to the study of cold gas in outflows and inflows at 2 < z < 5, the survey envisioned
here will provide invaluable information for a variety of studies of galaxy evolution during this
redshift range, including the evolution of the UV luminosity function (e.g., Reddy & Steidel
2009), evolution of the mass-SFR relation (Stark et al. 2009), and the evolution of stellar
populations and extinction (Bouwens et al. 2007) in addition to other studies.
Target Selection: LBGs are very common. Typical source densities imply there will be many
tens or hundreds of targets per GMACS field of view. Existing deep-wide surveys (including
DES and LSST) will produce copious numbers of LBGs for spectroscopic follow-up. In
addition, there are large fields (many square degrees, including, e.g., CFHTLS) with existing
imaging to accommodate the spectroscopic program envisioned here.
Summary: A large spectroscopic survey of distant LBGs at 2 < z < 5 with GMT/GMACS
would allow the detailed study of the galactic CGM, and how the properties of galaxy outflows
and cold gas depend on galaxy luminosity, mass, and evolution with redshift. This GMACS
survey would extend to substantially fainter galaxies than currently possible using existing
instruments on 8-10 m telescopes. The total cost of such a survey is about 4 nights to study
galaxies in one cosmic volume. To study how these processes evolve with redshift would
require a substantially longer investment of time, up to 20 nights with GMT/GMACS.
Measuring the evolution of the Lyman alpha emission fraction in galaxies at z < 7.4.
Abstract: As Lyman alpha photons are scattered by neutral hydrogen, a change with redshift in
the Lyman alpha EW distribution of distant galaxies offers a promising probe of the degree of
ionization in the intergalactic medium. Therefore, observations of the evolution of the Lyman
alpha EW distribution with redshift can measure the time rate of change of the neutral-hydrogen
fraction during the epoch spanned by ~6 < z < ~ 7. This simple test constrains the end of the
cosmic reionization. Current observations of the ―Lyman-alpha fraction‖, x(Lya), using the
Keck 10 m telescopes show that x(Lya) varies strongly with redshift and galaxy luminosity at 3 <
z < 6: at fixed UV luminosity the prevalence of strong Lyman alpha emission increases
moderately with redshift, and low luminosity galaxies show a higher frequency strong Ly-alpha
emission. Extrapolating current trends predicts a steady increase of galaxies with high Lyman
alpha EW at z > 6. However, 8-10 m telescopes are inefficient at measuring x(Lya) at redshifts
> 6, precisely during the period during the crucial reionization period. GMACS on the GMT can
measure x(Lya) for galaxies out to z < 7.4 with an accuracy of 20% assuming x(Lya)~0.1 in six

GMACS Conceptual Design Report 14
nights. In this use case we describe an example program and provide sensitivity estimates and
simulated spectra that demonstrate how such a program might be carried out.
Motivation: Determining when neutral hydrogen in the IGM was reionized is an important
question for observational cosmology and a precursor to understanding the energetics of the first
galaxies (Robertson et al. 2010, Nature, 468, 49). One of the most practical probes of
reionization is the frequency of the occurrence of Lyman alpha photons, which is a strong
recombination line in star forming galaxies. As Lyman alpha photons are resonantly scattered by
neutral hydrogen, the abundance of galaxies with Lyman-alpha emission should decrease as
observations probe into the era where there is neutral gas (e.g., Malhotra & Rhoads 2004, apJ,
617, L5). Indeed, measuring the frequency of Lyman-alpha emission in galaxies during
reionization is sensitive to IGM neutral fractions of 10-100% (McQuinn et al. 2007), which is
very complementary to other measurements of the IGM from QSO sightlines and polarization of
the CMB.
Recent work using 8-10 m telescopes (Keck and VLT) have focused on measuring the fraction of
UV-selected Lyman-break galaxies (LBGs), selected as galaxies whose light shortward of
Lyman-alpha in the rest-frame is attenuated by neutral hydrogen along the line of sight, causing a
strong spectral ―break‖ in their colors (e.g., Giavalisco et al. 2004). LBGs can be selected over a
broad range in redshift and are less sensitive to cosmic variance. Stark et al. (2010, 2011)
measured evolution of the Lyman-alpha EW distribution of LBGs at 4 < z < 7 using ultra-deep
observations (6-12 hrs) with Keck/DEIMOS and the refurbished LRIS-R. Their result is
illustrated in Figure 3. From z=4 to 6 the fraction of LBGs with EW(Lya) > 25 angstroms
increases steadily, both in increasing redshift and increasing luminosity. To z=6 there is no
indication that the Universe is rapidly reaching neutrality.
Recently, several attempts have been made to measure the frequency of Lyman-alpha emission
in z > 6 galaxies using ultra-deep exposures on Keck and the VLT ranging from 12 hrs to 18 hrs
(Schenker et al. 2011; Fontana et al. 2011, ApJ, 725, L205; Ono et al. 2011, astro-ph/1107.3159),
all at the technological limit of current telescopes and instruments. These studies find few
objects with detectable Lyman-alpha emission. Figure 3 shows that the current limits tentatively
suggest a drop in the fraction of galaxies with EW(Lyman-alpha) > 25 angstroms from ~50% at
z=6 to ~10-40% at z=7 for objects around M(UV) = -20 mag. Therefore, the evidence suggests
that current technology is on the cusp of detecting the signature reionization.

GMACS Conceptual Design Report 15
Figure 4: The redshift evolution of the fraction of LBGs with Lyman-alpha emission and EW > 2.5nm, adapted from Stark et al.
(2010, 2011) and Schenker et al. (2011, astro-ph:1107.1261). There is tentative evidence of a sharp decline in the occurrence of
Lyman alpha emission between z=6 and z=7, which corresponds to a rapid increase in the neutral hydrogen fraction at z > 6.
Approach: GMT provides the collecting area needed to detect faint Lyman-alpha emission
directly without the need for gravitational lensing. GMACS offers the technological advantage
of its flux sensitivity out to the silicon cut off (>1 micron) and large field of view to measure this
signature of reionization. The GMACS field of view (9 arcminute x 18 arcminute) covers the
large areas needed to multiplex many candidate LBGs at z~6-7 and with its large field of view
GMACS can sample a large number of Lyman-alpha emitters in a single exposure. The large
wavelength coverage allows for the detection of Lyman-alpha emission to z~7.4 (at 1.0214
micron) with the spectral resolution to avoid contamination by night sky emission lines. Figure 4
shows that with R~2000 a substantial portion of the spectrum is available to detect galaxies with
Lyman-alpha emission as low as EW > 10-20 angstroms in a 2 hour integration with
GMT/GMACS. Finally, the simultaneous red and blue channels also allow rejection of
confusing sources (e.g. other lines) with high efficiency.
Current limits derived from 8-10 m telescopes suggest that the fraction of Lyman-alpha emission
at z=7 drops to 10%. One can envision a survey with the goal to measure this fraction accurately
(to within 20%), however this requires detections of a minimum of 30 LBGs with Lyman-alpha
emission at z=7. This is an order of magnitude increase in the number of such galaxies. Current

GMACS Conceptual Design Report 16
photometric searches suggest there are approximately 1 z=7 candidate galaxy per 10 sq. Arcmin
(Finkelstein et al. 2011). Assuming 10% of these will show Lyman-alpha emission with
EW > 25 angstrom requires that a survey target ~300 candidate z=7 sources. The surface density
of z=7 candidates implies there will be 14-15 objects per GMACS mask. To target ~300 z=7
sources requires 20 GMACS masks, covering a total field of view of 0.8 sq. deg. In 2 hrs
GMT/GMACS will reach a limiting line flux of 2-3 x 10-18
erg cm-2
s-1
, comparable to measured
line flux in the few confirmed z=7 sources (e.g., Fontana et al. 2011). Assuming 2 hrs of
integration per mask, and allowing that one-third of the observing time will go to overheads, the
survey envisioned here would require (2 hrs per mask x 20 masks x 1.5 overhead) = 60 hours, or
approximately 6 nights on the GMT. No other existing telescope or GSMT concept can execute
such a survey with the efficiency of GMACS and GMT.
Figure 5: Sensitivity limits to Lyman-alpha emission EW for galaxies with m=26 and 27 (AB mag) as indicated, adapted from
Schenker et al. (2011) with a spectral resolution of R~2000. The sensitivity limits correspond to a 12 hour exposure with
Keck/LRIS, which is comparable to a 2 hr exposure with GMT/GMACS.
Target Selection: Defining a suitable set of targets is a challenging part of surveys for distant
Lyman-alpha emitters. For the survey envisioned here, we require suitable z~7 LBGs over an
area of near 0.8 deg. Such a survey is planned using the VLT/VISTA instrument: UltraVISTA,
which will reach a limiting magnitude of Y(1 micron) = 26.7 (5 sigma, AB) over the 2 sq. deg
field of COSMOS. At this magnitude limit, the number density of z~7 LBGs at this magnitude
is ~0.1 per sq. Arcmin, which implies there will be nearly 700 candidates in the UltraVISTA
dataset. The UltraVISTA field is equatorial and easily accessible from the ESO site.
http://www.eso.org/sci/observing/policies/PublicSurveys/sciencePublicSurveys.html
Summary: A modest-depth, wide-field spectroscopic survey with GMACS will provide
spectroscopic confirmation of ~30 z~7 LBG galaxies with measured Lyman-alpha emission.

GMACS Conceptual Design Report 17
This survey will constrain to within ~20% the occurrence of LBGs at z=7 showing Lyman-alpha
emission EW > 25 angstroms, which provides strong constraints on the neutral hydrogen fraction
at this redshift. This will allow one to distinguish between models of reionization. The total cost
of such a survey requires multiple (~20) GMACS masks to moderate spectroscopic depth (~2 hrs
per mask), or approximately 6 nights of observing time.
Census of the Local Group Dark Matter Mass Function and the Dark Matter profiles of
dwarf galaxies
Abstract: Assuming that the dark-matter (DM) halo of the Milky Way tracks the expected
distribution of sub-halos in the current Lambda-CDM paradigm, there should be between ~300
and ~600 satellites (and possibly as many as 1000) within 400 kpc that are brighter than the
faintest known dwarf galaxies. Current results alleviate the primary worries of the so-called
missing satellite problem in CDM if various assumptions about the completeness limits from the
Milky Way are correct. However, these same models predict that deep, wide-field surveys such
as DES and LSST will deliver a complete census of dwarf satellite candidates out to the virial
radius of the Milky Way, offering the potential of new limits on the free-streaming scale of dark
matter and the low-luminosity threshold of galaxy formation in the faintest galaxies. Here we
show that modest surveys with GMT/GMACS will have the sensitivity to measure the velocity
dispersions (and hence the DM mass) as well as the dark matter profiles of these new dwarf
galaxies allowing for these fundamental tests of the nature of the cold dark matter halos of
galaxies.
Motivation: It is well established from simulations in the Lambda-CDM concordance
cosmology that galaxy dark-matter (DM) halos form by the merging of smaller halos over time
(Springel et al. 2005, Stewart et al. 2008). The generic prediction from these models is that a
large number of self-bound DM sub-halos should survive the merging process and exist within
the dark matter halos of ―L*‖ galaxies like the Milky Way (Klypin et al. 1999). However,
surveys for dwarf galaxies about the Milky Way reveal only ~20 luminous dwarf satellite
galaxies, approximately an order of magnitude fewer than the expected number of subhalos that
are thought to be massive enough to form stars. This has led to the well known ―missing satellite
problem‖ as it suggests our understanding of the formation of DM structures in the Universe is
grossly incomplete.
Recent observations (Simon & Geha 2007) have measured the DM masses of new faint dwarf
galaxies discovered in the SDSS. Combined with new models for the completeness limits of
GMACS Conceptual Design Report 18
these dwarfs, various studies show that the existing distribution of Milky Way satellites
alleviates the primary worries associated with the missing satellite problem (e.g., Simon & Geha
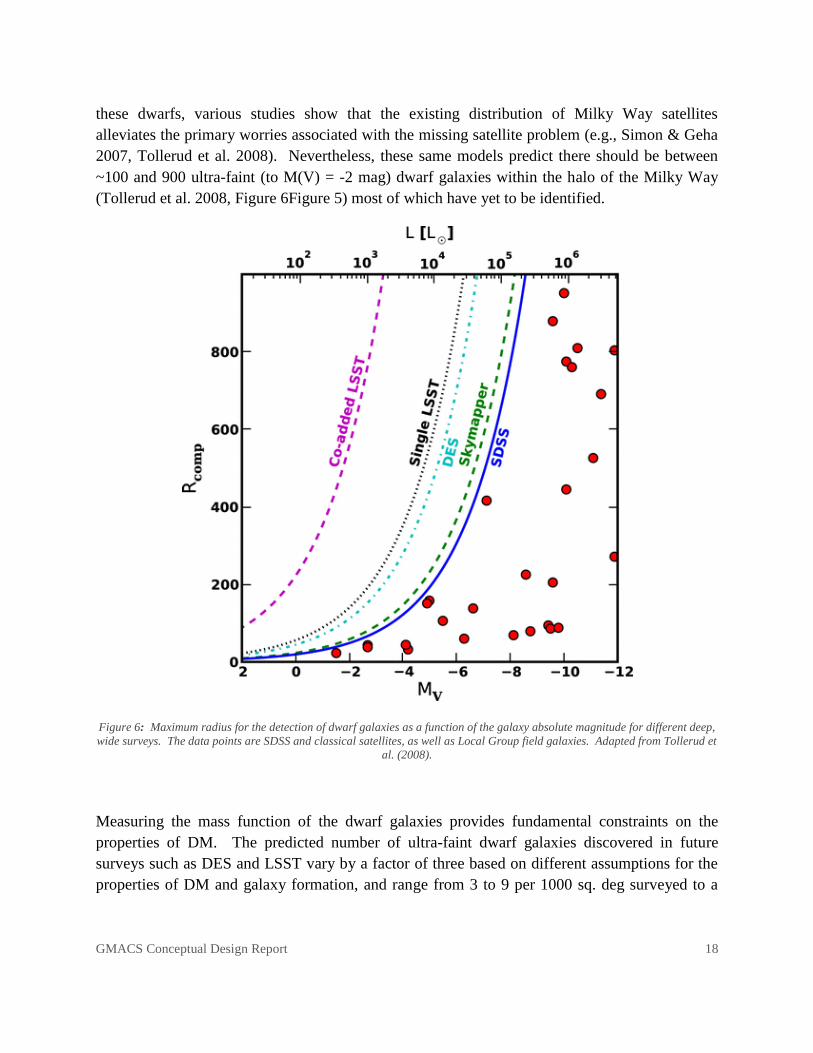
2007, Tollerud et al. 2008). Nevertheless, these same models predict there should be between
~100 and 900 ultra-faint (to M(V) = -2 mag) dwarf galaxies within the halo of the Milky Way
(Tollerud et al. 2008, Figure 6Figure 5) most of which have yet to be identified.
Figure 6: Maximum radius for the detection of dwarf galaxies as a function of the galaxy absolute magnitude for different deep,
wide surveys. The data points are SDSS and classical satellites, as well as Local Group field galaxies. Adapted from Tollerud et
al. (2008).
Measuring the mass function of the dwarf galaxies provides fundamental constraints on the
properties of DM. The predicted number of ultra-faint dwarf galaxies discovered in future
surveys such as DES and LSST vary by a factor of three based on different assumptions for the
properties of DM and galaxy formation, and range from 3 to 9 per 1000 sq. deg surveyed to a
GMACS Conceptual Design Report 19
limiting magnitude of r~24-24.5 (Tollerud et al. 2008). Therefore, characterizing the mass
function of these new dwarf galaxies will improve our constraints on the properties of DM by
many factors.
Another test of the properties of DM comes from the shape of the DM density distribution.
Lambda-CDM predicts that the DM halos should show steep central density ―cusps‖ (Navarro,
Frenk, & White 1996, NFW). Dwarf galaxies are ideal test subjects to measure dark matter
profiles as they are highly dark-matter dominated (with mass-to-light ratios approaching 1000),
even in the inner regions the baryons make a negligible contribution to the mass. Therefore, all
kinematics are dictated by the dark matter. An ongoing controversy driven by data is whether
dark matter halos exhibit such ―cusps‖ or if they show shallow density-profile ―cores.‖
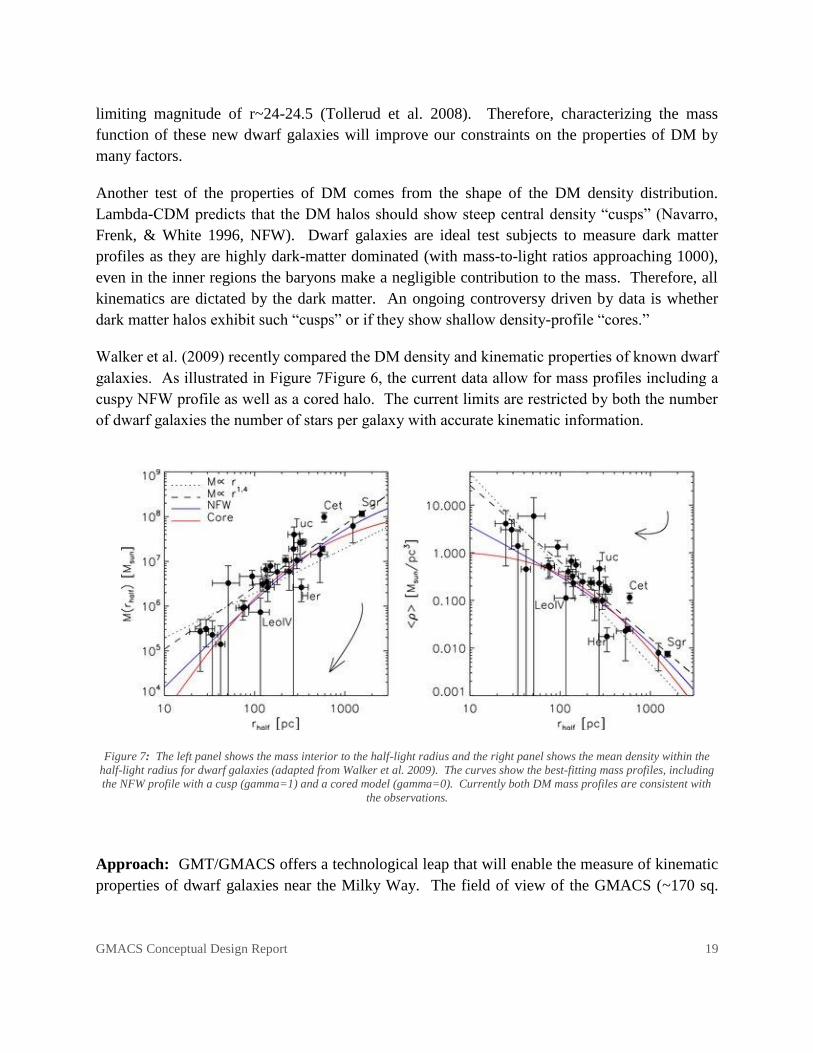
Walker et al. (2009) recently compared the DM density and kinematic properties of known dwarf
galaxies. As illustrated in Figure 7Figure 6, the current data allow for mass profiles including a
cuspy NFW profile as well as a cored halo. The current limits are restricted by both the number
of dwarf galaxies the number of stars per galaxy with accurate kinematic information.
Figure 7: The left panel shows the mass interior to the half-light radius and the right panel shows the mean density within the
half-light radius for dwarf galaxies (adapted from Walker et al. 2009). The curves show the best-fitting mass profiles, including
the NFW profile with a cusp (gamma=1) and a cored model (gamma=0). Currently both DM mass profiles are consistent with
the observations.
Approach: GMT/GMACS offers a technological leap that will enable the measure of kinematic
properties of dwarf galaxies near the Milky Way. The field of view of the GMACS (~170 sq.
GMACS Conceptual Design Report 20
Arcmin) compares favorably to the size of dwarf galaxies, which are expected to range in
diameter from 3 to 30 arcmin. Targeting entire dwarf galaxies will take no more than 2 GMACS
pointings. To confirm dwarf galaxies as gravitationally self-bound systems generally requires
kinematic information of at least 100 stars per object down to R = 23 mag at S/N=5. The
internal velocities of dwarf galaxies are small because they are low mass objects. Therefore, the
kinematic observations require precision on the order of 3 km/s, which sets the observational
spectral resolution requirement of R~5000.
The observing efficiency of GMACS is very high. Experience with Keck/DEIMOS has shown
that accurate kinematic data (typically delta(v) = 4 km/s) requires 150 min exposures for R=21.2
mag (Simon & Geha 2007), allowing a survey speed of 300 stars per night. To achieve this
spectral accuracy requires spectral resolutions of R~5000. Because of its large area and higher
sensitivity, equivalent observations with GMACS require 35 min allowing a 5x improvement in
survey efficiency of 1500 stars per night. GMT will have the ability to measure kinematic
information even for dwarfs out to 400 kpc, the virial radius of the Milky Way, which are
expected from surveys such as LSST and DES. Given that confirmation of dwarf galaxies
requires only a hundred stars per object, one can envision a survey of DES and LSST-selected
dwarf candidates where one can target up to 15 targets per night. These surveys can double the
number of known dwarfs in a few nights with GMT/GMACS. These observations will also
provide the kinematic data to measure the velocity dispersion and thus the dark matter mass of
dwarf galaxies for objects throughout the Milky Way halo.
To measure the dark matter mass profiles of dwarf galaxies requires substantial spectroscopic
information. The figure of merit is the accuracy of gamma, the exponent in the Hernquist (1980)
mass profile that dictates cored mass profiles (gamma = 0) compared to cuspy profiles (gamma >
0). Useful constraints require accuracies on gamma to 0.25, which requires kinematic
information for 5000 stars (Strigari et al. 2007). Many of the Milky Way galaxies have sufficient
stars for GMACS observations. Fornax has more than 10,000 stars brighter than R=20.5 (and
more than 30,000 brighter than R=21.2; Stetson et al. 1998) and Leo I contains more than 5000
stars brighter than R=21.6. Surveys of these dwarfs are very practical with GMACS. With a
survey speed of 1500 stars per night to these magnitude limits (see above), one can envision a
survey to measure accurately the dark matter profiles of a dwarf galaxy in a few nights per
object.
Lastly, the GMACS observations of the faint dwarf galaxies provide tests for galaxy assembly.
Simon & Geha (2007) showed that the metallicities of the ultra-faint Milky Way dwarfs are
among the most metal-poor systems in the known universe (see Figure 8). Their metallicities are
comparable to the low-metallicity tail of Galactic Globular Clusters. This result suggests that the
Galactic halo cannot have been assembled solely from objects stripped from current dwarf

GMACS Conceptual Design Report 21
galaxies. This presents severe challenges to models in which galaxy halos are assembled
hierarchically from dwarf-galaxy-sized subhalos. Surveys with GMACS-type observations will
increase the number of dwarf galaxies with known metallicities by an order of magnitude,
allowing for constraints to be placed on chemical enrichment in sub-halo systems.
Figure 8: Metallicity-Luminosity relationship for dwarf galaxies in the Local Group. The ultra-faint dwarfs are among the most
metal-poor stellar systems known. Because the ultra-faint dwarfs lie at the low-metallicity tail of the distribution for Galactic
globular clusters, the Galactic halo could not be built solely from ultra-faint dwarfs.
Target Selection: Forthcoming wide-field surveys will provide a tremendous set of dwarf-
galaxy targets for GMT. Models including the effects of survey completeness predict roughly 3-
9 dwarf galaxies to r~24-24.5 mag per 1000 sq. deg surveyed with DES and LSST (Tollerud et
al. 2008). This implies there will be 20-40 new dwarfs discovered by DES and an additional
100-200 by LSST suitable for spectroscopic follow-up with the GMT/GMACS.
Summary: GMT/GMACS will provide highly efficient follow-up of dwarf galaxies discovered
in forthcoming imaging surveys. GMACS has the appropriate field-of-view (some dwarfs will
have diameters up to 30 arcminutes), spectral resolution (R~5000), and sensitivity (1500 stars
per night at R=21.2, 35 min with velocity uncertainties 3 km/s) to do this science. Surveys with
GMT/GMACS can target up to 15 dwarf candidates from wide-field surveys per night, with the
potential to more than double the number of known dwarfs in as little as a few nights. In
addition, GMACS/GMT has the ability to characterize accurately the DM masses and DM
profiles of these dwarf galaxies. This requires kinematic information for ~5000 stars. Given the
survey efficiency of GMACS, these observations can be achieved in as little as 3 nights per

GMACS Conceptual Design Report 22
dwarf galaxy. These measurements will allow for measurements of the dwarf galaxy halo mass
function and allow for fundamental tests of the nature of the cold dark matter halos of galaxies.
Constraining the Galactic Halo and Galactic Center through spectroscopy of Galaxy
Halo and Hypervelocity Stars
Abstract: Hypervelocity stars (HVS) are Galactic stars with velocities in excess of the Galactic
escape speed. Characterizing their properties provides unique tracers of the Milky Way halo and
the Galactic center. In addition, characterizing the spatial and kinematic distribution of stars in
the halo allows one to measure the shape and size of the Milky Way dark matter halo, which is
poorly known, and to make progress requires measuring ―common‖ stars out to ~50 kpc. Both
of these goals are achievable with a study using GMT/GMACS to target Galactic Halo F-stars.
The GMACS survey would serve as a highly efficient ―piggy-back‖ program. Everywhere
GMACS points will contain tens of Halo F stars in the range 20 < g < 23, of which 1 out of every
200 will be an HVS. A systematic and ongoing search with GMACS of Halo F stars as filler
targets will produce over time (1) a few HVSs per every 100 sq. deg surveyed and (2) an
enormous database of Halo F-stars. This will permit studies both of the shape and size of the
Galactic Halo, but also allow for an unprecedented study of the conditions in the Galactic center.
Motivation: We plan to probe star formation in extreme environments by constraining the
stellar mass function of stars in the Galactic Center through a census of low mass hypervelocity
stars. The structure, extent, and total amount of dark matter in galaxies are of fundamental
importance in understanding galaxy formation and evolution, including the expected number of
dark matter sub-halos and the merger history of galaxies. The shape and size of the Milky Way's
dark matter halo are among the most poorly known of all Galactic parameters despite the fact
that we now have the tools to improve these measurements. Current observational estimates of
the mass and shape of the dark matter halo are based on very small numbers of objects. The
Milky Way's gas rotation curve has not been traced beyond ~20 kpc. Wilkinson & Evans (1999)
used the velocities of 27 satellite galaxies and globular clusters to conclude the Milky Way halo
mass is 1.9 (+3.6, -1.7) x 1012
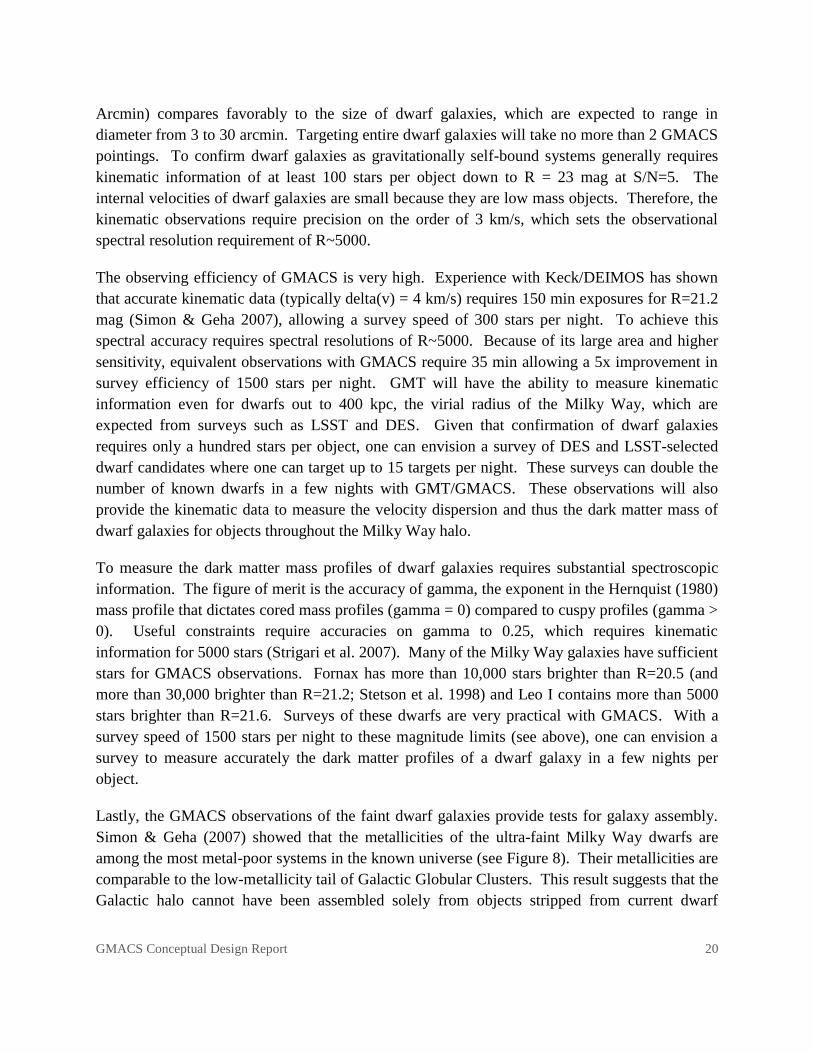
solar masses. Battaglia et al. (2005) claim the first detection of a
declining velocity dispersion at radii > 50 kpc, based on 19 objects with 50 < r < 100 kpc (see
Figure 9). Xue et al. (2008, ApJ, 684, 1143) present the combined sample of 2401 SDSS and
SEGUE blue horizontal branch stars and find a total halo mass of 1.0±0.3 x 10¹²
solar masses,
however only 80 SDSS and SEGUE horizontal branch stars have r > 50 kpc and none beyond r >
60 kpc.
GMACS Conceptual Design Report 23
Luminous but sparse tracers such as globular clusters and horizontal branch stars have
traditionally probed the stellar halo. Far better tracers are lower mass F-type stars—stars at the
main sequence turn-off of the halo. They have a number density 100 times higher than other
tracers, but are intrinsically faint. To reach 50-100 kpc depths we need to observe 22-24 mag F
stars. Wide-field deep imaging surveys (e.g., DES and LSST) will easily identify Halo F-stars
by their ugri colors at these depths. But to measure the size and shape of the Milky Way halo
requires kinematic data available only through intermediate spectroscopy of faint sources.
Figure 9: Measurement of the size and shape of the Galactic halo from Battaglia et al. (2005). Left: contours showing the 68,
95, and 99% confidence regions for the size and shape of an isothermal sphere model for the Galactic halo. Right: observed
velocity dispersion overlaid with the best-fitting model for the isothermal sphere. The analysis here used only 19 objects with 50
< r/kpc < 100, which show tentative evidence for a strong departure from the isothermal model at these radii. To test for
departure from the isothermal sphere model requires greatly enlarged samples of objects are large galactocentric radii.
In addition to measuring the velocity dispersion profile and total dark matter halo mass of the
Milky Way, one can use the radial velocities of stars in the Halo to test the merger history
predicted by hierarchical galaxy formation models. The remnants of past minor galaxy mergers
will appear as streams of stars moving together; the highest contrast streams will be at the
greatest distances. Existing star stream detections are based almost entirely on counting stars
(e.g., Belokurov et al 2006). A radial velocity survey of dense tracers will allow us to identify
star streams in velocity space as well as determine their orbits.
Finally, we will identify extremely rare objects such as hypervelocity stars (HVS) ejected from
the Galactic center. The frequency, spectral properties and distribution of HVSs provides
important constraints on the character of star formation and the stellar mass function in the
GMACS Conceptual Design Report 24
Galactic Center (GC), the history of stars interacting with the central black hole, and with
sufficient statistics they are unique dynamical tracers of the Milky Way halo. For example
Ginsburg & Loeb (2006) suggest that the stars on highly eccentric orbits around Sgr A* may be
former companions to a HVS ejected by the central massive black hole. Gnedin et al. (2005)
show that the distance and full space motion of HVSs can provide significant constraints on the
shape of the dark matter halo. Yu & Tremaine (2003) show that star encounters with binary
massive black holes produce an order of magnitude more HVSs than encounters with a single
massive black hole.
However, identifying HVSs requires a deep survey covering a large volume of space. The first
HVS discovery was a serendipitous event in a kinematic survey of blue horizontal branch stars
(Brown et al. 2005), with two additional serendipitous HVSs discovered as part of surveys for
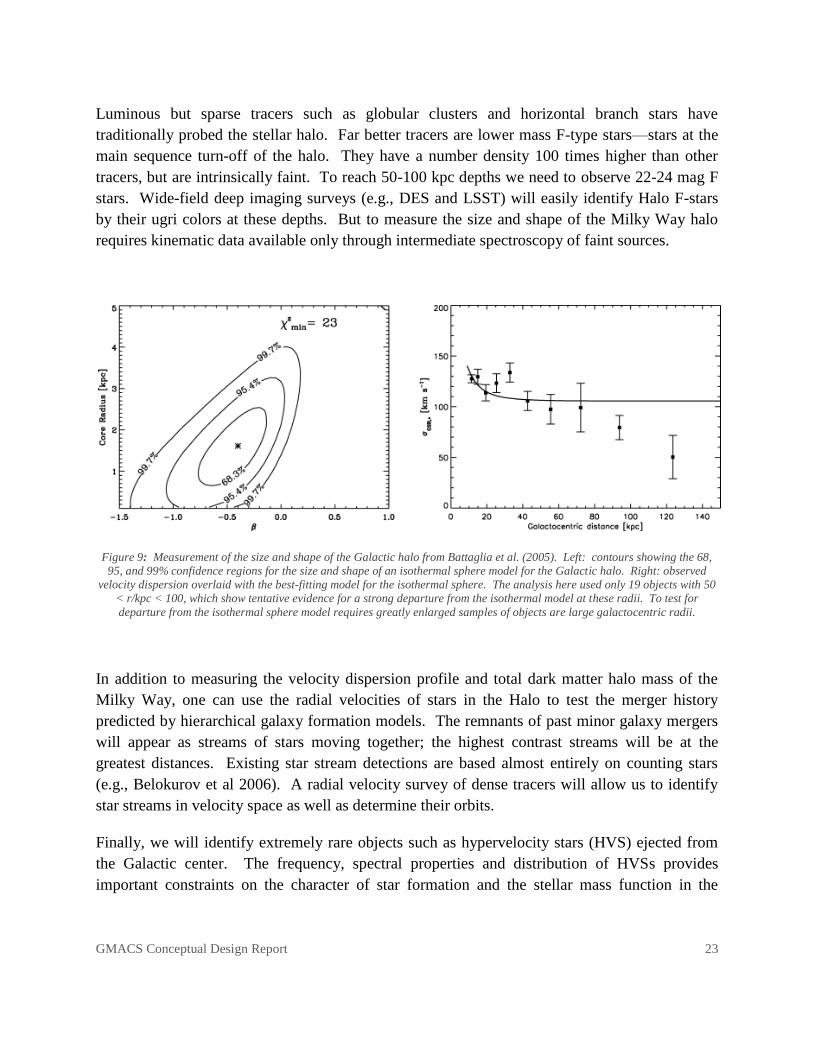
early-type stars (Edelmann et al. 2005, Hirsch et al. 2005). The first targeted search for HVSs
found 4 probable objects out of 894 candidates from a field of 5000 sq. deg (Brown et al.
2006a,b, 2007, see Figure 10).
Figure 10: Velocity histogram of late B-type stars in the HVS survey of Brown et al. (2006, ApJ, 640, L35). Two HVS are
idenitifed with galactoradial recessional velocities of >550 km/s.
Kollmeier & Gould (2007) argue that targeting 21-22 mag F stars is the optimal approach for
finding low mass HVSs, which have longer lifetimes, and therefore higher surface densities.
They predict a surface density of 1 unbound F star per 50 sq. deg. Finding F-type hypervelocity
stars places unique constraints on the mass function of stars orbiting near the central black hole,
the history of stars interacting with the central black hole, and, in conjunction with proper
motions, the shape of the dark matter halo. However, because F-stars are intrinsically fainter
GMACS Conceptual Design Report 25
compared to earlier type stars, only deep spectroscopic data can measure their line of sight
velocities and confirm they exceed the escape speed of the galaxy.
Approach: Star counts of 20 < g < 21 mag F-type stars in SDSS stripe 82 demonstrate that the
density of targets is about 100 per square degree. Thus everywhere GMT points on the sky, its
field-of-view will contain tens of halo F stars in the range 20 < g < 23 mag. A search for
hypervelocity F stars is therefore well suited to be a piggy-back project, pairing with a wide
range of other spectroscopic projects. One could obtain 20 - 25 km/s precision with S/N = 5 in
the continuum, which is adequate for measuring the velocity dispersion of the halo and for
identifying unbound hypervelocity stars. We require a survey area of ~10 square degrees to
measure the velocity dispersion at 50 kpc, and ~100 square degrees to find F-type HVSs and
possibly identify star streams.
F-type main-sequence stars are visible to GMT/GMACS out to r > 50 kpc with 20 < g < 23 mag.
To study the kinematics of the Galactic Halo requires blue-sensitive spectroscopy with velocities
accurate to <20 km/s. This sets the observational requirement for the spectral resolution of R >
2000 at a spectral range 3500-5500 angstroms where the emission from F-stars peaks. For the
expected magnitudes of the most distant F-stars, g = 24, GMACS will obtain S/N=10 spectra in
roughly 1 hr of integration, which is sufficient to measure the radial velocities of the stars to the
needed accuracy of <20 km/s.
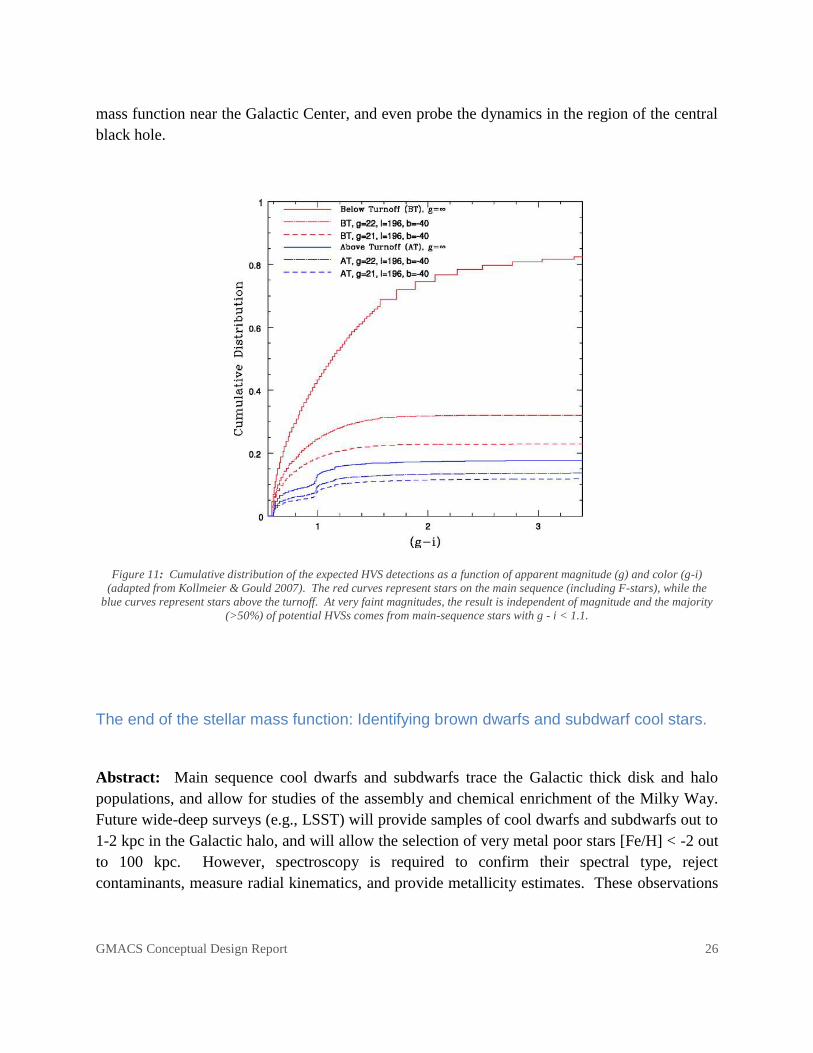
Target Selection: Old population HVSs are much less common than the relatively low density
population of halo stars. Kollmeier & Gould (2007) estimate the backgrounds to searches of
HVSs and model the cumulative distribution of the expected HVS detections as a function of
apparent magnitude g and g - i color as illustrated in Figure 11. By far the most important
conclusion is that the majority (>50%) of the potential sensitivity to old-population HVSs comes
from stars with g-i colors within 0.5 mag of the main-sequence turnoff (i.e, with g - i < 1.1 mag).
By contrast, M- and K-type dwarfs and M- and K-type giants contribute very little because the
former are too faint (and only visible over a small volume) and the latter are too rare. Therefore,
at fixed magnitude a color selection of 0.3 < g-i < 1.1 has the highest probability of selecting
halo F-stars, and candidates for HVS.
Summary: We outlined a ―piggy-back‖ survey form GMT/GMACS to measure F-type stars in
the Galactic Halo. Every GMACS field of view will contain tens of halo F-stars, which can be
pre-selected by optical color from surveys such as LSST. The large database of Halo F-stars will
allow for greatly improved constraints on the shape and size of the Galactic Halo primarily by
increasing the number of stars at large galactocentric radii, r > 50 kpc. In addition, 1 out of every
200 F-stars may be a HVS. These objects constrain the nature of star formation and the stellar
GMACS Conceptual Design Report 26
mass function near the Galactic Center, and even probe the dynamics in the region of the central
black hole.
Figure 11: Cumulative distribution of the expected HVS detections as a function of apparent magnitude (g) and color (g-i)
(adapted from Kollmeier & Gould 2007). The red curves represent stars on the main sequence (including F-stars), while the
blue curves represent stars above the turnoff. At very faint magnitudes, the result is independent of magnitude and the majority
(>50%) of potential HVSs comes from main-sequence stars with g - i < 1.1.
The end of the stellar mass function: Identifying brown dwarfs and subdwarf cool stars.
Abstract: Main sequence cool dwarfs and subdwarfs trace the Galactic thick disk and halo
populations, and allow for studies of the assembly and chemical enrichment of the Milky Way.
Future wide-deep surveys (e.g., LSST) will provide samples of cool dwarfs and subdwarfs out to
1-2 kpc in the Galactic halo, and will allow the selection of very metal poor stars [Fe/H] < -2 out
to 100 kpc. However, spectroscopy is required to confirm their spectral type, reject
contaminants, measure radial kinematics, and provide metallicity estimates. These observations
GMACS Conceptual Design Report 27
will provide the kinematic data to study the structures of the Milky Way. In addition, these
surveys will provide many hundreds of subdwarfs of L, T, and Y type. Spectroscopic follow-up
of the spectral types is required to confirm their nature and to study the physics and chemistry of
their atmospheres. We envision a survey with GMT/GMACS to provide spectroscopic
observations of dwarfs and subdwarfs. GMACS will allow the study of main-sequence cool
dwarfs out to 1-2 kpc and the study of brown dwarfs out to several 100 pc, increasing the known
samples of these objects by more than an order of magnitude.
Motivation: Cool subdwarfs are main sequence stars, which have both low mass and low metal
abundance. They have historically been identified from catalogs of stars with large proper
motion, where they show up as high velocity, faint, red stars. Kinematically they are associated
with the local thick disk and halo populations. Because they are surviving members of the
earliest generations of Galactic stars with main-sequence lifetimes longer than the age of the
Universe they hold important clues to the formation of the Milky Way.
The study of the dynamics, orbital characteristics, and metallicity distribution of these stars can
illuminate the formation and dynamical evolution of the Galaxy. Because cool subdwarfs do not
undergo significant elemental enrichment of their atmospheres, they retain their original
elemental composition from the time of their birth. This makes them near-perfect tracers of the
early chemical composition of the gas that formed the first generations of low-mass stars.
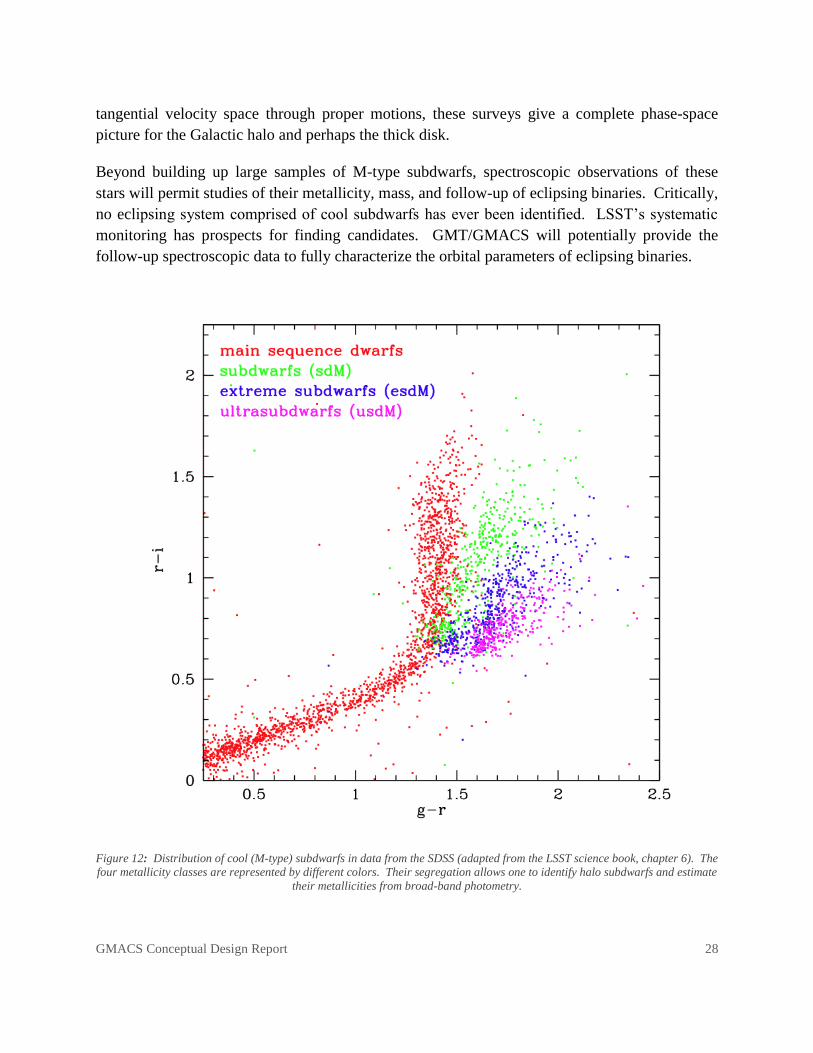
Cool stars of M-type have atmospheres dominated by molecular bands from (most notably) CaH,
TiO, and VO. Metallicity variations result in marked differences in the absolute and relative
strengths of these bands. M-type dwarfs and subdwarfs therefore display significant variations in
their broadband colors. Metal-poor subdwarfs in the Galactic halo populate a distinct locus in
the g-r / r-i color-color diagram, making candidates easy to identify. The major caveat is that
this color-color space is also populated by extragalactic sources, which are distinguishable
through their zero proper motions and through spectroscopic follow-up.
The main limitation in using low-mass subdwarfs is their faint luminosities, ranging from 10 <
M(r) < 15. SDSS can measure photometry to r=22 and proper motions to r=20, probing M-
dwarfs out to only a few hundred parsecs. Future wide-field, deep surveys will build up very
large samples of M-dwarf and subdwarf candidates. LSST will identify candidates on a much
grander scale with photometry to r=27 and proper motion data to r=24.5; LSST will detect M
dwarfs to a distance of 1 kpc.
The best estimates are that accurate distances to subdwarfs from broad-band photometry will be
accurate to 50%. Surveys of spectroscopic campaigns targeting between hundreds and thousands
of M dwarfs have the potential to map substructure in radial velocity space. Combined with
GMACS Conceptual Design Report 28
tangential velocity space through proper motions, these surveys give a complete phase-space
picture for the Galactic halo and perhaps the thick disk.
Beyond building up large samples of M-type subdwarfs, spectroscopic observations of these
stars will permit studies of their metallicity, mass, and follow-up of eclipsing binaries. Critically,
no eclipsing system comprised of cool subdwarfs has ever been identified. LSST’s systematic
monitoring has prospects for finding candidates. GMT/GMACS will potentially provide the
follow-up spectroscopic data to fully characterize the orbital parameters of eclipsing binaries.
Figure 12: Distribution of cool (M-type) subdwarfs in data from the SDSS (adapted from the LSST science book, chapter 6). The
four metallicity classes are represented by different colors. Their segregation allows one to identify halo subdwarfs and estimate
their metallicities from broad-band photometry.
GMACS Conceptual Design Report 29
The spectroscopic follow-up of cool dwarfs and subdwarfs also allows the study of metal-poor
stars in the Galaxy. Traditionally, candidates for metal-poor stars require moderate-resolution
follow-up from imaging surveys to validate genuine metal-poor stars among large numbers of
candidates. Wide-deep surveys like the LSST will provide photometric selection of metal-poor
candidates out to over 100 kpc from the Galactic center. Similar techniques have been used with
SDSS (and SDSS II and III) to identify candidate very metal-poor [Fe/H] < -2.0 stars, which are
subsequently observed with moderate resolution spectroscopy (R~2000). In the LSST era,
metal-poor candidates will be too faint for current technology, and studies with instruments like
GMACS will be required to capitalize on this science.
Beyond building up large samples of main-sequence subdwarfs, LSST will also uncover
substantial samples of cooler L-dwarfs (very low mass stars and brown dwarfs). L dwarfs have
effective temperatures between 1500-2200 K, with spectra showing weakened TiO absorption. T
dwarfs have Teff between 800-1500 K, and show increased absorption from CH4 in their
atmospheres. L subdwarfs have masses spanning the metallicity-dependent, H-burning limit,
making critical probes of both low mass star formation and thermal transport in partially
degenerate stellar interiors. Their atmospheres are also important laboratories for testing models
of chemistry in low-temperature photospheres, in particular dust condensate and cloud
formation.
L dwarfs are largely identified serendipitously with 2MASS and SDSS. They are very faint,
with ~15 < M(i) < ~18. Although their masses and luminosities are low, they are relatively
common in the Solar neighborhood, with 600 L and 150 T dwarfs now confirmed by
spectroscopy. Future surveys will build considerable samples of them. LSST will build quasi-
volume complete samples out to a couple hundred parsecs, and LSST should discover even
cooler T-type subdwarfs.
The spectral properties of L-dwarfs are poorly understood and completely unknown for T-type
subdwarfs, including how their spectra depend on metallicity effects. Spectroscopy will be
required to probe the physics and chemistry of the photospheres of these objects.
Approach: LSST will measure accurate proper motions of M dwarfs and subdwarfs to r=24.5,
out to 1 kpc. Halo stars in the Solar neighborhood have large transverse velocities, 100 km/s,
which yield proper motions of >20 mas/yr up to 1 kpc. To detect these proper motions with
LSST requires an accuracy of 0.2 mas/yr. GMT with GMACS can obtain spectroscopy of M
dwarf and subdwarf candidates selected via proper motion studies. In 1 hour GMACS will
obtain spectra with S/N=10 for all M dwarfs selected from proper motion studies with LSST
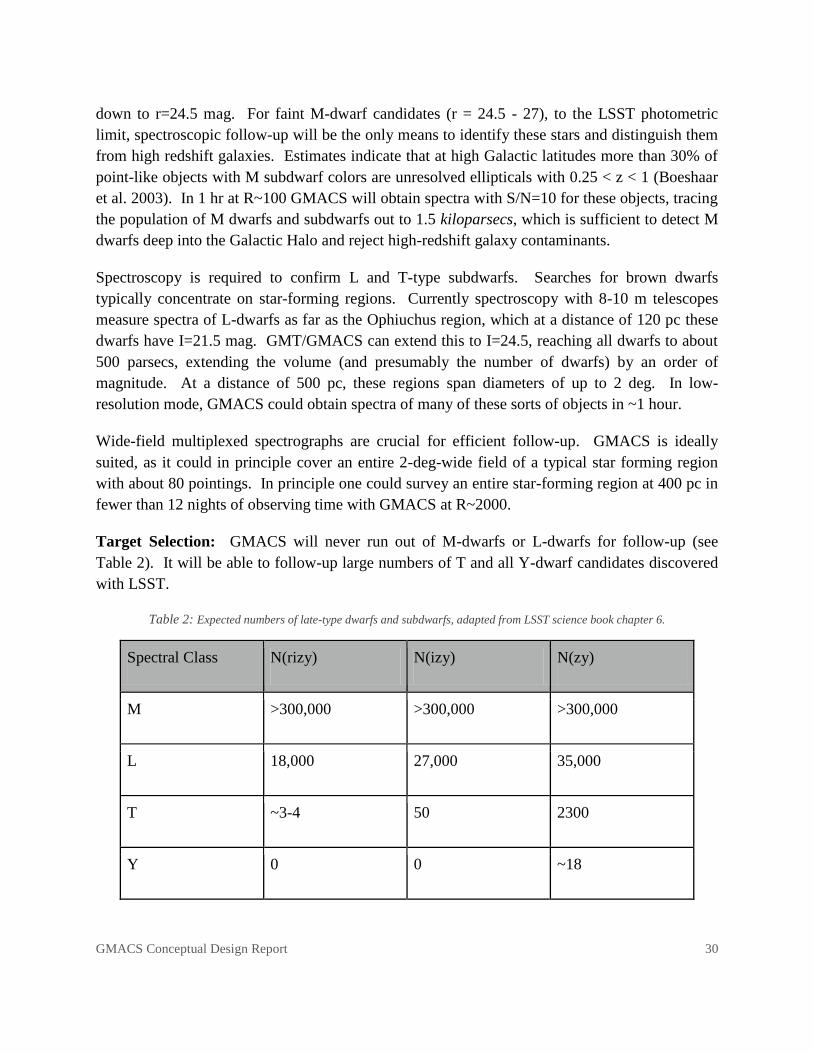
GMACS Conceptual Design Report 30
down to r=24.5 mag. For faint M-dwarf candidates (r = 24.5 - 27), to the LSST photometric
limit, spectroscopic follow-up will be the only means to identify these stars and distinguish them
from high redshift galaxies. Estimates indicate that at high Galactic latitudes more than 30% of
point-like objects with M subdwarf colors are unresolved ellipticals with 0.25 < z < 1 (Boeshaar
et al. 2003). In 1 hr at R~100 GMACS will obtain spectra with S/N=10 for these objects, tracing
the population of M dwarfs and subdwarfs out to 1.5 kiloparsecs, which is sufficient to detect M
dwarfs deep into the Galactic Halo and reject high-redshift galaxy contaminants.
Spectroscopy is required to confirm L and T-type subdwarfs. Searches for brown dwarfs
typically concentrate on star-forming regions. Currently spectroscopy with 8-10 m telescopes
measure spectra of L-dwarfs as far as the Ophiuchus region, which at a distance of 120 pc these
dwarfs have I=21.5 mag. GMT/GMACS can extend this to I=24.5, reaching all dwarfs to about
500 parsecs, extending the volume (and presumably the number of dwarfs) by an order of
magnitude. At a distance of 500 pc, these regions span diameters of up to 2 deg. In low-
resolution mode, GMACS could obtain spectra of many of these sorts of objects in ~1 hour.
Wide-field multiplexed spectrographs are crucial for efficient follow-up. GMACS is ideally
suited, as it could in principle cover an entire 2-deg-wide field of a typical star forming region
with about 80 pointings. In principle one could survey an entire star-forming region at 400 pc in
fewer than 12 nights of observing time with GMACS at R~2000.
Target Selection: GMACS will never run out of M-dwarfs or L-dwarfs for follow-up (see
Table 2). It will be able to follow-up large numbers of T and all Y-dwarf candidates discovered
with LSST.
Table 2: Expected numbers of late-type dwarfs and subdwarfs, adapted from LSST science book chapter 6.
Spectral Class N(rizy) N(izy) N(zy)
M >300,000 >300,000 >300,000
L 18,000 27,000 35,000
T ~3-4 50 2300
Y 0 0 ~18
GMACS Conceptual Design Report 31
Summary: Surveys with GMT/GMACS will allow the identification and the study of cool main
sequence dwarfs and subdwarfs in a ten-fold increase in volume of the Milky Way compared to
existing technology. A survey with GMT/GMACS will allow for complete kinematic
information of cool dwarfs out to 1-2 kpc in the Galactic Halo, and it will allow for the
identification of very metal poor stars out to as far as 100 kpc. In addition, ambitious surveys
with GMACS with up to 12 nights can provide complete coverage of star-forming regions to
search for late-type brown dwarfs to distances of 500 kpcs.
Measuring the Faint End Slope of the Ly Luminosity Function at z ~ 6
Abstract: The source of reionization at z > 6 remains uncertain as the present suite of telescopes
and instruments appear to be unable to probe deep enough to reach the relevant population. The
most likely source of reionization is a faint population of star forming galaxies at redshifts above
six. The Ly luminosity at z~6 provides a probe of the production rate, and escape fraction, of
ionizing photons at the end of the dark ages. A steep faint end slope would produce enough
photons to reionize the IGM; if the faint end of the LF is shallow then some other population
must be identified. GMACS on the GMT can measure the faint end slope at z ~6 in as few as
four nights. In this use case we describe an example program and provide sensitivity estimates
and simulated spectra that demonstrate how such a program might be carried out.
Motivation: Reionization is one of the major transition points in the evolution of the baryonic
content of the Universe. Our empirical knowledge of the timing of reionization and the source of
the ionization itself are quite rudimentary. Observations of the Gunn-Peterson effect place a
lower bound of z ~ 6.4 for the end of the reionization era and observations electron scattering in
the CMB suggest an upper limit of z ~ 12. Attempts to isolate the population of objects
responsible for a sufficient flux of ionizing photons have been indeterminate. The space density
of high luminosity sources such as bright quasars is too low. The importance of more abundant
systems like UV luminous galaxies depends strongly on the escape fraction below the Lyman
limit. Estimates of the total energy density in ionizing photons from UV bright galaxies depend
strongly on the shape of the luminosity function and the slope at the faint end in particular. As
the total UV luminosity density is determined by the integral of the LF, the faint end slope is
critical; if the LF is shallow the integral is dominated by sources near L*, if it is steep the faint
sources can make an important, even dominant, contribution.
GMACS Conceptual Design Report 32
Our present understanding of the faint-end slope for the galaxy and AGN luminosity functions at
z ~ 5 is rather limited. Luminosity function for continuum selected objects are based on their
deep imaging studies and photometric redshifts, or extrapolations of the luminosity functions at z
~ 3. The Ly LF is more relevant as it is pre-selected for objects with non-zero escape fractions.
At present our understanding of the faint end of the Ly LF is limited to very small sight lines
along strong gravitational lensing caustics in massive clusters. At the bright end the LF is
determined from wide-area searches with narrow band filters and somewhat deeper
spectroscopic surveys, both confined to narrow slices of redshift in which the sky is dark. In
Figure 13 we show the Ly luminosity function from Malhotra & Rhoads (2007). The faint end
is determined by detections of only ~ 11 objects from gravitational lensing studies. The
errorbars are dominated by the small number statistics. There are additional errors associated
with uncertainties in the magnification corrections. The extant data favor a steep slope, but the
range of slopes allowed is quite large.
Approach: GMT provides the collecting area needed to detect faint Ly emission directly
without the need for gravitational lensing. GMACS, with its large field of view can sample a
large number of Ly alpha emitters in a single exposure. The large wavelength coverage enabled
by the red and blue channels also allows one to reject confusing sources (e.g. other lines) with
high efficiency.
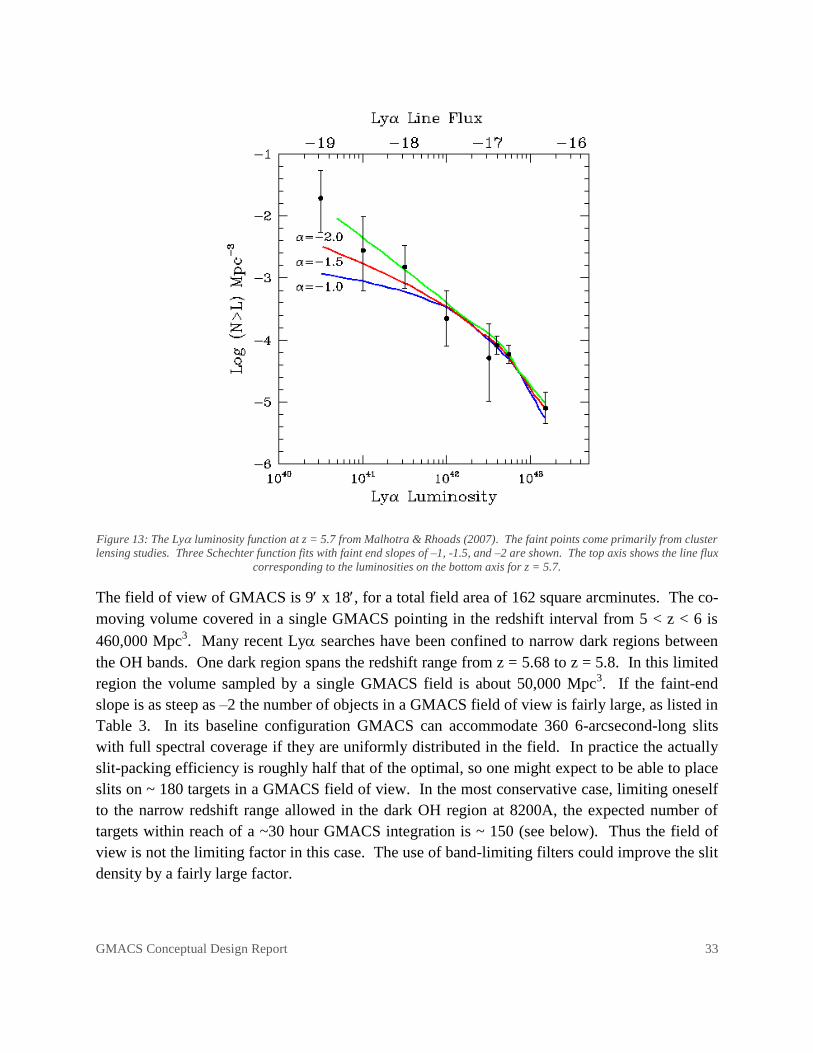
GMACS Conceptual Design Report 33
Figure 13: The Ly luminosity function at z = 5.7 from Malhotra & Rhoads (2007). The faint points come primarily from cluster
lensing studies. Three Schechter function fits with faint end slopes of –1, -1.5, and –2 are shown. The top axis shows the line flux
corresponding to the luminosities on the bottom axis for z = 5.7.
The field of view of GMACS is 9 x 18, for a total field area of 162 square arcminutes. The co-
moving volume covered in a single GMACS pointing in the redshift interval from 5 < z < 6 is
460,000 Mpc3. Many recent Ly searches have been confined to narrow dark regions between
the OH bands. One dark region spans the redshift range from z = 5.68 to z = 5.8. In this limited
region the volume sampled by a single GMACS field is about 50,000 Mpc3. If the faint-end
slope is as steep as –2 the number of objects in a GMACS field of view is fairly large, as listed in
Table 3. In its baseline configuration GMACS can accommodate 360 6-arcsecond-long slits
with full spectral coverage if they are uniformly distributed in the field. In practice the actually
slit-packing efficiency is roughly half that of the optimal, so one might expect to be able to place
slits on ~ 180 targets in a GMACS field of view. In the most conservative case, limiting oneself
to the narrow redshift range allowed in the dark OH region at 8200A, the expected number of
targets within reach of a ~30 hour GMACS integration is ~ 150 (see below). Thus the field of
view is not the limiting factor in this case. The use of band-limiting filters could improve the slit
density by a fairly large factor.
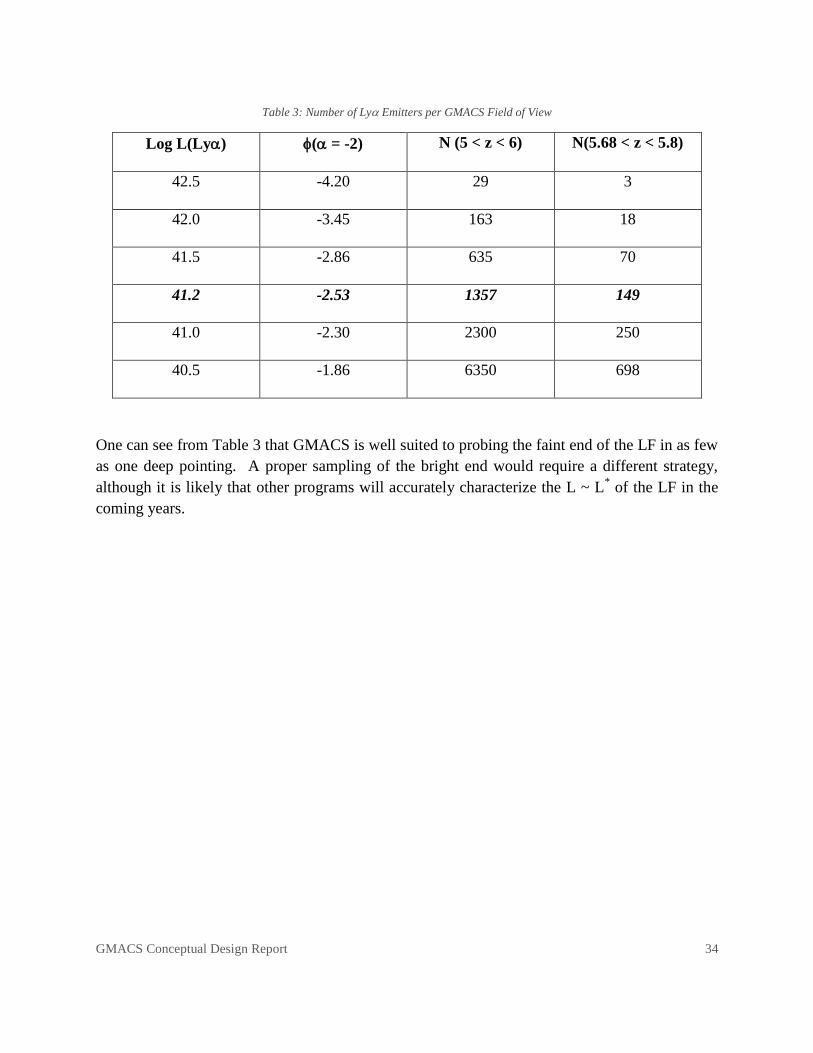
GMACS Conceptual Design Report 34
Table 3: Number of Ly Emitters per GMACS Field of View
Log L(Ly) ( = -2) N (5 < z < 6) N(5.68 < z < 5.8)
42.5 -4.20 29 3
42.0 -3.45 163 18
41.5 -2.86 635 70
41.2 -2.53 1357 149
41.0 -2.30 2300 250
40.5 -1.86 6350 698
One can see from Table 3 that GMACS is well suited to probing the faint end of the LF in as few
as one deep pointing. A proper sampling of the bright end would require a different strategy,
although it is likely that other programs will accurately characterize the L ~ L* of the LF in the
coming years.
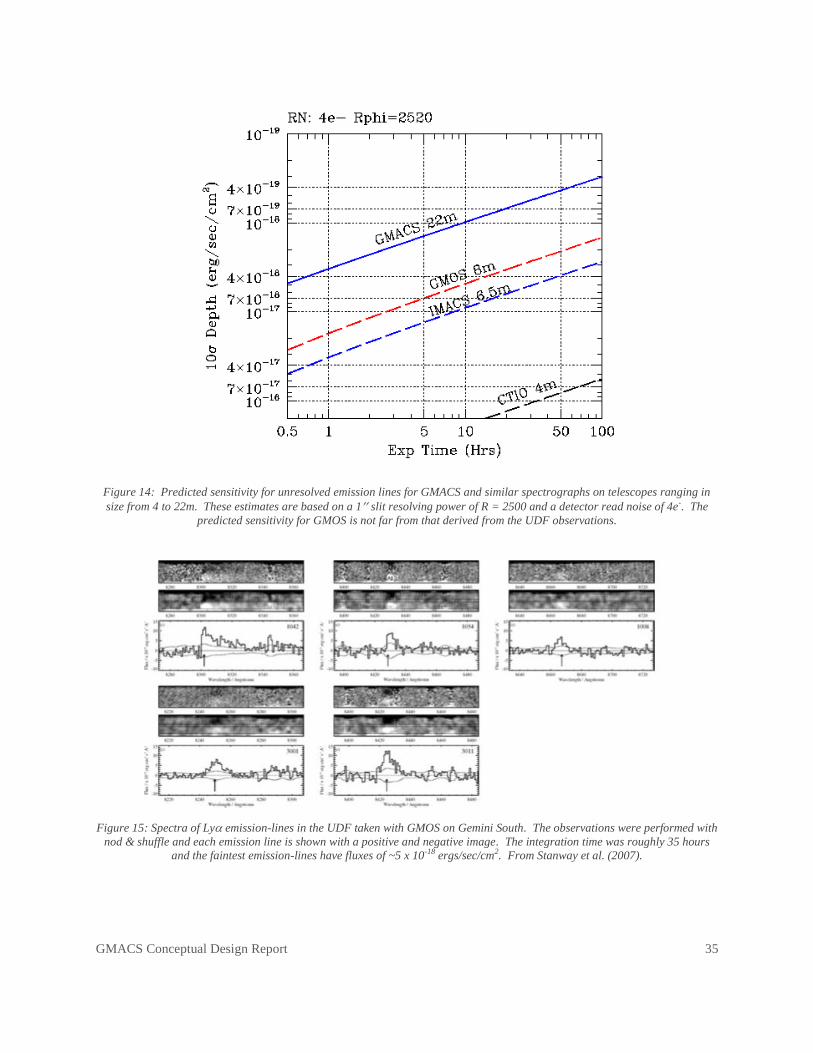
GMACS Conceptual Design Report 35
Figure 14: Predicted sensitivity for unresolved emission lines for GMACS and similar spectrographs on telescopes ranging in
size from 4 to 22m. These estimates are based on a 1 slit resolving power of R = 2500 and a detector read noise of 4e-. The
predicted sensitivity for GMOS is not far from that derived from the UDF observations.
Figure 15: Spectra of Ly emission-lines in the UDF taken with GMOS on Gemini South. The observations were performed with
nod & shuffle and each emission line is shown with a positive and negative image. The integration time was roughly 35 hours
and the faintest emission-lines have fluxes of ~5 x 10-18 ergs/sec/cm2. From Stanway et al. (2007).

GMACS Conceptual Design Report 36
Sensitivity: The critical question in evaluating the viability and cost of a program such as this
one is the expected sensitivity of the observations. We have estimated the sensitivity of the
GMT using the parameters for the GMACS spectrograph. Figure 14 shows the expected
sensitivity to unresolved emission-lines for GMACS along with similar numbers for GMOS on
Gemini, IMACS on Magellan and a similar spectrograph on a 4m telescope. The calculations all
use an R product of 2500; the GMACS and GMOS sensitivities are based on a 0.5‖ wide slit,
while the IMACS and 4m numbers use 0.75‖ and 1.2‖ slit widths, respectively. One can see that
in 10 hours GMACS can reach a limiting line flux of a 10-18
erg/sec/cm2.
A useful benchmark is provided by deep observations of Ly emitters at z = 5 in the UDF with
GMOS on Gemini. Examples are shown in Figure 15, where integrations as long as 35 hours in
duration reach a limiting flux of 5 x 10-18
ergs/sec/cm2. In this same time GMACS should reach
a depth on order of magnitude deeper for unresolved lines.
We have simulated spectra of Ly emitters at z = 6 using the baseline properties of GMACS.
The details of the simulations will be described elsewhere but, in brief, we use the basic
properties of GMACS along with a flux calibrated sky spectrum from Gemini. Slit losses are
included and a range of seeing and slit widths and on-chip binning combinations were
considered. The spectrograph throughput was set at 30%, conservative compared to state-of-the-
art spectrographs today. The observations are simulated at a resolution of ~ 4000 and, after sky
subtraction, are rebinned to lower resolution. The brighter objects were rebinned to R = 1200,
the fainter objects were binned to lower resolution. We modeled the Ly emission lines as
having a FHWM = 500 km/s, before passing through the IGM and a modest equivalent width
(~30A in the rest-frame). The data were scaled according to the line flux before attenuation by
the IGM. We treat the Ly forest absorption at 100% for simplicity and obscure all photons
more than 100 km/s to the blue of the line center. The results are shown in Figure 16. From this
figure we conclude that a reasonable limiting line flux is ~ 4 x 10-19
in a 30 hour integration.
With overheads in a fully queue schedule operation this observation would cost the equivalent of
four full nights of telescope time.
Measuring the Luminosity Function: As shown in Table 3, in the most conservative case there
would be ~ 150 targets within a single GMACS field of view for = -2. We would like to
determine the LF with reasonable statistical significance over bins no more than a factor of two
wide in luminosity. In this case these would be distributed in flux such that approximately 50%
of the objects would be in the last bin, 25% in the next faintest bin and so on until, in the
brightest bin there would be only a handful of objects. This is illustrated in Table 4 below.
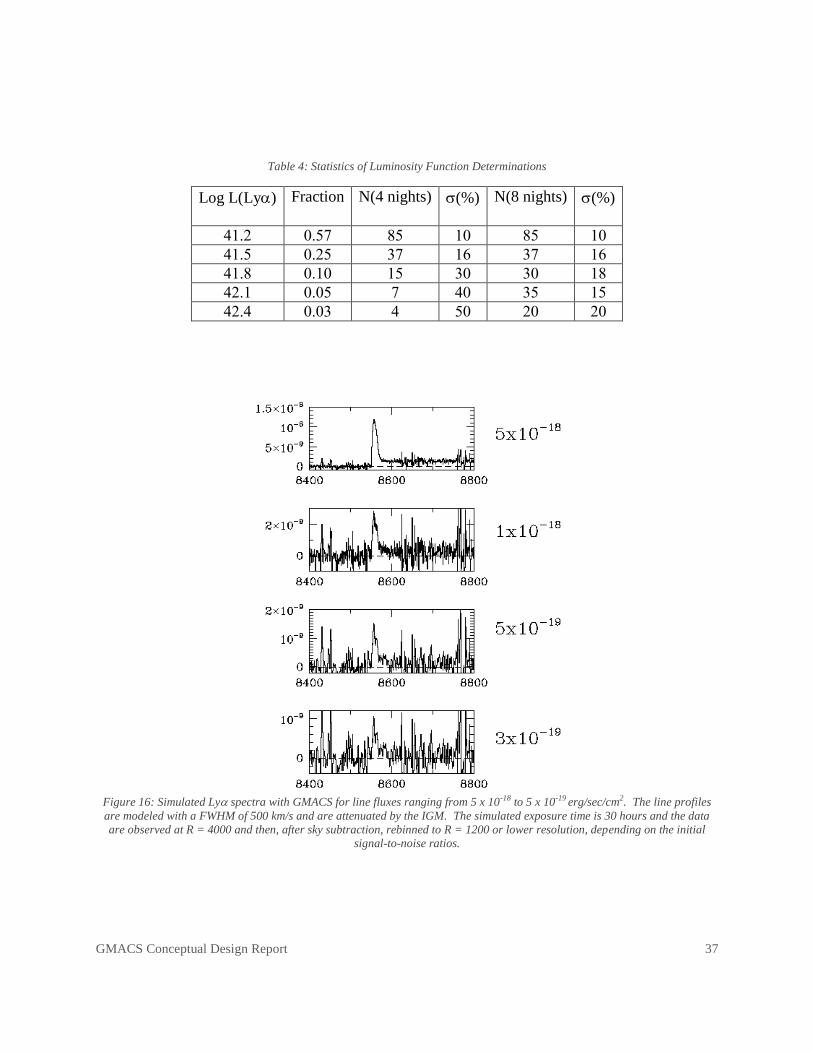
GMACS Conceptual Design Report 37
Table 4: Statistics of Luminosity Function Determinations
Log L(Ly) Fraction N(4 nights) (%) N(8 nights) (%)
41.2 0.57 85 10 85 10
41.5 0.25 37 16 37 16
41.8 0.10 15 30 30 18
42.1 0.05 7 40 35 15
42.4 0.03 4 50 20 20
Figure 16: Simulated Ly spectra with GMACS for line fluxes ranging from 5 x 10-18 to 5 x 10-19 erg/sec/cm2. The line profiles
are modeled with a FWHM of 500 km/s and are attenuated by the IGM. The simulated exposure time is 30 hours and the data
are observed at R = 4000 and then, after sky subtraction, rebinned to R = 1200 or lower resolution, depending on the initial
signal-to-noise ratios.

GMACS Conceptual Design Report 38
Figure 17. Simulated measurements of the Lya luminosity function at z = 5.7 based on a single GMACS pointing and a 30-hour
integration for an intrinsic faint end slope of –2. The statistical errors in the faintest bin are roughly 10%, while the bin sizes are
half that of the Malhotra & Rhoads bins. From this one could distinguish between faint end slopes of –1, -1.5 and –2 with high
confidence levels. The errors near L*, however, are not much improved from current studies.
One can see from Table 4, deep observations with GMACS can determine the faint end of the LF
with ~10% uncertainties in an single mask. The brighter bins, those near L* are poorly sampled
simply because the volume in a single pointing is too small. This is illustrated graphically in
Figure 17 where we show the LF from Malhotra & Rhoads with our putative simulated
measurements from a single field superposed. The errors in the faintest bins are dramatically
reduced while those in the bins near L* are not improved the same degree.

GMACS Conceptual Design Report 39
Figure 18. The same plot as in Figure 17, except in this case we include four extra pointings of six hours each along with the
original deep pointing. The combination produces nearly constant statistical errors in each of the bines and determines the LF
with high precision.
A somewhat longer program that combined four shorter pointings, of say six hours each, with the
single deeper pointing could provide nearly constant statistical errors in all of the bins. This
program would cost a total of 8 nights of telescope time, assuming reasonable overheads. The
power of these extra pointings is illustrated in the right two columns of Table 4 and in Figure 18
above.
Target Selection: Defining a suitable set of targets is often the most challenging part of surveys
for distant Ly emitters. In this example we have assumed that a narrow-band imaging program
using a 150A wide filter has been used to identify a list of emission-line candidates and deep
continuum imaging has filtered out most of the outliers. The deepest narrow-band imaging
surveys to date on 8m telescopes reach 5 limits of ~ 10-18
and so a deeper set of imaging
observations are needed to provide the target list for this experiment. Spectroscopic searches in
conjunction with intermediate band-filters provide better sensitivity than narrow-band imaging
surveys, but the volume sampled is rather limited.
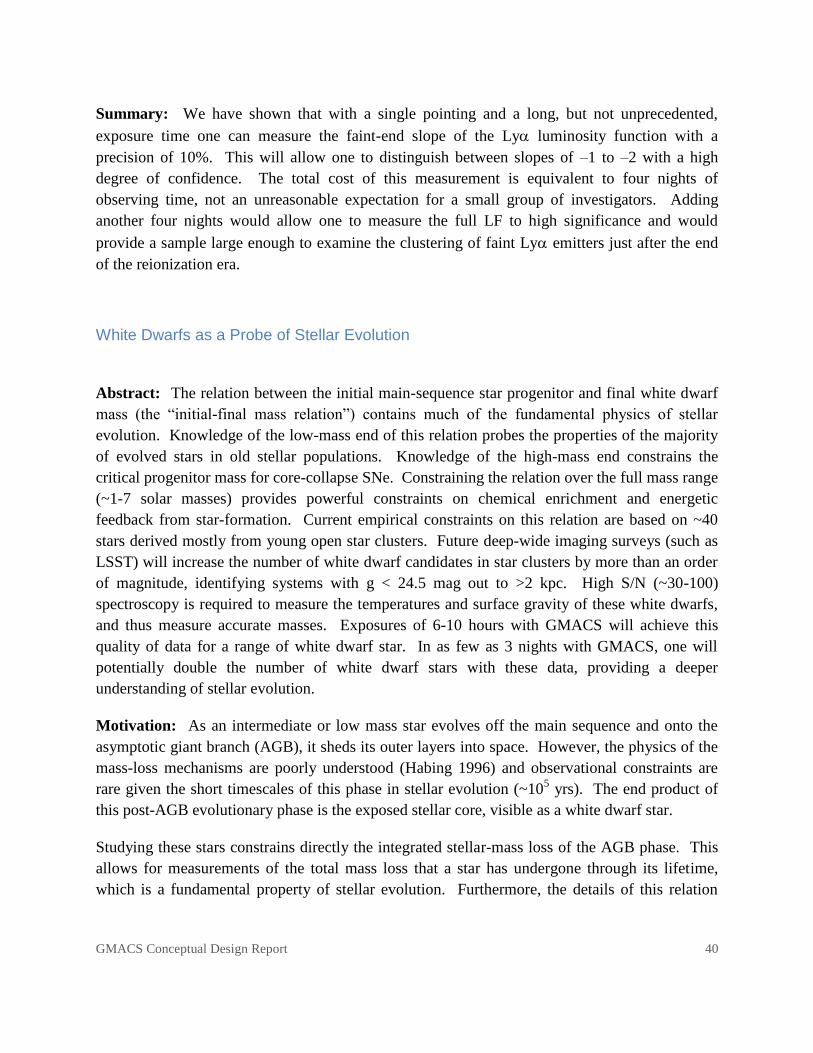
GMACS Conceptual Design Report 40
Summary: We have shown that with a single pointing and a long, but not unprecedented,
exposure time one can measure the faint-end slope of the Ly luminosity function with a
precision of 10%. This will allow one to distinguish between slopes of –1 to –2 with a high
degree of confidence. The total cost of this measurement is equivalent to four nights of
observing time, not an unreasonable expectation for a small group of investigators. Adding
another four nights would allow one to measure the full LF to high significance and would
provide a sample large enough to examine the clustering of faint Ly emitters just after the end
of the reionization era.
White Dwarfs as a Probe of Stellar Evolution
Abstract: The relation between the initial main-sequence star progenitor and final white dwarf
mass (the ―initial-final mass relation‖) contains much of the fundamental physics of stellar
evolution. Knowledge of the low-mass end of this relation probes the properties of the majority
of evolved stars in old stellar populations. Knowledge of the high-mass end constrains the
critical progenitor mass for core-collapse SNe. Constraining the relation over the full mass range
(~1-7 solar masses) provides powerful constraints on chemical enrichment and energetic
feedback from star-formation. Current empirical constraints on this relation are based on ~40
stars derived mostly from young open star clusters. Future deep-wide imaging surveys (such as
LSST) will increase the number of white dwarf candidates in star clusters by more than an order
of magnitude, identifying systems with g < 24.5 mag out to >2 kpc. High S/N (~30-100)
spectroscopy is required to measure the temperatures and surface gravity of these white dwarfs,
and thus measure accurate masses. Exposures of 6-10 hours with GMACS will achieve this
quality of data for a range of white dwarf star. In as few as 3 nights with GMACS, one will
potentially double the number of white dwarf stars with these data, providing a deeper
understanding of stellar evolution.
Motivation: As an intermediate or low mass star evolves off the main sequence and onto the
asymptotic giant branch (AGB), it sheds its outer layers into space. However, the physics of the
mass-loss mechanisms are poorly understood (Habing 1996) and observational constraints are
rare given the short timescales of this phase in stellar evolution (~105 yrs). The end product of
this post-AGB evolutionary phase is the exposed stellar core, visible as a white dwarf star.
Studying these stars constrains directly the integrated stellar-mass loss of the AGB phase. This
allows for measurements of the total mass loss that a star has undergone through its lifetime,
which is a fundamental property of stellar evolution. Furthermore, the details of this relation
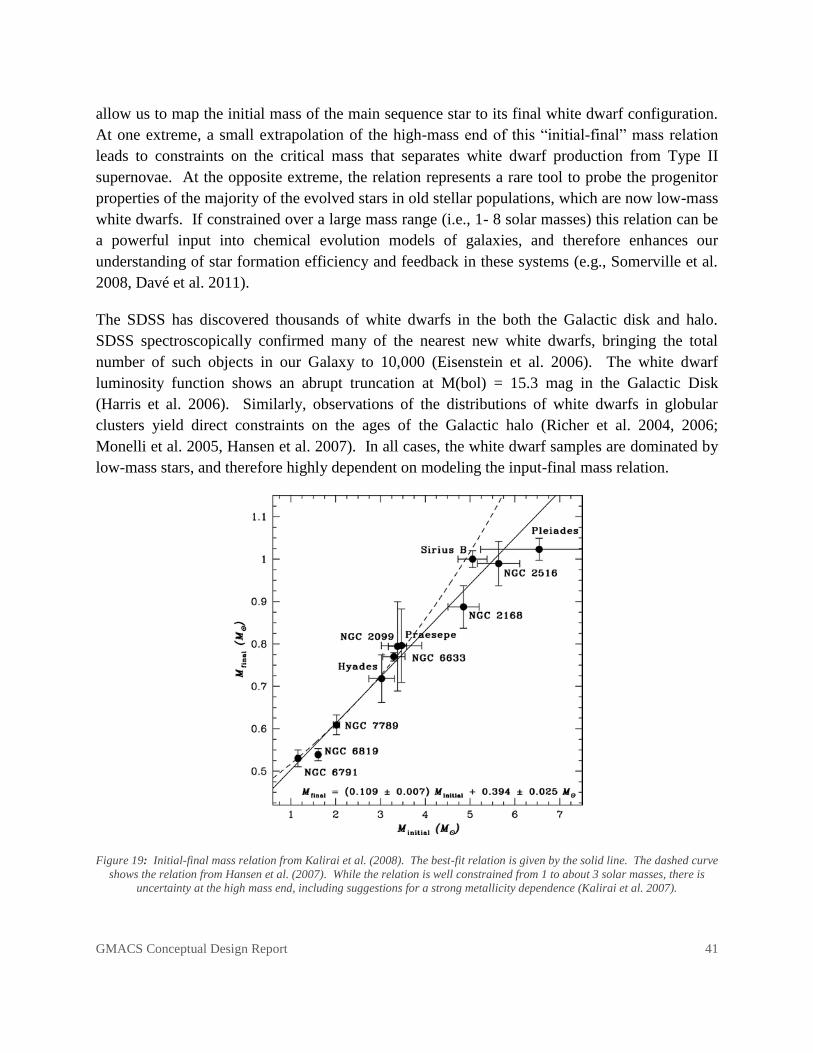
GMACS Conceptual Design Report 41
allow us to map the initial mass of the main sequence star to its final white dwarf configuration.
At one extreme, a small extrapolation of the high-mass end of this ―initial-final‖ mass relation
leads to constraints on the critical mass that separates white dwarf production from Type II
supernovae. At the opposite extreme, the relation represents a rare tool to probe the progenitor
properties of the majority of the evolved stars in old stellar populations, which are now low-mass
white dwarfs. If constrained over a large mass range (i.e., 1- 8 solar masses) this relation can be
a powerful input into chemical evolution models of galaxies, and therefore enhances our
understanding of star formation efficiency and feedback in these systems (e.g., Somerville et al.
2008, Davé et al. 2011).
The SDSS has discovered thousands of white dwarfs in the both the Galactic disk and halo.
SDSS spectroscopically confirmed many of the nearest new white dwarfs, bringing the total
number of such objects in our Galaxy to 10,000 (Eisenstein et al. 2006). The white dwarf
luminosity function shows an abrupt truncation at M(bol) = 15.3 mag in the Galactic Disk
(Harris et al. 2006). Similarly, observations of the distributions of white dwarfs in globular
clusters yield direct constraints on the ages of the Galactic halo (Richer et al. 2004, 2006;
Monelli et al. 2005, Hansen et al. 2007). In all cases, the white dwarf samples are dominated by
low-mass stars, and therefore highly dependent on modeling the input-final mass relation.
Figure 19: Initial-final mass relation from Kalirai et al. (2008). The best-fit relation is given by the solid line. The dashed curve
shows the relation from Hansen et al. (2007). While the relation is well constrained from 1 to about 3 solar masses, there is
uncertainty at the high mass end, including suggestions for a strong metallicity dependence (Kalirai et al. 2007).
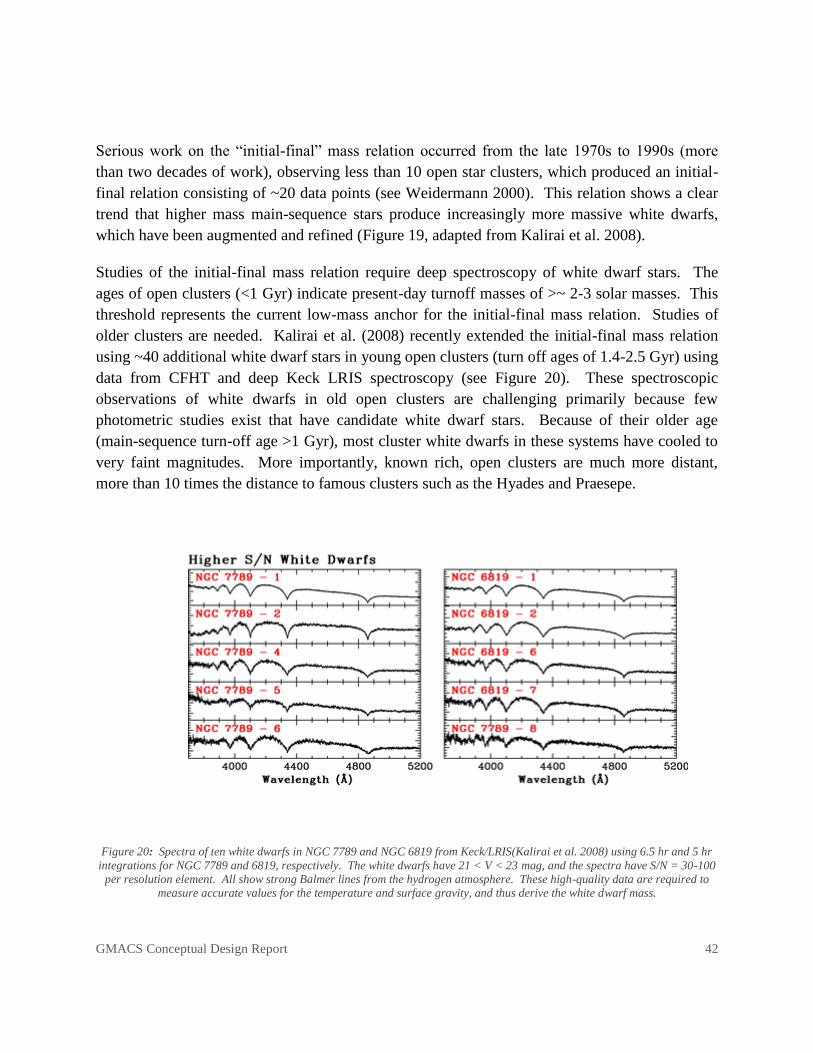
GMACS Conceptual Design Report 42
Serious work on the ―initial-final‖ mass relation occurred from the late 1970s to 1990s (more
than two decades of work), observing less than 10 open star clusters, which produced an initial-
final relation consisting of ~20 data points (see Weidermann 2000). This relation shows a clear
trend that higher mass main-sequence stars produce increasingly more massive white dwarfs,
which have been augmented and refined (Figure 19, adapted from Kalirai et al. 2008).
Studies of the initial-final mass relation require deep spectroscopy of white dwarf stars. The
ages of open clusters (<1 Gyr) indicate present-day turnoff masses of >~ 2-3 solar masses. This
threshold represents the current low-mass anchor for the initial-final mass relation. Studies of
older clusters are needed. Kalirai et al. (2008) recently extended the initial-final mass relation
using ~40 additional white dwarf stars in young open clusters (turn off ages of 1.4-2.5 Gyr) using
data from CFHT and deep Keck LRIS spectroscopy (see Figure 20). These spectroscopic
observations of white dwarfs in old open clusters are challenging primarily because few
photometric studies exist that have candidate white dwarf stars. Because of their older age
(main-sequence turn-off age >1 Gyr), most cluster white dwarfs in these systems have cooled to
very faint magnitudes. More importantly, known rich, open clusters are much more distant,
more than 10 times the distance to famous clusters such as the Hyades and Praesepe.
Figure 20: Spectra of ten white dwarfs in NGC 7789 and NGC 6819 from Keck/LRIS(Kalirai et al. 2008) using 6.5 hr and 5 hr
integrations for NGC 7789 and 6819, respectively. The white dwarfs have 21 < V < 23 mag, and the spectra have S/N = 30-100
per resolution element. All show strong Balmer lines from the hydrogen atmosphere. These high-quality data are required to
measure accurate values for the temperature and surface gravity, and thus derive the white dwarf mass.
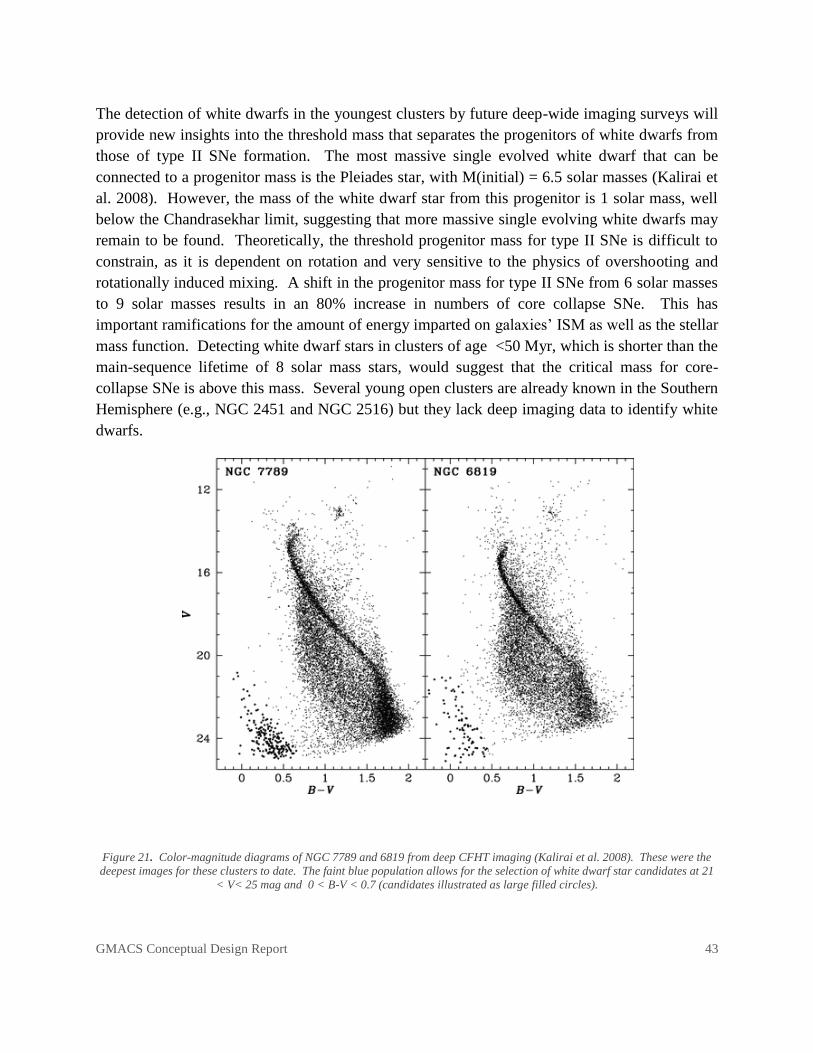
GMACS Conceptual Design Report 43
The detection of white dwarfs in the youngest clusters by future deep-wide imaging surveys will
provide new insights into the threshold mass that separates the progenitors of white dwarfs from
those of type II SNe formation. The most massive single evolved white dwarf that can be
connected to a progenitor mass is the Pleiades star, with M(initial) = 6.5 solar masses (Kalirai et
al. 2008). However, the mass of the white dwarf star from this progenitor is 1 solar mass, well
below the Chandrasekhar limit, suggesting that more massive single evolving white dwarfs may
remain to be found. Theoretically, the threshold progenitor mass for type II SNe is difficult to
constrain, as it is dependent on rotation and very sensitive to the physics of overshooting and
rotationally induced mixing. A shift in the progenitor mass for type II SNe from 6 solar masses
to 9 solar masses results in an 80% increase in numbers of core collapse SNe. This has
important ramifications for the amount of energy imparted on galaxies’ ISM as well as the stellar
mass function. Detecting white dwarf stars in clusters of age <50 Myr, which is shorter than the
main-sequence lifetime of 8 solar mass stars, would suggest that the critical mass for core-
collapse SNe is above this mass. Several young open clusters are already known in the Southern
Hemisphere (e.g., NGC 2451 and NGC 2516) but they lack deep imaging data to identify white
dwarfs.
Figure 21. Color-magnitude diagrams of NGC 7789 and 6819 from deep CFHT imaging (Kalirai et al. 2008). These were the
deepest images for these clusters to date. The faint blue population allows for the selection of white dwarf star candidates at 21
< V< 25 mag and 0 < B-V < 0.7 (candidates illustrated as large filled circles).
GMACS Conceptual Design Report 44
Approach: Future wide-field surveys such as DES and LSST will revolutionize our study of the
initial-final mass relation. Current studies are limited to ~40 white dwarf stars in open star
clusters (Kalirai et al. 2008). As an example, the LSST will permit hundreds of additional data
points over the full range of initial mass of stars that will form white dwarfs. However, because
of their intrinsic faintness and distance, deep spectroscopic observations from GMT/GMACS are
required to measure the masses of the white dwarfs to the needed precision, which typically
require S/N=30-100 (see Figure 21). The spectra of DA white dwarfs are remarkably simple,
showing pressure broadened Balmer lines caused by the thin hydrogen atmosphere of the stars.
The lines can be easily modeled to yield both the temperature, and surface gravity of the stars,
and therefore, the individual stellar masses (Bergeron et al. 1995). These mass measurements
can be uniquely connected to the initial mass of the progenitor from which the white dwarf
formed (e.g., the total cluster age is the sum of the white dwarf cooling age estimated from the
temperature and the main sequence lifetime of the progenitor), and therefore the initial-final
mass relation can be constructed (see Kaliari et al. 2008, figure 10.1)
The faintest white dwarfs identified by LSST and DES will have M(V)=13-15 mag, and will be
accessible with spectroscopy from GMT/GMACS with apparent magnitudes of g~24 mag out to
1 - 2.5 kpc (about 1 magnitude deeper than what is possible with current 8-10 m instruments).
To achieve the high S/N spectra (S/N~30-100) to model their temperature and surface gravity
will require roughly 6-10 hrs of integration at a resolution of R~2000 from 3500 - 5200
angstroms, spanning the important Balmer lines. The wide field-of-view of GMACS (9’ x 18’)
will allow large swaths of distant star clusters to be surveyed, allowing for spectroscopy of ten of
white dwarf candidates per night. Therefore, in less than 4 nights with GMACS, one could
envision a survey that would more than double the number of white dwarf stars with high S/N
spectra available for this science.
Target Selection: Data from wide-field surveys will identify distant open clusters and allow for
the construction of color-magnitude diagrams to model the main sequence turnoff, and identify
white-dwarf candidates (illustrated in figure 10.3 using deep CFHT imaging). Known young
open star clusters are already known to exist but do not yet have the available deep optical
imaging to select white dwarfs for spectroscopy. The expectation is that future imaging surveys
will increase the known number of white dwarfs by more than an order magnitude. For example,
while about 10,000 white dwarfs are identified by SDSS, LSST is expected to identify over
400,000 white dwarfs to r < 24.5 mag, within the spectroscopic limit of GMACS.
Summary: Current empirical constraints on the ―initial-final‖ relation between main-sequence
progenitor stars and their white dwarfs are highly important observations to constraint the
physics of stellar evolution. Current constraints based on high S/N spectroscopy of ~40 stars
derived mostly from young open star clusters. Future imaging surveys (such as LSST) will
GMACS Conceptual Design Report 45
increase the number of white dwarf candidates in star clusters by more than an order of
magnitude. We describe a GMACS survey, which is the only means to provide the high S/N
(~30-100) spectroscopy needed for the analysis. We show that with 6-10 hr integrations with
GMACS we will achieve this quality of data for a range of white dwarf stars. In as few as 3
nights with GMACS, one will potentially double the number of white dwarf stars with these
data, providing a deeper understanding of stellar evolution.
Surface composition of Kuiper Belt Objects
Abstract: GMACS spectroscopy of TNOs and KBOs can probe the surface composition and
conditions in these objects. Repeated observations can map the surface and determine the impact
of variable solar heating on the surface. A better understanding of composition and evolution of
the surfaces of KBOs and TNOs will help to constrain models of the early solar nebula and
subsequent evolution of the outer solar system.
Motivation: Measuring the surface composition of KBOs can provide clues to the composition
and environment of the primordial solar nebula and important evolutionary processes occurring
in the outer Solar System over the past 4.5 Gyr. One way to probe the surface composition is
through reflectance spectroscopy; in the optical there are bands of important ices such as CH4,
H2O, N2, O2, and other molecular species. Unfortunately, there are only a small number of
KBOs that have been measured with adequate S/N to detect features from these sorts of
molecules: 1966 TO66 (Brown et al 1999), Varuna (Licandro et al. 2001), Quaoar (Jewitt & Luu
2004), and Orcus (Fornasier et al. 2004) are seen to have H2O-ice in their spectra; Pluto
(Cruikshank et al. 1976), Triton (may be a captured KBO; Cruikshank et al. 1993), Eris (Brown
et al. 2005), and 2005 FY9 (Licandro et al. 2006) appear to have CH4-ice bands; O2-ice may
have been seen in 2003 EL61 by Tegler et al. (2007).
It is not coincidence that the observed objects are the brightest and largest KBOs known. Even
so many of the spectra are of poor quality despite relatively long exposures on large telescopes.
Figure 22 and Figure 23 show two representative spectra taken from Tegler et al. (2007).
Nevertheless, the spectra show interesting features (or potential features) that can be used to
place constraints on the CH4 grain size, although comparisons with laboratory spectra (see Figure
22) are often inadequate to reproduce the observations.
There are also often subtle shifts between the laboratory spectra of volatile ices and the
astronomical results. These shifts hint at the presence of additional ice components. For

GMACS Conceptual Design Report 46
example, Licandro et al. (2006) show blueshifts of 0.2 to 0.6 nm for CH4 bands. These shifts are
taken as a signal that the CH4 ice is mixed with N2-ice, CO-ice, or Ar, since CH4 absorption
bands shift towards shorter wavelengths when other species rather than other CH4 molecules
surround the methane molecules.
Pluto has been observed to have N2-ice that that changes in optical depth versus season (i.e.
Pluto’s location relative to the Sun; DePoy 1993, private communication and Grundy & Buie
2001). The best-fit model of the surface that coheres these changes with other molecular species
(CH4 in particular) suggests that the surface of Pluto is composed of a glaze of N2-ice lying on
top of granular CH4 ice. The thickness of the N2 ice glaze is 5-10 cm and seems to vary with
longitude and season. A similar pattern is seen in CO ices and an inverse to this pattern in CH4
ice. This argues that weather on Pluto is composed of CO and N2 snow settling on a time
variable landscape of CH4 pebbles. There is even evidence that the weather varies with latitude
and longitude on the surface of Pluto (Grundy & Buie 2001), suggesting that N2 on Pluto is
mobile.
The glaze can form textures that allow incoming photons to travel many centimeters through the
transparent, polycrystalline N2-ice before photons are scattered off inclusions or grain
boundaries. The long path-lengths make it possible for a relatively small amount of CH4 to
produce deep absorption bands (Tegler et al. 2007). CO and Ar ice can produce similar effects.
Laboratory measurements can measure the shifts of various concentrations of these mixtures,
which would then allow determination of the composition of any outer solar system body
surface.
Some spectra of KBOs are featureless at the S/N currently possible with large telescopes. Figure
23 shows an example in which there is tantalizing evidence for O2-ice absorption around
577.3nm. Very high S/N is required to confirm (or refute) the possibility of this feature, which
would require long exposures on existing large telescopes (>10 hours) or GMACS/GMT level
sensitivity. The detection of O2 on the surface of KBOs would be of interest in the distant future
as a source of spacecraft fuel. The presence of O2 could also signal the presence of H2O, since
the mechanism of O2 production is thought to be photolysis of water by UV photons.
Understanding the changes in the surfaces of outer solar system objects will help to constrain
models of the composition and physical conditions of the early solar nebula. If the ―weather‖
effects can be understood, then it should be possible to derive compositional histories of these
objects, which, combined with orbital elements and dynamic evolution estimates, will inform
models of the proto-solar nebula. Measurements of the changes in surface composition will also
allow modeling of the impact of the solar wind, seasons, and other effects on the surface of these
bodies.

GMACS Conceptual Design Report 47
Figure 22: Spectrum of 2005 FY9 (Tegler et al. 2007). The red line is a model based on laboratory data of the absorption
spectrum of CH4 surrounded by N2 ice.
Approach: Petit et al. (2006) predict that LSST will find >30,000 TNOs and KBOs brighter
than 24.5 mag. Because each object will be observed several hundred times, accurate orbital
elements will be available for almost all of these objects. The objects will span a broad range of
orbital location, dynamical history, ―family‖ groups, etc.
A subset of the LSST-discovered TNOs and KBOs can be selected that can span the range of
colors, locations, orbital history, etc. The expected target brightness ~21-22 mag, making them
ideal candidates for GMACS observations. Precise measurement of the spectra at high S/N
would require, on average, ~2 hours per target. Multiple measurements over the orbit and
orientation of the target could measure the change in surface composition versus solar irradiance
and location on the object.
We estimate that spectra of ~100 of these objects can span an appropriate range of properties.
An exact estimate can be made only after LSST can assess the general orbital elements,
inclination angles, sizes, dynamical histories, etc. Given the distribution of these sorts of targets
on the sky, we anticipate that observations spread throughout the year will be required.
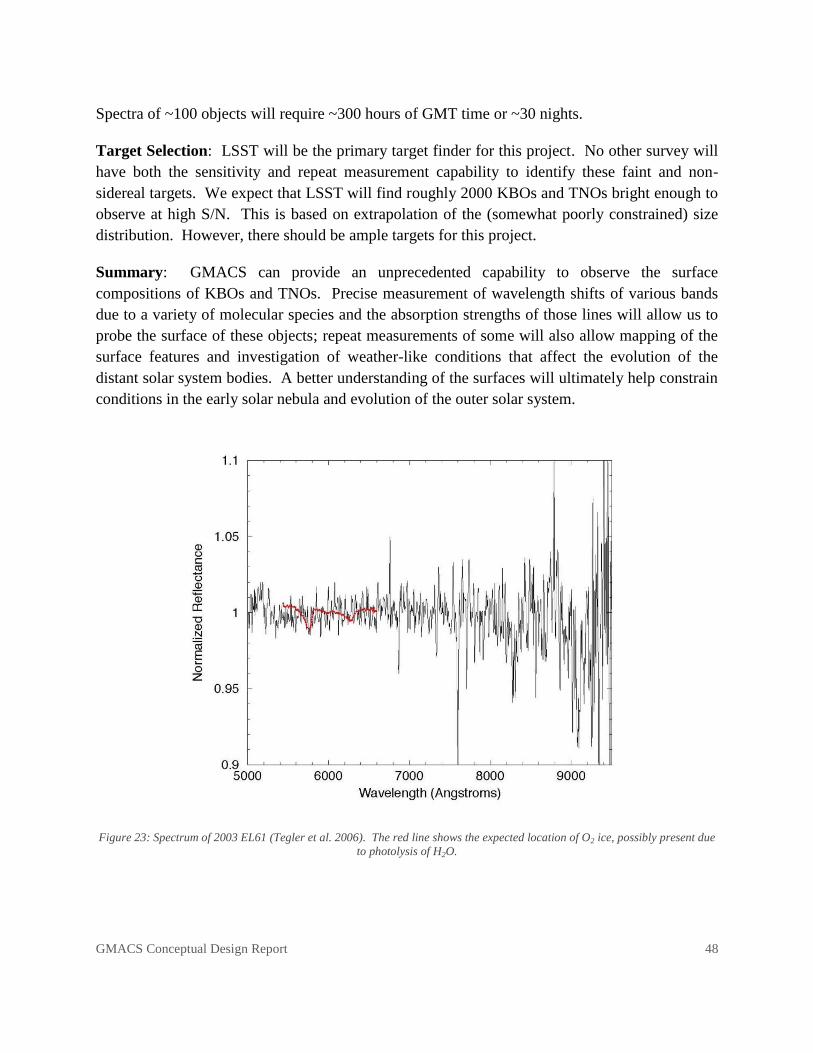
GMACS Conceptual Design Report 48
Spectra of ~100 objects will require ~300 hours of GMT time or ~30 nights.
Target Selection: LSST will be the primary target finder for this project. No other survey will
have both the sensitivity and repeat measurement capability to identify these faint and non-
sidereal targets. We expect that LSST will find roughly 2000 KBOs and TNOs bright enough to
observe at high S/N. This is based on extrapolation of the (somewhat poorly constrained) size
distribution. However, there should be ample targets for this project.
Summary: GMACS can provide an unprecedented capability to observe the surface
compositions of KBOs and TNOs. Precise measurement of wavelength shifts of various bands
due to a variety of molecular species and the absorption strengths of those lines will allow us to
probe the surface of these objects; repeat measurements of some will also allow mapping of the
surface features and investigation of weather-like conditions that affect the evolution of the
distant solar system bodies. A better understanding of the surfaces will ultimately help constrain
conditions in the early solar nebula and evolution of the outer solar system.
Figure 23: Spectrum of 2003 EL61 (Tegler et al. 2006). The red line shows the expected location of O2 ice, possibly present due
to photolysis of H2O.
GMACS Conceptual Design Report 49
A Measurement of the Galaxy Power Spectrum at z > 2.5
Abstract: Measuring the galaxy power spectrum at high redshift from galaxy surveys provides
strong constraints on the cosmological distance scale, the nature of dark evolution, and other
cosmological parameters, with accuracies competitive with ongoing ground and space-based
missions. Such constraints on not possible from lower redshift galaxy surveys as the power
spectrum at z < 2 is highly nonlinear on small spatial scales. Here, we envision an ambitious
survey with GMACS providing spectroscopic redshifts for approximately 1,000,000 galaxies
with 2.5 < z < 5 with the primary goal to measure the galaxy power spectrum and thus constrain
cosmological parameters. Given the high source density and multiplexing capacity of GMACS,
spectroscopic redshifts would be possible in a survey of under 200 nights. While this would be a
large survey, it provides unique constraints the nature of our universe.
Motivation: The theory of inflation is a cosmological paradigm that makes several testable
predictions. Among these are that the Universe should be nearly flat (Ωtot = 1) and that the
power spectrum of density perturbations should be nearly scale invariant. These two predictions
lead to a cold dark matter (CDM) scenario of structure formation, which holds that most matter
consists of slowly moving (cold) weakly interacting massive particles and that structure develops
hierarchically from initial density perturbations. This CDM picture is generally consistent with a
wide array of observations (see Turner & White 1997).
However, observations of galaxy clustering, peculiar velocities, and the X-ray clusters offered
support for a low matter density in the Universe, with Ωm ~ 0.2 - 0.4, strongly in contrast to the
“flatness” prediction from inflation if all the mass-energy density in the Universe is in the form
of matter. This conflict was resolved by measurements of distances to type Ia supernovae that
showed that cosmological expansion rate of the universe has been accelerating since redshifts
about 1. The phenomenon for this acceleration, “dark energy” is a mysterious mass-energy
component. It accounts for roughly 70% of the cosmic mass-energy content, ΩΛ ~ 0.7, and
combined with the matter density, suggests the total energy-mass density of the Universe is very
nearly unity: Ωtot = Ωm + ΩΛ ≈ 1, in line with the prediction from inflationary theories.
However, the existence of dark energy reflects a gross ignorance of the scientific community
even though the nature of this substance (and in particular its evolution) have profound
implications on the formation and evolution of the Universe. Ideas run the gamut from the
quantum vacuum energy (a “cosmological constant”) to a new quantum field (evolving dark
energy or “quintessence) and modifications to gravity (see Turner & Huterer 2007). Any of
these forms of dark energy require new physics beyond the standard model, even though
GMACS Conceptual Design Report 50
theoretical physicists struggle to understand this physics (with predicted values for dark energy
offset from observations by factors of 1056
to 10120
!).
The range of different phenomena proposed to explain the cosmological expansion make very
different predictions for the evolution of dark energy with redshift. The best observational data
is from the combination of nearby and distant SNe (Kowalski et al. 2008; Riess et al. 2007),
which are consistent with the idea that dark energy is a cosmological constant, consistent with
constant energy density associated with the vacuum energy. However, the uncertainties in these
measurements remain large enough to encompass a large range of alternative dark energy
theories. Decreasing the uncertainties on the cosmological constant is theoretically uninteresting
because it is only a low redshift anchor and provides little constraint on any evolution.
Furthermore, it is becoming increasingly true that systematics dominate the error budget of
studies of nearby supernovae, in which case adding more data will not solve the problem alone.
A robust plan to understand dark energy is to measure its evolution with cosmic time: There
remains no direct detection of dark energy at cosmologically interesting distances, z > 2. Such
observations provide the tightest constrains on the competing theories for the nature of dark
energy.
Detecting dark energy at high redshift, z > 2, requires measuring the expansion rate of the
Universe at these epochs, specifically the Hubble “constant” H(z) and the angular diameter
distance, DA(z). This can be accomplished by measuring the amplitude of power spectrum of
galaxies at z > 2, and comparing it to values at low redshift, providing a long baseline or tests of
evolution. To equation of state of dark energy is expressed by the w(z), the ratio of the cosmic
pressure to density (Turner & White 1997), where the the energy density of dark energy evolves
as R-3(1+w[z])
and R(z) is the cosmic scale factor. A cosmological constant corresponds to w = -1
and exotic physical models (relativistic particles, “tangled strings”, or scalar-field energy)
correspond to w = -1/3.
Measuring the effects of high redshift Dark Energy requires measuring the power spectrum of
galaxies at these epochs. This measurement requires large surveys of galaxies. The galaxy
power spectrum is essentially the Fourier transform of the galaxy two-point correlation function.
The amplitude, shape, and oscillatory features (for example, the Baryon Acoustic Oscillation)
contain a wealth of cosmological information (e.g., Weinberg 2008). The main reason to use the
full galaxy power spectrum is that it encodes all the standard rulers. Therefore, one obtains
dramatic improvement on the cosmological distance measures if one uses the full shape of the
galaxy power spectrum (rather than just the BAO signal, for example). However, this technique
is only effective if one understands the nonlinear behavior of the power spectrum, which is a
serious challenge, especially at low redshifts (z < 1.5) where nonlinear effects are more manifest.

GMACS Conceptual Design Report 51
However, the reward is great. Galaxy surveys at high redshift (z>2) allow for the measurement
of the power spectrum over spatial scales that are close to the linear regime (Jeong & Komatsu
2009, Figure 24), and in this case the improvement on the distance measures is a factor of order
~2-3 in the precision on DA and H(z) (Shoji et al. 2009).
Figure 24: The power spectra of Dark matter halos from the Millennium simulation at z=1, 2, 3, 4, 5, 6, as labeled in each
panel. The smaller panels are the residual of the fits. The error bars with points show the measured power spectra, while the
lines show the best-fitting nonlinear bias model (solid), best-fitting linear bias with nonlinear power spectrum (dashed), and best-
fitting linear bias with linear matter power spectrum (dot-dashed. The linear models are fit only to kmax, the maximum spatial
scale over which the nonlinear model is valid (adapted from Jeong & Komatsu 2009). Surveys of galaxies at high redshift allow
for a measurement of the power spectrum to much larger wave numbers (smaller spatial scales) than surveys at lower redshift.
Moreover, observations of the galaxy power spectrum at high redshift allows for constraints on
cosmological parameters that are not measurable by any other tests. This includes, e.g., the mass
of neutrinos (Ων), as well as the shape of the primordial power spectrum (n), and how the slope
of the power spectrum changes with scale (α = dn / d (ln k) ~ (n - 1)2 ~10
-3. The dependence on
the mass of neutrinos arises from the fact that the energy density in neutrinos is significant in the
early universe, and neutrinos are able to suppress structure on scales smaller than < 50-100
Mpc/h, or wave numbers, k > 0.1 (h/Mpc). One reason these observations are difficult with
CMB studies is that the CMB fluctuations are damped on small scales. A further complication is
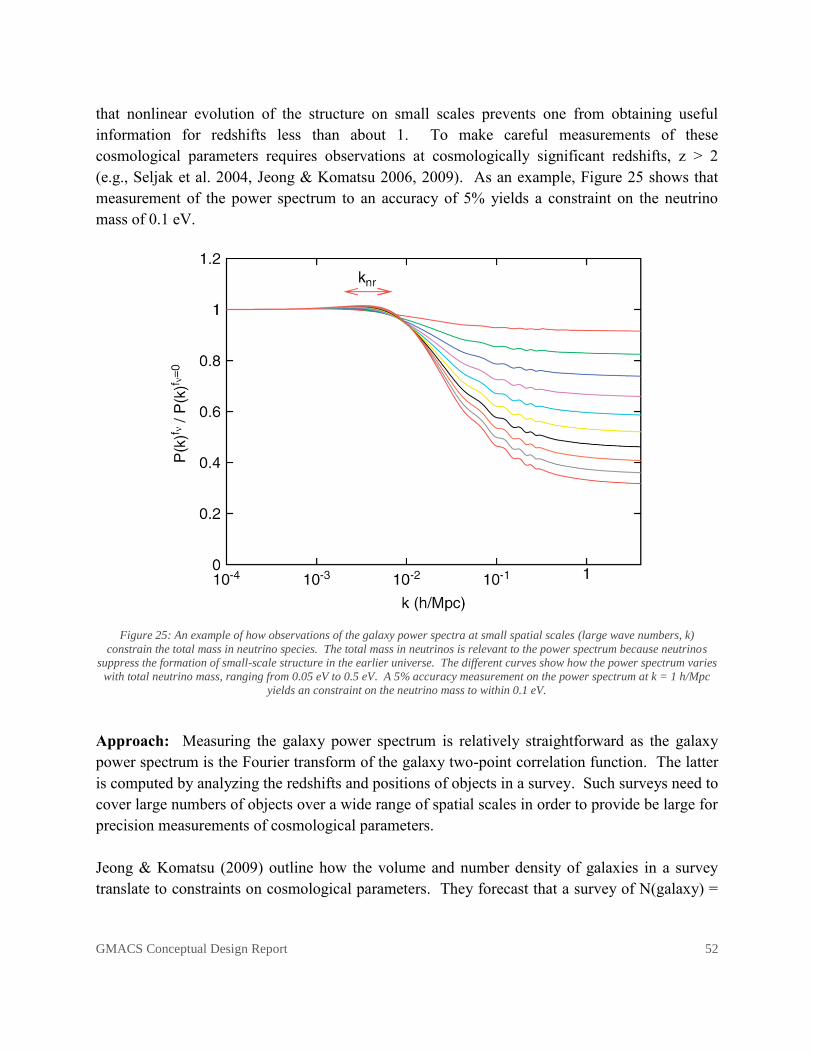
GMACS Conceptual Design Report 52
that nonlinear evolution of the structure on small scales prevents one from obtaining useful
information for redshifts less than about 1. To make careful measurements of these
cosmological parameters requires observations at cosmologically significant redshifts, z > 2
(e.g., Seljak et al. 2004, Jeong & Komatsu 2006, 2009). As an example, Figure 25 shows that
measurement of the power spectrum to an accuracy of 5% yields a constraint on the neutrino
mass of 0.1 eV.
Figure 25: An example of how observations of the galaxy power spectra at small spatial scales (large wave numbers, k)
constrain the total mass in neutrino species. The total mass in neutrinos is relevant to the power spectrum because neutrinos
suppress the formation of small-scale structure in the earlier universe. The different curves show how the power spectrum varies
with total neutrino mass, ranging from 0.05 eV to 0.5 eV. A 5% accuracy measurement on the power spectrum at k = 1 h/Mpc
yields an constraint on the neutrino mass to within 0.1 eV.
Approach: Measuring the galaxy power spectrum is relatively straightforward as the galaxy
power spectrum is the Fourier transform of the galaxy two-point correlation function. The latter
is computed by analyzing the redshifts and positions of objects in a survey. Such surveys need to
cover large numbers of objects over a wide range of spatial scales in order to provide be large for
precision measurements of cosmological parameters.
Jeong & Komatsu (2009) outline how the volume and number density of galaxies in a survey
translate to constraints on cosmological parameters. They forecast that a survey of N(galaxy) =
GMACS Conceptual Design Report 53
106 galaxies at 2 < z < 4 would allow for the galaxy distance scale, D, to be measured to 1.5%,
with roughly change in the precision that goes as N(galaxy)-2
for N(galaxy)=2 x 10⁵ to 2 x 10
6.
The constraint on the power spectrum is roughly a factor of 3 larger than the accuracy on D, and
thus a 3% measurement on D corresponds to a ~10% accuracy on P(k). This has strong
constraints on the cosmological parameters, including a measurement of the total mass of
neutrinos to an accuracy of .2 eV (see Figure 25) for this accuracy on P(k).
We envision a GMT/GMACS survey, which would measure redshifts for 106 galaxies with
redshifts 2.5 < z < 5. Using a low resolution grating, R~500, allows for high multiplexing with
GMT. The source density of galaxies with 2.5 < z < 5 will be 5-10 per arcminute2 (see table in
science case on the circumgalactic medium). Therefore, within one GMACS field of view, we
expect there to be roughly 1000 galaxies in this redshift range. GMACS will have ample targets,
and we expect a survey could target up to ~500 galaxies in this range per mask (with some loss
due to spectral collisions). We estimate that with 30 min exposures, GMACS will achieve S/N ~
3 spectra of sources to R < 25 mag. Assuming a redshift success rate of better than 70% (cf.
Steidel et al. 1999, 2003) a survey with GMACS can measure redshifts for 106 galaxies with 2.5
< z < 5 using no more than about 3000 individual masks, covering a total area of smaller than
120 sq. deg, and covering a total volume of about 1.1 (Gpc/h)3. Assuming exposure times of 30
min per mask, and an efficiency factor of 130%, such a survey is doable in less than 200 nights.
While this survey is expensive in terms of telescope nights, it is certainly feasible that it be
completed over the course of the GMT scientific lifetime. Moreover, this project is scientifically
justifiable because it provides unique constraints on the cosmological parameters.
Target Selection: Target selection for this survey will build on samples of Lyman-break
galaxies (LBGs) selected from wide-deep imaging surveys such as DES and LSST. The survey
depth of DES is comparable to the spectroscopic limit of GMACS for this project. DES covers
4000 sq. deg, more than enough sky coverage to execute this project. LSST will provide even
deeper imaging data, including u-band (required for z~2 and 3 LBG selection) over most of the
southern hemisphere sky.
A survey GMACS will never run out of targets. The source density of targets is high, and wide-
deep optical imaging surveys will provide the necessary galaxy samples.
Summary: Here, we envision an ambitious survey with GMACS providing spectroscopic
redshifts for approximately 1,000,000 galaxies with 2.5 < z < 5 with the primary goal to measure
the galaxy power spectrum and thus constrain cosmological parameters. Measuring the galaxy
power spectrum at these redshifts from galaxy clustering provides strong constraints on the
cosmological distance scale, the nature of dark evolution, and other cosmological parameters,
GMACS Conceptual Design Report 54
with accuracies competitive with ongoing ground and space-based missions. Furthermore, these
constraints are not possible from lower redshift galaxy surveys as the power spectrum at z < 2 is
highly nonlinear on small spatial scales. Using GMACS, it will be possible to measure the
galaxy power spectrum using no more than 200 nights of GMT time, covering <120 sq. deg.
While large, is a doable survey of the lifetime of GMT. Moreover, it is important to note that the
other GSMTs (TMT and ELT) will lack multi-object spectrographs covering anywhere near the
area of GMACS (9 x 18 sq. Arcmin), and the survey outlined here would be prohibitively
expensive.
Synergies with LSST
There are several large ground-based and space-based projects that are underway or which
should be functioning by first light of the GMT. Of these, perhaps the most pertinent are the
large ground-based imaging survey projects DES, VISTA, and LSST. VISTA is operational and
taking data; DES should be operational by mid-2012; LSST has a 2020 operational start goal,
although that will likely be delayed until ~2022. Thus, these projects will produce complete
surveys by the time GMT begins operations (DES, VISTA) or be roughly contemporaneous with
GMT first light (LSST).
We mention many projects above that draw directly on these three surveys. In particular, each
will provide optical and near-infrared surveys of the southern hemisphere to deep limiting
magnitudes. These surveys will be rich sources of targets for GMACS.
More specifically, the presence of GMACS on GMT will be crucial to the success of the LSST.
The LSST will be initially focused on four broad scientific topics:
Dark Matter and Dark Energy
Hazardous Asteroids and the Remote Solar System
The Transient Sky
The Formation and Structure of the Milky Way
GMACS will contribute tremendously to each of these topics.

GMACS Conceptual Design Report 55
Dark Matter and Dark Energy
The LSST plan is to use type Ia SNe as probes of dark energy characteristics. Although this is
hardly a new idea, and indeed DES will likely find thousands of similar SNe, LSST will
purposely find an incredibly large number of these objects. Current estimates are that LSST will
find ~300,000 type Ia SNe per year; this is roughly 1000 per night! The expected redshift
distribution of these SNe has a mean redshift of 0.45 and a significant number up to z ~ 0.7.
This redshift range is well tuned to measure dark energy effects. Therefore, this large sample
should enable high angular resolution searches for any dependence of dark energy parameters on
direction, which would indicate completely new physics. Furthermore, such a sample will allow
sensitive searches for systematic differences in SN populations (e.g., due to differing progenitor
channels) and other environmental properties, which can masquerade as cosmological effects.
The SNe will be discovered at brightness of 24-25 mag and should be 21-22 mag at peak. The
LSST believes multi-color/multi-epoch photometric observations will allow determination of SN
redshifts (or of the host galaxies) and guarantee the purity of the type Ia sample. However, as
SDSSII demonstrated (and other deep imaging surveys have also found) photometric redshifts
are generally not precise to better than 1% and have significant systematic errors. These random
uncertainties will mask a significant portion of the dark energy signal and large number statistics
will be compromised by the systematic errors.
We can use GMACS to take spectra of any LSST SN type Ia candidate. A single spectra could
require as little as ~15 minutes hour for adequate S/N (longer of course if the SNe are observed
off-peak), but would confirm the Ia identification and produce a redshift with <100 km/sec
precision, significantly below any local peculiar velocity of the host galaxy. The follow-up of
every LSST Ia candidate is not feasible, but the list can be culled using the photometric redshift
and light curves to produce an optimal observing target list. Depending on the distribution of the
candidates on the sky, some could naturally be observed during the course of other programs.
Hazardous Asteroids and the Remote Solar System
There is very little that GMT/GMACS can contribute to the study of hazardous asteroids, since
they are just rocks (albeit potentially dangerous ones, but it probably isn’t important to know the
composition of whatever is falling on our heads). However, as shown above, GMACS can
contribute to the study of KBOs and other remote solar system bodies. In particular, GMACS
can obtain a high S/N optical spectrum of almost any TNO or KBO found by LSST. This offers
the potential for follow-up of these objects to determine distribution of surface compositions,
changes in state or composition with orbit, etc., which in turn can elucidate the nature of the
early proto-solar nebula and subsequent environmental evolution over the history of the solar
system.
GMACS Conceptual Design Report 56
The Transient Sky
LSST claims that it will uniquely open the time domain in astronomy. The wide-area, dense
temporal coverage, and deep limiting magnitudes will indeed be unprecedented. LSST will
enable the discovery of rare and exotic objects such as neutron star and black hole binaries,
novae and stellar flares, gamma-ray bursts and x-ray flashes, AGN outbursts, and stellar
disruptions by black holes. These sorts of transient sources are known, but limited numbers are
known or have been discovered in time to allow probative follow-up observations. LSST
hopefully will also discover new classes of transients that are completely unknown or
unobserved to date, such as binary black hole mergers. LSST will also provide a powerful
capability for intensive monitoring of periodic variables and Cepheids.
LSST will also find thousands of SNe. As explained above, GMACS will play a crucial role in
exploiting those SNe as cosmological probes and for studies of SN physics.
Although organized spectroscopic follow-up of LSST transients has not yet been planned, it is
clear that spectra will play a vital role in extracting the science from the large number of
transients LSST will discover. A good analogy is the process of the PTF (Law et al. 2009). The
PTF is a fully automated, wide-field survey aimed at a systematic exploration of the optical
transient sky. The PTF survey is performed using an 8.1 square degree camera installed on the
48-inch Samuel Oschin telescope at Palomar Observatory; colors and light curves for detected
transients are obtained with the automated Palomar 60 inch telescope. PTF uses 80% of the 1.2
m and 50% of the 1.5 m telescope time. The PTF also uses roughly 2 weeks per month of 4m-
class telescope time for spectroscopic follow-up of the most ―interesting‖ transients they find
(Kulkarni, private communication).
Their system has been highly successful and is currently publishing 2-3 papers per month.
Recent PTF results include real-time detection and rapid multi-wavelength follow-up of highly
subluminous type IIP SNe (Gal-Yam et al. 2011), discovery of eclipsing binaries in star forming
regions (van Eyken et al. 2011), the discovery of a new sub-class of faint and fast classical novae
(Kasliwal et al. 2011), an outbursting class 1 protostar (Covey et al. 2011). Significantly, each of
these remarkable discoveries required spectroscopic follow-up observations to fully interpret the
results.
The use of a 4-5m telescope to spectroscopically follow-up objects discovered by a ~1m imaging
telescope makes a great deal of sense and has been a powerful astrophysical tool for ~100 years.
The reason is simple. For background limited observations
S /N DT texp
GMACS Conceptual Design Report 57
where DT is the diameter of the telescope, texp is discovery or spectroscopic exposure time, and
is the observation bandpass. Thus, an object found by a 1m telescope during survey
observations with an imaging bandpass of ~150nm (typical of SDSS-style filters) can be
measured by a 4-5m telescope spectroscopically (approximate bandpass of ~3 nm or resolution
of ~2000 in the optical) in ~3 times the exposure (with generous assumptions about the relative
efficiency of an imager versus a spectrograph and depending on the relative S/N desired in the
imaging and spectroscopic observations, of course). Assuming that the imaging system produces
an interesting target no more than once per four exposures, a telescope with roughly three times
the diameter could in principle be completely devoted to continuous spectroscopic follow-up of
the discovered transient sources.
LSST has an effective aperture of ~7m (the primary is 8.4m in diameter, but there is substantial
central vignetting by the very large secondary mirror). The effective aperture of the GMT is
~22m, since there are seven 8.4m primary mirrors. We feel that the GMT is an ideal partner of
LSST for transient spectroscopic follow-up and that GMACS will enable that capability.
We believe that GMT/GMACS will play a critical role in extracting the maximum science
potential from the zoo of LSST transients that will be discovered. LSST will report an enormous
number of transients: estimates range up to ~10,000 per night (hugely violating the assumption
above!). So a crucial issue will be to cull down to a manageable number of interesting targets.
As PTF seems to have no trouble keying on exciting objects, there will be ample precedent for
doing the same with LSST reports. Therefore, we expect that GMACS will be capable of
observing any LSST-reported transient as soon as announced (depending, of course, on the
telescope operational model). We do not believe it unreasonable that some fraction of GMT time
could be devoted to particular follow-up of LSST transients and that some slit mask positions
could be reserved for LSST transient follow-up for almost any program; the arguments are likely
to be about how to choose the best sample to follow out of the rich set of available targets.
The Formation and Structure of the Milky Way
A major objective of LSST is to add to our knowledge of the formation and evolution of
galaxies. The Milky Way and its environment provide a unique laboratory for understanding the
detailed processes that shape galaxy formation and for testing specific small-scale prediction of
standard models of galaxy formation.
LSST observations will map the structure of the Milky Way halo to 10 times deeper than SDSS,
reaching 100 kpc into the outer halo. This will improve our 3-dimensional maps of the shape,
substructure, chemical composition, and extent of our Galaxy and enable rigorous tests of
various models. More specifically, LSST will detect numerous blue main-sequence (F spectral
type) turn-off stars to distances as large as 200 kpc. The LSST will also detect RR Lyrae

GMACS Conceptual Design Report 58
variables and classical novae to a distance of 400 kpc, almost half way to Andromeda. Many
models predict that this volume should contain rich hierarchical substructure all the way to the
nominal tidal radius of the Milky Way at ~300 kpc. The LSST plans to measure proper motions
to ~0.2 milliarcsec/year (after 10 years) for many stars. This proper motion corresponds to ~10
km/sec at a distance of ~10 kpc. Such observations can potentially serve to enable stellar
kinematic probes of the gravitational potential of the Milky Way (including dark matter) and its
assembly history.
The ambitious LSST science goals are unlikely to be completely fulfilled without additional
spectroscopic observations. In particular, models of substructure and the evolution of the
gravitational potential really require full 6-dimensional phase space information on the particles
(3-dimensional positions and 3 velocity vectors). Although LSST can provide a vast number of
objects with most of that phase space information, only radial velocities can fully complete the
picture. Fortunately, radial velocity information to ~10 km/sec is adequate. GMACS can
provide such measurements for most of the stars mentioned above. Furthermore, LSST plans to
derive metallicity information from broad-band colors, which is consistent with their data set but
not particularly a well-demonstrated or accepted technique. GMACS can obtain spectra of
multiple optical absorption lines (Ca H&K, Mgb, Ca triplet, etc.) in almost any of the stars
mentioned above. This process could be slow, since exposures of 15-60 minutes are likely to be
required, but could be an ideal ―piggy-back‖ project that would assign a few positions on any slit
mask to such observations. Coordinated with smaller telescope observations of the brightest
stars, this could be an efficient and effective way to fill out the 6-dimensional phase space
diagram and associated metallicity distributions.
GMACS Conceptual Design Report 59
Comparison with other ELT Project Capabilities
There are two other ELT projects currently under consideration: the E-ELT and TMT. Here we
discuss these two projects and compare their plans for capabilities that may be similar to
GMT/GMACS.
E-ELT
The E-ELT is a ―40m-class‖ telescope with an aperture of 39m. The optical design has five
mirrors, several of which are thin sheets with thousands of actuators, and delivers an f/16 beam.
The design has two implications that are important for GMT. First, the size of the focal plane is
extremely large: a 5 arcminute diameter circle is ~900mm across. Second, the relatively large
number of mirrors before the focal plane guarantees that the throughput will be lower than GMT
delivers: the E-ELT throughput goal at 500nm is 60% (GMT will deliver >80%).
E-ELT’s initial instrument choices demonstrate that the telescope will not be oriented towards
wide field-of-view observing. The two ―first-light‖ instruments selected are a diffraction-limited
near-infrared imager (MICADO?) and a single-field near-infrared wide-band integral field
spectrograph (HARMONI). HARMONI does contain modes that work into the optical to
~500nm. Both instruments have field-of-view <1 arcminute.
Several E-ELT instrument concepts have wider field optical spectroscopic capability. These
include various flavors of the OPTIMOS concept: EVE that uses fibers and DIORAMAS that
uses direct slit masks. DIORAMAS is the most directly comparable to GMACS. This
instrument has a 6.7 arcminute 6.7 arcminute field, coverage of 370nm to 1600nm, and
resolutions of 300, 1000, and 2500 in a 0.5 arcsec wide slit (according to the main E-ELT web
page; the instrument itself seems to have no specific web page).
It is clear that the current orientation of the E-ELT project strongly emphasizes full-time AO
operation. The E-ELT apparently has no plans to provide a truly wide-field optical spectroscopic
capability to its community at this time. The maximum size of the unvignetted field of the E-
ELT is 5 arcminutes.
TMT
The TMT continues to plan to be a 30m aperture with an f/15 bent focal position. Although not
as severe as the E-ELT, the TMT focal plane remains very large. A 10 arcminute diameter focal
plane will be 1300mm in diameter. The three mirror design implies that the raw throughput of
the telescope will be ~70% around 500nm.

GMACS Conceptual Design Report 60
TMT has plans to have a wide-field optical spectrograph available at first light. The project PI is
R. Bernstein (UCSC). The instrument design has a 9.6 arcminute 4.2 arcminute field, 310-
1000nm wavelength coverage (two channels), and resolutions of 500 to 5000 in a 0.75 arcsec slit
width. This instrument is almost directly comparable to GMACS and is likely to be used for
many similar science projects. It is clear that the TMT community scientists have something
other than AO on their minds (science, for example).
Comparison between GMACS and other potential facilities
Table 5 compares the expected capabilities of GMACS/GMT with other potential instruments on
E-ELT and TMT. We have imagined an E-ELT instrument with a ~5 arcminute field (currently
unapproved). The full implementation of GMACS on the GMT will provide an unprecedented
wide-field optical spectroscopic capability amongst the ELTs. Particularly for projects that
follow-up faint, high-density, large number imaging surveys (like that produced by DES or
LSST), GMACS/GMT will be highly competitive, completing such projects ~3 times as fast as
E-ELT or TMT.
Table 5: Comparison of potential wide-field optical spectrographs on ELTs.
Telescope Collecting
area (m2)
Telescope
throughput ()
Field of view
(arcminute2)
Resolutions Scaled A
GMT 387 ~0.8 162 1500-5000 1.00
TMT 705 ~0.7 40.5 500-5000 0.40
E-ELT 1190 ~0.6 ~20 ? ~0.28
Technical Objectives
An instrument as large and expensive as GMACS requires formal systems engineering to define,
manage, control, and document the technical scope of work. We define our systems engineering
approach later in the this document, but the primary concept here is that the design and
performance of the instrument must flow directly from the science programs the instrument will
be expected to execute. The specific projects described above set examples of the science
programs that can be used to define these technical objectives, although future flexibility to
allow for changes in programmatic priorities must also be considered. Specifically, the main
science derived objectives are:

GMACS Conceptual Design Report 61
Sensitivity: S/N per resolution element should be 5-10 for 24th
mag targets in ~1 hour of
exposure. This is driven by essentially all of the specific science cases, which concentrate on
observing the faintest possible objects. Indeed it can be argued that GMT should not be used for
any other targets, which could be observed on smaller telescopes.
Image Quality: the science projects concern astronomical targets that range from individual stars
to very distant galaxies. Observations of faint point sources benefit from very small angular
resolution, since the S/N scales inversely with the square root of the effective aperture size.
There are some similar gains for extragalactic targets, which, although extended, can still have
concentrated central cusps or bulges. The instrument must have the capability of exploiting the
best images GMT will produce at optical wavelengths.
Background Emission Removal: sky subtraction must be accurate and precise to minimize the
presence of systematic noise in the spectra of faint objects. Again, this is driven by the science
goals to measure extremely faint objects that are ~5 mag fainter than the sky. Residuals of even
a few percent will seriously contaminate the science signal.
Efficiency of observations: all of the targeted science projects require the simultaneous
observation of multiple targets, which indicates that multi-object capability is a key aspect of the
instrument design. Although precise goals for the number of possible objects is difficult to
identify (some projects will be limited by the surface density of targets, but others will not), it is
clear that ―more is better‖ for the science.
Broad wavelength coverage: the projects span essentially the entire optical window, from the
UV to the far red. Most of the projects concentrate on the 400-950nm range, although clearly
science drivers exist that argue for extension of the range to 350-1050nm. We note that many
project require this entire optical range be simultaneously observed.
Spectral resolution: the science projects identify a range of resolutions that would be optimal.
There are essentially two fiducial resolutions: ―low‖ that would optimize sensitivity (particularly
in the red between the night sky emission lines) and ―high‖ that would allow for more precise
radial velocities.
Angular resolution: the science cases for GMACS all point towards an instrument that does not
require AO and that can be used in the natural seeing limit. Although, as pointed out above,
smaller effective apertures do increase S/N in a given time, so consideration should be given to
use with GLAO systems (for example) and consequent improved image quality.

GMACS Conceptual Design Report 62
Wavelength calibration stability: many of the science projects demand precision radial velocity
measurements from GMACS. This implies that the wavelength calibration of the instrument be
stable to a small fraction of a resolution element over the expected exposure time. In practice,
this suggests that the instrument must not shift the spectrum on the focal plane by more than
roughly 10 km/sec over an hour exposure so that induced error in redshifts (for example) are
small compared to expected local peculiar velocities, velocity dispersion, etc.
We can translate these science-derived demands into a set of technical objectives for the
instrument. These objectives include:
Sensitivity: High throughput; >50% at peak and no worse than 30% at any wavelength
Sensitivity: Detectors with low readout noise (<5% addition to background noise)
Excellent image quality: <0.2 arcsec rms over the entire detector plane
Accurate and precise sky subtraction: use direct slits
Multi-object capability: focal plane masks
Wide field: large focal plane masks
Broad wavelength coverage: at least 400-950nm (goal is 350-1100nm)
Moderate resolution: 1000-5000
Seeing limited operation: plan around use of a 0.7 arcsec slit (although the image quality
could make use of GLAO in the far red)
Spectral accuracy over long exposures of <0.1 resolution element; flexure compensation
These objectives define the capabilities we will make inherent in GMACS. They guide our
decisions throughout the project.
Resolution Choice
As described above GMACS science cases demand two resolutions. These are generically
―low‖, which optimizes sensitivity to faint objects, and ―high‖, which enhances radial velocity
precision, metallicity determination accuracy, etc. As described below, we have designed
GMACS to be capable of having both resolutions in place and usable during the night. We also
expect that the ―optimal‖ resolution for science applications will vary over the lifetime of the
instrument, so we expect that additional resolutions will be possible in the future.
In the blue the choice of a resolution to optimize S/N on faint targets is relatively
straightforward: the lower the better given constraints on the desired wavelength coverage,

GMACS Conceptual Design Report 63
velocity resolution, etc. We have selected a resolution of ~1400 as a fiducial choice, which is
consistent with our reference science cases (i.e. ~200 km/sec velocity resolution is well-matched
to typical galaxy velocity dispersions, ~0.1 pixel stability gives ~20 km/sec precision radial
velocity, etc.).
In the red, however, the presence of many and strong night sky emission lines, principally from
OH radicals in the upper atmosphere, complicate the situation. Particularly at wavelengths
longer than ~700nm, these emission lines dominate the sky background, even though the
background continuum is rising. Therefore, paradoxically, lowering resolution can degrade a
spectrograph’s ability to detect faint objects. This effect is demonstrated in Figure 26, which
shows the change in S/N per resolution element in background limited observations across the
600-1000nm range at various resolutions due to inclusion of some night sky line emission at
lower resolution (this simulation assumes no scattered light, but does account for Gaussian line
profiles with FWHM equal to the resolution). We use a night sky spectrum from Paranal as
representative of Las Campanas. The change in S/N is represented by the ratio of the square-root
of the sky continuum level relative to the actual background flux that would be seen in a
resolution element due to the line emission.
Note that in Figure 26 there are relatively few pixels that do not have significantly degraded S/N
at low resolution. In particular, at R=500 there are few pixels that are very few resolution
elements that are not compromised by at least 20%. Conversely, at higher resolution there are
more resolution elements that are not contaminated by emission lines. The ―getting between the
lines effect‖ is well-known in the infrared, where the night sky emission lines are severe (see
Martini and DePoy 2001).
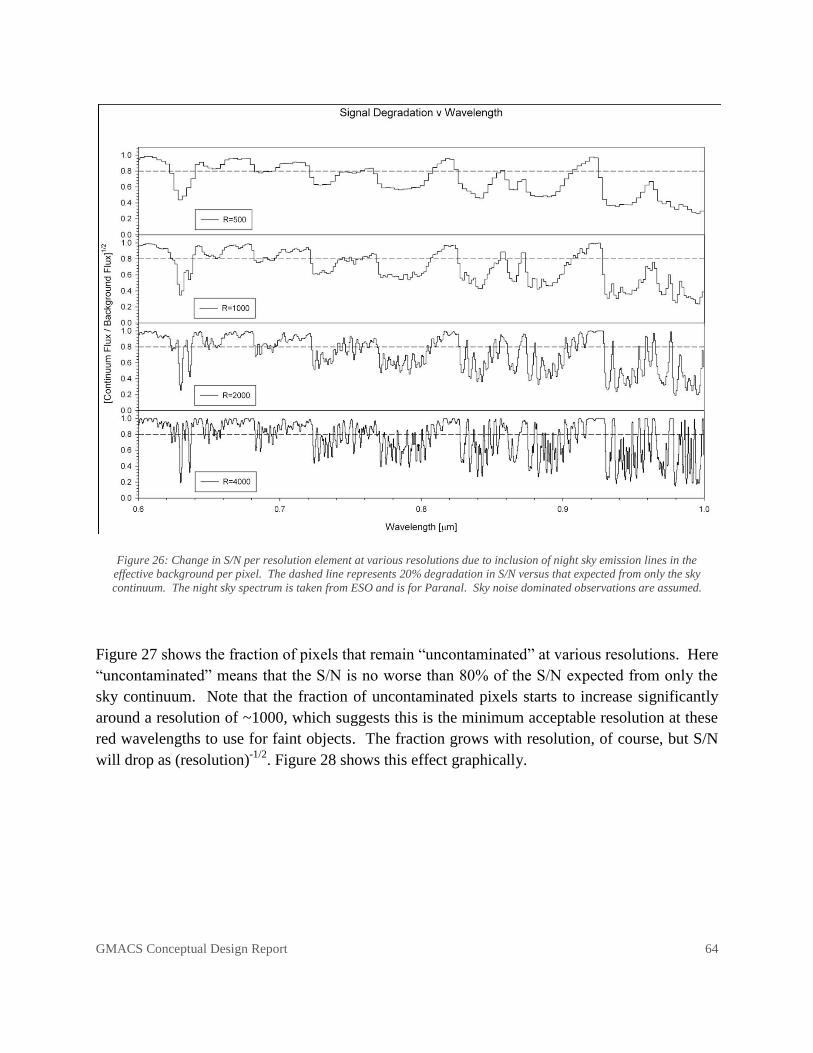
GMACS Conceptual Design Report 64
Figure 26: Change in S/N per resolution element at various resolutions due to inclusion of night sky emission lines in the
effective background per pixel. The dashed line represents 20% degradation in S/N versus that expected from only the sky
continuum. The night sky spectrum is taken from ESO and is for Paranal. Sky noise dominated observations are assumed.
Figure 27 shows the fraction of pixels that remain ―uncontaminated‖ at various resolutions. Here
―uncontaminated‖ means that the S/N is no worse than 80% of the S/N expected from only the
sky continuum. Note that the fraction of uncontaminated pixels starts to increase significantly
around a resolution of ~1000, which suggests this is the minimum acceptable resolution at these
red wavelengths to use for faint objects. The fraction grows with resolution, of course, but S/N
will drop as (resolution)-1/2
. Figure 28 shows this effect graphically.
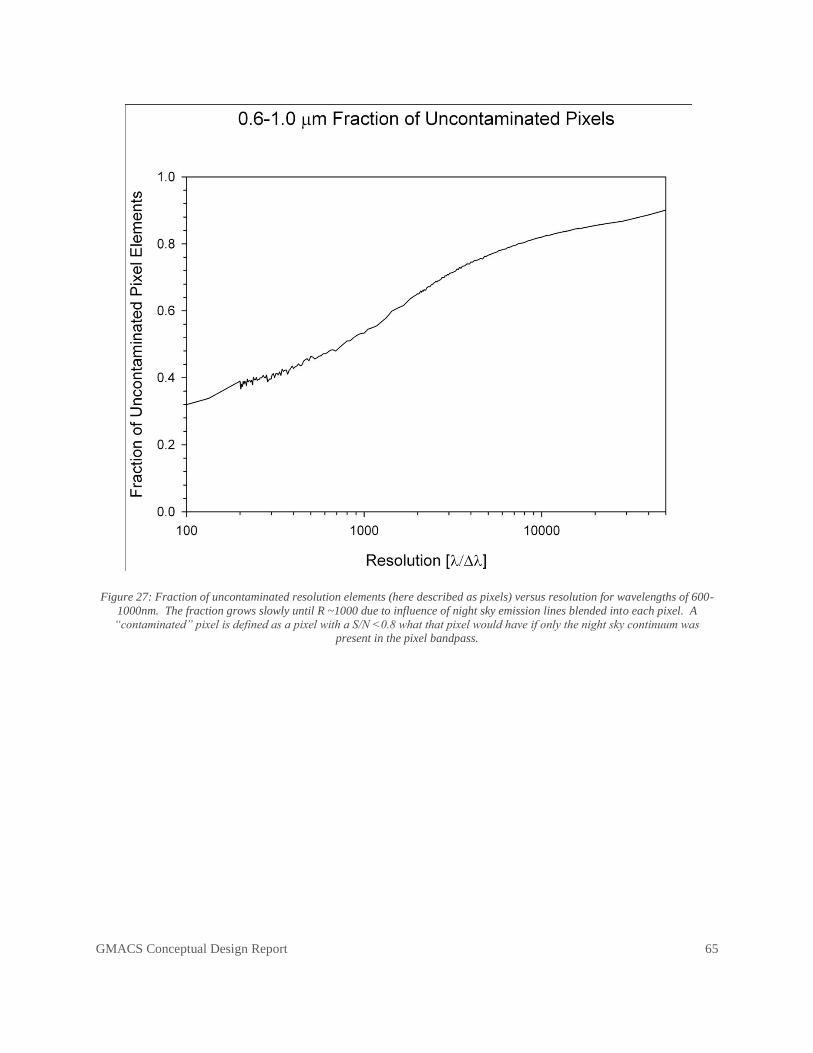
GMACS Conceptual Design Report 65
Figure 27: Fraction of uncontaminated resolution elements (here described as pixels) versus resolution for wavelengths of 600-
1000nm. The fraction grows slowly until R ~1000 due to influence of night sky emission lines blended into each pixel. A
“contaminated” pixel is defined as a pixel with a S/N <0.8 what that pixel would have if only the night sky continuum was
present in the pixel bandpass.

GMACS Conceptual Design Report 66
Figure 28: S/N per resolution element versus resolution for constant source brightness and sky-limited observations at
wavelengths of 600-1000nm. The different lines show the run of S/N versus resolution for the best 10%, 25%, 50%, and 75% of
the resolution elements. Note that for the best 75% the change does not scale with the resolution-1/2, due to the influence of
plentiful night sky emission lines.
We have selected a resolution of ~2200 as a reasonable choice for the fiducial red low-resolution
mode. This is a good compromise between too low, which would be seriously contaminated by
night sky emission lines, and too high, which would lower the S/N on faint objects. This
resolution is also consistent with the science project goals (i.e. velocity resolution of ~150
km/sec, which is well-matched to typical galaxy velocity dispersions and well under peculiar
velocities, and radial velocity precision of ~15 km/sec, which is adequate for galactic dynamics).
We have selected roughly twice these resolutions as the representative ―high‖ resolution mode.
There are two reasons. First, this coincides better with some of the science goals for radial
velocity precision and aids metallicity determination. Second, this is roughly the highest
GMACS Conceptual Design Report 67
resolution the instrument is capable of producing; significantly higher resolution would require a
substantially altered instrument design. However, the instrument is capable of higher resolution
(particularly with a narrower slit); see the Optical Design section of this document for additional
details.
We note that these particular resolution choices are not unchangeable. If there are compelling
science or technical reasons for alternate choices (subject to the constraints set by the instrument
general design), then those should be straightforward to accommodate. Indeed, we expect that
other resolution choices may be implemented over the lifetime of the instrument.
Brief Description of the Instrument Concept
The original instrument concept that we proposed to develop further is described in detail in the
GMT CoDR documentation. The concept provides complete, simultaneous spectral coverage
over the wavelength range from ~0.38 to 1.0μm, for hundreds of objects in a 9 18 arcmin field
of view. The default resolution with a 0.7 arcsec slit is ~1400 in the blue (at ~520nm) and ~2200
in the red (at 740nm) in the low-resolution mode; the resolution with the same slit in the high-
resolution mode is ~2600 in the blue (at ~520nm) and ~4000 in the red (at 740nm).
The instrument concept splits the GMT focal plane into four segments, each of which is fed to a
double spectrograph. The four arms were selected for two reasons. First, there is a legacy for
the instrument that adopts this approach. Second, however, is that four arms represent a good
balance of cost versus complexity. Fewer arms require larger optics and faster camera speeds
(for a particular final focal plane scale), which is likely to increase cost and risks in obtaining
appropriate optics blanks, gratings, etc. The four-arm design can be made from components that
require no new technology development. A larger number of arms increases alignment and
packaging complexity and does not substantially reduce cost. An eight-arm design, for example,
could be made of somewhat smaller components than those described below, but (of course)
twice as many would be required to cover the same field. Potentially this approach could allow
lower costs, but our preliminary estimates suggest that the additional personnel cost for increased
design, fabrication, assembly, test, and deployment would approximately equal the reduced
component cost. For both these reasons, we decided to proceed with a 4-arm approach.
The GMACS concept is highly modular, as described below, and could be deployed in stages
that progressively add capabilities as scientific priorities, user-community interest, and funding
allows. We discuss various deployment options and de-scope possibilities below.
GMACS Conceptual Design Report 68
The GMACS concept is designed around a multi-slit approach to provide the best possible sky
subtraction and instrumental throughput. The current optical design makes extensive use of
refractive elements and has a baseline beam diameter of ~300 mm. Typical optical element sizes
are ~400 mm. To create the maximum possible field, the optical design assumes the presence of
a telecentric corrector (as described in Section 6.3.1 of the CoDR document and in subsequent
GMTO revisions) and multiple collimators and spectrographs that would be deployed across the
telescope focal plane in a ―fly’s-eye‖ approach. We will require services from GMT for power,
communication, and cooling (detector and general waste heat); these are mentioned below in
more detail.
Performance Estimate
Our goal is to make GMACS the most efficient spectrograph on any extremely large telescope.
Our choice of VPH gratings and a dual-channel design is predicated on this goal. The VPH
gratings will be substantially more efficient than traditional plane reflection gratings (1.5 to 3
times as efficient, depending on the wavelength; see the Optical Design section below). The
ability to tune the performance to less than a single octave of wavelength coverage enabled by
the dual-channel design will permit additional efficiency gains. For example, we can tune lens
coatings for optimal performance; modern coatings on recent instruments permit lens
throughputs greater than 99.5% over broad wavelength regions. Even with ~20 surfaces, optical
efficiencies should be very high. CCDs can also be selected that are optimized for efficiency at
appropriate wavelengths. For example, detectors with anti-reflection coatings optimized for
ultraviolet and blue response in one channel; deep-depletion, thick CCDs with excellent red
response in the other. Recent examples of red-sensitive CCDs, in particular, have greater than
80% QE at 900 nm and less than 0.1% fringing at 950 nm; these would be very well suited to the
instrument and are available in large quantities from at least four vendors (E2V, Hitachi, LBL,
and Lesser).
More generally, the combination of GMT and the optical spectrograph will provide substantive
gains in spectroscopic sensitivity compared to any existing telescope and detector
combinations. The instrument will allow study of the spectroscopic details that are beyond the
limits of even the most sensitive spectrographs on 10 m-class telescopes. The DEIMOS
spectrograph on the Keck telescope, one of the world’s most sensitive optical spectrographs,
achieves typical S/N ~ 3 per spectral resolution element for 1 hour exposures with R~2000 for
objects of i' = 24 AB mag. Figure 29 shows the expected S/N for DEIMOS for this exposure
time and resolution as a function of i'-band AB magnitude. In comparison, we estimate the
GMACS Conceptual Design Report 69
expected S/N for the combination of GMT and our proposed spectrograph will be more than
three times higher in a given time. This gain comes primarily from the larger collecting area of
the telescope (4.95 times larger area) and our anticipated high throughput (roughly 1.5 higher
due to a combination of superior dispersive element efficiency and CCD QE).
This improvement in S/N compared to top-end instruments on 10 m-class telescopes is evident in
the amount of useful information that will be available from spectroscopic observations of faint
targets. Figure 30 shows simulated galaxy spectra for a galaxy at z=5 in a 2 hr exposure with
Keck + DEIMOS versus the gains with our spectrograph. The intrinsic galaxy spectrum is the
composite UV spectrum constructed from 1000 z=3 galaxies from Shapley et al (2003, ApJ, 688,
65) and corresponds to a nearly a 50 hr exposure with Keck. We have simulated the spectra of a
galaxy with this intrinsic spectrum at an apparent magnitude of i' = 25.1 AB mag, which
corresponds to the characteristic luminosity of the z=5 UV luminosity function (Bouwens et al.
2007, ApJ, 670, 928). Therefore, this is the data quality expected for "typical" galaxies at z=5.
Figure 30 shows that while Keck + DEIMOS is capable of measuring a redshift from the Lyman-
alpha emission line at 7300 Angstroms, this spectrum is not scientifically useful for most
additional studies. In contrast, our improved sensitivity provides sufficient S/N in the continuum
to measure the strength of atomic absorption features from the low-ionization interstellar
medium (ISM, including neutral carbon and oxygen, and singly ionized silicon and iron), as well
as the strength of high-ionization ISM, including features the stellar winds of massive stars
(triply ionized silicon and triply ionized carbon). In addition, spectroscopic measurements of all
galaxies at z > 5 to date have relied on the presence of Lyman-alpha in emission. Figure 30
shows that GMT will allow for the measurement of galaxy redshifts based on only absorption
lines.

GMACS Conceptual Design Report 70
Figure 29: Comparison of expected GMT optical spectrograph sensitivity versus DEIMOS on Keck under good conditions.
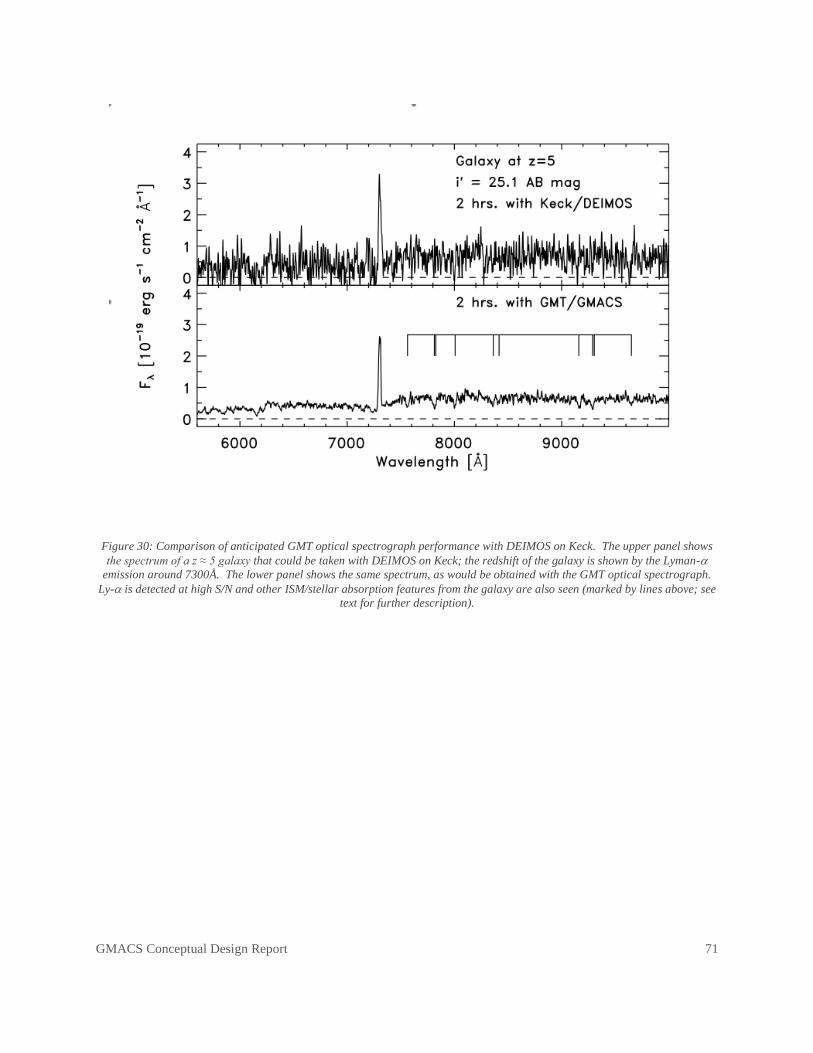
GMACS Conceptual Design Report 71
Figure 30: Comparison of anticipated GMT optical spectrograph performance with DEIMOS on Keck. The upper panel shows
the spectrum of a z ≈ 5 galaxy that could be taken with DEIMOS on Keck; the redshift of the galaxy is shown by the Lyman-
emission around 7300Å. The lower panel shows the same spectrum, as would be obtained with the GMT optical spectrograph.
Ly- is detected at high S/N and other ISM/stellar absorption features from the galaxy are also seen (marked by lines above; see
text for further description).

GMACS Conceptual Design Report 72
Optical Design
General Optical Design, Layout, and Performance
The optical design of GMACS is complete. The design consists of a broad wavelength coverage
collimator for each arm. The collimator feeds two cameras: a red camera optimized for 650nm
to 1020nm coverage, and a blue camera optimized for 370nm to 670nm coverage. The blue
camera works well to at least 350nm. The general layout of the optics is shown in Figure 31.
Note that we assume the existence of the GMT wide field corrector. Figure 32 shows more detail
on the optical configuration of a single channel. Zemax files of the design are available on the
Basecamp GMACS site; we include drawings of the individual lenses in the design in Appendix
2.
Figure 31: General optical layout of the GMACS design. The large lens in the middle is the last element of the GMT wide field
corrector. The green “tent” looking reflections are the four mirrors that direct the quadrants into the individual spectrograph
arms. Each arm consists of a two-channel spectrograph.
The collimator design is based on the IMACS collimator. An initially on-axis design is rotated
to an off-axis fly’s-eye position with no reoptimization for that position. Multiple fly’s-eye
collimators would physically interfere, which requires that the tent mirrors fold (separate) the

GMACS Conceptual Design Report 73
collimator axes. The collimators produce 300 mm diameter collimated beams with sufficient
pupil relief to fit the dichroic and locate the gratings at the pupil.
Figure 32: Additional details on the layout of each individual channel of GMACS shown from two orthogonal orientations. For
scale, note that the large initial lens is the final element of the GMT wide field corrector, which is ~1.5m in diameter.
The cameras are f/2.25, 675mm focal length refractive designs optimized for the red and the blue
(materials, coatings, etc.). The blue camera has 7 elements, including 3 aspheric surfaces. The
materials are CaF2, Fused Silica, BSM51Y, and BSL7Y. The red camera also has 7 elements,
again with 3 aspheric surfaces. The materials are CaF2, Fused Silica, PBL6Y, PBL35Y, and
BSM51Y. All materials are available in appropriate blank sizes and there are multiple qualified
vendors available to produce the required figures and polishing.
The cameras produce a scale at the GMACS detector plane of 3.72 arcsec/mm. For 15 µm
pixels, this corresponds to 0.056 arcsec/pixel. A 0.7 arcsec slit would be 12.6 pixels across
(assuming no anamorphic factor).
Figure 33 and Figure 34 show spot diagrams for the end-to-end performance of the blue and red
channels. Table 6 and Table 7 summarize the end-to-end optical performance of the designs.
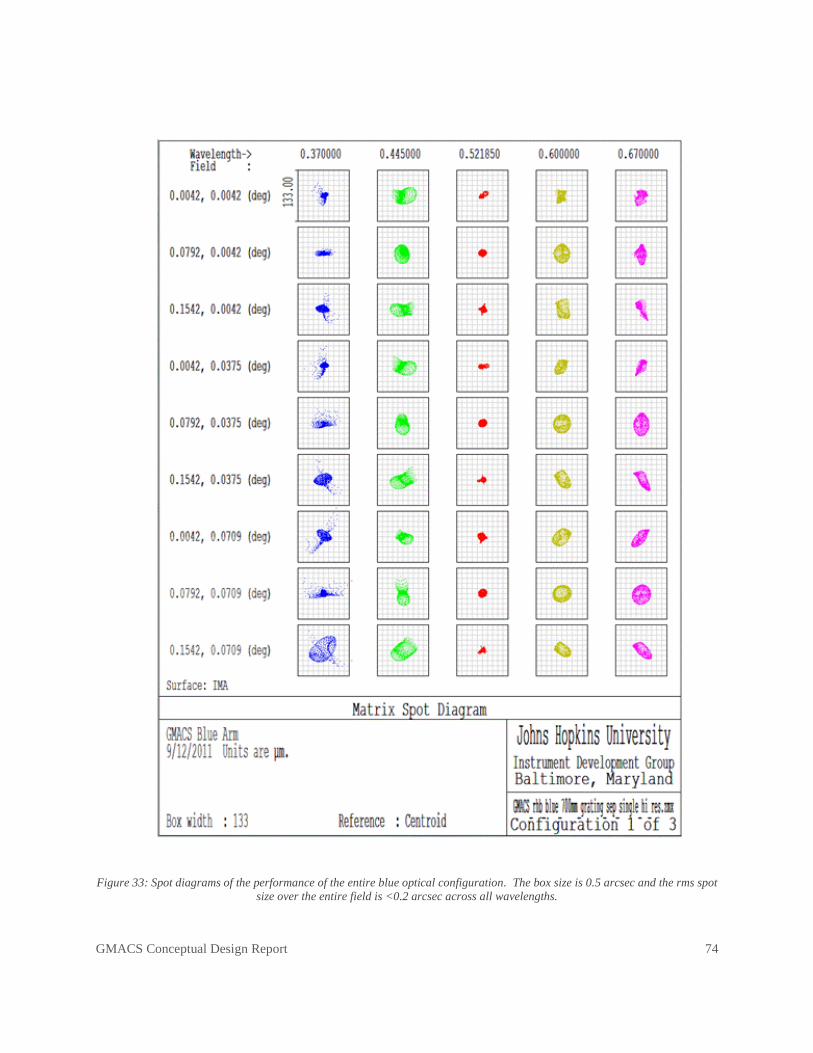
GMACS Conceptual Design Report 74
Figure 33: Spot diagrams of the performance of the entire blue optical configuration. The box size is 0.5 arcsec and the rms spot
size over the entire field is <0.2 arcsec across all wavelengths.
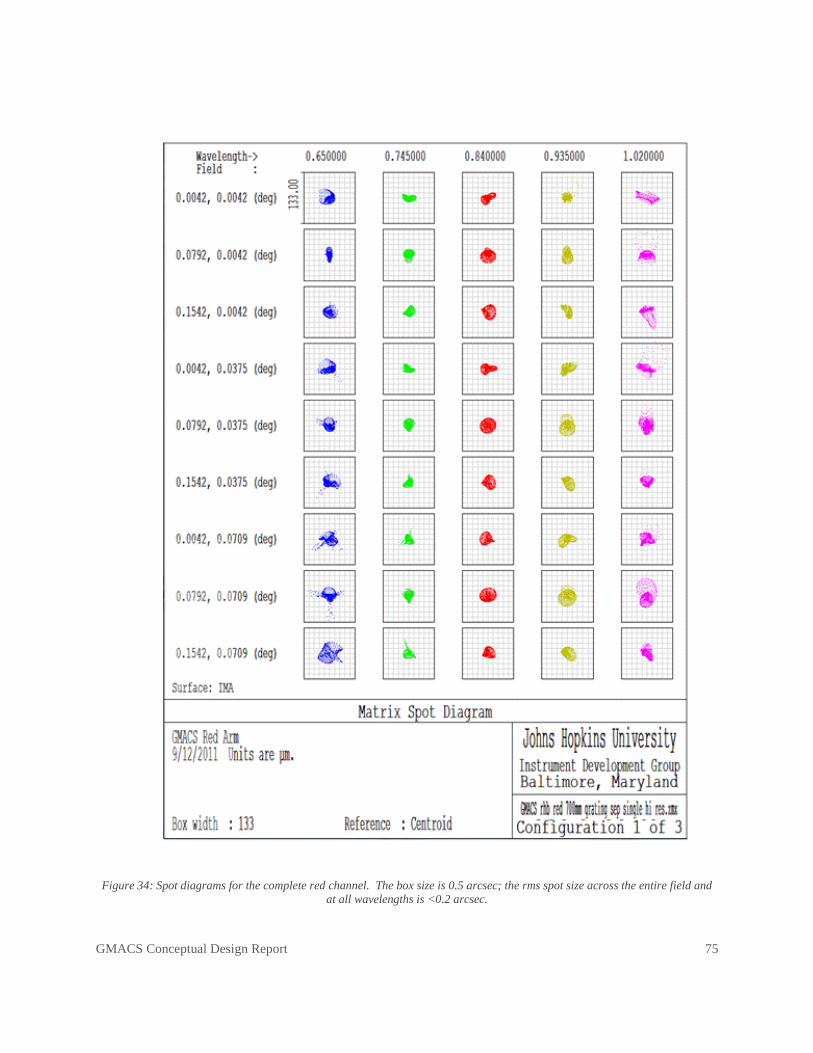
GMACS Conceptual Design Report 75
Figure 34: Spot diagrams for the complete red channel. The box size is 0.5 arcsec; the rms spot size across the entire field and
at all wavelengths is <0.2 arcsec.
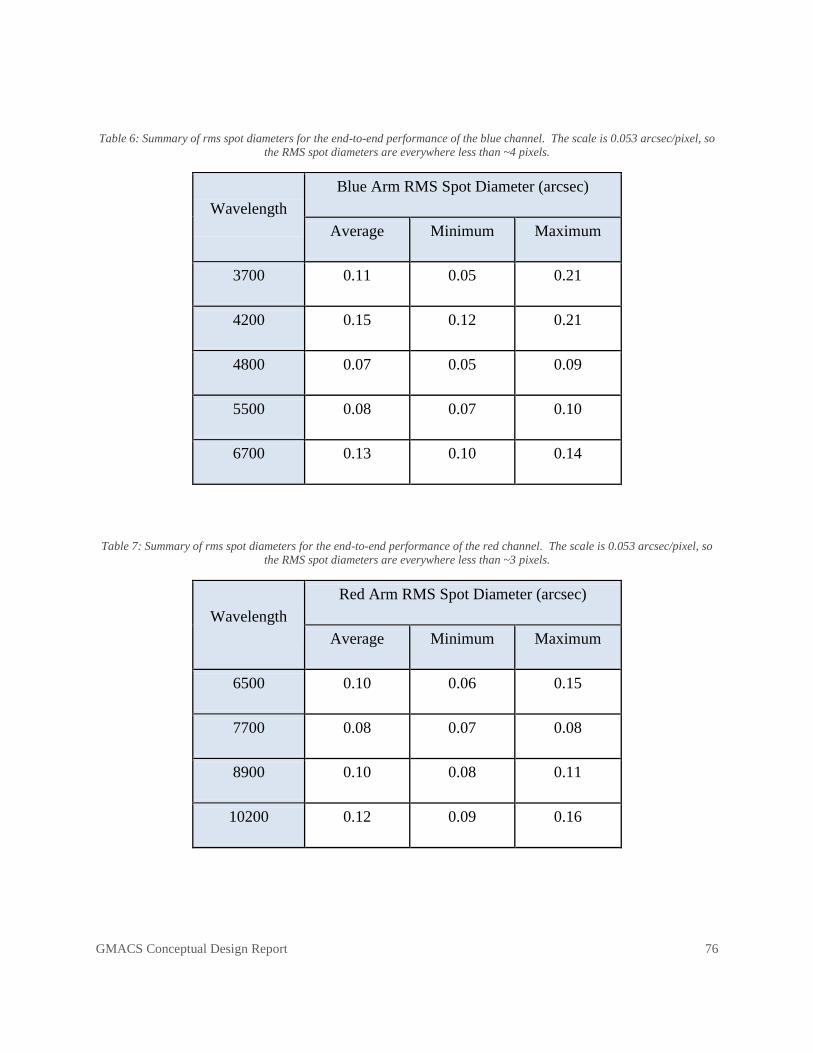
GMACS Conceptual Design Report 76
Table 6: Summary of rms spot diameters for the end-to-end performance of the blue channel. The scale is 0.053 arcsec/pixel, so
the RMS spot diameters are everywhere less than ~4 pixels.
Wavelength
Blue Arm RMS Spot Diameter (arcsec)
Average Minimum Maximum
3700 0.11 0.05 0.21
4200 0.15 0.12 0.21
4800 0.07 0.05 0.09
5500 0.08 0.07 0.10
6700 0.13 0.10 0.14
Table 7: Summary of rms spot diameters for the end-to-end performance of the red channel. The scale is 0.053 arcsec/pixel, so
the RMS spot diameters are everywhere less than ~3 pixels.
Wavelength
Red Arm RMS Spot Diameter (arcsec)
Average Minimum Maximum
6500 0.10 0.06 0.15
7700 0.08 0.07 0.08
8900 0.10 0.08 0.11
10200 0.12 0.09 0.16

GMACS Conceptual Design Report 77
Gratings
Four VPH gratings are needed for each arm: two blue and two red. We have adopted as a
baseline blue gratings with 728 l/mm and 1300 l/mm, and red gratings with 783 l/mm and 1300
l/mm. These give two different resolutions across the detector plane. The low-resolution mode
covers the entire wavelength range of a given channel at a resolution (λ / Δ λ) of ~2000; the
high-resolution mode gives roughly half the wavelength coverage, but at resolution of ~4000 (all
resolutions are using a 0.7 arcsec slit width). The high-resolution gratings will be capable of
rotation to select a desired wavelength range. Table 8 and Table 9 give more precise description
of the resolutions at various wavelengths in each channel using the default gratings.
The gratings are available commercially and have excellent throughput. Figure 35 - Figure 38
show grating efficiencies estimated by Kaiser Optical Systems. Kaiser believes these gratings
should be straightforward to manufacture and have provided cost estimates in appropriate
substrate sizes.
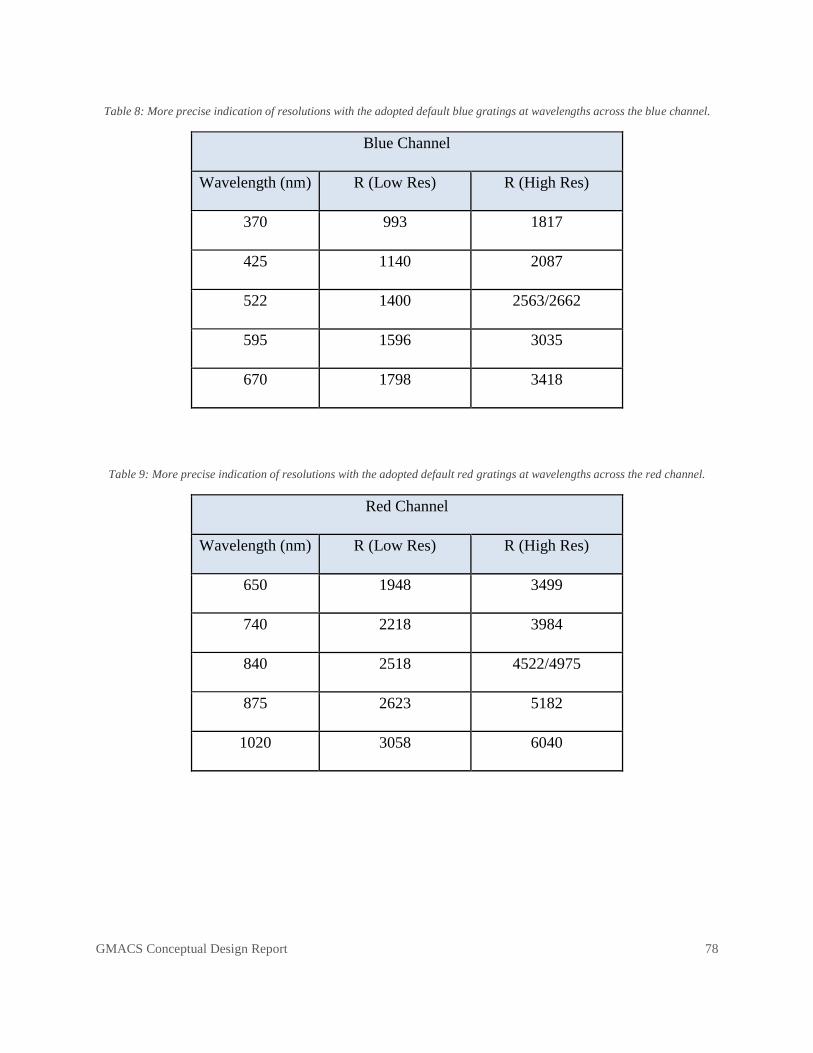
GMACS Conceptual Design Report 78
Table 8: More precise indication of resolutions with the adopted default blue gratings at wavelengths across the blue channel.
Blue Channel
Wavelength (nm) R (Low Res) R (High Res)
370 993 1817
425 1140 2087
522 1400 2563/2662
595 1596 3035
670 1798 3418
Table 9: More precise indication of resolutions with the adopted default red gratings at wavelengths across the red channel.
Red Channel
Wavelength (nm) R (Low Res) R (High Res)
650 1948 3499
740 2218 3984
840 2518 4522/4975
875 2623 5182
1020 3058 6040
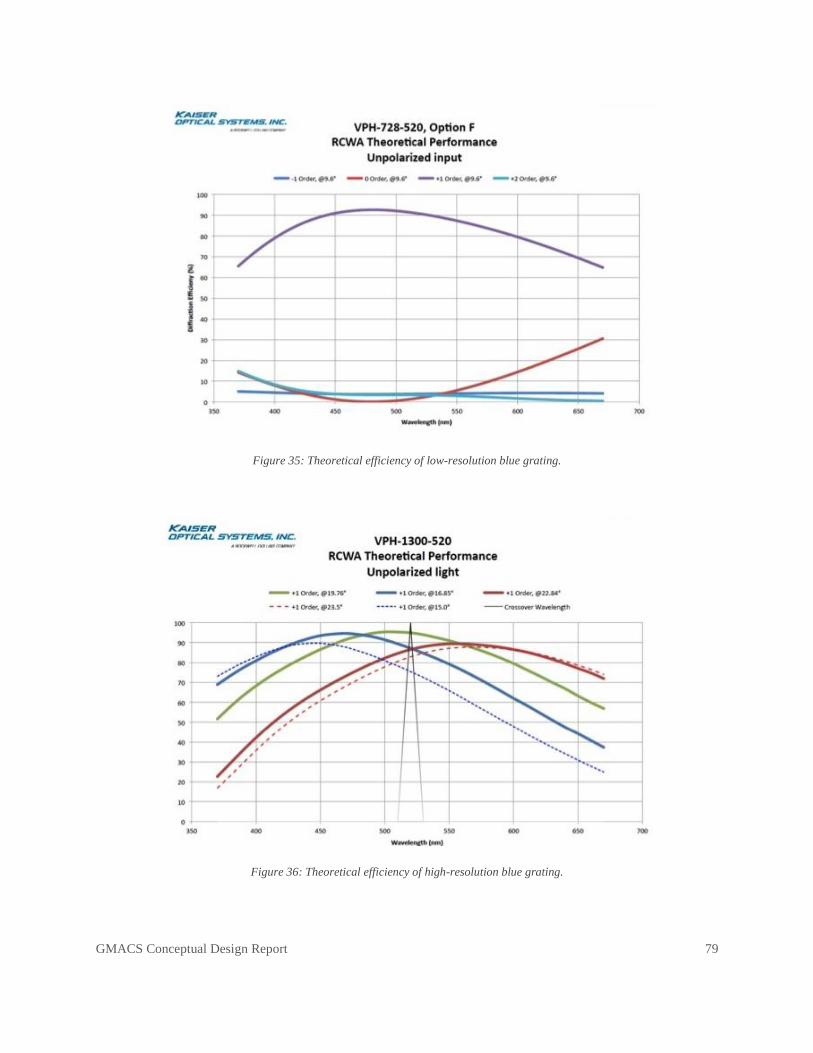
GMACS Conceptual Design Report 79
Figure 35: Theoretical efficiency of low-resolution blue grating.
Figure 36: Theoretical efficiency of high-resolution blue grating.
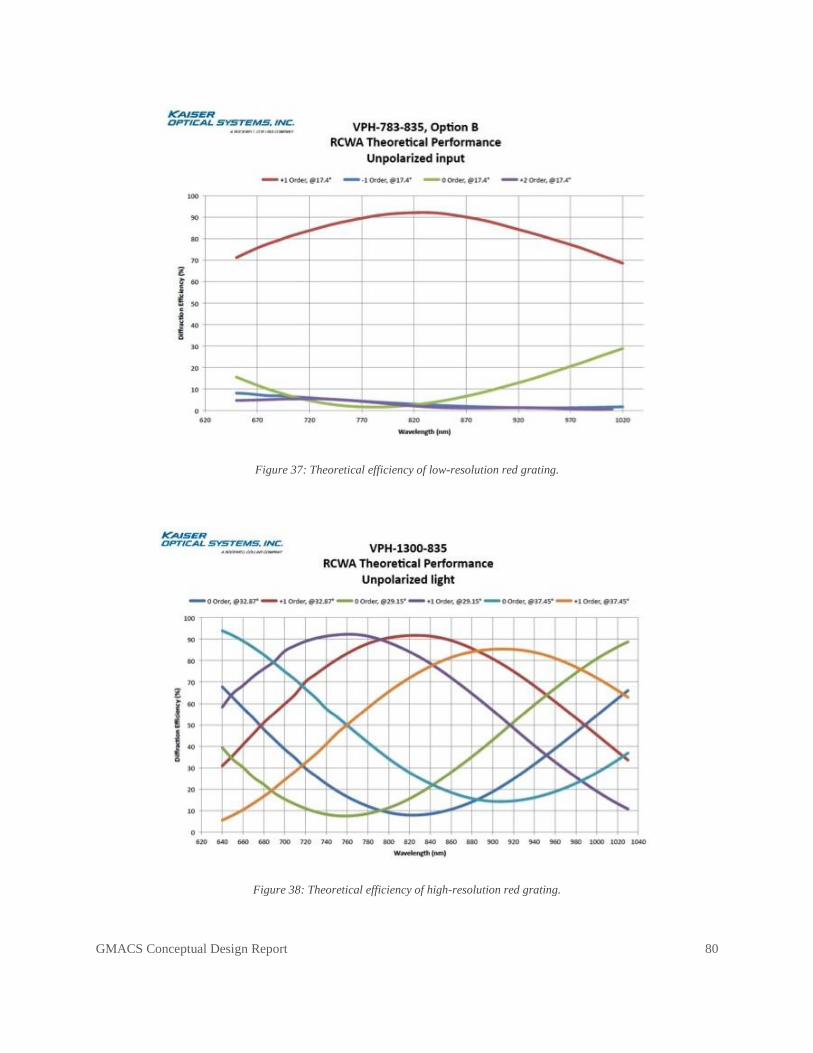
GMACS Conceptual Design Report 80
Figure 37: Theoretical efficiency of low-resolution red grating.
Figure 38: Theoretical efficiency of high-resolution red grating.
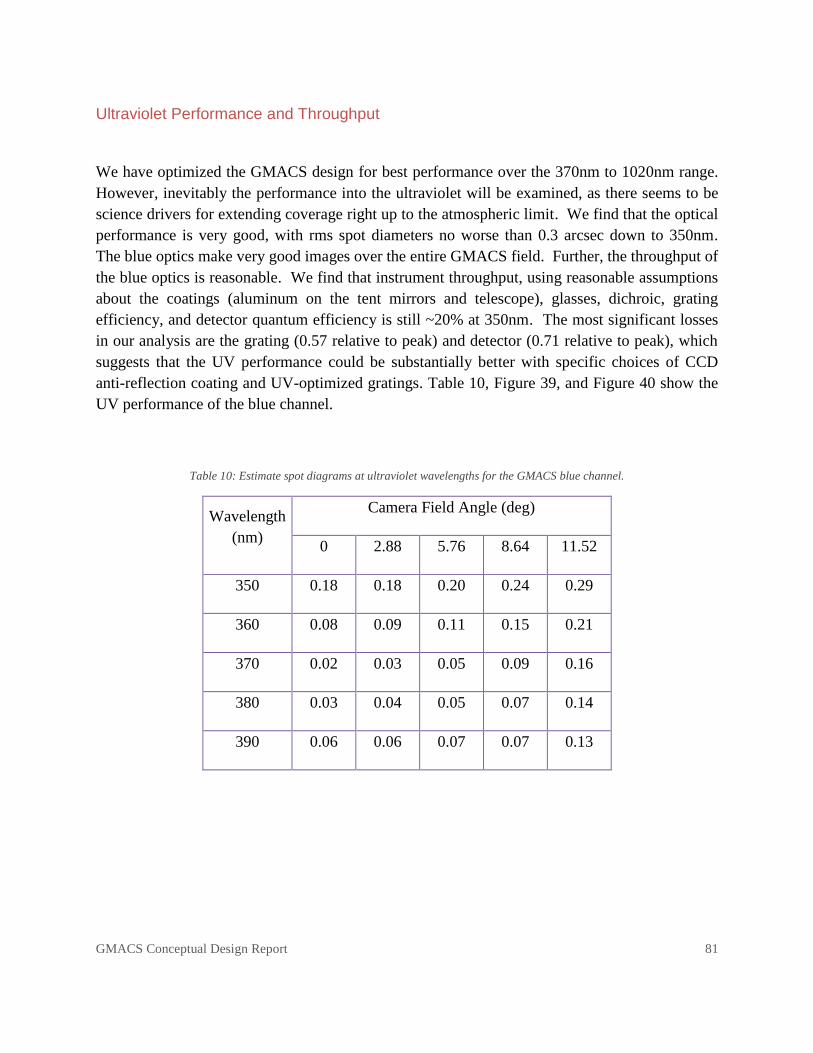
GMACS Conceptual Design Report 81
Ultraviolet Performance and Throughput
We have optimized the GMACS design for best performance over the 370nm to 1020nm range.
However, inevitably the performance into the ultraviolet will be examined, as there seems to be
science drivers for extending coverage right up to the atmospheric limit. We find that the optical
performance is very good, with rms spot diameters no worse than 0.3 arcsec down to 350nm.
The blue optics make very good images over the entire GMACS field. Further, the throughput of
the blue optics is reasonable. We find that instrument throughput, using reasonable assumptions
about the coatings (aluminum on the tent mirrors and telescope), glasses, dichroic, grating
efficiency, and detector quantum efficiency is still ~20% at 350nm. The most significant losses
in our analysis are the grating (0.57 relative to peak) and detector (0.71 relative to peak), which
suggests that the UV performance could be substantially better with specific choices of CCD
anti-reflection coating and UV-optimized gratings. Table 10, Figure 39, and Figure 40 show the
UV performance of the blue channel.
Table 10: Estimate spot diagrams at ultraviolet wavelengths for the GMACS blue channel.
Wavelength
(nm)
Camera Field Angle (deg)
0 2.88 5.76 8.64 11.52
350 0.18 0.18 0.20 0.24 0.29
360 0.08 0.09 0.11 0.15 0.21
370 0.02 0.03 0.05 0.09 0.16
380 0.03 0.04 0.05 0.07 0.14
390 0.06 0.06 0.07 0.07 0.13
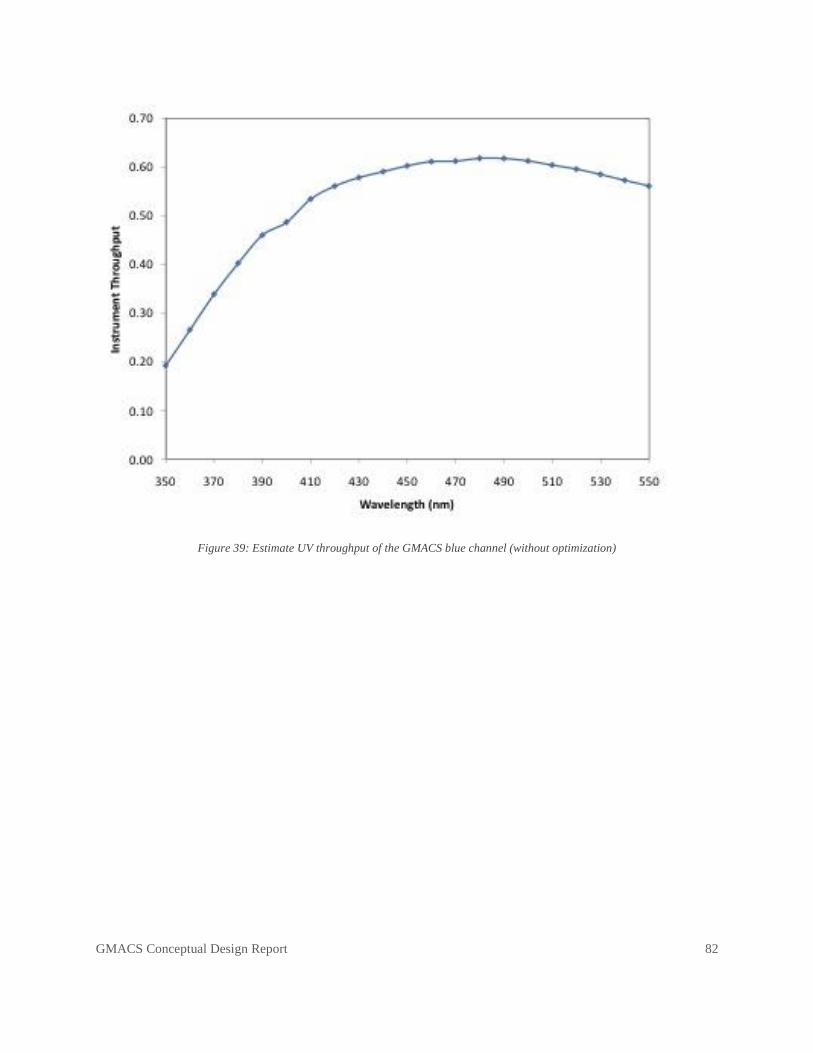
GMACS Conceptual Design Report 82
Figure 39: Estimate UV throughput of the GMACS blue channel (without optimization)
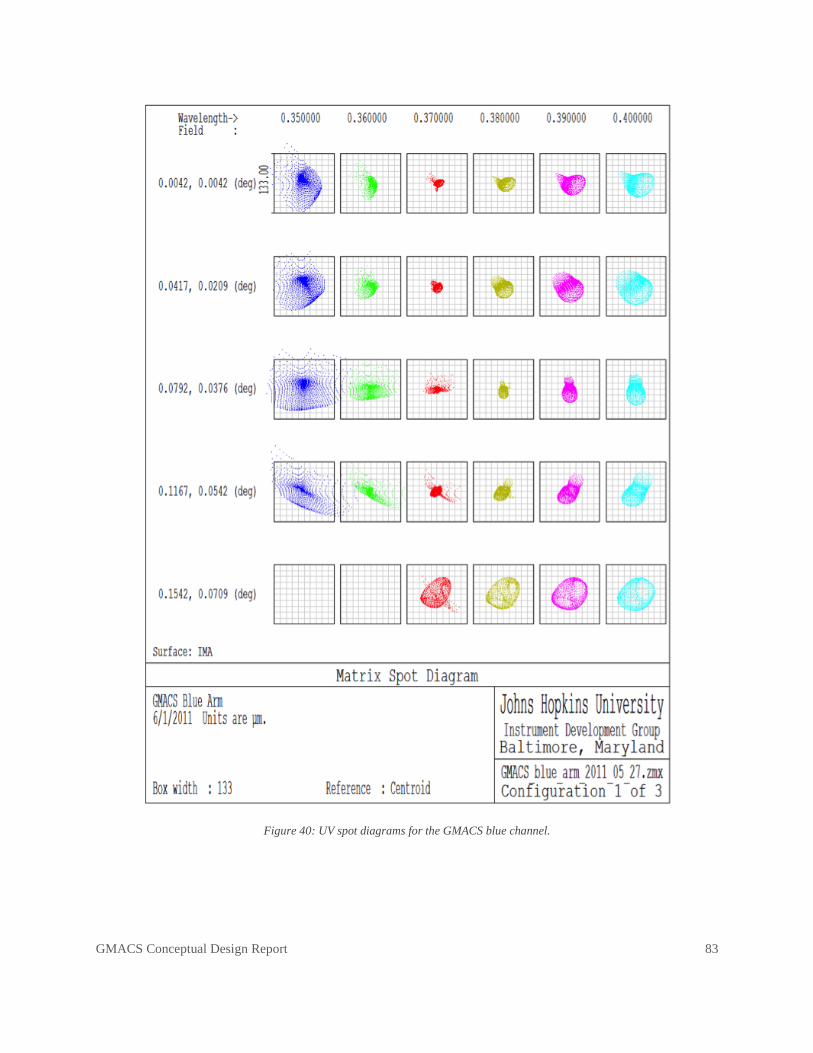
GMACS Conceptual Design Report 83
Figure 40: UV spot diagrams for the GMACS blue channel.

GMACS Conceptual Design Report 84
Imaging Mode
The articulation of the camera allows for an imaging mode. See the next section for more details
on the articulation mechanism. There are two possible configurations:
Remove one of the gratings from each channel infrequently in an ―imaging campaign‖ mode.
This would allow retention of partial spectroscopic capability.
Rotate gratings to (near) normal incidence and image through the gratings in zero order. This
configuration needs further analysis as to how much light, over what field of view, goes into
the various diffraction orders and where that light ultimately ends up on the detector. But
this option holds promise for quickly changing between all possible modes (low- and high-
resolution spectroscopy and imaging).
Imaging performance is reasonable in either mode. Figure 41 and Figure 42 show sample spot
diagrams. The angle between the collimator and cameras causes a shift of the field on the
detector. A small portion of the full field falls off the edge; this will have minimal impact on
performance. We are willing to more fully explore an imaging mode in the instrument and will
discuss the possibility at the Conceptual Design Review.
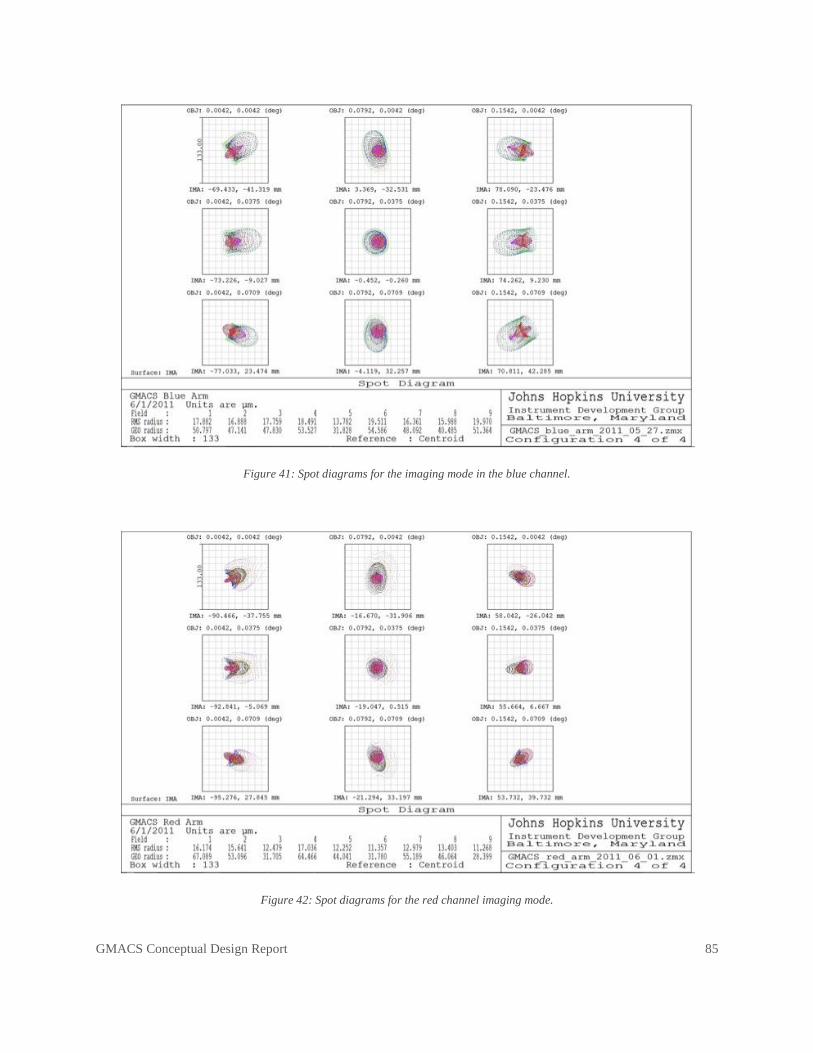
GMACS Conceptual Design Report 85
Figure 41: Spot diagrams for the imaging mode in the blue channel.
Figure 42: Spot diagrams for the red channel imaging mode.

GMACS Conceptual Design Report 86
Maximum Possible Resolution
We have investigated the maximum possible resolution that can be achieved with the GMACS
instrument; these maximum resolutions may be interesting for science cases other than the
baseline GMACS science case. We present the maximum resolutions in this section.
Red channel
We can increase the maximum resolution possible to a value above what we have adopted as the
―high resolution mode‖ throughout this document. If we increase the grating tilt 3.5 degrees to
41 degrees and articulate the camera an extra 7 degrees, we reach the limit of travel for both
mechanisms. A 1450 l/mm grating in the tiltable location and a 0.7 arcsec slit width would give
a resolution of 0.14 nm at these angles of use. This corresponds to a resolution of ~6600 at
950nm. Table 11 gives resolutions at other wavelengths. A consequence of this configuration,
however, is that the reddest wavelengths will no longer be on the detector. So this mode can
observe only at wavelengths shorter than ~965nm.
Table 11: Maximum resolution available in the red channel (corresponds to travel limits of grating tilt and camera articulation).
Red Channel Maximum Resolution
Wavelength (nm) R
650 4640
740 5290
840 6000
875 6250
950 6785
Blue Channel
Similarly, we can increase the maximum resolution of the blue channel by increasing the grating
tilt to 5 degrees beyond the fiducial ―high‖ resolution mode to an incidence angle of 27.8 degrees
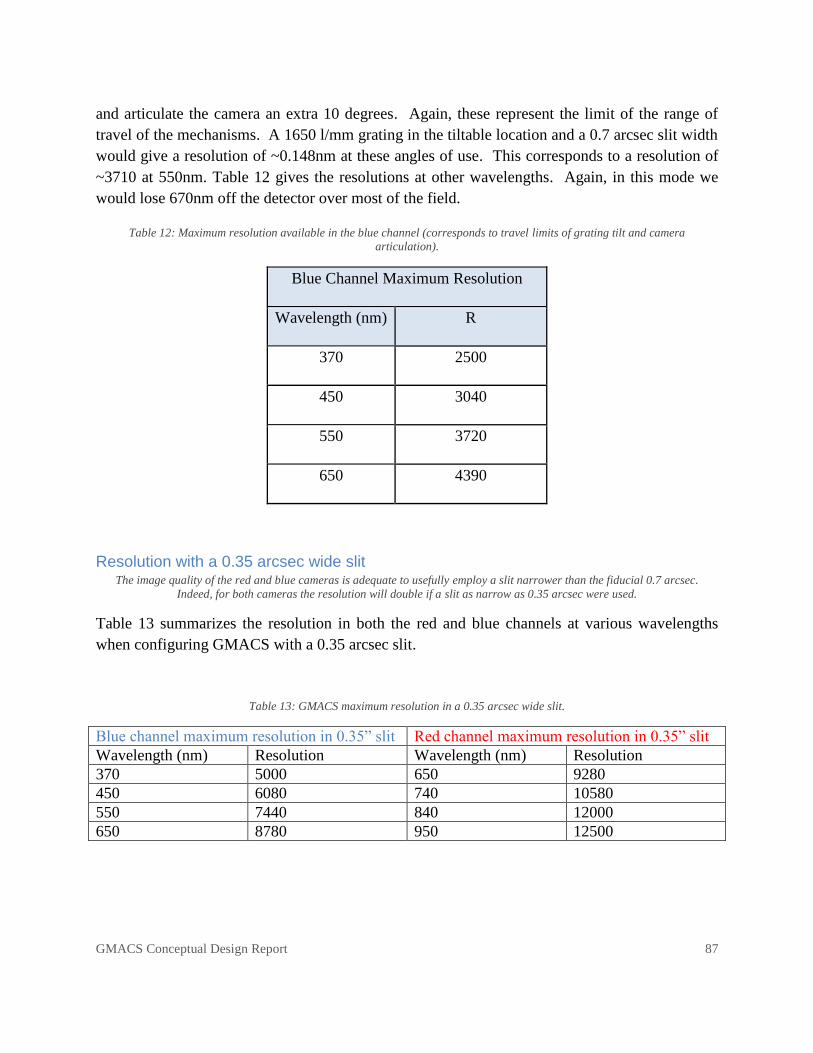
GMACS Conceptual Design Report 87
and articulate the camera an extra 10 degrees. Again, these represent the limit of the range of
travel of the mechanisms. A 1650 l/mm grating in the tiltable location and a 0.7 arcsec slit width
would give a resolution of ~0.148nm at these angles of use. This corresponds to a resolution of
~3710 at 550nm. Table 12 gives the resolutions at other wavelengths. Again, in this mode we
would lose 670nm off the detector over most of the field.
Table 12: Maximum resolution available in the blue channel (corresponds to travel limits of grating tilt and camera
articulation).
Blue Channel Maximum Resolution
Wavelength (nm) R
370 2500
450 3040
550 3720
650 4390
Resolution with a 0.35 arcsec wide slit The image quality of the red and blue cameras is adequate to usefully employ a slit narrower than the fiducial 0.7 arcsec.
Indeed, for both cameras the resolution will double if a slit as narrow as 0.35 arcsec were used.
Table 13 summarizes the resolution in both the red and blue channels at various wavelengths
when configuring GMACS with a 0.35 arcsec slit.
Table 13: GMACS maximum resolution in a 0.35 arcsec wide slit.
Blue channel maximum resolution in 0.35‖ slit Red channel maximum resolution in 0.35‖ slit
Wavelength (nm) Resolution Wavelength (nm) Resolution
370 5000 650 9280
450 6080 740 10580
550 7440 840 12000
650 8780 950 12500

GMACS Conceptual Design Report 88
Detector Objectives
GMACS detector systems must meet several objectives for the instrument to able to execute the
science projects that drive the overall design. Our objectives relevant to the detector systems are
Sensitivity: High throughput: >50% at peak and no worse than 30% at any wavelength
Sensitivity: Detectors with low readout noise (<5% addition to background noise)
Excellent image quality: <0.2 arcsec rms over the entire detector plane
Broad wavelength coverage: at least 400-950nm (goal is 350-1100nm)
Quantum Efficiency
These determine the characteristics of the detectors we plan to use in GMACS. In particular, the
high throughput objective implies we must select detectors with the highest possible quantum
efficiency. Fortunately, the detectors in each channel can be optimized differently so as to
ensure the best possible performance over the appropriate wavelength ranges. We anticipate
developing specific anti-reflection coating and device thickness as the project proceeds.
Figure 43 shows an example of the range of device quantum efficiency performance. These
curves were generated by E2V and show that devices with excellent quantum efficiency in the
ultraviolet are possible (although with some compromise of performance in the 450-600nm
wavelength range. We expect to develop specific requirements for the detector quantum
efficiency for the blue channel once GMT decides on primary mirror coating strategy and after
substantial discussions with GMT community scientists about the need for ultraviolet
performance.
Figure 43 also shows that devices with excellent performance are available for the red channel.
The ―bulk astro multi-AR‖ coating and device material may be today’s best choice, since the
device quantum efficiency is >80% through 900nm (and >90% for 600-850nm). That device
would also have ~30% quantum efficiency at 1000nm. Again, we anticipate developing specific
requirements for the coating and material choice to optimize performance in the next stage of the
project.
Readout Noise
The selected detectors must also have sufficiently low noise when read out to not have
significant impact on the S/N from science targets. In practice this means that the readout noise
must be small compared to the square-root of the expected number of detected sky photons.
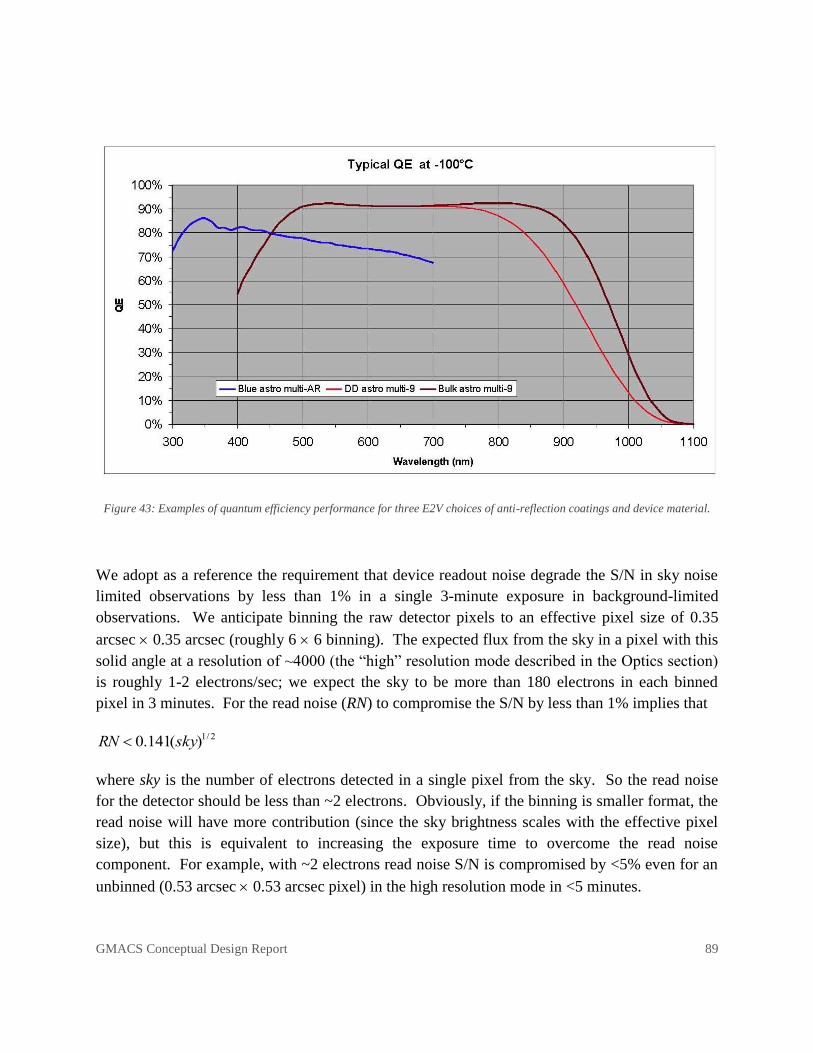
GMACS Conceptual Design Report 89
Figure 43: Examples of quantum efficiency performance for three E2V choices of anti-reflection coatings and device material.
We adopt as a reference the requirement that device readout noise degrade the S/N in sky noise
limited observations by less than 1% in a single 3-minute exposure in background-limited
observations. We anticipate binning the raw detector pixels to an effective pixel size of 0.35
arcsec 0.35 arcsec (roughly 6 6 binning). The expected flux from the sky in a pixel with this
solid angle at a resolution of ~4000 (the ―high‖ resolution mode described in the Optics section)
is roughly 1-2 electrons/sec; we expect the sky to be more than 180 electrons in each binned
pixel in 3 minutes. For the read noise (RN) to compromise the S/N by less than 1% implies that
RN 0.141(sky)1/ 2
where sky is the number of electrons detected in a single pixel from the sky. So the read noise
for the detector should be less than ~2 electrons. Obviously, if the binning is smaller format, the
read noise will have more contribution (since the sky brightness scales with the effective pixel
size), but this is equivalent to increasing the exposure time to overcome the read noise
component. For example, with ~2 electrons read noise S/N is compromised by <5% even for an
unbinned (0.53 arcsec 0.53 arcsec pixel) in the high resolution mode in <5 minutes.
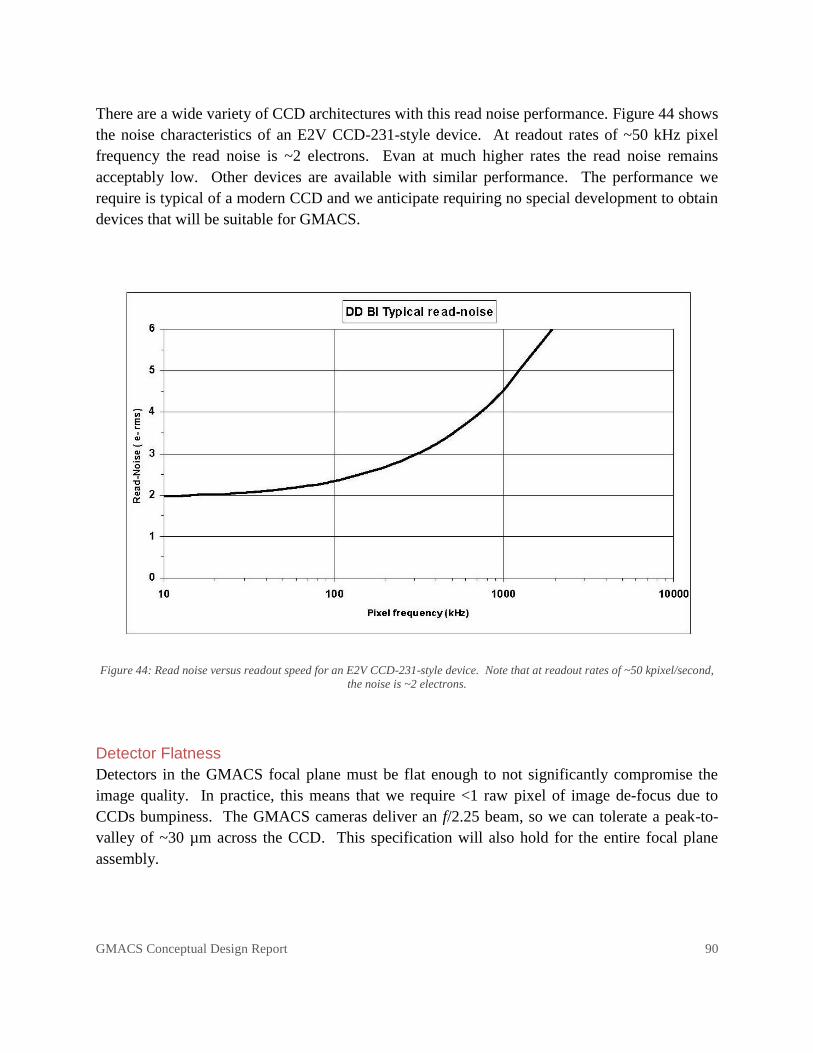
GMACS Conceptual Design Report 90
There are a wide variety of CCD architectures with this read noise performance. Figure 44 shows
the noise characteristics of an E2V CCD-231-style device. At readout rates of ~50 kHz pixel
frequency the read noise is ~2 electrons. Evan at much higher rates the read noise remains
acceptably low. Other devices are available with similar performance. The performance we
require is typical of a modern CCD and we anticipate requiring no special development to obtain
devices that will be suitable for GMACS.
Figure 44: Read noise versus readout speed for an E2V CCD-231-style device. Note that at readout rates of ~50 kpixel/second,
the noise is ~2 electrons.
Detector Flatness
Detectors in the GMACS focal plane must be flat enough to not significantly compromise the
image quality. In practice, this means that we require <1 raw pixel of image de-focus due to
CCDs bumpiness. The GMACS cameras deliver an f/2.25 beam, so we can tolerate a peak-to-
valley of ~30 µm across the CCD. This specification will also hold for the entire focal plane
assembly.
GMACS Conceptual Design Report 91
E2V CCDs hold this level of flatness and many instrument have created focal planes that meet
this specification (DECam, ODI, etc.). We do not believe this will be a difficult requirement to
meet.
Conclusion
Detector systems for GMACS are available commercially. In particular, E2V can provide both
blue- and red-optimized CCDs that can be used in both channels of the instrument; the
performance of the available devices is excellent (quantum efficiency, readout noise, cosmetics,
etc.) and meets our various instrument objectives. E2V can also provide ready-made ―focal
planes‖: mosaics of individual CCDs mounted on a SiC surface and attached to ASIC-based
controllers. The detector planes are very large by current standards: we need 8 10K × 20K CCD
mosaics (15 μm pixels) for a total focal plane size of 1.6 Gpixels. The expected slit width will be
over-sampled, so we expect to typically bin the pixels substantially (depending on observing
conditions).
As an example of devices that could be ordered today, see Appendix 4. This appendix gives a
copy of a specific proposal that E2V has provided. They offer to supply all the CCDs for
GMACS, mounted on a SiC plate, including ASIC readout electronics. This is an attractive
approach and we adopt it as our baseline for GMACS. The detector costs given below are based
on information from E2V related to this proposal.

GMACS Conceptual Design Report 92
Mechanical Design
The conceptual mechanical design of GMACS has two basic sub-systems: a focal plane unit that
translates into the active space in the GIR and is lifted to the telescope focal plane via an elevator
mechanism and a set of optics modules that contain the individual arms and channels. The focal
plane unit is stored in the lower half of one GIR bay; the optics modules are permanently fixed to
the ―ceiling‖ of the GIR and occupy the top half of two bays (separated by 180 degrees). Each is
described in additional detail below. Figure 45 and Figure 46 show the locations of these sub-
systems in the GIR.
Figure 45: Side view of the GIR showing the various sub-systems in the aligned and ready-to-observe position. A person is given
for scale.
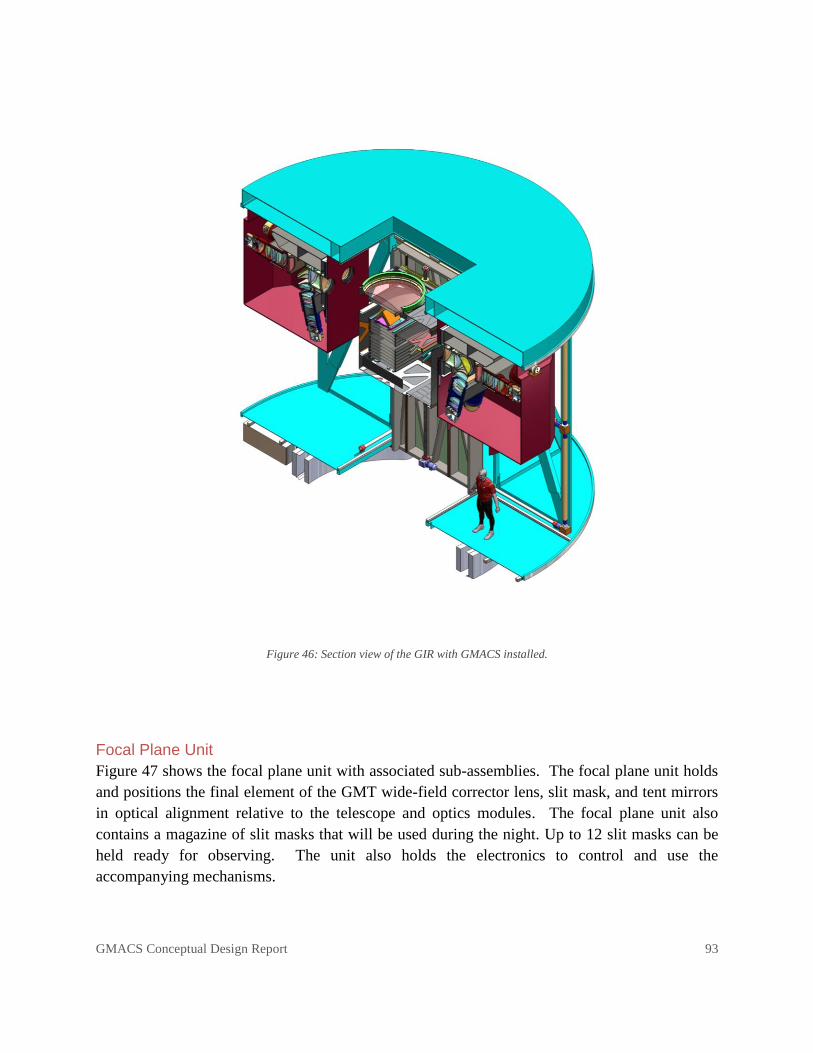
GMACS Conceptual Design Report 93
Figure 46: Section view of the GIR with GMACS installed.
Focal Plane Unit
Figure 47 shows the focal plane unit with associated sub-assemblies. The focal plane unit holds
and positions the final element of the GMT wide-field corrector lens, slit mask, and tent mirrors
in optical alignment relative to the telescope and optics modules. The focal plane unit also
contains a magazine of slit masks that will be used during the night. Up to 12 slit masks can be
held ready for observing. The unit also holds the electronics to control and use the
accompanying mechanisms.
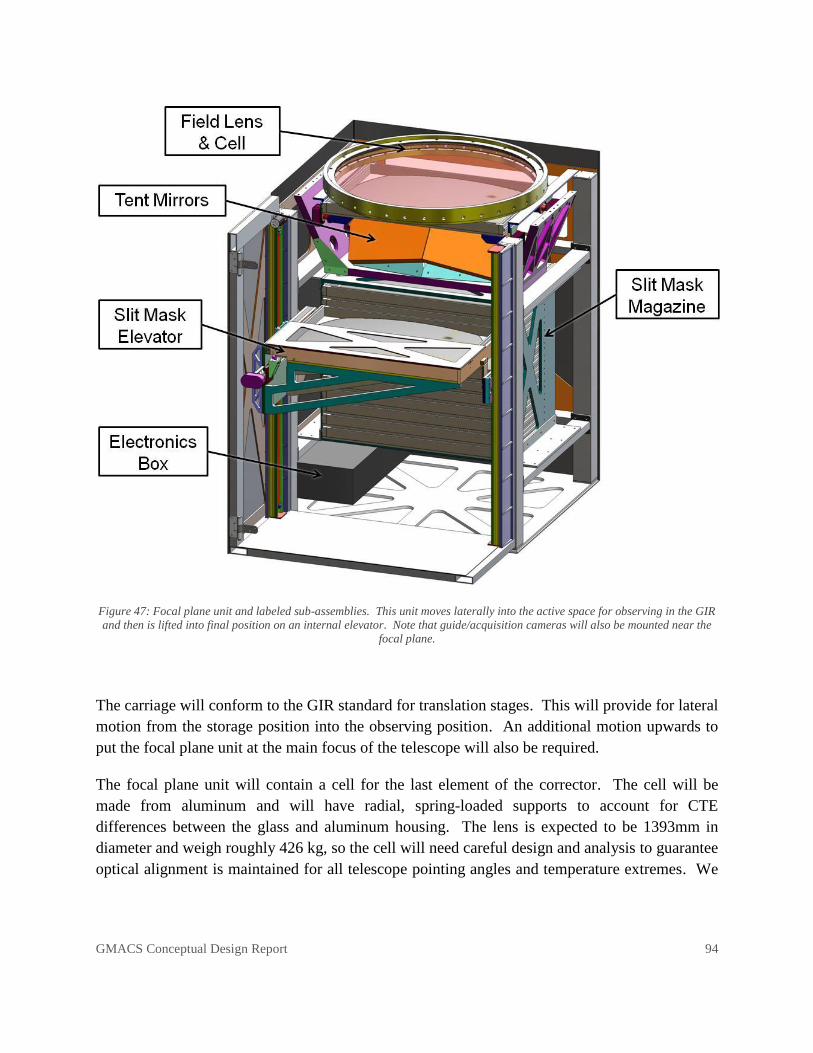
GMACS Conceptual Design Report 94
Figure 47: Focal plane unit and labeled sub-assemblies. This unit moves laterally into the active space for observing in the GIR
and then is lifted into final position on an internal elevator. Note that guide/acquisition cameras will also be mounted near the
focal plane.
The carriage will conform to the GIR standard for translation stages. This will provide for lateral
motion from the storage position into the observing position. An additional motion upwards to
put the focal plane unit at the main focus of the telescope will also be required.
The focal plane unit will contain a cell for the last element of the corrector. The cell will be
made from aluminum and will have radial, spring-loaded supports to account for CTE
differences between the glass and aluminum housing. The lens is expected to be 1393mm in
diameter and weigh roughly 426 kg, so the cell will need careful design and analysis to guarantee
optical alignment is maintained for all telescope pointing angles and temperature extremes. We
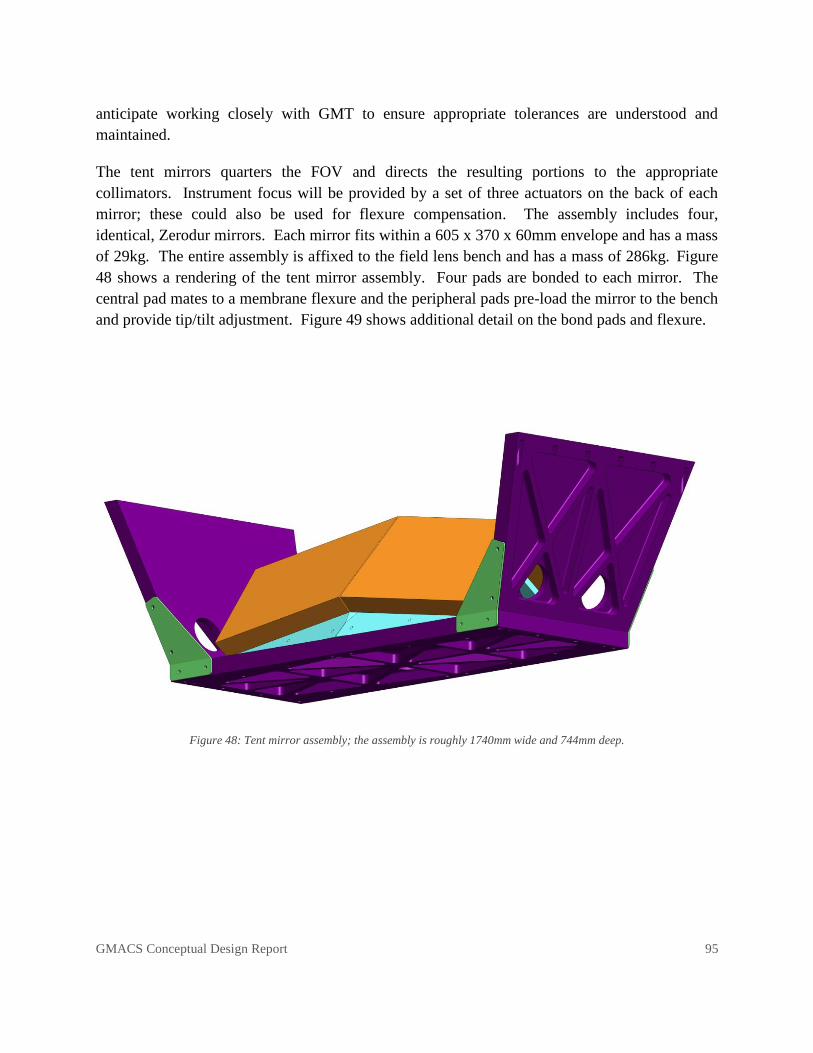
GMACS Conceptual Design Report 95
anticipate working closely with GMT to ensure appropriate tolerances are understood and
maintained.
The tent mirrors quarters the FOV and directs the resulting portions to the appropriate
collimators. Instrument focus will be provided by a set of three actuators on the back of each
mirror; these could also be used for flexure compensation. The assembly includes four,
identical, Zerodur mirrors. Each mirror fits within a 605 x 370 x 60mm envelope and has a mass
of 29kg. The entire assembly is affixed to the field lens bench and has a mass of 286kg. Figure
48 shows a rendering of the tent mirror assembly. Four pads are bonded to each mirror. The
central pad mates to a membrane flexure and the peripheral pads pre-load the mirror to the bench
and provide tip/tilt adjustment. Figure 49 shows additional detail on the bond pads and flexure.
Figure 48: Tent mirror assembly; the assembly is roughly 1740mm wide and 744mm deep.
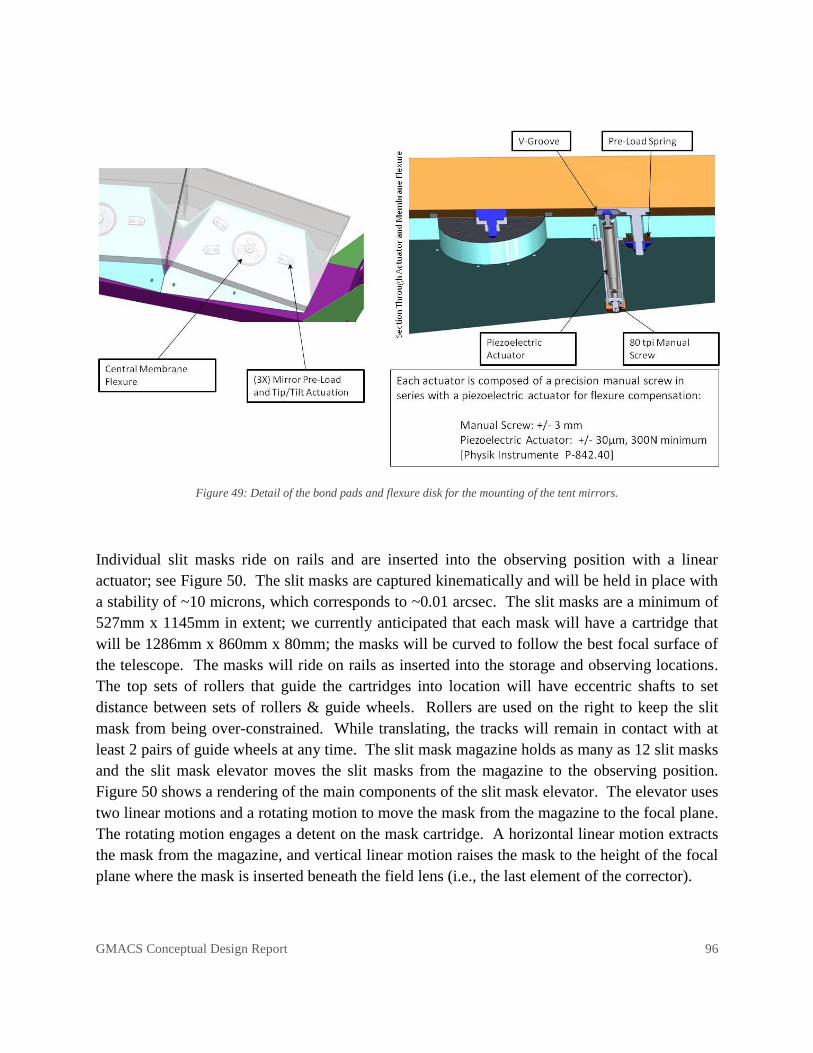
GMACS Conceptual Design Report 96
Figure 49: Detail of the bond pads and flexure disk for the mounting of the tent mirrors.
Individual slit masks ride on rails and are inserted into the observing position with a linear
actuator; see Figure 50. The slit masks are captured kinematically and will be held in place with
a stability of ~10 microns, which corresponds to ~0.01 arcsec. The slit masks are a minimum of
527mm x 1145mm in extent; we currently anticipated that each mask will have a cartridge that
will be 1286mm x 860mm x 80mm; the masks will be curved to follow the best focal surface of
the telescope. The masks will ride on rails as inserted into the storage and observing locations.
The top sets of rollers that guide the cartridges into location will have eccentric shafts to set
distance between sets of rollers & guide wheels. Rollers are used on the right to keep the slit
mask from being over-constrained. While translating, the tracks will remain in contact with at
least 2 pairs of guide wheels at any time. The slit mask magazine holds as many as 12 slit masks
and the slit mask elevator moves the slit masks from the magazine to the observing position.
Figure 50 shows a rendering of the main components of the slit mask elevator. The elevator uses
two linear motions and a rotating motion to move the mask from the magazine to the focal plane.
The rotating motion engages a detent on the mask cartridge. A horizontal linear motion extracts
the mask from the magazine, and vertical linear motion raises the mask to the height of the focal
plane where the mask is inserted beneath the field lens (i.e., the last element of the corrector).
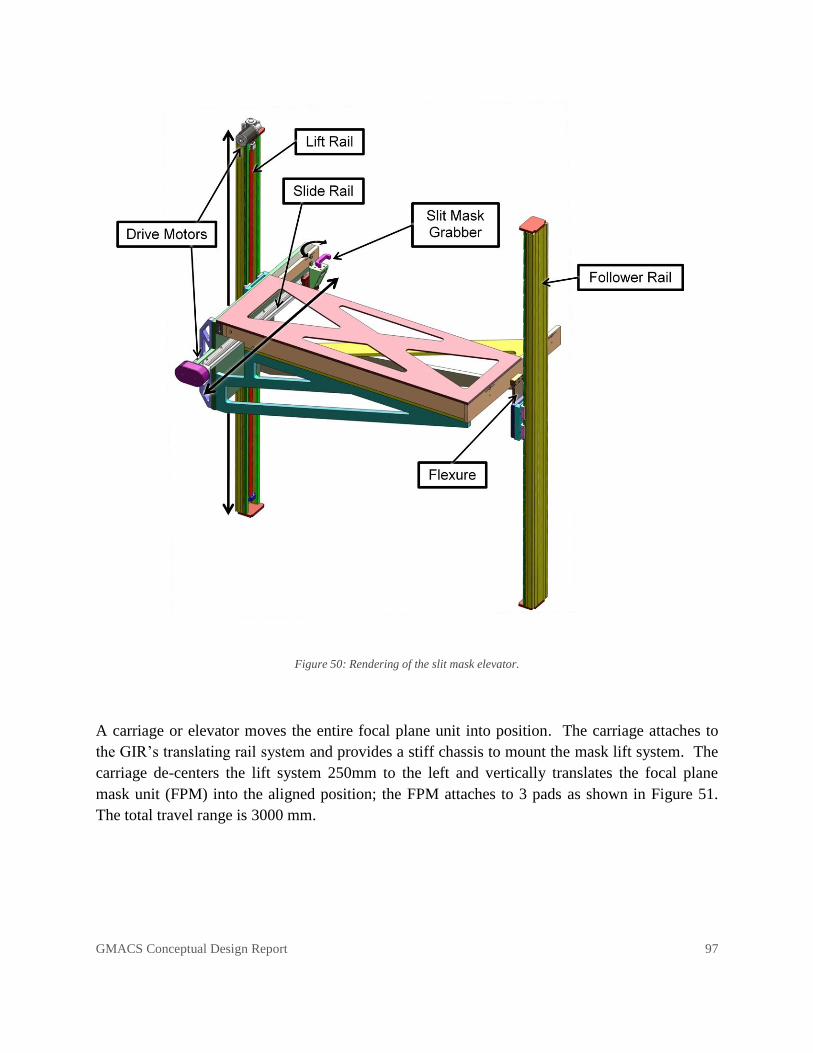
GMACS Conceptual Design Report 97
Figure 50: Rendering of the slit mask elevator.
A carriage or elevator moves the entire focal plane unit into position. The carriage attaches to
the GIR’s translating rail system and provides a stiff chassis to mount the mask lift system. The
carriage de-centers the lift system 250mm to the left and vertically translates the focal plane
mask unit (FPM) into the aligned position; the FPM attaches to 3 pads as shown in Figure 51.
The total travel range is 3000 mm.
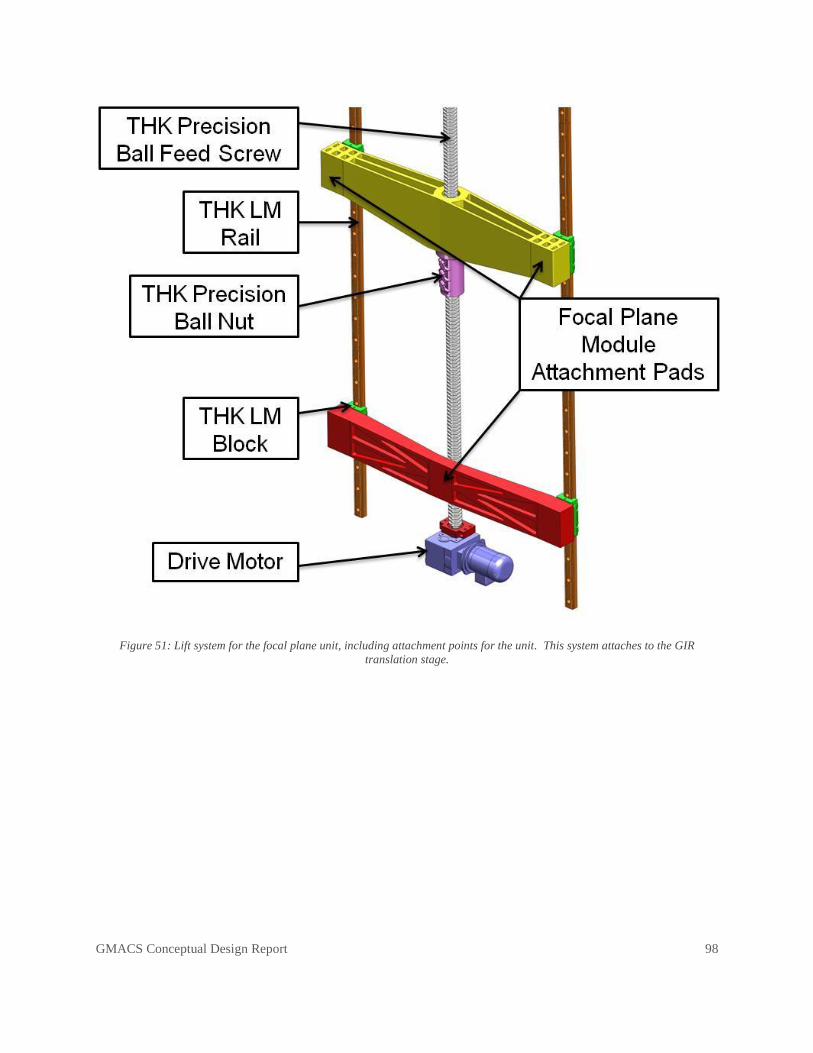
GMACS Conceptual Design Report 98
Figure 51: Lift system for the focal plane unit, including attachment points for the unit. This system attaches to the GIR
translation stage.
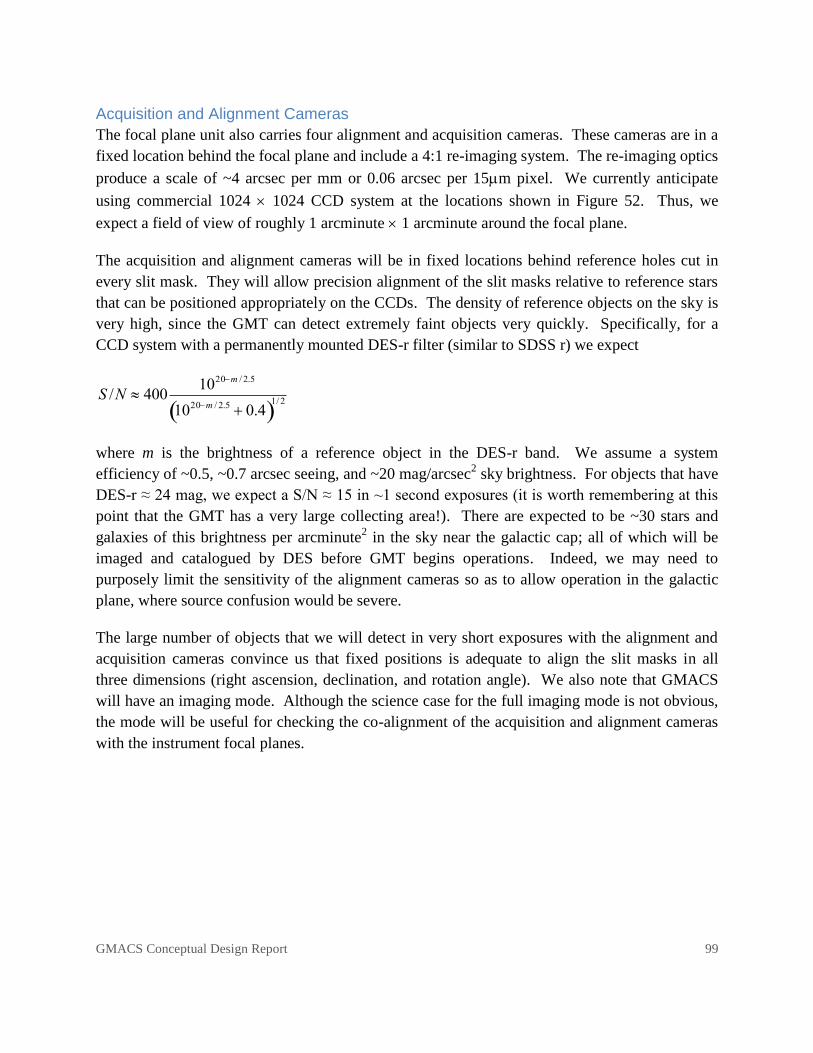
GMACS Conceptual Design Report 99
Acquisition and Alignment Cameras
The focal plane unit also carries four alignment and acquisition cameras. These cameras are in a
fixed location behind the focal plane and include a 4:1 re-imaging system. The re-imaging optics
produce a scale of ~4 arcsec per mm or 0.06 arcsec per 15m pixel. We currently anticipate
using commercial 1024 1024 CCD system at the locations shown in Figure 52. Thus, we
expect a field of view of roughly 1 arcminute 1 arcminute around the focal plane.
The acquisition and alignment cameras will be in fixed locations behind reference holes cut in
every slit mask. They will allow precision alignment of the slit masks relative to reference stars
that can be positioned appropriately on the CCDs. The density of reference objects on the sky is
very high, since the GMT can detect extremely faint objects very quickly. Specifically, for a
CCD system with a permanently mounted DES-r filter (similar to SDSS r) we expect
S /N 4001020m / 2.5
1020m / 2.5 0.4 1/ 2
where m is the brightness of a reference object in the DES-r band. We assume a system
efficiency of ~0.5, ~0.7 arcsec seeing, and ~20 mag/arcsec2 sky brightness. For objects that have
DES-r ≈ 24 mag, we expect a S/N ≈ 15 in ~1 second exposures (it is worth remembering at this
point that the GMT has a very large collecting area!). There are expected to be ~30 stars and
galaxies of this brightness per arcminute2 in the sky near the galactic cap; all of which will be
imaged and catalogued by DES before GMT begins operations. Indeed, we may need to
purposely limit the sensitivity of the alignment cameras so as to allow operation in the galactic
plane, where source confusion would be severe.
The large number of objects that we will detect in very short exposures with the alignment and
acquisition cameras convince us that fixed positions is adequate to align the slit masks in all
three dimensions (right ascension, declination, and rotation angle). We also note that GMACS
will have an imaging mode. Although the science case for the full imaging mode is not obvious,
the mode will be useful for checking the co-alignment of the acquisition and alignment cameras
with the instrument focal planes.
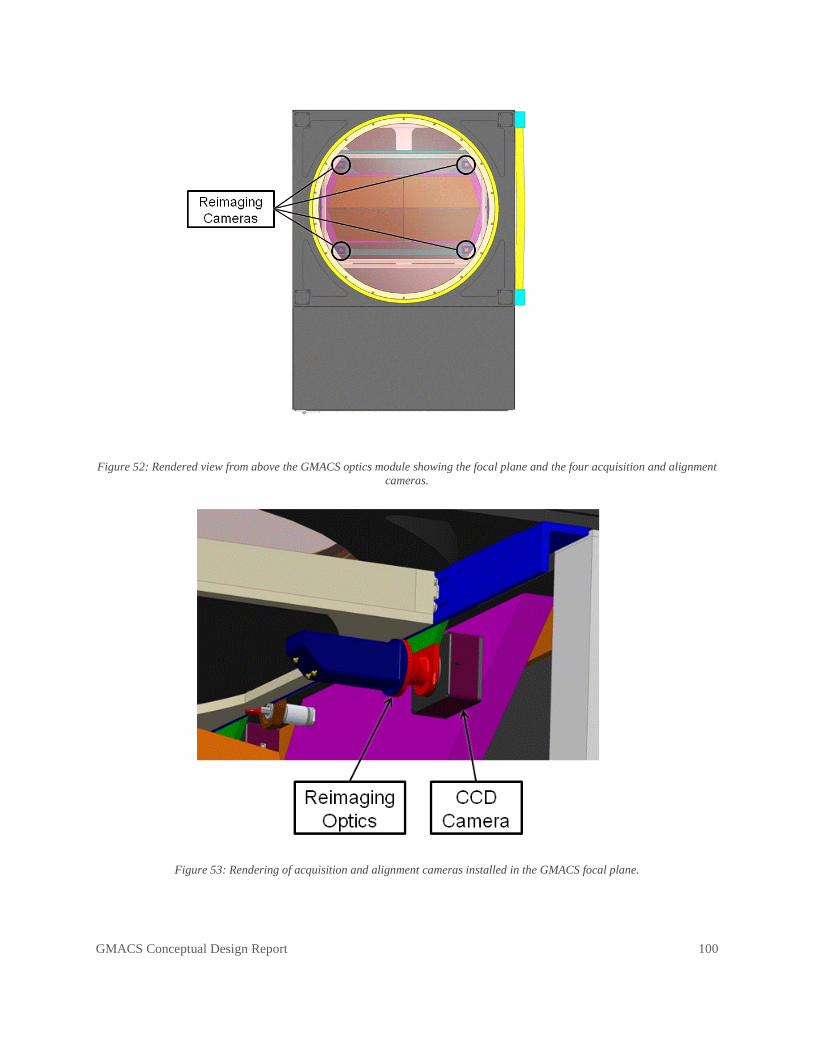
GMACS Conceptual Design Report 100
Figure 52: Rendered view from above the GMACS optics module showing the focal plane and the four acquisition and alignment
cameras.
Figure 53: Rendering of acquisition and alignment cameras installed in the GMACS focal plane.
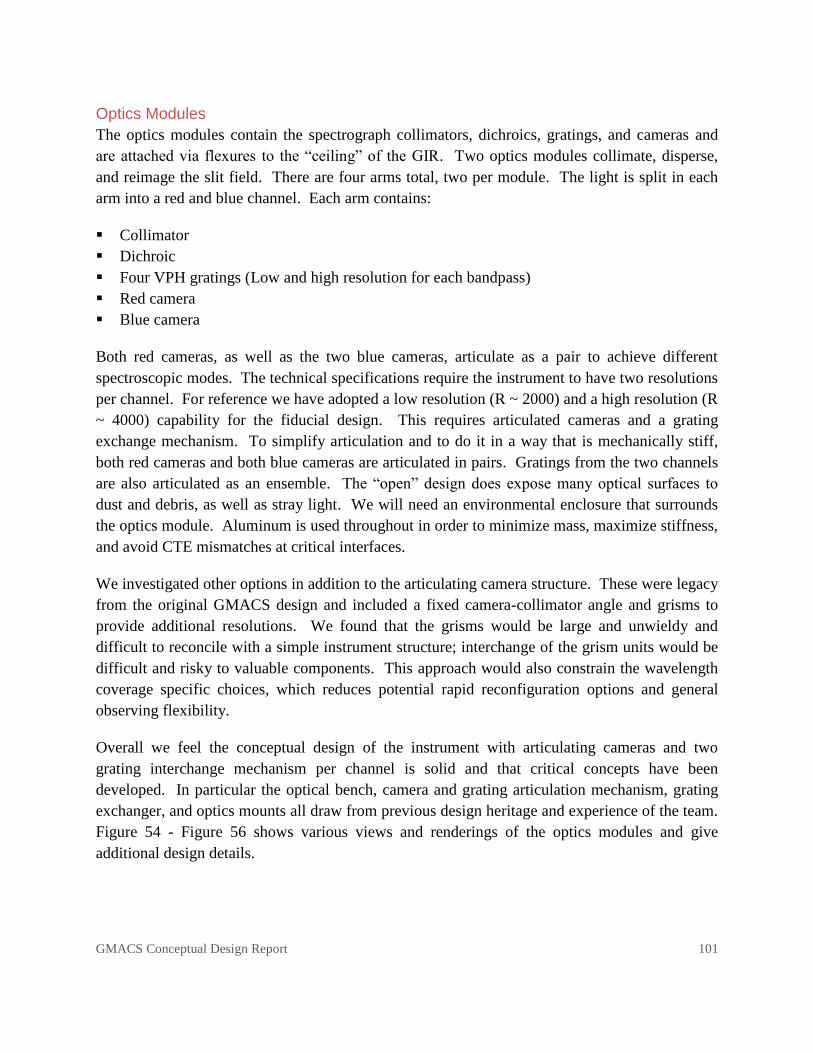
GMACS Conceptual Design Report 101
Optics Modules
The optics modules contain the spectrograph collimators, dichroics, gratings, and cameras and
are attached via flexures to the ―ceiling‖ of the GIR. Two optics modules collimate, disperse,
and reimage the slit field. There are four arms total, two per module. The light is split in each
arm into a red and blue channel. Each arm contains:
Collimator
Dichroic
Four VPH gratings (Low and high resolution for each bandpass)
Red camera
Blue camera
Both red cameras, as well as the two blue cameras, articulate as a pair to achieve different
spectroscopic modes. The technical specifications require the instrument to have two resolutions
per channel. For reference we have adopted a low resolution (R ~ 2000) and a high resolution (R
~ 4000) capability for the fiducial design. This requires articulated cameras and a grating
exchange mechanism. To simplify articulation and to do it in a way that is mechanically stiff,
both red cameras and both blue cameras are articulated in pairs. Gratings from the two channels
are also articulated as an ensemble. The ―open‖ design does expose many optical surfaces to
dust and debris, as well as stray light. We will need an environmental enclosure that surrounds
the optics module. Aluminum is used throughout in order to minimize mass, maximize stiffness,
and avoid CTE mismatches at critical interfaces.
We investigated other options in addition to the articulating camera structure. These were legacy
from the original GMACS design and included a fixed camera-collimator angle and grisms to
provide additional resolutions. We found that the grisms would be large and unwieldy and
difficult to reconcile with a simple instrument structure; interchange of the grism units would be
difficult and risky to valuable components. This approach would also constrain the wavelength
coverage specific choices, which reduces potential rapid reconfiguration options and general
observing flexibility.
Overall we feel the conceptual design of the instrument with articulating cameras and two
grating interchange mechanism per channel is solid and that critical concepts have been
developed. In particular the optical bench, camera and grating articulation mechanism, grating
exchanger, and optics mounts all draw from previous design heritage and experience of the team.
Figure 54 - Figure 56 shows various views and renderings of the optics modules and give
additional design details.
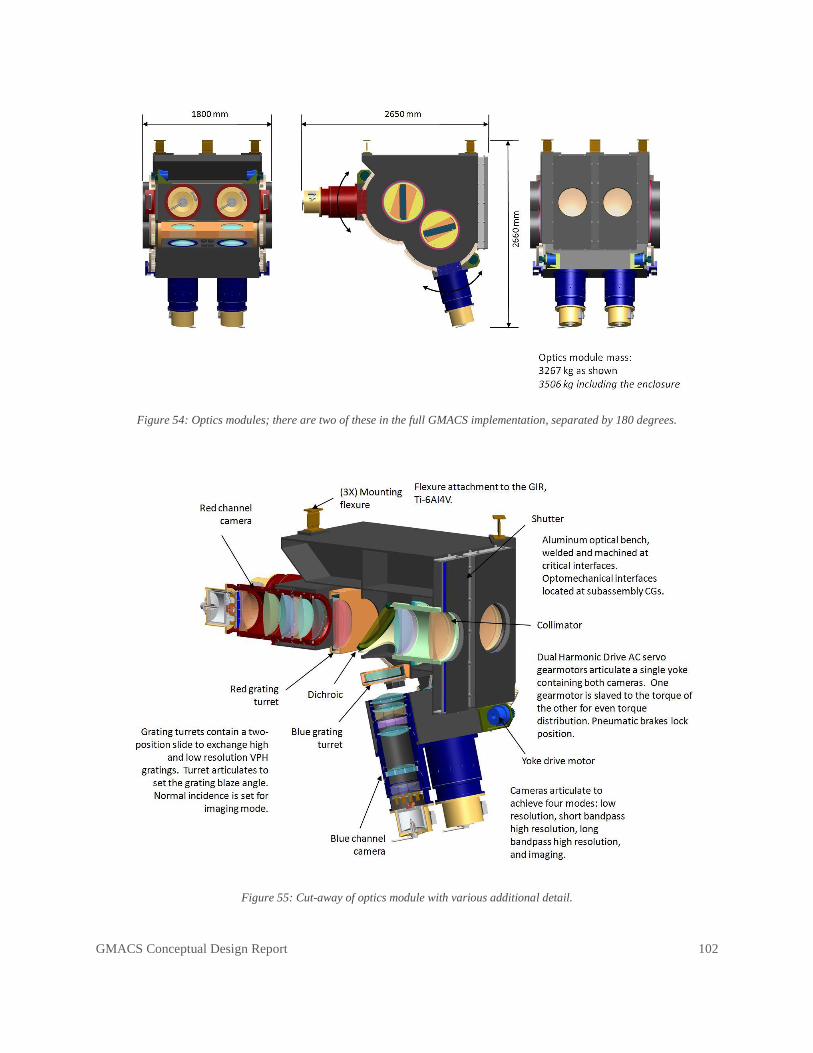
GMACS Conceptual Design Report 102
Figure 54: Optics modules; there are two of these in the full GMACS implementation, separated by 180 degrees.
Figure 55: Cut-away of optics module with various additional detail.
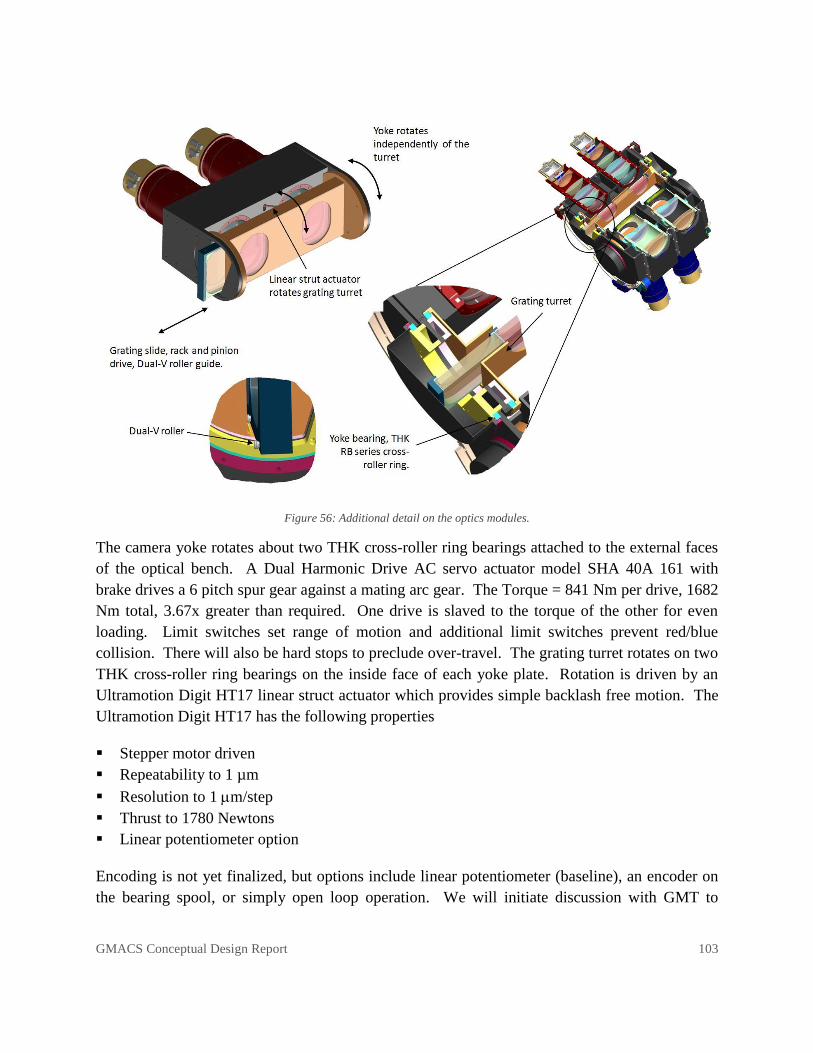
GMACS Conceptual Design Report 103
Figure 56: Additional detail on the optics modules.
The camera yoke rotates about two THK cross-roller ring bearings attached to the external faces
of the optical bench. A Dual Harmonic Drive AC servo actuator model SHA 40A 161 with
brake drives a 6 pitch spur gear against a mating arc gear. The Torque = 841 Nm per drive, 1682
Nm total, 3.67x greater than required. One drive is slaved to the torque of the other for even
loading. Limit switches set range of motion and additional limit switches prevent red/blue
collision. There will also be hard stops to preclude over-travel. The grating turret rotates on two
THK cross-roller ring bearings on the inside face of each yoke plate. Rotation is driven by an
Ultramotion Digit HT17 linear struct actuator which provides simple backlash free motion. The
Ultramotion Digit HT17 has the following properties
Stepper motor driven
Repeatability to 1 µm
Resolution to 1 m/step
Thrust to 1780 Newtons
Linear potentiometer option
Encoding is not yet finalized, but options include linear potentiometer (baseline), an encoder on
the bearing spool, or simply open loop operation. We will initiate discussion with GMT to

GMACS Conceptual Design Report 104
determine if the project has a preference model that will be consistent with other choices
amongst instrument teams.
The grating drive has similar design principles. For example, limit switches set range of motion
and hard stops preclude over-travel. Two sets of dual-V roller bearings ride on parallel tracks to
provide the requisite linear motion. We expect that the motive force will be a rack and pinion
drive, although details are not yet complete.
Figure 57 - Figure 59 show various details of the collimator housing and the red and blue camera
structures. The lens cell concepts shown are borrowed directly from the cells used in the
FourStar infrared camera and the SDSS spectrographs, which are known to work well. These are
incorporated into the optics modules.
Figure 57: Collimator cell and structure.

GMACS Conceptual Design Report 105
Figure 58: Blue camera showing lens arrangement, structure, and cryostat for detectors.
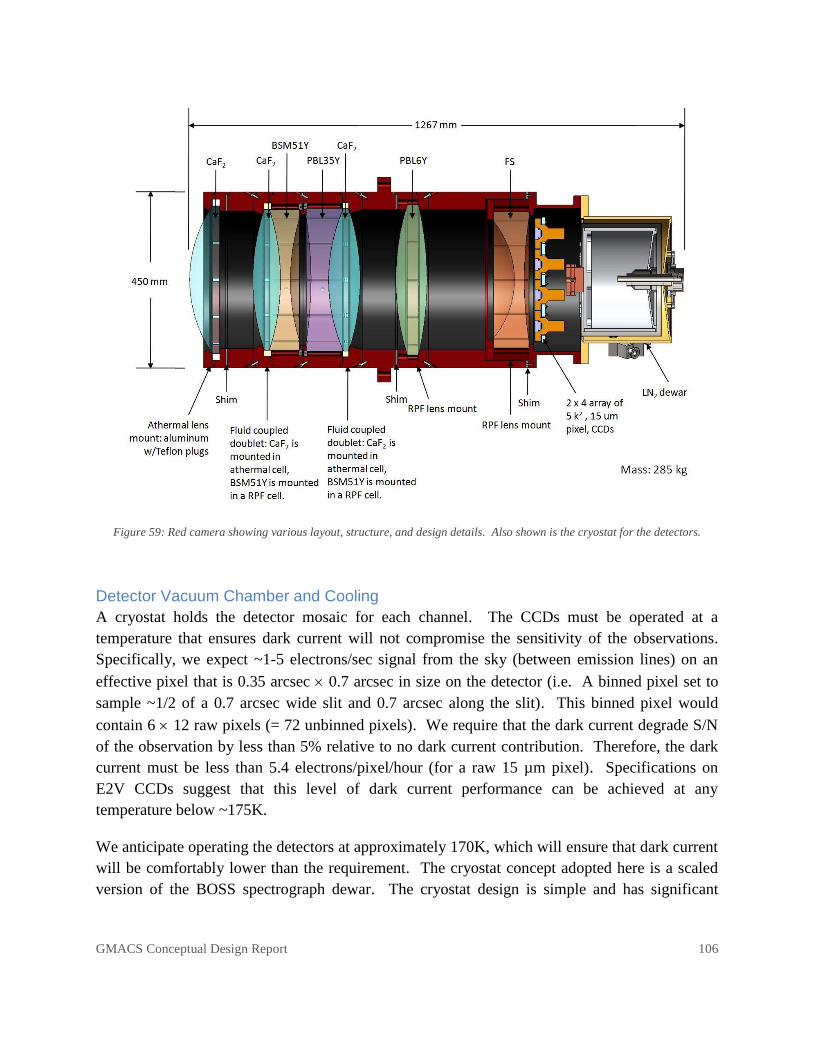
GMACS Conceptual Design Report 106
Figure 59: Red camera showing various layout, structure, and design details. Also shown is the cryostat for the detectors.
Detector Vacuum Chamber and Cooling
A cryostat holds the detector mosaic for each channel. The CCDs must be operated at a
temperature that ensures dark current will not compromise the sensitivity of the observations.
Specifically, we expect ~1-5 electrons/sec signal from the sky (between emission lines) on an
effective pixel that is 0.35 arcsec 0.7 arcsec in size on the detector (i.e. A binned pixel set to
sample ~1/2 of a 0.7 arcsec wide slit and 0.7 arcsec along the slit). This binned pixel would
contain 6 12 raw pixels (= 72 unbinned pixels). We require that the dark current degrade S/N
of the observation by less than 5% relative to no dark current contribution. Therefore, the dark
current must be less than 5.4 electrons/pixel/hour (for a raw 15 µm pixel). Specifications on
E2V CCDs suggest that this level of dark current performance can be achieved at any
temperature below ~175K.
We anticipate operating the detectors at approximately 170K, which will ensure that dark current
will be comfortably lower than the requirement. The cryostat concept adopted here is a scaled
version of the BOSS spectrograph dewar. The cryostat design is simple and has significant

GMACS Conceptual Design Report 107
heritage and has proven rugged and reliable in operation. Figure 60 shows some additional detail
of the cryostat.
Figure 60: Rendering of the cryostat.
A detailed calculation of the heat load on the dewars is given in Appendix 1.
We currently advocate using LN2 cooling. This is not a final decision and we are evaluating new
cryo-cooler units that can also be made to work. Experience with some cryo-coolers (cryo-
tigers, for example) has not been completely positive. With a MTBF of typically ~104 hours and
given that we expect to need 2 units per focal plane, we consider the ~1 failure per month
excessively unreliable and suspect replacement could cause significant maintenance burden on
GMT staff. However, we are aware of alternate potential units from SunPower with a
demonstrated MTBF of ~100,000 hours, which would significantly reduce the maintenance and

GMACS Conceptual Design Report 108
replacement burden. We will continue to evaluate these and similar units as replacements for
LN2 cooling. Note that a drawback to the use of cryo-coolers is that they generate substantial
waster heat. The SunPower units, for example, would each dump 265W of waste heat into the
GMT cooling loop; for an additional 4kW of required heat removal (roughly equal to the amount
generated by the entire rest of the instrument).
We estimate that the hold time of a cryogen tank in the cryostat design shown in Figure 60 is ~6
hours given the ~25 W heat load and the tank volume of 3.5 liters; see Appendix 1 for a detailed
calculation of the heat load. Our team has successfully used LN2 cooling with auto-feed refill on
many instruments and feel this approach is robust and simple. We advocate that an auto-feed
system re-fill the Dewar to keep the cryogen level constant. Our team has considerable
experience with auto-feed systems (DECam, VIRUS, SDSS, etc.) and we consider them a
reliable and robust way of providing the cooling needed for the detector systems. We will
ultimately rely on GMTO guidance in determining a final choice for the cooling of the GMACS
detectors.
GMACS Weight Summary
The total weight of GMACS can be estimated from the SolidWorks models of the instrument.
There are three principle sub-structures:
Optics Modules: ~3506 kg
Focal Plane Unit: ~2909 kg
Door Carriage: ~2934 kg
There are two Optics Modules; the total weight of GMACS will be ~12855 kg.
GMACS Conceptual Design Report 109
GMACS Flexure Study
Finite element analysis was conducted on the conceptual GMACS instrument to predict the
flexure of the device under the influence of gravity. Several telescope orientations were
considered.
Motivation
Gravity loading affects the relative positions of the optical elements of the instrument. Changes
in these relative positions as the telescope moves through its complete range of motion will
affect instrument performance. Analysis was conducted to quantify these changes as input into
an optical sensitivity study. Ultimately, the optical study will provide guidance on the nature of
the required flexure compensation mechanism.
Approach
The GMACS instrument consists of a focal plane assembly and two, structurally identical, optics
modules. The focal plane assembly includes the field lens, tent mirror assembly, and the slit
mask exchanger and magazine. The optics modules each include the red and blue cameras,
gratings, and the collimators.
Two separate finite element (FE) models were developed. The first model being of the focal
plane assembly mounted to its transport wall. The second model consists of one of the optics
modules up to and including the flexures that mount it to the telescope GIR. In practice, the
focal plane assembly and optics modules would be coupled through the GIR. For the purposes
of this conceptual study, the GMACS assemblies are assumed to be mounted to an entirely rigid
structure. A reasonable estimate of global (GMACS + GIR) deflections may be made by
superimposing the predicted GMACS deflections on top of those predicted for the telescope
GIR. The GMACS elements considered in the FEA are circled in Figure 61. The same figure
also shows the coordinate system used both in the solid model and in the analysis.
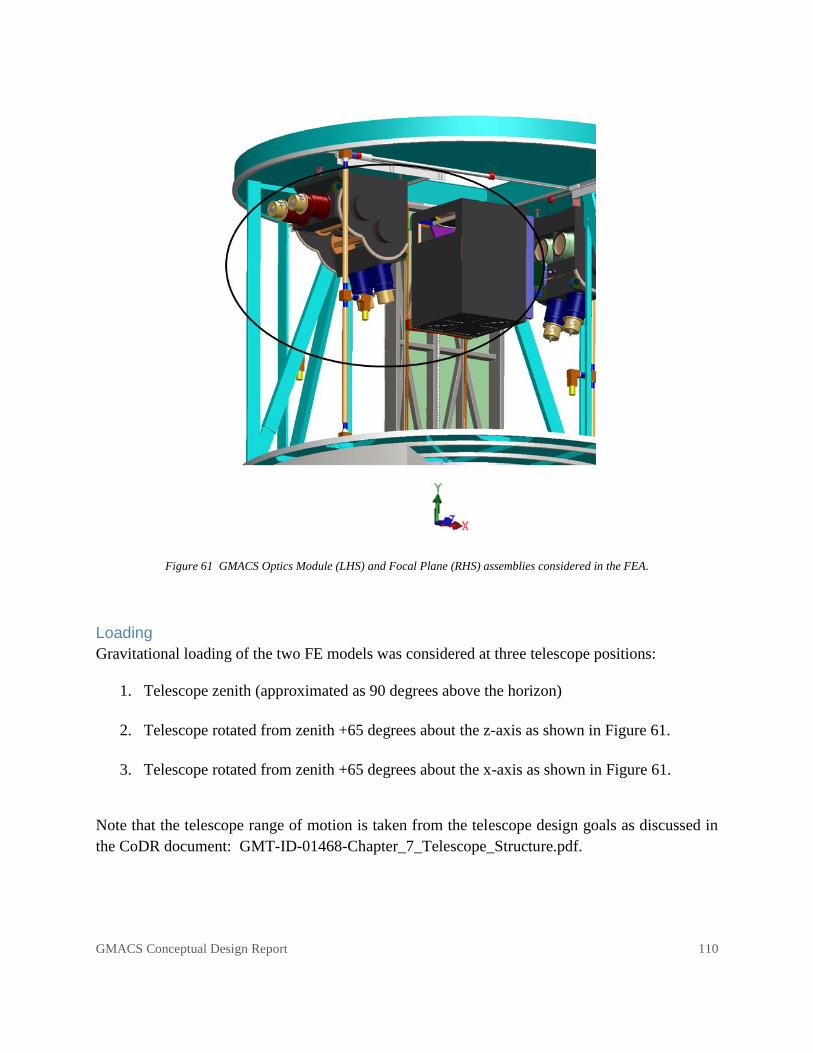
GMACS Conceptual Design Report 110
Figure 61 GMACS Optics Module (LHS) and Focal Plane (RHS) assemblies considered in the FEA.
Loading
Gravitational loading of the two FE models was considered at three telescope positions:
1. Telescope zenith (approximated as 90 degrees above the horizon)
2. Telescope rotated from zenith +65 degrees about the z-axis as shown in Figure 61.
3. Telescope rotated from zenith +65 degrees about the x-axis as shown in Figure 61.
Note that the telescope range of motion is taken from the telescope design goals as discussed in
the CoDR document: GMT-ID-01468-Chapter_7_Telescope_Structure.pdf.
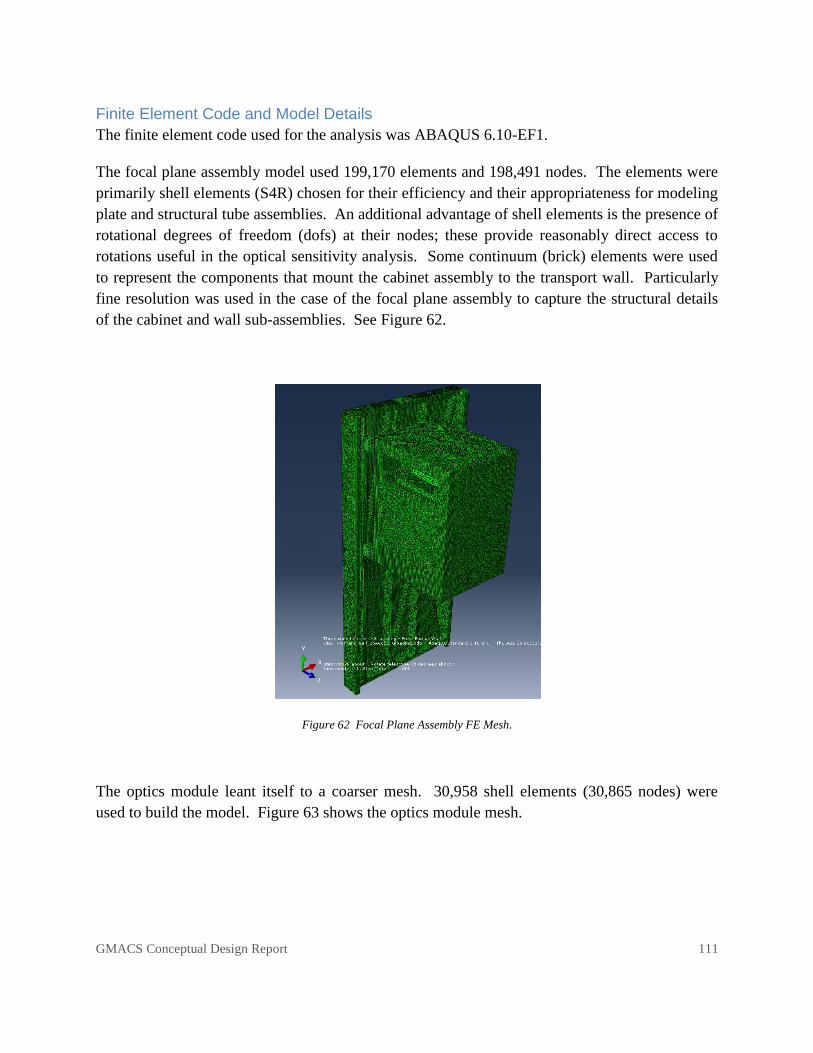
GMACS Conceptual Design Report 111
Finite Element Code and Model Details
The finite element code used for the analysis was ABAQUS 6.10-EF1.
The focal plane assembly model used 199,170 elements and 198,491 nodes. The elements were
primarily shell elements (S4R) chosen for their efficiency and their appropriateness for modeling
plate and structural tube assemblies. An additional advantage of shell elements is the presence of
rotational degrees of freedom (dofs) at their nodes; these provide reasonably direct access to
rotations useful in the optical sensitivity analysis. Some continuum (brick) elements were used
to represent the components that mount the cabinet assembly to the transport wall. Particularly
fine resolution was used in the case of the focal plane assembly to capture the structural details
of the cabinet and wall sub-assemblies. See Figure 62.
Figure 62 Focal Plane Assembly FE Mesh.
The optics module leant itself to a coarser mesh. 30,958 shell elements (30,865 nodes) were
used to build the model. Figure 63 shows the optics module mesh.
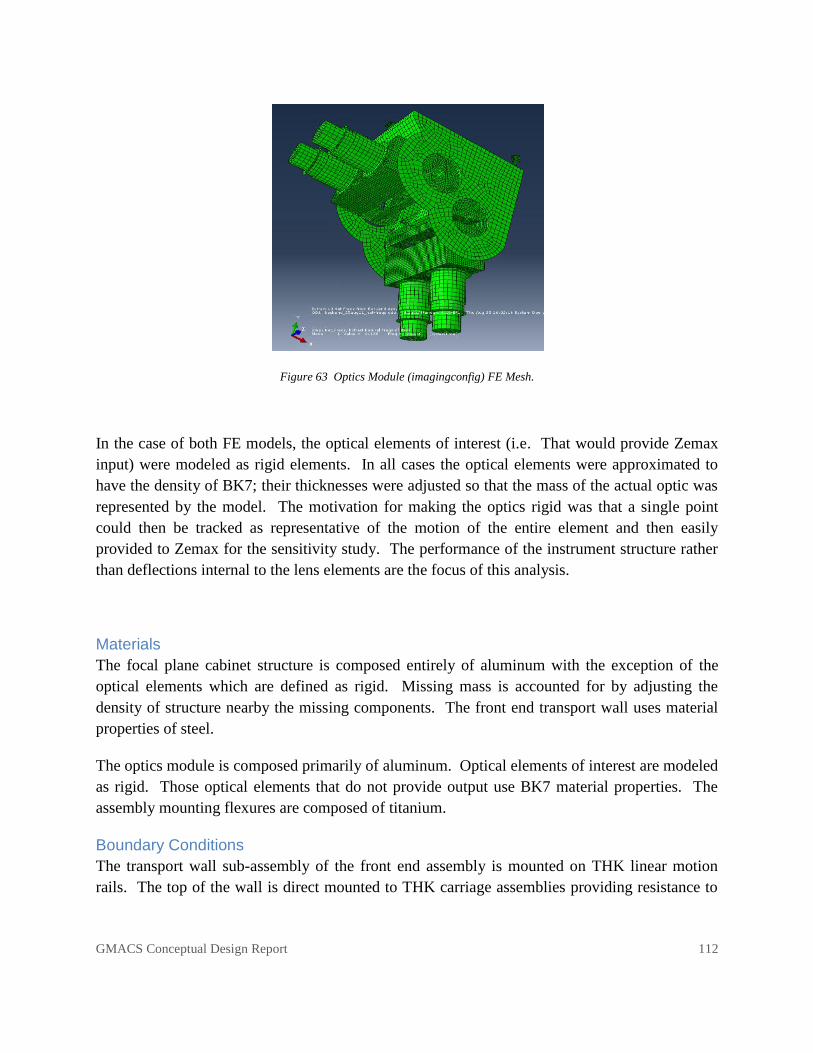
GMACS Conceptual Design Report 112
Figure 63 Optics Module (imagingconfig) FE Mesh.
In the case of both FE models, the optical elements of interest (i.e. That would provide Zemax
input) were modeled as rigid elements. In all cases the optical elements were approximated to
have the density of BK7; their thicknesses were adjusted so that the mass of the actual optic was
represented by the model. The motivation for making the optics rigid was that a single point
could then be tracked as representative of the motion of the entire element and then easily
provided to Zemax for the sensitivity study. The performance of the instrument structure rather
than deflections internal to the lens elements are the focus of this analysis.
Materials
The focal plane cabinet structure is composed entirely of aluminum with the exception of the
optical elements which are defined as rigid. Missing mass is accounted for by adjusting the
density of structure nearby the missing components. The front end transport wall uses material
properties of steel.
The optics module is composed primarily of aluminum. Optical elements of interest are modeled
as rigid. Those optical elements that do not provide output use BK7 material properties. The
assembly mounting flexures are composed of titanium.
Boundary Conditions
The transport wall sub-assembly of the front end assembly is mounted on THK linear motion
rails. The top of the wall is direct mounted to THK carriage assemblies providing resistance to

GMACS Conceptual Design Report 113
rotation. The bottom of the wall is flexure mounted to similar carriages. The boundary
conditions (BCs) shown in Figure 64 were chosen as a good representation of the assembly
during service.
Figure 64 Boundary Conditions on Focal Plane Assembly.
The optics module assembly is mounted on titanium flexures directly to the instrument GIR.
Boundary conditions in this case fully constrain all six dofs on the flexure mounting surfaces.
See Figure 65.
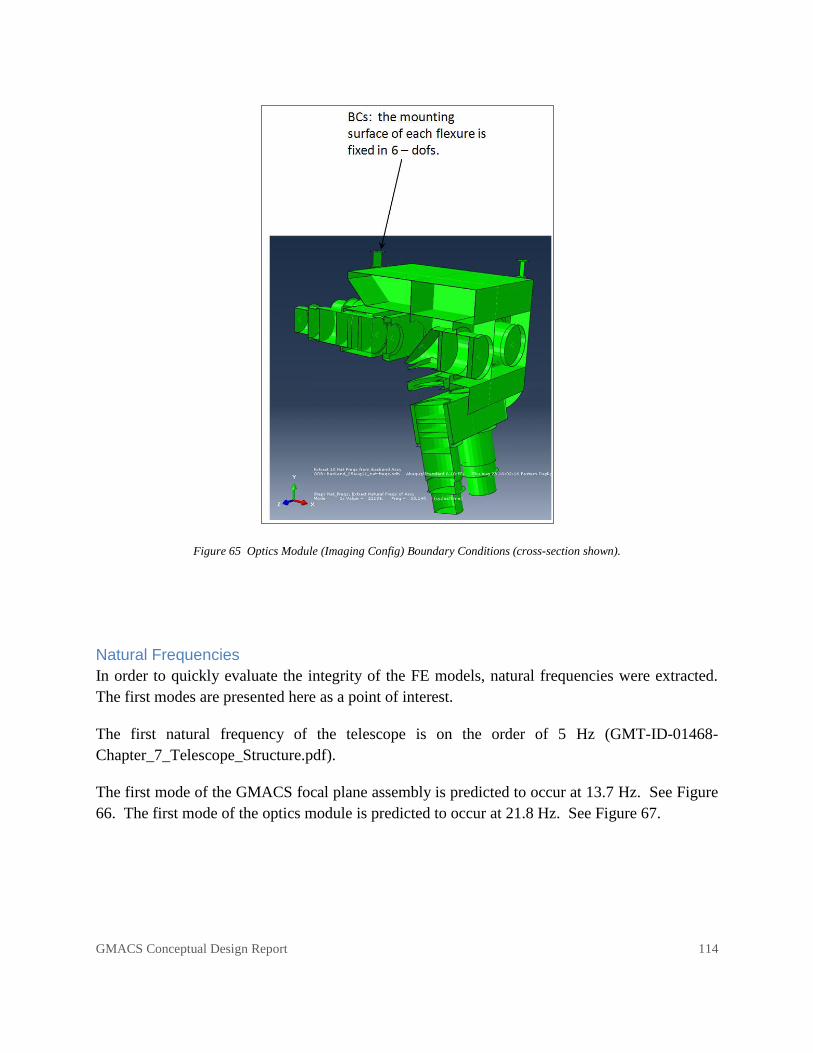
GMACS Conceptual Design Report 114
Figure 65 Optics Module (Imaging Config) Boundary Conditions (cross-section shown).
Natural Frequencies
In order to quickly evaluate the integrity of the FE models, natural frequencies were extracted.
The first modes are presented here as a point of interest.
The first natural frequency of the telescope is on the order of 5 Hz (GMT-ID-01468-
Chapter_7_Telescope_Structure.pdf).
The first mode of the GMACS focal plane assembly is predicted to occur at 13.7 Hz. See Figure
66. The first mode of the optics module is predicted to occur at 21.8 Hz. See Figure 67.

GMACS Conceptual Design Report 115
Figure 66 Focal Plane Assembly 1st Mode - 13.7Hz.

GMACS Conceptual Design Report 116
Figure 67 Optics Module (Low-Res Config) 1st Mode - 21.8 Hz.
Flexure Output Tracking Points
Tracking points were identified on both FEA models to provide input to the optical sensitivity
analysis. Deflections and rotations were monitored for the three load cases at each of these
points and retained as tabular data for Zemax. The output points for the focal plane assembly are
identified in Figure 68; the optics module points are shown in Figure 69.
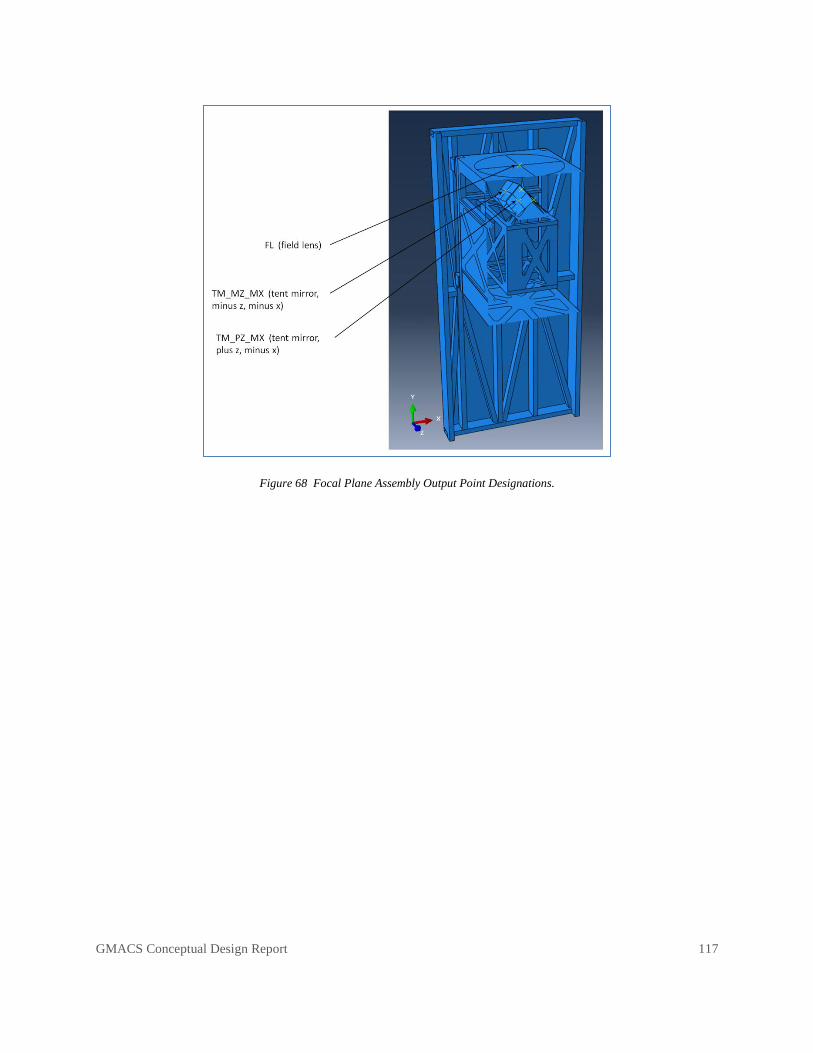
GMACS Conceptual Design Report 117
Figure 68 Focal Plane Assembly Output Point Designations.
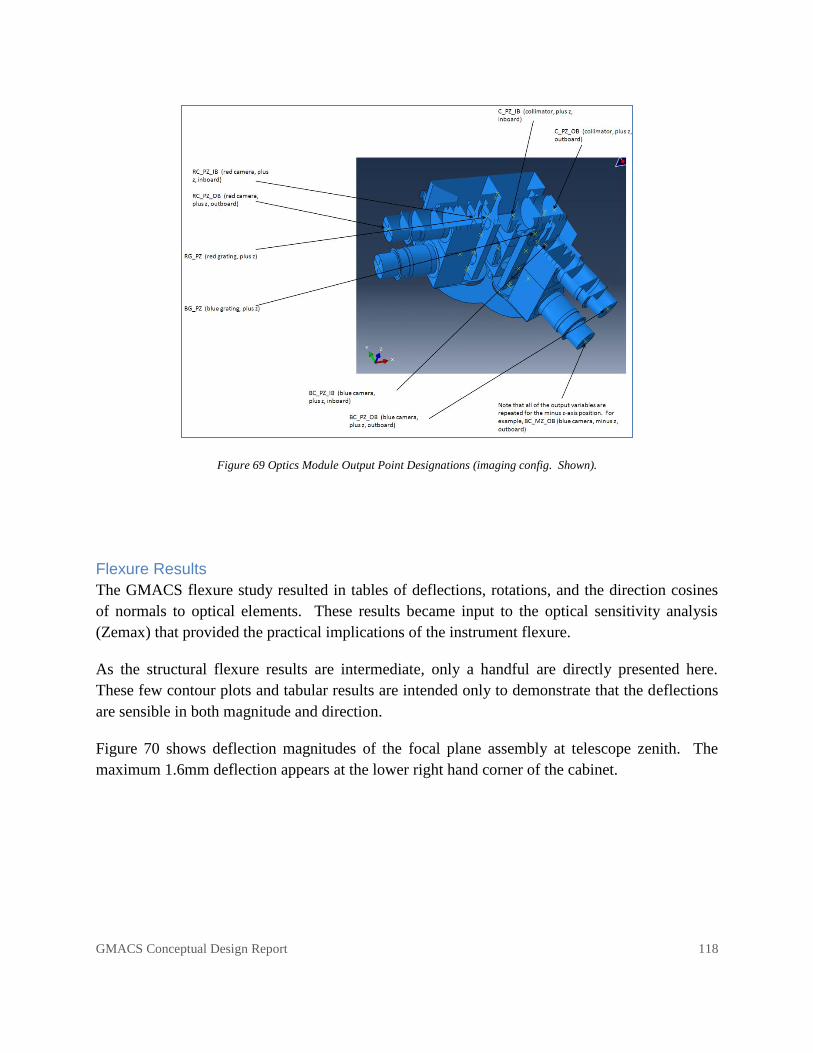
GMACS Conceptual Design Report 118
Figure 69 Optics Module Output Point Designations (imaging config. Shown).
Flexure Results
The GMACS flexure study resulted in tables of deflections, rotations, and the direction cosines
of normals to optical elements. These results became input to the optical sensitivity analysis
(Zemax) that provided the practical implications of the instrument flexure.
As the structural flexure results are intermediate, only a handful are directly presented here.
These few contour plots and tabular results are intended only to demonstrate that the deflections
are sensible in both magnitude and direction.
Figure 70 shows deflection magnitudes of the focal plane assembly at telescope zenith. The
maximum 1.6mm deflection appears at the lower right hand corner of the cabinet.

GMACS Conceptual Design Report 119
Figure 70 Focal Plane Assembly - Deflection Magnitude at Telescope Zenith.
Figure 71 shows deflection magnitude contours of the optics module assembly after the telescope
has been rotated +65 degrees about the x axis. A maximum 0.7 mm deflection is seen along the
outer edges of the plate structure. A deformation scale of 500 is used to highlight the form of the
deflection.
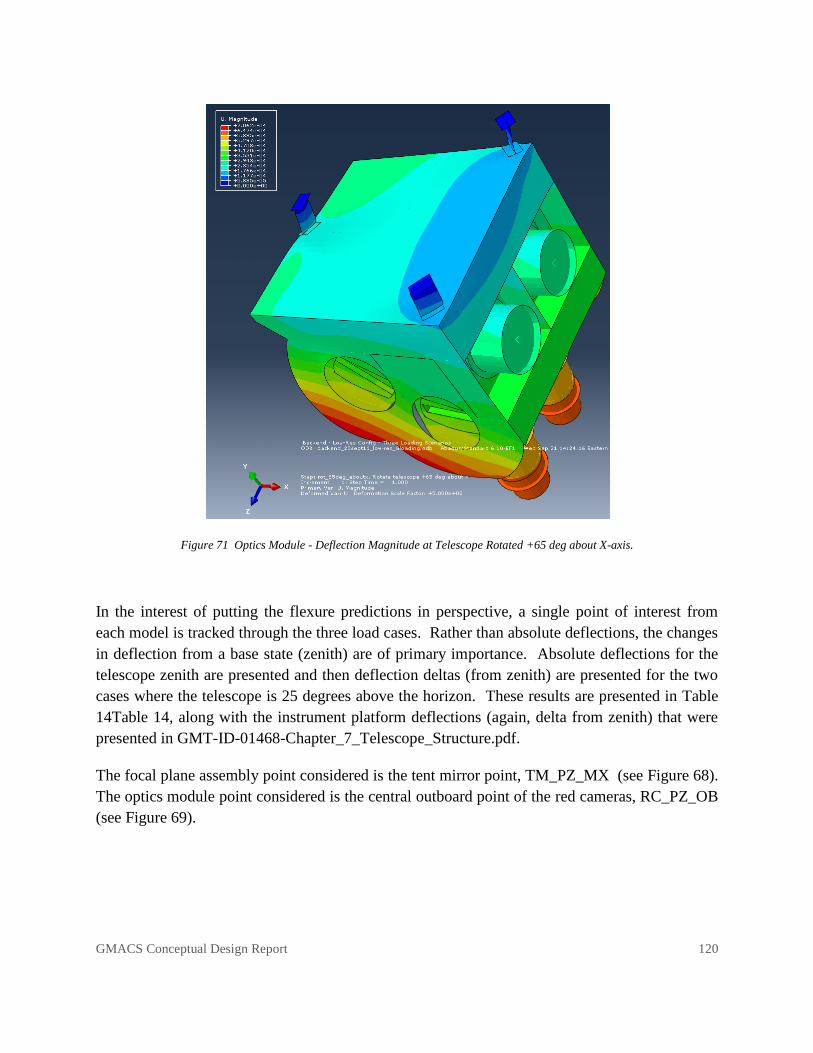
GMACS Conceptual Design Report 120
Figure 71 Optics Module - Deflection Magnitude at Telescope Rotated +65 deg about X-axis.
In the interest of putting the flexure predictions in perspective, a single point of interest from
each model is tracked through the three load cases. Rather than absolute deflections, the changes
in deflection from a base state (zenith) are of primary importance. Absolute deflections for the
telescope zenith are presented and then deflection deltas (from zenith) are presented for the two
cases where the telescope is 25 degrees above the horizon. These results are presented in Table
14Table 14, along with the instrument platform deflections (again, delta from zenith) that were
presented in GMT-ID-01468-Chapter_7_Telescope_Structure.pdf.
The focal plane assembly point considered is the tent mirror point, TM_PZ_MX (see Figure 68).
The optics module point considered is the central outboard point of the red cameras, RC_PZ_OB
(see Figure 69).
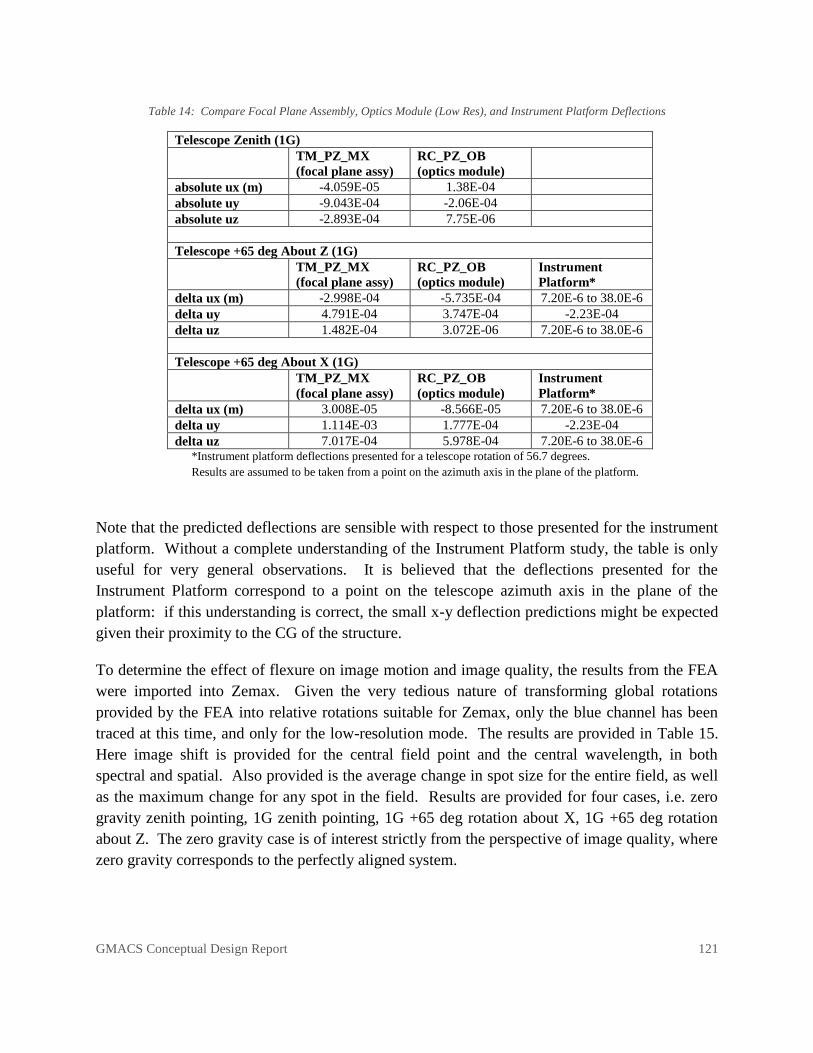
GMACS Conceptual Design Report 121
Table 14: Compare Focal Plane Assembly, Optics Module (Low Res), and Instrument Platform Deflections
Telescope Zenith (1G)
TM_PZ_MX
(focal plane assy)
RC_PZ_OB
(optics module)
absolute ux (m) -4.059E-05 1.38E-04
absolute uy -9.043E-04 -2.06E-04
absolute uz -2.893E-04 7.75E-06
Telescope +65 deg About Z (1G)
TM_PZ_MX
(focal plane assy)
RC_PZ_OB
(optics module)
Instrument
Platform*
delta ux (m) -2.998E-04 -5.735E-04 7.20E-6 to 38.0E-6
delta uy 4.791E-04 3.747E-04 -2.23E-04
delta uz 1.482E-04 3.072E-06 7.20E-6 to 38.0E-6
Telescope +65 deg About X (1G)
TM_PZ_MX
(focal plane assy)
RC_PZ_OB
(optics module)
Instrument
Platform*
delta ux (m) 3.008E-05 -8.566E-05 7.20E-6 to 38.0E-6
delta uy 1.114E-03 1.777E-04 -2.23E-04
delta uz 7.017E-04 5.978E-04 7.20E-6 to 38.0E-6 *Instrument platform deflections presented for a telescope rotation of 56.7 degrees.
Results are assumed to be taken from a point on the azimuth axis in the plane of the platform.
Note that the predicted deflections are sensible with respect to those presented for the instrument
platform. Without a complete understanding of the Instrument Platform study, the table is only
useful for very general observations. It is believed that the deflections presented for the
Instrument Platform correspond to a point on the telescope azimuth axis in the plane of the
platform: if this understanding is correct, the small x-y deflection predictions might be expected
given their proximity to the CG of the structure.
To determine the effect of flexure on image motion and image quality, the results from the FEA
were imported into Zemax. Given the very tedious nature of transforming global rotations
provided by the FEA into relative rotations suitable for Zemax, only the blue channel has been
traced at this time, and only for the low-resolution mode. The results are provided in Table 15.
Here image shift is provided for the central field point and the central wavelength, in both
spectral and spatial. Also provided is the average change in spot size for the entire field, as well
as the maximum change for any spot in the field. Results are provided for four cases, i.e. zero
gravity zenith pointing, 1G zenith pointing, 1G +65 deg rotation about X, 1G +65 deg rotation
about Z. The zero gravity case is of interest strictly from the perspective of image quality, where
zero gravity corresponds to the perfectly aligned system.
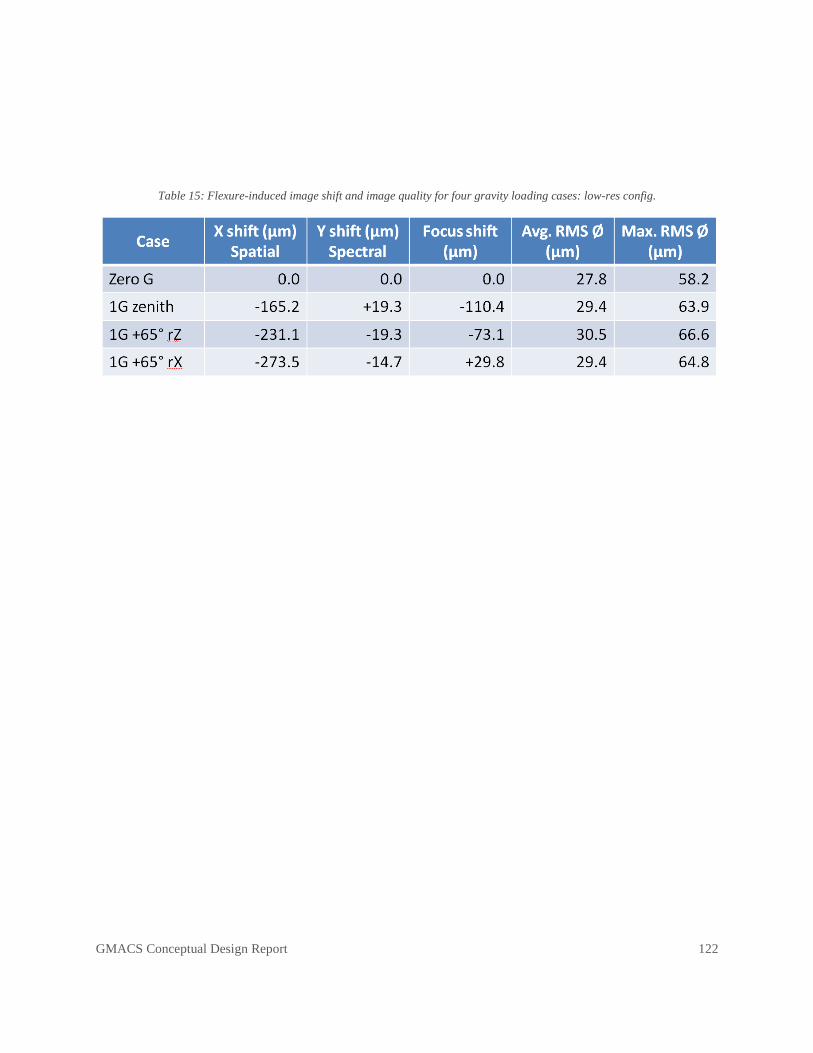
GMACS Conceptual Design Report 122
Table 15: Flexure-induced image shift and image quality for four gravity loading cases: low-res config.

GMACS Conceptual Design Report 123
Flexure Compensation
Flexure-induced image motion is a common issue for spectrographs mounted at the Cassegrain
focus. As the telescope tracks the sky, the gravity vector changes relative to the instrument.
Hence, gravity-induced deflections within the spectrograph structure change over time, and alter
the position and orientation of the optical elements housed within the structure. These subtle
shifts of the optics translate into degradation and motion of the focused images at the camera
detector focal plane, which in turn reduces resolution. This problem is particularly acute for
large instruments. And for GMACS, the problem is complicated further by the fact that the
instrument is comprised by three discrete optomechanical assemblies, i.e. The focal plane
assembly, and two separate optics modules.
Flexure compensation schemes built to date fall into one of three categories: 1) passive
compensation, 2) open-loop active compensation, and 3) closed-loop active compensation.
Passive schemes such as that described by Hileman, et al. (2004) for GNIRS rely on adjustable
cantilevered weights to drive tip and tilt of an optic within the path to compensate for flexure of
the entire system. Such a scheme requires accurate knowledge of the expected flexure to ensure
the appropriate adjustment degrees of freedom are provided, and tuning once implemented.
The Open-loop active compensation approach, such as that described by Kibrick et al. (2000) for
the Echellette Spectrograph and Imager (ESI) on Keck II, relies on mathematical predictions or
look-up tables to provide corrective adjustment of an optic within the optical train to correct for
flexure. On-sky measurements of flexure are used to create the look-up tables, or in the case of
analytical prediction, determine the defining constants. On-sky, the ESI flexure control system
stabilizes the spectra images to approximately 0.1 pixels (15 um pixels), though zero point
checks are required nightly.
In the case of closed-loop active compensation, a feedback signal is used to control the motion of
a compensating optic. An example of such a closed-loop system is provided by Marshall et al.
(2003) for the Multi-Object Double Spectrograph (MODS) on the Large Binocular Telescope
(LBT). Here an infrared laser is traced from the telescope focal plane through the entire optical
path to a quadrant detector adjacent to the camera detector. Feedback from the quadrant detector
is used to adjust the tip and tilt of the collimator so as to stabilize the position of the spectra on
the science detector. Another example of a closed-loop active system is that described by
Kibrick et al. (2004) for the Deep Imaging Multi-Object Spectrograph (DEIMOS) on Keck II.
Here fibers are used as light sources to generate a set of artificial objects in the telescope focal
plane. Light from these objects is traced through the entire optical path of the instrument and
GMACS Conceptual Design Report 124
imaged onto two small (600 row x 1200 column) CCD detectors adjacent to the science CCD
mosaic. A CuAr light source is used to illuminate the fibers. The CuAr lamp provides a rich
spectrum with broad wavelength coverage. Motion of the fiber source images are measured
during an exposure and those measurements are used as feedback to a tilt mirror and the dewar
translation stage, which combined, are used to adjust the location of the spectra on the mosaic.
Both the MODS and the DEIMOS flexure control systems provide of order 0.1 pixel flexure
stability during an observation.
As of this writing the flexure compensation scheme for GMACS is still being evaluated. The
current thinking is to have a hybrid system consisting of an open-loop system and a closed-loop
system. The open-loop system would use actuation of the tent mirrors to provide tip/tilt/flexure
correction of the focal plane assembly relative to the optics modules. A mathematical model or
lookup table would be generated from calibration data taken on-sky at discrete elevation and
rotator angles of the telescope. These data would be used to determine the tip and tilt of each
tent mirror as a function of telescope pointing. For the closed-loop system we would adopt a
system very similar to that used by DEIMOS whereby four fiber sources would project artificial
objects through windows in the slit mask and image onto four small CCDs located along the top
and bottom (spatial direction) edge of the science mosaic. The sources along a given edge would
be separated in the spectral direction so as to provide a broad sampling of image motion across
the mosaic (a source at roughly each corner of the mosaic). Each fiber would be fed by a CuAr
lamp that is filtered to provide only a minimum number of spectral lines (to mitigate stray light).
The flexure correction CCDs would be parfocal with the science mosaic and the entire ensemble
of detectors would be mounted on a hexapod inside the camera dewar. Feedback from centroids
of the fiber sources would be used to determine image motion in X (row), Y (column), and
rotation. Furthermore, we believe that we could measure focus of the mosaic if each fiber source
were actually five fibers, each slightly offset from the other, such that the middle fiber is parfocal
with the telescope focus, and of the remaining two, one pair is in front of focus and the other pair
behind focus. Thus each fiber bundle produces five PSFs for each spectral line provided by the
CuAr lamp. Adjusting the science mosaic in piston such that the center PSF is minimized
achieves focus. We envision that this closed loop control would provide updates several times
per minute.
GMACS Conceptual Design Report 125
Software Design
GMACS software will control the instrument and interface to the user, the telescope, and any
other external systems. In this section we describe the conceptual design of the GMACS
software architecture, as well as the data reduction pipeline and exposure time calculator.
Software philosophy
Once selected to proceed with the preliminary design study of GMACS we will hire necessary
software professionals and ramp up the software effort. At this point we have made no final
software (or associated hardware) choices. We plan to conform to GMT standards once they are
decided upon for motors/motor controllers, detector systems/acquisition cameras, detector
readout electronics, GUI morphologies/color schemes, programming languages, and operating
systems.
The GMACS software package is comprised of an Observation Control System (OCS), Detector
Control System (OCS), and an Instrument Control System (ICS). The conceptual design of these
systems is described in detail in the following sections. Parts of the GMACS software
architecture closely follow that of the Dark Energy Camera.
If unbinned, the GMACS science CCDs can produce 3.2 Gb/exposure, or up to ~1 Tb each night.
Although we plan to generally operate GMACS in a 6x6 binned (0.3‖ pixels), producing only 90
Mb/exposure and ~few Gb/night, we have designed the GMACS image handling software to be
able to handle the full unbinned GMACS detector array. The conceptual design of the GMACS
image handling software architecture is described below.
During the GMACS build phase we will develop prototype hardware and software systems to
test and control prototype instrument assemblies. These prototype systems will form the
foundation of the GMACS software. As the instrument design and build phase progresses, the
software development effort will proceed with it, providing a complete and well-tested software
package at the completion of the build phase. We will require a GMTO-provided TCS simulator
for this testing to determine the readiness of the completed instrument software. We will fully
test every component of the software on the final instrument before deploying to the telescope by
running extensive simulated observing sessions. We note that DePoy is particularly well-suited
to this task; he has a long history of uncovering bugs in instrument software by ―breaking‖ the
code during in-lab testing.
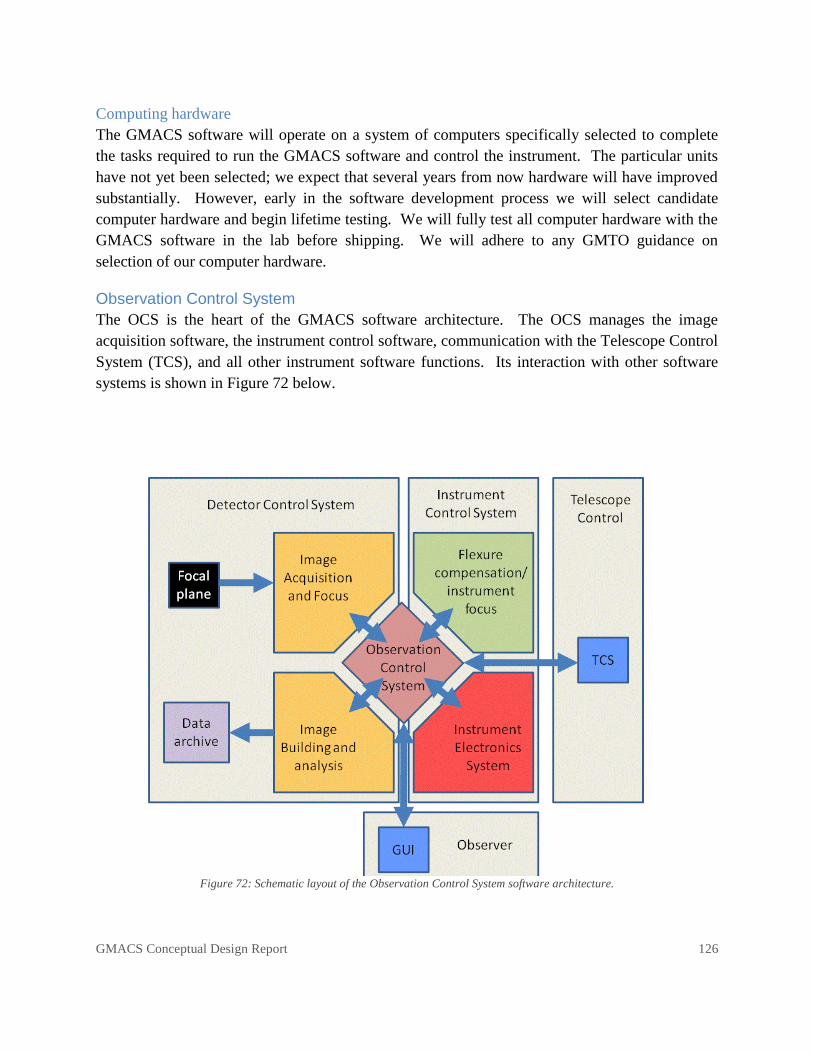
GMACS Conceptual Design Report 126
Computing hardware
The GMACS software will operate on a system of computers specifically selected to complete
the tasks required to run the GMACS software and control the instrument. The particular units
have not yet been selected; we expect that several years from now hardware will have improved
substantially. However, early in the software development process we will select candidate
computer hardware and begin lifetime testing. We will fully test all computer hardware with the
GMACS software in the lab before shipping. We will adhere to any GMTO guidance on
selection of our computer hardware.
Observation Control System
The OCS is the heart of the GMACS software architecture. The OCS manages the image
acquisition software, the instrument control software, communication with the Telescope Control
System (TCS), and all other instrument software functions. Its interaction with other software
systems is shown in Figure 72 below.
Figure 72: Schematic layout of the Observation Control System software architecture.
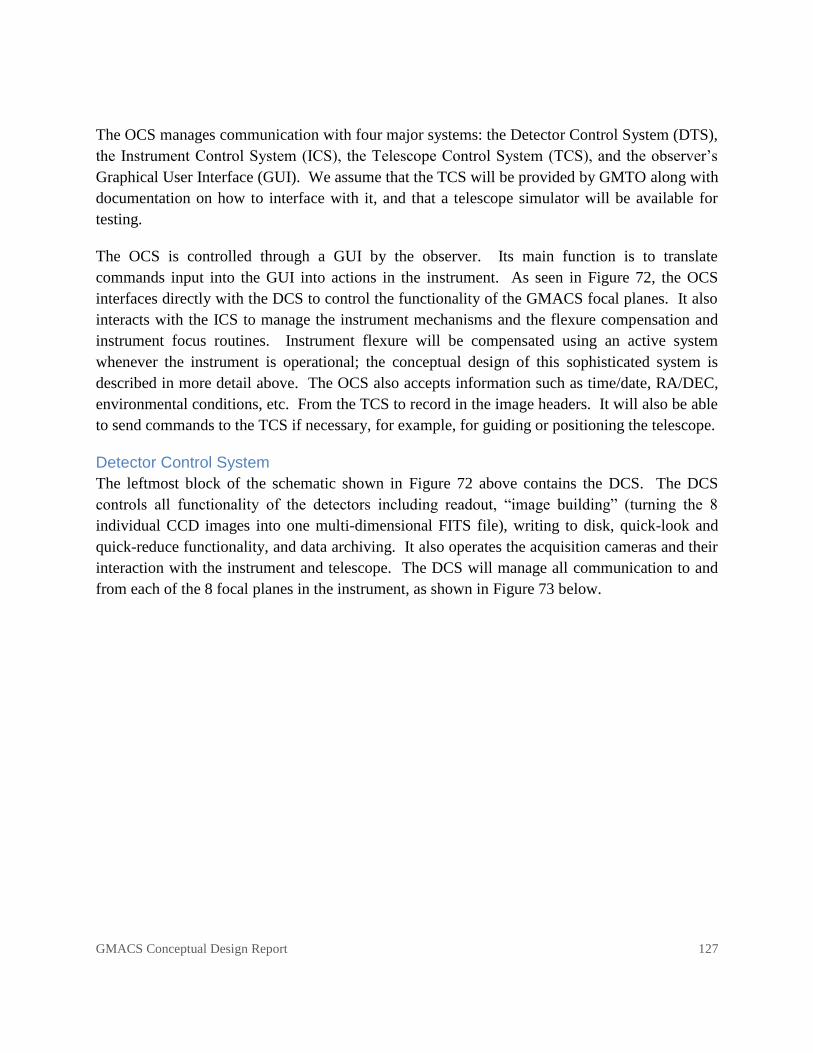
GMACS Conceptual Design Report 127
The OCS manages communication with four major systems: the Detector Control System (DTS),
the Instrument Control System (ICS), the Telescope Control System (TCS), and the observer’s
Graphical User Interface (GUI). We assume that the TCS will be provided by GMTO along with
documentation on how to interface with it, and that a telescope simulator will be available for
testing.
The OCS is controlled through a GUI by the observer. Its main function is to translate
commands input into the GUI into actions in the instrument. As seen in Figure 72, the OCS
interfaces directly with the DCS to control the functionality of the GMACS focal planes. It also
interacts with the ICS to manage the instrument mechanisms and the flexure compensation and
instrument focus routines. Instrument flexure will be compensated using an active system
whenever the instrument is operational; the conceptual design of this sophisticated system is
described in more detail above. The OCS also accepts information such as time/date, RA/DEC,
environmental conditions, etc. From the TCS to record in the image headers. It will also be able
to send commands to the TCS if necessary, for example, for guiding or positioning the telescope.
Detector Control System
The leftmost block of the schematic shown in Figure 72 above contains the DCS. The DCS
controls all functionality of the detectors including readout, ―image building‖ (turning the 8
individual CCD images into one multi-dimensional FITS file), writing to disk, quick-look and
quick-reduce functionality, and data archiving. It also operates the acquisition cameras and their
interaction with the instrument and telescope. The DCS will manage all communication to and
from each of the 8 focal planes in the instrument, as shown in Figure 73 below.

GMACS Conceptual Design Report 128
Figure 73: Schematic layout of the DCS as installed in the GMACS instrument. The individual image builder units are
highlighted in yellow and are described in more detail below.
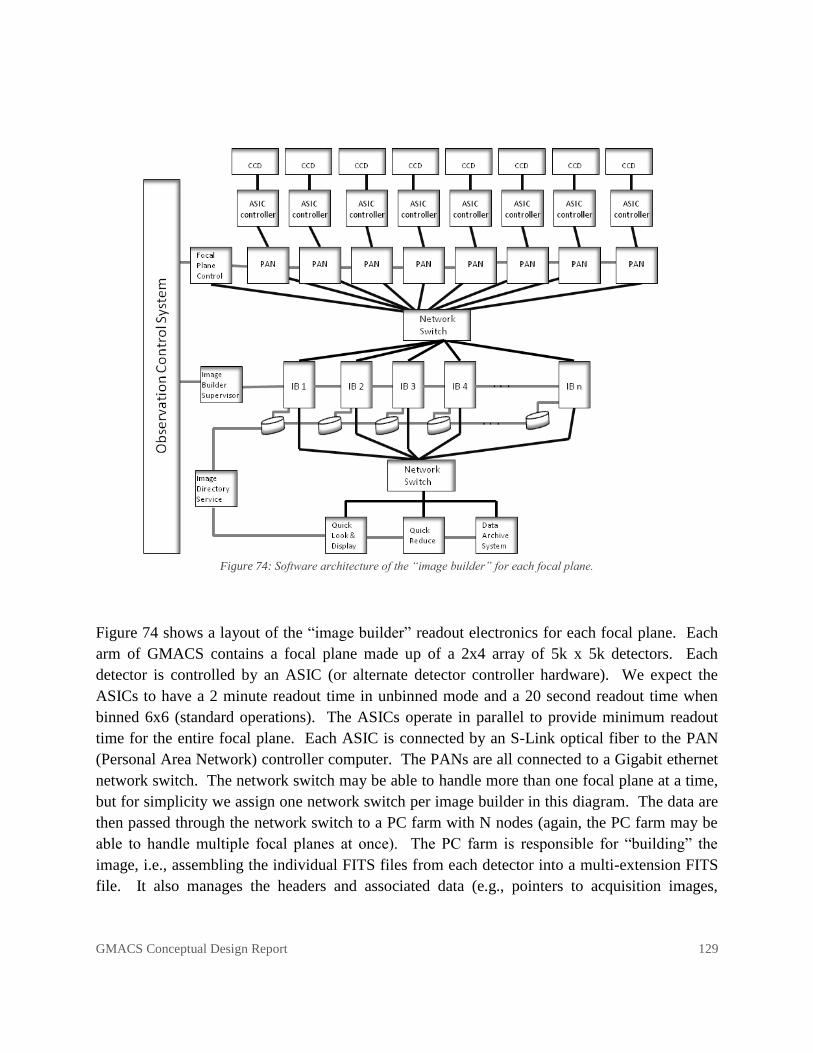
GMACS Conceptual Design Report 129
Figure 74: Software architecture of the “image builder” for each focal plane.
Figure 74 shows a layout of the ―image builder‖ readout electronics for each focal plane. Each
arm of GMACS contains a focal plane made up of a 2x4 array of 5k x 5k detectors. Each
detector is controlled by an ASIC (or alternate detector controller hardware). We expect the
ASICs to have a 2 minute readout time in unbinned mode and a 20 second readout time when
binned 6x6 (standard operations). The ASICs operate in parallel to provide minimum readout
time for the entire focal plane. Each ASIC is connected by an S-Link optical fiber to the PAN
(Personal Area Network) controller computer. The PANs are all connected to a Gigabit ethernet
network switch. The network switch may be able to handle more than one focal plane at a time,
but for simplicity we assign one network switch per image builder in this diagram. The data are
then passed through the network switch to a PC farm with N nodes (again, the PC farm may be
able to handle multiple focal planes at once). The PC farm is responsible for ―building‖ the
image, i.e., assembling the individual FITS files from each detector into a multi-extension FITS
file. It also manages the headers and associated data (e.g., pointers to acquisition images,

GMACS Conceptual Design Report 130
calibration frames, etc.). The PC farm feeds a distributed filesystem to handle the data. The
RAID filesystem will hold ~10 Tbyte: GMACS can produce up to 3.2 Mb images in unbinned
mode, but on an average night we expect GMACS will produce about 1 Gb/night (~100 images
in 6x6 binned mode). An image directory service provides the location of the images on the
distributed filesystem. The image builder filesystem is then connected via Gigabit Ethernet to
the machines that handle the realtime Quick-Look, realtime Image Display, and near-realtime
Quick Reduce functionality of the software. Finally, as the data are acquired they are archived to
a data archiving system (yet to be defined).
Detector control software
The detectors will require specific control software and hardware to be operated. The selection
of detector hardware will be selected at a later date, although it seems likely that the detectors
will be controlled by ASIC-style controllers. The detector controller hardware associated with
an ASIC readout might look something like that shown in Figure 75 below.
Figure 75: Electronics controller system for one focal plane array. Figure courtesy of E2V.
Each detector requires this type of electronics controller system. We will work with the detector
vendor to procure/produce these electronics as appropriate.
GMACS Conceptual Design Report 131
Instrument user interface (GUI) and Quick-Look/Quick-Reduce Tools
A graphical user interface will be developed that will coordinate user input, TCS
communication, and the DCS and ICS systems including instrument mechanisms and detector
control, and Quick-Look and Quick-Reduce data reduction and analysis tools.
The Quick-Look/Display tool will provide instant image display of each image as it is being
obtained. This will necessarily be displayed in some low-resolution mode to enable display of
all 8 focal planes. A goal will be to display a roughly reduced (bias subtracted, flat fielded, e.g.)
image in real time.
The Quick-Reduce tool will allow an observer to quickly reduce the science images during the
night. The data reduction process includes removal of instrumental signature, application of
calibration frames, mask definition files, instrument configuration data, removal of
background/sky, application of photometric calibrations, etc. A goal is to produce fully reduced
wavelength- and flux-calibrated spectrum within 10 minutes after readout.
Acquisition and Alignment Cameras
A system similar to (although less sophisticated than) the science DCS system described above
will be used to control the two acquisition cameras. These two cameras will be much smaller (1k
x 1k) than the science focal planes but will need to be controlled in a loop to provide feedback to
the TCS about how to position the telescope in order to align the slit masks. This control loop
will be managed by the OCS.
Instrument Control System
The ICS controls all functionality in the GMACS instrument other than the detectors. In
particular, it manages instrument mechanisms, controls the flexure compensation system, focuses
the instrument, protects the instrument from harm, and monitors the health of the instrument. In
this section we describe the particular tasks necessary to develop the full ICS, in particular the
mechanism hardware selection and software development and testing.
Mechanism control hardware
Mechanism control hardware tasks include selection of motors/actuators and motor controller
architecture, as well as limit switches that provide for instrument safety. We will select
appropriate motor controller architecture in the next phase of the project and use the selected
units to prototype the mechanisms and to perform extensive lifetime tests during instrument
assembly.
In the current GMACS conceptual design, the instrument has several mechanisms that will
require control software. In particular, the center pod lifting mechanism, the slit mask insertion
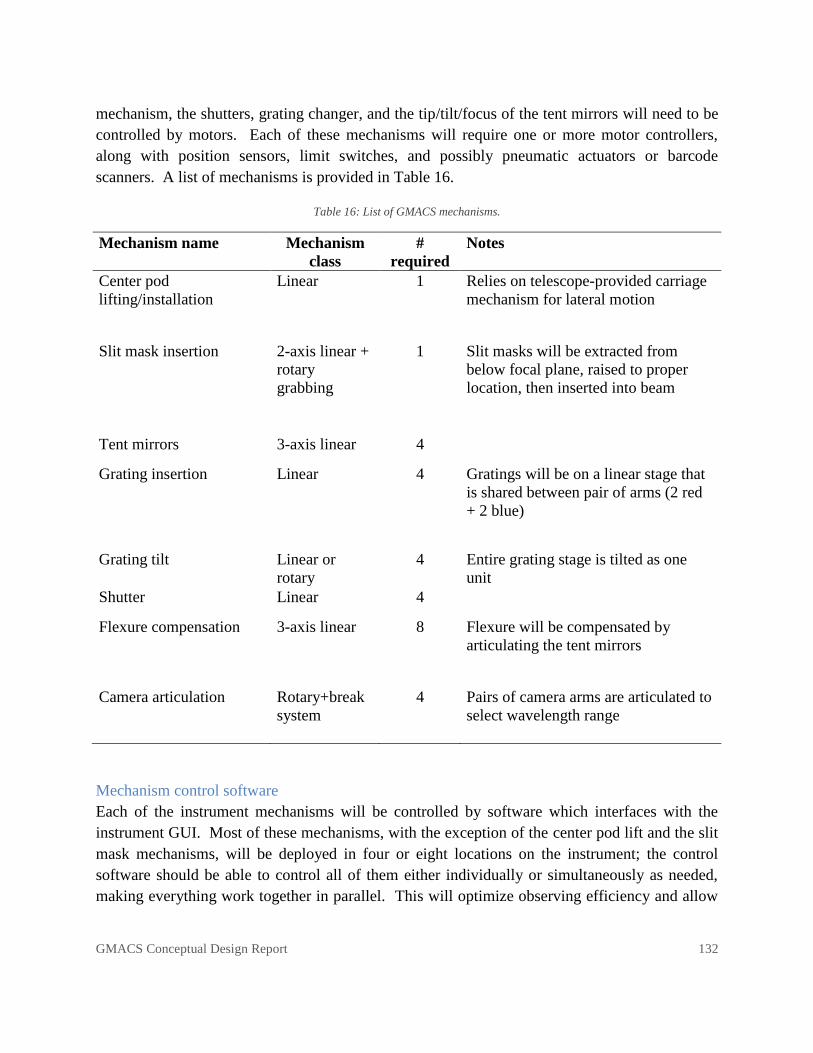
GMACS Conceptual Design Report 132
mechanism, the shutters, grating changer, and the tip/tilt/focus of the tent mirrors will need to be
controlled by motors. Each of these mechanisms will require one or more motor controllers,
along with position sensors, limit switches, and possibly pneumatic actuators or barcode
scanners. A list of mechanisms is provided in Table 16.
Table 16: List of GMACS mechanisms.
Mechanism name Mechanism
class
#
required
Notes
Center pod
lifting/installation
Linear 1 Relies on telescope-provided carriage
mechanism for lateral motion
Slit mask insertion 2-axis linear +
rotary
grabbing
1 Slit masks will be extracted from
below focal plane, raised to proper
location, then inserted into beam
Tent mirrors 3-axis linear 4
Grating insertion Linear 4 Gratings will be on a linear stage that
is shared between pair of arms (2 red
+ 2 blue)
Grating tilt Linear or
rotary
4 Entire grating stage is tilted as one
unit
Shutter Linear 4
Flexure compensation 3-axis linear 8 Flexure will be compensated by
articulating the tent mirrors
Camera articulation Rotary+break
system
4 Pairs of camera arms are articulated to
select wavelength range
Mechanism control software
Each of the instrument mechanisms will be controlled by software which interfaces with the
instrument GUI. Most of these mechanisms, with the exception of the center pod lift and the slit
mask mechanisms, will be deployed in four or eight locations on the instrument; the control
software should be able to control all of them either individually or simultaneously as needed,
making everything work together in parallel. This will optimize observing efficiency and allow

GMACS Conceptual Design Report 133
for the fastest possible reconfiguration of the instrument parameters. Code will also prevent
collisions for instrument safety, which will also be extensively tested.
Data reduction pipeline
Although the data produced by GMACS will not be particularly difficult to reduce, the
instrument will produce a large amount of data each night. We will develop a data reduction
pipeline to minimize the amount of data reduction each observer will need to do. With input
from the instrument User’s Group, the data reduction pipeline will reduce data in a way that will
benefit most science projects expected with the instrument. The pipeline should be sufficiently
flexible to be able to reduce multi-slit, longslit, and imaging data. The data reduction pipeline
will at minimum include the following reduction tasks: remove instrumental signature (bias, flat
field); handle input from the instrument such as mask definition files, calibration spectra, and
instrument configuration data; use these inputs to extract spectra and determine and apply a
wavelength calibration; remove background and/or sky contribution from the signal; and apply
any photometric calibrations to the data. The output of the pipeline should be a fully reduced,
wavelength- and flux-calibrated spectrum of each observed object. The goal is to be able to
produce these data products within 10 minutes after the data frame readout is complete.
The pipeline should be sufficiently easy to use such that any GMACS user can quickly
understand how to reduce data with the software, and it should be sufficiently flexible to handle
the range of different types of data obtained from the instrument. A software task will be to
develop this pipeline and to test it on preliminary data produced by the instrument in the lab.
Exposure time calculator
GMACS has a preliminary exposure time calculator that can be found at
http://instrumentation.tamu.edu:8080/gmacs/. Additional capabilities will be added to the
exposure time calculator as the project proceeds.
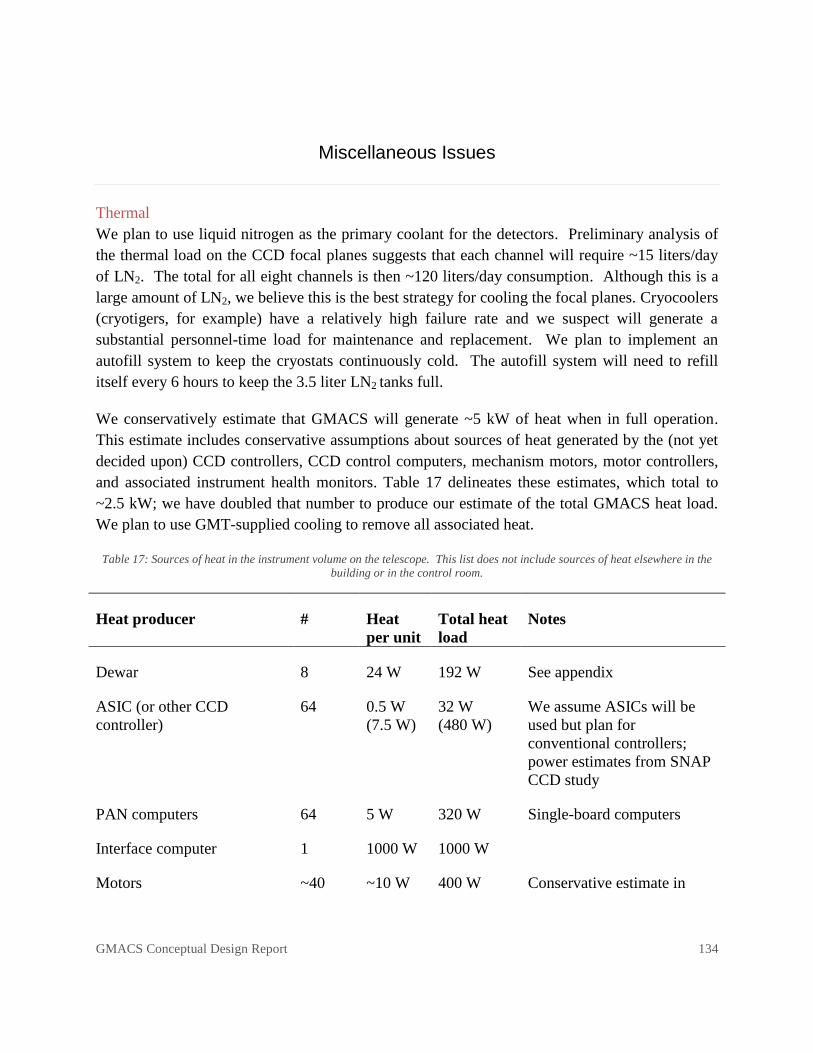
GMACS Conceptual Design Report 134
Miscellaneous Issues
Thermal
We plan to use liquid nitrogen as the primary coolant for the detectors. Preliminary analysis of
the thermal load on the CCD focal planes suggests that each channel will require ~15 liters/day
of LN2. The total for all eight channels is then ~120 liters/day consumption. Although this is a
large amount of LN2, we believe this is the best strategy for cooling the focal planes. Cryocoolers
(cryotigers, for example) have a relatively high failure rate and we suspect will generate a
substantial personnel-time load for maintenance and replacement. We plan to implement an
autofill system to keep the cryostats continuously cold. The autofill system will need to refill
itself every 6 hours to keep the 3.5 liter LN2 tanks full.
We conservatively estimate that GMACS will generate ~5 kW of heat when in full operation.
This estimate includes conservative assumptions about sources of heat generated by the (not yet
decided upon) CCD controllers, CCD control computers, mechanism motors, motor controllers,
and associated instrument health monitors. Table 17 delineates these estimates, which total to
~2.5 kW; we have doubled that number to produce our estimate of the total GMACS heat load.
We plan to use GMT-supplied cooling to remove all associated heat.
Table 17: Sources of heat in the instrument volume on the telescope. This list does not include sources of heat elsewhere in the
building or in the control room.
Heat producer # Heat
per unit
Total heat
load
Notes
Dewar 8 24 W 192 W See appendix
ASIC (or other CCD
controller)
64 0.5 W
(7.5 W)
32 W
(480 W)
We assume ASICs will be
used but plan for
conventional controllers;
power estimates from SNAP
CCD study
PAN computers 64 5 W 320 W Single-board computers
Interface computer 1 1000 W 1000 W
Motors ~40 ~10 W 400 W Conservative estimate in

GMACS Conceptual Design Report 135
steady state
Motor controllers ~40 ~10 W 400 W Conservative estimate in
steady state
Misc. instrument health
monitors (Temp, LN2 flow,
etc.)
~20
~5 W
100W
Total 2444 W
(2892 W)
(with conventional CCD
controllers)
Electrical
GMACS will have many electrical systems: motor controllers, limit switches, computers, etc.
We plan to minimize the size of all electrical and computer systems; the goal is to fit everything
in one corner of GIR and bottom of focal plane unit. We believe that the rapid commercial
development of small electronics systems will help us achieve this goal. Table 18 lists various
flavors of electronics that will be used in GMACS.
Table 18: Categories of GMACS electronics.
Category of electronics Example systems
Dewar electronics CCDs, CCD controllers (ASICs),
heaters, temperature sensors
Dewar peripherals CCD controllers (conventional), LN2
level sensors, pressure sensors
Motors Linear, rotary, clamping, braking
Motor controllers Various
Position indicators Inductive sensors, limit switches
Instrument health monitors Temperature/humidity sensors, aural
feedback
Mechanical Interfaces
GMACS will be installed directly into the GMT Gregorian Instrument Rotator (GIR). Three
main component of GMACS need to be installed on the telescope: the two optics modules, one
installed in each of two GIR ―pods‖, and the central lifting structure, to be mounted in the GIR
such that it can be moved into the beam when the instrument is in use.
GMACS Conceptual Design Report 136
We await the final design of the GIR from GMTO and plan to use available features on the GIR
structure’s ―ceiling‖ to mount the instrument. We have preliminary designs for how the
instrument will be installed in the GIR but cannot finalize the design before more interaction
with the GIR design team occurs. We currently plan to install the optics modules using titanium
flexures. We hope to interact much more with the GIR design team to ensure that adequate
structural members are available to mount the modules solidly.
The current plan is to lift the focal plane unit to the active position as described in the
Mechanical section above. Subject to comprehensive flexure analysis, we fear that this
arrangement will be unsuitably flexible. We plan to interact with the GMTO/ GIR design team
to discuss kinematic docking of the focal plane unit with the top of the GIR.
Support
GMACS will require few services from the GMT. We will need a supply of LN2 to feed the
autofill system. We will also need stable power, cooling lines, and Ethernet connectivity. We
will adhere to whatever standards GMT creates for those services.
Shipping
Our team members have had substantial experience shipping instrumentation to Chile and to
other countries around the world. Although some of the GMACS modules are large, we
anticipate no special problems shipping them to Las Campanas safely. We will design and test
the instrument in small subassemblies that can easily be handled in ~1m3 shipping crates. The
goal is to use containers small enough to be shipped via airplane. We will fully engineer the
GMACS shipping containers for shock absorption and safety. We have already budgeted for this
design effort in the GMACS costs presented in this document. The shipping containers will meet
all shipping requirements as far as size, weight, and Chilean customs/insect control standards.
The GMACS subassemblies will be designed to be sufficiently rugged that shipping by air will
cause no damage to any pieces of the instrument. We will of course include shock monitors and
will log the forces the shipping containers are subject to, just for our amusement.
Installation
Although we have had minimal interaction with GMTO staff regarding installation of GMACS
on the telescope, we have some idea of how the installation should go: GMACS will be shipped
to Las Campanas and installed in two GIR pods (provided by GMTO) on the mountain by
GMACS staff. The GMTO staff will install the pods on the telescope. GMACS staff will finish
the installation and optical alignment of the units and will then fully test the instrument first off
and then on telescope. The commissioning plan is described below. Specific details of the
GMACS Conceptual Design Report 137
installation procedures will await the final design of the GIR and are likely to change in the next
several years before the instrument is installed on the telescope.
There is some chance that, due to the size and weight of the GMACS instrument, GMTO may
choose to install pieces of GMACS in the GIR pods as the telescope itself is being assembled.
We will plan well in advance of installation and communicate our plans with GMTO staff to
ensure that our assembly plan is consistent with the telescope construction plans.
Commissioning
The plan for GMACS commissioning is straightforward. Our philosophy is to fully test the
instrument after a final lab assembly at Texas A&M. We have identified several large spaces on
or near campus that would serve as a suitable assembly area for the instrument (see the Risks
section for more detail). We plan to build appropriate telescope simulators in this space to allow
the fully-assembled instrument to be tested in all potential orientations. This will ensure that the
flexure compensation system, cryogenic systems, etc. All function as intended. Only once these
tests are complete and adequate functionality verified will the instrument be dis-assembled,
packed, and shipped to Chile.
We have followed this philosophy in several previous instruments. For example, the Dark
Energy Camera (DePoy is the Project Scientist) was fully assembled (except for optics) at
Fermilab on a telescope simulator. Full functionality was confirmed before instrument shipping,
so we have great confidence that DECam will begin observing very quickly after installation on
the telescope. The MODS instrument at Ohio State and the FourStar instrument at Johns
Hopkins/Carnegie are further examples of this philosophy. Many other instruments built by our
team have been shipped to sites around the world and were performing science observations the
first full night they were on the telescope after similar lab testing procedures.
We will follow this extensive pre-ship testing procedure for GMACS. If all goes as anticipated,
we anticipate requiring 2 months of installation time in a large, relatively clean room at the
telescope to unpack, install the instrument into the GIR pods, test mechanisms, optically align,
perform complete system tests, and exercise the software. We will then need ~3 weeks of on-sky
commissioning to optically align, confirm functionality of all mechanisms and optics, and
perform calibration exercises (photometric & spectroscopic). An example of the schedule for
this commissioning activity is given in Table 19. We would expect that first light science would
follow quickly after that.

GMACS Conceptual Design Report 138
Table 19: Possible schedule for GMACS on-telescope commissioning activity.
Mode Observation Duration
Imaging Observe Orion 1 night
Standard stars 2 nights
Flat fields, calibration lamps 1 night
Proto-typical imaging science case
e.g. Star cluster, galaxies, etc.
2 nights
Long-slit spectroscopy Observe Orion 1 night
Standard stars 2 nights
Flat fields, calibration lamps 1 night
Spectrophotometric calibration of
the instrument
2 nights
Longslit observations of proto-
typical science, e.g. metal-poor
stars, high-z galaxies, KBOs
4 nights
Multi-object spectroscopy Mask alignment procedure check 1 night
Multi-object observations of proto-
typical science, e.g. Star clusters,
galaxy clusters
4 nights
Total 3 weeks
Optical Coupling Fluid Testing
Recently, several spectrographs have been compromised by the corrosive nature of optical fluids
with some materials. Two years after the commissioning of the Robert Stobie Spectrograph
(RSS) on the Southern African Large Telescope, astronomers noticed a significant loss of ultra-
violet transmission. With great difficulty and time lost, they diagnosed that the optical fluids had
become contaminated by the materials that they had corroded and these contaminates blocked
UV light.
Furthermore, other astronomers have taken a preemptive approach to this problem. When
designing the Deep Imaging Multi-Object Spectrograph (DEIMOS), the team at UCO/Lick
Observatory did a preliminary 3-month test of several optical fluid and material candidates for
DEIMOS. With their research, they qualitatively identified and avoided many incompatible fluid
and material pairs.
Other instruments have had similar problems, problems we wish to avoid in GMACS. We have
initiated a project to quantify throughput changes over time caused by contamination of optical
coupling fluids. Over the next few years we will study several candidate optical coupling fluids
and potential contaminating materials that could be used in GMACS.
GMACS Conceptual Design Report 139
We will test these fluids:
Cargille LL5610
Cargille LL1074
Cargille S1056
Cargille LL3421
Glycerine
And these potential contaminants:
Silicone
Kapton Film
Teflon
Polyethylene
Delrin
Epotek 301-2
2216 B/A gray
Nothing (control)
Since the effects we wish to study set in after several years, these will be long-term tests. But to
acquire results in a timely manner, we will accelerate the corrosion process in some of the
samples by heating them in an oven for months at a time. During the course of the study, we will
remove the samples from the oven for periodic observations. Measurements will be made by
shining UV light through the cuvettes and by recording the resulting transmission curve in a
standard tabletop spectrometer.
We hope to confirm that several of the candidate Cargille fluids will be good candidates for
GMACS optics coupling and that they will not become contaminated over time by materials
designed into the lens cells.
Calibration System
We have spent some time thinking about how to calibrate the GMACS instrument. The Giant
Magellan Telescope is indeed giant: it will be unfeasible to construct a dome flat field screen for
the inside of the dome at which to point the telescope for calibration. We have begun planning
for how to calibrate the GMACS instrument without such a screen. We will develop a
calibration system that will illuminate the entrance of the spectrometer uniformly and with the
same f/# as the telescope, over the full wavelength range of the instrument. We have thus far
investigated three potential concepts for this calibration system, described below.
The first and simplest option (Option 1) would be to use a diffusing screen that can be inserted
below the final element of the corrector, facing the entrance pupil of the instrument. We would
GMACS Conceptual Design Report 140
have a light engine made of LEDs coupled to fiber that would project light on the screen from
the top of the ring on the Gregorian instrument rotator. The light reflected off the screen will
illuminate the entrance pupil. The problem with this option is that the light entering the
instrument is not at the same F/# as the GMT output.
A second option (Option 2) would be to use an integrating sphere and a Fresnel lens to project
light onto the pupil of GMACS. An integrating sphere would be placed below the final element
of the corrector with the aperture facing down towards the entrance pupil. A 1.5m diameter
Fresnel lens, placed at the top of the Gregorian instrument rotator, would take the divergent
beam from the integrating sphere and focus it to the appropriate F/#. Such a large Fresnel lens is
(amazingly) available in a material suitable for use with GMAC’s wavelength coverage from at
least one vendor. This solution would illuminate the entrance pupil with the right size and F/#.
Unfortunately, to cover both the GMACS and NIRMOS wavelength ranges complicates lens
material selection and we may have to use a different Fresnel lens for each instrument. We could
still share the same integrating sphere, calibration lamps, etc.
A third option (Option 3) would be to place a small projection system at the prime focus just
below the secondary. This would be a small ~6x6x12 inches light engine and integrating sphere
assembly. The output port of the integrating sphere would be pointing up towards the secondary
mirror. The plane of the output port would be placed just below the secondary focus such that its
re-imaged size at the instrument entrance would match the size of the entrance pupil of GMACS.
This would have the advantage of not requiring large size Fresnel optics but would require a
mounting system below the secondary.
We originally contacted Brian McLeod from the NIRMOS team to try and combine the
calibration system for the 2 spectrometers as the calibration requirements for the two instruments
are very similar. It is our understanding that the preferred solution at the moment for NIRMOS
is the use of a Fresnel lens and integrating sphere like our option 2. Unfortunately, the materials
available to make extremely large Fresnel lenses can't cover both the GMAX and NIRMOS
wavelength range simultaneously so we would require two separate lenses for the 2 instruments.
We could share the same integrating sphere as it is easy to create a light source that covers the
whole wavelength range.
Option 3 was discussed during a meeting with Steve Shectman and would work well for both
GMACS and NIRMOS instruments. It could also be used for regular dome flats for imaging
cameras.
We will continue to explore and communicate with other instrument teams about calibration
issues.
GMACS Conceptual Design Report 141
Management Plan
The design, fabrication, assembly, test, and deployment of GMACS is a large undertaking and
we will need substantial project management to successfully complete the instrument. To date,
we have relied on the PI and small project team to informally manage the conceptual design
study; we fully acknowledge that a much more elaborate, professionally managed approach will
be required to ensure that the project is completed on time and within the allocated budget.
If GMACS is selected to proceed to further design phases, there will be significant changes in
the instrument team composition. In particular, there would be multiple hires at Texas A&M
into mechanical and software engineering and science support positions (see the Personnel
Requirements section below). Texas A&M would also add several project management
professionals to the team to develop schedule milestones, monitor progress towards those
milestones, and track budgets. We plan to cooperatively work with GMTO to provide an
appropriate level of management interface to the project.
In this section we describe our concepts of the project management and systems engineering
approaches we will adopt if GMACS is selected to proceed to further design phases.
Systems Engineering Approach
The term "systems engineering" has many different interpretations depending on the industry in
which it is applied. For the development of astronomical instruments, the definition that we feel
best fits our unique field, and the definition that we adhere to, comes from the NASA Systems
Engineering Handbook (1995): "Systems engineering is a robust approach to the design,
creation, and operation of systems. In simple terms, the approach consists of identification and
quantification of system goals, creation of alternative system design concepts, performance of
design trades, selection and implementation of the best design, verification that the design is
properly built and integrated, and post-implementation assessment of how well the system meets
the goals."
The systems engineering methodology that our team will follow is the same methodology we
have followed for many years, a methodology that has consistently produced world-class
instruments, with minimal budget overruns and schedule delays. We have already begun this
process in the conceptual design phase with a solid understanding of the top-level requirements
(i.e. Technical, cost, and schedule) and interfaces. We have interacted with GMTO during this
process to interface the instrument with the telescope and to ensure that the instrument meets the
observatory’s science requirements. In the next phase of the project we will focus on a more
detailed mechanical design, complete flexure and finite element analysis, and lower level design

GMACS Conceptual Design Report 142
details, finishing with a system level performance analysis, the result being a quantitative
measure of how we expect the instrument to perform. Throughout this process we will rely on
our extensive interdisciplinary experience and input from GMTO to guide us.
For the preliminary design stage through construction and commissioning we will continue to
rely on methods that have proven successful for us in the past: an interdisciplinary engineering
approach; robust requirements and interface definitions; analyses to prove design concepts and
quantify performance; the development of prototypes as needed to prove concepts and quantify
performance; strict attention to detail in the development of construction blueprints and
procurement specifications; revision tracking to ensure the correct parts are built; extensive use
of sole-source procurements from vendors who are known to produce quality results, on schedule
and at competitive prices; and written test procedures and documented results.
As with any large project we have undertaken in the past, we will rely on several tools to manage
technical activities, cost, and schedule. For the configuration management of requirements and
designs we will use custom-built databases. We have found that databases are a very effective,
and efficient, way of tracking everything from vendors to drawings. There will be a
requirements database for all requirements that need tracking. A separate database will be used
for all mechanical, electrical, and optical components with information on revision level,
material, size, finish, etc. These tools will be used throughout the project lifecycle.
Project Management Approach
Efficient project management will be an essential part of a very large and expensive instrument
development project such as GMACS. As such, careful project management will need to be in
place early in the project. At the start of the next phase of the GMACS design, we will hire
additional project management professionals to aid with this effort. In this section we describe
the tools we envision these project managers will use in this process.
The Project Manager will use standard project management tools to manage the design study.
These will include Microsoft Project to monitor adherence to the project schedule and important
milestones, Microsoft Excel and Access to track budget and project deliverables, and internal
financial accounting software to further monitor the budget and expenses. The Microsoft Project
schedule will be monitored closely by the Project Manager and PM assistants and any slippages
in schedule will be handled by directing additional resources to problem areas. Team members
will be required to log hours spent on the GMACS design study each month; these values will be
input into the Project plan and tracked in the budget and schedule.
The team will also use an online project collaboration tool (such as Basecamp or Cognitive
Cockpit, which we have experience with through working with GMTO as well as other projects)
GMACS Conceptual Design Report 143
to manage the documentation and designs created during this project. We are already familiar
with this sort of collaboration software from our work on the GMACS and FourStar instruments.
This has proven to be an efficient way of communicating between project members at each
institution, and will facilitate involvement by GMTO staff as well.
An important management tool for the GMACS project is frequent team meetings. We will hold
weekly team meetings with all parties via telecon/videocon. We will publish the minutes from
these meetings online, as we have done throughout the conceptual design study (see
https://instrumentation.tamu.edu/~marshall/GMACS/).
In addition to team meetings, we will adhere to any GMTO-requested instrument reviews. We
plan to hold our own regular reviews if GMTO does not require them. We (or GMTO) will
invite outside reviewers to provide feedback on our instrument design process to ensure that the
project remains on track and able to produce cutting-edge science once installed on the telescope.
Figure 76 is an organizational chart for the GMACS project. DePoy is the Principal Investigator
of GMACS and will lead the instrument development effort. Steve Shectman at OCIW/GMTO
and Jennifer Marshall and Casey Papovich at Texas A&M will serve as project scientists and
will ensure the instrument is designed so that it will meet all science requirements and be able to
complete the science cases described in this document (as well as many others). One of the first
hires for the GMACS project as we move forward will be a Project Manager. This person will
be at Texas A&M and will be tasked with maintaining the schedule, budget, scope of the project,
and generally keeping the project on track. We have identified a potential candidate to fill this
position, Dr. Brenna Flaugher, the Project Manager of the successful DECam project at
Fermilab. We have discussed the possibility of her filling our GMACS Project Manager role and
she has not yet said no. The Project Manager will likely hire several assistants as the work
ramps up. The opto-mechanical, optical, and electronics engineering design will be completed
by Johns Hopkins team members. They have ample experience with this sort of work on many
large ground- and space-based instruments in the past. The detector development, software
development, and systems engineering will take place at Texas A&M. These hires will also be
made soon after the start of the project.

GMACS Conceptual Design Report 144
Figure 76: GMACS organizational chart.
Although some of our effort is distributed across multiple institutions, the main project
management and leadership will come from Texas A&M. We have had experience working in
this multi-institutional manner in the past with projects such as FourStar, VIRUS, and other
smaller instruments, and have been able to manage the effort appropriately with remote
conversations and face-to-face meetings. We do not anticipate distributed engineering effort on
GMACS to be a risk to the project and we will be sure to manage the effort appropriately.
Documentation
Over the course of many successful instrumentation projects, members of the GMACS team
have developed internally consistent documentation standards. In the next phase of the GMACS
project, the Project Manager will lead the effort to develop a documentation plan for the
instrument that will incorporate practices from each institution as appropriate.
At Texas A&M the project documentation system is well established. Ongoing instrumentation
projects each have a website accessible internally. Weekly meeting notes are typed up,
circulated to team members, and posted to the website. Current SolidWorks models and/or
drawings are generally available on the website as well, and are kept under change control by
one person. Up-to-date project management schedules and other project documentation are
posted and available to all team members.

GMACS Conceptual Design Report 145
The GMACS Project Manager will be responsible for acquiring/creating the documentation,
keeping it updated, and providing access to all relevant team members. As the instrument
progresses into the Preliminary Design Stage, the Project Manager will ensure that the
documentation follows the design progress, is properly controlled and under change control, and
meets all GMTO requirements.
Work Breakdown Structure and Schedule
Figure 77 gives an outline of the Work Breakdown Structure for the GMACS project, showing a
conceptual schedule for the entire GMACS project. A more complete WBS is provided via
GMTO’s BaseCamp website. Note that this is a preliminary estimate of the schedule, created to
demonstrate that the instrument could be designed and built in a reasonable amount of time.
Project management professionals will develop a much more detailed schedule with project
milestones and deadlines if the GMACS project moves to the next phase.
The WBS shows a proposed schedule that starts 1/1/2012 (not particularly realistic, of course)
and extends for ~5.5 years to 5/27/2017. This schedule takes into account mechanical, optical,
and software engineering effort, optics and detector delivery lead times, assembly and testing
processes, and instrument reviews. We note that this schedule does take an optimistic view of
lead times on optics and detectors in particular, but is designed to show that the instrument is
possible to build in a timely fashion based on feedback we have received from vendors.
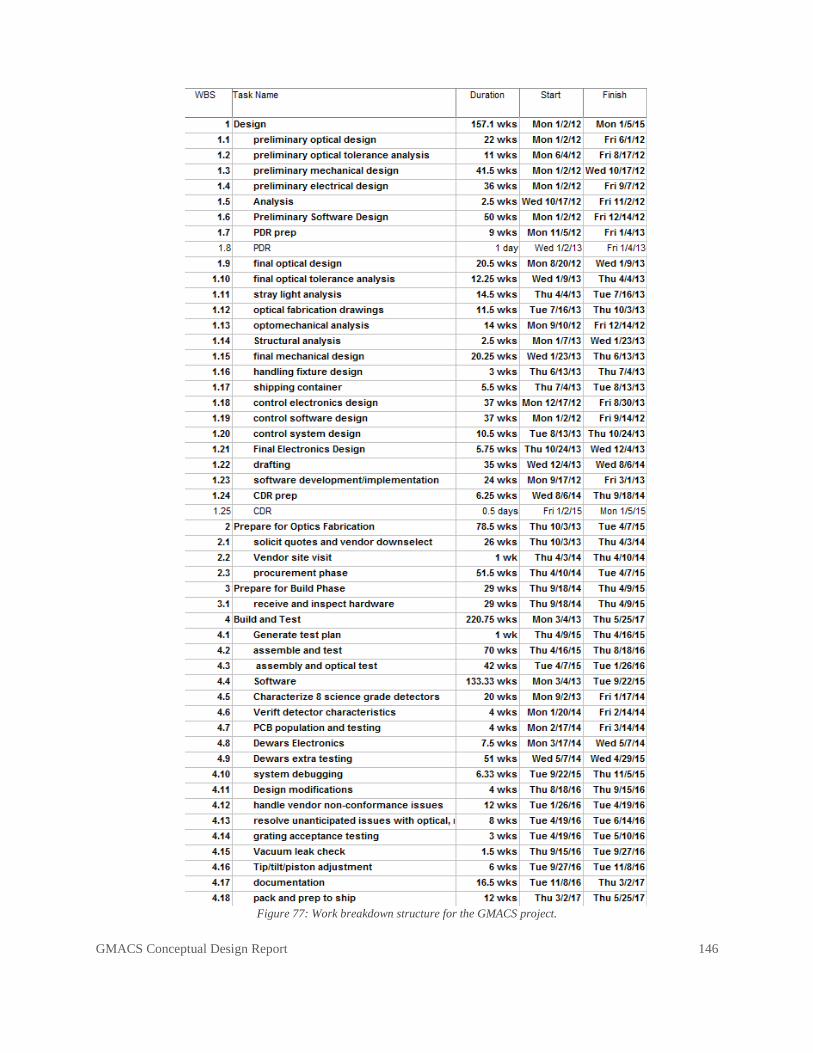
GMACS Conceptual Design Report 146
Figure 77: Work breakdown structure for the GMACS project.
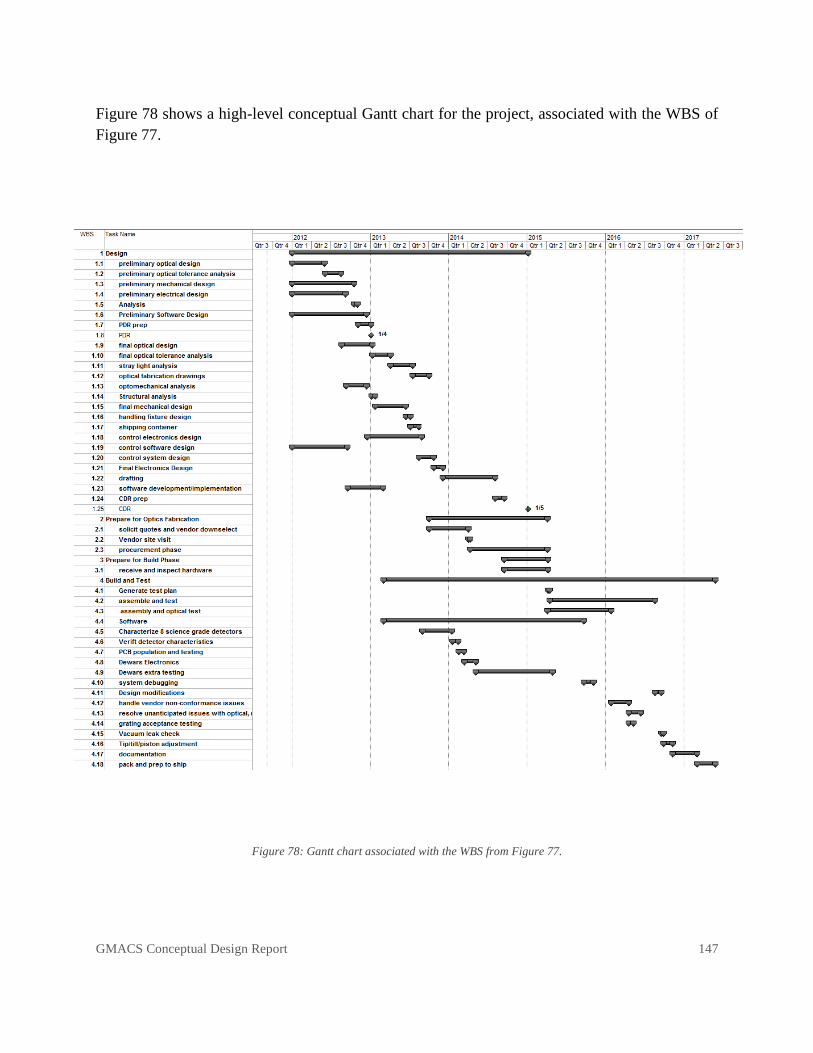
GMACS Conceptual Design Report 147
Figure 78 shows a high-level conceptual Gantt chart for the project, associated with the WBS of
Figure 77.
Figure 78: Gantt chart associated with the WBS from Figure 77.

GMACS Conceptual Design Report 148
Personnel requirements
From this conceptual WBS and project timeline we have derived a first estimate at the personnel
required to design and build GMACS. Again, these estimates will be refined once project
management professionals are hired in the next phase of the project. We show the total number
of personnel required to complete the instrument in the 5.5 year time frame in Figure 79 below.
Figure 79: Total number of personnel required each year to complete the GMACS instrument.
In this analysis we have divided the effort into four categories: work performed by optical,
electrical, mechanical, and software engineering professionals. We have assigned each task in
the WBS to one of these categories and summed up the amount of effort required by each group
over the course of the project. We show these sums in Figure 80 below.

GMACS Conceptual Design Report 149
Figure 80: Personnel requirements for the GMACS project, sorted by type of engineering professional.
We note that these divisions of labor are very coarse, and include everything from high-level
engineering design, performed by a professional engineer, to assembly and testing tasks
accomplished by a technical assistant. We also do not include all manufacturing and assembly
tasks that may or may not be completed by external vendors. We do, however, include effort
required to effectively manage the vendors, particularly in the optical and mechanical categories.
The specific hiring needs for the project will be determined by the Project Manager once that
role is filled.
GMACS Conceptual Design Report 150
Risk Mitigation
In this section we describe our risk mitigation plan and discuss the possible risks to the project
throughout the design and build phases, including technical risks as well as risks associated with
limited personnel, facilities, and team experience. We also detail the risks that we have retired
over the past year in the conceptual design phase.
Risk Mitigation Plan
We plan to manage project risk in general with good project management. If selected to proceed
we will hire full-time project managers at JHU & Texas A&M to monitor schedule (milestones,
time to complete individual tasks, effort tracking, budgeting, cost monitoring, etc.). We have
allocated 6-10% of the project budget to management directly. At Texas A&M we have
discussed the possibility of hiring the DECam project manager, Dr. Brenna Flaugher (currently
at Fermilab), for the GMACS project. DECam is a $45M instrument in final deployment stages
at the CTIO 4m. Flaugher has brought the DECam project to near completion within 6 months
of the project schedule developed 5 years ago and within the originally assigned project budget.
The GMACS PI has considerable experience working with the DECam project manager as well
and feels the excellent synergy would transfer well to the GMACS project.
We note here that it is important to have a steady (or at least known) funding stream in order to
successfully complete the project on time and on budget. Without a known funding stream, a
large-scale project such as GMACS is more prone to delays, budget overruns, and other non-
ideal situations.
Techincal Risks
We believe that GMACS has very few technical risks. The instrument is very large but not
particularly technically challenging. Together the GMACS project team has ample experience
with similar sized projects (MODS for LBT, a $15M instrument; DECam for the CTIO 4m
telescope, a $45M camera; FourStar for Magellan, a ~$6M infrared imager; VIRUS for HET, a
$35M project; multiple space instruments, etc.). The team’s experience with successful large
scale projects is discussed in more detail below. The scope of this instrument, although
physically larger, is not altogether different than these previous instruments: the number of
mechanisms is roughly the same, the way the instrument mounts to the telescope is similar, the
flexure compensation system will be based on previous experience with other large instruments.
We believe that the main risk to the project is cost and schedule. The main cost drivers in the
instrument are the optics and detectors. These elements are costly because they are very large
and numerous, but not because they are particularly difficult to produce. The optics are
GMACS Conceptual Design Report 151
expensive but not risky; multiple vendors are available for the lens sets and the materials are
currently available in the appropriate blank sizes. We will further mitigate risk to the optics by
purchasing spare blanks and lenses when possible and appropriate. The CCDs are ―off-the-
shelf‖ and are currently available from at least one vendor (e2v) who is enthusiastic about
working with us to provide us with our desired detector. We have identified other vendors
(Hamamatsu, LBL, Bredthauer/Lesser/Leach) who are also able to produce detectors for
GMSCS. The ASIC CCD controllers are not currently off-the-shelf but are likely to be the
standard controller for all CCDs by the time we take delivery of the detector. There are of
course many alternatives to these modern controllers as well.
The size of the instrument presents a few challenges in addition to the cost of the components.
There are many mechanisms in GMACS, but they are ones with which we have a lot of
experience and are comfortable drawing on previous well-proven designs. Collectively our team
has little fear of mechanisms: to give one example, OSIRIS, a cryogenic infrared imaging
spectrograph built nearly 20 years ago at Ohio State has ~20 mechanisms and has had almost no
failures over its lifetime of use on various telescopes. OSIRIS is still operational on the SOAR
telescope at Cerro Pachon in Chile. Many other instruments designed and built by our team have
similar track records.
Proper management of flexure compensation will be key to the success of the GMACS
instrument. We have already mitigated this risk by assembling a team with extensive experience
in dealing with flexure issues in large instruments. We will invest extensive engineering effort
during the conceptual and preliminary design phases to complete a comprehensive finite element
analysis of the instrument in order to predict the extent of instrument flexure. We will build
upon the experience of Marshall and DePoy, who have designed and commissioned a flexure
compensation system for the MODS spectrograph for the LBT telescope; the GMACS flexure
compensation system will somewhat resemble the successful MODS system.
Retired Risks
In the Conceptual Design Study proposal we presented a table listing potential risks to the
project that we had already identified, their probability of driving the project budget/schedule,
the impact on the project, and how we planned to mitigate them. We stated that we would retire
many of these risks during the conceptual design study. We have described throughout this
document the many ways in which we have mitigated the risks identified in the original
proposal; in Table 20 we present a reproduction of the original table from the CoDR along with
the current status of the risks, many of which have been retired over the past year. We do not
believe any additional risks have been uncovered during the conceptual design study.
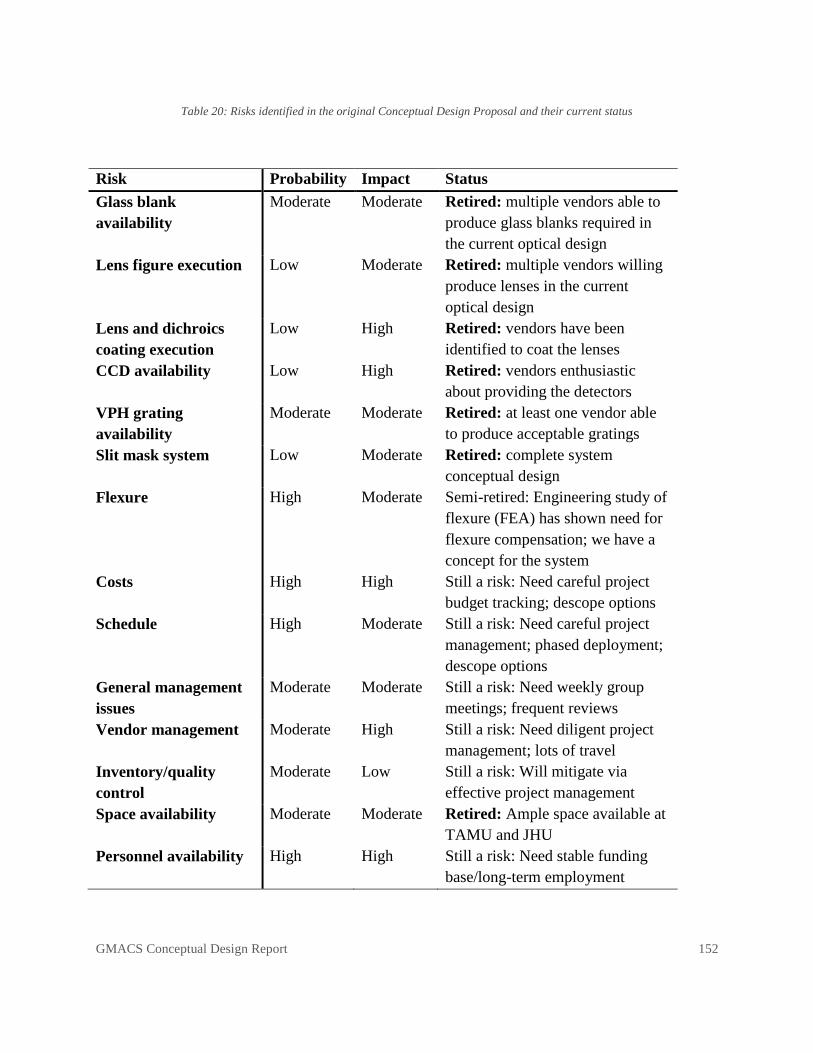
GMACS Conceptual Design Report 152
Table 20: Risks identified in the original Conceptual Design Proposal and their current status
Risk Probability Impact Status
Glass blank
availability
Moderate Moderate Retired: multiple vendors able to
produce glass blanks required in
the current optical design
Lens figure execution Low Moderate Retired: multiple vendors willing
produce lenses in the current
optical design
Lens and dichroics
coating execution
Low High Retired: vendors have been
identified to coat the lenses
CCD availability Low High Retired: vendors enthusiastic
about providing the detectors
VPH grating
availability
Moderate Moderate Retired: at least one vendor able
to produce acceptable gratings
Slit mask system Low Moderate Retired: complete system
conceptual design
Flexure High Moderate Semi-retired: Engineering study of
flexure (FEA) has shown need for
flexure compensation; we have a
concept for the system
Costs High High Still a risk: Need careful project
budget tracking; descope options
Schedule High Moderate Still a risk: Need careful project
management; phased deployment;
descope options
General management
issues
Moderate Moderate Still a risk: Need weekly group
meetings; frequent reviews
Vendor management Moderate High Still a risk: Need diligent project
management; lots of travel
Inventory/quality
control
Moderate Low Still a risk: Will mitigate via
effective project management
Space availability Moderate Moderate Retired: Ample space available at
TAMU and JHU
Personnel availability High High Still a risk: Need stable funding
base/long-term employment
GMACS Conceptual Design Report 153
Personnel
Another possible risk to the project is limited personnel time. The Astronomical Instrumentation
Group in the Physics and Astronomy Department at Texas A&M is a young group with most of
its members working together at Texas A&M for the past three years. Although the Texas A&M
group is still a relatively small, we plan to increase the size of the GMACS team if the project
proceeds to the next phase. We are fortunate to have the Instrument Development Group at JHU
on our team. The IDG is a mature group with eight senior engineers on staff. We feel that
additional hires at Texas A&M combined with the existing excellent staff of the IDG will
provide sufficient engineering experience for the GMACS project. See the Appendix for
biographical sketches of some of the key personnel.
Facilities
Both JHU and Texas A&M have ample facilities to complete a project such as GMACS: we do
not feel that the project is at risk of being limited by facilities or space to build and test the
instrument. We list these facilities in detail below. At Texas A&M, besides ample lab space that
is well-suited to assemble and test subassemblies of an instrument of the scale of GMACS, we
have access to a very large high-bay space (a former Texas Instruments manufacturing facility
that is now owned by Texas A&M) with a large overhead crane, an ideal location to install our
telescope simulator and to assemble and test an instrument the size of GMACS. We also have
several dark rooms in our lab in which to optically align these subassemblies, appropriate
assembly and measuring tools to test subassemblies during integration, an on-site machine shop
to fabricate parts of the instrument, and myriad useful capabilities within the University
community.
Texas A&M Facilities
Charles R. '62 and Judith G. Munnerlyn Astronomical Laboratory and Space Engineering
Building
4000 square feet of lab space
o Instrument assembly room
Lab benches, storage cabinets
Faro arm-style coordinate measuring machine
Overhead crane
Granite work table
o Three dark rooms
Two 1m x 2m optical table, smaller optical breadboards on wheels
Optical breadboard components and prototyping optics
OBB Monochromator, Newport spectrophotometer
Many commercial CCD imagers
Three 12-inch integrating spheres
GMACS Conceptual Design Report 154
Lasers and assorted illumination devices
o On-site machine shop
CNC mill, standard mill, standard lathe, drill press, bandsaw, grinder,
various handtools
o Electronics assembly area
Electronic components, oscilloscopes, dataloggers, etc.
o Planned Class 10,000 clean room area for optical assembly
3000 square feet of associated office space for lab personnel
o Large conference room
o Videoconferencing equipment
TI Building
High bay space with ~2500 square feet for Astronomical Instrumentation Group lab use
o Coordinate measuring machine with 2m x 1m x 1m envelope (to be located in TI
building)
o Class 10,000 clean room instrument assembly area with overhead crane
o Machine tools
o 50 Ton overhead crane
Physics Department facilities
Large well-equipped machine shop
o New, modern CNC milling machine
Large well-equipped electronics shop
Other on-campus facilities include
o Specialty machining equipment (e.g., wire EDM machine)
o Spectral reflectometer
o Low-temperature chamber
o Rapid prototyping machine
o Glass blowing facility
Johns Hopkins IDG Facilities
High Bay: 2400 square foot of assembly space with 5 Ton overhead crane
Engineering Lab: 2400 square foot with 1 Ton overhead crane
Electronics assembly area
Oscilloscopes, function generators, data logger
Mechanical fabrication area
Drill press, sheet metal sheer, vices, hand power tools
Mechanical assembly space
Benches, storage cabinets
GMACS Conceptual Design Report 155
Computer work stations
Optics lab: 400 square feet
8 foot granite optical bench
Laser unequal path interferometer
Acton SpectraPro monochromator
Cryogenic test chamber
Lenses, optics mounts, linear stages, motorized positioning stages
Machine shop: 2500 square feet
4 CNC mills, 1 CNC lathe, 4 engine lathes
Wire EDM, sink EDM
Sheet metal fabrication tools
Welding station
Clean Rooms: two class 10K clean rooms, 600 sq. Ft. And 300 sq. Ft.
Vibration isolated optical benches
Purge cabinets
Laminar flow benches
Past Projects
As stated above, we do not feel that the small group at Texas A&M poses a risk to the project.
Our design team has worked on many highly successful instrumentation projects in the past
independently: from nearly GMACS-sized instruments on 8m-class telescopes (MODS and
FourStar), to the most productive fiber-fed spectrograph in astronomy, the Sloan spectrographs
(among many other ground- and space-based instruments at JHU), to a long history of optical
and IR instrumentation of all kinds (DePoy at TAMU, formerly Ohio State). Below we give
some representative examples of the work we have done both individually and together; note that
all of these instruments have been designed and/or commissioned in the past ten years.
MODS (DePoy & Marshall, Ohio State now at Texas A&M)
At Ohio State, DePoy was the PI for the two identical Multi-Object Double Spectrographs
(MODS), one for each of the f/15 Gregorian foci of the Large Binocular Telescope (LBT). Each
MODS is a high-throughput optical low- to medium-resolution CCD spectrometer operating in
the 320-1000nm range with a 6.5-arcminute field-of-view. A dichroic distributes the science

GMACS Conceptual Design Report 156
beam into separately-optimized red and blue channels that provide for direct imaging and up to 3
spectroscopic modes per channel. The identical MODS instruments may be operated together
with digital data combination as a single instrument giving the LBT an effective aperture of 11.8-
meter, or separately configured to flexibly use the twin 8.4-meter apertures. Marshall developed
the flexure compensation system for the MODS instrument, a key component to the successful
deployment of MODS on the LBT.
VIRUS (Texas A&M)
Texas A&M is working collaboratively with the University of Texas at Austin (McDonald
Observatory) and Pennsylvania State University on the Hobby-Eberly Telescope Dark Energy
Experiment (HETDEX). Our part of the project is to assemble and align a set of 192 identical
spectrographs. These spectrographs will be fed by nearly 45,000 individual fibers coming from
the focus of the HET. This instrument will be, by far, the world’s largest integral field
spectrograph; it will be used to execute a blind spectroscopic survey of ~500 square degrees of
the sky for Lyman-alpha emission sources at z=2-3. These sources will be analyzed to measure
baryon acoustic oscillations at high redshift, which in turn will tightly constrain the nature of
dark energy at high redshift and the curvature of the Universe. This project has received a
substantial NSF grant (also has almost $25M in funding from private fund raising and the state of
Texas); contact NSF program officer Nigel Sharp for an evaluation of the state of the project.
Sloan Digital Sky Survey (SDSS) Spectrographs (Johns Hopkins)
The Sloan Digital Sky Survey employs twin, multi-object, fiber spectrographs mounted on an
instrument rotator at the Cassegrain focus of the SDSS telescope. The spectrographs operate
over the visible bandpass 370 nm < λ < 1000 nm, utilizing a dual-channel design with a common
reflecting collimator and a dichroic to split the beam into a blue channel and a red channel. In
each channel, just downstream of the dichroic, a transmitting grism disperses the light, which is
imaged by an all-refractive camera onto a CCD. The spectrographs were recently (2008-2009)
upgraded for the Baryon Oscillation Spectroscopic Survey (BOSS). For BOSS, the basic optical
design was retained, however, the ruled gratings were replaced with volume phase holographic
(VPH) gratings and the CCDs were replaced with more modern devices. These improvements
nearly doubled the peak instrumental throughput to ~70%. Additionally, smaller fibers that are a
better match to BOSS targets were installed, which allowed the multi-plex gain to be increased
from 640 (the original SDSS configuration) to 1000 (for BOSS).
The SDSS spectrographs were designed and built by Johns Hopkins University between 1992-
1997. Stephen Smee, who is now the head of the Instrument Development Group at JHU, was
the lead engineer for the spectrographs. Alan Uomoto, now at Carnegie Observatories, was the

GMACS Conceptual Design Report 157
PI. Smee and Uomoto worked closely on the spectrograph development. Systems engineering
and project management were handled by Uomoto, Smee was responsible for the engineering,
design, and construction. Smee and Robert Barkhouser are responsible for the recent
spectrograph upgrades implemented for BOSS.
FourStar (Johns Hopkins & Carnegie Observatories)
FourStar is a recently commissioned (2011) wide-field near infrared camera on the Magellan
Baade telescope at Las Campanas Observatory. The principal investigator is Eric Persson. This
facility-class instrument is mounted at one of two Nasmyth platform ports. The 4096 x 4096
pixel camera covers the J, H, and Ks bands. A straight-through, all-refractive optical design is
used to reimage the telescope focal plane onto the 2 x 2 array of Teledyne HAWAII-2RG
detectors. The camera employs a bi-modal cryogenic optical environment whereby the larger
fore-optics (excluding the window) are cooled to 200 K and the smaller focal plane optics (field-
flatteners and filters) are cooled to the detector operating temperature of 77 K. There are two
filter wheels, accommodating ten filters total. Separate field flatteners are interchanged via a
mechanized wheel to provided appropriate chromatic correction for each of the three broad-band
regimes of the camera: J, H, and Ks.
The development of FourStar (2004-2010) was a collaborative effort between Carnegie
Observatories and the Johns Hopkins University Instrument Development Group. Carnegie
Observatories was the lead institution. The optical design was developed by Stephen Shectman
and detailed by Robert Barkhouser. Stephen Smee was the lead engineer and managed the
detailed engineering of the instrument, exclusive of the focal plane assembly, which was
developed by Carnegie Observatories. The IDG provided optical design and analysis support,
and designed and led the construction of the instrument structure, lens mounts, the instrument
electronics, and the instrument support carts; over 1000 drawings in total, all under configuration
management. In total the IDG managed a separate budget and schedule for its work package,
with regular updates to both provided during the development phase.

GMACS Conceptual Design Report 158
Descope Options
Obvious Descope Options
We are currently considering 2 de-scope options: 1 arm (blue+red) and 2 arms (blue+red). These
two descopes preserve the ultimate nature of the instrument by allowing future upgrades to the
full configuration. They are also straightforward to estimate costs. We find that the cost
estimates for these descope options are (full configuration given for comparison)
• 1-arm cost: $16.7M ($21.6M with estimated contingency)
• 2-arm cost: $24.7M ($32.1M with estimated contingency)
• 4-arm cost: $40.6M ($52.8M with estimated contingency)
The difference is largely due to optics/CCD costs, since the structure is the same for 1-arm and
2-arm. In either approach we would design the entire instrument, but procure only enough parts
to assemble and test the reduced capability set. This would allow straightforward upgrades to the
additional arms in the future.
We have not carefully analyzed potential schedules for the de-scope options, but believe that a 1-
arm instrument would require four years and a 2-arm instrument five years.
Rejected Descope Options
There are several descope options that we do not think are appropriate to consider. We believe
the cost savings for these options is minimal relative to the degradation in performance or
flexibility of the instrument.
Fixed resolution and single grating
One potential option would be to eliminate the availability of a second grating and grating
interchange mechanism. We could adopt a single grating with a dispersion that puts the entire
wavelength range across the detector plane, which of course removes the need to design and
build a grating tilt mechanism. There would be no need to articulate the camera-collimator angle
as well.
The cost savings would be in the form of reduced grating costs and reduced personnel time for
the engineering of the optics modules. We estimate that the gratings costs would go down by
$1100K; the simplicity of the optics module design would save about $1664K. The total cost
reduction would be roughly $2763K.
GMACS Conceptual Design Report 159
The instrument would have substantially less science capability and flexibility under this
scenario. Although it would be possible to change gratings in the instrument to allow for
additional resolutions (perhaps by using replaceable grisms as originally envisioned), the
replacement would be cumbersome and likely require >1 day down time for the instrument
(associated with the reasons we rejected this approach during the design study).
We consider the small cost savings, roughly 7% of the total project budget, is poor relative to the
loss of science capability.
No immediate implementation of a red or a blue channel.
The loss of science flexibility makes this option unattractive. Fully half of the projects
mentioned in the science case would be impossible or severely handicapped by the loss of either
blue or red capability. Cost savings could be large, as the optics and detectors make up the major
part of the project budget. Nonetheless, we feel it would be better to build a one-arm, two
channel, spectrograph than a two- (or four-) arm spectrograph with only the red or blue channels
populated.
Single arm, on-axis, ~8 arcminute field spectrograph
We briefly considered a radical change in the instrument concept that would be a single arm, on-
axis approach. The instrument could have a substantially smaller field-of-view; ~10 arcminutes
or ~100 arcminutes2 of coverage could be accommodated, which would not necessarily require
the use of the wide-field corrector. The implementation of this option could result in significant
savings for the GMT project, since the wide-field corrector optics would no longer be required.
We estimate the cost of this option would be approximately equal to the ―1-arm cost‖ given
above: ~$20M (~$25M with contingency).
We believe that this option remains viable in a funding constrained environment and that we
could adapt our 1-arm design to this configuration. However, we believe that this would not be
in the best interest of the GMT as this approach would dramatically reduce the possibility of
fully exploiting the wide-field uniqueness of the telescope. We note that this option would allow
the GMT to be competitive with TMT for survey-type projects, since the A product would be
roughly equal.
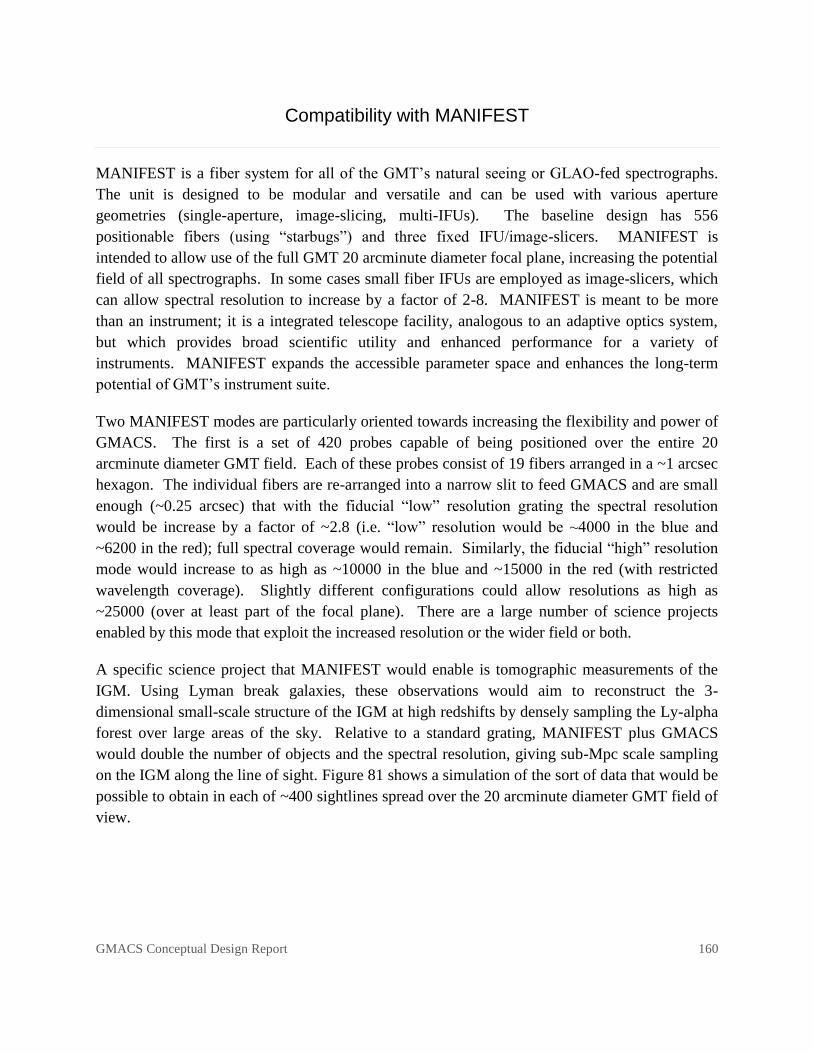
GMACS Conceptual Design Report 160
Compatibility with MANIFEST
MANIFEST is a fiber system for all of the GMT’s natural seeing or GLAO-fed spectrographs.
The unit is designed to be modular and versatile and can be used with various aperture
geometries (single-aperture, image-slicing, multi-IFUs). The baseline design has 556
positionable fibers (using ―starbugs‖) and three fixed IFU/image-slicers. MANIFEST is
intended to allow use of the full GMT 20 arcminute diameter focal plane, increasing the potential
field of all spectrographs. In some cases small fiber IFUs are employed as image-slicers, which
can allow spectral resolution to increase by a factor of 2-8. MANIFEST is meant to be more
than an instrument; it is a integrated telescope facility, analogous to an adaptive optics system,
but which provides broad scientific utility and enhanced performance for a variety of
instruments. MANIFEST expands the accessible parameter space and enhances the long-term
potential of GMT’s instrument suite.
Two MANIFEST modes are particularly oriented towards increasing the flexibility and power of
GMACS. The first is a set of 420 probes capable of being positioned over the entire 20
arcminute diameter GMT field. Each of these probes consist of 19 fibers arranged in a ~1 arcsec
hexagon. The individual fibers are re-arranged into a narrow slit to feed GMACS and are small
enough (~0.25 arcsec) that with the fiducial ―low‖ resolution grating the spectral resolution
would be increase by a factor of ~2.8 (i.e. ―low‖ resolution would be ~4000 in the blue and
~6200 in the red); full spectral coverage would remain. Similarly, the fiducial ―high‖ resolution
mode would increase to as high as ~10000 in the blue and ~15000 in the red (with restricted
wavelength coverage). Slightly different configurations could allow resolutions as high as
~25000 (over at least part of the focal plane). There are a large number of science projects
enabled by this mode that exploit the increased resolution or the wider field or both.
A specific science project that MANIFEST would enable is tomographic measurements of the
IGM. Using Lyman break galaxies, these observations would aim to reconstruct the 3-
dimensional small-scale structure of the IGM at high redshifts by densely sampling the Ly-alpha
forest over large areas of the sky. Relative to a standard grating, MANIFEST plus GMACS
would double the number of objects and the spectral resolution, giving sub-Mpc scale sampling
on the IGM along the line of sight. Figure 81 shows a simulation of the sort of data that would be
possible to obtain in each of ~400 sightlines spread over the 20 arcminute diameter GMT field of
view.
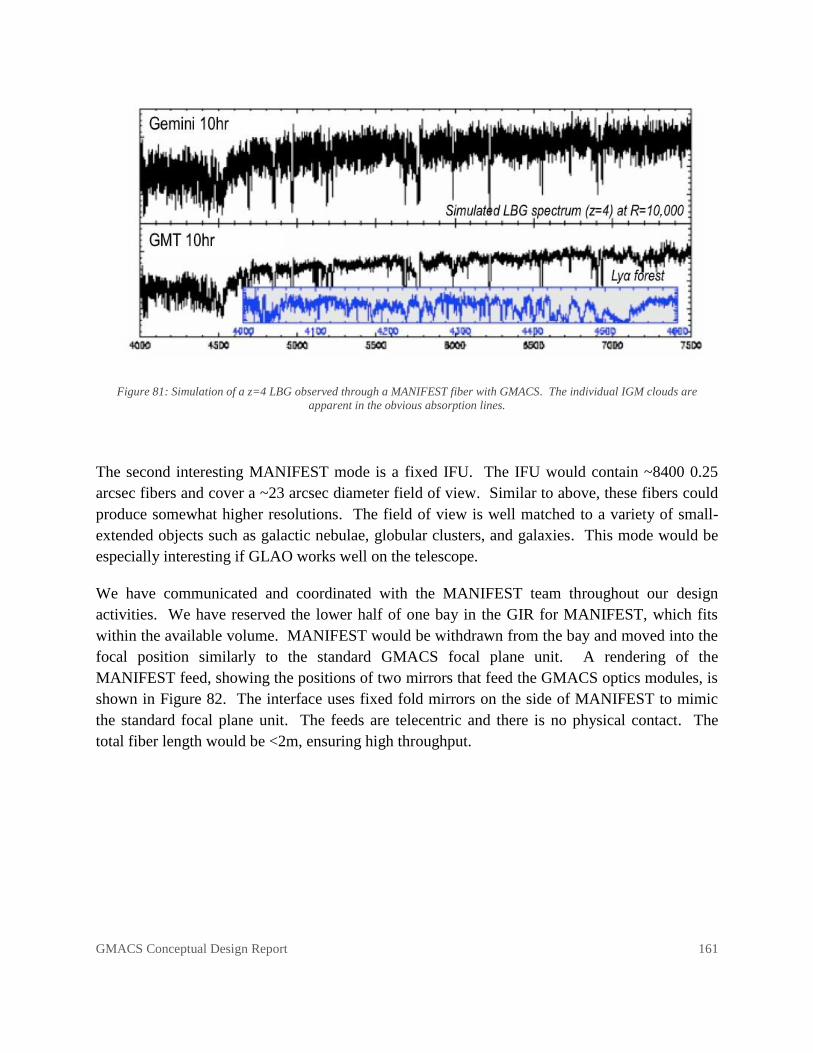
GMACS Conceptual Design Report 161
Figure 81: Simulation of a z=4 LBG observed through a MANIFEST fiber with GMACS. The individual IGM clouds are
apparent in the obvious absorption lines.
The second interesting MANIFEST mode is a fixed IFU. The IFU would contain ~8400 0.25
arcsec fibers and cover a ~23 arcsec diameter field of view. Similar to above, these fibers could
produce somewhat higher resolutions. The field of view is well matched to a variety of small-
extended objects such as galactic nebulae, globular clusters, and galaxies. This mode would be
especially interesting if GLAO works well on the telescope.
We have communicated and coordinated with the MANIFEST team throughout our design
activities. We have reserved the lower half of one bay in the GIR for MANIFEST, which fits
within the available volume. MANIFEST would be withdrawn from the bay and moved into the
focal position similarly to the standard GMACS focal plane unit. A rendering of the
MANIFEST feed, showing the positions of two mirrors that feed the GMACS optics modules, is
shown in Figure 82. The interface uses fixed fold mirrors on the side of MANIFEST to mimic
the standard focal plane unit. The feeds are telecentric and there is no physical contact. The
total fiber length would be <2m, ensuring high throughput.
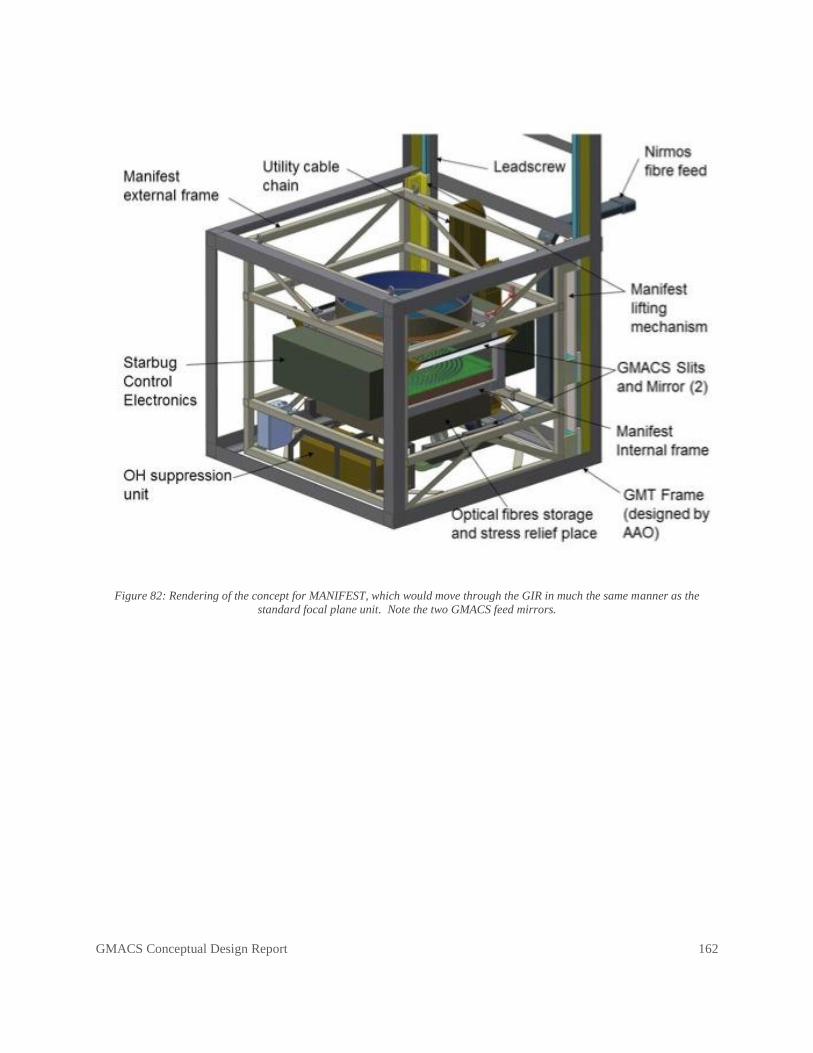
GMACS Conceptual Design Report 162
Figure 82: Rendering of the concept for MANIFEST, which would move through the GIR in much the same manner as the
standard focal plane unit. Note the two GMACS feed mirrors.
GMACS Conceptual Design Report 163
Conclusions
We believe we have executed all the tasks required to develop a solid conceptual design for a
wide-field, multi-object, moderate resolution optical spectrograph for the GMT. The scientific
potential of the instrument is substantial and we believe that the range of specific science cases
we have developed demonstrate that GMACS will have impact across most of modern
astrophysics. If historical precedent is a guide, then GMACS will be one of the most heavily
used and popular instruments on the GMT.
The conceptual design of the instrument is soundly established and we feel we have mitigated
the most serious technical risks. The optical design performs well and all the individual elements
can be fabricated. The mechanical design of the instrument fits within the allocated volume and
is based on heritage. Suitable detectors are available now for the instrument as well. We have
an excellent team and adequate facilities to design, fabricate, assemble, and test an instrument of
this size and scale. The main remaining technical risk is the development of the flexure
compensation system, but we feel we have good concepts for the mitigation scheme.
The most worrisome remaining risks relate to cost and schedule control. We have developed a
management plan that relies on professional project managers with experience with similar
programs to mitigate these risks. We have developed initial cost estimates based on vendor
responses and team experience. Most of the cost of the instrument is in optics and detectors; we
have assigned zero probability to the lower half of all vendors cost estimates and taken the mid-
point as the best estimate. Our contingency level is based on the upper limit of these same
vendor estimates.
We have identified some obvious de-scope options for the instrument and presented cost
estimates. Although these reduce the capabilities of the instrument, they do so in a way so as to
allow for future upgrades. Essentially, we would design and build the entire instrument, but
populate only part with optics and detectors. The savings could be substantial, but the cost will
be in observing time for nearly all the identified science projects.
We feel our team and the instrument design is ready to move to the next stage, in which we
would refine the design and build prototypes of the mechanisms and structure. The performance
of the prototypes will be compared to specific technical requirements that will be drawn from the
fiducial science cases. We are excited and energetic about creating this instrument for GMT.
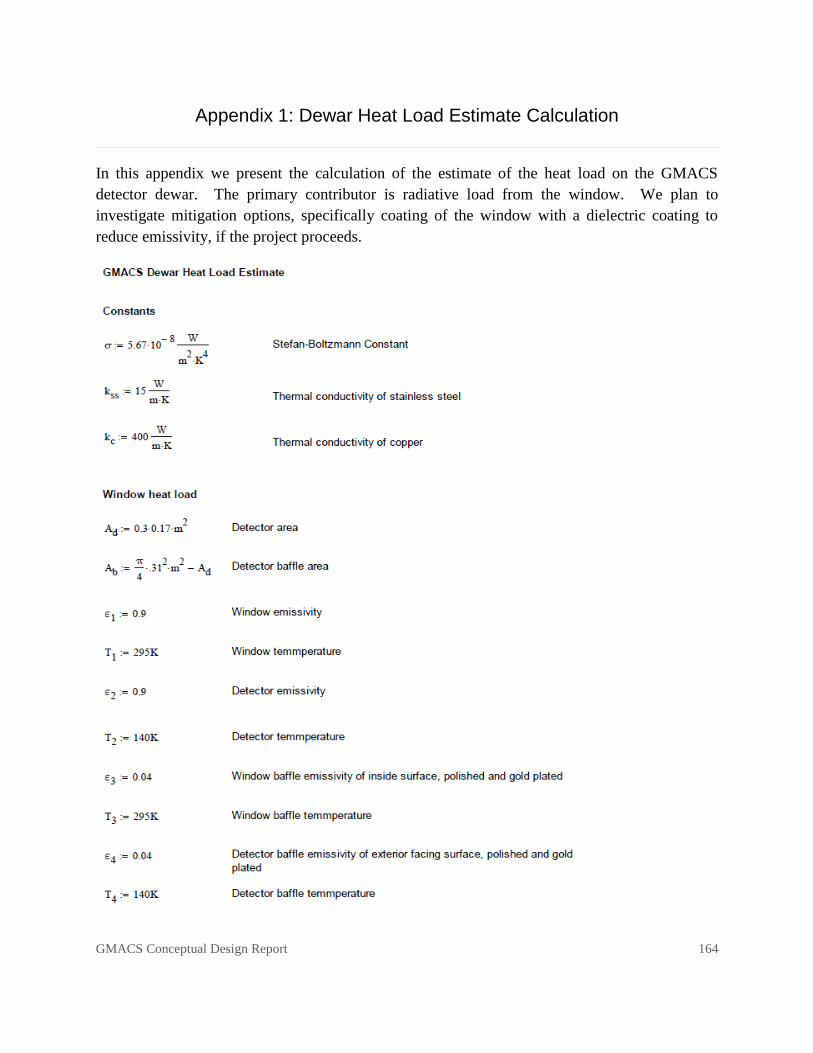
GMACS Conceptual Design Report 164
Appendix 1: Dewar Heat Load Estimate Calculation
In this appendix we present the calculation of the estimate of the heat load on the GMACS
detector dewar. The primary contributor is radiative load from the window. We plan to
investigate mitigation options, specifically coating of the window with a dielectric coating to
reduce emissivity, if the project proceeds.

GMACS Conceptual Design Report 165
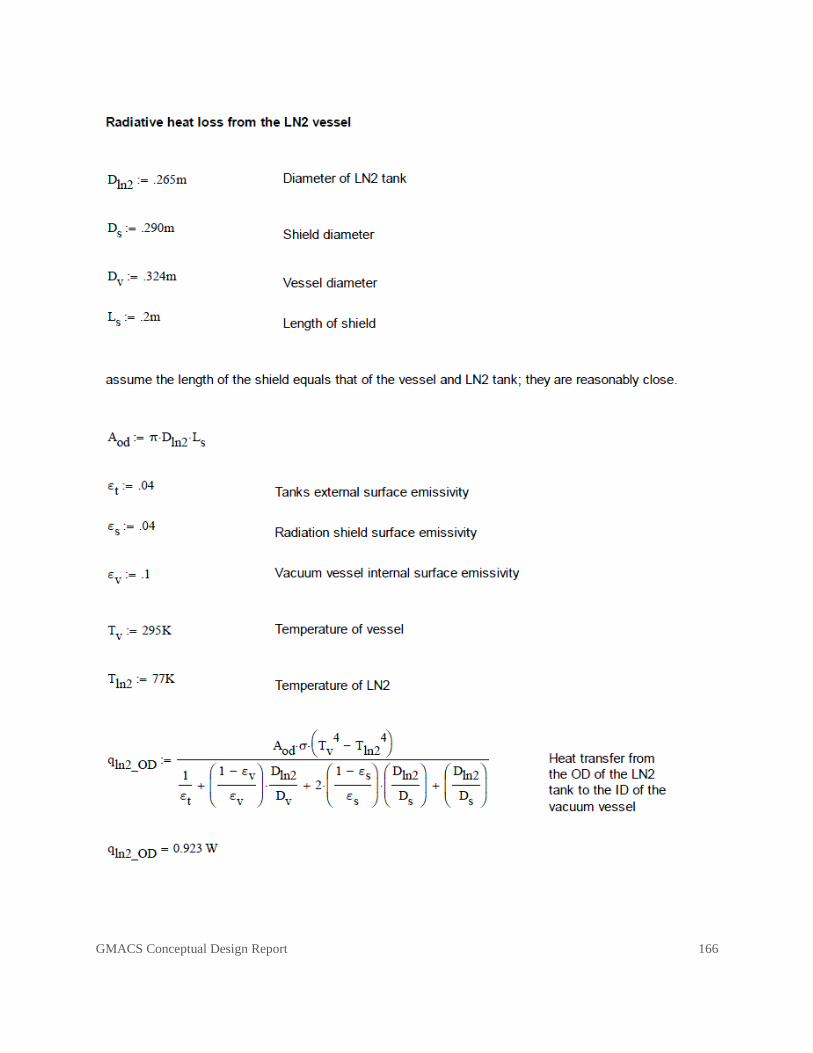
GMACS Conceptual Design Report 166
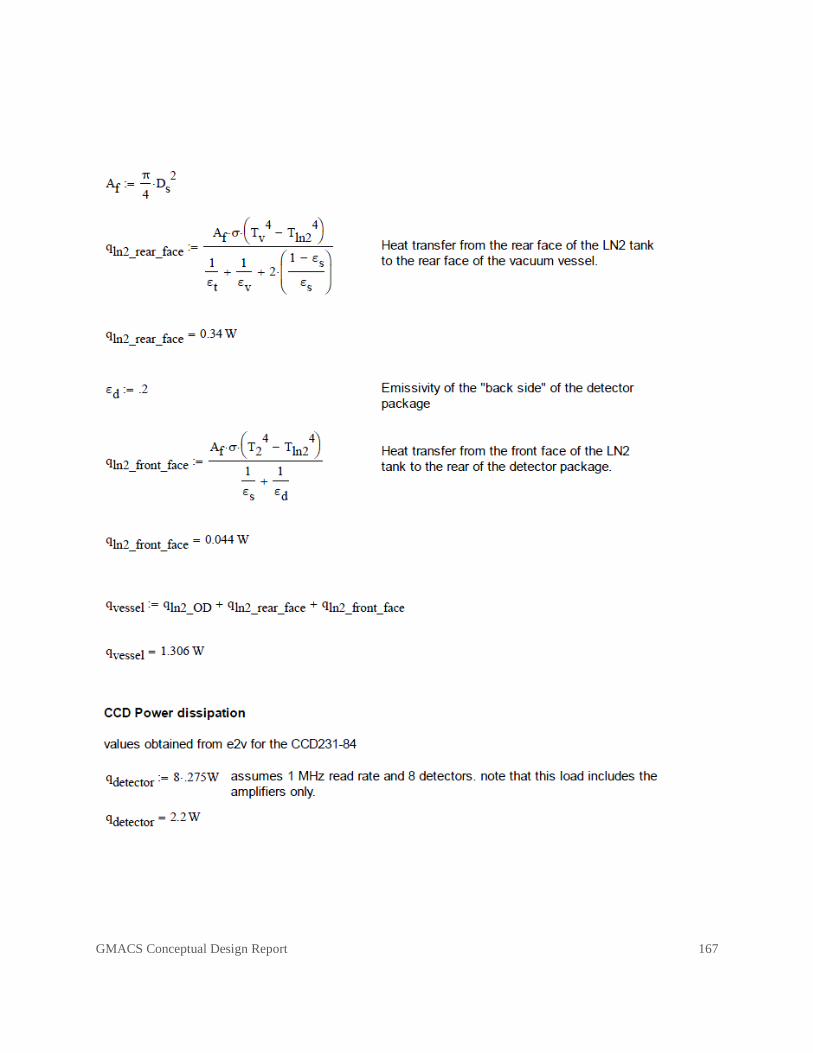
GMACS Conceptual Design Report 167
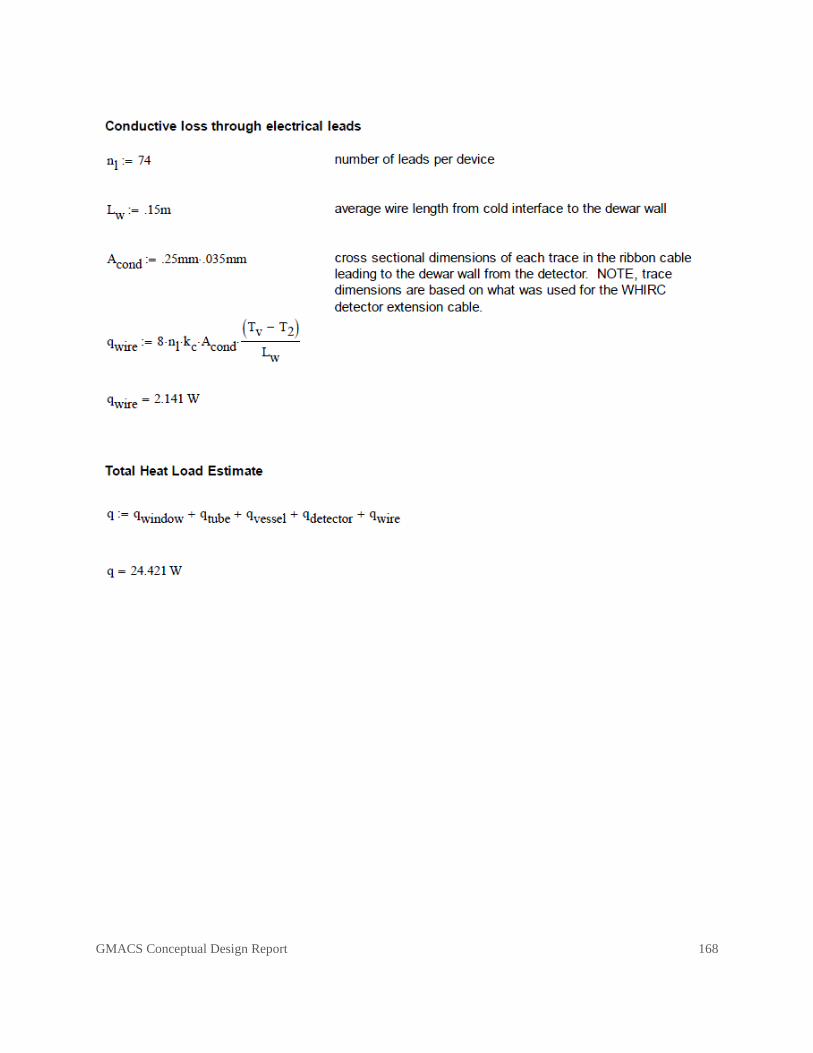
GMACS Conceptual Design Report 168

GMACS Conceptual Design Report 169
Appendix 3: Selected Team Biographical Sketches
Texas A&M University
D. L. DePoy (Principal Investigator)
Darren DePoy was an undergraduate at MIT where he helped to build one of the first digital
cameras used in astronomy, employing then new CCD technology. He attended graduate school
at the University of Hawaii at Manoa where he worked on developing infrared instrumentation,
including some of the first multi-element infrared spectrographs ever built. DePoy then became
an NOAO Fellow at Kitt Peak National Observatory and Cerro Tololo Inter-American
Observatory, successively. At both observatories he worked on creating instruments using a new
generation of infrared array detectors, providing capabilities that were unobtainable with
previous technologies. In 1990, DePoy became a professor in the Astronomy Department at
Ohio State University. Until 2008 he led the instrumentation group at Ohio State; during this
time his instrumentation team built the first cross-dispersed infrared spectrometer, an infrared
imaging spectrograph, cameras capable of observing at optical and infrared wavelengths
simultaneously, and many other smaller projects. He was the Principal Investigator and Project
Scientist for the MODS spectrograph, an instrument that required significant technology
development and detailed project management. DePoy moved to Texas A&M University in 2008
to be the first Rachal/Mitchell/Heep Professor of Physics. There he has developed an
astronomical instrumentation group at Texas A&M in a new building renovated especially for
that purpose (described below). He is currently the Project Scientist for the Dark Energy
Camera, a major DOE/NSF initiative to measure dark energy parameters. His group is currently
working on building spectrographs for the HETDEX project, designing a large optical
spectrograph for the Giant Magellan Telescope, working on a variety of spectrophotometric
calibration instruments for the Dark Energy Survey and the LSST, and other smaller projects.
J. L. Marshall (Project Scientist)
Jennifer Marshall has been an Assistant Research Scientist at Texas A&M University since
2008. She oversees day-to-day operation of the Astronomical Instrumentation Group. This
involves managing the activities of the engineering, technical, and student lab staff. She leads
the effort to construct the VIRUS spectrograph at Texas A&M, a new integral-field optical
spectrograph for the HET that consists of 192 copies of a simple fiber-fed instrument to support
the HET Dark Energy Experiment. Recently she has provided project management and scientific
support for a conceptual design study for the GMACS spectrograph, a wide-field, multi-object

GMACS Conceptual Design Report 170
optical spectrograph for the Giant Magellan Telescope. Marshall came to Texas A&M in 2008
from Carnegie Observatories, where she was a Carnegie Instrumentation Fellow and worked
with Shectman on deploying the Magellan Echellette (MagE) spectrograph at the Magellan
telescopes and participated in the design process of the FourStar infrared imager for Magellan.
She was a graduate student at The Ohio State University, where among other things she designed
the flexure compensation system for and participated in the design process of the MODS
spectrograph for the LBT.
Casey Papovich (Project Scientist)
Project Scientist Casey Papovich is an Assistant Professor of Physics and Astronomy and a
member of the Mitchell Institute for Fundamental Physics and Astronomy at the Texas A&M
University. He did his doctoral research at the Johns Hopkins University and the Hubble Space
Telescope Science Institute, earning his PhD in 2002. From 2002-2005 he worked as a
postdoctoral fellow with the Spitzer/MIPS instrument team at the University of Arizona. From
2005-2008 he held one of NASA's prize Spitzer Postdoctoral Fellowships. He is an expert on the
properties of distant galaxies, and he has been involved with multiple deep, extragalactic surveys
using NASA's Great Observatories and ground-based telescopes. He is currently the PI of
SHELA, a large program with the Spitzer Space Telescope to image deeply a large portion of the
sky in the infrared. He is the author or co-author of more than 260 peer-reviewed publications,
with more than 10,000 citations.
Travis Prochaska (Mechanical Engineer)
Travis Prochaska is the lead Mechanical Engineer in the Texas A&M Astronomical
Instrumentation Group. Travis has worked in the lab since January 2010 and has assisted with
the lab’s mechanical and opto-mechanical design needs. This includes designing and building
systems and components for telescopes, spectrographs and calibration systems for various
projects. His work on the HETDEX project, a collaboration with the University of Texas,
includes optimizing the design of the 192 VIRUS spectrographs for ease of assembly,
manufacturability and cost. He has worked on various assembly and alignment fixtures for many
of VIRUS’s sub-assemblies. He is also working on the conceptual design study of GMACS, a
proposed optical spectrograph for the GMT. For this project he has modeled concepts for optical
housing modules and mechanical transport systems, in collaboration with engineers at Johns
Hopkins University. Travis has also been involved in small projects affiliated with the DECam
project. These include CCD camera mounts for the DECam focusing unit, a new secondary
mirror mount for PRECam at the Curtis-Schmidt Telescope, and the flat field screen and
instrument mounting for DECam’s calibration system.
GMACS Conceptual Design Report 171
Johns Hopkins University
Stephen Smee, Ph.D. (Chief Mechanical Engineer, IDG Manager/Associate Research Scientist)
Stephen started at JHU in 1993 and was the lead engineer for the SDSS multi-object fiber
spectrographs between 1993 and 1996. In 1996 he transitioned to the Far Ultraviolet
Spectroscopic Explorer (FUSE) program where he was the lead optomechanical engineer for the
instrument optical end-to-end test. In 2002, after receiving a Ph.D. in mechanical engineering
from the University of Maryland, he returned to JHU as the manager of the IDG. Since then he
has played key technical and managerial roles in several instrument projects including: the
Multi-Analyzer Crystal Spectrometer for NIST; the WIYN high resolution near infrared camera
(WHIRC); FourStar, a near infrared imager for the Magellan telescope; APOGEE, a high
resolution near infrared multi-object fiber spectrograph; WFMOS a moderate resolution visible
multi-object fiber spectrograph; and upgrades to the SDSS multi-object fiber spectrographs. He
is currently managing and contributing to the technical development two cryogenic
photogrammetry metrology systems for the James Webb Space Telescope.
Robert Barkhouser (Optical Engineer)
Robert started at JHU in 1988 as a project engineer for the JHU Adaptive Optics Coronagraph.
He later transitioned to the Hopkins Ultraviolet Telescope (HUT) program where he worked on
the instrument integration and testing for the Astro-1 and Astro-2 space shuttle missions. In
1996 he joined the FUSE team and played a key role in the optical testing of the FUSE telescope
mirrors. He also provided optical analysis support for the FUSE optical end-to-end test. In 1998
Robert joined the IDG. Since that time Robert has provided optical engineering support for
several space programs including: FUSE, GALEX (Cal Tech), and New Horizons (APL). He
has designed, or provided design support, for many ground based instruments including: the
Apache Point InfraRed spectrograph; the WIYN High resolution InfraRed Spectrograph
(WHIRC); FourStar, a near infrared imager for the Magellan telescope; APOGEE, a high
resolution near infrared multi-object fiber spectrograph; WFMOS a moderate resolution visible
multi-object fiber spectrograph; and upgrades to the SDSS multi-object fiber spectrographs. He
is currently the lead optical designer for a day/night vision laser range finder being developed by
the Johns Hopkins Applied Physics Lab in partnership with several commercial partners.

GMACS Conceptual Design Report 172
Carnegie Observatories
Stephen Shectman
Stephen Shectman has been a staff member of the Carnegie Observatories since 1975. While he
was a postdoc at the University of Michigan he developed the Reticon photon-counting
spectrometer in collaboration with W. A. Hiltner. At Carnegie he was responsible for the
development of several generations of photon-counting detectors which were used in
spectrographs at Mount Wilson, Palomar, Las Campanas and several other observatories,
including for the CFA redshift survey.
Shectman developed the echelle spectrograph for the 2.5-m duPont telescope at Las Campanas,
as well as the multi-object fiber spectrograph for that telescope. Shectman served as the project
scientist for the Magellan telescopes for the full duration of the project, and was responsible for
the optical design of the telescopes, including the wide-field corrector/ADC and the extremely
wide-field collimator for the IMACS instrument. He was a collaborator on the construction of
the MIKE echelle spectrograph, the MagE echellette spectrograph, and the PFS precision radial
velocity spectrograph. Shectman was responsible for the optical design of the PANIC and
FourStar infrared reimaging cameras.
Shectman has used this instrumentation to conduct redshift surveys of galaxies in order to study
clustering and large scale structure, including the survey which resulted in the discovery of the
Bootes void, and Las Campanas Redshift Survey. He has also used this instrumentation to
conduct surveys for metal-poor stars in the galactic halo, including the BPS survey and follow-
up spectroscopy of the HES survey.