gmat integrated reasoning practice paper graphical
TRANSCRIPT

GMAT INTEGRATED REASONING PRACTICE
PAPER
GRAPHICAL REPRESENTATION
QUESTION 1
The bar chart above includes the 10 most populated countries in the world based on estimated 2010 population, and
includes bars for the approximate population of each country, in millions, in the years 2000 and 2010.
Use the drop down menus to fill in the blanks in each of the following statements based on the information given by
the bar chart.
The ratio of the 2010 total population of the 2 most populated countries to that of the remaining 8 countries
is___________.
A. greater than 1
B. approximately equal to 1
C. less than 1
The percentage increase in total population of the two most populated countries from 2000 to 2010 was closest
to____________.
A. 5%
B. 15%
C. 25%
D. 35%
QUESTION 2
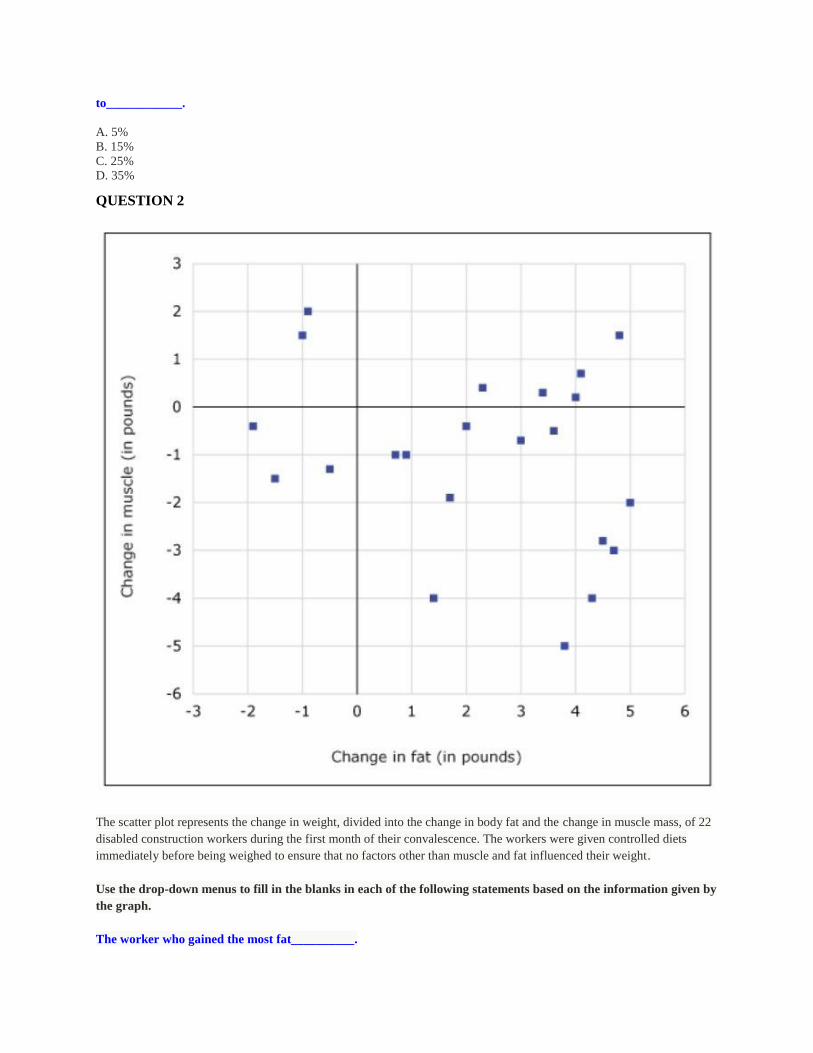
The scatter plot represents the change in weight, divided into the change in body fat and the change in muscle mass, of 22
disabled construction workers during the first month of their convalescence. The workers were given controlled diets
immediately before being weighed to ensure that no factors other than muscle and fat influenced their weight.
Use the drop-down menus to fill in the blanks in each of the following statements based on the information given by
the graph.
The worker who gained the most fat__________.

A. lost fewer pounds of muscle than he gained of fat
B. lost more pounds of muscle than he gained of fat
C. gained fewer pounds of muscle than he gained of fat
D. gained more pounds of muscle than he gained of fat.
Approximately__________percent of the 22 workers lost weight during the study.
A. 8
B. 15
C. 35
D. 48
E. 65
QUESTION 3
The chart shows a firm’s complete time-and-task schedule for the marketing team, planning team, and development team
involved in the launching of a new product.
Based on the information in the graph, select from each drop-down menu the option that creates the most accurate
statement.
1. To the nearest 5 percent, the number of weeks the development team has at least one task scheduled
is____________percent of the total duration represented by the chart.

A. 35
B. 40
C. 50
D. 55
E. 60
2. Week____________is the only week during which three different tasks are scheduled to begin.
A. 6
B. 7
C. 8
D. 9
E. 10
QUESTION 4


The diagram to the left is an image of the layers of the earth's atmosphere. It shows the approximate height from sea level
of the borders between layers, and it includes several vehicles and atmospheric occurrences within those layers as points of
reference.
Use the drop-down menus to complete each statement as accurately as possible on the basis of the information
provided.
The stratosphere makes up most nearly___________percent of the height of the atmosphere.
A. 4
B. 10
C. 32
D. 80
If the reference objects in the diagram can exist only in the layer in which they are drawn but can appear anywhere
within that layer, the closest that a weather balloon and an aurora could come to one another
is____________kilometers.
30
62
640
672
QUESTION 5
The graph above is a timeline that chronicles selected events in the development of computers.
Use the drop-down menus to fill in the blanks in each of the following statements based on the information given by

the graph
Approximately_____________passed between the time consumer computers were first available and the time the
first home computer with a GUI was introduced. The time between the introduction of the Mark 1 and ARPAnet is
approximately___________the time between the introduction of the integrated circuit and MS-DOS.
First Blank
A. 5 years
B. 10 years
C. 15 years
D. 40 years
Second Blank
A. one-fourth
B. half
C. twice
D. equal to
MULTI SOURCE REASONING
Question 1
Tab 1: Primary Election
From a recent news article about the primary election for the Domestic Party
In yesterday's primary election for the nomination of the Domestic Party for the vacant town council seat, Amy Baerga
won with 80 votes and will go on to the general election next month. The other two candidates, Sheldon Aaronson and
Anil Chouhary received 60 votes and 45 votes, respectively. The party's recent change in voting procedure, allowing
members of the party who fill out a ballot to vote for either one or two of the candidates, appears to have helped assure
victory for the party's up-and-comer. 15 of the people who voted for Aaronson also voted for Baerga, and 20 of the people
who voted for Chouhary also voted for Baerga. A total of 90 voters voted for at least one of the two establishment
candidates, Aaronson and Chouhary. In what officials are calling a disappointing turnout, only 3/5 of the members of the
Domestic Party filled out a ballot for this primary election.
Tab 2: General Election
From an email sent to Baerga from her campaign manager after learning the results of the general election
We had predicted that due to the presence of four candidates as well as the fact that voters can only vote for one candidate,
your percentage of the votes would decrease from what you had received in the primary election. It seems our prediction
was correct. I was just told by an election official that of the 900 votes cast, Tom Goodwin received 24%, Pamela Hart
received 18%, and Bill Iha received 30%.
1. Consider each statement. Indicate whether the statement about the primary election is true or false based on the
information provided.

True False Statements
The Domestic Party has 225 members
During the primary election, Amy Baerga received 1/3 of the votes she received during the general
election.
In the Domestic Party primary election, 1/4 of the people who voted for Sheldon Aaronson also voted
for Amy Baerga.
2. For each statement, determine whether the statement can be inferred from the information above. Select Yes if
the statement can be inferred. Otherwise, select No.
Yes No Statements
Amy Baerga received more votes during her primary election than did Tom Goodwin during his primary
election.
Amy Baerga received more votes than did any other candidate in the general election.
Bill Iha received 270 votes in the general election.
3. Consider each statement. Indicate whether the statement about the primary election is true or false based on the
information provided.
True False Statements
45 people voted exclusively for Amy Baerga.
20 people voted for both Sheldon Aaronson and Anil Chouhary.
A total of 125 voters voted for Sheldon Aaronson, Amy Baerga, or both Aaronson and Baerga.
QUESTION 2
Techniques: Island Museum analyzes historical artifacts using one or more techniques described below—all but one of which is
performed by an outside laboratory—to obtain specific information about an object’s creation. For each type of material
listed, the museum uses only the technique described:
Animal teeth or bones: The museum performs isotope ratio mass spectrometry (IRMS) in-house to determine the ratios of
chemical elements present, yielding clues as to the animal’s diet and the minerals in its water supply.
Metallic ores or alloys: Inductively coupled plasma mass spectrometry (ICP-MS) is used to determine the ratios of traces
of metallic isotopes present, which differ according to where the sample was obtained.
Plant matter: While they are living, plants absorb carbon-14, which decays at a predictable rate after death; thus
radiocarbon dating is used to estimate a plant’s date of death.

Fired-clay objects: Thermoluminescence (TL) dating is used to provide an estimate of the time since clay was fired to
create the object.
Artifacts: Island Museum has acquired a collection of metal, fired clay, stone, bone, and wooden artifacts found on the Kaxna
Islands, and presumed to be from the Kaxna Kingdom of 1250–850 BC. Researchers have mapped all the mines, quarries,
and sources of clay on Kaxna and know that wooden artifacts of that time were generally created within 2 years after tree
harvest. There is, however, considerable uncertainty as to whether these artifacts were actually created on Kaxna.
In analyzing these artifacts, the museum assumes that radiocarbon dating is accurate to approximately ±200 years and TL
dating is accurate to approximately ±100years.
Budget: For outside laboratory tests, the museum’s first-year budget for the Kaxna collection allows unlimited IRMS testing, and a
total of $7,000—equal to the cost of 4 TL tests plus 15 radiocarbon tests, or the cost of 40 ICP-MS tests—for all other
tests. For each technique applied by an outside lab, the museum is charged a fixed price per artifact.
Question #1
Which one of the following pieces of information would, on its own, provide the strongest evidence that the given
artifact was actually produced on Kaxna?
A. A radiocarbon date of 1050 BC for a wooden bowl
B. IRMS analysis of a necklace made from animal bones and teeth
C. A TL date for a fired-clay brick that places it definitively in the period of the Kaxna Kingdom
D. ICP-MS analysis of a metal tool that reveals element ratios unique to a mine on Kaxna
E. Determination that a stone statue was found near a quarry known to produce stone statues during the Kaxna Kingdom
Question #2
For each of the following combinations of Kaxna artifacts, select Yes if, based on the information provided, the cost
of all pertinent techniques described can be shown to be within the museum's first-year Kaxna budget. Otherwise,
select No. Attachment:

Question #3
For each of the following artifacts in the museum’s Kaxna collection, select Yes if, based on the museum’s
assumptions, a range of dates for the object’s creation can be obtained using one of the techniques in the manner
described. Otherwise, select No.
Yes No Values
Bronze statue of a deer
Fired-clay pot
Wooden statue of a warrior
Question #4
For each of the following results of tests performed on Kaxna artifacts, select Yes if, based on the museum’s
assumptions, the result confirms that the artifact was created during the time of the Kaxna Kingdom. Otherwise,
select No. Yes No
Yes No Values
Bone necklace shown by IRMS to have element
ratios characteristic of artifacts known to be from
the Kaxna Kingdom
Fired-clay jug dated to 1050 BC by TL dating
Copper box shown by ICP-MS to have the same
ratio of trace metals found in the copper mines of
Kaxna
Question #5
For each of the following combinations of Kaxna artifacts, select Yes if, based on the information provided, the cost
of all pertinent techniques described can be shown to be within the museum’s first- year Kaxna budget. Otherwise,
select No.
Yes No Values
2 bone implements and 5S fired-clay cups decorated with gold
7 wooden statues and 20 metal implements
15 wooden statues decorated with bone
Question #6
Among the Kaxna artifacts is a wooden box containing both a small fired-clay bead and some river sediment
containing clay and plant matter. Based on the museum’s assumptions, which one of the following details about the
bead can be determined by applying one of the tests in the manner described?
A. A range of dates for its manufacture
B. The Kaxna island on which it was made
C. Vegetation patterns near the workshop where it was made
D. A range of dates for its placement in the box
E. The source of clay used to make the bead
QUESTION 3
Marketing Executive An American museum of East Asian art reviewed its acquisitions strategy in 2009. As part of that review, a marketing
executive recommended purchasing more ceramics, jades, and paintings of people or landscapes because visitor surveys
indicated that those types are of greatest interest to museumgoers in the region.
Museum’s curator The museum’s curator recommended purchasing more twenty-first-century East Asian art—particularly abstract
(nonrepresentational) paintings and sculptures—because the museum’s collection is weakest in that area.
Among the East Asian works of art described below, select a painting and a sculpture, each of which satisfies at
least one of the recommendations made by the marketing executive and at least one of the recommendations made
by the curator. Make only two selections, one in each column.
A. Painting of girl’s face, in shades of blue and red, acrylic and oil on canvas, 2006
B. Chinese brush painting of fish in a tank, ink on paper, 2002
C. Fish-shaped vase with dragon head, jade, 1849
D. Abstract sequence of interconnected curves, ceramic, 2008
E. Fossil-like, jagged sculpture suspended from cables, stainless steel, aluminum, fiberglass, and cable, 2004
QUESTION 4
Tab 1: Email #1
E-mail from Chief Information Officer to Chief Operating Officer
Between 2008 and 2011, the number of Problem Reports (reports of computers affected by viruses or malware) has gone
up significantly, although the company still has approximately 1,000 computers in service, just as it did in 2008.
We have performed an investigation as to the cause of the problems and determined that the increase in the Problem
Reports occurred after many company employees began using a non-recommended browser (a browser other than Browser
A) as their default Internet browser. I recommend that all employees be required to use the same default browser in order
to reduce these risks.

Tab 2: Attachment
Tab 3: Email #2
E-mail from Information Security Officer to Chief Information Officer
I think the increase in Problem Reports has something to do with company employees who changed their default Internet
browser to something other than Browser A. In 2011, we only had 140 Problem Reports from computers using Browser A,
a decrease of 20% from 2008, while the annual number generated by the computers using a non-recommended browser
went up to 200, an increase of 60% from 2008.
1. Consider each of the following statements. Based on the company's data, is the statement true or false?
True False
The number of Problem Reports generated per computer using Browser A increased by 40% from 2008
to 2011.
The number of Problem Reports generated per computer using a non-recommended browser decreased
by 20% from 2008 to 2011.
In 2011, computers using Browser A generated 20% more Problem Reports per computer than did
computers using non-recommended browsers.
2. What was the probability in 2008 that a Problem Report selected at random would be related to a computer
using Browser A?
A. 1 out of 3
B. 5 out of 12

C. 1 out of 2
D. 7 out of 12
E. 2 out of 3
QUESTION 5
Tab 1: Article
The following is an article in a medical journal by researchers at Albion University.
We have conducted a recent study with mice that indicates that Virus Alpha is contagious in a subject up to 3 weeks after
infection. This result was found by placing recovering mice, which had been infected more than two weeks prior, into
healthy mice communities. More than half of the healthy communities then developed a Virus Alpha outbreak. This
finding belies our earlier hypothesis, which posited that Virus Alpha was reduced by the immune system to non-
contagious levels in the subject within 1 week of infection. Clearly, this means that we must re-visit our response to Virus
Alpha, especially with regards to citizen outreach. To ensure the most prompt public notice, our research team plans to
send a service announcement to the major web-based news magazines, radio stations, and television networks with
recommendations about methods of prevention, when and how to avoid contagion, and symptom recognition.
Tab 2: Blog Entry
The following is an entry in the blog Communications and Culture.
A major drawback of the Information Revolution is the ease with which an unfounded panic spreads. There is a tendency
in our culture to try to prepare for every single contingency; any report of bad news, however small, triggers an avalanche
of "preparedness recommendations". This situation is exacerbated by a litigious culture in which "misfortune" becomes
regularly redefined as "culpability." Because no agency wants to be liable for withholding crucial facts, information on
every new health risk is disseminated almost as soon as it is discovered, many times without much verification. Too often
this data becomes inflated via the rumor-mill of the Internet into a "crisis" or "epidemic," causing lowered productivity as
workers stay home from fear of infection, and medicine shortages as shoppers make runs on pharmacies. Thus, attempts
by the health industry to educate the citizenry via the Internet and newsfeeds result in less public security, not more.
1. For each of the following questions, indicate whether the answer to the question can be found in the texts
provided.
Yes No
How long would it take for someone to become infected with Virus Alpha?
What is one component of the researchers' proposed public service announcement about the virus?
Why do people panic when confronted with information about viral contagion?
2. For each statement, indicate whether it provides an assumption necessary to the conclusion of the blog
post.
Yes No

Responses to public health announcements should always be anticipated by the leaders of the
health industry.
It is more important to provide health alerts to the workers in a society than to the consumers.
The public does not quickly receive balanced and correct information via the Internet to
counteract exaggerated speculations and rumors.
TABLE ANALYSIS
QUESTION 1 The table below contains figures pertaining to a number of car service companies. The table shows years of service,
vehicle turnover, and general operating data such as revenue, insurance, accident numbers, and number of drivers. The
table also shows each company's consumer rating, with "awful" being the worst and "excellent" being the best.
Car
Service
Compan
y
Years
in
Servic
e
Consum
er
Rating
Vehicl
es
Added
per
Year
Vehicl
es
Retire
d
per
Year
Numbe
r
of
Drivers
Annual
Gross
Revenue
Annual
Insurance
Costs
Accide
nts
per
Year
BCC
Touring 28 Excellent 26 20 30 450875 12764 2
Bee There 32 Subpar 36 34 40 149437 10098 16
Deals on
Wheels 23 Average 32 31 52 229774 9856 11
Get a Way 17 Subpar 18 17 42 126250 6425 15
Hasty
Retreat 40 Excellent 29 22 32 472836 14268 3
Reliable
Rides 25 Good 21 17 28 337255 9790 8
Toll
Traversers 19 Average 16 14 24 199850 9652 12
Wrecks for
Rent 45 Awful 8 8 51 97265 15364 24
Each column of the table can be sorted in ascending order by clicking on the word "Select" above the table and
choosing, from the drop-down menu, the heading of the column on which you want the table to be sorted.
Consider each of the following statements. For each statement, indicate whether the statement is "True" or
"False," based on the information provided in the table.

True False
The higher a company's consumer rating, the higher its annual gross revenue.
The longer a company has been in service, the fewer accidents it has per year.
The higher a company's gross revenue, the fewer accidents it has per year.
QUESTION 2
The table below summarizes cetacean sightings during the Mariana Islands Sea Turtle and Cetacean Survey including the
total number of encounters, group-size range, depth range (m), the number of groups (n) estimation, and the mean group
size (S) for n groups.
For each of the following, select Yes if the statement listed is one that can be properly inferred from the
information in each of the three tabs. Otherwise, select No.

Yes No
If the survey were continued and a marine animal were encountered at a depth of 3,500 meters, it would be
more likely that animal belonged to a species of whale than to a species of dolphin.
The species with the greatest number of encounters is estimated to have the highest population.
It is believed that not all encounters during the Mariana Islands Sea Turtle and Cetacean Survey were
unique.
QUESTION 3
A company that designs websites primarily for minority-owned businesses conducted a survey of minority-owned
businesses in the United States that do not currently have a website. The survey was designed to help determine what
respondents see as the potential benefits of adding a website. The results of that survey are shown in the table.
For each of the following conclusions, select Supported if it is supported by the information in the table. Otherwise
select Not supported.
Supported Not
supported Values

A majority of the respondents believe adding a website could benefit their businesses.
Fewer than 25% of the respondents who believe a website could help expand their
customer base also believe a website could help them maintain their current market share.
Only a small proportion of the respondents are concerned that they are losing market share.
QUESTION 4
The table gives information about the seven longest Primary Interstate Highways that travel east-to-west in the United
States. In addition to length in miles of each Interstate, the table provides the number of states served by the Interstate and
the western and eastern terminus of the Interstate.
Each column of the table can be sorted in ascending order by clicking on the word "Select" above the table and choosing,
from the drop-down menu, the heading of the column on which you want the table to be sorted.
Consider each of the following statements about the Interstates. For each statement indicate whether the statement
is true or false, based on the information provided in the table.
True False
The ratio of the number of states served by the interstate with median length to the number of states
served by the shortest interstate is equal to 4 to 3.
The ratio of the length of the Interstate that serves the fewest states to the length of the Interstate that

serves the most states is approximately 1 to 5.
The Interstate with the median Interstate Number has a number of states served equal to the mode of the
number of states served.
QUESTION 5
For each of five models of computer—Models V through Z—the table shows the model's scores on each of three
performance tests (Tests A, B, and C). When the table is sorted by a particular test, the models are listed in order of
performance on that test, with the best performances at the top.
Attachment:
For each of the following performance tests, select Greater scores are better if greater numerical scores on that
performance test indicate better performance. Otherwise, select Greater scores are worse.
Greater scores are better Greater scores are worse
Test A
Test B
Test C

TWO-PART ANALYSIS
QUESTION 1
Michael took a survey on a social media site of 200 of his friends who identified as fans of a certain series of science-
fiction movies. He found that, of the 150 of his friends born on or before the year 1990, 80% said they were fans only of
the earlier movies, while the remainder were fans only of the later movies. Of the remainder of his friends, however, 90%
said they were fans only of the later movies, while the remainder were fans only of the earlier movies.
In the table below, select the total number of people surveyed who were born after the year 1990 and the total
number of people surveyed who preferred the earlier movies.
Born After 1990 Fan of Earlier Movies
50
75
100
125
150
175
QUESTION 2
Public health professional: The Happydale Department of Environmental Services (DES) has inspected area beaches for
pathogenic bacteria for over 20 years. Currently, DES monitors 50 freshwater beaches and 10 coastal beaches on a weekly
basis. Program participation by owners of beaches that are open to the public is voluntary. Beach owners who choose not
to participate in the Program are allowing the public to recreate on entirely unmonitored beaches. The DES now proposes
adoption of the Adopt-a-Beach Program, designed to promote health and environmental education as well as public
involvement in the protecting of public beaches. The program would require DES to collect biological data from all area
beaches. It will also help reduce the number of beach advisories, whereby the public must be warned of dangerous
conditions on certain beaches.
On the basis of the public health professional’s statement, indicate in the table which of the following is most likely
to result if the DES proposal is successfully adopted, and indicate which is most likely to result if the DES proposal
is not adopted. Make only two selections, one in each column.
Adopted Not Adopted Statements
Incidents of waterborne disease will increase.
The number of beach advisories will increase.
DES will shift its principal priorities from monitoring to education.
There will be fewer, if any, entirely unmonitored beaches.
Some beaches will remain entirely unmonitored.

QUESTION 3
There are two options for the terms of a loan of $10,000r$10,000r, both of which require repayment of the principal and
all associated interest after one year.
Option A has a simple annual interest rate of r%.
Option B has a simple annual interest rate of (r + 1)%.
Select the expression that represents the total payment due at the end of the year under Option B and the
expression that represents the positive Difference between the total payments due under the two options. Make only
two selections, one in each column.
Option B Difference -------------------------
10,000r10,000r
r+101100r+101100
100(r+100)r100(r+100)r
0.01r+10.01r+1
100r2+10,100r100r2+10,100r
100r100r
QUESTION 4
Scientists have conceived of a new treatment method for a particular form of cancer. Healthy cells would be "marked" by
introducing a modified chromosome that the treatment could detect, thereby avoiding attacking the healthy cells and
attacking the other, cancerous cells. The scientists believe this new method could eliminate the need to use other
treatments, such as traditional chemotherapy and radiation, to treat this form of cancer.
In the table below, identify which statement, if true, most strengthens the argument above, and which statement, if
true, most seriously weakens the argument above.
Strengthen Weaken
Human cells have a very wide variation in chromosomal cellular structure.
Chemotherapy treatments focus on rapidly reproducing cells by attacking cells that are in the
process of reproducing.
Some types of cancer are too widespread to be treated using the new method.
The cancerous cells could attack the healthy cells containing the modified chromosome and
turn them into cancerous cells, still containing the modified chromosome.
It is possible to modify virtually any kind of healthy human cell by introducing genetic
modifications without causing other cellular changes.
QUESTION 5
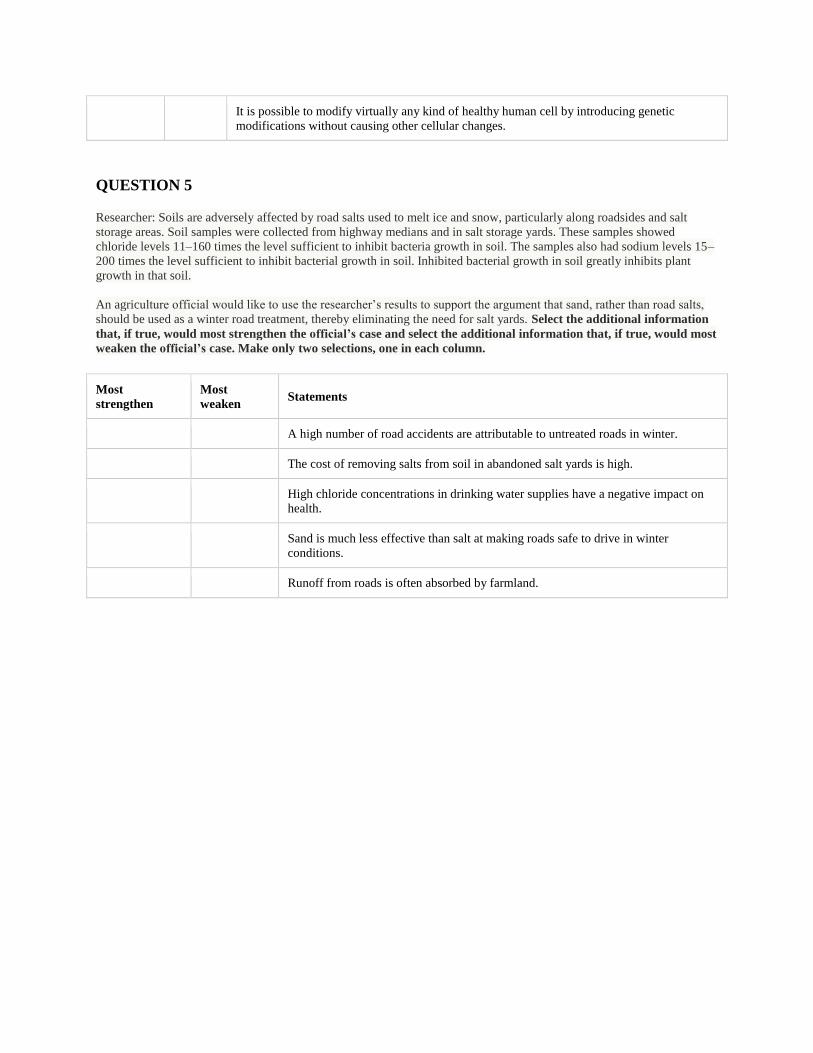
Researcher: Soils are adversely affected by road salts used to melt ice and snow, particularly along roadsides and salt
storage areas. Soil samples were collected from highway medians and in salt storage yards. These samples showed
chloride levels 11–160 times the level sufficient to inhibit bacteria growth in soil. The samples also had sodium levels 15–
200 times the level sufficient to inhibit bacterial growth in soil. Inhibited bacterial growth in soil greatly inhibits plant
growth in that soil.
An agriculture official would like to use the researcher’s results to support the argument that sand, rather than road salts,
should be used as a winter road treatment, thereby eliminating the need for salt yards. Select the additional information
that, if true, would most strengthen the official’s case and select the additional information that, if true, would most
weaken the official’s case. Make only two selections, one in each column.
Most
strengthen
Most
weaken Statements
A high number of road accidents are attributable to untreated roads in winter.
The cost of removing salts from soil in abandoned salt yards is high.
High chloride concentrations in drinking water supplies have a negative impact on
health.
Sand is much less effective than salt at making roads safe to drive in winter
conditions.
Runoff from roads is often absorbed by farmland.